0001051470December 312024Q2falsexbrli:sharesiso4217:USDiso4217:USDxbrli:sharesxbrli:pure00010514702024-01-012024-06-3000010514702024-07-2900010514702024-06-3000010514702023-12-3100010514702024-04-012024-06-3000010514702023-04-012023-06-3000010514702023-01-012023-06-3000010514702022-12-3100010514702023-06-300001051470us-gaap:CommonStockMember2024-03-310001051470us-gaap:AdditionalPaidInCapitalMember2024-03-310001051470us-gaap:AccumulatedOtherComprehensiveIncomeMember2024-03-310001051470us-gaap:RetainedEarningsMember2024-03-3100010514702024-03-310001051470us-gaap:CommonStockMember2024-04-012024-06-300001051470us-gaap:AdditionalPaidInCapitalMember2024-04-012024-06-300001051470us-gaap:AccumulatedOtherComprehensiveIncomeMember2024-04-012024-06-300001051470us-gaap:RetainedEarningsMember2024-04-012024-06-300001051470us-gaap:CommonStockMember2024-06-300001051470us-gaap:AdditionalPaidInCapitalMember2024-06-300001051470us-gaap:AccumulatedOtherComprehensiveIncomeMember2024-06-300001051470us-gaap:RetainedEarningsMember2024-06-300001051470us-gaap:CommonStockMember2023-03-310001051470us-gaap:AdditionalPaidInCapitalMember2023-03-310001051470us-gaap:AccumulatedOtherComprehensiveIncomeMember2023-03-310001051470us-gaap:RetainedEarningsMember2023-03-3100010514702023-03-310001051470us-gaap:CommonStockMember2023-04-012023-06-300001051470us-gaap:AdditionalPaidInCapitalMember2023-04-012023-06-300001051470us-gaap:AccumulatedOtherComprehensiveIncomeMember2023-04-012023-06-300001051470us-gaap:RetainedEarningsMember2023-04-012023-06-300001051470us-gaap:CommonStockMember2023-06-300001051470us-gaap:AdditionalPaidInCapitalMember2023-06-300001051470us-gaap:AccumulatedOtherComprehensiveIncomeMember2023-06-300001051470us-gaap:RetainedEarningsMember2023-06-300001051470us-gaap:CommonStockMember2023-12-310001051470us-gaap:AdditionalPaidInCapitalMember2023-12-310001051470us-gaap:AccumulatedOtherComprehensiveIncomeMember2023-12-310001051470us-gaap:RetainedEarningsMember2023-12-310001051470us-gaap:CommonStockMember2024-01-012024-06-300001051470us-gaap:AdditionalPaidInCapitalMember2024-01-012024-06-300001051470us-gaap:AccumulatedOtherComprehensiveIncomeMember2024-01-012024-06-300001051470us-gaap:RetainedEarningsMember2024-01-012024-06-300001051470us-gaap:CommonStockMember2022-12-310001051470us-gaap:AdditionalPaidInCapitalMember2022-12-310001051470us-gaap:AccumulatedOtherComprehensiveIncomeMember2022-12-310001051470us-gaap:RetainedEarningsMember2022-12-310001051470us-gaap:CommonStockMember2023-01-012023-06-300001051470us-gaap:AdditionalPaidInCapitalMember2023-01-012023-06-300001051470us-gaap:AccumulatedOtherComprehensiveIncomeMember2023-01-012023-06-300001051470us-gaap:RetainedEarningsMember2023-01-012023-06-300001051470cci:SubjectToCapitalLeaseWithTMOOrATTMember2024-06-300001051470srt:MinimumMember2024-01-012024-06-300001051470srt:MaximumMember2024-01-012024-06-300001051470us-gaap:SecuredDebtMembercci:FixedRateDebt2009SecuritizedNotesA2Member2024-06-300001051470us-gaap:SecuredDebtMembercci:FixedRateDebt2009SecuritizedNotesA2Member2023-12-310001051470cci:A2015TowerRevenueNotes3.663due2045Memberus-gaap:SecuredDebtMember2024-06-300001051470cci:A2015TowerRevenueNotes3.663due2045Memberus-gaap:SecuredDebtMember2023-12-310001051470us-gaap:SecuredDebtMembercci:A2018TowerRevenueNotes4.241due2048Member2024-06-300001051470us-gaap:SecuredDebtMembercci:A2018TowerRevenueNotes4.241due2048Member2023-12-310001051470cci:FinanceLeaseObligationsandOtherMemberus-gaap:SecuredDebtMember2024-06-300001051470cci:FinanceLeaseObligationsandOtherMemberus-gaap:SecuredDebtMember2023-12-310001051470us-gaap:SecuredDebtMember2024-06-300001051470us-gaap:SecuredDebtMember2023-12-310001051470us-gaap:RevolvingCreditFacilityMember2024-06-300001051470us-gaap:RevolvingCreditFacilityMember2023-12-310001051470cci:A2016TermLoanAMembercci:BankDebtMember2024-06-300001051470cci:A2016TermLoanAMembercci:BankDebtMember2023-12-310001051470cci:BankDebtMemberus-gaap:CommercialPaperMember2024-06-300001051470cci:BankDebtMemberus-gaap:CommercialPaperMember2023-12-310001051470cci:BankDebtMemberus-gaap:CommercialPaperMember2024-06-300001051470us-gaap:BondsMembercci:August2017SeniorUnsecured3.200NotesMember2024-06-300001051470us-gaap:BondsMembercci:August2017SeniorUnsecured3.200NotesMember2023-12-310001051470cci:June2020SeniorUnsecured1.350NotesDomainus-gaap:BondsMember2024-06-300001051470cci:June2020SeniorUnsecured1.350NotesDomainus-gaap:BondsMember2023-12-310001051470us-gaap:BondsMembercci:SeniorUnsecured2016Notes4.450Member2024-06-300001051470us-gaap:BondsMembercci:SeniorUnsecured2016Notes4.450Member2023-12-310001051470us-gaap:BondsMembercci:SeniorUnsecured2016Notes3.7Member2024-06-300001051470us-gaap:BondsMembercci:SeniorUnsecured2016Notes3.7Member2023-12-310001051470us-gaap:BondsMembercci:February2021SeniorUnsecured1050NotesMember2024-06-300001051470us-gaap:BondsMembercci:February2021SeniorUnsecured1050NotesMember2023-12-310001051470us-gaap:BondsMembercci:A4.000SeniorUnsecuredNotesMember2024-06-300001051470us-gaap:BondsMembercci:A4.000SeniorUnsecuredNotesMember2023-12-310001051470us-gaap:BondsMembercci:A2900SeniorUnsecuredNotesMember2024-06-300001051470us-gaap:BondsMembercci:A2900SeniorUnsecuredNotesMember2023-12-310001051470us-gaap:BondsMembercci:August2017SeniorUnsecured3.650NotesMember2024-06-300001051470us-gaap:BondsMembercci:August2017SeniorUnsecured3.650NotesMember2023-12-310001051470us-gaap:BondsMembercci:January2023SeniorUnsecured5000NotesMember2024-06-300001051470us-gaap:BondsMembercci:January2023SeniorUnsecured5000NotesMember2023-12-310001051470us-gaap:BondsMembercci:A3.800SeniorNotesMember2024-06-300001051470us-gaap:BondsMembercci:A3.800SeniorNotesMember2023-12-310001051470us-gaap:BondsMembercci:A4800SeniorNotesMember2024-06-300001051470us-gaap:BondsMembercci:A4800SeniorNotesMember2023-12-310001051470cci:February2019SeniorUnsecured4.300NotesMemberus-gaap:BondsMember2024-06-300001051470cci:February2019SeniorUnsecured4.300NotesMemberus-gaap:BondsMember2023-12-310001051470cci:December2023SeniorUnsecured5.600NotesMemberus-gaap:BondsMember2024-06-300001051470cci:December2023SeniorUnsecured5.600NotesMemberus-gaap:BondsMember2023-12-310001051470us-gaap:BondsMembercci:August2019SeniorUnsecured3.100NotesMember2024-06-300001051470us-gaap:BondsMembercci:August2019SeniorUnsecured3.100NotesMember2023-12-310001051470cci:April2020SeniorUnsecured3.300NotesMemberus-gaap:BondsMember2024-06-300001051470cci:April2020SeniorUnsecured3.300NotesMemberus-gaap:BondsMember2023-12-310001051470cci:June2020SeniorUnsecured2.250NotesDomainus-gaap:BondsMember2024-06-300001051470cci:June2020SeniorUnsecured2.250NotesDomainus-gaap:BondsMember2023-12-310001051470us-gaap:BondsMembercci:February2021SeniorUnsecured2100NotesMember2024-06-300001051470us-gaap:BondsMembercci:February2021SeniorUnsecured2100NotesMember2023-12-310001051470cci:June2021SeniorUnsecured2500NotesDomainus-gaap:BondsMember2024-06-300001051470cci:June2021SeniorUnsecured2500NotesDomainus-gaap:BondsMember2023-12-310001051470us-gaap:BondsMembercci:A5100SeniorNotesMember2024-06-300001051470us-gaap:BondsMembercci:A5100SeniorNotesMember2023-12-310001051470us-gaap:BondsMembercci:December2023SeniorUnsecured5.800NotesMember2024-06-300001051470us-gaap:BondsMembercci:December2023SeniorUnsecured5.800NotesMember2023-12-310001051470us-gaap:BondsMembercci:February2021SeniorUnsecured2900NotesMember2024-06-300001051470us-gaap:BondsMembercci:February2021SeniorUnsecured2900NotesMember2023-12-310001051470cci:A4.750SeniorUnsecuredNotesMemberMemberus-gaap:BondsMember2024-06-300001051470cci:A4.750SeniorUnsecuredNotesMemberMemberus-gaap:BondsMember2023-12-310001051470cci:February2019SeniorUnsecured5.200NotesMemberus-gaap:BondsMember2024-06-300001051470cci:February2019SeniorUnsecured5.200NotesMemberus-gaap:BondsMember2023-12-310001051470us-gaap:BondsMembercci:August2019SeniorUnsecured4.000NotesMember2024-06-300001051470us-gaap:BondsMembercci:August2019SeniorUnsecured4.000NotesMember2023-12-310001051470cci:April2020SeniorUnsecured4.150NotesMemberus-gaap:BondsMember2024-06-300001051470cci:April2020SeniorUnsecured4.150NotesMemberus-gaap:BondsMember2023-12-310001051470us-gaap:BondsMembercci:June2020SeniorUnsecured3.250NotesDomain2024-06-300001051470us-gaap:BondsMembercci:June2020SeniorUnsecured3.250NotesDomain2023-12-310001051470us-gaap:UnsecuredDebtMember2024-06-300001051470us-gaap:UnsecuredDebtMember2023-12-310001051470cci:July2018TowerRevenueNotesMember2024-01-012024-06-300001051470cci:A2015TowerRevenueNotes3.663due2045Member2024-06-300001051470cci:A2018TowerRevenueNotes4.241due2048Member2024-06-300001051470srt:MaximumMembercci:FinanceLeaseObligationsandOtherMember2024-06-300001051470cci:FinanceLeaseObligationsandOtherMembersrt:MinimumMember2024-01-012024-06-300001051470cci:FinanceLeaseObligationsandOtherMembersrt:MaximumMember2024-01-012024-06-300001051470cci:TermSOFRAdjustmentMember2024-06-300001051470us-gaap:SecuredOvernightFinancingRateSofrOvernightIndexSwapRateMembersrt:MinimumMember2024-06-300001051470us-gaap:SecuredOvernightFinancingRateSofrOvernightIndexSwapRateMembersrt:MaximumMember2024-06-300001051470srt:MinimumMember2024-06-300001051470srt:MaximumMember2024-06-300001051470us-gaap:RevolvingCreditFacilityMembersrt:MinimumMember2024-01-012024-06-300001051470srt:MaximumMemberus-gaap:RevolvingCreditFacilityMember2024-01-012024-06-300001051470cci:BankDebtMemberus-gaap:CommercialPaperMember2024-01-012024-06-300001051470srt:MaximumMembercci:BankDebtMemberus-gaap:CommercialPaperMember2024-01-012024-06-300001051470us-gaap:CommonStockMember2024-01-012024-03-3100010514702024-01-012024-03-310001051470cci:TowersMember2024-04-012024-06-300001051470cci:FiberMember2024-04-012024-06-300001051470us-gaap:SegmentDomain2024-04-012024-06-300001051470cci:TowersMember2023-04-012023-06-300001051470cci:FiberMember2023-04-012023-06-300001051470us-gaap:SegmentDomain2023-04-012023-06-300001051470us-gaap:CorporateAndOtherMember2024-04-012024-06-300001051470us-gaap:CorporateAndOtherMember2023-04-012023-06-300001051470cci:TowersMember2024-06-300001051470cci:FiberMember2024-06-300001051470us-gaap:CorporateAndOtherMember2024-06-300001051470us-gaap:SegmentDomain2024-06-300001051470cci:TowersMember2023-06-300001051470cci:FiberMember2023-06-300001051470us-gaap:CorporateAndOtherMember2023-06-300001051470us-gaap:SegmentDomain2023-06-300001051470cci:SegmentcostofoperationssharebasedcompensationMember2024-04-012024-06-300001051470cci:SegmentcostofoperationssharebasedcompensationMember2023-04-012023-06-300001051470cci:SegmentGAsharebasedcompensationMember2024-04-012024-06-300001051470cci:SegmentGAsharebasedcompensationMember2023-04-012023-06-300001051470cci:TowersMember2024-01-012024-06-300001051470cci:FiberMember2024-01-012024-06-300001051470us-gaap:SegmentDomain2024-01-012024-06-300001051470cci:TowersMember2023-01-012023-06-300001051470cci:FiberMember2023-01-012023-06-300001051470us-gaap:SegmentDomain2023-01-012023-06-300001051470us-gaap:CorporateAndOtherMember2024-01-012024-06-300001051470us-gaap:CorporateAndOtherMember2023-01-012023-06-300001051470cci:SegmentcostofoperationssharebasedcompensationMember2024-01-012024-06-300001051470cci:SegmentcostofoperationssharebasedcompensationMember2023-01-012023-06-300001051470cci:SegmentGAsharebasedcompensationMember2024-01-012024-06-300001051470cci:SegmentGAsharebasedcompensationMember2023-01-012023-06-300001051470cci:A2023RestructuringPlanMember2023-06-300001051470cci:A2023RestructuringPlanMember2024-01-012024-06-300001051470cci:A2023RestructuringPlanMembercci:RemainingObligationsUnderFacilityLeasesMember2024-01-012024-06-300001051470cci:AcceleratedDepreciationAndAssetWriteDownsMembercci:A2023RestructuringPlanMember2024-01-012024-06-300001051470us-gaap:EmployeeSeveranceMembercci:A2023RestructuringPlanMember2024-01-012024-06-300001051470us-gaap:EmployeeSeveranceMembercci:A2023RestructuringPlanMember2024-03-310001051470us-gaap:FacilityClosingMembercci:A2023RestructuringPlanMember2024-03-310001051470cci:A2023RestructuringPlanMember2024-03-310001051470us-gaap:EmployeeSeveranceMembercci:A2023RestructuringPlanMember2023-12-310001051470us-gaap:FacilityClosingMembercci:A2023RestructuringPlanMember2023-12-310001051470cci:A2023RestructuringPlanMember2023-12-310001051470us-gaap:EmployeeSeveranceMembercci:A2023RestructuringPlanMember2024-04-012024-06-300001051470us-gaap:FacilityClosingMembercci:A2023RestructuringPlanMember2024-04-012024-06-300001051470cci:A2023RestructuringPlanMember2024-04-012024-06-300001051470us-gaap:FacilityClosingMembercci:A2023RestructuringPlanMember2024-01-012024-06-300001051470us-gaap:EmployeeSeveranceMembercci:A2023RestructuringPlanMember2024-06-300001051470us-gaap:FacilityClosingMembercci:A2023RestructuringPlanMember2024-06-300001051470cci:A2023RestructuringPlanMember2024-06-300001051470cci:A2024RestructuringPlanMember2024-06-300001051470cci:A2024RestructuringPlanMember2024-01-012024-06-300001051470cci:A2024RestructuringPlanMemberus-gaap:EmployeeSeveranceMember2024-01-012024-06-300001051470cci:A2024RestructuringPlanMembercci:AcceleratedDepreciationAndAssetWriteDownsMember2024-01-012024-06-300001051470srt:ScenarioForecastMember2024-12-310001051470cci:A2024RestructuringPlanMemberus-gaap:EmployeeSeveranceMember2024-04-012024-06-300001051470us-gaap:FacilityClosingMembercci:A2024RestructuringPlanMember2024-01-012024-06-300001051470us-gaap:FacilityClosingMembercci:A2024RestructuringPlanMember2024-04-012024-06-300001051470cci:A2024RestructuringPlanMember2024-04-012024-06-300001051470cci:A2024RestructuringPlanMemberus-gaap:EmployeeSeveranceMember2024-06-300001051470us-gaap:FacilityClosingMembercci:A2024RestructuringPlanMember2024-06-300001051470us-gaap:AllOtherSegmentsMember2024-04-012024-06-30
UNITED STATES
SECURITIES AND EXCHANGE COMMISSION
Washington, D.C. 20549
____________________________________
FORM 10-Q
___________________________________
| | | | | |
| ☒ | QUARTERLY REPORT PURSUANT TO SECTION 13 OR 15(d) OF THE SECURITIES EXCHANGE ACT OF 1934 |
For the quarterly period ended June 30, 2024
OR
| | | | | |
| ☐ | TRANSITION REPORT PURSUANT TO SECTION 13 OR 15(d) OF THE SECURITIES EXCHANGE ACT OF 1934 |
For the transition period to
Commission File Number 001-16441
____________________________________
CROWN CASTLE INC.
(Exact name of registrant as specified in its charter)
| | | | | | | | | | | |
| Delaware | 76-0470458 |
(State or other jurisdiction
of incorporation or organization) | (I.R.S. Employer
Identification No.) |
| | | |
8020 Katy Freeway, Houston, Texas 77024
(Address of principal executives office) (Zip Code)
(713) 570-3000
(Registrant's telephone number, including area code)
____________________________________
Securities registered pursuant to Section 12(b) of the Act:
| | | | | | | | | |
| Title of each class | | Trading Symbol(s) | Name of each exchange on which registered |
| Common Stock, $0.01 par value | | CCI | New York Stock Exchange |
Indicate by check mark whether the registrant (1) has filed all reports required to be filed by Section 13 or 15(d) of the Securities Exchange Act of 1934 during the preceding 12 months (or for such shorter period that the registrant was required to file such reports), and (2) has been subject to such filing requirements for the past 90 days. Yes ☒ No ☐
Indicate by check mark whether the registrant has submitted electronically every Interactive Data File required to be submitted pursuant to Rule 405 of Regulation S-T (§232.405 of this chapter) during the preceding 12 months (or for such shorter period that the registrant was required to submit such files). Yes ☒ No ☐
Indicate by check mark whether the registrant is a large accelerated filer, an accelerated filer, a non-accelerated filer, a smaller reporting company, or an emerging growth company. See the definitions of "large accelerated filer," "accelerated filer," "smaller reporting company" and "emerging growth company" in Rule 12b-2 of the Exchange Act.
| | | | | | | | | | | | | | | | | | | | |
| Large accelerated filer | ☒ | | Accelerated filer | ☐ | |
| Non-accelerated filer | ☐ | | Smaller reporting company | ☐ | |
| | | | Emerging growth company | ☐ | |
| If an emerging growth company, indicate by check mark if the registrant has elected not to use the extended transition period for complying with any new or revised financial accounting standards provided pursuant to Section 13(a) of the Exchange Act. ☐ | |
Indicate by check mark whether the registrant is a shell company (as defined in Rule 12b-2 of the Exchange Act). Yes ☐ No ☒
Number of shares of common stock outstanding at July 29, 2024: 434,567,298
CROWN CASTLE INC. AND SUBSIDIARIES
INDEX
| | | | | | | | | | | |
| | | Page |
| | |
| ITEM 1. | | | |
| | | |
| | | |
| | | |
| | | |
| | | |
| ITEM 2. | | | |
| ITEM 3. | | | |
| ITEM 4. | | | |
| | |
| ITEM 1. | LEGAL PROCEEDINGS | | |
| ITEM 1A. | | | |
| ITEM 5. | | | |
| ITEM 6. | | | |
| EXHIBIT INDEX | | |
| SIGNATURES | | |
Cautionary Language Regarding Forward-Looking Statements
This Quarterly Report on Form 10-Q ("Form 10-Q") contains forward-looking statements that are based on our management's expectations as of the filing date of this report with the Securities and Exchange Commission ("SEC"). Statements that are not historical facts are hereby identified as forward-looking statements. In addition, words such as "estimate," "anticipate," "project," "plan," "intend," "believe," "expect," "likely," "predicted," "positioned," "continue," "target," "seek," "focus" and any variations of these words and similar expressions are intended to identify forward-looking statements. Examples of forward-looking statements include our full year 2024 outlook and our plans, projections, expectations and estimates regarding (1) the value of our business model and the demand for our communications infrastructure, (2) the growth potential of the U.S. market for shared communications infrastructure, (3) growth in the communications infrastructure industry, (4) demand for data and factors driving such demand, (5) the duration of our construction projects, (6) tenants' investment in wireless networks, (7) use of high-bandwidth applications, (8) our ability to service our debt and comply with debt covenants, (9) the level of commitment under our debt instruments, (10) our ability to remain qualified as a real estate investment trust ("REIT"), (11) site rental revenues, including the growth thereof, (12) sources and uses of liquidity, (13) impact from the Sprint Cancellations (as defined below), (14) drivers of cash flow growth, (15) our competitive advantage, (16) our dividends, including timing, amount, payment or tax characterization, (17) the timing of small cell deployments, (18) discretionary and sustaining capital expenditures and expansion of our business, (19) impact of elevated interest rates, (20) the growth in our business and its driving factors, (21) non-renewals, (22) restructuring activities and the cost reductions, charges, scope, actions and savings associated therewith, including timing, amounts and impact and (23) Fiber segment strategic and operating review. All future dividends are subject to declaration by our board of directors.
Such forward-looking statements should, therefore, be considered in light of various risks, uncertainties and assumptions, including prevailing market conditions, risk factors described in "Item 1A. Risk Factors" of the Annual Report on Form 10-K for the fiscal year ended December 31, 2023 ("2023 Form 10-K") and other factors. Should one or more of these risks or uncertainties materialize, or should underlying assumptions prove incorrect, actual results may vary materially from those expected.
Our filings with the SEC are available through the SEC website at www.sec.gov or through our investor relations website at investor.crowncastle.com. We use our investor relations website to disclose information about us that may be deemed to be material. We encourage investors, the media and others interested in us to visit our investor relations website from time to time to review up-to-date information or to sign up for e-mail alerts to be notified when new or updated information is posted on the site.
Interpretation
As used herein, the term "including," and any variation thereof, means "including without limitation." The use of the word "or" herein is not exclusive. Unless this Form 10-Q indicates otherwise or the context otherwise requires, the terms "we," "our," "our company," "the company" or "us" as used in this Form 10-Q refer to Crown Castle Inc. ("CCI") and its predecessor (organized in 1995), as applicable, each a Delaware corporation, and their subsidiaries. Additionally, unless the context suggests otherwise, references to "U.S." are to the United States of America and Puerto Rico, collectively. Capitalized terms used but not defined in this Form 10-Q have the same meaning given to them in the 2023 Form 10-K.
PART I—FINANCIAL INFORMATION
ITEM 1.FINANCIAL STATEMENTS
CROWN CASTLE INC. AND SUBSIDIARIES
CONDENSED CONSOLIDATED BALANCE SHEET (Unaudited)
(Amounts in millions, except par values)
| | | | | | | | | | | |
| | June 30, 2024 | | December 31, 2023 |
| ASSETS | | | |
| Current assets: | | | |
| Cash and cash equivalents | $ | 155 | | | $ | 105 | |
Restricted cash and cash equivalents | 171 | | | 171 | |
| Receivables, net | 420 | | | 481 | |
| Prepaid expenses | 155 | | | 103 | |
| Current portion of deferred site rental receivables | 129 | | | 116 | |
| Other current assets | 51 | | | 56 | |
| Total current assets | 1,081 | | | 1,032 | |
| Deferred site rental receivables | 2,341 | | | 2,239 | |
Property and equipment, net of accumulated depreciation of $14,919 and $14,279, respectively | 15,698 | | | 15,666 | |
| Operating lease right-of-use assets | 5,930 | | | 6,187 | |
| Goodwill | 10,085 | | | 10,085 | |
| Other intangible assets, net | 2,974 | | | 3,179 | |
| Other assets, net | 137 | | | 139 | |
| Total assets | $ | 38,246 | | | $ | 38,527 | |
| | | |
| LIABILITIES AND EQUITY | | | |
| Current liabilities: | | | |
| Accounts payable | $ | 225 | | | $ | 252 | |
| Accrued interest | 228 | | | 219 | |
| Deferred revenues | 509 | | | 605 | |
| Other accrued liabilities | 359 | | | 342 | |
| Current maturities of debt and other obligations | 865 | | | 835 | |
| Current portion of operating lease liabilities | 308 | | | 332 | |
| Total current liabilities | 2,494 | | | 2,585 | |
| Debt and other long-term obligations | 22,854 | | | 22,086 | |
| Operating lease liabilities | 5,354 | | | 5,561 | |
| Other long-term liabilities | 1,892 | | | 1,914 | |
| Total liabilities | 32,594 | | | 32,146 | |
| Commitments and contingencies (note 8) | | | |
| Stockholders' equity: | | | |
Common stock, $0.01 par value; 1,200 shares authorized; shares issued and outstanding: June 30, 2024—435 and December 31, 2023—434 | 4 | | | 4 | |
| Additional paid-in capital | 18,347 | | | 18,270 | |
| Accumulated other comprehensive income (loss) | (5) | | | (4) | |
| Dividends/distributions in excess of earnings | (12,694) | | | (11,889) | |
| Total equity | 5,652 | | | 6,381 | |
| Total liabilities and equity | $ | 38,246 | | | $ | 38,527 | |
See notes to condensed consolidated financial statements.
CROWN CASTLE INC. AND SUBSIDIARIES
CONDENSED CONSOLIDATED STATEMENT OF OPERATIONS AND
COMPREHENSIVE INCOME (LOSS) (Unaudited)
(Amounts in millions, except per share amounts)
| | | | | | | | | | | | | | | | | | | | | | | |
| Three Months Ended June 30, | | Six Months Ended June 30, |
| 2024 | | 2023 | | 2024 | | 2023 |
| Net revenues: | | | | | | | |
| Site rental | $ | 1,580 | | | $ | 1,728 | | | $ | 3,168 | | | $ | 3,352 | |
| Services and other | 46 | | | 139 | | | 99 | | | 288 | |
| Net revenues | 1,626 | | | 1,867 | | | 3,267 | | | 3,640 | |
| Operating expenses: | | | | | | | |
Costs of operations:(a) | | | | | | | |
| Site rental | 432 | | | 424 | | | 862 | | | 839 | |
| Services and other | 27 | | | 98 | | | 61 | | | 202 | |
| Selling, general and administrative | 204 | | | 210 | | | 387 | | | 405 | |
| Asset write-down charges | 3 | | | 22 | | | 9 | | | 22 | |
| Acquisition and integration costs | — | | | 1 | | | — | | | 1 | |
| Depreciation, amortization and accretion | 430 | | | 445 | | | 869 | | | 876 | |
Restructuring charges | 45 | | | — | | | 56 | | | — | |
| Total operating expenses | 1,141 | | | 1,200 | | | 2,244 | | | 2,345 | |
| Operating income (loss) | 485 | | | 667 | | | 1,023 | | | 1,295 | |
| Interest expense and amortization of deferred financing costs, net | (230) | | | (208) | | | (456) | | | (410) | |
| | | | | | | |
| Interest income | 4 | | | 5 | | | 8 | | | 7 | |
| Other income (expense) | (1) | | | (2) | | | 1 | | | (4) | |
| Income (loss) before income taxes | 258 | | | 462 | | | 576 | | | 888 | |
| Benefit (provision) for income taxes | (7) | | | (7) | | | (14) | | | (14) | |
| Net income (loss) | 251 | | | 455 | | | 562 | | | 874 | |
| Other comprehensive income (loss): | | | | | | | |
| Foreign currency translation adjustments | — | | | 1 | | | (1) | | | — | |
| Total other comprehensive income (loss) | — | | | 1 | | | (1) | | | — | |
| Comprehensive income (loss) | $ | 251 | | | $ | 456 | | | $ | 561 | | | $ | 874 | |
| Net income (loss), per common share: | | | | | | | |
| Basic | $ | 0.58 | | | $ | 1.05 | | | $ | 1.29 | | | $ | 2.02 | |
| Diluted | $ | 0.58 | | | $ | 1.05 | | | $ | 1.29 | | | $ | 2.01 | |
| Weighted-average common shares outstanding: | | | | | | | |
| Basic | 435 | | 434 | | | 434 | | | 433 | |
| Diluted | 435 | | 434 | | | 435 | | | 434 | |
(a)Exclusive of depreciation, amortization and accretion shown separately.
See notes to condensed consolidated financial statements.
CROWN CASTLE INC. AND SUBSIDIARIES
CONDENSED CONSOLIDATED STATEMENT OF CASH FLOWS (Unaudited)
(In millions of dollars)
| | | | | | | | | | | |
| | Six Months Ended June 30, |
| | 2024 | | 2023 |
| Cash flows from operating activities: | | | |
| Net income (loss) | $ | 562 | | | $ | 874 | |
| Adjustments to reconcile net income (loss) to net cash provided by (used for) operating activities: | | | |
| Depreciation, amortization and accretion | 869 | | | 876 | |
| | | |
| Amortization of deferred financing costs and other non-cash interest | 18 | | | 14 | |
| Stock-based compensation expense, net | 78 | | | 91 | |
| Asset write-down charges | 9 | | | 22 | |
| Deferred income tax (benefit) provision | 5 | | | 1 | |
| Other non-cash adjustments, net | 8 | | | 2 | |
| Changes in assets and liabilities, excluding the effects of acquisitions: | | | |
| Increase (decrease) in accrued interest | 9 | | | 36 | |
| Increase (decrease) in accounts payable | (6) | | | (1) | |
| Increase (decrease) in other liabilities | (102) | | | (70) | |
| Decrease (increase) in receivables | 62 | | | 103 | |
| Decrease (increase) in other assets | (145) | | | (223) | |
| Net cash provided by (used for) operating activities | 1,367 | | | 1,725 | |
| Cash flows from investing activities: | | | |
| Capital expenditures | (649) | | | (720) | |
| Payments for acquisitions, net of cash acquired | (1) | | | (89) | |
| Other investing activities, net | — | | | 3 | |
| Net cash provided by (used for) investing activities | (650) | | | (806) | |
| Cash flows from financing activities: | | | |
| Proceeds from issuance of long-term debt | — | | | 2,347 | |
| Principal payments on debt and other long-term obligations | (36) | | | (39) | |
| | | |
| Borrowings under revolving credit facility | — | | | 2,113 | |
| Payments under revolving credit facility | (670) | | | (2,739) | |
| Net issuances (repayments) under commercial paper program | 1,438 | | | (1,024) | |
| Payments for financing costs | — | | | (23) | |
| | | |
| Purchases of common stock | (30) | | | (29) | |
| Dividends/distributions paid on common stock | (1,368) | | | (1,364) | |
| | | |
| Net cash provided by (used for) financing activities | (666) | | | (758) | |
Net increase (decrease) in cash and cash equivalents and restricted cash and cash equivalents | 51 | | | 161 | |
| Effect of exchange rate changes | (1) | | | — | |
Cash and cash equivalents and restricted cash and cash equivalents at beginning of period | 281 | | | 327 | |
Cash and cash equivalents and restricted cash and cash equivalents at end of period | $ | 331 | | | $ | 488 | |
See notes to condensed consolidated financial statements.
CROWN CASTLE INC. AND SUBSIDIARIES
CONDENSED CONSOLIDATED STATEMENT OF EQUITY
(Amounts in millions) (Unaudited)
| | | | | | | | | | | | | | | | | | | | | | | | | | | | | | | | | | | |
| Common Stock | | Additional
Paid-in
Capital | | Accumulated Other Comprehensive Income (Loss) | | Dividends/Distributions in Excess of Earnings | | |
| Shares | | ($0.01 Par) | | | | | Total |
Balance, March 31, 2024 | 435 | | | $ | 4 | | | $ | 18,310 | | | $ | (5) | | | $ | (12,261) | | | $ | 6,048 | |
| Stock-based compensation related activity, net of forfeitures | — | | | — | | | 40 | | | — | | | — | | | 40 | |
| Purchases and retirement of common stock | — | | | — | | | (3) | | | — | | | — | | | (3) | |
Other comprehensive income (loss)(a) | — | | | — | | | — | | | — | | | — | | | — | |
| Common stock dividends/distributions | — | | | — | | | — | | | — | | | (684) | | | (684) | |
| Net income (loss) | — | | | — | | | — | | | — | | | 251 | | | 251 | |
Balance, June 30, 2024 | 435 | | | $ | 4 | | | $ | 18,347 | | | $ | (5) | | | $ | (12,694) | | | $ | 5,652 | |
| | | | | | | | | | | |
Balance, March 31, 2023 | 434 | | | $ | 4 | | | $ | 18,154 | | | $ | (6) | | | $ | (10,929) | | | $ | 7,223 | |
| Stock-based compensation related activity, net of forfeitures | — | | | — | | | 49 | | | — | | | — | | | 49 | |
| Purchases and retirement of common stock | — | | | — | | | (1) | | | — | | | — | | | (1) | |
Other comprehensive income (loss)(a) | — | | | — | | | — | | | 1 | | | — | | | 1 | |
| Common stock dividends/distributions | — | | | — | | | — | | | — | | | (681) | | | (681) | |
| Net income (loss) | — | | | — | | | — | | | — | | | 455 | | | 455 | |
Balance, June 30, 2023 | 434 | | | $ | 4 | | | $ | 18,202 | | | $ | (5) | | | $ | (11,155) | | | $ | 7,046 | |
| | | | | | | | | | | |
Balance, December 31, 2023 | 434 | | | $ | 4 | | | $ | 18,270 | | | $ | (4) | | | $ | (11,889) | | | $ | 6,381 | |
Stock-based compensation related activity, net of forfeitures | 1 | | | — | | | 107 | | | — | | | — | | | 107 | |
Purchases and retirement of common stock | — | | | — | | | (30) | | | — | | | — | | | (30) | |
Other comprehensive income (loss)(a) | — | | | — | | | — | | | (1) | | | — | | | (1) | |
| Common stock dividends/distributions | — | | | — | | | — | | | — | | | (1,367) | | | (1,367) | |
| Net income (loss) | — | | | — | | | — | | | — | | | 562 | | | 562 | |
Balance, June 30, 2024 | 435 | | | $ | 4 | | | $ | 18,347 | | | $ | (5) | | | $ | (12,694) | | | $ | 5,652 | |
| | | | | | | | | | | |
Balance, December 31, 2022 | 433 | | | $ | 4 | | | $ | 18,116 | | | $ | (5) | | | $ | (10,666) | | | $ | 7,449 | |
Stock-based compensation related activity, net of forfeitures | 1 | | | — | | | 115 | | | — | | | — | | | 115 | |
Purchases and retirement of common stock | — | | | — | | | (29) | | | — | | | — | | | (29) | |
Other comprehensive income (loss)(a) | — | | | — | | | — | | | — | | | — | | | — | |
| Common stock dividends/distributions | — | | | — | | | — | | | — | | | (1,363) | | | (1,363) | |
| Net income (loss) | — | | | — | | | — | | | — | | | 874 | | | 874 | |
Balance, June 30, 2023 | 434 | | | $ | 4 | | | $ | 18,202 | | | $ | (5) | | | $ | (11,155) | | | $ | 7,046 | |
(a)See the condensed consolidated statement of operations and other comprehensive income (loss) for the components of other comprehensive income (loss).
See notes to condensed consolidated financial statements.
CROWN CASTLE INC. AND SUBSIDIARIES
NOTES TO CONDENSED CONSOLIDATED FINANCIAL STATEMENTS-Unaudited
(Tabular dollars in millions, except per share amounts)
1.General
The information contained in the following notes to the condensed consolidated financial statements is condensed from that which would appear in the annual consolidated financial statements; accordingly, the condensed consolidated financial statements included herein should be reviewed in conjunction with the consolidated financial statements for the fiscal year ended December 31, 2023, and related notes thereto, included in the 2023 Form 10-K filed by Crown Castle Inc. ("CCI") with the SEC. Capitalized terms used but not defined in these notes to the condensed consolidated financial statements have the same meaning given to them in the 2023 Form 10-K. References to the "Company" refer to CCI and its predecessor, as applicable, and their subsidiaries, unless otherwise indicated or the context indicates otherwise. As used herein, the term "including," and any variation thereof means "including without limitation." The use of the word "or" herein is not exclusive. Unless the context suggests otherwise, references to "U.S." are to the United States of America and Puerto Rico, collectively.
The Company owns, operates and leases shared communications infrastructure that is geographically dispersed throughout the U.S., including (1) towers and other structures, such as rooftops (collectively, "towers"), and (2) fiber primarily supporting small cell networks ("small cells") and fiber solutions. The Company's towers, small cells and fiber assets are collectively referred to herein as "communications infrastructure," and the Company's customers on its communications infrastructure are referred to herein as "tenants."
The Company's core business is providing access, including space or capacity, to its shared communications infrastructure via long-term contracts in various forms, including lease, license, sublease and service agreements (collectively, "tenant contracts").
The Company's operating segments consist of (1) Towers and (2) Fiber. See note 10.
As part of the Company's effort to provide comprehensive communications infrastructure solutions, as an ancillary business, the Company also offers certain services primarily relating to its Towers segment. For the periods presented, such services predominately consisted of (1) site development services relating to existing or new tenant equipment installations, including: site acquisition, architectural and engineering, or zoning and permitting (collectively, "site development services") and (2) tenant equipment installation or subsequent augmentations (collectively, "installation services").
See note 12 to the condensed consolidated financial statements for a discussion of (1) the Company's July 2023 restructuring plan ("2023 Restructuring Plan"), which included discontinuing installation services as a Towers product offering and (2) the Company's June 2024 restructuring plan ("2024 Restructuring Plan, and together with the 2023 Restructuring Plan, "Restructuring Plans").
The Company operates as a REIT for U.S. federal income tax purposes. In addition, the Company has certain taxable REIT subsidiaries ("TRSs"). See note 6.
Approximately 53% of the Company's towers are leased or subleased or operated and managed under master leases, subleases, and other agreements with AT&T and T-Mobile (including those which T-Mobile assumed in its merger with Sprint). The Company has the option to purchase these towers at the end of their respective lease terms. The Company has no obligation to exercise such purchase options.
Basis of Presentation
The condensed consolidated financial statements included herein are unaudited; however, they include all adjustments (consisting only of normal recurring adjustments) which, in the opinion of management, are necessary to state fairly the condensed consolidated financial position of the Company as of June 30, 2024, the condensed consolidated results of operations for the three and six months ended June 30, 2024 and 2023, and the condensed consolidated cash flows for the six months ended June 30, 2024 and 2023. The year-end condensed consolidated balance sheet data was derived from audited financial statements, but does not include all disclosures required by GAAP. The results of operations for the interim periods presented are not necessarily indicative of the results to be expected for the full year.
The preparation of financial statements in conformity with GAAP requires management to make estimates and assumptions that affect the reported amounts of assets and liabilities, the disclosure of contingent assets and liabilities as of the date of the financial statements, and the reported amounts of revenues and expenses during the reporting period. Actual results could differ from those estimates.
CROWN CASTLE INC. AND SUBSIDIARIES
NOTES TO CONDENSED CONSOLIDATED FINANCIAL STATEMENTS-Unaudited (Continued)
(Tabular dollars in millions, except per share amounts)
2.Summary of Significant Accounting Policies
Recently Adopted Accounting Pronouncements
No accounting pronouncements adopted during the six months ended June 30, 2024 had a material impact on the Company's condensed consolidated financial statements.
Recent Accounting Pronouncements Not Yet Adopted
In November 2023, the FASB issued new guidance that is designed to improve reportable segment disclosure requirements, primarily through enhanced disclosure of significant segment expenses. The new guidance also expands interim segment disclosure requirements and requires disclosure of the position and title of the Company's chief operating decision-maker. The guidance will be effective for the Company's fiscal year ending December 31, 2024 and for interim periods starting in the first quarter of fiscal year 2025 with early adoption permitted. The guidance is required to be applied retrospectively to each prior reporting period presented. The Company is currently evaluating the effect of the guidance, including the impact on its consolidated financial statements and related disclosures.
In December 2023, the FASB issued new guidance that enhances the transparency and decision usefulness of income tax disclosures, primarily through changes to the rate reconciliation and income taxes paid disclosures. The guidance will be effective for the Company's fiscal year ending December 31, 2025, and can be applied prospectively or retrospectively, with early adoption permitted. The Company is currently evaluating the effect of the guidance, including the impact on its consolidated financial statements and related disclosures.
3.Revenues
Site Rental Revenues
The Company generates site rental revenues from its core business by providing tenants with access, including space or capacity, to its shared communications infrastructure via long-term tenant contracts in various forms, including lease, license, sublease and service agreements. Typically, providing such access over the length of the tenant contract term represents the Company’s sole performance obligation under its tenant contracts.
Site rental revenues from the Company's tenant contracts are recognized on a straight-line, ratable basis over the fixed, non-cancelable term of the relevant tenant contract, which generally ranges between five to 15 years for wireless tenants and one to 20 years for fiber solutions tenants (including from organizations with high-bandwidth and multi-location demands), regardless of whether the payments from the tenant are received in equal monthly amounts during the life of the tenant contract. Certain of the Company's tenant contracts contain (1) fixed escalation clauses (such as fixed dollar or fixed percentage increases) or inflation-based escalation clauses (such as those tied to the CPI), (2) multiple renewal periods exercisable at the tenant's option and (3) only limited termination rights at the applicable tenant's option through the current term. If the payment terms call for fixed escalators, upfront payments, or rent-free periods, the revenue is recognized on a straight-line basis over the fixed, non-cancelable term of the tenant contract. When calculating straight-line rental revenues, the Company considers all fixed elements of tenant contractual escalation provisions, even if such escalation provisions contain a variable element in addition to a minimum. The Company's assets related to straight-line site rental revenues are recorded within "Current portion of deferred site rental receivables" and "Deferred site rental receivables" on the Company's condensed consolidated balance sheet. Amounts billed or received prior to being earned are deferred and reflected in "Deferred revenues" and "Other long-term liabilities" on the Company's condensed consolidated balance sheet. Amounts to which the Company has an unconditional right to payment, which are related to both satisfied or partially satisfied performance obligations, are recorded within "Receivables, net" on the Company's condensed consolidated balance sheet.
Payments Associated with Sprint Cancellations.
For the three and six months ended June 30, 2024, site rental revenues include $1 million and $4 million, respectively, and for three and six months ended June 30, 2023, $106 million and $154 million, respectively, of payments in the Company's Fiber segment to satisfy the remaining rental obligations of certain canceled Sprint leases as a result of the T-Mobile US, Inc. and Sprint network consolidation. In connection with such canceled Sprint leases, the Company also recognized $57 million of accelerated prepaid rent amortization in the Company's Fiber segment during the three and six months ended June 30, 2023.
CROWN CASTLE INC. AND SUBSIDIARIES
NOTES TO CONDENSED CONSOLIDATED FINANCIAL STATEMENTS-Unaudited (Continued)
(Tabular dollars in millions, except per share amounts)
Services and Other Revenues
As part of the Company’s effort to provide comprehensive communications infrastructure solutions, as an ancillary business, the Company offers certain services primarily relating to its Towers segment, predominately consisting of (1) site development services and (2) installation services. See note 12 to the condensed consolidated financial statements for a discussion of the Company's 2023 Restructuring Plan, which included discontinuing installation services as a Towers product offering. Upon contract commencement, the Company assesses its services to tenants and identifies performance obligations for each promise to provide a distinct service.
The Company may have multiple performance obligations for site development services, which primarily include: structural analysis, zoning, permitting and construction drawings. For each of these performance obligations, services revenues are recognized at completion of the applicable performance obligation, which represents the point at which the Company believes it has transferred goods or services to the tenant. The services revenue recognized is based on an allocation of the transaction price among the performance obligations in a respective tenant contract based on estimated standalone selling price. The volume and mix of site development services may vary among tenant contracts and may include a combination of some or all of the above performance obligations. Amounts are billed per contractual milestones, with payments generally due within 45 to 90 days, and generally do not contain variable-consideration provisions. The transaction price for the Company's tower installation services consists of amounts for (1) permanent improvements to the Company's towers that represent a lease component and (2) the performance of the service. Amounts under the Company's tower installation service agreements that represent a lease component are recognized as site rental revenues on a straight-line basis over the length of the associated estimated lease term. For the performance of the installation service, the Company has one performance obligation, which is satisfied at the time of the applicable installation or augmentation and recognized as services and other revenues on the Company's condensed consolidated statement of operations and comprehensive income (loss). Since performance obligations are typically satisfied prior to receiving payment from tenants, the unconditional right to payment is recorded within "Receivables, net" on the Company’s condensed consolidated balance sheet. Generally, the services the Company provides to its tenants have a duration of one year or less.
Additional Information on Revenues
As of January 1, 2024 and June 30, 2024, $2.1 billion and $2.0 billion of unrecognized revenues, respectively, were reported in "Deferred revenues" and "Other long-term liabilities" on the Company's condensed consolidated balance sheet. During the six months ended June 30, 2024, approximately $270 million of the January 1, 2024 unrecognized revenues balance was recognized as revenues. As of January 1, 2023, $2.3 billion of unrecognized revenues were reported in "Deferred revenues" and "Other long-term liabilities" on the Company's condensed consolidated balance sheet. During the six months ended June 30, 2023, approximately $360 million of the January 1, 2023 unrecognized revenues balance was recognized as revenues.
The following table is a summary of the contracted amounts owed to the Company by tenants pursuant to tenant contracts in effect as of June 30, 2024.
| | | | | | | | | | | | | | | | | | | | | | | | | | | | | | | | | | | | | | | | | | | | |
| | Six Months Ending December 31, | | Years Ending December 31, | | | | |
| | 2024 | | 2025 | | 2026 | | 2027 | | 2028 | | Thereafter | | Total |
Contracted amounts(a) | | $ | 2,595 | | | $ | 4,891 | | | $ | 4,729 | | | $ | 4,603 | | | $ | 4,381 | | | $ | 16,134 | | | $ | 37,333 | |
(a)Based on the nature of the contract, tenant contracts are accounted for pursuant to relevant lease accounting (ASC 842) or revenue accounting (ASC 606) guidance. Excludes amounts related to services, as those contracts generally have a duration of one year or less.
See note 10 for further information regarding the Company's operating segments.
CROWN CASTLE INC. AND SUBSIDIARIES
NOTES TO CONDENSED CONSOLIDATED FINANCIAL STATEMENTS-Unaudited (Continued)
(Tabular dollars in millions, except per share amounts)
4.Debt and Other Obligations
The table below sets forth the Company's debt and other obligations as of June 30, 2024.
| | | | | | | | | | | | | | | | | | | | | | | | | | | | | | | | |
| Original
Issue Date | | Final Maturity Date(a) | | Balance as of June 30, 2024 | | Balance as of December 31, 2023 | | Stated Interest Rate as of June 30, 2024(a)(b) | |
| Secured Notes, Series 2009-1, Class A-2 | July 2009 | | Aug. 2029 | | $ | 36 | | | $ | 40 | | | 9.0 | % | |
| Tower Revenue Notes, Series 2015-2 | May 2015 | | May 2045 | (c) | 699 | | | 698 | | | 3.7 | % | |
| Tower Revenue Notes, Series 2018-2 | July 2018 | | July 2048 | (c) | 747 | | | 746 | | | 4.2 | % | |
Installment purchase liabilities and finance leases | Various | (d) | Various | (d) | 295 | | (e) | 270 | | (e) | Various | (d) |
| Total secured debt | | | | | 1,777 | | | 1,754 | | | | |
| 2016 Revolver | Jan. 2016 | | July 2027 | | — | | (f) | 670 | | | N/A | (g) |
| 2016 Term Loan A | Jan. 2016 | | July 2027 | | 1,155 | | | 1,162 | | | 6.4 | % | (g) |
| Commercial Paper Notes | Various | (h) | Various | (h) | 1,438 | | (h) | — | | | 5.9 | % | |
| 3.200% Senior Notes | Aug. 2017 | | Sept. 2024 | | 750 | | | 749 | | | 3.2 | % | |
| 1.350% Senior Notes | June 2020 | | July 2025 | | 499 | | | 498 | | | 1.4 | % | |
| 4.450% Senior Notes | Feb. 2016 | | Feb. 2026 | | 898 | | | 898 | | | 4.5 | % | |
| 3.700% Senior Notes | May 2016 | | June 2026 | | 748 | | | 748 | | | 3.7 | % | |
| 1.050% Senior Notes | Feb. 2021 | | July 2026 | | 996 | | | 994 | | | 1.1 | % | |
| 4.000% Senior Notes | Feb. 2017 | | Mar. 2027 | | 498 | | | 498 | | | 4.0 | % | |
| 2.900% Senior Notes | Mar. 2022 | | Mar. 2027 | | 745 | | | 744 | | | 2.9 | % | |
| 3.650% Senior Notes | Aug. 2017 | | Sept. 2027 | | 997 | | | 997 | | | 3.7 | % | |
| 5.000% Senior Notes | Jan. 2023 | | Jan. 2028 | | 992 | | | 991 | | | 5.0 | % | |
| 3.800% Senior Notes | Jan. 2018 | | Feb. 2028 | | 995 | | | 995 | | | 3.8 | % | |
| 4.800% Senior Notes | Apr. 2023 | | Sept. 2028 | | 595 | | | 594 | | | 4.8 | % | |
| 4.300% Senior Notes | Feb. 2019 | | Feb. 2029 | | 596 | | | 595 | | | 4.3 | % | |
| 5.600% Senior Notes | Dec. 2023 | | June 2029 | | 741 | | | 740 | | | 5.6 | % | |
| 3.100% Senior Notes | Aug. 2019 | | Nov. 2029 | | 546 | | | 546 | | | 3.1 | % | |
| 3.300% Senior Notes | Apr. 2020 | | July 2030 | | 741 | | | 741 | | | 3.3 | % | |
| 2.250% Senior Notes | June 2020 | | Jan. 2031 | | 1,092 | | | 1,091 | | | 2.3 | % | |
| 2.100% Senior Notes | Feb. 2021 | | Apr. 2031 | | 991 | | | 990 | | | 2.1 | % | |
| 2.500% Senior Notes | June 2021 | | July 2031 | | 743 | | | 743 | | | 2.5 | % | |
| 5.100% Senior Notes | Apr. 2023 | | May 2033 | | 743 | | | 743 | | | 5.1 | % | |
5.800% Senior Notes | Dec. 2023 | | Mar. 2034 | | 742 | | | 740 | | | 5.8 | % | |
| 2.900% Senior Notes | Feb. 2021 | | Apr. 2041 | | 1,235 | | | 1,234 | | | 2.9 | % | |
| 4.750% Senior Notes | May 2017 | | May 2047 | | 344 | | | 344 | | | 4.8 | % | |
| 5.200% Senior Notes | Feb. 2019 | | Feb. 2049 | | 396 | | | 396 | | | 5.2 | % | |
| 4.000% Senior Notes | Aug. 2019 | | Nov. 2049 | | 346 | | | 346 | | | 4.0 | % | |
| 4.150% Senior Notes | Apr. 2020 | | July 2050 | | 490 | | | 490 | | | 4.2 | % | |
| 3.250% Senior Notes | June 2020 | | Jan. 2051 | | 890 | | | 890 | | | 3.3 | % | |
| Total unsecured debt | | | | | 21,942 | | | 21,167 | | | | |
| Total debt and other obligations | | | | | 23,719 | | | 22,921 | | | | |
| Less: current maturities of debt and other obligations | | 865 | | | 835 | | | | |
| Non-current portion of debt and other long-term obligations | | $ | 22,854 | | | $ | 22,086 | | | | |
(a)See the 2023 Form 10-K, including note 7 to the consolidated financial statements, for additional information regarding the maturity and principal amortization provisions and interest rates relating to the Company's indebtedness.
(b)Represents the weighted-average stated interest rate, as applicable.
(c)If the Tower Revenue Notes, Series 2015-2 and Series 2018-2 (collectively, "Tower Revenue Notes") are not paid in full on or prior to an applicable anticipated repayment date, then Excess Cash Flow (as defined in the indenture governing the terms of such notes) of the issuers of such notes will be used to repay principal of the applicable series and class of the Tower Revenue Notes, and additional interest (of an additional approximately 5% per annum) will accrue on the respective Tower Revenue Notes. As of June 30, 2024, the Tower Revenue Notes, Series 2015-2 and Series 2018-2 have principal amounts of $700 million and $750 million, with anticipated repayment dates in 2025 and 2028, respectively.
(d)The Company's installment purchases primarily relate to land and bear interest rates up to 8% and mature in periods ranging from less than one year to approximately 25 years.
CROWN CASTLE INC. AND SUBSIDIARIES
NOTES TO CONDENSED CONSOLIDATED FINANCIAL STATEMENTS-Unaudited (Continued)
(Tabular dollars in millions, except per share amounts)
(e)For the periods ended June 30, 2024 and December 31, 2023, reflects $27 million and $18 million, respectively, in finance lease obligations (primarily related to vehicles).
(f)As of June 30, 2024, the undrawn availability under the Company's senior unsecured revolving credit facility ("2016 Revolver") was $7.0 billion.
(g)Both the 2016 Revolver and the senior unsecured term loan A facility ("2016 Term Loan A" and, collectively, "2016 Credit Facility") bear interest, at the Company's option, at either (1) Term SOFR plus (i) a credit spread adjustment of 0.10% per annum and (ii) a credit spread ranging from 0.875% to 1.750% per annum or (2) an alternate base rate plus a credit spread ranging from 0.000% to 0.750% per annum, in each case, with the applicable credit spread based on the Company's senior unsecured debt rating. The Company pays a commitment fee ranging from 0.080% to 0.300%, based on the Company's senior unsecured debt rating, per annum on the undrawn available amount under the 2016 Revolver. See the 2023 Form 10-K, including note 7 to the consolidated financial statements, for information regarding potential adjustments to such percentages.
(h)The maturities of the Commercial Paper Notes, when outstanding, may vary but may not exceed 397 days from the date of issue, but there were no Commercial Paper Notes issued or outstanding during the period that had original maturities greater than three months. The Commercial Paper Notes are issued under customary terms in the commercial paper market and are issued at a discount from par or, alternatively, can be issued at par and bear varying interest rates on a fixed or floating basis. At any point in time, the Company intends to maintain available commitments under its 2016 Revolver in an amount at least equal to the amount of Commercial Paper Notes outstanding. While any outstanding Commercial Paper Notes generally have short-term maturities, the Company classifies the outstanding issuances, when applicable, as long-term based on its ability and intent to refinance the outstanding issuances on a long-term basis.
Scheduled Principal Payments and Final Maturities
The following are the scheduled principal payments and final maturities of the total debt and other long-term obligations of the Company outstanding as of June 30, 2024, which do not consider the principal payments that will commence following the anticipated repayment dates on the Tower Revenue Notes.
| | | | | | | | | | | | | | | | | | | | | | | | | | | | | | | | | | | | | | | | | | | | | | | | | | | | | |
| | Six Months Ending December 31, | | Years Ending December 31, | | | | Total Cash Obligations | | Unamortized Adjustments, Net | | Total Debt and Other Obligations Outstanding |
| | 2024 | | 2025 | | 2026 | | 2027 | | 2028 | | Thereafter | | | |
Scheduled principal payments and final maturities | $ | 2,249 | | (a) | $ | 605 | | | $ | 2,784 | | | $ | 3,254 | | | $ | 2,632 | |
| $ | 12,350 | | | $ | 23,874 | | | $ | (155) | | | $ | 23,719 | |
(a)Predominately consists of outstanding indebtedness under the CP Program as discussed in footnote (h) of the preceding table and $750 million aggregate principal amount of 3.200% senior unsecured notes due September 2024.
Interest Expense and Amortization of Deferred Financing Costs, Net
The components of interest expense and amortization of deferred financing costs, net are as follows:
| | | | | | | | | | | | | | | | | | | | | | | |
| Three Months Ended June 30, | | Six Months Ended June 30, |
| 2024 | | 2023 | | 2024 | | 2023 |
| Interest expense on debt obligations | $ | 227 | | | $ | 205 | | | $ | 450 | | | $ | 403 | |
| Amortization of deferred financing costs and adjustments on long-term debt | 8 | | | 7 | | | 16 | | | 14 | |
| Capitalized interest | (5) | | | (4) | | | (10) | | | (7) | |
| Total | $ | 230 | | | $ | 208 | | | $ | 456 | | | $ | 410 | |
5.Fair Value Disclosures | | | | | | | | | | | | | | | | | | | | | | | | | | | | | |
| Level in Fair Value Hierarchy | | June 30, 2024 | | December 31, 2023 |
| | Carrying Amount | | Fair Value | | Carrying Amount | | Fair Value |
| Assets: | | | | | | | | | |
| Cash and cash equivalents | 1 | | $ | 155 | | | $ | 155 | | | $ | 105 | | | $ | 105 | |
Restricted cash and cash equivalents, current and non-current | 1 | | 176 | | | 176 | | | 176 | | | 176 | |
| | | | | | | | | |
| Liabilities: | | | | | | | | | |
| Total debt and other obligations | 2 | | 23,719 | | | 21,834 | | | 22,921 | | | 21,201 | |
The fair values of cash and cash equivalents and restricted cash and cash equivalents approximate the carrying values. The Company determines the fair value of its debt securities based on indicative, non-binding quotes from brokers. Quotes from brokers require judgment and are based on the brokers' interpretation of market information, including implied credit spreads for similar borrowings on recent trades or bid/ask prices or quotes from active markets if available. Since December 31, 2023, there have been no changes in the Company's valuation techniques used to measure fair values.
CROWN CASTLE INC. AND SUBSIDIARIES
NOTES TO CONDENSED CONSOLIDATED FINANCIAL STATEMENTS-Unaudited (Continued)
(Tabular dollars in millions, except per share amounts)
6.Income Taxes
The Company operates as a REIT for U.S. federal income tax purposes. As a REIT, the Company is generally entitled to a deduction for dividends that it pays and, therefore, is not subject to U.S. federal corporate income tax on its net taxable income that is currently distributed to its stockholders. The Company may be subject to certain federal, state, local and foreign taxes on its income, including (1) taxes on any undistributed income and (2) taxes related to the TRSs. In addition, the Company could, under certain circumstances, be required to pay an excise or penalty tax, which could be significant in amount, in order to utilize one or more relief provisions under the Internal Revenue Code of 1986, as amended, to maintain qualification for taxation as a REIT.
The Company's TRS assets and operations will continue to be subject, as applicable, to federal and state corporate income taxes or to foreign taxes in the jurisdictions in which such assets and operations are located. The Company's foreign assets and operations (including its tower operations in Puerto Rico) are subject to foreign income taxes in the jurisdictions in which such assets and operations are located, regardless of whether they are included in a TRS or not.
For the six months ended June 30, 2024 and 2023, the Company's effective tax rate differed from the federal statutory rate predominately due to the Company's REIT status, including the dividends paid deduction.
7.Per Share Information
Basic net income (loss), per common share, excludes dilution and is computed by dividing net income (loss) by the weighted-average number of common shares outstanding during the period. For the three and six months ended June 30, 2024 and 2023, diluted net income (loss), per common share, is computed by dividing net income (loss) by the weighted-average number of common shares outstanding during the period, plus any potential dilutive common share equivalents, including shares issuable upon the vesting of restricted stock units ("RSUs") as determined under the treasury stock method.
| | | | | | | | | | | | | | | | | | | | | | | |
| | Three Months Ended June 30, | | Six Months Ended June 30, |
| | 2024 | | 2023 | | 2024 | | 2023 |
| Net income (loss) | $ | 251 | | | $ | 455 | | | $ | 562 | | | $ | 874 | |
| | | | | | | |
| Weighted-average number of common shares outstanding (in millions): | | | | | | | |
| Basic weighted-average number of common stock outstanding | 435 | | | 434 | | | 434 | | | 433 | |
| Effect of assumed dilution from potential issuance of common shares relating to restricted stock units | — | | | — | | | 1 | | | 1 | |
| Diluted weighted-average number of common shares outstanding | 435 | | | 434 | | | 435 | | | 434 | |
| | | | | | | |
| Net income (loss), per common share: | | | | | | | |
| Basic | $ | 0.58 | | | $ | 1.05 | | | $ | 1.29 | | | $ | 2.02 | |
| Diluted | $ | 0.58 | | | $ | 1.05 | | | $ | 1.29 | | | $ | 2.01 | |
| | | | | | | |
| Dividends/distributions declared per share of common stock | $ | 1.565 | | | $ | 1.565 | | | $ | 3.130 | | | $ | 3.130 | |
During the six months ended June 30, 2024, the Company granted one million RSUs to the Company's executives and certain other employees.
8.Commitments and Contingencies
The Company is involved in various claims, assessments, lawsuits or proceedings arising in the ordinary course of business. While there are uncertainties inherent in the ultimate outcome of such matters and it is impossible to presently determine the ultimate costs or losses that may be incurred, if any, management believes the adverse resolution of such uncertainties and the incurrence of such costs should not have a material adverse effect on the Company's condensed consolidated financial position or results of operations. The Company and certain of its subsidiaries are also contingently liable for commitments or performance guarantees arising in the ordinary course of business, including certain letters of credit or surety bonds. In addition, as mentioned in note 1, the Company has the option to purchase approximately 53% of its towers at the end of their respective lease terms. The Company has no obligation to exercise such purchase options.
CROWN CASTLE INC. AND SUBSIDIARIES
NOTES TO CONDENSED CONSOLIDATED FINANCIAL STATEMENTS-Unaudited (Continued)
(Tabular dollars in millions, except per share amounts)
9.Equity
Declaration and Payment of Dividends
During the six months ended June 30, 2024, the following dividends/distributions were declared or paid:
| | | | | | | | | | | | | | | | | | | | | | | | | | | | | | | | |
| Equity Type | | Declaration Date | | Record Date | | Payment Date | | Dividends Per Share | | Aggregate Payment Amount(a) |
| Common Stock | | February 21, 2024 | | March 15, 2024 | | March 28, 2024 | | $ | 1.565 | | | $ | 683 | |
| Common Stock | | May 22, 2024 | | June 14, 2024 | | June 28, 2024 | | $ | 1.565 | | | $ | 684 | |
| | | | | | | | | | |
| | | | | | | | | | |
| | | | | | | | | | |
| | | | | | | | | | |
| | | | | | | | | | |
| | | | | | | | | | |
(a)Inclusive of dividends accrued for holders of unvested RSUs, which will be paid when and if the RSUs vest.
Purchases of the Company's Common Stock
For the six months ended June 30, 2024, the Company purchased 0.3 million shares of its common stock utilizing $30 million in cash. The shares of common stock purchased relate to shares withheld in connection with the payment of withholding taxes upon vesting of RSUs.
2021 "At-the-Market" Stock Offering Program
The Company previously maintained an "at-the-market" stock offering program through which it had the right to issue and sell shares of its common stock having an aggregate gross sales price of up to $750 million ("2021 ATM Program"). The Company terminated its previously outstanding 2021 ATM Program in March 2024 with the entire gross sales price of $750 million remaining unsold.
2024 "At-the-Market" Stock Offering Program
In March 2024, the Company established a new "at-the-market" stock offering program through which it may issue and sell shares of its common stock having an aggregate gross sales price of up to $750 million ("2024 ATM Program"). Sales under the 2024 ATM Program may be made by means of ordinary brokers' transactions on the NYSE or otherwise at market prices prevailing at the time of sale, at prices related to prevailing market prices or, subject to the Company's specific instructions, at negotiated prices. The Company intends to use the net proceeds from any sales under the 2024 ATM Program for general corporate purposes, which may include (1) the funding of future acquisitions or investments or (2) the repayment or repurchase of any outstanding indebtedness. The Company has not sold any shares of common stock under the 2024 ATM Program.
10.Operating Segments
The Company's operating segments consist of (1) Towers and (2) Fiber. The Towers segment provides access, including space or capacity, to the Company's more than 40,000 towers geographically dispersed throughout the U.S. The Towers segment also reflects certain ancillary services relating to the Company's towers, predominately consisting of site development services and installation services. See note 12 to the condensed consolidated financial statements for a discussion of the Company's 2023 Restructuring Plan, which included discontinuing installation services as a Towers product offering. The Fiber segment provides access, including space or capacity, to the Company's approximately (1) 115,000 small cells on air or under contract and (2) 90,000 route miles of fiber primarily supporting small cells and fiber solutions geographically dispersed throughout the U.S.
The measurement of profit or loss used by the Company's chief operating decision maker ("CODM") to evaluate the performance of its operating segments is segment operating profit (loss). Additionally, the Company CODM also reviews segment site rental gross margin and segment services and other gross margin. The Company defines segment operating profit (loss) as segment site rental gross margin plus segment services and other gross margin, and segment other operating (income) expense, less segment selling, general and administrative expenses. The Company defines segment site rental gross margin as segment site rental revenues less segment site rental costs of operations, excluding stock-based compensation expense, net and amortization of prepaid lease purchase price adjustments recorded in consolidated site rental costs of operations. The Company defines segment services and other gross margin as segment services and other revenues less segment services and other costs of operations, excluding stock-based compensation expense, net recorded in consolidated services and other costs of operations. All of these measurements are exclusive of depreciation, amortization and accretion, which are shown separately.
CROWN CASTLE INC. AND SUBSIDIARIES
NOTES TO CONDENSED CONSOLIDATED FINANCIAL STATEMENTS-Unaudited (Continued)
(Tabular dollars in millions, except per share amounts)
The following tables set forth the Company's segment operating results for the three and six months ended June 30, 2024 and 2023. Costs that are directly attributable to Towers and Fiber are assigned to those respective segments. Additionally, certain costs are shared across segments and are reflected in the Company's segment measures through allocations that management believes to be reasonable. The "Other" column (1) represents amounts excluded from specific segments, such as restructuring charges (credits), asset write-down charges, acquisition and integration costs, depreciation, amortization and accretion, amortization of prepaid lease purchase price adjustments, interest expense and amortization of deferred financing costs, net, gains (losses) on retirement of long-term obligations, interest income, other income (expense), stock-based compensation expense, net and certain selling, general and administrative expenses, and (2) reconciles segment operating profit (loss) to income (loss) before income taxes, as the amounts are not utilized in assessing each segment’s performance. The "Other" total assets balance includes corporate assets such as cash and cash equivalents and restricted cash and cash equivalents which have not been allocated to specific segments. There are no significant revenues resulting from transactions between the Company's operating segments.
| | | | | | | | | | | | | | | | | | | | | | | | | | | | | | | | | | | | | | | | | | | | | | | |
| Three Months Ended June 30, 2024 | | Three Months Ended June 30, 2023 |
| Towers | | Fiber | | Other | |
Total | | Towers | | Fiber | | Other | |
Total |
| Segment site rental revenues | $ | 1,064 | | | $ | 516 | | | | | $ | 1,580 | | | $ | 1,080 | | | $ | 648 | | | | | $ | 1,728 | |
| Segment services and other revenues | 43 | | | 3 | | | | | 46 | | | 124 | | | 15 | | | | | 139 | |
| Segment revenues | 1,107 | | | 519 | | | | | 1,626 | | | 1,204 | | | 663 | | | | | 1,867 | |
| Segment site rental costs of operations | 245 | | | 178 | | | | | 423 | | | 243 | | | 171 | | | | | 414 | |
| Segment services and other costs of operations | 23 | | | 2 | | | | | 25 | | | 92 | | | 3 | | | | | 95 | |
Segment costs of operations(a)(b) | 268 | | | 180 | | | | | 448 | | | 335 | | | 174 | | | | | 509 | |
| Segment site rental gross margin | 819 | | | 338 | | | | | 1,157 | | | 837 | | | 477 | | | | | 1,314 | |
| Segment services and other gross margin | 20 | | | 1 | | | | | 21 | | | 32 | | | 12 | | | | | 44 | |
Segment selling, general and administrative expenses(b) | 16 | | | 50 | | | | | 66 | | | 30 | | | 51 | | | | | 81 | |
| Segment operating profit (loss) | 823 | | | 289 | | | | | 1,112 | | | 839 | | | 438 | | | | | 1,277 | |
Other selling, general and administrative expenses(b) | | | | | $ | 105 | | | 105 | | | | | | | $ | 88 | | | 88 | |
| Stock-based compensation expense, net | | | | | 40 | | | 40 | | | | | | | 50 | | | 50 | |
| Depreciation, amortization and accretion | | | | | 430 | | | 430 | | | | | | | 445 | | | 445 | |
Restructuring charges | | | | | 45 | | | 45 | | | | | | | — | | | — | |
| Interest expense and amortization of deferred financing costs, net | | | | | 230 | | | 230 | | | | | | | 208 | | | 208 | |
Other (income) expenses to reconcile to income (loss) before income taxes(c) | | | | | 4 | | | 4 | | | | | | | 24 | | | 24 | |
| Income (loss) before income taxes | | | | | | | $ | 258 | | | | | | | | | $ | 462 | |
| Capital expenditures | $ | 29 | | | $ | 289 | | | $ | 11 | | | $ | 329 | | | $ | 61 | | | $ | 306 | | | $ | 12 | | | $ | 379 | |
| Total assets (at period end) | $ | 21,177 | | | $ | 16,358 | | | $ | 711 | | | $ | 38,246 | | | $ | 21,973 | | | $ | 16,166 | | | $ | 903 | | | $ | 39,042 | |
(a)Exclusive of depreciation, amortization and accretion shown separately.
(b)Segment costs of operations excludes (1) stock-based compensation expense, net of $7 million and $9 million for the three months ended June 30, 2024 and 2023, respectively and (2) prepaid lease purchase price adjustments of $4 million for each of the three months ended June 30, 2024 and 2023. Segment selling, general and administrative expenses and other selling, general and administrative expenses exclude stock-based compensation expense, net of $33 million and $41 million for the three months ended June 30, 2024 and 2023, respectively.
(c)See condensed consolidated statement of operations and comprehensive income (loss) for further information.
CROWN CASTLE INC. AND SUBSIDIARIES
NOTES TO CONDENSED CONSOLIDATED FINANCIAL STATEMENTS-Unaudited (Continued)
(Tabular dollars in millions, except per share amounts)
| | | | | | | | | | | | | | | | | | | | | | | | | | | | | | | | | | | | | | | | | | | | | | | |
| Six Months Ended June 30, 2024 | | Six Months Ended June 30, 2023 |
| Towers | | Fiber | | Other | |
Total | | Towers | | Fiber | | Other | |
Total |
| Segment site rental revenues | $ | 2,132 | | | $ | 1,036 | | | | | $ | 3,168 | | | $ | 2,161 | | | $ | 1,191 | | | | | $ | 3,352 | |
| Segment services and other revenues | 89 | | | 10 | | | | | 99 | | | 270 | | | 18 | | | | | 288 | |
| Segment revenues | 2,221 | | | 1,046 | | | | | 3,267 | | | 2,431 | | | 1,209 | | | | | 3,640 | |
| Segment site rental costs of operations | 483 | | | 360 | | | | | 843 | | | 477 | | | 343 | | | | | 820 | |
| Segment services and other costs of operations | 51 | | | 7 | | | | | 58 | | | 191 | | | 5 | | | | | 196 | |
Segment costs of operations(a)(b) | 534 | | | 367 | | | | | 901 | | | 668 | | | 348 | | | | | 1,016 | |
| Segment site rental gross margin | 1,649 | | | 676 | | | | | 2,325 | | | 1,684 | | | 848 | | | | | 2,532 | |
| Segment services and other gross margin | 38 | | | 3 | | | | | 41 | | | 79 | | | 13 | | | | | 92 | |
Segment selling, general and administrative expenses(b) | 37 | | | 97 | | | | | 134 | | | 61 | | | 100 | | | | | 161 | |
Segment operating profit (loss) | 1,650 | | | 582 | | | | | 2,232 | | | 1,702 | | | 761 | | | | | 2,463 | |
Other selling, general and administrative expenses(b) | | | | | $ | 189 | | | 189 | | | | | | | $ | 170 | | | 170 | |
| Stock-based compensation expense | | | | | 78 | | | 78 | | | | | | | 91 | | | 91 | |
Depreciation, amortization and accretion | | | | | 869 | | | 869 | | | | | | | 876 | | | 876 | |
Restructuring charges | | | | | 56 | | | 56 | | | | | | | — | | | — | |
| Interest expense and amortization of deferred financing costs, net | | | | | 456 | | | 456 | | | | | | | 410 | | | 410 | |
Other (income) expenses to reconcile to income (loss) before income taxes(c) | | | | | 8 | | | 8 | | | | | | | 28 | | | 28 | |
| Income (loss) before income taxes | | | | | | | $ | 576 | | | | | | | | | $ | 888 | |
| Capital expenditures | $ | 64 | | | $ | 562 | | | $ | 23 | | | $ | 649 | | | $ | 111 | | | $ | 585 | | | $ | 24 | | | $ | 720 | |
(a)Exclusive of depreciation, amortization and accretion shown separately.
(b)Segment costs of operations excludes (1) stock-based compensation expense, net of $14 million and $17 million for the six months ended June 30, 2024 and 2023, respectively, and (2) prepaid lease purchase price adjustments of $8 million for each of the six months ended June 30, 2024 and 2023. Segment selling, general and administrative expenses and other selling, general and administrative expenses exclude stock-based compensation expense, net of $64 million and $74 million for the six months ended June 30, 2024 and 2023, respectively.
(c)See condensed consolidated statement of operations and comprehensive income (loss) for further information.
11.Supplemental Cash Flow Information
The following table is a summary of the Company's supplemental cash flow information for the six months ended June 30, 2024 and 2023:
| | | | | | | | | | | |
| Six Months Ended June 30, |
| 2024 | | 2023 |
| Supplemental disclosure of cash flow information: | | | |
Cash payments related to operating lease liabilities(a) | $ | 283 | | | $ | 284 | |
| Interest paid | 441 | | | 367 | |
Income taxes paid | 9 | | | 10 | |
| Supplemental disclosure of non-cash operating, investing and financing activities: | | | |
ROU assets recorded in exchange for operating lease liabilities | (70) | | | 28 | |
| Increase (decrease) in accounts payable for purchases of property and equipment | (18) | | | 16 | |
Capitalized stock-based compensation | 13 | | | 14 | |
| Purchase of property and equipment under finance leases and installment land purchases | 41 | | | 39 | |
(a)Excludes the Company's contingent payments pursuant to operating leases, which are recorded as expense in the period such contingencies are resolved.
CROWN CASTLE INC. AND SUBSIDIARIES
NOTES TO CONDENSED CONSOLIDATED FINANCIAL STATEMENTS-Unaudited (Continued)
(Tabular dollars in millions, except per share amounts)
The reconciliation of cash and cash equivalents and restricted cash and cash equivalents reported within various lines on the condensed consolidated balance sheet to amounts reported in the condensed consolidated statement of cash flows is shown below.
| | | | | | | | | | | |
| June 30, 2024 | | December 31, 2023 |
| Cash and cash equivalents | $ | 155 | | | $ | 105 | |
Restricted cash and cash equivalents, current | 171 | | | 171 | |
Restricted cash and cash equivalents reported within other assets, net | 5 | | | 5 | |
Cash and cash equivalents and restricted cash and cash equivalents | $ | 331 | | | $ | 281 | |
12.Restructuring
2023 Restructuring Plan
In July 2023, the Company initiated the 2023 Restructuring Plan as part of its efforts to reduce costs to better align the Company's operational needs with lower tower activity. The 2023 Restructuring Plan included reducing the Company's total employee headcount by approximately 15%, discontinuing installation services as a Towers product offering while continuing to offer site development services on Company towers, and consolidating office space.
In the first six months ended June 30, 2024, the Company recorded approximately $13 million in charges in connection with the 2023 Restructuring Plan (including $2 million in the three months ended June 30, 2024), $8 million of which is related to remaining obligations under facility leases and $4 million of non-cash charges representing accelerated depreciation. In connection with the headcount reduction, the Company recorded a $1 million charge which represents cash payments that have been made in connection with the employee headcount reduction.
The actions associated with the 2023 Restructuring Plan have been substantially completed and related charges have been recorded by June 30, 2024, while the payments are expected to be completed for the employee headcount reduction and office space consolidation in 2024 and 2032, respectively. The following table summarizes the activities related to the 2023 Restructuring Plan for the three and six months ended June 30, 2024:
| | | | | | | | | | | | | | | | | | | | | | | | | | | | | | | | | | | |
| Three Months Ended June 30, 2024 | | Six Months Ended June 30, 2024 |
| Employee Headcount Reduction | | Office Space Consolidation | | Total | | Employee Headcount Reduction | | Office Space Consolidation | | Total |
Liability as of the beginning of the respective period | $ | 8 | | | $ | 15 | | | $ | 23 | | | $ | 16 | | | $ | 12 | | | $ | 28 | |
Charges | 1 | | | 1 | | | 2 | | | 1 | | | 12 | | | 13 | |
Payments | (3) | | | (4) | | | (7) | | | (11) | | | (8) | | | (19) | |
Non-cash items | — | | | — | | | — | | | — | | | (4) | | | (4) | |
Liability as of June 30, 2024 | $ | 6 | | | $ | 12 | | | $ | 18 | | | $ | 6 | | | $ | 12 | | | $ | 18 | |
2024 Restructuring Plan
In June 2024, the Company initiated the 2024 Restructuring Plan as part of its efforts to drive operational efficiencies and reduce operating costs and capital expenditures, with a primary focus on the Company's Fiber segment. As a result, the Company announced a reduction of the Company's total employee headcount by more than 10% and the closing of certain offices.
In the second quarter 2024, the Company recorded approximately $43 million in charges in connection with the 2024 Restructuring Plan, $36 million of which represent cash payments that have been or will be made in connection with employee severance and other one-time termination benefits. In connection with the office closures, the Company recorded $7 million of non-cash charges representing accelerated depreciation.
The actions associated with the 2024 Restructuring Plan and related charges are expected to be substantially completed and recorded by December 31, 2024, while the payments are expected to be completed for the employee headcount reduction in 2025 and office closures in 2033. The Company expects to incur an additional approximately $70 million of related charges during the second half of 2024, primarily related to office closures. The Company may incur other charges or cash expenditures not currently contemplated due to unanticipated events that may occur, including in connection with the implementation of the 2024 Restructuring Plan.
CROWN CASTLE INC. AND SUBSIDIARIES
NOTES TO CONDENSED CONSOLIDATED FINANCIAL STATEMENTS-Unaudited (Continued)
(Tabular dollars in millions, except per share amounts)
The following table summarizes the activities related to the 2024 Restructuring Plan for the three and six months ended June 30, 2024:
| | | | | | | | | | | | | | | | | | | | | | | | | |
| Three and Six Months Ended June 30, 2024 | | |
| Employee Headcount Reduction | | Office Closures | | | | Total | | | | | | |
Charges | 36 | | | 7 | | | | | 43 | | | | | | | |
Payments | (2) | | | — | | | | | (2) | | | | | | | |
Non-cash items | — | | | (7) | | | | | (7) | | | | | | | |
Liability as of June 30, 2024 | $ | 34 | | | $ | — | | | | | $ | 34 | | | | | | | |
As of June 30, 2024, the liability for restructuring charges is included in "Other accrued liabilities" on the consolidated balance sheet, and the corresponding expense is included in "Restructuring charges" on the condensed consolidated statements of operations and comprehensive income.
The Company does not allocate restructuring charges between its operating segments. If charges related to the Restructuring Plans were allocated to operating segments, for the three months ended June 30, 2024, $4 million and $27 million of the aforementioned charge would have been allocated to the Company's Towers and Fiber segment, respectively, with the remaining $14 million allocated to Other. Similarly, for the six months ended June 30, 2024, $6 million and $31 million of the aforementioned charge would have been allocated to the Company's Towers and Fiber segment, respectively, with the remaining $19 million allocated to Other.
ITEM 2.MANAGEMENT'S DISCUSSION AND ANALYSIS OF FINANCIAL CONDITION AND RESULTS OF OPERATIONS
The following discussion should be read in conjunction with the response to Part I, Item 1 of this report and the consolidated financial statements of the Company including the related notes and "Item 7. Management's Discussion and Analysis of Financial Condition and Results of Operations" ("MD&A") included in the 2023 Form 10-K.
General Overview
Overview
We own, operate and lease shared communications infrastructure that is geographically dispersed throughout the U.S., including (1) more than 40,000 towers and other structures, such as rooftops (collectively, "towers"), (2) approximately 115,000 small cells on air or under contract and (3) approximately 90,000 route miles of fiber primarily supporting small cells and fiber solutions.
Our towers have a significant presence in each of the top 100 basic trading areas ("BTAs"), and the majority of our small cells and fiber assets are located in major metropolitan areas, including a presence within every major U.S. market. Site rental revenues represented 97% of our second quarter 2024 consolidated net revenues, of which 67% and 33% were from our Towers segment and Fiber segment, respectively. Within our Fiber segment, 67% and 33% of our second quarter 2024 Fiber site rental revenues related to fiber solutions and small cells, respectively. See note 10 to our condensed consolidated financial statements. The vast majority of our site rental revenues are of a recurring nature and are derived from long-term tenant contracts.
Strategy
As a leading provider of shared communications infrastructure in the U.S., our strategy is to create long-term stockholder value via a combination of (1) growing cash flows generated from our existing portfolio of communications infrastructure, (2) returning a meaningful portion of our cash generated by operating activities to our common stockholders in the form of dividends and (3) investing capital efficiently to grow cash flows and long-term dividends per share. Our strategy is based, in part, on our belief that the U.S. is the most attractive market for shared communications infrastructure investment with the greatest long-term growth potential. We measure our efforts to create "long-term stockholder value" by the combined payment of dividends to stockholders and growth in our per-share results. The key elements of our strategy are to:
•Grow cash flows from our existing communications infrastructure. We are focused on maximizing the recurring site rental cash flows generated from providing our tenants with long-term access to our shared infrastructure assets, which we believe is the core driver of value for our stockholders. Tenant additions or modifications of existing tenant equipment (collectively, "tenant additions") enable our tenants to expand coverage and capacity in order to meet increasing demand for data while generating high incremental returns for our business. We believe our product offerings of towers and small cells through our shared communications infrastructure model provide a comprehensive, efficient and cost-effective solution for our wireless tenants' growing networks. Additionally, we believe our ability to share our fiber assets across multiple tenants to both deploy small cells and offer fiber solutions allows us to generate cash flows and increase stockholder return.
•Return cash generated by operating activities to common stockholders in the form of dividends. We believe that distributing a meaningful portion of our cash generated by operating activities appropriately provides common stockholders with increased certainty for a portion of expected long-term stockholder value while still allowing us to retain sufficient flexibility to invest in our business and deliver growth. We believe this decision reflects the translation of the high-quality, long-term contractual cash flows of our business into stable capital returns to common stockholders.
•Invest capital efficiently to grow cash flows and long-term dividends per share. In addition to adding tenants to existing communications infrastructure, we seek to invest our available capital, including the net cash generated by our operating activities and external financing sources, in a manner that will increase long-term stockholder value on a risk-adjusted basis. These investments include constructing and acquiring new communications infrastructure that we expect will generate future cash flow growth and attractive long-term returns by adding tenants to those assets over time. Our historical investments have included the following (in no particular order):
◦construction of towers, fiber and small cells;
◦acquisitions of towers, fiber and small cells;
◦acquisitions of land interests (which primarily relate to land assets under towers);
◦improvements and structural enhancements to our existing communications infrastructure;
◦purchases of shares of our common stock from time to time; and
◦purchases, repayments or redemptions of our debt.
Our strategy to create long-term stockholder value is based on our belief that there will be considerable future demand for our communications infrastructure based on the location of our assets and the rapid and continuing growth in the demand for data. We believe that such demand for our communications infrastructure will continue, will result in growth of our cash flows due to tenant additions on our existing communications infrastructure, and will create other growth opportunities for us, such as demand for newly constructed or acquired communications infrastructure, as described above. Further, we seek to augment the long-term value creation associated with growing our recurring site rental cash flows by offering certain ancillary site development services within our Towers segment.
Highlights of Business Fundamentals and Results
•We operate as a REIT for U.S. federal income tax purposes
◦As a REIT, we are generally entitled to a deduction for dividends that we pay and, therefore, are not subject to U.S. federal corporate income tax on our net taxable income that is currently distributed to our stockholders.
◦To remain qualified and be taxed as a REIT, we will generally be required to annually distribute to our stockholders at least 90% of our REIT taxable income, after the utilization of our NOLs (determined without regard to the dividends paid deduction and excluding net capital gain).
◦See note 6 to our condensed consolidated financial statements for further discussion of our REIT status.
•Potential growth resulting from the increasing demand for data
◦We expect existing and potential new tenant demand for our communications infrastructure will result from (1) new technologies, (2) increased usage of mobile entertainment, mobile internet, and machine-to-machine applications, (3) adoption of other emerging and embedded wireless devices (including smartphones, laptops, tablets, wearables and other devices), (4) increasing smartphone penetration, (5) wireless carrier focus on expanding both network quality and capacity, including the use of both towers and small cells, (6) the adoption of other bandwidth-intensive applications (such as cloud services, artificial intelligence and video communications), (7) the availability of additional spectrum and (8) increased government initiatives to support connectivity throughout the U.S.
◦We expect U.S. wireless carriers will continue to focus on improving network quality and expanding capacity (including through 5G initiatives) by utilizing a combination of towers and small cells. We believe our product offerings of towers and small cells provide a comprehensive solution to our wireless tenants' growing communications infrastructure needs.
◦We expect organizations will continue to increase the usage of high-bandwidth applications that will require the utilization of more fiber infrastructure and fiber solutions, such as those we provide.
◦Within our Fiber segment, we are able to generate growth and returns for our stockholders by deploying our fiber for both small cells and fiber solutions tenants.
◦Tenant additions on our existing communications infrastructure are achieved at a low incremental operating cost, delivering high incremental returns.
•Substantially all of our communications infrastructure can accommodate additional tenancy, either as currently constructed or with appropriate modifications.
•Investing capital efficiently to grow long-term dividends per share (see also "Item 2. MD&A—General Overview—Strategy")
◦We had discretionary capital expenditures of $600 million for the six months ended June 30, 2024, predominately resulting from the construction of new communications infrastructure and improvements to existing communications infrastructure in order to support additional tenants.
◦We expect to continue to construct and acquire new communications infrastructure based on our tenants' needs and generate attractive long-term returns by adding additional tenants over time. See note 12 to our condensed consolidated financial statements for a discussion of the 2024 Restructuring Plan (as defined below), which contemplates, among others, an increase in return thresholds on new growth opportunities and a reduction in projected Fiber capital expenditures for full year 2024.
•Site rental revenues under long-term tenant contracts
◦Our wireless tenant contracts have initial terms generally between five to 15 years, with contractual escalators and multiple renewal periods generally between five to 10 years each, exercisable at the option of the tenant.
◦Our fiber solutions tenant contracts' initial terms generally vary between one to 20 years.
◦As of June 30, 2024, our weighted-average remaining term was approximately six years, exclusive of renewals exercisable at the tenants' option, currently representing approximately $37.3 billion of expected future cash inflows.
•Majority of our revenues from large wireless carriers
◦For the six months ended June 30, 2024, approximately three-fourths of our site rental revenues were derived from T-Mobile, AT&T and Verizon Wireless.
•Majority of land under our towers under long-term control
◦For the six months ended June 30, 2024, approximately 90% of our towers site rental gross margin and approximately 80% of our towers site rental gross margin was derived from towers located on land that we own or control for greater than 10 and 20 years, respectively. The aforementioned percentages include towers located on land that is owned, including through fee interests and perpetual easements, which represented approximately 40% of our towers site rental gross margin.
•Majority of our fiber assets are located in major metropolitan areas and are on public rights-of-way
•Minimal sustaining capital expenditure requirements
◦For the six months ended June 30, 2024, sustaining capital expenditures represented approximately 1% of net revenues.
•Debt portfolio with long-dated maturities extended over multiple years, with the vast majority of such debt having a fixed rate (see note 4 to our condensed consolidated financial statements and "Item 3. Quantitative and Qualitative Disclosures About Market Risk" for a further discussion of our debt)
◦As of June 30, 2024, our outstanding debt had a weighted-average interest rate of 3.9% and weighted-average maturity of approximately seven years (assuming anticipated repayment dates on certain debt).
◦As of June 30, 2024, 89% of our debt had fixed rate coupons.
◦Our debt service coverage and leverage ratios are within their respective financial maintenance covenants.
•During 2024, we have completed the following financing activity (see note 9 to our condensed consolidated financial statements)
◦In March 2024, we terminated the previously outstanding 2021 ATM Program and established the 2024 ATM Program through which we may issue and sell shares of our common stock having an aggregate gross sales price of up to $750 million.
•Significant cash flows from operations
◦Net cash provided by operating activities was $1.4 billion for the six months ended June 30, 2024.
◦In addition to the positive impact of contractual escalators, we expect to grow our core business of providing access to our communications infrastructure as a result of future anticipated additional demand for our communications infrastructure.
•Returning cash flows provided by operations to stockholders in the form of dividends
◦During each of the first two quarters of 2024, we paid a common stock dividend of $1.565 per share, totaling approximately $1.4 billion.
◦We currently expect our common stock dividends over the next 12 months to be a cumulative amount of at least $6.26 per share, or an aggregate amount of approximately $2.7 billion.
◦Over time, we expect to increase our dividend per share as we grow cash flows. Any future common stock dividends are subject to declaration by our board of directors. See note 9 to our condensed consolidated financial statements for further information regarding our common stock and dividends.
•Restructuring Plans
◦In July 2023, we initiated a restructuring plan ("2023 Restructuring Plan") as part of our efforts to reduce costs to better align our operational needs with lower tower activity. See note 12 to our condensed consolidated financial statements and "Item 2. MD&A—Results of Operations" for further discussion of the 2023 Restructuring Plan.
◦In June 2024, we initiated a restructuring plan ("2024 Restructuring Plan," and together with 2023 Restructuring Plan, "Restructuring Plans") as part of our efforts to drive operational efficiencies, enhance returns by increasing return thresholds on new growth opportunities and reduce operating costs and capital expenditures, with a primary focus on our Fiber segment. See note 12 to our condensed consolidated financial statements and "Item 2. MD&A—Results of Operations" for further discussion of the 2024 Restructuring Plan.
•In December 2023, we announced a strategic and operating review of our Fiber segment. While the strategic review remains underway, in the second quarter of 2024, we concluded our operating review and implemented changes to our operating plans based on the findings. See note 12 to our condensed consolidated financial statements and "Item 2. MD&A—Outlook Highlights" for further discussion of the 2024 Restructuring Plan.
Outlook Highlights
The following are certain highlights of our outlook that impact our business fundamentals described above.
•We expect that, when compared to full year 2023, our full year 2024 site rental revenues growth will be positively impacted by tenant additions, as large wireless carriers and fiber solutions tenants continue to focus on meeting the increasing demand for data. We expect a year over year reduction in site rental revenues related to (1) the payments received from T-Mobile in 2023 compared to 2024 which were made in satisfaction of remaining rental obligations for certain canceled Sprint leases ("Sprint Cancellations"), as a result of the T-Mobile US, Inc. and Sprint network consolidation and (2) a decline in long-term deferred revenue amortization.
•We expect to continue to invest a significant amount of our available capital in the form of discretionary capital expenditures for 2024 based on the anticipated returns on such discretionary investments.
•We also expect sustaining capital expenditures of approximately 1% of net revenues for full year 2024, consistent with historical annual levels.
•As part of the aforementioned Restructuring Plans:
◦In connection with the 2023 Restructuring Plan, we expect to realize $105 million in labor and facilities cost savings in 2024 relative to 2023, of which $50 million is expected in selling, general and administrative, $40 million in services and other costs of operations and $15 million in site rental costs of operation. The 2024 costs savings are expected to be partially offset by a $40 million reduction in services and other gross margin due to the discontinuation of installation services.
◦We expect to incur an additional approximately $70 million of restructuring charges during the second half of 2024, primarily related to the 2024 Restructuring Plan and the resulting office closures. We may incur other charges or cash expenditures not currently contemplated due to unanticipated events that may occur, including in connection with the implementation of the 2024 Restructuring Plan. Additionally, in connection with the 2024 Restructuring Plan, we expect to realize approximately $60 million in labor and facilities cost savings in 2024, of which $50 million is expected in selling, general and administrative and $10 million in site rental costs of operations. The 2024 cost savings are expected to be partially offset by a $25 million reduction in site rental revenues due to a reduction of 3,000 to 5,000 new revenue-generating small cell nodes in 2024.
See also "Item 3. Quantitative and Qualitative Disclosures About Market Risk" for a discussion of our interest rate risks.
Results of Operations
The following discussion of our results of operations should be read in conjunction with our condensed consolidated financial statements and the 2023 Form 10-K.
The following discussion of our results of operations is based on our condensed consolidated financial statements prepared in accordance with GAAP, which requires us to make estimates and judgments that affect the reported amounts (see "Item 2. MD&A—Accounting and Reporting Matters—Critical Accounting Policies and Estimates" and note 2 to our consolidated financial statements in the 2023 Form 10-K). See "Item 2. MD&A—Accounting and Reporting Matters—Non-GAAP and Segment Financial Measures" for a discussion of our use of (1) segment site rental gross margin, (2) segment services and other gross margin, (3) segment operating profit (loss), including their respective definitions, and (4) Adjusted EBITDA, including its definition and a reconciliation to net income (loss).
Our operating segments consist of (1) Towers and (2) Fiber. See note 10 to our condensed consolidated financial statements for further discussion of our operating segments.
Highlights of our results of operations for the three months ended June 30, 2024 and 2023 are depicted below.
| | | | | | | | | | | | | | | | | | | | | | | |
| (In millions of dollars) | Three Months Ended June 30, | | | | |
| 2024 | | 2023 | | $ Change | | % Change |
| Site rental revenues: | | | | | | | |
| Towers site rental revenues | $1,064 | | $1,080 | | $(16) | | (1)% |
| Fiber site rental revenues | $516 | | $648 | | $(132) | | (20)% |
| Total site rental revenues | $1,580 | | $1,728 | | $(148) | | (9)% |
Segment site rental gross margin:(a) | | | | | | | |
Towers site rental gross margin | $819 | | $837 | | $(18) | | (2)% |
Fiber site rental gross margin | $338 | | $477 | | $(139) | | (29)% |
Segment services and other gross margin:(a) | | | | | | | |
Towers services and other gross margin | $20 | | $32 | | $(12) | | (38)% |
Fiber services and other gross margin | $1 | | $12 | | $(11) | | (92)% |
Segment operating profit (loss):(a) | | | | | | | |
Towers operating profit (loss) | $823 | | $839 | | $(16) | | (2)% |
Fiber operating profit (loss) | $289 | | $438 | | $(149) | | (34)% |
| Net income (loss) | $251 | | $455 | | $(204) | | (45)% |
Adjusted EBITDA(b) | $1,006 | | $1,188 | | $(182) | | (15)% |
(a)See note 10 to our condensed consolidated financial statements and "Item 2. MD&A—Accounting and Reporting Matters—Non-GAAP and Segment Financial Measures" for further discussion of our definitions of segment site rental gross margin, segment services and other gross margin and segment operating profit (loss).
(b)See reconciliation of this non-GAAP financial measure to net income (loss) and definition included in "Item 2. MD&A—Accounting and Reporting Matters—Non-GAAP and Segment Financial Measures."
Site rental revenues decreased $148 million, or 9%, for the three months ended June 30, 2024 compared to the three months ended June 30, 2023. This decrease was predominately comprised of the factors depicted in the chart below:
(In millions of dollars)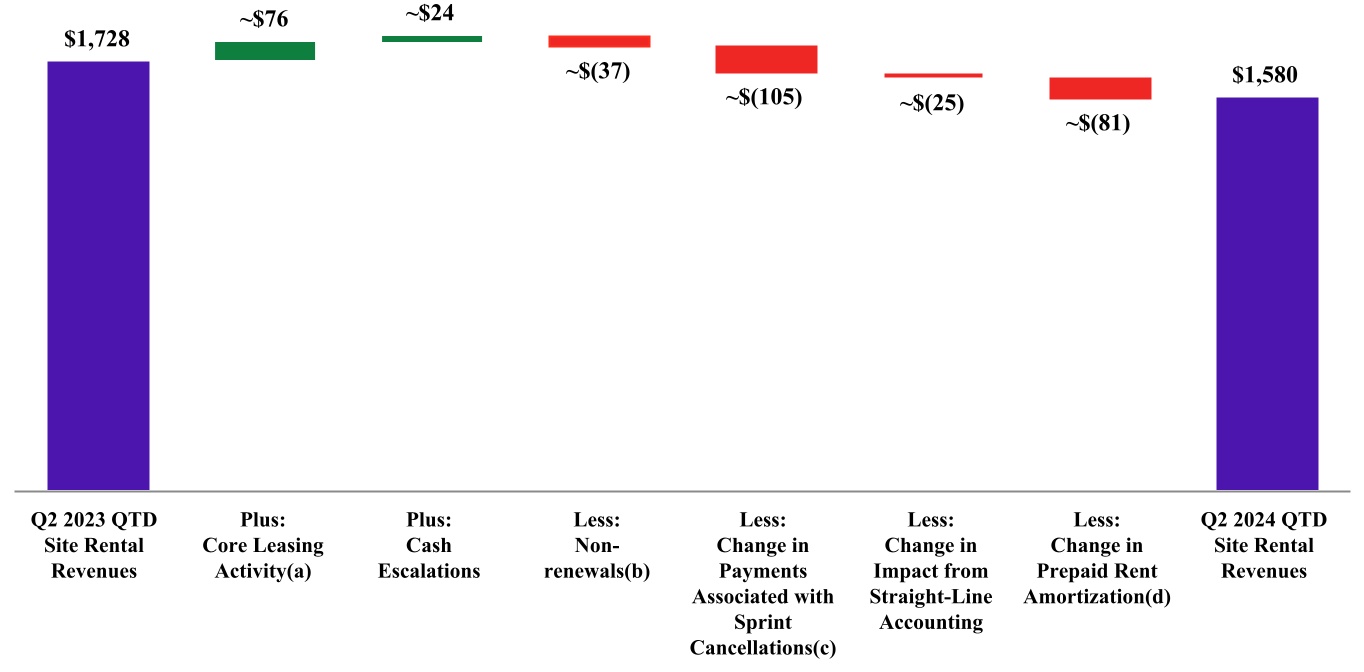
(a)Represents site rental revenues growth from tenant additions across our entire portfolio and renewals or extensions of tenant contracts, exclusive of the impacts from straight-line accounting and amortization of prepaid rent, in accordance with GAAP, and change in payments associated with Sprint Cancellations .
(b)Includes $7 million of non-renewals associated with Sprint Cancellations.
(c)Represents $106 million of payments associated with Sprint Cancellations received in the second quarter 2023 and not recurring in 2024, which were partially offset by approximately $1 million of payments associated with Sprint Cancellations received in the second quarter 2024.
(d)Prepaid rent amortization includes amortization of upfront payments received from long-term tenants and other deferred credits. Prepaid rent amortization includes $57 million of accelerated prepaid rent amortization associated with the Sprint Cancellations that was recognized in the first six months of 2023 that did not recur in 2024.
Towers site rental revenues and Towers site rental gross margin for the second quarter of 2024 were $1.1 billion and $819 million, respectively, compared to $1.1 billion and $837 million, respectively, in the same period in the prior year. The decrease of $16 million and $18 million in Towers site rental revenue and Towers site rental gross margin, respectively, was primarily due to a decrease in prepaid rent amortization, as new leasing activity and contractual cash escalators were substantially offset by a decline in the associated straight-line accounting adjustment.
Fiber site rental revenues and Fiber site rental gross margin for the second quarter of 2024 were $516 million and $338 million, respectively, and decreased by $132 million and $139 million, respectively, from the same period in the prior year. The decrease in Fiber site rental revenues and Fiber site rental gross margin was predominately impacted by the $105 million reduction in site rental revenues and the absence of $57 million in accelerated prepaid rent amortization, both related to the Sprint Cancellations, which was partially offset by the increased demand for small cells and fiber.
Towers services and other gross margin was $20 million for the second quarter of 2024 and decreased by $12 million from $32 million during the same period in the prior year, which is a reflection of the lower volume of activity from carriers' network enhancements, the volume and mix of services and other work and the discontinuation of installation services as a Towers product offering. Our services and other offerings are of a variable nature as these revenues are not under long-term tenant contracts. See note 12 to our condensed consolidated financial statements for a discussion of the 2023 Restructuring Plan, which included discontinuing installation services as a Towers product offering.
Fiber services and other gross margin was $1 million for the second quarter of 2024 and decreased by $11 million from $12 million during the same period in the prior year primarily as a result of the absence of site abandonment fees associated with the Sprint Cancellations that were received during the second quarter of 2023.
Selling, general and administrative expenses for the second quarter of 2024 were $204 million and decreased by $6 million, or 3%, from $210 million during the same period in the prior year. This decrease was primarily related to a decrease in employee-related cost as a result of our aforementioned restructuring activities, which was partially offset by an increase in legal and consulting fees, mostly stemming from our recent proxy contest.
Towers operating profit (loss) for the second quarter of 2024 decreased by $16 million, or 2%, from the same period in the prior year as a result of the previously-mentioned decreases in both Towers site rental gross margin and Towers services and other gross margin.
Fiber operating profit (loss) for the second quarter of 2024 decreased by $149 million, or 34%, from the same period in the prior year as a result of the previously-mentioned decreases in both Fiber site rental gross margin and Fiber services and other gross margin.
Depreciation, amortization and accretion was $430 million for second quarter of 2024 and decreased by $15 million, or 3%, from the same period in the prior year. This decrease predominately resulted from certain site rental contracts and tenant relationships intangible assets becoming fully amortized.
Restructuring charges in connection with the Restructuring Plans were $45 million for the second quarter of 2024. The charges primarily consisted of $37 million related to cash payments that have been or will be made associated with employee severance and other one-time termination benefits and $1 million of remaining obligations under facility leases. Additionally, non-cash charges of $7 million for accelerated depreciation were also recorded. See note 12 to our condensed consolidated financial statements.
Interest expense and amortization of deferred financing costs, net were $230 million for the second quarter of 2024 and increased by $22 million, or 11%, from $208 million during the same period in the prior year. The increase predominately resulted from an increase in the variable interest rate on our 2016 Term Loan A, as well as an increase in our outstanding indebtedness due to the financing of our discretionary capital expenditures. See note 4 to our condensed consolidated financial statements for a further discussion of our debt and "Item 3. Quantitative and Qualitative Disclosures About Market Risk" for a further discussion of our interest rate exposure.
The provision for income taxes was $7 million for both the second quarter of 2024 and 2023. For the second quarter 2024 and 2023, the effective tax rate differs from the federal statutory rate predominately due to our REIT status, including the dividends paid deduction. See note 6 to our condensed consolidated financial statements and also note 9 to our consolidated financial statements in the 2023 Form 10-K.
Net income (loss) was $251 million for the second quarter of 2024 compared to $455 million during the second quarter of 2023. The decrease was primarily related to the previously-mentioned decreases in Towers and Fiber operating profits and the previously-mentioned increases in restructuring charges and interest expense, and amortization of deferred financing costs, net.
Adjusted EBITDA decreased by $182 million, or 15%, from the second quarter of 2023 to the second quarter of 2024, reflecting the previously-mentioned decreases in Towers and Fiber operating profits.
Highlights of our results of operations for the six months ended June 30, 2024 and 2023 are depicted below.
| | | | | | | | | | | | | | | | | | | | | | | |
| (In millions of dollars) | Six Months Ended June 30, | | | | |
| 2024 | | 2023 | | $ Change | | % Change |
| Site rental revenues: | | | | | | | |
| Towers site rental revenues | $2,132 | | $2,161 | | $(29) | | (1)% |
| Fiber site rental revenues | $1,036 | | $1,191 | | $(155) | | (13)% |
| Total site rental revenues | $3,168 | | $3,352 | | $(184) | | (5)% |
Segment site rental gross margin:(a) | | | | | | | |
Towers site rental gross margin | $1,649 | | $1,684 | | $(35) | | (2)% |
Fiber site rental gross margin | $676 | | $848 | | $(172) | | (20)% |
Segment services and other gross margin:(a) | | | | | | | |
Towers services and other gross margin | $38 | | $79 | | $(41) | | (52)% |
Fiber services and other gross margin | $3 | | $13 | | $(10) | | (77)% |
Segment operating profit (loss):(a) | | | | | | | |
Towers operating profit (loss) | $1,650 | | $1,702 | | $(52) | | (3)% |
Fiber operating profit (loss) | $582 | | $761 | | $(179) | | (24)% |
| Net income (loss) | $562 | | $874 | | $(312) | | (36)% |
Adjusted EBITDA(b) | $2,043 | | $2,292 | | $(249) | | (11)% |
(a)See note 10 to our condensed consolidated financial statements and "Item 2. MD&A—Accounting and Reporting Matters—Non-GAAP and Segment Financial Measures" for further discussion of our definitions of segment site rental gross margin, segment services and other gross margin and segment operating profit (loss).
(b)See reconciliation of this non-GAAP financial measure to net income (loss) and definition included in "Item 2. MD&A—Accounting and Reporting Matters—Non-GAAP and Segment Financial Measures."
Site rental revenues decreased $184 million, or 5%, for the six months ended June 30, 2024 compared to the six months ended June 30, 2023. This decrease was predominately comprised of the factors depicted in the chart below:
(In millions of dollars)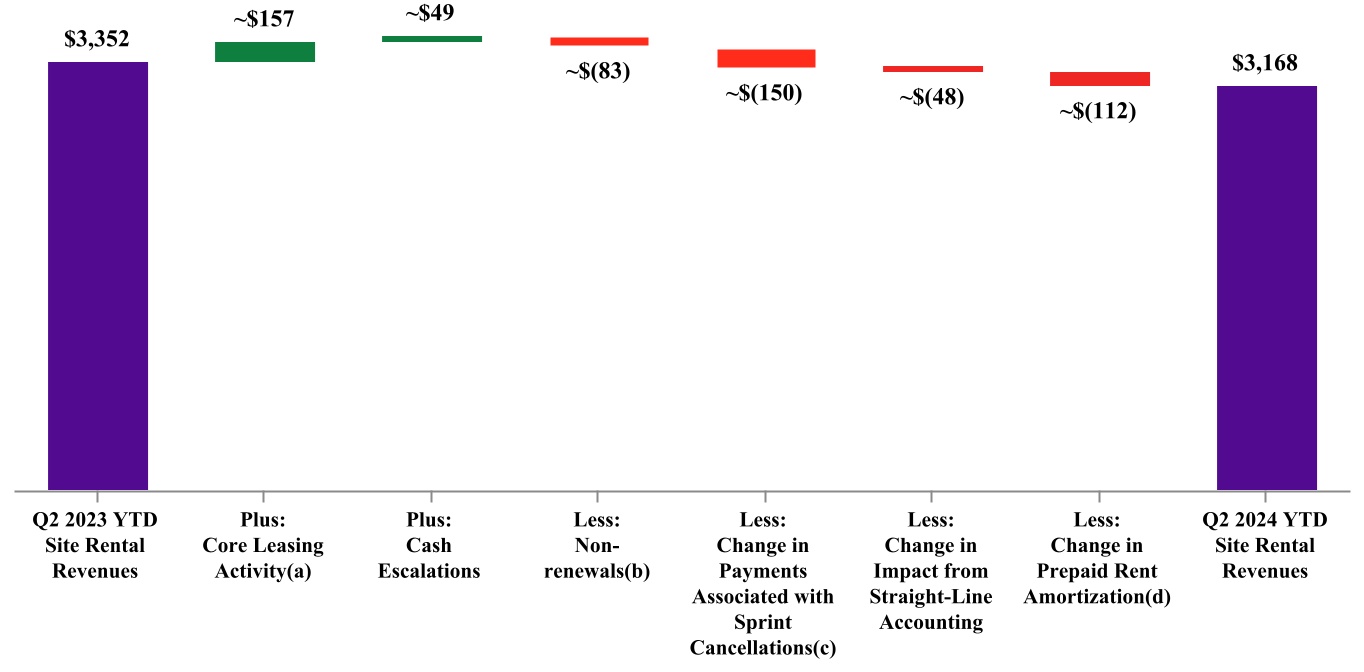
(a)Represents site rental revenues growth from tenant additions across our entire portfolio and renewals or extensions of tenant contracts, exclusive of the impacts from both straight-line accounting and amortization of prepaid rent in accordance with GAAP.
(b)Includes $7 million of non-renewals associated with Sprint Cancellations.
(c)Represents $154 million of payments associated with Sprint Cancellations received in the first six months 2023 and not recurring in 2024, which were partially offset by approximately $4 million of payments associated with Sprint Cancellations received in the first six months of 2024.
(d)Prepaid rent amortization includes amortization of upfront payments received from long-term tenants and other deferred credits. Prepaid rent amortization includes $57 million of accelerated prepaid rent amortization associated with the Sprint Cancellations that was recognized in the first six months of 2023 that did not recur in 2024.
Towers site rental revenues and Towers site rental gross margin for the first six months of 2024 were $2.1 billion and $1.6 billion, respectively, compared to $2.2 billion and $1.7 billion, respectively, in the same period in the prior year. The decrease of $29 million and $35 million in Towers site rental revenue and Towers site rental gross margin, respectively, was primarily due to a decrease in prepaid rent amortization, as new leasing activity and contractual cash escalators were substantially offset by a decline in the associated straight-line accounting adjustment.
Fiber site rental revenues and Fiber site rental gross margin for the first six months of 2024 were $1.0 billion and $676 million, respectively, and decreased by $155 million and $172 million, respectively, from the same period in the prior year. Both Fiber site rental revenues and Fiber site rental gross margin were predominately impacted by a $150 million reduction in site rental revenues and an absence of $57 million of accelerated prepaid rent amortization, both related to the Sprint Cancellations.
Towers services and other gross margin was $38 million for the first six months of 2024 and decreased by $41 million from $79 million during the same period in the prior year, which is a reflection of the lower volume of activity from carriers' network enhancements and the volume and mix of services and other work. Our services and other offerings are of a variable nature as these revenues are not under long-term tenant contracts. See note 12 to our condensed consolidated financial statements for a discussion of the 2023 Restructuring Plan, which included discontinuing installation services as a Towers product offering.
Fiber services and other gross margin was $3 million for the first six months of 2024 and decreased by $10 million from $13 million during the same period in the prior year primarily as a result of the absence of site abandonment fees associated with the Sprint Cancellations that were received during the first six months of 2023.
Selling, general and administrative expenses for the first six months of 2024 were $387 million and decreased by $18 million, or 4%, from $405 million during the same period in the prior year. This decrease was primarily related to a decrease in employee-related cost as a result of our aforementioned restructuring activities, which was partially offset by an increase in legal and consulting fees, mostly stemming from our recent proxy contest.
Towers operating profit (loss) for the first six months of 2024 decreased by $52 million, or 3%, from the same period in the prior year as a result of the previously-mentioned decreases in both Towers site rental gross margin and Towers services and other gross margin.
Fiber operating profit (loss) for the first six months of 2024 decreased by $179 million, or 24%, from the same period in the prior year as a result of the previously-mentioned decrease in both Fiber site rental gross margin and Fiber services and other gross margin.
Depreciation, amortization and accretion was $869 million for the first six months of 2024 and decreased by $7 million, or 1%, from the same period in the prior year. This decrease predominately resulted from certain site rental contracts and tenant relationships intangible assets becoming fully amortized.
Restructuring charges in connection with the Restructuring Plans were $56 million for the first six months of 2024. The charges primarily consisted of $37 million related to cash payments that have been or will be made associated with employee severance and other one-time termination benefits and $8 million of remaining obligations under facility leases payable through 2033. Additionally, non-cash charges of $11 million for accelerated depreciation were also recorded. See note 12 to our condensed consolidated financial statements.
Interest expense and amortization of deferred financing costs, net were $456 million for the first six months of 2024 and increased by $46 million, or 11%, from $410 million during the same period in the prior year. The increase predominately resulted from an increase in the variable interest rate on our 2016 Term Loan A, as well as an increase in our outstanding indebtedness due to the financing of our discretionary capital expenditures. See note 4 to our condensed consolidated financial statements for a further discussion of our debt and "Item 3. Quantitative and Qualitative Disclosures About Market Risk" for a further discussion of our interest rate exposure.
The provision for income taxes was $14 million in both the first six months of 2024 and 2023. For both periods, the effective tax rate differs from the federal statutory rate predominately due to our REIT status, including the dividends paid deduction. See note 6 to our condensed consolidated financial statements and also note 9 to our consolidated financial statements in the 2023 Form 10-K.
Net income (loss) was $562 million for the first six months of 2024 compared to $874 million during the first six months of 2023. The decrease was primarily related to the previously-mentioned decrease in Towers and Fiber operating profits and the previously-mentioned increases in restructuring charges and interest expense, and amortization of deferred financing costs.
Adjusted EBITDA decreased by $250 million, or 11%, from the first six months of 2023 to the first six months of 2024, reflecting the previously-mentioned decreases in Towers and Fiber operating profits.
Liquidity and Capital Resources
Overview
General. Our core business generates revenues under long-term tenant contracts (see "Item 2. MD&A—General Overview—Overview") from (1) the largest U.S. wireless carriers and (2) other towers and fiber solutions tenants. As a leading provider of shared communications infrastructure in the U.S., our strategy is to create long-term stockholder value via a combination of (1) growing cash flows generated from our portfolio of communications infrastructure, (2) returning a meaningful portion of our cash generated by operating activities to our stockholders in the form of dividends, and (3) investing capital efficiently to grow cash flows and long-term dividends per share. Our strategy is based, in part, on our belief that the U.S. is the most attractive market for shared communications infrastructure investment with the greatest long-term growth potential. We measure our efforts to create "long-term stockholder value" by the combined payment of dividends to stockholders and growth in our per share results.
We have engaged, and expect to continue to engage, in discretionary investments that we believe will maximize long-term stockholder value. Our historical discretionary investments include (in no particular order): constructing communications infrastructure, acquiring communications infrastructure, acquiring land interests (which primarily relate to land assets under towers), improving and structurally enhancing our existing communications infrastructure, purchasing shares of our common
stock, and purchasing, repaying, or redeeming our debt. We have recently spent, and expect to continue to spend, a significant percentage of our discretionary investments on the construction of small cells and fiber. See note 12 to our condensed consolidated financial statements and "Item 2. MD&A—Outlook Highlights" for a discussion of the 2024 Restructuring Plan, which contemplates, among others, an increase in return thresholds on new growth opportunities and a reduction in projected Fiber segment capital expenditures for full year 2024. We seek to fund our discretionary investments with both cash generated by operating activities and cash available from financing capacity, such as the use of our availability under our 2016 Revolver, issuances under our CP Program, debt financings and issuances of equity or equity-related securities, including under our 2024 ATM Program.
We seek to maintain a capital structure that we believe drives long-term stockholder value and optimizes our weighted-average cost of capital. We target a leverage ratio of approximately five times Adjusted EBITDA, subject to various factors, such as the availability and cost of capital and the potential long-term return on our discretionary investments. We may choose to increase or decrease our leverage from this target for various periods of time. Our contractual debt maturities over the next 12 months, consist of (1) Commercial Paper Notes, of which we had $1.3 billion outstanding as of July 29, 2024, (2) the 3.200% senior unsecured notes due September 2024 ("3.200% Senior Notes") and (3) principal payments on certain outstanding debt. Amounts available under our CP Program may be repaid and re-issued from time to time and we intend to maintain available commitments under our 2016 Revolver in an amount at least equal to the amount of Commercial Paper Notes outstanding.
We operate as a REIT for U.S. federal income tax purposes. We expect to continue to pay minimal cash income taxes as a result of our REIT status and our NOLs. See note 6 to our condensed consolidated financial statements and also the 2023 Form 10-K.
Liquidity Position. The following is a summary of our capitalization and liquidity position as of June 30, 2024. See "Item 3. Quantitative and Qualitative Disclosures About Market Risk" and note 4 to our condensed consolidated financial statements for additional information regarding our debt as well as note 9 to our condensed consolidated financial statements for additional information regarding our 2024 ATM Program.
| | | | | |
| (In millions of dollars) | |
Cash and cash equivalents and restricted cash and cash equivalents(a) | $ | 331 | |
Undrawn 2016 Revolver availability(b) | 6,960 | |
| Debt and other long-term obligations (current and non-current) | 23,719 | |
| Total equity | 5,652 | |
(a)Inclusive of $5 million included within "Other assets, net" on our condensed consolidated balance sheet.
(b)Availability at any point in time is subject to certain restrictions based on the maintenance of financial covenants contained in our 2016 Credit Facility. See the 2023 Form 10-K. At any point in time, we intend to maintain available commitments under our 2016 Revolver in an amount at least equal to the amount of outstanding Commercial Paper Notes. See note 4 to our condensed consolidated financial statements.
Over the next 12 months:
•Our liquidity sources may include (1) cash on hand, (2) cash generated by our operating activities, (3) availability under our 2016 Revolver, (4) issuances under our CP Program, and (5) issuances of equity pursuant to our 2024 ATM Program. Our liquidity uses over the next 12 months are expected to include (1) debt obligations of $2.3 billion (consisting of Commercial Paper Notes, the 3.200% Senior Notes and principal payments on certain outstanding debt), (2) cumulative common stock dividend payments expected to be at least $6.26 per share, or an aggregate amount of approximately $2.7 billion (see "Item 2. MD&A—Highlights of Business Fundamentals and Results") and (3) capital expenditures. We currently expect to refinance the Tower Revenue Notes, Series 2015-2 on or prior to the anticipated repayment date of May 15, 2025, see "Item 3. Quantitative and Qualitative Disclosures About Market Risk" for further discussion.
•We may also purchase shares of our common stock. Additionally, amounts available under our CP Program may be repaid and re-issued from time to time and we intend to maintain available commitments under our 2016 Revolver in an amount at least equal to the amount of Commercial Paper Notes outstanding. During the next 12 months, while our liquidity uses are expected to exceed our cash generated by operating activities, we expect that our liquidity sources described above should be sufficient to cover our expected uses. Historically, from time to time, we have accessed the capital markets to issue debt and equity.
•See "Item 3. Quantitative and Qualitative Disclosures About Market Risk" for a discussion of interest rate risk and note 4 to our condensed consolidated financial statements for a tabular presentation of our debt maturities and a discussion of anticipated repayment dates.
Summary Cash Flow Information
| | | | | | | | | | | | | | | | | |
| Six Months Ended June 30, |
| (In millions of dollars) | 2024 | | 2023 | | Change |
| Operating activities | $ | 1,367 | | | $ | 1,725 | | | $ | (358) | |
| Investing activities | (650) | | | (806) | | | 156 | |
| Financing activities | (666) | | | (758) | | | 92 | |
Net increase (decrease) in cash and cash equivalents and restricted cash and cash equivalents | $ | 51 | | | $ | 161 | | | $ | (110) | |
Operating Activities
Net cash provided by operating activities of $1.4 billion for the first six months of 2024 decreased by $358 million, or 21%, compared to the first six months of 2023, due primarily to the aforementioned decrease in Towers operating profit, the reduction in Fiber site rental revenues related to the absence of Sprint Cancellation payments, and a net decrease from changes in working capital. Changes in working capital contribute to variability in net cash provided by operating activities, largely due to the timing of advanced payments by us and advanced receipts from tenants. We expect to grow our net cash provided by operating activities in the future (exclusive of changes in working capital) if we realize expected growth in our core business.
Investing Activities
Net cash used for investing activities of $650 million for the first six months of 2024 decreased by $156 million, or 19%, from the first six months of 2023 primarily as a result of a decrease in payments for acquisitions in our Towers segment and a decrease in discretionary capital expenditures in both our Towers and Fiber segments.
Our capital expenditures are categorized as discretionary or sustaining as described below.
•Discretionary capital expenditures are made with respect to activities which we believe exhibit sufficient potential to enhance long-term stockholder value. They primarily consist of expansion or development of communications infrastructure (including capital expenditures related to (1) enhancing communications infrastructure in order to add new tenants for the first time or support subsequent tenant equipment augmentations or (2) modifying the structure of a communications infrastructure asset to accommodate additional tenants) and construction of new communications infrastructure. Discretionary capital expenditures also include purchases of land interests (which primarily relate to land assets under towers as we seek to manage our interests in the land beneath our towers), certain technology-related investments necessary to support and scale future customer demand for our communications infrastructure, and other capital projects. The expansion or development of existing communications infrastructure to accommodate new leasing typically varies based on, among other factors: (1) the type of communications infrastructure, (2) the scope, volume, and mix of work performed on the communications infrastructure, (3) existing capacity prior to installation, or (4) changes in structural engineering regulations and standards. Currently, construction of new communications infrastructure is predominately comprised of the construction of small cells and fiber (including certain construction projects that may take 18 to 36 months to complete). Our decisions regarding discretionary capital expenditures are influenced by the availability and cost of capital and expected returns on alternative uses of cash, such as payments of dividends and investments.
•Sustaining capital expenditures consist of those capital expenditures not otherwise categorized as discretionary capital expenditures, such as (1) maintenance capital expenditures on our communications infrastructure assets that enable our tenants' ongoing quiet enjoyment of the communications infrastructure and (2) ordinary corporate capital expenditures.
A summary of our capital expenditures for the six months ended June 30, 2024 and 2023 is as follows:
| | | | | | | | | | | | | | | | | | | | | | | | | | | | | |
| For the Six Months Ended |
| June 30, 2024 | | June 30, 2023 |
| (In millions of dollars) | Towers | Fiber | Other | Total | | Towers | Fiber | Other | Total |
| Discretionary: | | | | | | | | | |
Communications infrastructure improvements and other capital projects(a) | $ | 35 | | $ | 530 | | $ | 11 | | $ | 576 | | | $ | 67 | | $ | 570 | | $ | 12 | | $ | 649 | |
| Purchases of land interests | 24 | | — | | — | | 24 | | | 38 | | — | | — | | 38 | |
| Sustaining | 5 | | 32 | | 12 | | 49 | | | 6 | | 15 | | 12 | | 33 | |
| Total | $ | 64 | | $ | 562 | | $ | 23 | | $ | 649 | | | $ | 111 | | $ | 585 | | $ | 24 | | $ | 720 | |
(a)Towers segment includes $7 million and $20 million of capital expenditures incurred during the six months ended June 30, 2024 and 2023, respectively, in connection with tenant installations and upgrades on our towers.
Discretionary capital expenditures were primarily impacted by the timing of both Towers and Fiber tenant activity during the first six months of 2024 compared to the same period in 2023. See also "Item 2. MD&A—General Overview—Outlook Highlights" for our expectations surrounding 2024 capital expenditures.
Financing Activities
We seek to allocate cash generated by our operations in a manner that will enhance long-term stockholder value, which may include various financing activities such as (in no particular order): (1) paying dividends on our common stock (currently expected to total at least $6.26 per share over the next 12 months, or an aggregate amount of approximately $2.7 billion, (2) purchasing our common stock or (3) purchasing, repaying, or redeeming our debt. See notes 4 and 9 to our condensed consolidated financial statements.
Net cash used for financing activities of $666 million for the first six months of 2024 increased by $92 million from the first six months of 2023 as a result of the net impact from our issuances and repayments of debt (including with respect to our 2016 Credit Facility and CP Program). See "Item 2. MD&A—General Overview—Highlights of Business Fundamentals and Results" and notes 4 and 9 to our condensed consolidated financial statements for further information.
Credit Facility. The proceeds from our 2016 Revolver may be used for general corporate purposes, which may include the financing of capital expenditures, acquisitions, the repayment or repurchase of any outstanding indebtedness and purchases of our common stock. As of July 29, 2024, there was no outstanding balance and $7.0 billion in undrawn availability under our 2016 Revolver. At any point in time, we intend to maintain available commitments under our 2016 Revolver in an amount at least equal to the amount of outstanding Commercial Paper Notes. See note 4 to our condensed consolidated financial statements for additional information regarding our Credit Facility.
Commercial Paper Program. The proceeds from our Commercial Paper Notes may be used for general corporate purposes, which may include the financing of capital expenditures, acquisitions, the repayment or repurchase of any outstanding indebtedness and purchases of our common stock. As of July 29, 2024, there was $1.3 billion outstanding under our CP Program. See note 4 to our condensed consolidated financial statements for further information regarding our CP Program.
Incurrence, Purchases, and Repayments of Debt. See "Item 7. MD&A—General Overview", "MD&A—Liquidity and Capital Resources—Overview—Liquidity Position" and note 7 of our consolidated financial statements in the 2023 Form 10-K for further discussion of our recent issuances, purchases, redemptions and repayments of debt.
Common Stock Activity. See note 9 to our condensed consolidated financial statements for further information regarding our common stock and dividends.
ATM Program. We previously maintained a 2021 ATM Program through which we had the right to issue and sell shares of our common stock having an aggregate gross sales price of up to $750 million to or through sales agents. In March 2024, we terminated the formerly outstanding 2021 ATM Program.
In March 2024, we established the 2024 ATM Program through which we may issue and sell shares of our common stock having an aggregate gross sales price of up to $750 million. Sales under the 2024 ATM Program may be made by means of ordinary brokers' transactions on the NYSE or otherwise at market prices prevailing at the time of sale, at prices related to prevailing market prices or, subject to our specific instructions, at negotiated prices. We intend to use the net proceeds from any sales under the 2024 ATM Program for general corporate purposes, which may include (1) the funding of future acquisitions or investments or (2) the repayment or repurchase of any outstanding indebtedness. We have not sold any shares of common stock under the 2024 ATM Program.
Debt Covenants. Our 2016 Credit Agreement contains financial maintenance covenants. We are currently in compliance with these financial maintenance covenants and, based upon our current expectations, we believe we will continue to comply with our financial maintenance covenants. In addition, certain of our debt agreements contain restrictive covenants that place restrictions on us and may limit our ability to, among other things, incur additional debt and liens, purchase our securities, make capital expenditures, dispose of assets, undertake transactions with affiliates, make other investments, pay dividends or distribute excess cash flow. See the 2023 Form 10-K for a further discussion of our debt covenants, certain restrictive covenants and factors that are likely to determine our subsidiaries' ability to comply with current and future debt covenants.
Accounting and Reporting Matters
Critical Accounting Policies and Estimates
Our critical accounting policies and estimates are those that we believe (1) are most important to the portrayal of our financial condition and results of operations or (2) require our most difficult, subjective or complex judgments, often as a result of the need to make estimates about the effect of matters that are inherently uncertain. In many cases, the accounting treatment of a particular transaction is specifically prescribed by GAAP. In other cases, management is required to exercise judgment in the application of accounting principles with respect to particular transactions. Accordingly, actual results could differ materially from our estimates. Our critical accounting policies and estimates as of December 31, 2023 are described in "Item 7. MD&A—Accounting and Reporting Matters" and in note 2 of our consolidated financial statements in the 2023 Form 10-K.
Accounting Pronouncements
Recently Adopted Accounting Pronouncements. See note 2 to our condensed consolidated financial statements.
Recent Accounting Pronouncements Not Yet Adopted. See note 2 to our condensed consolidated financial statements.
Non-GAAP and Segment Financial Measures
We use earnings before interest, taxes, depreciation, amortization and accretion, as adjusted ("Adjusted EBITDA"), which is a non-GAAP financial measure, as an indicator of consolidated financial performance. Our measure of Adjusted EBITDA may not be comparable to similarly titled measures of other companies, including companies in the communications infrastructure sector or other REITs, and is not a measure of performance calculated in accordance with GAAP. Adjusted EBITDA should not be considered in isolation or as a substitute for operating income (loss), net income (loss), net cash provided by (used for) operating, investing and financing activities or other income statement or cash flow statement data prepared in accordance with GAAP and should be considered only as a supplement to net income (loss) computed in accordance with GAAP as a measure of our performance. There are material limitations to using a measure such as Adjusted EBITDA, including the difficulty associated with comparing results among more than one company, including our competitors, and the inability to analyze certain significant items, including depreciation and interest expense, that directly affect our net income (loss). Management compensates for these limitations by considering the economic effect of the excluded expense items independently as well as in connection with their analysis of net income (loss).
We define Adjusted EBITDA as net income (loss) plus restructuring charges (credits), asset write-down charges, acquisition and integration costs, depreciation, amortization and accretion, amortization of prepaid lease purchase price adjustments, interest expense and amortization of deferred financing costs, net, (gains) losses on retirement of long-term obligations, net (gain) loss on interest rate swaps, (gains) losses on foreign currency swaps, impairment of available-for-sale securities, interest income, other (income) expense, (benefit) provision for income taxes, net (income) loss from discontinued operations, (gain) loss on sale of discontinued operations, cumulative effect of a change in accounting principle, stock-based
compensation expense, net and net (gain) loss from disposal of discontinued operations, net of tax. The reconciliation of Adjusted EBITDA to our net income (loss) is set forth below:
| | | | | | | | | | | | | | | | | | | | | | | |
| (In millions of dollars; components may not sum to totals due to rounding) | Three Months Ended June 30, | | Six Months Ended June 30, |
| 2024 | | 2023 | | 2024 | | 2023 |
| Net income (loss) | $ | 251 | | | $ | 455 | | | $ | 562 | | | $ | 874 | |
| Adjustments to increase (decrease) net income (loss): | | | | | | | |
| Asset write-down charges | 3 | | | 22 | | | 9 | | | 22 | |
| Acquisition and integration costs | — | | | 1 | | | — | | | 1 | |
Depreciation, amortization and accretion | 430 | | | 445 | | | 869 | | | 876 | |
Restructuring charges | 45 | | | — | | | 56 | | | — | |
Amortization of prepaid lease purchase price adjustments | 4 | | | 4 | | | 8 | | | 8 | |
| Interest expense and amortization of deferred financing costs, net | 230 | | | 208 | | | 456 | | | 410 | |
| | | | | | | |
| Interest income | (4) | | | (5) | | | (8) | | | (7) | |
| Other (income) expense | 1 | | | 2 | | | (1) | | | 4 | |
| (Benefit) provision for income taxes | 7 | | | 7 | | | 14 | | | 14 | |
| Stock-based compensation expense, net | 40 | | | 50 | | | 78 | | | 91 | |
Adjusted EBITDA(a) | $ | 1,006 | | | $ | 1,188 | | | $ | 2,043 | | | $ | 2,292 | |
(a)The above reconciliation excludes the items included in our Adjusted EBITDA definition which are not applicable to the periods shown.
We believe Adjusted EBITDA is useful to investors or other interested parties in evaluating our financial performance because:
•it is the primary measure used by our management (1) to evaluate the economic productivity of our operations and (2) for purposes of making decisions about allocating resources to, and assessing the performance of, our operations;
•although specific definitions may vary, it is widely used by investors or other interested parties in evaluation of the communications infrastructure sector and other REITs to measure financial performance without regard to items such as depreciation, amortization and accretion, which can vary depending upon accounting methods and the book value of assets;
•we believe it helps investors and other interested parties meaningfully evaluate and compare the results of our operations (1) from period to period and (2) to our competitors by removing the impact of our capital structure (primarily interest charges from our outstanding debt) and asset base (primarily depreciation, amortization and accretion) from our financial results; and
•it is similar to the measure of current financial performance generally used in our debt covenant calculations.
Our management uses Adjusted EBITDA:
•as a performance goal in employee annual incentive compensation;
•as a measurement of financial performance because it assists us in comparing our financial performance on a consistent basis as it removes the impact of our capital structure (primarily interest charges from our outstanding debt) and asset base (primarily depreciation, amortization and accretion) from our operating results;
•in presentations to our board of directors to enable it to have the same measurement of financial performance used by management;
•for planning purposes, including preparation of our annual operating budget;
•as a valuation measure in strategic analyses in connection with the purchase and sale of assets;
•in determining self-imposed limits on our debt levels, including the evaluation of our leverage ratio; and
•with respect to compliance with our debt covenants, which require us to maintain certain financial ratios that incorporate concepts such as, or similar to, Adjusted EBITDA.
In addition to the non-GAAP measures used herein and as discussed in note 10 to our condensed consolidated financial statements, we also provide (1) segment site rental gross margin, (2) segment services and other gross margin, and (3) segment operating profit (loss), which are key measures used by management to evaluate the performance of our operating segments. These segment measures are provided pursuant to GAAP requirements related to segment reporting.
We define segment site rental gross margin as segment site rental revenues less segment site rental costs of operations, excluding stock-based compensation expense, net and amortization of prepaid lease purchase price adjustments recorded in consolidated site rental costs of operations. We define segment services and other gross margin as segment services and other revenues less segment services and other costs of operations, excluding stock-based compensation expense, net recorded in consolidated services and other costs of operations. We define segment operating profit (loss) as segment site rental gross margin plus segment services and other gross margin, and segment other operating (income) expense, less segment selling, general and administrative expenses. All of these measurements of profit or loss are exclusive of depreciation, amortization and accretion, which are shown separately. Additionally, certain costs are shared across segments and are reflected in our segment measures through allocations that management believes to be reasonable.
ITEM 3.QUANTITATIVE AND QUALITATIVE DISCLOSURES ABOUT MARKET RISK
The following section updates "Item 7A. Quantitative and Qualitative Disclosures About Market Risk" in the 2023 Form 10-K and should be read in conjunction with that report as well as our condensed consolidated financial statements.
Interest Rate Risk
Our interest rate risk as of June 30, 2024 relates primarily to the impact of interest rate movements on the following:
•our $2.6 billion of floating rate debt as of June 30, 2024, which represented approximately 11% of our total debt as of June 30, 2024; and
•potential future borrowings of incremental debt, including borrowings under our 2016 Credit Facility and issuances under our CP Program.
Since March 2022, the Federal Reserve has repeatedly raised the federal funds rate for a cumulative increase of 5.25%, which adversely impacted the interest rates on our variable rate debt and refinancings of fixed rate debt. Any prolonged period of elevated interest rates or further increases to interest rates could increase our costs of borrowing. See also "Item 1A. Risk Factors" in the 2023 Form 10-K for a discussion of risks stemming from interest rate increases.
We currently have no interest rate swaps.
Sensitivity Analysis.
We manage our exposure to market interest rates on our existing debt by controlling the mix of fixed and floating rate debt. As of June 30, 2024, we had $2.6 billion of floating rate debt. As a result, a hypothetical unfavorable fluctuation in market interest rates on our existing debt of 1/4 of a percent point over a 12-month period would increase our interest expense by approximately $6 million.
Future Principal Payments and Interest Rates.
The following table provides information about our market risk related to changes in interest rates. The future principal payments and weighted-average interest rates are presented as of June 30, 2024. These debt maturities reflect final maturity dates and do not consider the impact of the principal payments that commence following the anticipated repayment dates of certain debt (see footnotes (b) and (d)). The information presented below regarding the variable rate debt is supplementary to our sensitivity analysis regarding the impact of changes in the interest rates. See notes 4 and 5 to our condensed consolidated financial statements and the 2023 Form 10-K for additional information regarding our debt.
| | | | | | | | | | | | | | | | | | | | | | | | | | | | | | | | | | | | | | | | | | | | | | | |
| Future Principal Payments and Interest Rates by the Debt Instruments' Contractual Year of Maturity |
| (In millions of dollars) | 2024 | | 2025 | | 2026 | | 2027 | | 2028 | | Thereafter | | Total | | Fair Value(a) |
| Debt: | | | | | | | | | | | | | | | |
Fixed rate(b) | $ | 774 | | (f) | $ | 545 | | | $ | 2,693 | | | $ | 2,288 | | | $ | 2,632 | | | $ | 12,350 | | | $ | 21,282 | | | $ | 19,242 | |
Average interest rate(b)(c)(d) | 3.2 | % | | 1.6 | % | | 3.0 | % | | 3.5 | % | | 4.5 | % | | 4.3 | % | | 4.0 | % | | |
Variable rate(e) | $ | 1,475 | | (g) | $ | 60 | | | $ | 91 | | | $ | 966 | | | $ | — | | | $ | — | | | $ | 2,592 | | | $ | 2,592 | |
Average interest rate(e) | 5.9 | % | | 5.5 | % | | 4.9 | % | | 4.7 | % | | — | % | | — | % | | 5.4 | % | | |
(a)The fair value of our debt is based on indicative quotes, non-binding quotes from brokers that require judgment to interpret market information, including implied credit spreads for similar borrowings on recent trades or bid/ask offers. These fair values are not necessarily indicative of the amount, which could be realized in a current market exchange.
(b)The impact of principal payments that will commence following the anticipated repayment dates is not considered (see footnote (d) below). The Tower Revenue Notes, Series 2015-2 and Series 2018-2 have principal amounts of $700 million and $750 million, with anticipated repayment dates in 2025 and 2028, respectively.
(c)The average interest rate represents the weighted-average stated coupon rate (see footnote (d) below).
(d)If the Tower Revenue Notes are not repaid in full by the applicable anticipated repayment dates, the applicable interest rate increases by approximately 5% per annum and monthly principal payments commence using the Excess Cash Flow (as defined in the indenture governing the applicable Tower Revenue Notes) of the issuers of the Tower Revenue Notes. The Tower Revenue Notes are presented based on their contractual maturity dates ranging from 2045 to 2048 and include the impact of an assumed 5% increase in interest rate that would occur following the anticipated repayment dates but exclude the impact of monthly principal payments that would commence using Excess Cash Flow of the issuers of the Tower Revenue Notes. The full year 2023 Excess Cash Flow of the issuers of the Tower Revenue Notes was approximately $993 million. We currently expect to refinance these notes on or prior to the respective anticipated repayment dates.
(e)See note 7 to our consolidated financial statements in the 2023 Form 10-K for information regarding potential upward or downward adjustments to the interest rate spread and unused commitment fee percentage on our 2016 Credit Facility if we achieve specified annual sustainability targets or fail to meet
annual sustainability metrics. Each period presented assumes the downward adjustments in the interest rate spread and unused commitment fee percentage on our 2016 Credit Facility.
(f)Predominately consists of $750 million aggregate principal amount of 3.200% Senior Notes which mature in September 2024.
(g)Predominately consists of outstanding indebtedness under our CP Program. Such amounts may be issued, repaid or re-issued from time to time.
ITEM 4.CONTROLS AND PROCEDURES
Disclosure Controls and Procedures
The Company conducted an evaluation, under the supervision and with the participation of the Company's management, including the Company's Chief Executive Officer ("CEO") and Chief Financial Officer ("CFO"), of the effectiveness of the Company's disclosure controls and procedures as of the end of the period covered by this report. Based upon their evaluation, the CEO and CFO concluded that as of June 30, 2024, the Company's disclosure controls and procedures were effective in alerting them in a timely manner to material information relating to the Company required to be included in the Company's periodic reports under the Securities Exchange Act of 1934, as amended.
Changes in Internal Control Over Financial Reporting
There have been no changes in the Company's internal control over financial reporting during the fiscal quarter covered by this Form 10-Q that have materially affected, or are reasonably likely to materially affect, the Company's internal control over financial reporting.
PART II—OTHER INFORMATION
ITEM 1. LEGAL PROCEEDINGS
See the disclosure in note 8 to our condensed consolidated financial statements.
ITEM 1A.RISK FACTORS
There are no material changes to the risk factors discussed in "Item 1A. Risk Factors" in the 2023 Form 10-K.
ITEM 5.OTHER INFORMATION
None.
ITEM 6.EXHIBITS
Exhibit Index | | | | | | | | | | | | | | | | | | | | | | | | | | | | | | | | |
| | | | Incorporated by Reference |
Exhibit
Number | | Exhibit Description | | Form | | File Number | | Date of Filing | | Exhibit Number |
3.1 | | | | 10-Q | | 001-16441 | | August 2, 2023 | | 3.1 |
| 3.2 | | | | 8-K | | 001-16441 | | December 20, 2023 | | 3.1 |
| 31.1* | | | | — | | — | | — | | — |
| 31.2* | | | | — | | — | | — | | — |
| 32.1† | | | | — | | — | | — | | — |
| 101* | | The following financial statements from Crown Castle Inc. Quarterly Report on Form 10-Q for the quarter ended June 30, 2024, formatted in Inline XBRL: (i) Condensed Consolidated Balance Sheet, (ii) Condensed Consolidated Statement of Operations and Comprehensive Income (Loss), (iii) Condensed Consolidated Statement of Cash Flows, (iv) Condensed Consolidated Statement of Equity, and (v) Notes to Condensed Consolidated Financial Statements, tagged as blocks of text and including detailed tags | | — | | — | | — | | — |
| 104* | | The cover page from Crown Castle Inc. Quarterly Report on Form 10-Q for the quarter ended June 30, 2024, formatted in Inline XBRL | | — | | — | | — | | — |
* Filed herewith.
† Furnished herewith.
SIGNATURES
Pursuant to the requirements of the Securities Exchange Act of 1934, the Registrant has duly caused this report to be signed on its behalf by the undersigned thereunto duly authorized.
| | | | | | | | | | | | | | |
| | | CROWN CASTLE INC. |
| | | |
| Date: | July 30, 2024 | | By: | /s/ DANIEL K. SCHLANGER |
| | | | | Daniel K. Schlanger |
| | | | | Executive Vice President and Chief Financial Officer |
| | | | | (Principal Financial Officer) |
| | | | | |
| | | |
| Date: | July 30, 2024 | | By: | /s/ ROBERT S. COLLINS |
| | | | | Robert S. Collins |
| | | | | Vice President and Controller |
| | | | | (Principal Accounting Officer) |
Exhibit 31.1
Certification
For the Quarter Ended June 30, 2024
I, Steven J. Moskowitz, certify that:
1.I have reviewed this report on Form 10-Q of Crown Castle Inc. ("registrant");
2.Based on my knowledge, this report does not contain any untrue statement of a material fact or omit to state a material fact necessary to make the statements made, in light of the circumstances under which such statements were made, not misleading with respect to the period covered by this report;
3.Based on my knowledge, the financial statements, and other financial information included in this report, fairly present in all material respects the financial condition, results of operations and cash flows of the registrant as of, and for, the periods presented in this report;
4.The registrant's other certifying officer and I are responsible for establishing and maintaining disclosure controls and procedures (as defined in Exchange Act Rules 13a-15(e) and 15d-15(e)) and internal control over financial reporting (as defined in Exchange Act Rules 13a-15(f) and 15d-15(f)) for the registrant and have:
a)Designed such disclosure controls and procedures, or caused such disclosure controls and procedures to be designed under our supervision, to ensure that material information relating to the registrant, including its consolidated subsidiaries, is made known to us by others within those entities, particularly during the period in which this report is being prepared;
b)Designed such internal control over financial reporting, or caused such internal control over financial reporting to be designed under our supervision, to provide reasonable assurance regarding the reliability of financial reporting and the preparation of financial statements for external purposes in accordance with generally accepted accounting principles;
c)Evaluated the effectiveness of the registrant's disclosure controls and procedures and presented in this report our conclusions about the effectiveness of the disclosure controls and procedures, as of the end of the period covered by this report based on such evaluation; and
d)Disclosed in this report any change in the registrant's internal control over financial reporting that occurred during the registrant's most recent fiscal quarter (the registrant's fourth fiscal quarter in the case of an annual report) that has materially affected, or is reasonably likely to materially affect, the registrant's internal control over financial reporting; and
5.The registrant's other certifying officer and I have disclosed, based on our most recent evaluation of internal control over financial reporting, to the registrant's auditors and the audit committee of the registrant's board of directors (or persons performing the equivalent functions):
a)All significant deficiencies and material weaknesses in the design or operation of internal control over financial reporting which are reasonably likely to adversely affect the registrant's ability to record, process, summarize and report financial information; and
b)Any fraud, whether or not material, that involves management or other employees who have a significant role in the registrant's internal control over financial reporting.
Date: July 30, 2024
| | | | | | | | |
| /s/ Steven J. Moskowitz | |
| Steven J. Moskowitz President and Chief Executive Officer | |
Exhibit 31.2
Certification
For the Quarter Ended June 30, 2024
I, Daniel K. Schlanger, certify that:
1.I have reviewed this report on Form 10-Q of Crown Castle Inc. ("registrant");
2.Based on my knowledge, this report does not contain any untrue statement of a material fact or omit to state a material fact necessary to make the statements made, in light of the circumstances under which such statements were made, not misleading with respect to the period covered by this report;
3.Based on my knowledge, the financial statements, and other financial information included in this report, fairly present in all material respects the financial condition, results of operations and cash flows of the registrant as of, and for, the periods presented in this report;
4.The registrant's other certifying officer and I are responsible for establishing and maintaining disclosure controls and procedures (as defined in Exchange Act Rules 13a-15(e) and 15d-15(e)) and internal control over financial reporting (as defined in Exchange Act Rules 13a-15(f) and 15d-15(f)) for the registrant and have:
a)Designed such disclosure controls and procedures, or caused such disclosure controls and procedures to be designed under our supervision, to ensure that material information relating to the registrant, including its consolidated subsidiaries, is made known to us by others within those entities, particularly during the period in which this report is being prepared;
b)Designed such internal control over financial reporting, or caused such internal control over financial reporting to be designed under our supervision, to provide reasonable assurance regarding the reliability of financial reporting and the preparation of financial statements for external purposes in accordance with generally accepted accounting principles;
c)Evaluated the effectiveness of the registrant's disclosure controls and procedures and presented in this report our conclusions about the effectiveness of the disclosure controls and procedures, as of the end of the period covered by this report based on such evaluation; and
d)Disclosed in this report any change in the registrant's internal control over financial reporting that occurred during the registrant's most recent fiscal quarter (the registrant's fourth fiscal quarter in the case of an annual report) that has materially affected, or is reasonably likely to materially affect, the registrant's internal control over financial reporting; and
5.The registrant's other certifying officer and I have disclosed, based on our most recent evaluation of internal control over financial reporting, to the registrant's auditors and the audit committee of the registrant's board of directors (or persons performing the equivalent functions):
a)All significant deficiencies and material weaknesses in the design or operation of internal control over financial reporting which are reasonably likely to adversely affect the registrant's ability to record, process, summarize and report financial information; and
b)Any fraud, whether or not material, that involves management or other employees who have a significant role in the registrant's internal control over financial reporting.
Date: July 30, 2024
| | | | | | | | |
| /s/ Daniel K. Schlanger | |
| Daniel K. Schlanger
Executive Vice President and Chief Financial Officer | |
Exhibit 32.1
Certification Pursuant to
18 U.S.C. Section 1350
As Adopted Pursuant to Section 906 of the Sarbanes-Oxley Act of 2002
In connection with the Quarterly Report on Form 10-Q of Crown Castle Inc., a Delaware Corporation ("Company"), for the period ended June 30, 2024 as filed with the Securities and Exchange Commission on the date hereof ("Report"), each of the undersigned officers of the Company hereby certifies pursuant to 18 U.S.C. Section 1350, as adopted pursuant to Section 906 of the Sarbanes-Oxley Act of 2002, that to the best of such officer's knowledge:
1)the Report complies with the requirements of Section 13(a) or 15(d) of the Securities Exchange Act of 1934; and
2)the information contained in the Report fairly presents, in all material respects, the financial condition and results of operations of the Company as of June 30, 2024 (the last date of the period covered by the Report).
| | | | | | | | |
| /s/ Steven J. Moskowitz | |
| Steven J. Moskowitz President and Chief Executive Officer | |
| July 30, 2024 | |
| | |
| /s/ Daniel K. Schlanger | |
| Daniel K. Schlanger
Executive Vice President and Chief Financial Officer | |
| July 30, 2024 | |
v3.24.2
Document and Entity Information - shares
|
6 Months Ended |
|
Jun. 30, 2024 |
Jul. 29, 2024 |
| Entity Information [Line Items] |
|
|
| Document Type |
10-Q
|
|
| Document Quarterly Report |
true
|
|
| Document Period End Date |
Jun. 30, 2024
|
|
| Document Transition Report |
false
|
|
| Entity File Number |
001-16441
|
|
| Entity Registrant Name |
CROWN CASTLE INC.
|
|
| Entity Incorporation, State or Country Code |
DE
|
|
| Entity Tax Identification Number |
76-0470458
|
|
| Entity Address, Address Line One |
8020 Katy Freeway
|
|
| Entity Address, City or Town |
Houston
|
|
| Entity Address, State or Province |
TX
|
|
| Entity Address, Postal Zip Code |
77024
|
|
| City Area Code |
713
|
|
| Local Phone Number |
570-3000
|
|
| Title of 12(b) Security |
Common Stock, $0.01 par value
|
|
| Trading Symbol |
CCI
|
|
| Security Exchange Name |
NYSE
|
|
| Entity Current Reporting Status |
Yes
|
|
| Entity Interactive Data Current |
Yes
|
|
| Entity Filer Category |
Large Accelerated Filer
|
|
| Entity Small Business |
false
|
|
| Entity Emerging Growth Company |
false
|
|
| Entity Shell Company |
false
|
|
| Entity Common Stock, Shares Outstanding |
|
434,567,298
|
| Entity Central Index Key |
0001051470
|
|
| Current Fiscal Year End Date |
--12-31
|
|
| Document Fiscal Year Focus |
2024
|
|
| Document Fiscal Period Focus |
Q2
|
|
| Amendment Flag |
false
|
|
| X |
- DefinitionBoolean flag that is true when the XBRL content amends previously-filed or accepted submission.
| Name: |
dei_AmendmentFlag |
| Namespace Prefix: |
dei_ |
| Data Type: |
xbrli:booleanItemType |
| Balance Type: |
na |
| Period Type: |
duration |
|
| X |
- DefinitionEnd date of current fiscal year in the format --MM-DD.
| Name: |
dei_CurrentFiscalYearEndDate |
| Namespace Prefix: |
dei_ |
| Data Type: |
xbrli:gMonthDayItemType |
| Balance Type: |
na |
| Period Type: |
duration |
|
| X |
- DefinitionFiscal period values are FY, Q1, Q2, and Q3. 1st, 2nd and 3rd quarter 10-Q or 10-QT statements have value Q1, Q2, and Q3 respectively, with 10-K, 10-KT or other fiscal year statements having FY.
| Name: |
dei_DocumentFiscalPeriodFocus |
| Namespace Prefix: |
dei_ |
| Data Type: |
dei:fiscalPeriodItemType |
| Balance Type: |
na |
| Period Type: |
duration |
|
| X |
- DefinitionThis is focus fiscal year of the document report in YYYY format. For a 2006 annual report, which may also provide financial information from prior periods, fiscal 2006 should be given as the fiscal year focus. Example: 2006.
| Name: |
dei_DocumentFiscalYearFocus |
| Namespace Prefix: |
dei_ |
| Data Type: |
xbrli:gYearItemType |
| Balance Type: |
na |
| Period Type: |
duration |
|
| X |
- DefinitionFor the EDGAR submission types of Form 8-K: the date of the report, the date of the earliest event reported; for the EDGAR submission types of Form N-1A: the filing date; for all other submission types: the end of the reporting or transition period. The format of the date is YYYY-MM-DD.
| Name: |
dei_DocumentPeriodEndDate |
| Namespace Prefix: |
dei_ |
| Data Type: |
xbrli:dateItemType |
| Balance Type: |
na |
| Period Type: |
duration |
|
| X |
- DefinitionBoolean flag that is true only for a form used as an quarterly report. Reference 1: http://www.xbrl.org/2003/role/presentationRef
-Publisher SEC
-Name Form 10-Q
-Number 240
-Section 308
-Subsection a
| Name: |
dei_DocumentQuarterlyReport |
| Namespace Prefix: |
dei_ |
| Data Type: |
xbrli:booleanItemType |
| Balance Type: |
na |
| Period Type: |
duration |
|
| X |
- DefinitionBoolean flag that is true only for a form used as a transition report. Reference 1: http://www.xbrl.org/2003/role/presentationRef
-Publisher SEC
-Name Forms 10-K, 10-Q, 20-F
-Number 240
-Section 13
-Subsection a-1
| Name: |
dei_DocumentTransitionReport |
| Namespace Prefix: |
dei_ |
| Data Type: |
xbrli:booleanItemType |
| Balance Type: |
na |
| Period Type: |
duration |
|
| X |
- DefinitionThe type of document being provided (such as 10-K, 10-Q, 485BPOS, etc). The document type is limited to the same value as the supporting SEC submission type, or the word 'Other'.
| Name: |
dei_DocumentType |
| Namespace Prefix: |
dei_ |
| Data Type: |
dei:submissionTypeItemType |
| Balance Type: |
na |
| Period Type: |
duration |
|
| X |
- DefinitionAddress Line 1 such as Attn, Building Name, Street Name
| Name: |
dei_EntityAddressAddressLine1 |
| Namespace Prefix: |
dei_ |
| Data Type: |
xbrli:normalizedStringItemType |
| Balance Type: |
na |
| Period Type: |
duration |
|
| X |
- Definition
+ References
+ Details
| Name: |
dei_EntityAddressCityOrTown |
| Namespace Prefix: |
dei_ |
| Data Type: |
xbrli:normalizedStringItemType |
| Balance Type: |
na |
| Period Type: |
duration |
|
| X |
- DefinitionCode for the postal or zip code
| Name: |
dei_EntityAddressPostalZipCode |
| Namespace Prefix: |
dei_ |
| Data Type: |
xbrli:normalizedStringItemType |
| Balance Type: |
na |
| Period Type: |
duration |
|
| X |
- DefinitionName of the state or province.
| Name: |
dei_EntityAddressStateOrProvince |
| Namespace Prefix: |
dei_ |
| Data Type: |
dei:stateOrProvinceItemType |
| Balance Type: |
na |
| Period Type: |
duration |
|
| X |
- DefinitionA unique 10-digit SEC-issued value to identify entities that have filed disclosures with the SEC. It is commonly abbreviated as CIK. Reference 1: http://www.xbrl.org/2003/role/presentationRef
-Publisher SEC
-Name Exchange Act
-Number 240
-Section 12
-Subsection b-2
| Name: |
dei_EntityCentralIndexKey |
| Namespace Prefix: |
dei_ |
| Data Type: |
dei:centralIndexKeyItemType |
| Balance Type: |
na |
| Period Type: |
duration |
|
| X |
- DefinitionIndicate number of shares or other units outstanding of each of registrant's classes of capital or common stock or other ownership interests, if and as stated on cover of related periodic report. Where multiple classes or units exist define each class/interest by adding class of stock items such as Common Class A [Member], Common Class B [Member] or Partnership Interest [Member] onto the Instrument [Domain] of the Entity Listings, Instrument.
| Name: |
dei_EntityCommonStockSharesOutstanding |
| Namespace Prefix: |
dei_ |
| Data Type: |
xbrli:sharesItemType |
| Balance Type: |
na |
| Period Type: |
instant |
|
| X |
- DefinitionIndicate 'Yes' or 'No' whether registrants (1) have filed all reports required to be filed by Section 13 or 15(d) of the Securities Exchange Act of 1934 during the preceding 12 months (or for such shorter period that registrants were required to file such reports), and (2) have been subject to such filing requirements for the past 90 days. This information should be based on the registrant's current or most recent filing containing the related disclosure.
| Name: |
dei_EntityCurrentReportingStatus |
| Namespace Prefix: |
dei_ |
| Data Type: |
dei:yesNoItemType |
| Balance Type: |
na |
| Period Type: |
duration |
|
| X |
- DefinitionIndicate if registrant meets the emerging growth company criteria. Reference 1: http://www.xbrl.org/2003/role/presentationRef
-Publisher SEC
-Name Exchange Act
-Number 240
-Section 12
-Subsection b-2
| Name: |
dei_EntityEmergingGrowthCompany |
| Namespace Prefix: |
dei_ |
| Data Type: |
xbrli:booleanItemType |
| Balance Type: |
na |
| Period Type: |
duration |
|
| X |
- DefinitionCommission file number. The field allows up to 17 characters. The prefix may contain 1-3 digits, the sequence number may contain 1-8 digits, the optional suffix may contain 1-4 characters, and the fields are separated with a hyphen.
| Name: |
dei_EntityFileNumber |
| Namespace Prefix: |
dei_ |
| Data Type: |
dei:fileNumberItemType |
| Balance Type: |
na |
| Period Type: |
duration |
|
| X |
- DefinitionIndicate whether the registrant is one of the following: Large Accelerated Filer, Accelerated Filer, Non-accelerated Filer. Definitions of these categories are stated in Rule 12b-2 of the Exchange Act. This information should be based on the registrant's current or most recent filing containing the related disclosure. Reference 1: http://www.xbrl.org/2003/role/presentationRef
-Publisher SEC
-Name Exchange Act
-Number 240
-Section 12
-Subsection b-2
| Name: |
dei_EntityFilerCategory |
| Namespace Prefix: |
dei_ |
| Data Type: |
dei:filerCategoryItemType |
| Balance Type: |
na |
| Period Type: |
duration |
|
| X |
- DefinitionTwo-character EDGAR code representing the state or country of incorporation.
| Name: |
dei_EntityIncorporationStateCountryCode |
| Namespace Prefix: |
dei_ |
| Data Type: |
dei:edgarStateCountryItemType |
| Balance Type: |
na |
| Period Type: |
duration |
|
| X |
- DefinitionBoolean flag that is true when the registrant has submitted electronically every Interactive Data File required to be submitted pursuant to Rule 405 of Regulation S-T during the preceding 12 months (or for such shorter period that the registrant was required to submit such files). Reference 1: http://www.xbrl.org/2003/role/presentationRef
-Publisher SEC
-Name Regulation S-T
-Number 232
-Section 405
| Name: |
dei_EntityInteractiveDataCurrent |
| Namespace Prefix: |
dei_ |
| Data Type: |
dei:yesNoItemType |
| Balance Type: |
na |
| Period Type: |
duration |
|
| X |
- DefinitionThe exact name of the entity filing the report as specified in its charter, which is required by forms filed with the SEC. Reference 1: http://www.xbrl.org/2003/role/presentationRef
-Publisher SEC
-Name Exchange Act
-Number 240
-Section 12
-Subsection b-2
| Name: |
dei_EntityRegistrantName |
| Namespace Prefix: |
dei_ |
| Data Type: |
xbrli:normalizedStringItemType |
| Balance Type: |
na |
| Period Type: |
duration |
|
| X |
- DefinitionBoolean flag that is true when the registrant is a shell company as defined in Rule 12b-2 of the Exchange Act. Reference 1: http://www.xbrl.org/2003/role/presentationRef
-Publisher SEC
-Name Exchange Act
-Number 240
-Section 12
-Subsection b-2
| Name: |
dei_EntityShellCompany |
| Namespace Prefix: |
dei_ |
| Data Type: |
xbrli:booleanItemType |
| Balance Type: |
na |
| Period Type: |
duration |
|
| X |
- DefinitionIndicates that the company is a Smaller Reporting Company (SRC). Reference 1: http://www.xbrl.org/2003/role/presentationRef
-Publisher SEC
-Name Exchange Act
-Number 240
-Section 12
-Subsection b-2
| Name: |
dei_EntitySmallBusiness |
| Namespace Prefix: |
dei_ |
| Data Type: |
xbrli:booleanItemType |
| Balance Type: |
na |
| Period Type: |
duration |
|
| X |
- DefinitionThe Tax Identification Number (TIN), also known as an Employer Identification Number (EIN), is a unique 9-digit value assigned by the IRS. Reference 1: http://www.xbrl.org/2003/role/presentationRef
-Publisher SEC
-Name Exchange Act
-Number 240
-Section 12
-Subsection b-2
| Name: |
dei_EntityTaxIdentificationNumber |
| Namespace Prefix: |
dei_ |
| Data Type: |
dei:employerIdItemType |
| Balance Type: |
na |
| Period Type: |
duration |
|
| X |
- DefinitionLocal phone number for entity.
| Name: |
dei_LocalPhoneNumber |
| Namespace Prefix: |
dei_ |
| Data Type: |
xbrli:normalizedStringItemType |
| Balance Type: |
na |
| Period Type: |
duration |
|
| X |
- DefinitionTitle of a 12(b) registered security. Reference 1: http://www.xbrl.org/2003/role/presentationRef
-Publisher SEC
-Name Exchange Act
-Number 240
-Section 12
-Subsection b
| Name: |
dei_Security12bTitle |
| Namespace Prefix: |
dei_ |
| Data Type: |
dei:securityTitleItemType |
| Balance Type: |
na |
| Period Type: |
duration |
|
| X |
- DefinitionName of the Exchange on which a security is registered. Reference 1: http://www.xbrl.org/2003/role/presentationRef
-Publisher SEC
-Name Exchange Act
-Number 240
-Section 12
-Subsection d1-1
| Name: |
dei_SecurityExchangeName |
| Namespace Prefix: |
dei_ |
| Data Type: |
dei:edgarExchangeCodeItemType |
| Balance Type: |
na |
| Period Type: |
duration |
|
| X |
- DefinitionTrading symbol of an instrument as listed on an exchange.
| Name: |
dei_TradingSymbol |
| Namespace Prefix: |
dei_ |
| Data Type: |
dei:tradingSymbolItemType |
| Balance Type: |
na |
| Period Type: |
duration |
|
v3.24.2
Condensed Consolidated Balance Sheet - USD ($)
$ in Millions |
Jun. 30, 2024 |
Dec. 31, 2023 |
| Assets, Current [Abstract] |
|
|
| Cash and cash equivalents |
$ 155
|
$ 105
|
| Restricted cash and cash equivalents, current |
171
|
171
|
| Receivables, net |
420
|
481
|
| Prepaid expenses |
155
|
103
|
| Deferred site rental receivables |
129
|
116
|
| Other current assets |
51
|
56
|
| Assets, Current, Total |
1,081
|
1,032
|
| Deferred site rental receivables |
2,341
|
2,239
|
| Property and equipment, net of accumulated depreciation of $14,919 and $14,279, respectively |
15,698
|
15,666
|
| Operating lease right-of-use assets |
5,930
|
6,187
|
| Goodwill |
10,085
|
10,085
|
| Other Intangible Assets, Net |
2,974
|
3,179
|
| Other assets, net |
137
|
139
|
| Assets, Total |
38,246
|
38,527
|
| Liabilities, Current [Abstract] |
|
|
| Accounts payable |
225
|
252
|
| Accrued interest |
228
|
219
|
| Deferred revenues |
509
|
605
|
| Other accrued liabilities |
359
|
342
|
| Current maturities of debt and other obligations |
865
|
835
|
| Current portion of operating lease liabilities |
308
|
332
|
| Liabilities, Current, Total |
2,494
|
2,585
|
| Debt and other long-term obligations |
22,854
|
22,086
|
| Operating lease liabilities |
5,354
|
5,561
|
| Other long-term liabilities |
1,892
|
1,914
|
| Liabilities, Total |
$ 32,594
|
$ 32,146
|
| Common stock, par value |
$ 0.01
|
$ 0.01
|
| Stockholders' Equity Attributable to Parent [Abstract] |
|
|
| Common Stock, Value, Issued |
$ 4
|
$ 4
|
| Additional Paid in Capital |
18,347
|
18,270
|
| Accumulated Other Comprehensive Income (Loss), Net of Tax |
(5)
|
(4)
|
| Retained Earnings (Accumulated Deficit) |
(12,694)
|
(11,889)
|
| Stockholders' Equity, Including Portion Attributable to Noncontrolling Interest, Total |
5,652
|
6,381
|
| Liabilities and Equity, Total |
$ 38,246
|
$ 38,527
|
| X |
- DefinitionCarrying value as of the balance sheet date of liabilities incurred (and for which invoices have typically been received) and payable to vendors for goods and services received that are used in an entity's business. Used to reflect the current portion of the liabilities (due within one year or within the normal operating cycle if longer). Reference 1: http://fasb.org/us-gaap/role/ref/legacyRef
-Topic 210
-SubTopic 10
-Name Accounting Standards Codification
-Section S99
-Paragraph 1
-Subparagraph (SX 210.5-02(19)(a))
-Publisher FASB
-URI https://asc.fasb.org/1943274/2147480566/210-10-S99-1
Reference 2: http://www.xbrl.org/2003/role/exampleRef
-Topic 852
-SubTopic 10
-Name Accounting Standards Codification
-Section 55
-Paragraph 10
-Publisher FASB
-URI https://asc.fasb.org/1943274/2147481372/852-10-55-10
| Name: |
us-gaap_AccountsPayableCurrent |
| Namespace Prefix: |
us-gaap_ |
| Data Type: |
xbrli:monetaryItemType |
| Balance Type: |
credit |
| Period Type: |
instant |
|
| X |
- DefinitionAmount, after allowance for credit loss, of right to consideration from customer for product sold and service rendered in normal course of business, classified as current. Reference 1: http://www.xbrl.org/2009/role/commonPracticeRef
-Topic 310
-SubTopic 10
-Name Accounting Standards Codification
-Section 45
-Paragraph 2
-Publisher FASB
-URI https://asc.fasb.org/1943274/2147481990/310-10-45-2
| Name: |
us-gaap_AccountsReceivableNetCurrent |
| Namespace Prefix: |
us-gaap_ |
| Data Type: |
xbrli:monetaryItemType |
| Balance Type: |
debit |
| Period Type: |
instant |
|
| X |
- DefinitionAmount, after tax, of accumulated increase (decrease) in equity from transaction and other event and circumstance from nonowner source. Reference 1: http://fasb.org/us-gaap/role/ref/legacyRef
-Name Accounting Standards Codification
-Topic 220
-SubTopic 10
-Section 45
-Paragraph 14A
-Publisher FASB
-URI https://asc.fasb.org/1943274/2147482790/220-10-45-14A
Reference 2: http://fasb.org/us-gaap/role/ref/legacyRef
-Topic 220
-SubTopic 10
-Name Accounting Standards Codification
-Section 45
-Paragraph 11
-Publisher FASB
-URI https://asc.fasb.org/1943274/2147482790/220-10-45-11
Reference 3: http://www.xbrl.org/2003/role/disclosureRef
-Topic 944
-SubTopic 40
-Name Accounting Standards Codification
-Section 65
-Paragraph 2
-Subparagraph (g)(2)(ii)
-Publisher FASB
-URI https://asc.fasb.org/1943274/2147480016/944-40-65-2
Reference 4: http://www.xbrl.org/2003/role/disclosureRef
-Topic 944
-SubTopic 40
-Name Accounting Standards Codification
-Section 65
-Paragraph 2
-Subparagraph (h)(2)
-Publisher FASB
-URI https://asc.fasb.org/1943274/2147480016/944-40-65-2
Reference 5: http://www.xbrl.org/2003/role/disclosureRef
-Topic 210
-SubTopic 10
-Name Accounting Standards Codification
-Section S99
-Paragraph 1
-Subparagraph (SX 210.5-02(30)(a)(4))
-Publisher FASB
-URI https://asc.fasb.org/1943274/2147480566/210-10-S99-1
Reference 6: http://www.xbrl.org/2003/role/disclosureRef
-Topic 944
-SubTopic 210
-Name Accounting Standards Codification
-Section S99
-Paragraph 1
-Subparagraph (SX 210.7-03(a)(23)(a)(3))
-Publisher FASB
-URI https://asc.fasb.org/1943274/2147478777/944-210-S99-1
Reference 7: http://fasb.org/us-gaap/role/ref/legacyRef
-Name Accounting Standards Codification
-Topic 220
-SubTopic 10
-Section 45
-Paragraph 14
-Publisher FASB
-URI https://asc.fasb.org/1943274/2147482790/220-10-45-14
| Name: |
us-gaap_AccumulatedOtherComprehensiveIncomeLossNetOfTax |
| Namespace Prefix: |
us-gaap_ |
| Data Type: |
xbrli:monetaryItemType |
| Balance Type: |
credit |
| Period Type: |
instant |
|
| X |
- DefinitionAmount of excess of issue price over par or stated value of stock and from other transaction involving stock or stockholder. Includes, but is not limited to, additional paid-in capital (APIC) for common and preferred stock. Reference 1: http://www.xbrl.org/2003/role/exampleRef
-Topic 852
-SubTopic 10
-Name Accounting Standards Codification
-Section 55
-Paragraph 10
-Publisher FASB
-URI https://asc.fasb.org/1943274/2147481372/852-10-55-10
Reference 2: http://www.xbrl.org/2009/role/commonPracticeRef
-Topic 946
-SubTopic 210
-Name Accounting Standards Codification
-Section S99
-Paragraph 1
-Subparagraph (SX 210.6-04(18))
-Publisher FASB
-URI https://asc.fasb.org/1943274/2147479170/946-210-S99-1
Reference 3: http://fasb.org/us-gaap/role/ref/legacyRef
-Topic 210
-SubTopic 10
-Name Accounting Standards Codification
-Section S99
-Paragraph 1
-Subparagraph (SX 210.5-02(30)(a)(1))
-Publisher FASB
-URI https://asc.fasb.org/1943274/2147480566/210-10-S99-1
| Name: |
us-gaap_AdditionalPaidInCapital |
| Namespace Prefix: |
us-gaap_ |
| Data Type: |
xbrli:monetaryItemType |
| Balance Type: |
credit |
| Period Type: |
instant |
|
| X |
- DefinitionAmount of asset recognized for present right to economic benefit. Reference 1: http://www.xbrl.org/2003/role/exampleRef
-Topic 280
-SubTopic 10
-Name Accounting Standards Codification
-Section 55
-Paragraph 48
-Publisher FASB
-URI https://asc.fasb.org/1943274/2147482785/280-10-55-48
Reference 2: http://www.xbrl.org/2003/role/exampleRef
-Topic 280
-SubTopic 10
-Name Accounting Standards Codification
-Section 55
-Paragraph 49
-Publisher FASB
-URI https://asc.fasb.org/1943274/2147482785/280-10-55-49
Reference 3: http://www.xbrl.org/2003/role/disclosureRef
-Topic 270
-SubTopic 10
-Name Accounting Standards Codification
-Section 50
-Paragraph 1
-Subparagraph (i)
-Publisher FASB
-URI https://asc.fasb.org/1943274/2147482964/270-10-50-1
Reference 4: http://www.xbrl.org/2003/role/disclosureRef
-Topic 280
-SubTopic 10
-Name Accounting Standards Codification
-Section 50
-Paragraph 32
-Subparagraph (ee)
-Publisher FASB
-URI https://asc.fasb.org/1943274/2147482810/280-10-50-32
Reference 5: http://fasb.org/us-gaap/role/ref/otherTransitionRef
-Topic 280
-SubTopic 10
-Name Accounting Standards Codification
-Section 50
-Paragraph 32
-Subparagraph (d)
-Publisher FASB
-URI https://asc.fasb.org/1943274/2147482810/280-10-50-32
Reference 6: http://www.xbrl.org/2003/role/disclosureRef
-Topic 280
-SubTopic 10
-Name Accounting Standards Codification
-Section 50
-Paragraph 22
-Publisher FASB
-URI https://asc.fasb.org/1943274/2147482810/280-10-50-22
Reference 7: http://www.xbrl.org/2003/role/disclosureRef
-Topic 810
-SubTopic 10
-Name Accounting Standards Codification
-Section 50
-Paragraph 3
-Subparagraph (bb)
-Publisher FASB
-URI https://asc.fasb.org/1943274/2147481203/810-10-50-3
Reference 8: http://www.xbrl.org/2003/role/disclosureRef
-Topic 810
-SubTopic 10
-Name Accounting Standards Codification
-Section 45
-Paragraph 25
-Subparagraph (a)
-Publisher FASB
-URI https://asc.fasb.org/1943274/2147481231/810-10-45-25
Reference 9: http://www.xbrl.org/2003/role/disclosureRef
-Topic 235
-SubTopic 10
-Name Accounting Standards Codification
-Section S99
-Paragraph 1
-Subparagraph (SX 210.4-08(g)(1)(ii))
-Publisher FASB
-URI https://asc.fasb.org/1943274/2147480678/235-10-S99-1
Reference 10: http://www.xbrl.org/2003/role/disclosureRef
-Topic 323
-SubTopic 10
-Name Accounting Standards Codification
-Section 50
-Paragraph 3
-Subparagraph (c)
-Publisher FASB
-URI https://asc.fasb.org/1943274/2147481687/323-10-50-3
Reference 11: http://www.xbrl.org/2003/role/disclosureRef
-Topic 825
-SubTopic 10
-Name Accounting Standards Codification
-Section 50
-Paragraph 28
-Subparagraph (f)
-Publisher FASB
-URI https://asc.fasb.org/1943274/2147482907/825-10-50-28
Reference 12: http://www.xbrl.org/2003/role/exampleRef
-Topic 852
-SubTopic 10
-Name Accounting Standards Codification
-Section 55
-Paragraph 10
-Publisher FASB
-URI https://asc.fasb.org/1943274/2147481372/852-10-55-10
Reference 13: http://www.xbrl.org/2003/role/exampleRef
-Topic 946
-SubTopic 830
-Name Accounting Standards Codification
-Section 55
-Paragraph 12
-Publisher FASB
-URI https://asc.fasb.org/1943274/2147479168/946-830-55-12
Reference 14: http://www.xbrl.org/2003/role/disclosureRef
-Topic 944
-SubTopic 210
-Name Accounting Standards Codification
-Section S99
-Paragraph 1
-Subparagraph (SX 210.7-03(a)(12))
-Publisher FASB
-URI https://asc.fasb.org/1943274/2147478777/944-210-S99-1
Reference 15: http://www.xbrl.org/2003/role/disclosureRef
-Topic 946
-SubTopic 210
-Name Accounting Standards Codification
-Section S99
-Paragraph 1
-Subparagraph (SX 210.6-04(8))
-Publisher FASB
-URI https://asc.fasb.org/1943274/2147479170/946-210-S99-1
Reference 16: http://www.xbrl.org/2003/role/disclosureRef
-Topic 210
-SubTopic 10
-Name Accounting Standards Codification
-Section S99
-Paragraph 1
-Subparagraph (SX 210.5-02(18))
-Publisher FASB
-URI https://asc.fasb.org/1943274/2147480566/210-10-S99-1
Reference 17: http://www.xbrl.org/2003/role/disclosureRef
-Topic 470
-SubTopic 10
-Name Accounting Standards Codification
-Section S99
-Paragraph 1A
-Subparagraph (SX 210.13-01(a)(4)(i))
-Publisher FASB
-URI https://asc.fasb.org/1943274/2147480097/470-10-S99-1A
Reference 18: http://www.xbrl.org/2009/role/commonPracticeRef
-Topic 470
-SubTopic 10
-Name Accounting Standards Codification
-Section S99
-Paragraph 1A
-Subparagraph (SX 210.13-01(a)(4)(ii))
-Publisher FASB
-URI https://asc.fasb.org/1943274/2147480097/470-10-S99-1A
Reference 19: http://www.xbrl.org/2009/role/commonPracticeRef
-Topic 470
-SubTopic 10
-Name Accounting Standards Codification
-Section S99
-Paragraph 1A
-Subparagraph (SX 210.13-01(a)(4)(iii))
-Publisher FASB
-URI https://asc.fasb.org/1943274/2147480097/470-10-S99-1A
Reference 20: http://www.xbrl.org/2003/role/disclosureRef
-Topic 470
-SubTopic 10
-Name Accounting Standards Codification
-Section S99
-Paragraph 1A
-Subparagraph (SX 210.13-01(a)(4)(iii)(A))
-Publisher FASB
-URI https://asc.fasb.org/1943274/2147480097/470-10-S99-1A
Reference 21: http://www.xbrl.org/2003/role/disclosureRef
-Topic 470
-SubTopic 10
-Name Accounting Standards Codification
-Section S99
-Paragraph 1A
-Subparagraph (SX 210.13-01(a)(4)(iv))
-Publisher FASB
-URI https://asc.fasb.org/1943274/2147480097/470-10-S99-1A
Reference 22: http://www.xbrl.org/2003/role/disclosureRef
-Topic 470
-SubTopic 10
-Name Accounting Standards Codification
-Section S99
-Paragraph 1A
-Subparagraph (SX 210.13-01(a)(5))
-Publisher FASB
-URI https://asc.fasb.org/1943274/2147480097/470-10-S99-1A
Reference 23: http://www.xbrl.org/2003/role/disclosureRef
-Topic 470
-SubTopic 10
-Name Accounting Standards Codification
-Section S99
-Paragraph 1B
-Subparagraph (SX 210.13-02(a)(4)(i))
-Publisher FASB
-URI https://asc.fasb.org/1943274/2147480097/470-10-S99-1B
Reference 24: http://www.xbrl.org/2003/role/disclosureRef
-Topic 470
-SubTopic 10
-Name Accounting Standards Codification
-Section S99
-Paragraph 1B
-Subparagraph (SX 210.13-02(a)(4)(iii)(A))
-Publisher FASB
-URI https://asc.fasb.org/1943274/2147480097/470-10-S99-1B
Reference 25: http://www.xbrl.org/2003/role/disclosureRef
-Topic 470
-SubTopic 10
-Name Accounting Standards Codification
-Section S99
-Paragraph 1B
-Subparagraph (SX 210.13-02(a)(4)(iii)(B))
-Publisher FASB
-URI https://asc.fasb.org/1943274/2147480097/470-10-S99-1B
Reference 26: http://www.xbrl.org/2003/role/disclosureRef
-Topic 470
-SubTopic 10
-Name Accounting Standards Codification
-Section S99
-Paragraph 1B
-Subparagraph (SX 210.13-02(a)(4)(iv))
-Publisher FASB
-URI https://asc.fasb.org/1943274/2147480097/470-10-S99-1B
Reference 27: http://www.xbrl.org/2003/role/disclosureRef
-Topic 470
-SubTopic 10
-Name Accounting Standards Codification
-Section S99
-Paragraph 1B
-Subparagraph (SX 210.13-02(a)(5))
-Publisher FASB
-URI https://asc.fasb.org/1943274/2147480097/470-10-S99-1B
Reference 28: http://www.xbrl.org/2009/role/commonPracticeRef
-Topic 852
-SubTopic 10
-Name Accounting Standards Codification
-Section 50
-Paragraph 7
-Subparagraph (a)
-Publisher FASB
-URI https://asc.fasb.org/1943274/2147481404/852-10-50-7
Reference 29: http://www.xbrl.org/2003/role/disclosureRef
-Topic 280
-SubTopic 10
-Name Accounting Standards Codification
-Section 50
-Paragraph 30
-Subparagraph (c)
-Publisher FASB
-URI https://asc.fasb.org/1943274/2147482810/280-10-50-30
Reference 30: http://fasb.org/us-gaap/role/ref/legacyRef
-Topic 942
-SubTopic 210
-Name Accounting Standards Codification
-Section S99
-Paragraph 1
-Subparagraph (SX 210.9-03(11))
-Publisher FASB
-URI https://asc.fasb.org/1943274/2147478546/942-210-S99-1
| Name: |
us-gaap_Assets |
| Namespace Prefix: |
us-gaap_ |
| Data Type: |
xbrli:monetaryItemType |
| Balance Type: |
debit |
| Period Type: |
instant |
|
| X |
- DefinitionAmount of asset recognized for present right to economic benefit, classified as current. Reference 1: http://www.xbrl.org/2003/role/disclosureRef
-Topic 810
-SubTopic 10
-Name Accounting Standards Codification
-Section 50
-Paragraph 3
-Subparagraph (bb)
-Publisher FASB
-URI https://asc.fasb.org/1943274/2147481203/810-10-50-3
Reference 2: http://www.xbrl.org/2003/role/disclosureRef
-Topic 810
-SubTopic 10
-Name Accounting Standards Codification
-Section 45
-Paragraph 25
-Subparagraph (a)
-Publisher FASB
-URI https://asc.fasb.org/1943274/2147481231/810-10-45-25
Reference 3: http://www.xbrl.org/2003/role/disclosureRef
-Topic 235
-SubTopic 10
-Name Accounting Standards Codification
-Section S99
-Paragraph 1
-Subparagraph (SX 210.4-08(g)(1)(ii))
-Publisher FASB
-URI https://asc.fasb.org/1943274/2147480678/235-10-S99-1
Reference 4: http://www.xbrl.org/2003/role/disclosureRef
-Topic 323
-SubTopic 10
-Name Accounting Standards Codification
-Section 50
-Paragraph 3
-Subparagraph (c)
-Publisher FASB
-URI https://asc.fasb.org/1943274/2147481687/323-10-50-3
Reference 5: http://www.xbrl.org/2003/role/disclosureRef
-Topic 825
-SubTopic 10
-Name Accounting Standards Codification
-Section 50
-Paragraph 28
-Subparagraph (f)
-Publisher FASB
-URI https://asc.fasb.org/1943274/2147482907/825-10-50-28
Reference 6: http://www.xbrl.org/2003/role/exampleRef
-Topic 852
-SubTopic 10
-Name Accounting Standards Codification
-Section 55
-Paragraph 10
-Publisher FASB
-URI https://asc.fasb.org/1943274/2147481372/852-10-55-10
Reference 7: http://www.xbrl.org/2003/role/disclosureRef
-Topic 210
-SubTopic 10
-Name Accounting Standards Codification
-Section 45
-Paragraph 1
-Publisher FASB
-URI https://asc.fasb.org/1943274/2147483467/210-10-45-1
Reference 8: http://www.xbrl.org/2003/role/disclosureRef
-Topic 210
-SubTopic 10
-Name Accounting Standards Codification
-Section S99
-Paragraph 1
-Subparagraph (SX 210.5-02(9))
-Publisher FASB
-URI https://asc.fasb.org/1943274/2147480566/210-10-S99-1
Reference 9: http://www.xbrl.org/2003/role/disclosureRef
-Topic 470
-SubTopic 10
-Name Accounting Standards Codification
-Section S99
-Paragraph 1A
-Subparagraph (SX 210.13-01(a)(4)(i))
-Publisher FASB
-URI https://asc.fasb.org/1943274/2147480097/470-10-S99-1A
Reference 10: http://www.xbrl.org/2009/role/commonPracticeRef
-Topic 470
-SubTopic 10
-Name Accounting Standards Codification
-Section S99
-Paragraph 1A
-Subparagraph (SX 210.13-01(a)(4)(ii))
-Publisher FASB
-URI https://asc.fasb.org/1943274/2147480097/470-10-S99-1A
Reference 11: http://www.xbrl.org/2009/role/commonPracticeRef
-Topic 470
-SubTopic 10
-Name Accounting Standards Codification
-Section S99
-Paragraph 1A
-Subparagraph (SX 210.13-01(a)(4)(iii))
-Publisher FASB
-URI https://asc.fasb.org/1943274/2147480097/470-10-S99-1A
Reference 12: http://www.xbrl.org/2003/role/disclosureRef
-Topic 470
-SubTopic 10
-Name Accounting Standards Codification
-Section S99
-Paragraph 1A
-Subparagraph (SX 210.13-01(a)(4)(iii)(A))
-Publisher FASB
-URI https://asc.fasb.org/1943274/2147480097/470-10-S99-1A
Reference 13: http://www.xbrl.org/2003/role/disclosureRef
-Topic 470
-SubTopic 10
-Name Accounting Standards Codification
-Section S99
-Paragraph 1A
-Subparagraph (SX 210.13-01(a)(4)(iv))
-Publisher FASB
-URI https://asc.fasb.org/1943274/2147480097/470-10-S99-1A
Reference 14: http://www.xbrl.org/2003/role/disclosureRef
-Topic 470
-SubTopic 10
-Name Accounting Standards Codification
-Section S99
-Paragraph 1A
-Subparagraph (SX 210.13-01(a)(5))
-Publisher FASB
-URI https://asc.fasb.org/1943274/2147480097/470-10-S99-1A
Reference 15: http://www.xbrl.org/2003/role/disclosureRef
-Topic 470
-SubTopic 10
-Name Accounting Standards Codification
-Section S99
-Paragraph 1B
-Subparagraph (SX 210.13-02(a)(4)(i))
-Publisher FASB
-URI https://asc.fasb.org/1943274/2147480097/470-10-S99-1B
Reference 16: http://www.xbrl.org/2003/role/disclosureRef
-Topic 470
-SubTopic 10
-Name Accounting Standards Codification
-Section S99
-Paragraph 1B
-Subparagraph (SX 210.13-02(a)(4)(iii)(A))
-Publisher FASB
-URI https://asc.fasb.org/1943274/2147480097/470-10-S99-1B
Reference 17: http://www.xbrl.org/2003/role/disclosureRef
-Topic 470
-SubTopic 10
-Name Accounting Standards Codification
-Section S99
-Paragraph 1B
-Subparagraph (SX 210.13-02(a)(4)(iii)(B))
-Publisher FASB
-URI https://asc.fasb.org/1943274/2147480097/470-10-S99-1B
Reference 18: http://www.xbrl.org/2003/role/disclosureRef
-Topic 470
-SubTopic 10
-Name Accounting Standards Codification
-Section S99
-Paragraph 1B
-Subparagraph (SX 210.13-02(a)(4)(iv))
-Publisher FASB
-URI https://asc.fasb.org/1943274/2147480097/470-10-S99-1B
Reference 19: http://www.xbrl.org/2003/role/disclosureRef
-Topic 470
-SubTopic 10
-Name Accounting Standards Codification
-Section S99
-Paragraph 1B
-Subparagraph (SX 210.13-02(a)(5))
-Publisher FASB
-URI https://asc.fasb.org/1943274/2147480097/470-10-S99-1B
Reference 20: http://www.xbrl.org/2009/role/commonPracticeRef
-Topic 852
-SubTopic 10
-Name Accounting Standards Codification
-Section 50
-Paragraph 7
-Subparagraph (a)
-Publisher FASB
-URI https://asc.fasb.org/1943274/2147481404/852-10-50-7
| Name: |
us-gaap_AssetsCurrent |
| Namespace Prefix: |
us-gaap_ |
| Data Type: |
xbrli:monetaryItemType |
| Balance Type: |
debit |
| Period Type: |
instant |
|
| X |
- References
+ Details
| Name: |
us-gaap_AssetsCurrentAbstract |
| Namespace Prefix: |
us-gaap_ |
| Data Type: |
xbrli:stringItemType |
| Balance Type: |
na |
| Period Type: |
duration |
|
| X |
- DefinitionAmount of currency on hand as well as demand deposits with banks or financial institutions. Includes other kinds of accounts that have the general characteristics of demand deposits. Also includes short-term, highly liquid investments that are both readily convertible to known amounts of cash and so near their maturity that they present insignificant risk of changes in value because of changes in interest rates. Excludes cash and cash equivalents within disposal group and discontinued operation. Reference 1: http://www.xbrl.org/2003/role/disclosureRef
-Topic 210
-SubTopic 10
-Name Accounting Standards Codification
-Section S99
-Paragraph 1
-Subparagraph (SX 210.5-02(1))
-Publisher FASB
-URI https://asc.fasb.org/1943274/2147480566/210-10-S99-1
Reference 2: http://www.xbrl.org/2003/role/exampleRef
-Topic 210
-SubTopic 10
-Name Accounting Standards Codification
-Section 45
-Paragraph 1
-Subparagraph (a)
-Publisher FASB
-URI https://asc.fasb.org/1943274/2147483467/210-10-45-1
Reference 3: http://fasb.org/us-gaap/role/ref/legacyRef
-Name Accounting Standards Codification
-Topic 230
-SubTopic 10
-Section 45
-Paragraph 4
-Publisher FASB
-URI https://asc.fasb.org/1943274/2147482740/230-10-45-4
| Name: |
us-gaap_CashAndCashEquivalentsAtCarryingValue |
| Namespace Prefix: |
us-gaap_ |
| Data Type: |
xbrli:monetaryItemType |
| Balance Type: |
debit |
| Period Type: |
instant |
|
| X |
- DefinitionFace amount or stated value per share of common stock. Reference 1: http://fasb.org/us-gaap/role/ref/legacyRef
-Topic 210
-SubTopic 10
-Name Accounting Standards Codification
-Section S99
-Paragraph 1
-Subparagraph (SX 210.5-02(29))
-Publisher FASB
-URI https://asc.fasb.org/1943274/2147480566/210-10-S99-1
| Name: |
us-gaap_CommonStockParOrStatedValuePerShare |
| Namespace Prefix: |
us-gaap_ |
| Data Type: |
dtr-types:perShareItemType |
| Balance Type: |
na |
| Period Type: |
instant |
|
| X |
- DefinitionAggregate par or stated value of issued nonredeemable common stock (or common stock redeemable solely at the option of the issuer). This item includes treasury stock repurchased by the entity. Note: elements for number of nonredeemable common shares, par value and other disclosure concepts are in another section within stockholders' equity. Reference 1: http://fasb.org/us-gaap/role/ref/legacyRef
-Topic 210
-SubTopic 10
-Name Accounting Standards Codification
-Section S99
-Paragraph 1
-Subparagraph (SX 210.5-02(29))
-Publisher FASB
-URI https://asc.fasb.org/1943274/2147480566/210-10-S99-1
Reference 2: http://www.xbrl.org/2003/role/exampleRef
-Topic 852
-SubTopic 10
-Name Accounting Standards Codification
-Section 55
-Paragraph 10
-Publisher FASB
-URI https://asc.fasb.org/1943274/2147481372/852-10-55-10
Reference 3: http://www.xbrl.org/2003/role/disclosureRef
-Topic 944
-SubTopic 210
-Name Accounting Standards Codification
-Section S99
-Paragraph 1
-Subparagraph (SX 210.7-03(a)(22))
-Publisher FASB
-URI https://asc.fasb.org/1943274/2147478777/944-210-S99-1
| Name: |
us-gaap_CommonStockValue |
| Namespace Prefix: |
us-gaap_ |
| Data Type: |
xbrli:monetaryItemType |
| Balance Type: |
credit |
| Period Type: |
instant |
|
| X |
- DefinitionAmount of debt and lease obligation, classified as current. Reference 1: http://www.xbrl.org/2003/role/disclosureRef
-Topic 210
-SubTopic 10
-Name Accounting Standards Codification
-Section S99
-Paragraph 1
-Subparagraph (SX 210.5-02(21))
-Publisher FASB
-URI https://asc.fasb.org/1943274/2147480566/210-10-S99-1
| Name: |
us-gaap_DebtCurrent |
| Namespace Prefix: |
us-gaap_ |
| Data Type: |
xbrli:monetaryItemType |
| Balance Type: |
credit |
| Period Type: |
instant |
|
| X |
- DefinitionAmount of excess of rental income recognized over rental payment required by lease. Reference 1: http://fasb.org/us-gaap/role/ref/otherTransitionRef
-Topic 840
-SubTopic 20
-Name Accounting Standards Codification
-Section 35
-Paragraph 2
-Publisher FASB
-URI https://asc.fasb.org/1943274/2147481123/840-20-35-2
Reference 2: http://fasb.org/us-gaap/role/ref/otherTransitionRef
-Topic 840
-SubTopic 20
-Name Accounting Standards Codification
-Section 25
-Paragraph 1
-Publisher FASB
-URI https://asc.fasb.org/1943274/2147481178/840-20-25-1
Reference 3: http://www.xbrl.org/2009/role/commonPracticeRef
-Topic 842
-SubTopic 30
-Name Accounting Standards Codification
-Section 25
-Paragraph 11
-Subparagraph (a)
-Publisher FASB
-URI https://asc.fasb.org/1943274/2147479341/842-30-25-11
Reference 4: http://fasb.org/us-gaap/role/ref/otherTransitionRef
-Topic 840
-SubTopic 20
-Name Accounting Standards Codification
-Section 25
-Paragraph 2
-Publisher FASB
-URI https://asc.fasb.org/1943274/2147481178/840-20-25-2
| Name: |
us-gaap_DeferredRentReceivablesNet |
| Namespace Prefix: |
us-gaap_ |
| Data Type: |
xbrli:monetaryItemType |
| Balance Type: |
debit |
| Period Type: |
instant |
|
| X |
- DefinitionAmount of excess of rental income recognized over rental payment required by lease, classified as noncurrent. Reference 1: http://www.xbrl.org/2009/role/commonPracticeRef
-Topic 842
-SubTopic 30
-Name Accounting Standards Codification
-Section 25
-Paragraph 11
-Subparagraph (a)
-Publisher FASB
-URI https://asc.fasb.org/1943274/2147479341/842-30-25-11
Reference 2: http://fasb.org/us-gaap/role/ref/otherTransitionRef
-Topic 840
-SubTopic 20
-Name Accounting Standards Codification
-Section 25
-Paragraph 2
-Publisher FASB
-URI https://asc.fasb.org/1943274/2147481178/840-20-25-2
| Name: |
us-gaap_DeferredRentReceivablesNetNoncurrent |
| Namespace Prefix: |
us-gaap_ |
| Data Type: |
xbrli:monetaryItemType |
| Balance Type: |
debit |
| Period Type: |
instant |
|
| X |
- DefinitionAmount of deferred income and obligation to transfer product and service to customer for which consideration has been received or is receivable, classified as current. Reference 1: http://www.xbrl.org/2009/role/commonPracticeRef
-Topic 210
-SubTopic 10
-Name Accounting Standards Codification
-Section S99
-Paragraph 1
-Subparagraph (SX 210.5-02(20))
-Publisher FASB
-URI https://asc.fasb.org/1943274/2147480566/210-10-S99-1
| Name: |
us-gaap_DeferredRevenueCurrent |
| Namespace Prefix: |
us-gaap_ |
| Data Type: |
xbrli:monetaryItemType |
| Balance Type: |
credit |
| Period Type: |
instant |
|
| X |
- DefinitionAmount, after accumulated impairment loss, of asset representing future economic benefit arising from other asset acquired in business combination or from joint venture formation or both, that is not individually identified and separately recognized. Reference 1: http://www.xbrl.org/2003/role/exampleRef
-Topic 280
-SubTopic 10
-Name Accounting Standards Codification
-Section 55
-Paragraph 49
-Publisher FASB
-URI https://asc.fasb.org/1943274/2147482785/280-10-55-49
Reference 2: http://www.xbrl.org/2003/role/exampleRef
-Topic 350
-SubTopic 20
-Name Accounting Standards Codification
-Section 55
-Paragraph 24
-Publisher FASB
-URI https://asc.fasb.org/1943274/2147482548/350-20-55-24
Reference 3: http://www.xbrl.org/2003/role/exampleRef
-Topic 820
-SubTopic 10
-Name Accounting Standards Codification
-Section 55
-Paragraph 100
-Subparagraph (d)
-Publisher FASB
-URI https://asc.fasb.org/1943274/2147482078/820-10-55-100
Reference 4: http://www.xbrl.org/2003/role/exampleRef
-Topic 852
-SubTopic 10
-Name Accounting Standards Codification
-Section 55
-Paragraph 10
-Publisher FASB
-URI https://asc.fasb.org/1943274/2147481372/852-10-55-10
Reference 5: http://www.xbrl.org/2003/role/disclosureRef
-Topic 210
-SubTopic 10
-Name Accounting Standards Codification
-Section S99
-Paragraph 1
-Subparagraph (SX 210.5-02(15))
-Publisher FASB
-URI https://asc.fasb.org/1943274/2147480566/210-10-S99-1
Reference 6: http://www.xbrl.org/2003/role/disclosureRef
-Topic 350
-SubTopic 20
-Name Accounting Standards Codification
-Section 45
-Paragraph 1
-Publisher FASB
-URI https://asc.fasb.org/1943274/2147482598/350-20-45-1
Reference 7: http://www.xbrl.org/2009/role/commonPracticeRef
-Topic 350
-SubTopic 20
-Name Accounting Standards Codification
-Section 50
-Paragraph 1
-Subparagraph (a)
-Publisher FASB
-URI https://asc.fasb.org/1943274/2147482573/350-20-50-1
Reference 8: http://www.xbrl.org/2009/role/commonPracticeRef
-Topic 350
-SubTopic 20
-Name Accounting Standards Codification
-Section 50
-Paragraph 1
-Subparagraph (h)
-Publisher FASB
-URI https://asc.fasb.org/1943274/2147482573/350-20-50-1
Reference 9: http://www.xbrl.org/2003/role/disclosureRef
-Topic 942
-SubTopic 210
-Name Accounting Standards Codification
-Section S99
-Paragraph 1
-Subparagraph (SX 210.9-03(10)(1))
-Publisher FASB
-URI https://asc.fasb.org/1943274/2147478546/942-210-S99-1
| Name: |
us-gaap_Goodwill |
| Namespace Prefix: |
us-gaap_ |
| Data Type: |
xbrli:monetaryItemType |
| Balance Type: |
debit |
| Period Type: |
instant |
|
| X |
- DefinitionCarrying value as of the balance sheet date of [accrued] interest payable on all forms of debt, including trade payables, that has been incurred and is unpaid. Used to reflect the current portion of the liabilities (due within one year or within the normal operating cycle if longer). Reference 1: http://fasb.org/us-gaap/role/ref/legacyRef
-Topic 210
-SubTopic 10
-Name Accounting Standards Codification
-Section S99
-Paragraph 1
-Subparagraph (SX 210.5-02(20))
-Publisher FASB
-URI https://asc.fasb.org/1943274/2147480566/210-10-S99-1
| Name: |
us-gaap_InterestPayableCurrent |
| Namespace Prefix: |
us-gaap_ |
| Data Type: |
xbrli:monetaryItemType |
| Balance Type: |
credit |
| Period Type: |
instant |
|
| X |
- DefinitionAmount of liability recognized for present obligation requiring transfer or otherwise providing economic benefit to others. Reference 1: http://fasb.org/us-gaap/role/ref/legacyRef
-Name Accounting Standards Codification
-Section S99
-Paragraph 1
-Subparagraph (SX 210.5-02(22))
-SubTopic 10
-Topic 210
-Publisher FASB
-URI https://asc.fasb.org/1943274/2147480566/210-10-S99-1
Reference 2: http://fasb.org/us-gaap/role/ref/legacyRef
-Topic 210
-SubTopic 10
-Name Accounting Standards Codification
-Section S99
-Paragraph 1
-Subparagraph (SX 210.5-02(20))
-Publisher FASB
-URI https://asc.fasb.org/1943274/2147480566/210-10-S99-1
Reference 3: http://fasb.org/us-gaap/role/ref/legacyRef
-Topic 210
-SubTopic 10
-Name Accounting Standards Codification
-Section S99
-Paragraph 1
-Subparagraph (SX 210.5-02(24))
-Publisher FASB
-URI https://asc.fasb.org/1943274/2147480566/210-10-S99-1
Reference 4: http://fasb.org/us-gaap/role/ref/legacyRef
-Topic 210
-SubTopic 10
-Name Accounting Standards Codification
-Section S99
-Paragraph 1
-Subparagraph (SX 210.5-02(19))
-Publisher FASB
-URI https://asc.fasb.org/1943274/2147480566/210-10-S99-1
Reference 5: http://fasb.org/us-gaap/role/ref/legacyRef
-Topic 210
-SubTopic 10
-Name Accounting Standards Codification
-Section S99
-Paragraph 1
-Subparagraph (SX 210.5-02(25))
-Publisher FASB
-URI https://asc.fasb.org/1943274/2147480566/210-10-S99-1
Reference 6: http://fasb.org/us-gaap/role/ref/legacyRef
-Topic 210
-SubTopic 10
-Name Accounting Standards Codification
-Section S99
-Paragraph 1
-Subparagraph (SX 210.5-02(26))
-Publisher FASB
-URI https://asc.fasb.org/1943274/2147480566/210-10-S99-1
Reference 7: http://fasb.org/us-gaap/role/ref/legacyRef
-Topic 210
-SubTopic 10
-Name Accounting Standards Codification
-Section S99
-Paragraph 1
-Subparagraph (SX 210.5-02(23))
-Publisher FASB
-URI https://asc.fasb.org/1943274/2147480566/210-10-S99-1
Reference 8: http://fasb.org/us-gaap/role/ref/legacyRef
-Topic 210
-SubTopic 10
-Name Accounting Standards Codification
-Section S99
-Paragraph 1
-Subparagraph (SX 210.5-02(21))
-Publisher FASB
-URI https://asc.fasb.org/1943274/2147480566/210-10-S99-1
Reference 9: http://www.xbrl.org/2003/role/disclosureRef
-Topic 810
-SubTopic 10
-Name Accounting Standards Codification
-Section 50
-Paragraph 3
-Subparagraph (c)
-Publisher FASB
-URI https://asc.fasb.org/1943274/2147481203/810-10-50-3
Reference 10: http://www.xbrl.org/2003/role/disclosureRef
-Topic 810
-SubTopic 10
-Name Accounting Standards Codification
-Section 45
-Paragraph 25
-Subparagraph (b)
-Publisher FASB
-URI https://asc.fasb.org/1943274/2147481231/810-10-45-25
Reference 11: http://www.xbrl.org/2003/role/disclosureRef
-Topic 810
-SubTopic 10
-Name Accounting Standards Codification
-Section 50
-Paragraph 3
-Subparagraph (bb)
-Publisher FASB
-URI https://asc.fasb.org/1943274/2147481203/810-10-50-3
Reference 12: http://www.xbrl.org/2003/role/disclosureRef
-Topic 235
-SubTopic 10
-Name Accounting Standards Codification
-Section S99
-Paragraph 1
-Subparagraph (SX 210.4-08(g)(1)(ii))
-Publisher FASB
-URI https://asc.fasb.org/1943274/2147480678/235-10-S99-1
Reference 13: http://www.xbrl.org/2003/role/disclosureRef
-Topic 323
-SubTopic 10
-Name Accounting Standards Codification
-Section 50
-Paragraph 3
-Subparagraph (c)
-Publisher FASB
-URI https://asc.fasb.org/1943274/2147481687/323-10-50-3
Reference 14: http://www.xbrl.org/2003/role/disclosureRef
-Topic 825
-SubTopic 10
-Name Accounting Standards Codification
-Section 50
-Paragraph 28
-Subparagraph (f)
-Publisher FASB
-URI https://asc.fasb.org/1943274/2147482907/825-10-50-28
Reference 15: http://www.xbrl.org/2003/role/exampleRef
-Topic 946
-SubTopic 830
-Name Accounting Standards Codification
-Section 55
-Paragraph 12
-Publisher FASB
-URI https://asc.fasb.org/1943274/2147479168/946-830-55-12
Reference 16: http://www.xbrl.org/2003/role/disclosureRef
-Topic 946
-SubTopic 210
-Name Accounting Standards Codification
-Section S99
-Paragraph 1
-Subparagraph (SX 210.6-04(14))
-Publisher FASB
-URI https://asc.fasb.org/1943274/2147479170/946-210-S99-1
Reference 17: http://www.xbrl.org/2003/role/disclosureRef
-Topic 470
-SubTopic 10
-Name Accounting Standards Codification
-Section S99
-Paragraph 1A
-Subparagraph (SX 210.13-01(a)(4)(i))
-Publisher FASB
-URI https://asc.fasb.org/1943274/2147480097/470-10-S99-1A
Reference 18: http://www.xbrl.org/2009/role/commonPracticeRef
-Topic 470
-SubTopic 10
-Name Accounting Standards Codification
-Section S99
-Paragraph 1A
-Subparagraph (SX 210.13-01(a)(4)(ii))
-Publisher FASB
-URI https://asc.fasb.org/1943274/2147480097/470-10-S99-1A
Reference 19: http://www.xbrl.org/2003/role/disclosureRef
-Topic 470
-SubTopic 10
-Name Accounting Standards Codification
-Section S99
-Paragraph 1A
-Subparagraph (SX 210.13-01(a)(4)(iii)(A))
-Publisher FASB
-URI https://asc.fasb.org/1943274/2147480097/470-10-S99-1A
Reference 20: http://www.xbrl.org/2003/role/disclosureRef
-Topic 470
-SubTopic 10
-Name Accounting Standards Codification
-Section S99
-Paragraph 1A
-Subparagraph (SX 210.13-01(a)(4)(iv))
-Publisher FASB
-URI https://asc.fasb.org/1943274/2147480097/470-10-S99-1A
Reference 21: http://www.xbrl.org/2003/role/disclosureRef
-Topic 470
-SubTopic 10
-Name Accounting Standards Codification
-Section S99
-Paragraph 1A
-Subparagraph (SX 210.13-01(a)(5))
-Publisher FASB
-URI https://asc.fasb.org/1943274/2147480097/470-10-S99-1A
Reference 22: http://www.xbrl.org/2003/role/disclosureRef
-Topic 470
-SubTopic 10
-Name Accounting Standards Codification
-Section S99
-Paragraph 1B
-Subparagraph (SX 210.13-02(a)(4)(i))
-Publisher FASB
-URI https://asc.fasb.org/1943274/2147480097/470-10-S99-1B
Reference 23: http://www.xbrl.org/2003/role/disclosureRef
-Topic 470
-SubTopic 10
-Name Accounting Standards Codification
-Section S99
-Paragraph 1B
-Subparagraph (SX 210.13-02(a)(4)(iii)(A))
-Publisher FASB
-URI https://asc.fasb.org/1943274/2147480097/470-10-S99-1B
Reference 24: http://www.xbrl.org/2003/role/disclosureRef
-Topic 470
-SubTopic 10
-Name Accounting Standards Codification
-Section S99
-Paragraph 1B
-Subparagraph (SX 210.13-02(a)(4)(iii)(B))
-Publisher FASB
-URI https://asc.fasb.org/1943274/2147480097/470-10-S99-1B
Reference 25: http://www.xbrl.org/2003/role/disclosureRef
-Topic 470
-SubTopic 10
-Name Accounting Standards Codification
-Section S99
-Paragraph 1B
-Subparagraph (SX 210.13-02(a)(4)(iv))
-Publisher FASB
-URI https://asc.fasb.org/1943274/2147480097/470-10-S99-1B
Reference 26: http://www.xbrl.org/2003/role/disclosureRef
-Topic 470
-SubTopic 10
-Name Accounting Standards Codification
-Section S99
-Paragraph 1B
-Subparagraph (SX 210.13-02(a)(5))
-Publisher FASB
-URI https://asc.fasb.org/1943274/2147480097/470-10-S99-1B
Reference 27: http://www.xbrl.org/2009/role/commonPracticeRef
-Topic 852
-SubTopic 10
-Name Accounting Standards Codification
-Section 50
-Paragraph 7
-Subparagraph (a)
-Publisher FASB
-URI https://asc.fasb.org/1943274/2147481404/852-10-50-7
Reference 28: http://www.xbrl.org/2009/role/commonPracticeRef
-Topic 852
-SubTopic 10
-Name Accounting Standards Codification
-Section 50
-Paragraph 7
-Subparagraph (b)
-Publisher FASB
-URI https://asc.fasb.org/1943274/2147481404/852-10-50-7
Reference 29: http://www.xbrl.org/2003/role/exampleRef
-Topic 280
-SubTopic 10
-Name Accounting Standards Codification
-Section 50
-Paragraph 30
-Subparagraph (d)
-Publisher FASB
-URI https://asc.fasb.org/1943274/2147482810/280-10-50-30
| Name: |
us-gaap_Liabilities |
| Namespace Prefix: |
us-gaap_ |
| Data Type: |
xbrli:monetaryItemType |
| Balance Type: |
credit |
| Period Type: |
instant |
|
| X |
- DefinitionAmount of liabilities and equity items, including the portion of equity attributable to noncontrolling interests, if any. Reference 1: http://www.xbrl.org/2003/role/exampleRef
-Topic 852
-SubTopic 10
-Name Accounting Standards Codification
-Section 55
-Paragraph 10
-Publisher FASB
-URI https://asc.fasb.org/1943274/2147481372/852-10-55-10
Reference 2: http://www.xbrl.org/2003/role/disclosureRef
-Topic 944
-SubTopic 210
-Name Accounting Standards Codification
-Section S99
-Paragraph 1
-Subparagraph (SX 210.7-03(a)(25))
-Publisher FASB
-URI https://asc.fasb.org/1943274/2147478777/944-210-S99-1
Reference 3: http://www.xbrl.org/2009/role/commonPracticeRef
-Topic 235
-SubTopic 10
-Name Accounting Standards Codification
-Section S99
-Paragraph 1
-Subparagraph (SX 210.4-08(g)(1)(ii))
-Publisher FASB
-URI https://asc.fasb.org/1943274/2147480678/235-10-S99-1
Reference 4: http://www.xbrl.org/2009/role/commonPracticeRef
-Topic 323
-SubTopic 10
-Name Accounting Standards Codification
-Section 50
-Paragraph 3
-Subparagraph (c)
-Publisher FASB
-URI https://asc.fasb.org/1943274/2147481687/323-10-50-3
Reference 5: http://www.xbrl.org/2009/role/commonPracticeRef
-Topic 825
-SubTopic 10
-Name Accounting Standards Codification
-Section 50
-Paragraph 28
-Subparagraph (f)
-Publisher FASB
-URI https://asc.fasb.org/1943274/2147482907/825-10-50-28
Reference 6: http://fasb.org/us-gaap/role/ref/legacyRef
-Topic 942
-SubTopic 210
-Name Accounting Standards Codification
-Section S99
-Paragraph 1
-Subparagraph (SX 210.9-03(23))
-Publisher FASB
-URI https://asc.fasb.org/1943274/2147478546/942-210-S99-1
Reference 7: http://fasb.org/us-gaap/role/ref/legacyRef
-Topic 210
-SubTopic 10
-Name Accounting Standards Codification
-Section S99
-Paragraph 1
-Subparagraph (SX 210.5-02(32))
-Publisher FASB
-URI https://asc.fasb.org/1943274/2147480566/210-10-S99-1
| Name: |
us-gaap_LiabilitiesAndStockholdersEquity |
| Namespace Prefix: |
us-gaap_ |
| Data Type: |
xbrli:monetaryItemType |
| Balance Type: |
credit |
| Period Type: |
instant |
|
| X |
- DefinitionTotal obligations incurred as part of normal operations that are expected to be paid during the following twelve months or within one business cycle, if longer. Reference 1: http://fasb.org/us-gaap/role/ref/legacyRef
-Topic 210
-SubTopic 10
-Name Accounting Standards Codification
-Section S99
-Paragraph 1
-Subparagraph (SX 210.5-02(21))
-Publisher FASB
-URI https://asc.fasb.org/1943274/2147480566/210-10-S99-1
Reference 2: http://www.xbrl.org/2003/role/disclosureRef
-Topic 810
-SubTopic 10
-Name Accounting Standards Codification
-Section 50
-Paragraph 3
-Subparagraph (c)
-Publisher FASB
-URI https://asc.fasb.org/1943274/2147481203/810-10-50-3
Reference 3: http://www.xbrl.org/2003/role/disclosureRef
-Topic 810
-SubTopic 10
-Name Accounting Standards Codification
-Section 45
-Paragraph 25
-Subparagraph (b)
-Publisher FASB
-URI https://asc.fasb.org/1943274/2147481231/810-10-45-25
Reference 4: http://www.xbrl.org/2003/role/disclosureRef
-Topic 810
-SubTopic 10
-Name Accounting Standards Codification
-Section 50
-Paragraph 3
-Subparagraph (bb)
-Publisher FASB
-URI https://asc.fasb.org/1943274/2147481203/810-10-50-3
Reference 5: http://www.xbrl.org/2003/role/disclosureRef
-Topic 235
-SubTopic 10
-Name Accounting Standards Codification
-Section S99
-Paragraph 1
-Subparagraph (SX 210.4-08(g)(1)(ii))
-Publisher FASB
-URI https://asc.fasb.org/1943274/2147480678/235-10-S99-1
Reference 6: http://www.xbrl.org/2003/role/disclosureRef
-Topic 323
-SubTopic 10
-Name Accounting Standards Codification
-Section 50
-Paragraph 3
-Subparagraph (c)
-Publisher FASB
-URI https://asc.fasb.org/1943274/2147481687/323-10-50-3
Reference 7: http://www.xbrl.org/2003/role/disclosureRef
-Topic 825
-SubTopic 10
-Name Accounting Standards Codification
-Section 50
-Paragraph 28
-Subparagraph (f)
-Publisher FASB
-URI https://asc.fasb.org/1943274/2147482907/825-10-50-28
Reference 8: http://www.xbrl.org/2003/role/exampleRef
-Topic 852
-SubTopic 10
-Name Accounting Standards Codification
-Section 55
-Paragraph 10
-Publisher FASB
-URI https://asc.fasb.org/1943274/2147481372/852-10-55-10
Reference 9: http://www.xbrl.org/2003/role/disclosureRef
-Topic 210
-SubTopic 10
-Name Accounting Standards Codification
-Section 45
-Paragraph 5
-Publisher FASB
-URI https://asc.fasb.org/1943274/2147483467/210-10-45-5
Reference 10: http://www.xbrl.org/2003/role/disclosureRef
-Topic 470
-SubTopic 10
-Name Accounting Standards Codification
-Section S99
-Paragraph 1A
-Subparagraph (SX 210.13-01(a)(4)(i))
-Publisher FASB
-URI https://asc.fasb.org/1943274/2147480097/470-10-S99-1A
Reference 11: http://www.xbrl.org/2009/role/commonPracticeRef
-Topic 470
-SubTopic 10
-Name Accounting Standards Codification
-Section S99
-Paragraph 1A
-Subparagraph (SX 210.13-01(a)(4)(ii))
-Publisher FASB
-URI https://asc.fasb.org/1943274/2147480097/470-10-S99-1A
Reference 12: http://www.xbrl.org/2003/role/disclosureRef
-Topic 470
-SubTopic 10
-Name Accounting Standards Codification
-Section S99
-Paragraph 1A
-Subparagraph (SX 210.13-01(a)(4)(iii)(A))
-Publisher FASB
-URI https://asc.fasb.org/1943274/2147480097/470-10-S99-1A
Reference 13: http://www.xbrl.org/2003/role/disclosureRef
-Topic 470
-SubTopic 10
-Name Accounting Standards Codification
-Section S99
-Paragraph 1A
-Subparagraph (SX 210.13-01(a)(4)(iv))
-Publisher FASB
-URI https://asc.fasb.org/1943274/2147480097/470-10-S99-1A
Reference 14: http://www.xbrl.org/2003/role/disclosureRef
-Topic 470
-SubTopic 10
-Name Accounting Standards Codification
-Section S99
-Paragraph 1A
-Subparagraph (SX 210.13-01(a)(5))
-Publisher FASB
-URI https://asc.fasb.org/1943274/2147480097/470-10-S99-1A
Reference 15: http://www.xbrl.org/2003/role/disclosureRef
-Topic 470
-SubTopic 10
-Name Accounting Standards Codification
-Section S99
-Paragraph 1B
-Subparagraph (SX 210.13-02(a)(4)(i))
-Publisher FASB
-URI https://asc.fasb.org/1943274/2147480097/470-10-S99-1B
Reference 16: http://www.xbrl.org/2003/role/disclosureRef
-Topic 470
-SubTopic 10
-Name Accounting Standards Codification
-Section S99
-Paragraph 1B
-Subparagraph (SX 210.13-02(a)(4)(iii)(A))
-Publisher FASB
-URI https://asc.fasb.org/1943274/2147480097/470-10-S99-1B
Reference 17: http://www.xbrl.org/2003/role/disclosureRef
-Topic 470
-SubTopic 10
-Name Accounting Standards Codification
-Section S99
-Paragraph 1B
-Subparagraph (SX 210.13-02(a)(4)(iii)(B))
-Publisher FASB
-URI https://asc.fasb.org/1943274/2147480097/470-10-S99-1B
Reference 18: http://www.xbrl.org/2003/role/disclosureRef
-Topic 470
-SubTopic 10
-Name Accounting Standards Codification
-Section S99
-Paragraph 1B
-Subparagraph (SX 210.13-02(a)(4)(iv))
-Publisher FASB
-URI https://asc.fasb.org/1943274/2147480097/470-10-S99-1B
Reference 19: http://www.xbrl.org/2003/role/disclosureRef
-Topic 470
-SubTopic 10
-Name Accounting Standards Codification
-Section S99
-Paragraph 1B
-Subparagraph (SX 210.13-02(a)(5))
-Publisher FASB
-URI https://asc.fasb.org/1943274/2147480097/470-10-S99-1B
Reference 20: http://www.xbrl.org/2009/role/commonPracticeRef
-Topic 852
-SubTopic 10
-Name Accounting Standards Codification
-Section 50
-Paragraph 7
-Subparagraph (a)
-Publisher FASB
-URI https://asc.fasb.org/1943274/2147481404/852-10-50-7
Reference 21: http://www.xbrl.org/2009/role/commonPracticeRef
-Topic 852
-SubTopic 10
-Name Accounting Standards Codification
-Section 50
-Paragraph 7
-Subparagraph (b)
-Publisher FASB
-URI https://asc.fasb.org/1943274/2147481404/852-10-50-7
| Name: |
us-gaap_LiabilitiesCurrent |
| Namespace Prefix: |
us-gaap_ |
| Data Type: |
xbrli:monetaryItemType |
| Balance Type: |
credit |
| Period Type: |
instant |
|
| X |
- References
+ Details
| Name: |
us-gaap_LiabilitiesCurrentAbstract |
| Namespace Prefix: |
us-gaap_ |
| Data Type: |
xbrli:stringItemType |
| Balance Type: |
na |
| Period Type: |
duration |
|
| X |
- DefinitionAmount of long-term debt and lease obligation, classified as noncurrent. Reference 1: http://fasb.org/us-gaap/role/ref/legacyRef
-Name Accounting Standards Codification
-Section S99
-Paragraph 1
-Subparagraph (SX 210.5-02(22))
-SubTopic 10
-Topic 210
-Publisher FASB
-URI https://asc.fasb.org/1943274/2147480566/210-10-S99-1
Reference 2: http://www.xbrl.org/2003/role/disclosureRef
-Topic 944
-SubTopic 210
-Name Accounting Standards Codification
-Section S99
-Paragraph 1
-Subparagraph (SX 210.7-03(a)(16)(a)(2))
-Publisher FASB
-URI https://asc.fasb.org/1943274/2147478777/944-210-S99-1
| Name: |
us-gaap_LongTermDebtAndCapitalLeaseObligations |
| Namespace Prefix: |
us-gaap_ |
| Data Type: |
xbrli:monetaryItemType |
| Balance Type: |
credit |
| Period Type: |
instant |
|
| X |
- DefinitionPresent value of lessee's discounted obligation for lease payments from operating lease, classified as current. Reference 1: http://www.xbrl.org/2003/role/disclosureRef
-Topic 842
-SubTopic 20
-Name Accounting Standards Codification
-Section 45
-Paragraph 1
-Subparagraph (b)
-Publisher FASB
-URI https://asc.fasb.org/1943274/2147479041/842-20-45-1
| Name: |
us-gaap_OperatingLeaseLiabilityCurrent |
| Namespace Prefix: |
us-gaap_ |
| Data Type: |
xbrli:monetaryItemType |
| Balance Type: |
credit |
| Period Type: |
instant |
|
| X |
- DefinitionPresent value of lessee's discounted obligation for lease payments from operating lease, classified as noncurrent. Reference 1: http://www.xbrl.org/2003/role/disclosureRef
-Topic 842
-SubTopic 20
-Name Accounting Standards Codification
-Section 45
-Paragraph 1
-Subparagraph (b)
-Publisher FASB
-URI https://asc.fasb.org/1943274/2147479041/842-20-45-1
| Name: |
us-gaap_OperatingLeaseLiabilityNoncurrent |
| Namespace Prefix: |
us-gaap_ |
| Data Type: |
xbrli:monetaryItemType |
| Balance Type: |
credit |
| Period Type: |
instant |
|
| X |
- DefinitionAmount of lessee's right to use underlying asset under operating lease. Reference 1: http://www.xbrl.org/2003/role/disclosureRef
-Topic 842
-SubTopic 20
-Name Accounting Standards Codification
-Section 45
-Paragraph 1
-Subparagraph (a)
-Publisher FASB
-URI https://asc.fasb.org/1943274/2147479041/842-20-45-1
| Name: |
us-gaap_OperatingLeaseRightOfUseAsset |
| Namespace Prefix: |
us-gaap_ |
| Data Type: |
xbrli:monetaryItemType |
| Balance Type: |
debit |
| Period Type: |
instant |
|
| X |
- DefinitionAmount of current assets classified as other. Reference 1: http://www.xbrl.org/2003/role/exampleRef
-Topic 852
-SubTopic 10
-Name Accounting Standards Codification
-Section 55
-Paragraph 10
-Publisher FASB
-URI https://asc.fasb.org/1943274/2147481372/852-10-55-10
Reference 2: http://www.xbrl.org/2003/role/disclosureRef
-Topic 210
-SubTopic 10
-Name Accounting Standards Codification
-Section S99
-Paragraph 1
-Subparagraph (SX 210.5-02(8))
-Publisher FASB
-URI https://asc.fasb.org/1943274/2147480566/210-10-S99-1
| Name: |
us-gaap_OtherAssetsCurrent |
| Namespace Prefix: |
us-gaap_ |
| Data Type: |
xbrli:monetaryItemType |
| Balance Type: |
debit |
| Period Type: |
instant |
|
| X |
- DefinitionAmount of noncurrent assets classified as other. Reference 1: http://www.xbrl.org/2003/role/disclosureRef
-Topic 210
-SubTopic 10
-Name Accounting Standards Codification
-Section S99
-Paragraph 1
-Subparagraph (SX 210.5-02(17))
-Publisher FASB
-URI https://asc.fasb.org/1943274/2147480566/210-10-S99-1
| Name: |
us-gaap_OtherAssetsNoncurrent |
| Namespace Prefix: |
us-gaap_ |
| Data Type: |
xbrli:monetaryItemType |
| Balance Type: |
debit |
| Period Type: |
instant |
|
| X |
- DefinitionAmount after accumulated amortization of finite-lived and indefinite-lived intangible assets classified as other.
| Name: |
us-gaap_OtherIntangibleAssetsNet |
| Namespace Prefix: |
us-gaap_ |
| Data Type: |
xbrli:monetaryItemType |
| Balance Type: |
debit |
| Period Type: |
instant |
|
| X |
- DefinitionAmount of liabilities classified as other, due within one year or the normal operating cycle, if longer. Reference 1: http://fasb.org/us-gaap/role/ref/legacyRef
-Topic 210
-SubTopic 10
-Name Accounting Standards Codification
-Section S99
-Paragraph 1
-Subparagraph (SX 210.5-02(20))
-Publisher FASB
-URI https://asc.fasb.org/1943274/2147480566/210-10-S99-1
Reference 2: http://www.xbrl.org/2003/role/exampleRef
-Topic 852
-SubTopic 10
-Name Accounting Standards Codification
-Section 55
-Paragraph 10
-Publisher FASB
-URI https://asc.fasb.org/1943274/2147481372/852-10-55-10
| Name: |
us-gaap_OtherLiabilitiesCurrent |
| Namespace Prefix: |
us-gaap_ |
| Data Type: |
xbrli:monetaryItemType |
| Balance Type: |
credit |
| Period Type: |
instant |
|
| X |
- DefinitionAmount of liabilities classified as other, due after one year or the normal operating cycle, if longer. Reference 1: http://fasb.org/us-gaap/role/ref/legacyRef
-Topic 210
-SubTopic 10
-Name Accounting Standards Codification
-Section S99
-Paragraph 1
-Subparagraph (SX 210.5-02(24))
-Publisher FASB
-URI https://asc.fasb.org/1943274/2147480566/210-10-S99-1
| Name: |
us-gaap_OtherLiabilitiesNoncurrent |
| Namespace Prefix: |
us-gaap_ |
| Data Type: |
xbrli:monetaryItemType |
| Balance Type: |
credit |
| Period Type: |
instant |
|
| X |
- DefinitionAmount of asset related to consideration paid in advance for costs that provide economic benefits within a future period of one year or the normal operating cycle, if longer. Reference 1: http://www.xbrl.org/2003/role/exampleRef
-Topic 210
-SubTopic 10
-Name Accounting Standards Codification
-Section 45
-Paragraph 1
-Subparagraph (g)
-Publisher FASB
-URI https://asc.fasb.org/1943274/2147483467/210-10-45-1
Reference 2: http://www.xbrl.org/2003/role/disclosureRef
-Topic 210
-SubTopic 10
-Name Accounting Standards Codification
-Section S99
-Paragraph 1
-Subparagraph (SX 210.5-02(7))
-Publisher FASB
-URI https://asc.fasb.org/1943274/2147480566/210-10-S99-1
Reference 3: http://www.xbrl.org/2003/role/disclosureRef
-Topic 340
-SubTopic 10
-Name Accounting Standards Codification
-Section 05
-Paragraph 5
-Publisher FASB
-URI https://asc.fasb.org/1943274/2147482955/340-10-05-5
Reference 4: http://www.xbrl.org/2003/role/disclosureRef
-Topic 340
-SubTopic 10
-Name Accounting Standards Codification
-Section 45
-Paragraph 1
-Publisher FASB
-URI https://asc.fasb.org/1943274/2147483032/340-10-45-1
| Name: |
us-gaap_PrepaidExpenseCurrent |
| Namespace Prefix: |
us-gaap_ |
| Data Type: |
xbrli:monetaryItemType |
| Balance Type: |
debit |
| Period Type: |
instant |
|
| X |
- DefinitionAmount after accumulated depreciation, depletion and amortization of physical assets used in the normal conduct of business to produce goods and services and not intended for resale. Examples include, but are not limited to, land, buildings, machinery and equipment, office equipment, and furniture and fixtures. Reference 1: http://fasb.org/us-gaap/role/ref/legacyRef
-Name Accounting Standards Codification
-Section 50
-Paragraph 1
-SubTopic 10
-Topic 360
-Publisher FASB
-URI https://asc.fasb.org/1943274/2147482099/360-10-50-1
Reference 2: http://www.xbrl.org/2003/role/disclosureRef
-Topic 842
-SubTopic 20
-Name Accounting Standards Codification
-Section 50
-Paragraph 7A
-Subparagraph (a)
-Publisher FASB
-URI https://asc.fasb.org/1943274/2147478964/842-20-50-7A
Reference 3: http://www.xbrl.org/2003/role/exampleRef
-Topic 852
-SubTopic 10
-Name Accounting Standards Codification
-Section 55
-Paragraph 10
-Publisher FASB
-URI https://asc.fasb.org/1943274/2147481372/852-10-55-10
Reference 4: http://www.xbrl.org/2003/role/disclosureRef
-Topic 944
-SubTopic 210
-Name Accounting Standards Codification
-Section S99
-Paragraph 1
-Subparagraph (SX 210.7-03(a)(8))
-Publisher FASB
-URI https://asc.fasb.org/1943274/2147478777/944-210-S99-1
Reference 5: http://www.xbrl.org/2003/role/disclosureRef
-Topic 942
-SubTopic 360
-Name Accounting Standards Codification
-Section 50
-Paragraph 1
-Publisher FASB
-URI https://asc.fasb.org/1943274/2147478451/942-360-50-1
| Name: |
us-gaap_PropertyPlantAndEquipmentNet |
| Namespace Prefix: |
us-gaap_ |
| Data Type: |
xbrli:monetaryItemType |
| Balance Type: |
debit |
| Period Type: |
instant |
|
| X |
- DefinitionAmount of cash and cash equivalents restricted as to withdrawal or usage, classified as current. Cash includes, but is not limited to, currency on hand, demand deposits with banks or financial institutions, and other accounts with general characteristics of demand deposits. Cash equivalents include, but are not limited to, short-term, highly liquid investments that are both readily convertible to known amounts of cash and so near their maturity that they present insignificant risk of changes in value because of changes in interest rates. Reference 1: http://www.xbrl.org/2003/role/disclosureRef
-Topic 210
-SubTopic 10
-Name Accounting Standards Codification
-Section S99
-Paragraph 1
-Subparagraph (SX 210.5-02(1))
-Publisher FASB
-URI https://asc.fasb.org/1943274/2147480566/210-10-S99-1
Reference 2: http://www.xbrl.org/2003/role/disclosureRef
-Topic 230
-SubTopic 10
-Name Accounting Standards Codification
-Section 50
-Paragraph 8
-Publisher FASB
-URI https://asc.fasb.org/1943274/2147482913/230-10-50-8
Reference 3: http://fasb.org/us-gaap/role/ref/legacyRef
-Name Accounting Standards Codification
-Topic 230
-SubTopic 10
-Section 45
-Paragraph 4
-Publisher FASB
-URI https://asc.fasb.org/1943274/2147482740/230-10-45-4
| Name: |
us-gaap_RestrictedCashAndCashEquivalentsAtCarryingValue |
| Namespace Prefix: |
us-gaap_ |
| Data Type: |
xbrli:monetaryItemType |
| Balance Type: |
debit |
| Period Type: |
instant |
|
| X |
- DefinitionAmount of accumulated undistributed earnings (deficit). Reference 1: http://fasb.org/us-gaap/role/ref/legacyRef
-Topic 210
-SubTopic 10
-Name Accounting Standards Codification
-Section S99
-Paragraph 1
-Subparagraph (SX 210.5-02(30)(a)(3))
-Publisher FASB
-URI https://asc.fasb.org/1943274/2147480566/210-10-S99-1
Reference 2: http://www.xbrl.org/2003/role/exampleRef
-Topic 852
-SubTopic 10
-Name Accounting Standards Codification
-Section 55
-Paragraph 10
-Publisher FASB
-URI https://asc.fasb.org/1943274/2147481372/852-10-55-10
Reference 3: http://www.xbrl.org/2003/role/disclosureRef
-Topic 944
-SubTopic 40
-Name Accounting Standards Codification
-Section 65
-Paragraph 2
-Subparagraph (g)(2)(i)
-Publisher FASB
-URI https://asc.fasb.org/1943274/2147480016/944-40-65-2
Reference 4: http://www.xbrl.org/2003/role/disclosureRef
-Topic 944
-SubTopic 40
-Name Accounting Standards Codification
-Section 65
-Paragraph 2
-Subparagraph (h)(2)
-Publisher FASB
-URI https://asc.fasb.org/1943274/2147480016/944-40-65-2
Reference 5: http://www.xbrl.org/2003/role/disclosureRef
-Topic 946
-SubTopic 20
-Name Accounting Standards Codification
-Section 50
-Paragraph 11
-Publisher FASB
-URI https://asc.fasb.org/1943274/2147480990/946-20-50-11
Reference 6: http://www.xbrl.org/2003/role/disclosureRef
-Topic 944
-SubTopic 210
-Name Accounting Standards Codification
-Section S99
-Paragraph 1
-Subparagraph (SX 210.7-03(a)(23)(a)(4))
-Publisher FASB
-URI https://asc.fasb.org/1943274/2147478777/944-210-S99-1
Reference 7: http://www.xbrl.org/2003/role/disclosureRef
-Topic 946
-SubTopic 210
-Name Accounting Standards Codification
-Section S99
-Paragraph 1
-Subparagraph (SX 210.6-04(17))
-Publisher FASB
-URI https://asc.fasb.org/1943274/2147479170/946-210-S99-1
Reference 8: http://fasb.org/us-gaap/role/ref/legacyRef
-Topic 505
-SubTopic 10
-Name Accounting Standards Codification
-Section S99
-Paragraph 1
-Subparagraph (SX 210.3-04)
-Publisher FASB
-URI https://asc.fasb.org/1943274/2147480008/505-10-S99-1
| Name: |
us-gaap_RetainedEarningsAccumulatedDeficit |
| Namespace Prefix: |
us-gaap_ |
| Data Type: |
xbrli:monetaryItemType |
| Balance Type: |
credit |
| Period Type: |
instant |
|
| X |
- References
+ Details
| Name: |
us-gaap_StockholdersEquityAbstract |
| Namespace Prefix: |
us-gaap_ |
| Data Type: |
xbrli:stringItemType |
| Balance Type: |
na |
| Period Type: |
duration |
|
| X |
- DefinitionAmount of equity (deficit) attributable to parent and noncontrolling interest. Excludes temporary equity. Reference 1: http://www.xbrl.org/2003/role/disclosureRef
-Topic 250
-SubTopic 10
-Name Accounting Standards Codification
-Section 50
-Paragraph 6
-Publisher FASB
-URI https://asc.fasb.org/1943274/2147483443/250-10-50-6
Reference 2: http://www.xbrl.org/2003/role/disclosureRef
-Topic 805
-SubTopic 60
-Name Accounting Standards Codification
-Section 65
-Paragraph 1
-Subparagraph (g)
-Publisher FASB
-URI https://asc.fasb.org/1943274/2147476176/805-60-65-1
Reference 3: http://www.xbrl.org/2003/role/disclosureRef
-Topic 805
-SubTopic 60
-Name Accounting Standards Codification
-Section 65
-Paragraph 1
-Subparagraph (d)(1)
-Publisher FASB
-URI https://asc.fasb.org/1943274/2147476176/805-60-65-1
Reference 4: http://www.xbrl.org/2003/role/disclosureRef
-Topic 740
-SubTopic 323
-Name Accounting Standards Codification
-Section 65
-Paragraph 2
-Subparagraph (e)
-Publisher FASB
-URI https://asc.fasb.org/1943274/2147478666/740-323-65-2
Reference 5: http://www.xbrl.org/2003/role/disclosureRef
-Topic 740
-SubTopic 323
-Name Accounting Standards Codification
-Section 65
-Paragraph 2
-Subparagraph (g)(4)
-Publisher FASB
-URI https://asc.fasb.org/1943274/2147478666/740-323-65-2
Reference 6: http://www.xbrl.org/2003/role/disclosureRef
-Topic 740
-SubTopic 323
-Name Accounting Standards Codification
-Section 65
-Paragraph 2
-Subparagraph (d)(2)
-Publisher FASB
-URI https://asc.fasb.org/1943274/2147478666/740-323-65-2
Reference 7: http://www.xbrl.org/2003/role/disclosureRef
-Topic 740
-SubTopic 323
-Name Accounting Standards Codification
-Section 65
-Paragraph 2
-Subparagraph (d)(1)
-Publisher FASB
-URI https://asc.fasb.org/1943274/2147478666/740-323-65-2
Reference 8: http://www.xbrl.org/2003/role/disclosureRef
-Topic 848
-SubTopic 10
-Name Accounting Standards Codification
-Section 65
-Paragraph 2
-Subparagraph (a)(3)(iii)(03)
-Publisher FASB
-URI https://asc.fasb.org/1943274/2147483550/848-10-65-2
Reference 9: http://www.xbrl.org/2003/role/disclosureRef
-Topic 842
-SubTopic 10
-Name Accounting Standards Codification
-Section 65
-Paragraph 8
-Subparagraph (c)(3)
-Publisher FASB
-URI https://asc.fasb.org/1943274/2147479832/842-10-65-8
Reference 10: http://www.xbrl.org/2003/role/disclosureRef
-Topic 250
-SubTopic 10
-Name Accounting Standards Codification
-Section 45
-Paragraph 24
-Publisher FASB
-URI https://asc.fasb.org/1943274/2147483421/250-10-45-24
Reference 11: http://www.xbrl.org/2003/role/disclosureRef
-Topic 250
-SubTopic 10
-Name Accounting Standards Codification
-Section 45
-Paragraph 23
-Subparagraph (b)
-Publisher FASB
-URI https://asc.fasb.org/1943274/2147483421/250-10-45-23
Reference 12: http://www.xbrl.org/2003/role/disclosureRef
-Topic 250
-SubTopic 10
-Name Accounting Standards Codification
-Section 45
-Paragraph 5
-Subparagraph (b)
-Publisher FASB
-URI https://asc.fasb.org/1943274/2147483421/250-10-45-5
Reference 13: http://www.xbrl.org/2003/role/disclosureRef
-Topic 326
-SubTopic 10
-Name Accounting Standards Codification
-Section 65
-Paragraph 5
-Subparagraph (c)(2)
-Publisher FASB
-URI https://asc.fasb.org/1943274/2147479654/326-10-65-5
Reference 14: http://www.xbrl.org/2003/role/disclosureRef
-Topic 815
-SubTopic 20
-Name Accounting Standards Codification
-Section 65
-Paragraph 6
-Subparagraph (e)
-Publisher FASB
-URI https://asc.fasb.org/1943274/2147480528/815-20-65-6
Reference 15: http://www.xbrl.org/2003/role/disclosureRef
-Topic 815
-SubTopic 20
-Name Accounting Standards Codification
-Section 65
-Paragraph 6
-Subparagraph (h)(1)
-Publisher FASB
-URI https://asc.fasb.org/1943274/2147480528/815-20-65-6
Reference 16: http://www.xbrl.org/2003/role/disclosureRef
-Topic 815
-SubTopic 20
-Name Accounting Standards Codification
-Section 65
-Paragraph 6
-Subparagraph (h)(1)(i)
-Publisher FASB
-URI https://asc.fasb.org/1943274/2147480528/815-20-65-6
Reference 17: http://www.xbrl.org/2003/role/disclosureRef
-Topic 815
-SubTopic 20
-Name Accounting Standards Codification
-Section 65
-Paragraph 6
-Subparagraph (h)(1)(iii)
-Publisher FASB
-URI https://asc.fasb.org/1943274/2147480528/815-20-65-6
Reference 18: http://www.xbrl.org/2003/role/disclosureRef
-Topic 815
-SubTopic 20
-Name Accounting Standards Codification
-Section 65
-Paragraph 6
-Subparagraph (h)(1)(iv)
-Publisher FASB
-URI https://asc.fasb.org/1943274/2147480528/815-20-65-6
Reference 19: http://www.xbrl.org/2003/role/disclosureRef
-Topic 815
-SubTopic 20
-Name Accounting Standards Codification
-Section 65
-Paragraph 6
-Subparagraph (i)(3)
-Publisher FASB
-URI https://asc.fasb.org/1943274/2147480528/815-20-65-6
Reference 20: http://www.xbrl.org/2003/role/disclosureRef
-Topic 105
-SubTopic 10
-Name Accounting Standards Codification
-Section 65
-Paragraph 6
-Subparagraph (c)
-Publisher FASB
-URI https://asc.fasb.org/1943274/2147479343/105-10-65-6
Reference 21: http://www.xbrl.org/2003/role/disclosureRef
-Topic 105
-SubTopic 10
-Name Accounting Standards Codification
-Section 65
-Paragraph 6
-Subparagraph (d)
-Publisher FASB
-URI https://asc.fasb.org/1943274/2147479343/105-10-65-6
Reference 22: http://www.xbrl.org/2003/role/disclosureRef
-Topic 944
-SubTopic 40
-Name Accounting Standards Codification
-Section 65
-Paragraph 2
-Subparagraph (f)(1)
-Publisher FASB
-URI https://asc.fasb.org/1943274/2147480016/944-40-65-2
Reference 23: http://www.xbrl.org/2003/role/disclosureRef
-Topic 944
-SubTopic 40
-Name Accounting Standards Codification
-Section 65
-Paragraph 2
-Subparagraph (f)(2)
-Publisher FASB
-URI https://asc.fasb.org/1943274/2147480016/944-40-65-2
Reference 24: http://www.xbrl.org/2003/role/disclosureRef
-Topic 740
-SubTopic 10
-Name Accounting Standards Codification
-Section 65
-Paragraph 8
-Subparagraph (d)(2)
-Publisher FASB
-URI https://asc.fasb.org/1943274/2147482615/740-10-65-8
Reference 25: http://www.xbrl.org/2003/role/disclosureRef
-Topic 740
-SubTopic 10
-Name Accounting Standards Codification
-Section 65
-Paragraph 8
-Subparagraph (d)(3)
-Publisher FASB
-URI https://asc.fasb.org/1943274/2147482615/740-10-65-8
Reference 26: http://www.xbrl.org/2003/role/disclosureRef
-Topic 326
-SubTopic 10
-Name Accounting Standards Codification
-Section 65
-Paragraph 4
-Subparagraph (d)
-Publisher FASB
-URI https://asc.fasb.org/1943274/2147479654/326-10-65-4
Reference 27: http://www.xbrl.org/2003/role/disclosureRef
-Topic 250
-SubTopic 10
-Name Accounting Standards Codification
-Section 50
-Paragraph 1
-Subparagraph (b)(3)
-Publisher FASB
-URI https://asc.fasb.org/1943274/2147483443/250-10-50-1
Reference 28: http://www.xbrl.org/2003/role/disclosureRef
-Topic 815
-SubTopic 40
-Name Accounting Standards Codification
-Section 65
-Paragraph 1
-Subparagraph (e)(3)
-Publisher FASB
-URI https://asc.fasb.org/1943274/2147480175/815-40-65-1
Reference 29: http://www.xbrl.org/2003/role/disclosureRef
-Topic 250
-SubTopic 10
-Name Accounting Standards Codification
-Section 50
-Paragraph 7
-Subparagraph (b)
-Publisher FASB
-URI https://asc.fasb.org/1943274/2147483443/250-10-50-7
Reference 30: http://www.xbrl.org/2003/role/disclosureRef
-Topic 220
-SubTopic 10
-Name Accounting Standards Codification
-Section 50
-Paragraph 5
-Publisher FASB
-URI https://asc.fasb.org/1943274/2147482765/220-10-50-5
Reference 31: http://www.xbrl.org/2003/role/disclosureRef
-Topic 830
-SubTopic 30
-Name Accounting Standards Codification
-Section 50
-Paragraph 1
-Publisher FASB
-URI https://asc.fasb.org/1943274/2147481674/830-30-50-1
Reference 32: http://www.xbrl.org/2003/role/disclosureRef
-Topic 830
-SubTopic 30
-Name Accounting Standards Codification
-Section 45
-Paragraph 17
-Publisher FASB
-URI https://asc.fasb.org/1943274/2147481694/830-30-45-17
Reference 33: http://www.xbrl.org/2003/role/disclosureRef
-Topic 830
-SubTopic 30
-Name Accounting Standards Codification
-Section 45
-Paragraph 20
-Subparagraph (a)
-Publisher FASB
-URI https://asc.fasb.org/1943274/2147481694/830-30-45-20
Reference 34: http://www.xbrl.org/2003/role/exampleRef
-Topic 946
-SubTopic 830
-Name Accounting Standards Codification
-Section 55
-Paragraph 11
-Publisher FASB
-URI https://asc.fasb.org/1943274/2147479168/946-830-55-11
Reference 35: http://www.xbrl.org/2003/role/disclosureRef
-Topic 946
-SubTopic 205
-Name Accounting Standards Codification
-Section 45
-Paragraph 3
-Publisher FASB
-URI https://asc.fasb.org/1943274/2147478009/946-205-45-3
Reference 36: http://www.xbrl.org/2003/role/disclosureRef
-Topic 946
-SubTopic 505
-Name Accounting Standards Codification
-Section 50
-Paragraph 3
-Publisher FASB
-URI https://asc.fasb.org/1943274/2147478448/946-505-50-3
Reference 37: http://www.xbrl.org/2003/role/disclosureRef
-Topic 946
-SubTopic 210
-Name Accounting Standards Codification
-Section S99
-Paragraph 1
-Subparagraph (SX 210.6-04(19))
-Publisher FASB
-URI https://asc.fasb.org/1943274/2147479170/946-210-S99-1
Reference 38: http://www.xbrl.org/2003/role/disclosureRef
-Topic 946
-SubTopic 210
-Name Accounting Standards Codification
-Section S99
-Paragraph 2
-Subparagraph (SX 210.6-05(4))
-Publisher FASB
-URI https://asc.fasb.org/1943274/2147479170/946-210-S99-2
Reference 39: http://www.xbrl.org/2009/role/commonPracticeRef
-Topic 946
-SubTopic 220
-Name Accounting Standards Codification
-Section S99
-Paragraph 3
-Subparagraph (SX 210.6-09(4)(b))
-Publisher FASB
-URI https://asc.fasb.org/1943274/2147479134/946-220-S99-3
Reference 40: http://www.xbrl.org/2003/role/disclosureRef
-Topic 946
-SubTopic 220
-Name Accounting Standards Codification
-Section S99
-Paragraph 3
-Subparagraph (SX 210.6-09(6))
-Publisher FASB
-URI https://asc.fasb.org/1943274/2147479134/946-220-S99-3
Reference 41: http://www.xbrl.org/2003/role/disclosureRef
-Topic 946
-SubTopic 220
-Name Accounting Standards Codification
-Section S99
-Paragraph 3
-Subparagraph (SX 210.6-09(7))
-Publisher FASB
-URI https://asc.fasb.org/1943274/2147479134/946-220-S99-3
Reference 42: http://www.xbrl.org/2003/role/disclosureRef
-Topic 505
-SubTopic 10
-Name Accounting Standards Codification
-Section S99
-Paragraph 1
-Subparagraph (SX 210.3-04)
-Publisher FASB
-URI https://asc.fasb.org/1943274/2147480008/505-10-S99-1
Reference 43: http://www.xbrl.org/2009/role/commonPracticeRef
-Topic 235
-SubTopic 10
-Name Accounting Standards Codification
-Section S99
-Paragraph 1
-Subparagraph (SX 210.4-08(g)(1)(ii))
-Publisher FASB
-URI https://asc.fasb.org/1943274/2147480678/235-10-S99-1
Reference 44: http://www.xbrl.org/2009/role/commonPracticeRef
-Topic 323
-SubTopic 10
-Name Accounting Standards Codification
-Section 50
-Paragraph 3
-Subparagraph (c)
-Publisher FASB
-URI https://asc.fasb.org/1943274/2147481687/323-10-50-3
Reference 45: http://www.xbrl.org/2009/role/commonPracticeRef
-Topic 825
-SubTopic 10
-Name Accounting Standards Codification
-Section 50
-Paragraph 28
-Subparagraph (f)
-Publisher FASB
-URI https://asc.fasb.org/1943274/2147482907/825-10-50-28
Reference 46: http://fasb.org/us-gaap/role/ref/legacyRef
-Name Accounting Standards Codification
-Topic 810
-SubTopic 10
-Section 45
-Paragraph 15
-Publisher FASB
-URI https://asc.fasb.org/1943274/2147481231/810-10-45-15
Reference 47: http://fasb.org/us-gaap/role/ref/legacyRef
-Name Accounting Standards Codification
-Topic 810
-SubTopic 10
-Section 45
-Paragraph 16
-Publisher FASB
-URI https://asc.fasb.org/1943274/2147481231/810-10-45-16
Reference 48: http://fasb.org/us-gaap/role/ref/legacyRef
-Name Accounting Standards Codification
-Topic 810
-SubTopic 10
-Section 55
-Paragraph 4I
-Publisher FASB
-URI https://asc.fasb.org/1943274/2147481175/810-10-55-4I
Reference 49: http://www.xbrl.org/2003/role/disclosureRef
-Topic 350
-SubTopic 60
-Name Accounting Standards Codification
-Section 65
-Paragraph 1
-Subparagraph (b)
-Publisher FASB
-URI https://asc.fasb.org/1943274/2147476166/350-60-65-1
| Name: |
us-gaap_StockholdersEquityIncludingPortionAttributableToNoncontrollingInterest |
| Namespace Prefix: |
us-gaap_ |
| Data Type: |
xbrli:monetaryItemType |
| Balance Type: |
credit |
| Period Type: |
instant |
|
v3.24.2
Condensed Consolidated Balance Sheet (Parenthetical) - USD ($)
shares in Millions, $ in Millions |
Jun. 30, 2024 |
Dec. 31, 2023 |
| Condensed Consolidated Balance Sheet (Parenthetical) [Abstract] |
|
|
| Accumulated depreciation, property and equipment |
$ 14,919
|
$ 14,279
|
| Common stock, shares outstanding |
435
|
434
|
| Common stock, shares authorized |
1,200
|
1,200
|
| Common stock, par value |
$ 0.01
|
$ 0.01
|
| X |
- DefinitionCondensed Consolidated Balance Sheet (Parenthetical) [Abstract]
| Name: |
cci_CondensedConsolidatedBalanceSheetParentheticalAbstract |
| Namespace Prefix: |
cci_ |
| Data Type: |
xbrli:stringItemType |
| Balance Type: |
na |
| Period Type: |
duration |
|
| X |
- DefinitionAmount of accumulated depreciation, depletion and amortization for physical assets used in the normal conduct of business to produce goods and services. Reference 1: http://www.xbrl.org/2003/role/disclosureRef
-Topic 944
-SubTopic 210
-Name Accounting Standards Codification
-Section S99
-Paragraph 1
-Subparagraph (SX 210.7-03(a)(8)(b))
-Publisher FASB
-URI https://asc.fasb.org/1943274/2147478777/944-210-S99-1
Reference 2: http://www.xbrl.org/2003/role/disclosureRef
-Topic 210
-SubTopic 10
-Name Accounting Standards Codification
-Section S99
-Paragraph 1
-Subparagraph (SX 210.5-02(14))
-Publisher FASB
-URI https://asc.fasb.org/1943274/2147480566/210-10-S99-1
Reference 3: http://fasb.org/us-gaap/role/ref/legacyRef
-Name Accounting Standards Codification
-Topic 360
-SubTopic 10
-Section 50
-Paragraph 1
-Subparagraph (c)
-Publisher FASB
-URI https://asc.fasb.org/1943274/2147482099/360-10-50-1
| Name: |
us-gaap_AccumulatedDepreciationDepletionAndAmortizationPropertyPlantAndEquipment |
| Namespace Prefix: |
us-gaap_ |
| Data Type: |
xbrli:monetaryItemType |
| Balance Type: |
credit |
| Period Type: |
instant |
|
| X |
- DefinitionFace amount or stated value per share of common stock. Reference 1: http://fasb.org/us-gaap/role/ref/legacyRef
-Topic 210
-SubTopic 10
-Name Accounting Standards Codification
-Section S99
-Paragraph 1
-Subparagraph (SX 210.5-02(29))
-Publisher FASB
-URI https://asc.fasb.org/1943274/2147480566/210-10-S99-1
| Name: |
us-gaap_CommonStockParOrStatedValuePerShare |
| Namespace Prefix: |
us-gaap_ |
| Data Type: |
dtr-types:perShareItemType |
| Balance Type: |
na |
| Period Type: |
instant |
|
| X |
- DefinitionThe maximum number of common shares permitted to be issued by an entity's charter and bylaws. Reference 1: http://fasb.org/us-gaap/role/ref/legacyRef
-Topic 210
-SubTopic 10
-Name Accounting Standards Codification
-Section S99
-Paragraph 1
-Subparagraph (SX 210.5-02(29))
-Publisher FASB
-URI https://asc.fasb.org/1943274/2147480566/210-10-S99-1
Reference 2: http://www.xbrl.org/2003/role/disclosureRef
-Topic 946
-SubTopic 210
-Name Accounting Standards Codification
-Section S99
-Paragraph 1
-Subparagraph (SX 210.6-04(16)(a))
-Publisher FASB
-URI https://asc.fasb.org/1943274/2147479170/946-210-S99-1
| Name: |
us-gaap_CommonStockSharesAuthorized |
| Namespace Prefix: |
us-gaap_ |
| Data Type: |
xbrli:sharesItemType |
| Balance Type: |
na |
| Period Type: |
instant |
|
| X |
- DefinitionNumber of shares of common stock outstanding. Common stock represent the ownership interest in a corporation. Reference 1: http://fasb.org/us-gaap/role/ref/legacyRef
-Name Accounting Standards Codification
-Section 50
-Paragraph 2
-SubTopic 10
-Topic 505
-Publisher FASB
-URI https://asc.fasb.org/1943274/2147481112/505-10-50-2
Reference 2: http://fasb.org/us-gaap/role/ref/legacyRef
-Topic 210
-SubTopic 10
-Name Accounting Standards Codification
-Section S99
-Paragraph 1
-Subparagraph (SX 210.5-02(29))
-Publisher FASB
-URI https://asc.fasb.org/1943274/2147480566/210-10-S99-1
Reference 3: http://www.xbrl.org/2003/role/disclosureRef
-Topic 946
-SubTopic 210
-Name Accounting Standards Codification
-Section S99
-Paragraph 2
-Subparagraph (SX 210.6-05(4))
-Publisher FASB
-URI https://asc.fasb.org/1943274/2147479170/946-210-S99-2
Reference 4: http://www.xbrl.org/2009/role/commonPracticeRef
-Topic 946
-SubTopic 220
-Name Accounting Standards Codification
-Section S99
-Paragraph 3
-Subparagraph (SX 210.6-09(4)(b))
-Publisher FASB
-URI https://asc.fasb.org/1943274/2147479134/946-220-S99-3
Reference 5: http://www.xbrl.org/2003/role/disclosureRef
-Topic 946
-SubTopic 210
-Name Accounting Standards Codification
-Section S99
-Paragraph 1
-Subparagraph (SX 210.6-04(16)(a))
-Publisher FASB
-URI https://asc.fasb.org/1943274/2147479170/946-210-S99-1
Reference 6: http://www.xbrl.org/2009/role/commonPracticeRef
-Topic 946
-SubTopic 220
-Name Accounting Standards Codification
-Section S99
-Paragraph 3
-Subparagraph (SX 210.6-09(7))
-Publisher FASB
-URI https://asc.fasb.org/1943274/2147479134/946-220-S99-3
| Name: |
us-gaap_CommonStockSharesOutstanding |
| Namespace Prefix: |
us-gaap_ |
| Data Type: |
xbrli:sharesItemType |
| Balance Type: |
na |
| Period Type: |
instant |
|
v3.24.2
Condensed Consolidated Statement of Operations and Comprehensive Income (Loss) - USD ($)
shares in Millions, $ in Millions |
3 Months Ended |
6 Months Ended |
Jun. 30, 2024 |
Jun. 30, 2023 |
Jun. 30, 2024 |
Jun. 30, 2023 |
| Net revenues: |
|
|
|
|
|
| Site Rental |
|
$ 1,580
|
$ 1,728
|
$ 3,168
|
$ 3,352
|
| Services and other |
|
46
|
139
|
99
|
288
|
| Net Revenues |
|
1,626
|
1,867
|
3,267
|
3,640
|
| Operating expenses: |
|
|
|
|
|
| Site rental |
[1] |
432
|
424
|
862
|
839
|
| Services and other |
[1] |
27
|
98
|
61
|
202
|
| Selling, general and administrative |
|
204
|
210
|
387
|
405
|
| Asset write-down charges |
|
3
|
22
|
9
|
22
|
| Acquisition and integration costs |
|
0
|
1
|
0
|
1
|
| Depreciation, amortization and accretion |
|
430
|
445
|
869
|
876
|
| Restructuring Charges |
|
45
|
0
|
56
|
|
| Total operating expenses |
|
1,141
|
1,200
|
2,244
|
2,345
|
| Operating income (loss) |
|
485
|
667
|
1,023
|
1,295
|
| Interest expense and amortization of deferred financing costs, net |
|
(230)
|
(208)
|
(456)
|
(410)
|
| Interest income |
|
4
|
5
|
8
|
7
|
| Other income (expense) |
|
(1)
|
(2)
|
1
|
(4)
|
| Income (Loss) from Continuing Operations before Income Taxes, Noncontrolling Interest |
|
258
|
462
|
576
|
888
|
| Benefit (provision) for income taxes |
|
(7)
|
(7)
|
(14)
|
(14)
|
| Net Income (Loss) Attributable to Parent |
|
251
|
455
|
562
|
874
|
| Foreign currency translation adjustments |
[2] |
0
|
1
|
(1)
|
0
|
| Total other comprehensive income (loss) |
[2] |
0
|
1
|
(1)
|
0
|
| Comprehensive Income (Loss), Net of Tax, Attributable to Parent |
|
$ 251
|
$ 456
|
$ 561
|
$ 874
|
| Earnings Per Share, Basic |
|
$ 0.58
|
$ 1.05
|
$ 1.29
|
$ 2.02
|
| Earnings Per Share, Diluted |
|
$ 0.58
|
$ 1.05
|
$ 1.29
|
$ 2.01
|
| Weighted-average common shares outstanding, basic |
|
435
|
434
|
434
|
433
|
| Weighted-average common shares outstanding, diluted |
|
435
|
434
|
435
|
434
|
|
|
| X |
- DefinitionThis element represents acquisition and integration related costs incurred to effect a business combination which costs have been expensed during the period. Such costs include finder's fees; advisory, legal, accounting, valuation, and other professional or consulting fees; general administrative costs; integration costs; and may include costs of registering and issuing debt and equity securities.
| Name: |
cci_AcquisitionAndIntegrationCosts |
| Namespace Prefix: |
cci_ |
| Data Type: |
xbrli:monetaryItemType |
| Balance Type: |
debit |
| Period Type: |
duration |
|
| X |
- DefinitionContains revenue from accounted under both Topic 606 (Finance leases) and Topic 842 (Operating leases)
| Name: |
cci_Siterentalrevenues |
| Namespace Prefix: |
cci_ |
| Data Type: |
xbrli:monetaryItemType |
| Balance Type: |
credit |
| Period Type: |
duration |
|
| X |
- DefinitionAmount of write-down of assets recognized in the income statement. Includes, but is not limited to, losses from tangible assets, intangible assets and goodwill. Reference 1: http://fasb.org/us-gaap/role/ref/legacyRef
-Name Accounting Standards Codification
-Section 45
-Paragraph 28
-Subparagraph (b)
-SubTopic 10
-Topic 230
-Publisher FASB
-URI https://asc.fasb.org/1943274/2147482740/230-10-45-28
Reference 2: http://fasb.org/us-gaap/role/ref/legacyRef
-Name Accounting Standards Codification
-Topic 360
-SubTopic 10
-Section 45
-Paragraph 4
-Publisher FASB
-URI https://asc.fasb.org/1943274/2147482130/360-10-45-4
| Name: |
us-gaap_AssetImpairmentCharges |
| Namespace Prefix: |
us-gaap_ |
| Data Type: |
xbrli:monetaryItemType |
| Balance Type: |
debit |
| Period Type: |
duration |
|
| X |
- DefinitionAmount after tax of increase (decrease) in equity from transactions and other events and circumstances from net income and other comprehensive income, attributable to parent entity. Excludes changes in equity resulting from investments by owners and distributions to owners. Reference 1: http://www.xbrl.org/2003/role/disclosureRef
-Topic 220
-SubTopic 10
-Name Accounting Standards Codification
-Section S99
-Paragraph 2
-Subparagraph (SX 210.5-03(24))
-Publisher FASB
-URI https://asc.fasb.org/1943274/2147483621/220-10-S99-2
Reference 2: http://www.xbrl.org/2003/role/disclosureRef
-Topic 942
-SubTopic 220
-Name Accounting Standards Codification
-Section S99
-Paragraph 1
-Subparagraph (SX 210.9-04(26))
-Publisher FASB
-URI https://asc.fasb.org/1943274/2147478524/942-220-S99-1
Reference 3: http://www.xbrl.org/2003/role/disclosureRef
-Topic 944
-SubTopic 220
-Name Accounting Standards Codification
-Section S99
-Paragraph 1
-Subparagraph (SX 210.7-04(22))
-Publisher FASB
-URI https://asc.fasb.org/1943274/2147477250/944-220-S99-1
Reference 4: http://www.xbrl.org/2003/role/disclosureRef
-Topic 220
-SubTopic 10
-Name Accounting Standards Codification
-Section 45
-Paragraph 1A
-Subparagraph (c)
-Publisher FASB
-URI https://asc.fasb.org/1943274/2147482790/220-10-45-1A
Reference 5: http://www.xbrl.org/2003/role/disclosureRef
-Topic 220
-SubTopic 10
-Name Accounting Standards Codification
-Section 45
-Paragraph 1B
-Subparagraph (b)
-Publisher FASB
-URI https://asc.fasb.org/1943274/2147482790/220-10-45-1B
Reference 6: http://www.xbrl.org/2003/role/disclosureRef
-Topic 944
-SubTopic 220
-Name Accounting Standards Codification
-Section S99
-Paragraph 1
-Subparagraph (SX 210.7-04(20))
-Publisher FASB
-URI https://asc.fasb.org/1943274/2147477250/944-220-S99-1
Reference 7: http://fasb.org/us-gaap/role/ref/legacyRef
-Name Accounting Standards Codification
-Topic 220
-SubTopic 10
-Section 45
-Paragraph 5
-Publisher FASB
-URI https://asc.fasb.org/1943274/2147482790/220-10-45-5
| Name: |
us-gaap_ComprehensiveIncomeNetOfTax |
| Namespace Prefix: |
us-gaap_ |
| Data Type: |
xbrli:monetaryItemType |
| Balance Type: |
credit |
| Period Type: |
duration |
|
| X |
- DefinitionThe aggregate costs related to goods produced and sold and services rendered by an entity during the reporting period. This excludes costs incurred during the reporting period related to financial services rendered and other revenue generating activities. Reference 1: http://fasb.org/us-gaap/role/ref/legacyRef
-Topic 220
-SubTopic 10
-Name Accounting Standards Codification
-Section S99
-Paragraph 2
-Subparagraph (SX 210.5-03(2)(d))
-Publisher FASB
-URI https://asc.fasb.org/1943274/2147483621/220-10-S99-2
Reference 2: http://fasb.org/us-gaap/role/ref/legacyRef
-Topic 220
-SubTopic 10
-Name Accounting Standards Codification
-Section S99
-Paragraph 2
-Subparagraph (SX 210.5-03(2)(a))
-Publisher FASB
-URI https://asc.fasb.org/1943274/2147483621/220-10-S99-2
Reference 3: http://www.xbrl.org/2003/role/disclosureRef
-Topic 924
-SubTopic 10
-Name Accounting Standards Codification
-Section S99
-Paragraph 1
-Subparagraph (SAB Topic 11.L)
-Publisher FASB
-URI https://asc.fasb.org/1943274/2147479941/924-10-S99-1
| Name: |
us-gaap_CostOfGoodsAndServicesSold |
| Namespace Prefix: |
us-gaap_ |
| Data Type: |
xbrli:monetaryItemType |
| Balance Type: |
debit |
| Period Type: |
duration |
|
| X |
- DefinitionTotal costs of sales and operating expenses for the period. Reference 1: http://fasb.org/us-gaap/role/ref/legacyRef
-Topic 220
-SubTopic 10
-Name Accounting Standards Codification
-Section S99
-Paragraph 2
-Subparagraph (SX 210.5-03)
-Publisher FASB
-URI https://asc.fasb.org/1943274/2147483621/220-10-S99-2
| Name: |
us-gaap_CostsAndExpenses |
| Namespace Prefix: |
us-gaap_ |
| Data Type: |
xbrli:monetaryItemType |
| Balance Type: |
debit |
| Period Type: |
duration |
|
| X |
- DefinitionThe aggregate net amount of depreciation, amortization, and accretion recognized during an accounting period. As a noncash item, the net amount is added back to net income when calculating cash provided by or used in operations using the indirect method. Reference 1: http://fasb.org/us-gaap/role/ref/legacyRef
-Name Accounting Standards Codification
-Section 45
-Paragraph 28
-Subparagraph (b)
-SubTopic 10
-Topic 230
-Publisher FASB
-URI https://asc.fasb.org/1943274/2147482740/230-10-45-28
| Name: |
us-gaap_DepreciationAmortizationAndAccretionNet |
| Namespace Prefix: |
us-gaap_ |
| Data Type: |
xbrli:monetaryItemType |
| Balance Type: |
debit |
| Period Type: |
duration |
|
| X |
- DefinitionAmount of expense incurred and directly related to generating revenue by lessor from operating lease of rented property and equipment. Reference 1: http://www.xbrl.org/2009/role/commonPracticeRef
-Name Accounting Standards Codification
-Section S99
-Paragraph 2
-Subparagraph (SX 210.5-03(2)(c))
-SubTopic 10
-Topic 220
-Publisher FASB
-URI https://asc.fasb.org/1943274/2147483621/220-10-S99-2
| Name: |
us-gaap_DirectCostsOfLeasedAndRentedPropertyOrEquipment |
| Namespace Prefix: |
us-gaap_ |
| Data Type: |
xbrli:monetaryItemType |
| Balance Type: |
debit |
| Period Type: |
duration |
|
| X |
- DefinitionThe amount of net income (loss) for the period per each share of common stock or unit outstanding during the reporting period. Reference 1: http://www.xbrl.org/2003/role/disclosureRef
-Topic 250
-SubTopic 10
-Name Accounting Standards Codification
-Section 50
-Paragraph 6
-Publisher FASB
-URI https://asc.fasb.org/1943274/2147483443/250-10-50-6
Reference 2: http://www.xbrl.org/2003/role/exampleRef
-Topic 260
-SubTopic 10
-Name Accounting Standards Codification
-Section 55
-Paragraph 52
-Publisher FASB
-URI https://asc.fasb.org/1943274/2147482635/260-10-55-52
Reference 3: http://www.xbrl.org/2003/role/disclosureRef
-Topic 805
-SubTopic 60
-Name Accounting Standards Codification
-Section 65
-Paragraph 1
-Subparagraph (g)
-Publisher FASB
-URI https://asc.fasb.org/1943274/2147476176/805-60-65-1
Reference 4: http://www.xbrl.org/2003/role/disclosureRef
-Topic 740
-SubTopic 323
-Name Accounting Standards Codification
-Section 65
-Paragraph 2
-Subparagraph (g)(3)
-Publisher FASB
-URI https://asc.fasb.org/1943274/2147478666/740-323-65-2
Reference 5: http://www.xbrl.org/2003/role/disclosureRef
-Topic 250
-SubTopic 10
-Name Accounting Standards Codification
-Section 50
-Paragraph 3
-Publisher FASB
-URI https://asc.fasb.org/1943274/2147483443/250-10-50-3
Reference 6: http://www.xbrl.org/2003/role/disclosureRef
-Topic 260
-SubTopic 10
-Name Accounting Standards Codification
-Section 55
-Paragraph 15
-Publisher FASB
-URI https://asc.fasb.org/1943274/2147482635/260-10-55-15
Reference 7: http://www.xbrl.org/2003/role/disclosureRef
-Topic 815
-SubTopic 40
-Name Accounting Standards Codification
-Section 65
-Paragraph 1
-Subparagraph (e)(4)
-Publisher FASB
-URI https://asc.fasb.org/1943274/2147480175/815-40-65-1
Reference 8: http://www.xbrl.org/2003/role/disclosureRef
-Topic 815
-SubTopic 40
-Name Accounting Standards Codification
-Section 65
-Paragraph 1
-Subparagraph (f)
-Publisher FASB
-URI https://asc.fasb.org/1943274/2147480175/815-40-65-1
Reference 9: http://www.xbrl.org/2003/role/disclosureRef
-Topic 250
-SubTopic 10
-Name Accounting Standards Codification
-Section 50
-Paragraph 11
-Subparagraph (a)
-Publisher FASB
-URI https://asc.fasb.org/1943274/2147483443/250-10-50-11
Reference 10: http://www.xbrl.org/2003/role/disclosureRef
-Topic 250
-SubTopic 10
-Name Accounting Standards Codification
-Section 50
-Paragraph 11
-Subparagraph (b)
-Publisher FASB
-URI https://asc.fasb.org/1943274/2147483443/250-10-50-11
Reference 11: http://www.xbrl.org/2003/role/disclosureRef
-Topic 250
-SubTopic 10
-Name Accounting Standards Codification
-Section 50
-Paragraph 7
-Subparagraph (a)
-Publisher FASB
-URI https://asc.fasb.org/1943274/2147483443/250-10-50-7
Reference 12: http://www.xbrl.org/2003/role/disclosureRef
-Topic 260
-SubTopic 10
-Name Accounting Standards Codification
-Section 45
-Paragraph 2
-Publisher FASB
-URI https://asc.fasb.org/1943274/2147482689/260-10-45-2
Reference 13: http://www.xbrl.org/2003/role/disclosureRef
-Topic 260
-SubTopic 10
-Name Accounting Standards Codification
-Section 45
-Paragraph 60B
-Subparagraph (d)
-Publisher FASB
-URI https://asc.fasb.org/1943274/2147482689/260-10-45-60B
Reference 14: http://www.xbrl.org/2003/role/disclosureRef
-Topic 250
-SubTopic 10
-Name Accounting Standards Codification
-Section 50
-Paragraph 4
-Publisher FASB
-URI https://asc.fasb.org/1943274/2147483443/250-10-50-4
Reference 15: http://www.xbrl.org/2003/role/disclosureRef
-Topic 260
-SubTopic 10
-Name Accounting Standards Codification
-Section 50
-Paragraph 1
-Subparagraph (a)
-Publisher FASB
-URI https://asc.fasb.org/1943274/2147482662/260-10-50-1
Reference 16: http://www.xbrl.org/2003/role/disclosureRef
-Topic 260
-SubTopic 10
-Name Accounting Standards Codification
-Section 45
-Paragraph 10
-Publisher FASB
-URI https://asc.fasb.org/1943274/2147482689/260-10-45-10
Reference 17: http://www.xbrl.org/2003/role/disclosureRef
-Topic 220
-SubTopic 10
-Name Accounting Standards Codification
-Section S99
-Paragraph 2
-Subparagraph (SX 210.5-03(25))
-Publisher FASB
-URI https://asc.fasb.org/1943274/2147483621/220-10-S99-2
Reference 18: http://www.xbrl.org/2003/role/disclosureRef
-Topic 942
-SubTopic 220
-Name Accounting Standards Codification
-Section S99
-Paragraph 1
-Subparagraph (SX 210.9-04(27))
-Publisher FASB
-URI https://asc.fasb.org/1943274/2147478524/942-220-S99-1
Reference 19: http://www.xbrl.org/2003/role/disclosureRef
-Topic 944
-SubTopic 220
-Name Accounting Standards Codification
-Section S99
-Paragraph 1
-Subparagraph (SX 210.7-04(23))
-Publisher FASB
-URI https://asc.fasb.org/1943274/2147477250/944-220-S99-1
Reference 20: http://www.xbrl.org/2003/role/disclosureRef
-Topic 260
-SubTopic 10
-Name Accounting Standards Codification
-Section 45
-Paragraph 7
-Publisher FASB
-URI https://asc.fasb.org/1943274/2147482689/260-10-45-7
| Name: |
us-gaap_EarningsPerShareBasic |
| Namespace Prefix: |
us-gaap_ |
| Data Type: |
dtr-types:perShareItemType |
| Balance Type: |
na |
| Period Type: |
duration |
|
| X |
- DefinitionThe amount of net income (loss) for the period available to each share of common stock or common unit outstanding during the reporting period and to each share or unit that would have been outstanding assuming the issuance of common shares or units for all dilutive potential common shares or units outstanding during the reporting period. Reference 1: http://www.xbrl.org/2003/role/disclosureRef
-Topic 250
-SubTopic 10
-Name Accounting Standards Codification
-Section 50
-Paragraph 6
-Publisher FASB
-URI https://asc.fasb.org/1943274/2147483443/250-10-50-6
Reference 2: http://www.xbrl.org/2003/role/exampleRef
-Topic 260
-SubTopic 10
-Name Accounting Standards Codification
-Section 55
-Paragraph 52
-Publisher FASB
-URI https://asc.fasb.org/1943274/2147482635/260-10-55-52
Reference 3: http://www.xbrl.org/2003/role/disclosureRef
-Topic 805
-SubTopic 60
-Name Accounting Standards Codification
-Section 65
-Paragraph 1
-Subparagraph (g)
-Publisher FASB
-URI https://asc.fasb.org/1943274/2147476176/805-60-65-1
Reference 4: http://www.xbrl.org/2003/role/disclosureRef
-Topic 740
-SubTopic 323
-Name Accounting Standards Codification
-Section 65
-Paragraph 2
-Subparagraph (g)(3)
-Publisher FASB
-URI https://asc.fasb.org/1943274/2147478666/740-323-65-2
Reference 5: http://www.xbrl.org/2003/role/disclosureRef
-Topic 250
-SubTopic 10
-Name Accounting Standards Codification
-Section 50
-Paragraph 3
-Publisher FASB
-URI https://asc.fasb.org/1943274/2147483443/250-10-50-3
Reference 6: http://www.xbrl.org/2003/role/disclosureRef
-Topic 260
-SubTopic 10
-Name Accounting Standards Codification
-Section 55
-Paragraph 15
-Publisher FASB
-URI https://asc.fasb.org/1943274/2147482635/260-10-55-15
Reference 7: http://www.xbrl.org/2003/role/disclosureRef
-Topic 815
-SubTopic 40
-Name Accounting Standards Codification
-Section 65
-Paragraph 1
-Subparagraph (e)(4)
-Publisher FASB
-URI https://asc.fasb.org/1943274/2147480175/815-40-65-1
Reference 8: http://www.xbrl.org/2003/role/disclosureRef
-Topic 815
-SubTopic 40
-Name Accounting Standards Codification
-Section 65
-Paragraph 1
-Subparagraph (f)
-Publisher FASB
-URI https://asc.fasb.org/1943274/2147480175/815-40-65-1
Reference 9: http://www.xbrl.org/2003/role/disclosureRef
-Topic 250
-SubTopic 10
-Name Accounting Standards Codification
-Section 50
-Paragraph 11
-Subparagraph (a)
-Publisher FASB
-URI https://asc.fasb.org/1943274/2147483443/250-10-50-11
Reference 10: http://www.xbrl.org/2003/role/disclosureRef
-Topic 250
-SubTopic 10
-Name Accounting Standards Codification
-Section 50
-Paragraph 11
-Subparagraph (b)
-Publisher FASB
-URI https://asc.fasb.org/1943274/2147483443/250-10-50-11
Reference 11: http://www.xbrl.org/2003/role/disclosureRef
-Topic 250
-SubTopic 10
-Name Accounting Standards Codification
-Section 50
-Paragraph 7
-Subparagraph (a)
-Publisher FASB
-URI https://asc.fasb.org/1943274/2147483443/250-10-50-7
Reference 12: http://www.xbrl.org/2003/role/disclosureRef
-Topic 260
-SubTopic 10
-Name Accounting Standards Codification
-Section 45
-Paragraph 2
-Publisher FASB
-URI https://asc.fasb.org/1943274/2147482689/260-10-45-2
Reference 13: http://www.xbrl.org/2003/role/disclosureRef
-Topic 260
-SubTopic 10
-Name Accounting Standards Codification
-Section 45
-Paragraph 60B
-Subparagraph (d)
-Publisher FASB
-URI https://asc.fasb.org/1943274/2147482689/260-10-45-60B
Reference 14: http://www.xbrl.org/2003/role/disclosureRef
-Topic 250
-SubTopic 10
-Name Accounting Standards Codification
-Section 50
-Paragraph 4
-Publisher FASB
-URI https://asc.fasb.org/1943274/2147483443/250-10-50-4
Reference 15: http://www.xbrl.org/2003/role/disclosureRef
-Topic 260
-SubTopic 10
-Name Accounting Standards Codification
-Section 50
-Paragraph 1
-Subparagraph (a)
-Publisher FASB
-URI https://asc.fasb.org/1943274/2147482662/260-10-50-1
Reference 16: http://www.xbrl.org/2003/role/disclosureRef
-Topic 220
-SubTopic 10
-Name Accounting Standards Codification
-Section S99
-Paragraph 2
-Subparagraph (SX 210.5-03(25))
-Publisher FASB
-URI https://asc.fasb.org/1943274/2147483621/220-10-S99-2
Reference 17: http://www.xbrl.org/2003/role/disclosureRef
-Topic 942
-SubTopic 220
-Name Accounting Standards Codification
-Section S99
-Paragraph 1
-Subparagraph (SX 210.9-04(27))
-Publisher FASB
-URI https://asc.fasb.org/1943274/2147478524/942-220-S99-1
Reference 18: http://www.xbrl.org/2003/role/disclosureRef
-Topic 944
-SubTopic 220
-Name Accounting Standards Codification
-Section S99
-Paragraph 1
-Subparagraph (SX 210.7-04(23))
-Publisher FASB
-URI https://asc.fasb.org/1943274/2147477250/944-220-S99-1
Reference 19: http://www.xbrl.org/2003/role/disclosureRef
-Topic 260
-SubTopic 10
-Name Accounting Standards Codification
-Section 45
-Paragraph 7
-Publisher FASB
-URI https://asc.fasb.org/1943274/2147482689/260-10-45-7
| Name: |
us-gaap_EarningsPerShareDiluted |
| Namespace Prefix: |
us-gaap_ |
| Data Type: |
dtr-types:perShareItemType |
| Balance Type: |
na |
| Period Type: |
duration |
|
| X |
- DefinitionAmount of the cost of borrowed funds accounted for as interest expense for debt. Reference 1: http://fasb.org/us-gaap/role/ref/legacyRef
-Topic 220
-SubTopic 10
-Name Accounting Standards Codification
-Section S99
-Paragraph 2
-Subparagraph (SX 210.5-03(8))
-Publisher FASB
-URI https://asc.fasb.org/1943274/2147483621/220-10-S99-2
Reference 2: http://www.xbrl.org/2003/role/exampleRef
-Topic 470
-SubTopic 20
-Name Accounting Standards Codification
-Section 55
-Paragraph 69E
-Publisher FASB
-URI https://asc.fasb.org/1943274/2147481568/470-20-55-69E
Reference 3: http://www.xbrl.org/2003/role/exampleRef
-Topic 470
-SubTopic 20
-Name Accounting Standards Codification
-Section 55
-Paragraph 69F
-Publisher FASB
-URI https://asc.fasb.org/1943274/2147481568/470-20-55-69F
Reference 4: http://www.xbrl.org/2003/role/disclosureRef
-Topic 470
-SubTopic 20
-Name Accounting Standards Codification
-Section 50
-Paragraph 1F
-Subparagraph (b)
-Publisher FASB
-URI https://asc.fasb.org/1943274/2147481139/470-20-50-1F
Reference 5: http://www.xbrl.org/2003/role/disclosureRef
-Topic 470
-SubTopic 20
-Name Accounting Standards Codification
-Section 50
-Paragraph 6
-Subparagraph (b)
-Publisher FASB
-URI https://asc.fasb.org/1943274/2147481139/470-20-50-6
| Name: |
us-gaap_InterestExpenseDebt |
| Namespace Prefix: |
us-gaap_ |
| Data Type: |
xbrli:monetaryItemType |
| Balance Type: |
debit |
| Period Type: |
duration |
|
| X |
- DefinitionAmount before accretion (amortization) of purchase discount (premium) of interest income on nonoperating securities. Reference 1: http://www.xbrl.org/2003/role/disclosureRef
-Topic 280
-SubTopic 10
-Name Accounting Standards Codification
-Section 50
-Paragraph 22
-Subparagraph (c)
-Publisher FASB
-URI https://asc.fasb.org/1943274/2147482810/280-10-50-22
Reference 2: http://www.xbrl.org/2003/role/exampleRef
-Topic 280
-SubTopic 10
-Name Accounting Standards Codification
-Section 55
-Paragraph 48
-Publisher FASB
-URI https://asc.fasb.org/1943274/2147482785/280-10-55-48
Reference 3: http://www.xbrl.org/2009/role/commonPracticeRef
-Topic 220
-SubTopic 10
-Name Accounting Standards Codification
-Section S99
-Paragraph 2
-Subparagraph (SX 210.5-03(7)(b))
-Publisher FASB
-URI https://asc.fasb.org/1943274/2147483621/220-10-S99-2
Reference 4: http://www.xbrl.org/2003/role/disclosureRef
-Topic 270
-SubTopic 10
-Name Accounting Standards Codification
-Section 50
-Paragraph 1
-Subparagraph (i)
-Publisher FASB
-URI https://asc.fasb.org/1943274/2147482964/270-10-50-1
Reference 5: http://www.xbrl.org/2003/role/disclosureRef
-Topic 280
-SubTopic 10
-Name Accounting Standards Codification
-Section 50
-Paragraph 32
-Subparagraph (ee)
-Publisher FASB
-URI https://asc.fasb.org/1943274/2147482810/280-10-50-32
| Name: |
us-gaap_InvestmentIncomeInterest |
| Namespace Prefix: |
us-gaap_ |
| Data Type: |
xbrli:monetaryItemType |
| Balance Type: |
credit |
| Period Type: |
duration |
|
| X |
- DefinitionThe portion of profit or loss for the period, net of income taxes, which is attributable to the parent. Reference 1: http://www.xbrl.org/2003/role/disclosureRef
-Topic 250
-SubTopic 10
-Name Accounting Standards Codification
-Section 50
-Paragraph 6
-Publisher FASB
-URI https://asc.fasb.org/1943274/2147483443/250-10-50-6
Reference 2: http://www.xbrl.org/2003/role/disclosureRef
-Topic 250
-SubTopic 10
-Name Accounting Standards Codification
-Section 50
-Paragraph 9
-Publisher FASB
-URI https://asc.fasb.org/1943274/2147483443/250-10-50-9
Reference 3: http://www.xbrl.org/2003/role/disclosureRef
-Topic 805
-SubTopic 60
-Name Accounting Standards Codification
-Section 65
-Paragraph 1
-Subparagraph (g)
-Publisher FASB
-URI https://asc.fasb.org/1943274/2147476176/805-60-65-1
Reference 4: http://www.xbrl.org/2003/role/disclosureRef
-Topic 740
-SubTopic 323
-Name Accounting Standards Codification
-Section 65
-Paragraph 2
-Subparagraph (g)(3)
-Publisher FASB
-URI https://asc.fasb.org/1943274/2147478666/740-323-65-2
Reference 5: http://fasb.org/us-gaap/role/ref/legacyRef
-Topic 220
-SubTopic 10
-Name Accounting Standards Codification
-Section S99
-Paragraph 2
-Subparagraph (SX 210.5-03(20))
-Publisher FASB
-URI https://asc.fasb.org/1943274/2147483621/220-10-S99-2
Reference 6: http://www.xbrl.org/2003/role/disclosureRef
-Topic 235
-SubTopic 10
-Name Accounting Standards Codification
-Section S99
-Paragraph 1
-Subparagraph (SX 210.4-08(g)(1)(ii))
-Publisher FASB
-URI https://asc.fasb.org/1943274/2147480678/235-10-S99-1
Reference 7: http://www.xbrl.org/2003/role/disclosureRef
-Topic 323
-SubTopic 10
-Name Accounting Standards Codification
-Section 50
-Paragraph 3
-Subparagraph (c)
-Publisher FASB
-URI https://asc.fasb.org/1943274/2147481687/323-10-50-3
Reference 8: http://www.xbrl.org/2003/role/disclosureRef
-Topic 825
-SubTopic 10
-Name Accounting Standards Codification
-Section 50
-Paragraph 28
-Subparagraph (f)
-Publisher FASB
-URI https://asc.fasb.org/1943274/2147482907/825-10-50-28
Reference 9: http://www.xbrl.org/2003/role/disclosureRef
-Topic 220
-SubTopic 10
-Name Accounting Standards Codification
-Section 50
-Paragraph 6
-Publisher FASB
-URI https://asc.fasb.org/1943274/2147482765/220-10-50-6
Reference 10: http://www.xbrl.org/2003/role/disclosureRef
-Topic 250
-SubTopic 10
-Name Accounting Standards Codification
-Section 50
-Paragraph 3
-Publisher FASB
-URI https://asc.fasb.org/1943274/2147483443/250-10-50-3
Reference 11: http://www.xbrl.org/2003/role/disclosureRef
-Topic 250
-SubTopic 10
-Name Accounting Standards Codification
-Section 50
-Paragraph 1
-Subparagraph (b)(2)
-Publisher FASB
-URI https://asc.fasb.org/1943274/2147483443/250-10-50-1
Reference 12: http://www.xbrl.org/2003/role/disclosureRef
-Topic 815
-SubTopic 40
-Name Accounting Standards Codification
-Section 65
-Paragraph 1
-Subparagraph (f)
-Publisher FASB
-URI https://asc.fasb.org/1943274/2147480175/815-40-65-1
Reference 13: http://www.xbrl.org/2003/role/disclosureRef
-Topic 250
-SubTopic 10
-Name Accounting Standards Codification
-Section 50
-Paragraph 8
-Publisher FASB
-URI https://asc.fasb.org/1943274/2147483443/250-10-50-8
Reference 14: http://www.xbrl.org/2003/role/disclosureRef
-Topic 250
-SubTopic 10
-Name Accounting Standards Codification
-Section 50
-Paragraph 11
-Subparagraph (a)
-Publisher FASB
-URI https://asc.fasb.org/1943274/2147483443/250-10-50-11
Reference 15: http://www.xbrl.org/2003/role/disclosureRef
-Topic 250
-SubTopic 10
-Name Accounting Standards Codification
-Section 50
-Paragraph 11
-Subparagraph (b)
-Publisher FASB
-URI https://asc.fasb.org/1943274/2147483443/250-10-50-11
Reference 16: http://www.xbrl.org/2003/role/disclosureRef
-Topic 250
-SubTopic 10
-Name Accounting Standards Codification
-Section 50
-Paragraph 4
-Publisher FASB
-URI https://asc.fasb.org/1943274/2147483443/250-10-50-4
Reference 17: http://www.xbrl.org/2003/role/exampleRef
-Topic 946
-SubTopic 830
-Name Accounting Standards Codification
-Section 55
-Paragraph 10
-Publisher FASB
-URI https://asc.fasb.org/1943274/2147479168/946-830-55-10
Reference 18: http://www.xbrl.org/2003/role/disclosureRef
-Topic 946
-SubTopic 220
-Name Accounting Standards Codification
-Section 45
-Paragraph 7
-Publisher FASB
-URI https://asc.fasb.org/1943274/2147479105/946-220-45-7
Reference 19: http://www.xbrl.org/2003/role/disclosureRef
-Topic 944
-SubTopic 220
-Name Accounting Standards Codification
-Section S99
-Paragraph 1
-Subparagraph (SX 210.7-04(18))
-Publisher FASB
-URI https://asc.fasb.org/1943274/2147477250/944-220-S99-1
Reference 20: http://www.xbrl.org/2003/role/disclosureRef
-Topic 946
-SubTopic 220
-Name Accounting Standards Codification
-Section S99
-Paragraph 1
-Subparagraph (SX 210.6-07(9))
-Publisher FASB
-URI https://asc.fasb.org/1943274/2147479134/946-220-S99-1
Reference 21: http://www.xbrl.org/2003/role/disclosureRef
-Topic 946
-SubTopic 220
-Name Accounting Standards Codification
-Section S99
-Paragraph 3
-Subparagraph (SX 210.6-09(1)(d))
-Publisher FASB
-URI https://asc.fasb.org/1943274/2147479134/946-220-S99-3
Reference 22: http://www.xbrl.org/2003/role/disclosureRef
-Topic 470
-SubTopic 10
-Name Accounting Standards Codification
-Section S99
-Paragraph 1A
-Subparagraph (SX 210.13-01(a)(4)(i))
-Publisher FASB
-URI https://asc.fasb.org/1943274/2147480097/470-10-S99-1A
Reference 23: http://www.xbrl.org/2009/role/commonPracticeRef
-Topic 470
-SubTopic 10
-Name Accounting Standards Codification
-Section S99
-Paragraph 1A
-Subparagraph (SX 210.13-01(a)(4)(ii))
-Publisher FASB
-URI https://asc.fasb.org/1943274/2147480097/470-10-S99-1A
Reference 24: http://www.xbrl.org/2003/role/disclosureRef
-Topic 470
-SubTopic 10
-Name Accounting Standards Codification
-Section S99
-Paragraph 1A
-Subparagraph (SX 210.13-01(a)(4)(iii)(A))
-Publisher FASB
-URI https://asc.fasb.org/1943274/2147480097/470-10-S99-1A
Reference 25: http://www.xbrl.org/2003/role/disclosureRef
-Topic 470
-SubTopic 10
-Name Accounting Standards Codification
-Section S99
-Paragraph 1A
-Subparagraph (SX 210.13-01(a)(4)(iv))
-Publisher FASB
-URI https://asc.fasb.org/1943274/2147480097/470-10-S99-1A
Reference 26: http://www.xbrl.org/2003/role/disclosureRef
-Topic 470
-SubTopic 10
-Name Accounting Standards Codification
-Section S99
-Paragraph 1A
-Subparagraph (SX 210.13-01(a)(5))
-Publisher FASB
-URI https://asc.fasb.org/1943274/2147480097/470-10-S99-1A
Reference 27: http://www.xbrl.org/2003/role/disclosureRef
-Topic 470
-SubTopic 10
-Name Accounting Standards Codification
-Section S99
-Paragraph 1B
-Subparagraph (SX 210.13-02(a)(4)(i))
-Publisher FASB
-URI https://asc.fasb.org/1943274/2147480097/470-10-S99-1B
Reference 28: http://www.xbrl.org/2003/role/disclosureRef
-Topic 470
-SubTopic 10
-Name Accounting Standards Codification
-Section S99
-Paragraph 1B
-Subparagraph (SX 210.13-02(a)(4)(iii)(A))
-Publisher FASB
-URI https://asc.fasb.org/1943274/2147480097/470-10-S99-1B
Reference 29: http://www.xbrl.org/2003/role/disclosureRef
-Topic 470
-SubTopic 10
-Name Accounting Standards Codification
-Section S99
-Paragraph 1B
-Subparagraph (SX 210.13-02(a)(4)(iii)(B))
-Publisher FASB
-URI https://asc.fasb.org/1943274/2147480097/470-10-S99-1B
Reference 30: http://www.xbrl.org/2003/role/disclosureRef
-Topic 470
-SubTopic 10
-Name Accounting Standards Codification
-Section S99
-Paragraph 1B
-Subparagraph (SX 210.13-02(a)(4)(iv))
-Publisher FASB
-URI https://asc.fasb.org/1943274/2147480097/470-10-S99-1B
Reference 31: http://www.xbrl.org/2003/role/disclosureRef
-Topic 470
-SubTopic 10
-Name Accounting Standards Codification
-Section S99
-Paragraph 1B
-Subparagraph (SX 210.13-02(a)(5))
-Publisher FASB
-URI https://asc.fasb.org/1943274/2147480097/470-10-S99-1B
Reference 32: http://www.xbrl.org/2003/role/disclosureRef
-Topic 260
-SubTopic 10
-Name Accounting Standards Codification
-Section 45
-Paragraph 60B
-Subparagraph (a)
-Publisher FASB
-URI https://asc.fasb.org/1943274/2147482689/260-10-45-60B
Reference 33: http://www.xbrl.org/2003/role/disclosureRef
-Topic 205
-SubTopic 20
-Name Accounting Standards Codification
-Section 50
-Paragraph 7
-Publisher FASB
-URI https://asc.fasb.org/1943274/2147483499/205-20-50-7
Reference 34: http://fasb.org/us-gaap/role/ref/legacyRef
-Topic 230
-SubTopic 10
-Name Accounting Standards Codification
-Section 45
-Paragraph 28
-Publisher FASB
-URI https://asc.fasb.org/1943274/2147482740/230-10-45-28
Reference 35: http://www.xbrl.org/2003/role/disclosureRef
-Topic 220
-SubTopic 10
-Name Accounting Standards Codification
-Section 45
-Paragraph 1A
-Subparagraph (a)
-Publisher FASB
-URI https://asc.fasb.org/1943274/2147482790/220-10-45-1A
Reference 36: http://www.xbrl.org/2003/role/disclosureRef
-Topic 220
-SubTopic 10
-Name Accounting Standards Codification
-Section 45
-Paragraph 1B
-Subparagraph (a)
-Publisher FASB
-URI https://asc.fasb.org/1943274/2147482790/220-10-45-1B
Reference 37: http://fasb.org/us-gaap/role/ref/legacyRef
-Topic 942
-SubTopic 220
-Name Accounting Standards Codification
-Section S99
-Paragraph 1
-Subparagraph (SX 210.9-04(22))
-Publisher FASB
-URI https://asc.fasb.org/1943274/2147478524/942-220-S99-1
| Name: |
us-gaap_NetIncomeLoss |
| Namespace Prefix: |
us-gaap_ |
| Data Type: |
xbrli:monetaryItemType |
| Balance Type: |
credit |
| Period Type: |
duration |
|
| X |
- References
+ Details
| Name: |
us-gaap_OperatingExpensesAbstract |
| Namespace Prefix: |
us-gaap_ |
| Data Type: |
xbrli:stringItemType |
| Balance Type: |
na |
| Period Type: |
duration |
|
| X |
- DefinitionThe net result for the period of deducting operating expenses from operating revenues. Reference 1: http://www.xbrl.org/2009/role/commonPracticeRef
-Topic 280
-SubTopic 10
-Name Accounting Standards Codification
-Section 50
-Paragraph 22
-Publisher FASB
-URI https://asc.fasb.org/1943274/2147482810/280-10-50-22
Reference 2: http://www.xbrl.org/2009/role/commonPracticeRef
-Topic 280
-SubTopic 10
-Name Accounting Standards Codification
-Section 50
-Paragraph 32
-Subparagraph (f)
-Publisher FASB
-URI https://asc.fasb.org/1943274/2147482810/280-10-50-32
Reference 3: http://www.xbrl.org/2009/role/commonPracticeRef
-Topic 280
-SubTopic 10
-Name Accounting Standards Codification
-Section 50
-Paragraph 30
-Subparagraph (b)
-Publisher FASB
-URI https://asc.fasb.org/1943274/2147482810/280-10-50-30
Reference 4: http://www.xbrl.org/2009/role/commonPracticeRef
-Topic 270
-SubTopic 10
-Name Accounting Standards Codification
-Section 50
-Paragraph 1
-Subparagraph (i)
-Publisher FASB
-URI https://asc.fasb.org/1943274/2147482964/270-10-50-1
Reference 5: http://www.xbrl.org/2009/role/commonPracticeRef
-Topic 280
-SubTopic 10
-Name Accounting Standards Codification
-Section 50
-Paragraph 32
-Subparagraph (ee)
-Publisher FASB
-URI https://asc.fasb.org/1943274/2147482810/280-10-50-32
Reference 6: http://fasb.org/us-gaap/role/ref/otherTransitionRef
-Topic 280
-SubTopic 10
-Name Accounting Standards Codification
-Section 50
-Paragraph 32
-Subparagraph (c)
-Publisher FASB
-URI https://asc.fasb.org/1943274/2147482810/280-10-50-32
Reference 7: http://www.xbrl.org/2003/role/exampleRef
-Topic 280
-SubTopic 10
-Name Accounting Standards Codification
-Section 50
-Paragraph 31
-Publisher FASB
-URI https://asc.fasb.org/1943274/2147482810/280-10-50-31
| Name: |
us-gaap_OperatingIncomeLoss |
| Namespace Prefix: |
us-gaap_ |
| Data Type: |
xbrli:monetaryItemType |
| Balance Type: |
credit |
| Period Type: |
duration |
|
| X |
- DefinitionAmount after tax and reclassification adjustments of gain (loss) on foreign currency translation adjustments, foreign currency transactions designated and effective as economic hedges of a net investment in a foreign entity and intra-entity foreign currency transactions that are of a long-term-investment nature. Reference 1: http://fasb.org/us-gaap/role/ref/legacyRef
-Name Accounting Standards Codification
-Section 45
-Paragraph 10A
-Subparagraph (a)
-SubTopic 10
-Topic 220
-Publisher FASB
-URI https://asc.fasb.org/1943274/2147482790/220-10-45-10A
Reference 2: http://www.xbrl.org/2003/role/disclosureRef
-Topic 944
-SubTopic 220
-Name Accounting Standards Codification
-Section S99
-Paragraph 1
-Subparagraph (SX 210.7-04(19))
-Publisher FASB
-URI https://asc.fasb.org/1943274/2147477250/944-220-S99-1
| Name: |
us-gaap_OtherComprehensiveIncomeLossForeignCurrencyTransactionAndTranslationAdjustmentNetOfTax |
| Namespace Prefix: |
us-gaap_ |
| Data Type: |
xbrli:monetaryItemType |
| Balance Type: |
credit |
| Period Type: |
duration |
|
| X |
- DefinitionAmount after tax and reclassification adjustments of other comprehensive income (loss). Reference 1: http://fasb.org/us-gaap/role/ref/legacyRef
-Name Accounting Standards Codification
-Section 50
-Paragraph 2
-SubTopic 10
-Topic 505
-Publisher FASB
-URI https://asc.fasb.org/1943274/2147481112/505-10-50-2
Reference 2: http://www.xbrl.org/2003/role/disclosureRef
-Topic 250
-SubTopic 10
-Name Accounting Standards Codification
-Section 50
-Paragraph 6
-Publisher FASB
-URI https://asc.fasb.org/1943274/2147483443/250-10-50-6
Reference 3: http://www.xbrl.org/2003/role/disclosureRef
-Topic 830
-SubTopic 30
-Name Accounting Standards Codification
-Section 50
-Paragraph 1
-Publisher FASB
-URI https://asc.fasb.org/1943274/2147481674/830-30-50-1
Reference 4: http://www.xbrl.org/2003/role/disclosureRef
-Topic 830
-SubTopic 30
-Name Accounting Standards Codification
-Section 45
-Paragraph 17
-Publisher FASB
-URI https://asc.fasb.org/1943274/2147481694/830-30-45-17
Reference 5: http://www.xbrl.org/2003/role/disclosureRef
-Topic 944
-SubTopic 220
-Name Accounting Standards Codification
-Section S99
-Paragraph 1
-Subparagraph (SX 210.7-04(19))
-Publisher FASB
-URI https://asc.fasb.org/1943274/2147477250/944-220-S99-1
Reference 6: http://www.xbrl.org/2009/role/commonPracticeRef
-Topic 220
-SubTopic 10
-Name Accounting Standards Codification
-Section 50
-Paragraph 4
-Publisher FASB
-URI https://asc.fasb.org/1943274/2147482765/220-10-50-4
Reference 7: http://www.xbrl.org/2009/role/commonPracticeRef
-Topic 220
-SubTopic 10
-Name Accounting Standards Codification
-Section 50
-Paragraph 5
-Publisher FASB
-URI https://asc.fasb.org/1943274/2147482765/220-10-50-5
Reference 8: http://www.xbrl.org/2003/role/disclosureRef
-Topic 830
-SubTopic 30
-Name Accounting Standards Codification
-Section 45
-Paragraph 20
-Publisher FASB
-URI https://asc.fasb.org/1943274/2147481694/830-30-45-20
Reference 9: http://www.xbrl.org/2003/role/disclosureRef
-Topic 220
-SubTopic 10
-Name Accounting Standards Codification
-Section S99
-Paragraph 2
-Subparagraph (SX 210.5-03(21))
-Publisher FASB
-URI https://asc.fasb.org/1943274/2147483621/220-10-S99-2
Reference 10: http://www.xbrl.org/2003/role/disclosureRef
-Topic 942
-SubTopic 220
-Name Accounting Standards Codification
-Section S99
-Paragraph 1
-Subparagraph (SX 210.9-04(23))
-Publisher FASB
-URI https://asc.fasb.org/1943274/2147478524/942-220-S99-1
Reference 11: http://www.xbrl.org/2003/role/disclosureRef
-Topic 220
-SubTopic 10
-Name Accounting Standards Codification
-Section 45
-Paragraph 1B
-Subparagraph (b)
-Publisher FASB
-URI https://asc.fasb.org/1943274/2147482790/220-10-45-1B
Reference 12: http://fasb.org/us-gaap/role/ref/legacyRef
-Name Accounting Standards Codification
-Section 55
-Paragraph 15
-SubTopic 10
-Topic 220
-Publisher FASB
-URI https://asc.fasb.org/1943274/2147482739/220-10-55-15
Reference 13: http://www.xbrl.org/2003/role/disclosureRef
-Topic 220
-SubTopic 10
-Name Accounting Standards Codification
-Section 45
-Paragraph 1A
-Subparagraph (b)
-Publisher FASB
-URI https://asc.fasb.org/1943274/2147482790/220-10-45-1A
| Name: |
us-gaap_OtherComprehensiveIncomeLossNetOfTax |
| Namespace Prefix: |
us-gaap_ |
| Data Type: |
xbrli:monetaryItemType |
| Balance Type: |
credit |
| Period Type: |
duration |
|
| X |
- DefinitionAmount of income (expense) related to nonoperating activities, classified as other. Reference 1: http://fasb.org/us-gaap/role/ref/legacyRef
-Topic 220
-SubTopic 10
-Name Accounting Standards Codification
-Section S99
-Paragraph 2
-Subparagraph (SX 210.5-03(9))
-Publisher FASB
-URI https://asc.fasb.org/1943274/2147483621/220-10-S99-2
| Name: |
us-gaap_OtherNonoperatingIncomeExpense |
| Namespace Prefix: |
us-gaap_ |
| Data Type: |
xbrli:monetaryItemType |
| Balance Type: |
credit |
| Period Type: |
duration |
|
| X |
- DefinitionAmount of expenses associated with exit or disposal activities pursuant to an authorized plan. Excludes expenses related to a discontinued operation or an asset retirement obligation. Reference 1: http://fasb.org/us-gaap/role/ref/legacyRef
-Name Accounting Standards Codification
-Section 45
-Paragraph 28
-Subparagraph (b)
-SubTopic 10
-Topic 230
-Publisher FASB
-URI https://asc.fasb.org/1943274/2147482740/230-10-45-28
Reference 2: http://www.xbrl.org/2003/role/disclosureRef
-Topic 420
-SubTopic 10
-Name Accounting Standards Codification
-Section S99
-Paragraph 2
-Subparagraph (SAB Topic 5.P.4.b.1)
-Publisher FASB
-URI https://asc.fasb.org/1943274/2147479823/420-10-S99-2
Reference 3: http://www.xbrl.org/2009/role/commonPracticeRef
-Topic 420
-SubTopic 10
-Name Accounting Standards Codification
-Section 45
-Paragraph 3
-Publisher FASB
-URI https://asc.fasb.org/1943274/2147482047/420-10-45-3
Reference 4: http://www.xbrl.org/2003/role/disclosureRef
-Topic 420
-SubTopic 10
-Name Accounting Standards Codification
-Section S99
-Paragraph 1
-Subparagraph (SAB Topic 5.P.3)
-Publisher FASB
-URI https://asc.fasb.org/1943274/2147479823/420-10-S99-1
| Name: |
us-gaap_RestructuringCharges |
| Namespace Prefix: |
us-gaap_ |
| Data Type: |
xbrli:monetaryItemType |
| Balance Type: |
debit |
| Period Type: |
duration |
|
| X |
- DefinitionAmount, excluding tax collected from customer, of revenue from satisfaction of performance obligation by transferring promised good or service to customer. Tax collected from customer is tax assessed by governmental authority that is both imposed on and concurrent with specific revenue-producing transaction, including, but not limited to, sales, use, value added and excise. Reference 1: http://www.xbrl.org/2003/role/disclosureRef
-Topic 280
-SubTopic 10
-Name Accounting Standards Codification
-Section 50
-Paragraph 41
-Subparagraph (a)
-Publisher FASB
-URI https://asc.fasb.org/1943274/2147482810/280-10-50-41
Reference 2: http://www.xbrl.org/2003/role/disclosureRef
-Topic 270
-SubTopic 10
-Name Accounting Standards Codification
-Section 50
-Paragraph 1
-Subparagraph (i)
-Publisher FASB
-URI https://asc.fasb.org/1943274/2147482964/270-10-50-1
Reference 3: http://www.xbrl.org/2003/role/disclosureRef
-Topic 280
-SubTopic 10
-Name Accounting Standards Codification
-Section 50
-Paragraph 32
-Subparagraph (ee)
-Publisher FASB
-URI https://asc.fasb.org/1943274/2147482810/280-10-50-32
Reference 4: http://fasb.org/us-gaap/role/ref/otherTransitionRef
-Topic 280
-SubTopic 10
-Name Accounting Standards Codification
-Section 50
-Paragraph 32
-Subparagraph (b)
-Publisher FASB
-URI https://asc.fasb.org/1943274/2147482810/280-10-50-32
Reference 5: http://fasb.org/us-gaap/role/ref/otherTransitionRef
-Topic 280
-SubTopic 10
-Name Accounting Standards Codification
-Section 50
-Paragraph 32
-Subparagraph (a)
-Publisher FASB
-URI https://asc.fasb.org/1943274/2147482810/280-10-50-32
Reference 6: http://www.xbrl.org/2003/role/disclosureRef
-Topic 924
-SubTopic 10
-Name Accounting Standards Codification
-Section S99
-Paragraph 1
-Subparagraph (SAB Topic 11.L)
-Publisher FASB
-URI https://asc.fasb.org/1943274/2147479941/924-10-S99-1
Reference 7: http://www.xbrl.org/2003/role/disclosureRef
-Topic 606
-SubTopic 10
-Name Accounting Standards Codification
-Section 50
-Paragraph 5
-Publisher FASB
-URI https://asc.fasb.org/1943274/2147479806/606-10-50-5
Reference 8: http://www.xbrl.org/2003/role/disclosureRef
-Topic 280
-SubTopic 10
-Name Accounting Standards Codification
-Section 50
-Paragraph 30
-Subparagraph (a)
-Publisher FASB
-URI https://asc.fasb.org/1943274/2147482810/280-10-50-30
Reference 9: http://www.xbrl.org/2003/role/disclosureRef
-Topic 280
-SubTopic 10
-Name Accounting Standards Codification
-Section 50
-Paragraph 42
-Publisher FASB
-URI https://asc.fasb.org/1943274/2147482810/280-10-50-42
Reference 10: http://www.xbrl.org/2003/role/disclosureRef
-Topic 280
-SubTopic 10
-Name Accounting Standards Codification
-Section 50
-Paragraph 22
-Subparagraph (b)
-Publisher FASB
-URI https://asc.fasb.org/1943274/2147482810/280-10-50-22
Reference 11: http://www.xbrl.org/2003/role/disclosureRef
-Topic 280
-SubTopic 10
-Name Accounting Standards Codification
-Section 50
-Paragraph 40
-Publisher FASB
-URI https://asc.fasb.org/1943274/2147482810/280-10-50-40
Reference 12: http://www.xbrl.org/2003/role/disclosureRef
-Topic 280
-SubTopic 10
-Name Accounting Standards Codification
-Section 50
-Paragraph 22
-Subparagraph (a)
-Publisher FASB
-URI https://asc.fasb.org/1943274/2147482810/280-10-50-22
Reference 13: http://www.xbrl.org/2003/role/disclosureRef
-Topic 606
-SubTopic 10
-Name Accounting Standards Codification
-Section 50
-Paragraph 4
-Subparagraph (a)
-Publisher FASB
-URI https://asc.fasb.org/1943274/2147479806/606-10-50-4
| Name: |
us-gaap_RevenueFromContractWithCustomerExcludingAssessedTax |
| Namespace Prefix: |
us-gaap_ |
| Data Type: |
xbrli:monetaryItemType |
| Balance Type: |
credit |
| Period Type: |
duration |
|
| X |
- DefinitionAmount of revenue recognized from goods sold, services rendered, insurance premiums, or other activities that constitute an earning process. Includes, but is not limited to, investment and interest income before deduction of interest expense when recognized as a component of revenue, and sales and trading gain (loss). Reference 1: http://www.xbrl.org/2003/role/exampleRef
-Topic 280
-SubTopic 10
-Name Accounting Standards Codification
-Section 55
-Paragraph 48
-Publisher FASB
-URI https://asc.fasb.org/1943274/2147482785/280-10-55-48
Reference 2: http://www.xbrl.org/2003/role/disclosureRef
-Topic 280
-SubTopic 10
-Name Accounting Standards Codification
-Section 50
-Paragraph 41
-Subparagraph (a)
-Publisher FASB
-URI https://asc.fasb.org/1943274/2147482810/280-10-50-41
Reference 3: http://www.xbrl.org/2003/role/disclosureRef
-Topic 270
-SubTopic 10
-Name Accounting Standards Codification
-Section 50
-Paragraph 1
-Subparagraph (i)
-Publisher FASB
-URI https://asc.fasb.org/1943274/2147482964/270-10-50-1
Reference 4: http://www.xbrl.org/2003/role/disclosureRef
-Topic 280
-SubTopic 10
-Name Accounting Standards Codification
-Section 50
-Paragraph 32
-Subparagraph (ee)
-Publisher FASB
-URI https://asc.fasb.org/1943274/2147482810/280-10-50-32
Reference 5: http://fasb.org/us-gaap/role/ref/otherTransitionRef
-Topic 280
-SubTopic 10
-Name Accounting Standards Codification
-Section 50
-Paragraph 32
-Subparagraph (b)
-Publisher FASB
-URI https://asc.fasb.org/1943274/2147482810/280-10-50-32
Reference 6: http://fasb.org/us-gaap/role/ref/otherTransitionRef
-Topic 280
-SubTopic 10
-Name Accounting Standards Codification
-Section 50
-Paragraph 32
-Subparagraph (a)
-Publisher FASB
-URI https://asc.fasb.org/1943274/2147482810/280-10-50-32
Reference 7: http://www.xbrl.org/2003/role/disclosureRef
-Topic 235
-SubTopic 10
-Name Accounting Standards Codification
-Section S99
-Paragraph 1
-Subparagraph (SX 210.4-08(g)(1)(ii))
-Publisher FASB
-URI https://asc.fasb.org/1943274/2147480678/235-10-S99-1
Reference 8: http://www.xbrl.org/2003/role/disclosureRef
-Topic 323
-SubTopic 10
-Name Accounting Standards Codification
-Section 50
-Paragraph 3
-Subparagraph (c)
-Publisher FASB
-URI https://asc.fasb.org/1943274/2147481687/323-10-50-3
Reference 9: http://www.xbrl.org/2003/role/disclosureRef
-Topic 825
-SubTopic 10
-Name Accounting Standards Codification
-Section 50
-Paragraph 28
-Subparagraph (f)
-Publisher FASB
-URI https://asc.fasb.org/1943274/2147482907/825-10-50-28
Reference 10: http://www.xbrl.org/2003/role/disclosureRef
-Topic 470
-SubTopic 10
-Name Accounting Standards Codification
-Section S99
-Paragraph 1A
-Subparagraph (SX 210.13-01(a)(4)(i))
-Publisher FASB
-URI https://asc.fasb.org/1943274/2147480097/470-10-S99-1A
Reference 11: http://www.xbrl.org/2009/role/commonPracticeRef
-Topic 470
-SubTopic 10
-Name Accounting Standards Codification
-Section S99
-Paragraph 1A
-Subparagraph (SX 210.13-01(a)(4)(ii))
-Publisher FASB
-URI https://asc.fasb.org/1943274/2147480097/470-10-S99-1A
Reference 12: http://www.xbrl.org/2003/role/disclosureRef
-Topic 470
-SubTopic 10
-Name Accounting Standards Codification
-Section S99
-Paragraph 1A
-Subparagraph (SX 210.13-01(a)(4)(iii)(A))
-Publisher FASB
-URI https://asc.fasb.org/1943274/2147480097/470-10-S99-1A
Reference 13: http://www.xbrl.org/2003/role/disclosureRef
-Topic 470
-SubTopic 10
-Name Accounting Standards Codification
-Section S99
-Paragraph 1A
-Subparagraph (SX 210.13-01(a)(4)(iv))
-Publisher FASB
-URI https://asc.fasb.org/1943274/2147480097/470-10-S99-1A
Reference 14: http://www.xbrl.org/2003/role/disclosureRef
-Topic 470
-SubTopic 10
-Name Accounting Standards Codification
-Section S99
-Paragraph 1A
-Subparagraph (SX 210.13-01(a)(5))
-Publisher FASB
-URI https://asc.fasb.org/1943274/2147480097/470-10-S99-1A
Reference 15: http://www.xbrl.org/2003/role/disclosureRef
-Topic 470
-SubTopic 10
-Name Accounting Standards Codification
-Section S99
-Paragraph 1B
-Subparagraph (SX 210.13-02(a)(4)(i))
-Publisher FASB
-URI https://asc.fasb.org/1943274/2147480097/470-10-S99-1B
Reference 16: http://www.xbrl.org/2003/role/disclosureRef
-Topic 470
-SubTopic 10
-Name Accounting Standards Codification
-Section S99
-Paragraph 1B
-Subparagraph (SX 210.13-02(a)(4)(iii)(A))
-Publisher FASB
-URI https://asc.fasb.org/1943274/2147480097/470-10-S99-1B
Reference 17: http://www.xbrl.org/2003/role/disclosureRef
-Topic 470
-SubTopic 10
-Name Accounting Standards Codification
-Section S99
-Paragraph 1B
-Subparagraph (SX 210.13-02(a)(4)(iii)(B))
-Publisher FASB
-URI https://asc.fasb.org/1943274/2147480097/470-10-S99-1B
Reference 18: http://www.xbrl.org/2003/role/disclosureRef
-Topic 470
-SubTopic 10
-Name Accounting Standards Codification
-Section S99
-Paragraph 1B
-Subparagraph (SX 210.13-02(a)(4)(iv))
-Publisher FASB
-URI https://asc.fasb.org/1943274/2147480097/470-10-S99-1B
Reference 19: http://www.xbrl.org/2003/role/disclosureRef
-Topic 470
-SubTopic 10
-Name Accounting Standards Codification
-Section S99
-Paragraph 1B
-Subparagraph (SX 210.13-02(a)(5))
-Publisher FASB
-URI https://asc.fasb.org/1943274/2147480097/470-10-S99-1B
Reference 20: http://www.xbrl.org/2003/role/disclosureRef
-Topic 280
-SubTopic 10
-Name Accounting Standards Codification
-Section 50
-Paragraph 30
-Subparagraph (a)
-Publisher FASB
-URI https://asc.fasb.org/1943274/2147482810/280-10-50-30
Reference 21: http://www.xbrl.org/2003/role/disclosureRef
-Topic 280
-SubTopic 10
-Name Accounting Standards Codification
-Section 50
-Paragraph 42
-Publisher FASB
-URI https://asc.fasb.org/1943274/2147482810/280-10-50-42
Reference 22: http://www.xbrl.org/2003/role/disclosureRef
-Topic 280
-SubTopic 10
-Name Accounting Standards Codification
-Section 50
-Paragraph 22
-Subparagraph (b)
-Publisher FASB
-URI https://asc.fasb.org/1943274/2147482810/280-10-50-22
Reference 23: http://www.xbrl.org/2003/role/disclosureRef
-Topic 280
-SubTopic 10
-Name Accounting Standards Codification
-Section 50
-Paragraph 40
-Publisher FASB
-URI https://asc.fasb.org/1943274/2147482810/280-10-50-40
Reference 24: http://www.xbrl.org/2003/role/disclosureRef
-Topic 280
-SubTopic 10
-Name Accounting Standards Codification
-Section 50
-Paragraph 22
-Subparagraph (a)
-Publisher FASB
-URI https://asc.fasb.org/1943274/2147482810/280-10-50-22
Reference 25: http://www.xbrl.org/2003/role/disclosureRef
-Topic 942
-SubTopic 235
-Name Accounting Standards Codification
-Section S99
-Paragraph 1
-Subparagraph (SX 210.9-05(b)(2))
-Publisher FASB
-URI https://asc.fasb.org/1943274/2147477314/942-235-S99-1
Reference 26: http://www.xbrl.org/2003/role/disclosureRef
-Topic 220
-SubTopic 10
-Name Accounting Standards Codification
-Section S99
-Paragraph 2
-Subparagraph (SX 210.5-03(1))
-Publisher FASB
-URI https://asc.fasb.org/1943274/2147483621/220-10-S99-2
| Name: |
us-gaap_Revenues |
| Namespace Prefix: |
us-gaap_ |
| Data Type: |
xbrli:monetaryItemType |
| Balance Type: |
credit |
| Period Type: |
duration |
|
| X |
- References
+ Details
| Name: |
us-gaap_RevenuesAbstract |
| Namespace Prefix: |
us-gaap_ |
| Data Type: |
xbrli:stringItemType |
| Balance Type: |
na |
| Period Type: |
duration |
|
| X |
- DefinitionThe aggregate total costs related to selling a firm's product and services, as well as all other general and administrative expenses. Direct selling expenses (for example, credit, warranty, and advertising) are expenses that can be directly linked to the sale of specific products. Indirect selling expenses are expenses that cannot be directly linked to the sale of specific products, for example telephone expenses, Internet, and postal charges. General and administrative expenses include salaries of non-sales personnel, rent, utilities, communication, etc. Reference 1: http://fasb.org/us-gaap/role/ref/legacyRef
-Topic 220
-SubTopic 10
-Name Accounting Standards Codification
-Section S99
-Paragraph 2
-Subparagraph (SX 210.5-03(4))
-Publisher FASB
-URI https://asc.fasb.org/1943274/2147483621/220-10-S99-2
| Name: |
us-gaap_SellingGeneralAndAdministrativeExpense |
| Namespace Prefix: |
us-gaap_ |
| Data Type: |
xbrli:monetaryItemType |
| Balance Type: |
debit |
| Period Type: |
duration |
|
| X |
- DefinitionThe average number of shares or units issued and outstanding that are used in calculating diluted EPS or earnings per unit (EPU), determined based on the timing of issuance of shares or units in the period. Reference 1: http://www.xbrl.org/2003/role/disclosureRef
-Topic 260
-SubTopic 10
-Name Accounting Standards Codification
-Section 50
-Paragraph 1
-Subparagraph (a)
-Publisher FASB
-URI https://asc.fasb.org/1943274/2147482662/260-10-50-1
Reference 2: http://www.xbrl.org/2003/role/disclosureRef
-Topic 260
-SubTopic 10
-Name Accounting Standards Codification
-Section 45
-Paragraph 16
-Publisher FASB
-URI https://asc.fasb.org/1943274/2147482689/260-10-45-16
| Name: |
us-gaap_WeightedAverageNumberOfDilutedSharesOutstanding |
| Namespace Prefix: |
us-gaap_ |
| Data Type: |
xbrli:sharesItemType |
| Balance Type: |
na |
| Period Type: |
duration |
|
| X |
- DefinitionNumber of [basic] shares or units, after adjustment for contingently issuable shares or units and other shares or units not deemed outstanding, determined by relating the portion of time within a reporting period that common shares or units have been outstanding to the total time in that period. Reference 1: http://www.xbrl.org/2003/role/disclosureRef
-Topic 260
-SubTopic 10
-Name Accounting Standards Codification
-Section 50
-Paragraph 1
-Subparagraph (a)
-Publisher FASB
-URI https://asc.fasb.org/1943274/2147482662/260-10-50-1
Reference 2: http://www.xbrl.org/2003/role/disclosureRef
-Topic 260
-SubTopic 10
-Name Accounting Standards Codification
-Section 45
-Paragraph 10
-Publisher FASB
-URI https://asc.fasb.org/1943274/2147482689/260-10-45-10
| Name: |
us-gaap_WeightedAverageNumberOfSharesOutstandingBasic |
| Namespace Prefix: |
us-gaap_ |
| Data Type: |
xbrli:sharesItemType |
| Balance Type: |
na |
| Period Type: |
duration |
|
v3.24.2
Condensed Consolidated Statement of Cash Flows - USD ($)
$ in Millions |
6 Months Ended |
Jun. 30, 2024 |
Jun. 30, 2023 |
| Cash flows from operating activities: |
|
|
| Net Income (Loss) Attributable to Parent |
$ 562
|
$ 874
|
| Adjustments to reconcile net income (loss) from continuing operations to net cash provided by (used for) operating activities: |
|
|
| Depreciation, amortization and accretion |
869
|
876
|
| Amortization of deferred financing costs and other non-cash interest |
18
|
14
|
| Stock-based compensation expense, net |
78
|
91
|
| Asset write-down charges |
9
|
22
|
| Deferred income tax (benefit) provision |
5
|
1
|
| Other non-cash adjustments, net |
8
|
2
|
| Changes in assets and liabilities, excluding the effects of acquisitions: |
|
|
| Increase (decrease) in accrued interest |
9
|
36
|
| Increase (decrease) in accounts payable |
(6)
|
(1)
|
| Increase (decrease) in other liabilities |
(102)
|
(70)
|
| Decrease (increase) in receivables |
62
|
103
|
| Decrease (increase) in other assets |
(145)
|
(223)
|
| Net cash provided by (used for) operating activities |
1,367
|
1,725
|
| Cash flows from investing activities: |
|
|
| Capital expenditures |
(649)
|
(720)
|
| Payments for acquisitions, net of cash acquired |
(1)
|
(89)
|
| Other investing activities, net |
0
|
3
|
| Net cash provided by (used for) investing activities |
(650)
|
(806)
|
| Cash flows from financing activities: |
|
|
| Proceeds from issuance of long-term debt |
0
|
2,347
|
| Principal payments on debt and other long-term obligations |
(36)
|
(39)
|
| Borrowings under revolving credit facility |
0
|
2,113
|
| Payments under revolving credit facility |
(670)
|
(2,739)
|
| Net issuances (repayments) under commercial paper program |
1,438
|
(1,024)
|
| Payments for financing costs |
0
|
(23)
|
| Purchases of common stock |
(30)
|
(29)
|
| Dividends/distributions paid on common stock |
(1,368)
|
(1,364)
|
| Net cash provided by (used for) financing activities |
(666)
|
(758)
|
| Net increase (decrease) in cash, cash equivalents, and restricted cash and cash equivalents |
51
|
161
|
| Effect of Exchange Rate on Cash, Cash Equivalents, Restricted Cash and Restricted Cash Equivalents |
(1)
|
0
|
| Cash, cash equivalents and restricted cash and cash equivalents at beginning of period |
281
|
327
|
| Cash, cash equivalents and restricted cash and cash equivalents at end of period |
$ 331
|
$ 488
|
| X |
- References
+ Details
| Name: |
us-gaap_AdjustmentsToReconcileNetIncomeLossToCashProvidedByUsedInOperatingActivitiesAbstract |
| Namespace Prefix: |
us-gaap_ |
| Data Type: |
xbrli:stringItemType |
| Balance Type: |
na |
| Period Type: |
duration |
|
| X |
- DefinitionAmount of amortization expense attributable to debt discount (premium) and debt issuance costs. Reference 1: http://www.xbrl.org/2003/role/exampleRef
-Topic 470
-SubTopic 20
-Name Accounting Standards Codification
-Section 55
-Paragraph 69E
-Publisher FASB
-URI https://asc.fasb.org/1943274/2147481568/470-20-55-69E
Reference 2: http://www.xbrl.org/2003/role/exampleRef
-Topic 470
-SubTopic 20
-Name Accounting Standards Codification
-Section 55
-Paragraph 69F
-Publisher FASB
-URI https://asc.fasb.org/1943274/2147481568/470-20-55-69F
Reference 3: http://www.xbrl.org/2003/role/disclosureRef
-Topic 470
-SubTopic 20
-Name Accounting Standards Codification
-Section 50
-Paragraph 1F
-Subparagraph (b)(2)
-Publisher FASB
-URI https://asc.fasb.org/1943274/2147481139/470-20-50-1F
Reference 4: http://www.xbrl.org/2009/role/commonPracticeRef
-Topic 230
-SubTopic 10
-Name Accounting Standards Codification
-Section 45
-Paragraph 28
-Subparagraph (b)
-Publisher FASB
-URI https://asc.fasb.org/1943274/2147482740/230-10-45-28
Reference 5: http://www.xbrl.org/2009/role/commonPracticeRef
-Topic 835
-SubTopic 30
-Name Accounting Standards Codification
-Section 45
-Paragraph 3
-Publisher FASB
-URI https://asc.fasb.org/1943274/2147482925/835-30-45-3
| Name: |
us-gaap_AmortizationOfFinancingCostsAndDiscounts |
| Namespace Prefix: |
us-gaap_ |
| Data Type: |
xbrli:monetaryItemType |
| Balance Type: |
debit |
| Period Type: |
duration |
|
| X |
- DefinitionAmount of write-down of assets recognized in the income statement. Includes, but is not limited to, losses from tangible assets, intangible assets and goodwill. Reference 1: http://fasb.org/us-gaap/role/ref/legacyRef
-Name Accounting Standards Codification
-Section 45
-Paragraph 28
-Subparagraph (b)
-SubTopic 10
-Topic 230
-Publisher FASB
-URI https://asc.fasb.org/1943274/2147482740/230-10-45-28
Reference 2: http://fasb.org/us-gaap/role/ref/legacyRef
-Name Accounting Standards Codification
-Topic 360
-SubTopic 10
-Section 45
-Paragraph 4
-Publisher FASB
-URI https://asc.fasb.org/1943274/2147482130/360-10-45-4
| Name: |
us-gaap_AssetImpairmentCharges |
| Namespace Prefix: |
us-gaap_ |
| Data Type: |
xbrli:monetaryItemType |
| Balance Type: |
debit |
| Period Type: |
duration |
|
| X |
- DefinitionAmount of cash and cash equivalents, and cash and cash equivalents restricted to withdrawal or usage. Excludes amount for disposal group and discontinued operations. Cash includes, but is not limited to, currency on hand, demand deposits with banks or financial institutions, and other accounts with general characteristics of demand deposits. Cash equivalents include, but are not limited to, short-term, highly liquid investments that are both readily convertible to known amounts of cash and so near their maturity that they present insignificant risk of changes in value because of changes in interest rates. Reference 1: http://www.xbrl.org/2003/role/disclosureRef
-Topic 230
-SubTopic 10
-Name Accounting Standards Codification
-Section 50
-Paragraph 8
-Publisher FASB
-URI https://asc.fasb.org/1943274/2147482913/230-10-50-8
Reference 2: http://fasb.org/us-gaap/role/ref/legacyRef
-Topic 230
-SubTopic 10
-Name Accounting Standards Codification
-Section 45
-Paragraph 24
-Publisher FASB
-URI https://asc.fasb.org/1943274/2147482740/230-10-45-24
Reference 3: http://fasb.org/us-gaap/role/ref/legacyRef
-Name Accounting Standards Codification
-Topic 230
-SubTopic 10
-Section 45
-Paragraph 4
-Publisher FASB
-URI https://asc.fasb.org/1943274/2147482740/230-10-45-4
| Name: |
us-gaap_CashCashEquivalentsRestrictedCashAndRestrictedCashEquivalents |
| Namespace Prefix: |
us-gaap_ |
| Data Type: |
xbrli:monetaryItemType |
| Balance Type: |
debit |
| Period Type: |
instant |
|
| X |
- DefinitionAmount of increase (decrease) in cash and cash equivalents, and cash and cash equivalents restricted to withdrawal or usage; excluding effect from exchange rate change. Cash includes, but is not limited to, currency on hand, demand deposits with banks or financial institutions, and other accounts with general characteristics of demand deposits. Cash equivalents include, but are not limited to, short-term, highly liquid investments that are both readily convertible to known amounts of cash and so near their maturity that they present insignificant risk of changes in value because of changes in interest rates. Reference 1: http://fasb.org/us-gaap/role/ref/legacyRef
-Topic 230
-SubTopic 10
-Name Accounting Standards Codification
-Section 45
-Paragraph 24
-Publisher FASB
-URI https://asc.fasb.org/1943274/2147482740/230-10-45-24
Reference 2: http://fasb.org/us-gaap/role/ref/legacyRef
-Name Accounting Standards Codification
-Section 45
-Paragraph 1
-SubTopic 230
-Topic 830
-Publisher FASB
-URI https://asc.fasb.org/1943274/2147477401/830-230-45-1
| Name: |
us-gaap_CashCashEquivalentsRestrictedCashAndRestrictedCashEquivalentsPeriodIncreaseDecreaseExcludingExchangeRateEffect |
| Namespace Prefix: |
us-gaap_ |
| Data Type: |
xbrli:monetaryItemType |
| Balance Type: |
debit |
| Period Type: |
duration |
|
| X |
- DefinitionThe aggregate net amount of depreciation, amortization, and accretion recognized during an accounting period. As a noncash item, the net amount is added back to net income when calculating cash provided by or used in operations using the indirect method. Reference 1: http://fasb.org/us-gaap/role/ref/legacyRef
-Name Accounting Standards Codification
-Section 45
-Paragraph 28
-Subparagraph (b)
-SubTopic 10
-Topic 230
-Publisher FASB
-URI https://asc.fasb.org/1943274/2147482740/230-10-45-28
| Name: |
us-gaap_DepreciationAmortizationAndAccretionNet |
| Namespace Prefix: |
us-gaap_ |
| Data Type: |
xbrli:monetaryItemType |
| Balance Type: |
debit |
| Period Type: |
duration |
|
| X |
- DefinitionAmount of increase (decrease) from effect of exchange rate changes on cash and cash equivalents, and cash and cash equivalents restricted to withdrawal or usage; held in foreign currencies. Excludes amounts for disposal group and discontinued operations. Cash includes, but is not limited to, currency on hand, demand deposits with banks or financial institutions, and other accounts with general characteristics of demand deposits. Cash equivalents include, but are not limited to, short-term, highly liquid investments that are both readily convertible to known amounts of cash and so near their maturity that they present insignificant risk of changes in value because of changes in interest rates. Reference 1: http://www.xbrl.org/2003/role/disclosureRef
-Topic 830
-SubTopic 230
-Name Accounting Standards Codification
-Section 45
-Paragraph 1
-Publisher FASB
-URI https://asc.fasb.org/1943274/2147477401/830-230-45-1
| Name: |
us-gaap_EffectOfExchangeRateOnCashCashEquivalentsRestrictedCashAndRestrictedCashEquivalents |
| Namespace Prefix: |
us-gaap_ |
| Data Type: |
xbrli:monetaryItemType |
| Balance Type: |
debit |
| Period Type: |
duration |
|
| X |
- DefinitionChange in recurring obligations of a business that arise from the acquisition of merchandise, materials, supplies and services used in the production and sale of goods and services. Reference 1: http://fasb.org/us-gaap/role/ref/legacyRef
-Name Accounting Standards Codification
-Section 45
-Paragraph 28
-Subparagraph (a)
-SubTopic 10
-Topic 230
-Publisher FASB
-URI https://asc.fasb.org/1943274/2147482740/230-10-45-28
| Name: |
us-gaap_IncreaseDecreaseInAccountsPayableTrade |
| Namespace Prefix: |
us-gaap_ |
| Data Type: |
xbrli:monetaryItemType |
| Balance Type: |
debit |
| Period Type: |
duration |
|
| X |
- DefinitionThe increase (decrease) during the reporting period in interest payable, which represents the amount owed to note holders, bond holders, and other parties for interest earned on loans or credit extended to the reporting entity. Reference 1: http://fasb.org/us-gaap/role/ref/legacyRef
-Name Accounting Standards Codification
-Section 45
-Paragraph 28
-Subparagraph (a)
-SubTopic 10
-Topic 230
-Publisher FASB
-URI https://asc.fasb.org/1943274/2147482740/230-10-45-28
| Name: |
us-gaap_IncreaseDecreaseInInterestPayableNet |
| Namespace Prefix: |
us-gaap_ |
| Data Type: |
xbrli:monetaryItemType |
| Balance Type: |
debit |
| Period Type: |
duration |
|
| X |
- References
+ Details
| Name: |
us-gaap_IncreaseDecreaseInOperatingCapitalAbstract |
| Namespace Prefix: |
us-gaap_ |
| Data Type: |
xbrli:stringItemType |
| Balance Type: |
na |
| Period Type: |
duration |
|
| X |
- DefinitionAmount of increase (decrease) in operating assets classified as other. Reference 1: http://fasb.org/us-gaap/role/ref/legacyRef
-Name Accounting Standards Codification
-Section 45
-Paragraph 28
-Subparagraph (a)
-SubTopic 10
-Topic 230
-Publisher FASB
-URI https://asc.fasb.org/1943274/2147482740/230-10-45-28
| Name: |
us-gaap_IncreaseDecreaseInOtherOperatingAssets |
| Namespace Prefix: |
us-gaap_ |
| Data Type: |
xbrli:monetaryItemType |
| Balance Type: |
credit |
| Period Type: |
duration |
|
| X |
- DefinitionAmount of increase (decrease) in operating liabilities classified as other. Reference 1: http://fasb.org/us-gaap/role/ref/legacyRef
-Name Accounting Standards Codification
-Section 45
-Paragraph 28
-Subparagraph (a)
-SubTopic 10
-Topic 230
-Publisher FASB
-URI https://asc.fasb.org/1943274/2147482740/230-10-45-28
| Name: |
us-gaap_IncreaseDecreaseInOtherOperatingLiabilities |
| Namespace Prefix: |
us-gaap_ |
| Data Type: |
xbrli:monetaryItemType |
| Balance Type: |
debit |
| Period Type: |
duration |
|
| X |
- DefinitionThe increase (decrease) during the reporting period in the total amount due within one year (or one operating cycle) from all parties, associated with underlying transactions that are classified as operating activities. Reference 1: http://fasb.org/us-gaap/role/ref/legacyRef
-Name Accounting Standards Codification
-Section 45
-Paragraph 28
-Subparagraph (a)
-SubTopic 10
-Topic 230
-Publisher FASB
-URI https://asc.fasb.org/1943274/2147482740/230-10-45-28
| Name: |
us-gaap_IncreaseDecreaseInReceivables |
| Namespace Prefix: |
us-gaap_ |
| Data Type: |
xbrli:monetaryItemType |
| Balance Type: |
credit |
| Period Type: |
duration |
|
| X |
- DefinitionAmount of cash inflow (outflow) from financing activities, including discontinued operations. Financing activity cash flows include obtaining resources from owners and providing them with a return on, and a return of, their investment; borrowing money and repaying amounts borrowed, or settling the obligation; and obtaining and paying for other resources obtained from creditors on long-term credit. Reference 1: http://www.xbrl.org/2003/role/disclosureRef
-Topic 230
-SubTopic 10
-Name Accounting Standards Codification
-Section 45
-Paragraph 24
-Publisher FASB
-URI https://asc.fasb.org/1943274/2147482740/230-10-45-24
| Name: |
us-gaap_NetCashProvidedByUsedInFinancingActivities |
| Namespace Prefix: |
us-gaap_ |
| Data Type: |
xbrli:monetaryItemType |
| Balance Type: |
debit |
| Period Type: |
duration |
|
| X |
- References
+ Details
| Name: |
us-gaap_NetCashProvidedByUsedInFinancingActivitiesAbstract |
| Namespace Prefix: |
us-gaap_ |
| Data Type: |
xbrli:stringItemType |
| Balance Type: |
na |
| Period Type: |
duration |
|
| X |
- DefinitionAmount of cash inflow (outflow) from investing activities, including discontinued operations. Investing activity cash flows include making and collecting loans and acquiring and disposing of debt or equity instruments and property, plant, and equipment and other productive assets. Reference 1: http://www.xbrl.org/2003/role/disclosureRef
-Topic 230
-SubTopic 10
-Name Accounting Standards Codification
-Section 45
-Paragraph 24
-Publisher FASB
-URI https://asc.fasb.org/1943274/2147482740/230-10-45-24
| Name: |
us-gaap_NetCashProvidedByUsedInInvestingActivities |
| Namespace Prefix: |
us-gaap_ |
| Data Type: |
xbrli:monetaryItemType |
| Balance Type: |
debit |
| Period Type: |
duration |
|
| X |
- References
+ Details
| Name: |
us-gaap_NetCashProvidedByUsedInInvestingActivitiesAbstract |
| Namespace Prefix: |
us-gaap_ |
| Data Type: |
xbrli:stringItemType |
| Balance Type: |
na |
| Period Type: |
duration |
|
| X |
- DefinitionAmount of cash inflow (outflow) from operating activities, including discontinued operations. Operating activity cash flows include transactions, adjustments, and changes in value not defined as investing or financing activities. Reference 1: http://fasb.org/us-gaap/role/ref/legacyRef
-Topic 230
-SubTopic 10
-Name Accounting Standards Codification
-Section 45
-Paragraph 28
-Publisher FASB
-URI https://asc.fasb.org/1943274/2147482740/230-10-45-28
Reference 2: http://fasb.org/us-gaap/role/ref/legacyRef
-Topic 230
-SubTopic 10
-Name Accounting Standards Codification
-Section 45
-Paragraph 24
-Publisher FASB
-URI https://asc.fasb.org/1943274/2147482740/230-10-45-24
Reference 3: http://fasb.org/us-gaap/role/ref/legacyRef
-Topic 230
-SubTopic 10
-Name Accounting Standards Codification
-Section 45
-Paragraph 25
-Publisher FASB
-URI https://asc.fasb.org/1943274/2147482740/230-10-45-25
| Name: |
us-gaap_NetCashProvidedByUsedInOperatingActivities |
| Namespace Prefix: |
us-gaap_ |
| Data Type: |
xbrli:monetaryItemType |
| Balance Type: |
na |
| Period Type: |
duration |
|
| X |
- References
+ Details
| Name: |
us-gaap_NetCashProvidedByUsedInOperatingActivitiesAbstract |
| Namespace Prefix: |
us-gaap_ |
| Data Type: |
xbrli:stringItemType |
| Balance Type: |
na |
| Period Type: |
duration |
|
| X |
- DefinitionThe portion of profit or loss for the period, net of income taxes, which is attributable to the parent. Reference 1: http://www.xbrl.org/2003/role/disclosureRef
-Topic 250
-SubTopic 10
-Name Accounting Standards Codification
-Section 50
-Paragraph 6
-Publisher FASB
-URI https://asc.fasb.org/1943274/2147483443/250-10-50-6
Reference 2: http://www.xbrl.org/2003/role/disclosureRef
-Topic 250
-SubTopic 10
-Name Accounting Standards Codification
-Section 50
-Paragraph 9
-Publisher FASB
-URI https://asc.fasb.org/1943274/2147483443/250-10-50-9
Reference 3: http://www.xbrl.org/2003/role/disclosureRef
-Topic 805
-SubTopic 60
-Name Accounting Standards Codification
-Section 65
-Paragraph 1
-Subparagraph (g)
-Publisher FASB
-URI https://asc.fasb.org/1943274/2147476176/805-60-65-1
Reference 4: http://www.xbrl.org/2003/role/disclosureRef
-Topic 740
-SubTopic 323
-Name Accounting Standards Codification
-Section 65
-Paragraph 2
-Subparagraph (g)(3)
-Publisher FASB
-URI https://asc.fasb.org/1943274/2147478666/740-323-65-2
Reference 5: http://fasb.org/us-gaap/role/ref/legacyRef
-Topic 220
-SubTopic 10
-Name Accounting Standards Codification
-Section S99
-Paragraph 2
-Subparagraph (SX 210.5-03(20))
-Publisher FASB
-URI https://asc.fasb.org/1943274/2147483621/220-10-S99-2
Reference 6: http://www.xbrl.org/2003/role/disclosureRef
-Topic 235
-SubTopic 10
-Name Accounting Standards Codification
-Section S99
-Paragraph 1
-Subparagraph (SX 210.4-08(g)(1)(ii))
-Publisher FASB
-URI https://asc.fasb.org/1943274/2147480678/235-10-S99-1
Reference 7: http://www.xbrl.org/2003/role/disclosureRef
-Topic 323
-SubTopic 10
-Name Accounting Standards Codification
-Section 50
-Paragraph 3
-Subparagraph (c)
-Publisher FASB
-URI https://asc.fasb.org/1943274/2147481687/323-10-50-3
Reference 8: http://www.xbrl.org/2003/role/disclosureRef
-Topic 825
-SubTopic 10
-Name Accounting Standards Codification
-Section 50
-Paragraph 28
-Subparagraph (f)
-Publisher FASB
-URI https://asc.fasb.org/1943274/2147482907/825-10-50-28
Reference 9: http://www.xbrl.org/2003/role/disclosureRef
-Topic 220
-SubTopic 10
-Name Accounting Standards Codification
-Section 50
-Paragraph 6
-Publisher FASB
-URI https://asc.fasb.org/1943274/2147482765/220-10-50-6
Reference 10: http://www.xbrl.org/2003/role/disclosureRef
-Topic 250
-SubTopic 10
-Name Accounting Standards Codification
-Section 50
-Paragraph 3
-Publisher FASB
-URI https://asc.fasb.org/1943274/2147483443/250-10-50-3
Reference 11: http://www.xbrl.org/2003/role/disclosureRef
-Topic 250
-SubTopic 10
-Name Accounting Standards Codification
-Section 50
-Paragraph 1
-Subparagraph (b)(2)
-Publisher FASB
-URI https://asc.fasb.org/1943274/2147483443/250-10-50-1
Reference 12: http://www.xbrl.org/2003/role/disclosureRef
-Topic 815
-SubTopic 40
-Name Accounting Standards Codification
-Section 65
-Paragraph 1
-Subparagraph (f)
-Publisher FASB
-URI https://asc.fasb.org/1943274/2147480175/815-40-65-1
Reference 13: http://www.xbrl.org/2003/role/disclosureRef
-Topic 250
-SubTopic 10
-Name Accounting Standards Codification
-Section 50
-Paragraph 8
-Publisher FASB
-URI https://asc.fasb.org/1943274/2147483443/250-10-50-8
Reference 14: http://www.xbrl.org/2003/role/disclosureRef
-Topic 250
-SubTopic 10
-Name Accounting Standards Codification
-Section 50
-Paragraph 11
-Subparagraph (a)
-Publisher FASB
-URI https://asc.fasb.org/1943274/2147483443/250-10-50-11
Reference 15: http://www.xbrl.org/2003/role/disclosureRef
-Topic 250
-SubTopic 10
-Name Accounting Standards Codification
-Section 50
-Paragraph 11
-Subparagraph (b)
-Publisher FASB
-URI https://asc.fasb.org/1943274/2147483443/250-10-50-11
Reference 16: http://www.xbrl.org/2003/role/disclosureRef
-Topic 250
-SubTopic 10
-Name Accounting Standards Codification
-Section 50
-Paragraph 4
-Publisher FASB
-URI https://asc.fasb.org/1943274/2147483443/250-10-50-4
Reference 17: http://www.xbrl.org/2003/role/exampleRef
-Topic 946
-SubTopic 830
-Name Accounting Standards Codification
-Section 55
-Paragraph 10
-Publisher FASB
-URI https://asc.fasb.org/1943274/2147479168/946-830-55-10
Reference 18: http://www.xbrl.org/2003/role/disclosureRef
-Topic 946
-SubTopic 220
-Name Accounting Standards Codification
-Section 45
-Paragraph 7
-Publisher FASB
-URI https://asc.fasb.org/1943274/2147479105/946-220-45-7
Reference 19: http://www.xbrl.org/2003/role/disclosureRef
-Topic 944
-SubTopic 220
-Name Accounting Standards Codification
-Section S99
-Paragraph 1
-Subparagraph (SX 210.7-04(18))
-Publisher FASB
-URI https://asc.fasb.org/1943274/2147477250/944-220-S99-1
Reference 20: http://www.xbrl.org/2003/role/disclosureRef
-Topic 946
-SubTopic 220
-Name Accounting Standards Codification
-Section S99
-Paragraph 1
-Subparagraph (SX 210.6-07(9))
-Publisher FASB
-URI https://asc.fasb.org/1943274/2147479134/946-220-S99-1
Reference 21: http://www.xbrl.org/2003/role/disclosureRef
-Topic 946
-SubTopic 220
-Name Accounting Standards Codification
-Section S99
-Paragraph 3
-Subparagraph (SX 210.6-09(1)(d))
-Publisher FASB
-URI https://asc.fasb.org/1943274/2147479134/946-220-S99-3
Reference 22: http://www.xbrl.org/2003/role/disclosureRef
-Topic 470
-SubTopic 10
-Name Accounting Standards Codification
-Section S99
-Paragraph 1A
-Subparagraph (SX 210.13-01(a)(4)(i))
-Publisher FASB
-URI https://asc.fasb.org/1943274/2147480097/470-10-S99-1A
Reference 23: http://www.xbrl.org/2009/role/commonPracticeRef
-Topic 470
-SubTopic 10
-Name Accounting Standards Codification
-Section S99
-Paragraph 1A
-Subparagraph (SX 210.13-01(a)(4)(ii))
-Publisher FASB
-URI https://asc.fasb.org/1943274/2147480097/470-10-S99-1A
Reference 24: http://www.xbrl.org/2003/role/disclosureRef
-Topic 470
-SubTopic 10
-Name Accounting Standards Codification
-Section S99
-Paragraph 1A
-Subparagraph (SX 210.13-01(a)(4)(iii)(A))
-Publisher FASB
-URI https://asc.fasb.org/1943274/2147480097/470-10-S99-1A
Reference 25: http://www.xbrl.org/2003/role/disclosureRef
-Topic 470
-SubTopic 10
-Name Accounting Standards Codification
-Section S99
-Paragraph 1A
-Subparagraph (SX 210.13-01(a)(4)(iv))
-Publisher FASB
-URI https://asc.fasb.org/1943274/2147480097/470-10-S99-1A
Reference 26: http://www.xbrl.org/2003/role/disclosureRef
-Topic 470
-SubTopic 10
-Name Accounting Standards Codification
-Section S99
-Paragraph 1A
-Subparagraph (SX 210.13-01(a)(5))
-Publisher FASB
-URI https://asc.fasb.org/1943274/2147480097/470-10-S99-1A
Reference 27: http://www.xbrl.org/2003/role/disclosureRef
-Topic 470
-SubTopic 10
-Name Accounting Standards Codification
-Section S99
-Paragraph 1B
-Subparagraph (SX 210.13-02(a)(4)(i))
-Publisher FASB
-URI https://asc.fasb.org/1943274/2147480097/470-10-S99-1B
Reference 28: http://www.xbrl.org/2003/role/disclosureRef
-Topic 470
-SubTopic 10
-Name Accounting Standards Codification
-Section S99
-Paragraph 1B
-Subparagraph (SX 210.13-02(a)(4)(iii)(A))
-Publisher FASB
-URI https://asc.fasb.org/1943274/2147480097/470-10-S99-1B
Reference 29: http://www.xbrl.org/2003/role/disclosureRef
-Topic 470
-SubTopic 10
-Name Accounting Standards Codification
-Section S99
-Paragraph 1B
-Subparagraph (SX 210.13-02(a)(4)(iii)(B))
-Publisher FASB
-URI https://asc.fasb.org/1943274/2147480097/470-10-S99-1B
Reference 30: http://www.xbrl.org/2003/role/disclosureRef
-Topic 470
-SubTopic 10
-Name Accounting Standards Codification
-Section S99
-Paragraph 1B
-Subparagraph (SX 210.13-02(a)(4)(iv))
-Publisher FASB
-URI https://asc.fasb.org/1943274/2147480097/470-10-S99-1B
Reference 31: http://www.xbrl.org/2003/role/disclosureRef
-Topic 470
-SubTopic 10
-Name Accounting Standards Codification
-Section S99
-Paragraph 1B
-Subparagraph (SX 210.13-02(a)(5))
-Publisher FASB
-URI https://asc.fasb.org/1943274/2147480097/470-10-S99-1B
Reference 32: http://www.xbrl.org/2003/role/disclosureRef
-Topic 260
-SubTopic 10
-Name Accounting Standards Codification
-Section 45
-Paragraph 60B
-Subparagraph (a)
-Publisher FASB
-URI https://asc.fasb.org/1943274/2147482689/260-10-45-60B
Reference 33: http://www.xbrl.org/2003/role/disclosureRef
-Topic 205
-SubTopic 20
-Name Accounting Standards Codification
-Section 50
-Paragraph 7
-Publisher FASB
-URI https://asc.fasb.org/1943274/2147483499/205-20-50-7
Reference 34: http://fasb.org/us-gaap/role/ref/legacyRef
-Topic 230
-SubTopic 10
-Name Accounting Standards Codification
-Section 45
-Paragraph 28
-Publisher FASB
-URI https://asc.fasb.org/1943274/2147482740/230-10-45-28
Reference 35: http://www.xbrl.org/2003/role/disclosureRef
-Topic 220
-SubTopic 10
-Name Accounting Standards Codification
-Section 45
-Paragraph 1A
-Subparagraph (a)
-Publisher FASB
-URI https://asc.fasb.org/1943274/2147482790/220-10-45-1A
Reference 36: http://www.xbrl.org/2003/role/disclosureRef
-Topic 220
-SubTopic 10
-Name Accounting Standards Codification
-Section 45
-Paragraph 1B
-Subparagraph (a)
-Publisher FASB
-URI https://asc.fasb.org/1943274/2147482790/220-10-45-1B
Reference 37: http://fasb.org/us-gaap/role/ref/legacyRef
-Topic 942
-SubTopic 220
-Name Accounting Standards Codification
-Section S99
-Paragraph 1
-Subparagraph (SX 210.9-04(22))
-Publisher FASB
-URI https://asc.fasb.org/1943274/2147478524/942-220-S99-1
| Name: |
us-gaap_NetIncomeLoss |
| Namespace Prefix: |
us-gaap_ |
| Data Type: |
xbrli:monetaryItemType |
| Balance Type: |
credit |
| Period Type: |
duration |
|
| X |
- DefinitionAmount of income (expense) included in net income that results in no cash inflow (outflow), classified as other. Reference 1: http://fasb.org/us-gaap/role/ref/legacyRef
-Topic 230
-SubTopic 10
-Name Accounting Standards Codification
-Section 45
-Paragraph 28
-Publisher FASB
-URI https://asc.fasb.org/1943274/2147482740/230-10-45-28
| Name: |
us-gaap_OtherNoncashIncomeExpense |
| Namespace Prefix: |
us-gaap_ |
| Data Type: |
xbrli:monetaryItemType |
| Balance Type: |
credit |
| Period Type: |
duration |
|
| X |
- DefinitionAmount of cash (inflow) outflow from investing activities classified as other. Reference 1: http://www.xbrl.org/2009/role/commonPracticeRef
-Topic 230
-SubTopic 10
-Name Accounting Standards Codification
-Section 45
-Paragraph 13
-Publisher FASB
-URI https://asc.fasb.org/1943274/2147482740/230-10-45-13
Reference 2: http://www.xbrl.org/2009/role/commonPracticeRef
-Name Accounting Standards Codification
-Section 45
-Paragraph 12
-SubTopic 10
-Topic 230
-Publisher FASB
-URI https://asc.fasb.org/1943274/2147482740/230-10-45-12
| Name: |
us-gaap_PaymentsForProceedsFromOtherInvestingActivities |
| Namespace Prefix: |
us-gaap_ |
| Data Type: |
xbrli:monetaryItemType |
| Balance Type: |
credit |
| Period Type: |
duration |
|
| X |
- DefinitionThe cash outflow to reacquire common stock during the period. Reference 1: http://fasb.org/us-gaap/role/ref/legacyRef
-Topic 230
-SubTopic 10
-Name Accounting Standards Codification
-Section 45
-Paragraph 15
-Subparagraph (a)
-Publisher FASB
-URI https://asc.fasb.org/1943274/2147482740/230-10-45-15
| Name: |
us-gaap_PaymentsForRepurchaseOfCommonStock |
| Namespace Prefix: |
us-gaap_ |
| Data Type: |
xbrli:monetaryItemType |
| Balance Type: |
credit |
| Period Type: |
duration |
|
| X |
- DefinitionAmount of cash outflow in the form of ordinary dividends to common shareholders of the parent entity. Reference 1: http://fasb.org/us-gaap/role/ref/legacyRef
-Topic 230
-SubTopic 10
-Name Accounting Standards Codification
-Section 45
-Paragraph 15
-Subparagraph (a)
-Publisher FASB
-URI https://asc.fasb.org/1943274/2147482740/230-10-45-15
| Name: |
us-gaap_PaymentsOfDividendsCommonStock |
| Namespace Prefix: |
us-gaap_ |
| Data Type: |
xbrli:monetaryItemType |
| Balance Type: |
credit |
| Period Type: |
duration |
|
| X |
- DefinitionThe cash outflow for loan and debt issuance costs. Reference 1: http://fasb.org/us-gaap/role/ref/legacyRef
-Name Accounting Standards Codification
-Topic 230
-SubTopic 10
-Section 45
-Paragraph 15
-Publisher FASB
-URI https://asc.fasb.org/1943274/2147482740/230-10-45-15
| Name: |
us-gaap_PaymentsOfFinancingCosts |
| Namespace Prefix: |
us-gaap_ |
| Data Type: |
xbrli:monetaryItemType |
| Balance Type: |
credit |
| Period Type: |
duration |
|
| X |
- DefinitionThe cash outflow associated with the acquisition of a business, net of the cash acquired from the purchase. Reference 1: http://fasb.org/us-gaap/role/ref/legacyRef
-Name Accounting Standards Codification
-Topic 230
-SubTopic 10
-Section 45
-Paragraph 13
-Subparagraph (b)
-Publisher FASB
-URI https://asc.fasb.org/1943274/2147482740/230-10-45-13
| Name: |
us-gaap_PaymentsToAcquireBusinessesNetOfCashAcquired |
| Namespace Prefix: |
us-gaap_ |
| Data Type: |
xbrli:monetaryItemType |
| Balance Type: |
credit |
| Period Type: |
duration |
|
| X |
- DefinitionThe cash outflow for purchases of and capital improvements on property, plant and equipment (capital expenditures), software, and other intangible assets. Reference 1: http://www.xbrl.org/2009/role/commonPracticeRef
-Topic 805
-SubTopic 50
-Name Accounting Standards Codification
-Section 25
-Paragraph 1
-Publisher FASB
-URI https://asc.fasb.org/1943274/2147480060/805-50-25-1
Reference 2: http://www.xbrl.org/2009/role/commonPracticeRef
-Topic 805
-SubTopic 50
-Name Accounting Standards Codification
-Section 30
-Paragraph 1
-Publisher FASB
-URI https://asc.fasb.org/1943274/2147480027/805-50-30-1
Reference 3: http://www.xbrl.org/2009/role/commonPracticeRef
-Topic 805
-SubTopic 50
-Name Accounting Standards Codification
-Section 30
-Paragraph 2
-Publisher FASB
-URI https://asc.fasb.org/1943274/2147480027/805-50-30-2
Reference 4: http://www.xbrl.org/2003/role/disclosureRef
-Name Accounting Standards Codification
-Section 45
-Paragraph 13
-Subparagraph (c)
-SubTopic 10
-Topic 230
-Publisher FASB
-URI https://asc.fasb.org/1943274/2147482740/230-10-45-13
| Name: |
us-gaap_PaymentsToAcquireProductiveAssets |
| Namespace Prefix: |
us-gaap_ |
| Data Type: |
xbrli:monetaryItemType |
| Balance Type: |
credit |
| Period Type: |
duration |
|
| X |
- DefinitionThe cash inflow from a debt initially having maturity due after one year or beyond the operating cycle, if longer. Reference 1: http://www.xbrl.org/2003/role/disclosureRef
-Topic 946
-SubTopic 10
-Name Accounting Standards Codification
-Section S99
-Paragraph 3
-Subparagraph (SX 210.6-03(i)(1))
-Publisher FASB
-URI https://asc.fasb.org/1943274/2147479886/946-10-S99-3
Reference 2: http://fasb.org/us-gaap/role/ref/legacyRef
-Name Accounting Standards Codification
-Topic 230
-SubTopic 10
-Section 45
-Paragraph 14
-Subparagraph (b)
-Publisher FASB
-URI https://asc.fasb.org/1943274/2147482740/230-10-45-14
| Name: |
us-gaap_ProceedsFromIssuanceOfLongTermDebt |
| Namespace Prefix: |
us-gaap_ |
| Data Type: |
xbrli:monetaryItemType |
| Balance Type: |
debit |
| Period Type: |
duration |
|
| X |
- DefinitionAmount of cash inflow from contractual arrangement with the lender, including but not limited to, letter of credit, standby letter of credit and revolving credit arrangements. Reference 1: http://www.xbrl.org/2009/role/commonPracticeRef
-Topic 235
-SubTopic 10
-Name Accounting Standards Codification
-Section S99
-Paragraph 1
-Subparagraph (SX 210.4-08(f))
-Publisher FASB
-URI https://asc.fasb.org/1943274/2147480678/235-10-S99-1
Reference 2: http://fasb.org/us-gaap/role/ref/legacyRef
-Name Accounting Standards Codification
-Topic 230
-SubTopic 10
-Section 45
-Paragraph 14
-Subparagraph (b)
-Publisher FASB
-URI https://asc.fasb.org/1943274/2147482740/230-10-45-14
| Name: |
us-gaap_ProceedsFromLinesOfCredit |
| Namespace Prefix: |
us-gaap_ |
| Data Type: |
xbrli:monetaryItemType |
| Balance Type: |
debit |
| Period Type: |
duration |
|
| X |
- DefinitionThe net cash inflow or cash outflow from issuing (borrowing) and repaying commercial paper. Reference 1: http://www.xbrl.org/2009/role/commonPracticeRef
-Topic 230
-SubTopic 10
-Name Accounting Standards Codification
-Section 45
-Paragraph 15
-Subparagraph (b)
-Publisher FASB
-URI https://asc.fasb.org/1943274/2147482740/230-10-45-15
Reference 2: http://www.xbrl.org/2009/role/commonPracticeRef
-Topic 230
-SubTopic 10
-Name Accounting Standards Codification
-Section 45
-Paragraph 14
-Subparagraph (b)
-Publisher FASB
-URI https://asc.fasb.org/1943274/2147482740/230-10-45-14
Reference 3: http://www.xbrl.org/2009/role/commonPracticeRef
-Topic 230
-SubTopic 10
-Name Accounting Standards Codification
-Section 45
-Paragraph 9
-Subparagraph (c)
-Publisher FASB
-URI https://asc.fasb.org/1943274/2147482740/230-10-45-9
| Name: |
us-gaap_ProceedsFromRepaymentsOfCommercialPaper |
| Namespace Prefix: |
us-gaap_ |
| Data Type: |
xbrli:monetaryItemType |
| Balance Type: |
debit |
| Period Type: |
duration |
|
| X |
- DefinitionAmount of cash outflow for payment of an obligation from a lender, including but not limited to, letter of credit, standby letter of credit and revolving credit arrangements. Reference 1: http://fasb.org/us-gaap/role/ref/legacyRef
-Topic 230
-SubTopic 10
-Name Accounting Standards Codification
-Section 45
-Paragraph 15
-Subparagraph (b)
-Publisher FASB
-URI https://asc.fasb.org/1943274/2147482740/230-10-45-15
Reference 2: http://www.xbrl.org/2009/role/commonPracticeRef
-Topic 235
-SubTopic 10
-Name Accounting Standards Codification
-Section S99
-Paragraph 1
-Subparagraph (SX 210.4-08(f))
-Publisher FASB
-URI https://asc.fasb.org/1943274/2147480678/235-10-S99-1
| Name: |
us-gaap_RepaymentsOfLinesOfCredit |
| Namespace Prefix: |
us-gaap_ |
| Data Type: |
xbrli:monetaryItemType |
| Balance Type: |
credit |
| Period Type: |
duration |
|
| X |
- DefinitionAmount of cash outflow for the payment of debt classified as other. Reference 1: http://fasb.org/us-gaap/role/ref/legacyRef
-Topic 230
-SubTopic 10
-Name Accounting Standards Codification
-Section 45
-Paragraph 15
-Subparagraph (b)
-Publisher FASB
-URI https://asc.fasb.org/1943274/2147482740/230-10-45-15
| Name: |
us-gaap_RepaymentsOfOtherDebt |
| Namespace Prefix: |
us-gaap_ |
| Data Type: |
xbrli:monetaryItemType |
| Balance Type: |
credit |
| Period Type: |
duration |
|
| X |
- DefinitionAmount of noncash expense for share-based payment arrangement. Reference 1: http://fasb.org/us-gaap/role/ref/legacyRef
-Name Accounting Standards Codification
-Section 45
-Paragraph 28
-Subparagraph (a)
-SubTopic 10
-Topic 230
-Publisher FASB
-URI https://asc.fasb.org/1943274/2147482740/230-10-45-28
| Name: |
us-gaap_ShareBasedCompensation |
| Namespace Prefix: |
us-gaap_ |
| Data Type: |
xbrli:monetaryItemType |
| Balance Type: |
debit |
| Period Type: |
duration |
|
v3.24.2
Condensed Consolidated Statement of Equity - USD ($)
shares in Millions, $ in Millions |
Total |
Common Stock [Member] |
Additional Paid-in Capital [Member] |
Dividends/Distributions in Excess of Earnings [Member] |
AOCI Attributable to Parent |
| Balance, shares Period Start at Dec. 31, 2022 |
|
|
433
|
|
|
|
| Balance, value Period Start at Dec. 31, 2022 |
|
$ 7,449
|
$ 4
|
$ 18,116
|
$ (10,666)
|
$ (5)
|
| Stock-based compensation related activity, net of forfeitures, value |
|
115
|
|
115
|
|
|
| Purchases and retirement of common stock, value |
|
(29)
|
|
(29)
|
|
|
| Common stock dividends/distributions |
|
(1,363)
|
|
|
(1,363)
|
|
| Net income (loss) |
|
874
|
|
|
874
|
|
| Balance, shares Period End at Jun. 30, 2023 |
|
|
434
|
|
|
|
| Balance, value Period End at Jun. 30, 2023 |
|
7,046
|
$ 4
|
18,202
|
(11,155)
|
(5)
|
| Share-Based Compensation Arrangement by Share-Based Payment Award, Shares Issued in Period |
|
|
1
|
|
|
|
| Total other comprehensive income (loss) |
[1] |
0
|
|
|
|
0
|
| Foreign currency translation adjustments |
[1] |
0
|
|
|
|
|
| Balance, shares Period Start at Mar. 31, 2023 |
|
|
434
|
|
|
|
| Balance, value Period Start at Mar. 31, 2023 |
|
7,223
|
$ 4
|
18,154
|
(10,929)
|
(6)
|
| Stock-based compensation related activity, net of forfeitures, value |
|
49
|
|
49
|
|
|
| Purchases and retirement of common stock, value |
|
(1)
|
|
(1)
|
|
|
| Common stock dividends/distributions |
|
(681)
|
|
|
(681)
|
|
| Net income (loss) |
|
455
|
|
|
455
|
|
| Balance, shares Period End at Jun. 30, 2023 |
|
|
434
|
|
|
|
| Balance, value Period End at Jun. 30, 2023 |
|
7,046
|
$ 4
|
18,202
|
(11,155)
|
(5)
|
| Share-Based Compensation Arrangement by Share-Based Payment Award, Shares Issued in Period |
|
|
0
|
|
|
|
| Total other comprehensive income (loss) |
[1] |
1
|
|
|
|
1
|
| Foreign currency translation adjustments |
[1] |
$ 1
|
|
|
|
|
| Balance, shares Period Start at Dec. 31, 2023 |
|
434
|
434
|
|
|
|
| Balance, value Period Start at Dec. 31, 2023 |
|
$ 6,381
|
$ 4
|
18,270
|
(11,889)
|
(4)
|
| Stock-based compensation related activity, net of forfeitures, value |
|
107
|
|
107
|
|
|
| Purchases and retirement of common stock, value |
|
(30)
|
|
(30)
|
|
|
| Common stock dividends/distributions |
|
(1,367)
|
|
|
(1,367)
|
|
| Net income (loss) |
|
$ 562
|
|
|
562
|
|
| Balance, shares Period End at Jun. 30, 2024 |
|
435
|
435
|
|
|
|
| Balance, value Period End at Jun. 30, 2024 |
|
$ 5,652
|
$ 4
|
18,347
|
(12,694)
|
(5)
|
| Share-Based Compensation Arrangement by Share-Based Payment Award, Shares Issued in Period |
|
|
1
|
|
|
|
| Total other comprehensive income (loss) |
[1] |
(1)
|
|
|
|
(1)
|
| Foreign currency translation adjustments |
[1] |
(1)
|
|
|
|
|
| Balance, shares Period Start at Mar. 31, 2024 |
|
|
435
|
|
|
|
| Balance, value Period Start at Mar. 31, 2024 |
|
6,048
|
$ 4
|
18,310
|
(12,261)
|
(5)
|
| Stock-based compensation related activity, net of forfeitures, value |
|
40
|
|
40
|
|
|
| Purchases and retirement of common stock, value |
|
(3)
|
|
(3)
|
|
|
| Common stock dividends/distributions |
|
(684)
|
|
|
(684)
|
|
| Net income (loss) |
|
$ 251
|
|
|
251
|
|
| Balance, shares Period End at Jun. 30, 2024 |
|
435
|
435
|
|
|
|
| Balance, value Period End at Jun. 30, 2024 |
|
$ 5,652
|
$ 4
|
$ 18,347
|
$ (12,694)
|
(5)
|
| Share-Based Compensation Arrangement by Share-Based Payment Award, Shares Issued in Period |
|
|
0
|
|
|
|
| Total other comprehensive income (loss) |
[1] |
0
|
|
|
|
$ 0
|
| Foreign currency translation adjustments |
[1] |
$ 0
|
|
|
|
|
|
|
| X |
- DefinitionNumber of shares of common stock outstanding. Common stock represent the ownership interest in a corporation. Reference 1: http://fasb.org/us-gaap/role/ref/legacyRef
-Name Accounting Standards Codification
-Section 50
-Paragraph 2
-SubTopic 10
-Topic 505
-Publisher FASB
-URI https://asc.fasb.org/1943274/2147481112/505-10-50-2
Reference 2: http://fasb.org/us-gaap/role/ref/legacyRef
-Topic 210
-SubTopic 10
-Name Accounting Standards Codification
-Section S99
-Paragraph 1
-Subparagraph (SX 210.5-02(29))
-Publisher FASB
-URI https://asc.fasb.org/1943274/2147480566/210-10-S99-1
Reference 3: http://www.xbrl.org/2003/role/disclosureRef
-Topic 946
-SubTopic 210
-Name Accounting Standards Codification
-Section S99
-Paragraph 2
-Subparagraph (SX 210.6-05(4))
-Publisher FASB
-URI https://asc.fasb.org/1943274/2147479170/946-210-S99-2
Reference 4: http://www.xbrl.org/2009/role/commonPracticeRef
-Topic 946
-SubTopic 220
-Name Accounting Standards Codification
-Section S99
-Paragraph 3
-Subparagraph (SX 210.6-09(4)(b))
-Publisher FASB
-URI https://asc.fasb.org/1943274/2147479134/946-220-S99-3
Reference 5: http://www.xbrl.org/2003/role/disclosureRef
-Topic 946
-SubTopic 210
-Name Accounting Standards Codification
-Section S99
-Paragraph 1
-Subparagraph (SX 210.6-04(16)(a))
-Publisher FASB
-URI https://asc.fasb.org/1943274/2147479170/946-210-S99-1
Reference 6: http://www.xbrl.org/2009/role/commonPracticeRef
-Topic 946
-SubTopic 220
-Name Accounting Standards Codification
-Section S99
-Paragraph 3
-Subparagraph (SX 210.6-09(7))
-Publisher FASB
-URI https://asc.fasb.org/1943274/2147479134/946-220-S99-3
| Name: |
us-gaap_CommonStockSharesOutstanding |
| Namespace Prefix: |
us-gaap_ |
| Data Type: |
xbrli:sharesItemType |
| Balance Type: |
na |
| Period Type: |
instant |
|
| X |
- DefinitionAmount of paid and unpaid common stock dividends declared with the form of settlement in cash, stock and payment-in-kind (PIK). Reference 1: http://fasb.org/us-gaap/role/ref/legacyRef
-Topic 505
-SubTopic 10
-Name Accounting Standards Codification
-Section S99
-Paragraph 1
-Subparagraph (SX 210.3-04)
-Publisher FASB
-URI https://asc.fasb.org/1943274/2147480008/505-10-S99-1
Reference 2: http://fasb.org/us-gaap/role/ref/legacyRef
-Name Accounting Standards Codification
-Section 45
-Paragraph 2
-SubTopic 405
-Topic 942
-Publisher FASB
-URI https://asc.fasb.org/1943274/2147477787/942-405-45-2
| Name: |
us-gaap_DividendsCommonStock |
| Namespace Prefix: |
us-gaap_ |
| Data Type: |
xbrli:monetaryItemType |
| Balance Type: |
debit |
| Period Type: |
duration |
|
| X |
- DefinitionAmount after tax and reclassification adjustments of gain (loss) on foreign currency translation adjustments, foreign currency transactions designated and effective as economic hedges of a net investment in a foreign entity and intra-entity foreign currency transactions that are of a long-term-investment nature. Reference 1: http://fasb.org/us-gaap/role/ref/legacyRef
-Name Accounting Standards Codification
-Section 45
-Paragraph 10A
-Subparagraph (a)
-SubTopic 10
-Topic 220
-Publisher FASB
-URI https://asc.fasb.org/1943274/2147482790/220-10-45-10A
Reference 2: http://www.xbrl.org/2003/role/disclosureRef
-Topic 944
-SubTopic 220
-Name Accounting Standards Codification
-Section S99
-Paragraph 1
-Subparagraph (SX 210.7-04(19))
-Publisher FASB
-URI https://asc.fasb.org/1943274/2147477250/944-220-S99-1
| Name: |
us-gaap_OtherComprehensiveIncomeLossForeignCurrencyTransactionAndTranslationAdjustmentNetOfTax |
| Namespace Prefix: |
us-gaap_ |
| Data Type: |
xbrli:monetaryItemType |
| Balance Type: |
credit |
| Period Type: |
duration |
|
| X |
- DefinitionAmount after tax and reclassification adjustments of other comprehensive income (loss). Reference 1: http://fasb.org/us-gaap/role/ref/legacyRef
-Name Accounting Standards Codification
-Section 50
-Paragraph 2
-SubTopic 10
-Topic 505
-Publisher FASB
-URI https://asc.fasb.org/1943274/2147481112/505-10-50-2
Reference 2: http://www.xbrl.org/2003/role/disclosureRef
-Topic 250
-SubTopic 10
-Name Accounting Standards Codification
-Section 50
-Paragraph 6
-Publisher FASB
-URI https://asc.fasb.org/1943274/2147483443/250-10-50-6
Reference 3: http://www.xbrl.org/2003/role/disclosureRef
-Topic 830
-SubTopic 30
-Name Accounting Standards Codification
-Section 50
-Paragraph 1
-Publisher FASB
-URI https://asc.fasb.org/1943274/2147481674/830-30-50-1
Reference 4: http://www.xbrl.org/2003/role/disclosureRef
-Topic 830
-SubTopic 30
-Name Accounting Standards Codification
-Section 45
-Paragraph 17
-Publisher FASB
-URI https://asc.fasb.org/1943274/2147481694/830-30-45-17
Reference 5: http://www.xbrl.org/2003/role/disclosureRef
-Topic 944
-SubTopic 220
-Name Accounting Standards Codification
-Section S99
-Paragraph 1
-Subparagraph (SX 210.7-04(19))
-Publisher FASB
-URI https://asc.fasb.org/1943274/2147477250/944-220-S99-1
Reference 6: http://www.xbrl.org/2009/role/commonPracticeRef
-Topic 220
-SubTopic 10
-Name Accounting Standards Codification
-Section 50
-Paragraph 4
-Publisher FASB
-URI https://asc.fasb.org/1943274/2147482765/220-10-50-4
Reference 7: http://www.xbrl.org/2009/role/commonPracticeRef
-Topic 220
-SubTopic 10
-Name Accounting Standards Codification
-Section 50
-Paragraph 5
-Publisher FASB
-URI https://asc.fasb.org/1943274/2147482765/220-10-50-5
Reference 8: http://www.xbrl.org/2003/role/disclosureRef
-Topic 830
-SubTopic 30
-Name Accounting Standards Codification
-Section 45
-Paragraph 20
-Publisher FASB
-URI https://asc.fasb.org/1943274/2147481694/830-30-45-20
Reference 9: http://www.xbrl.org/2003/role/disclosureRef
-Topic 220
-SubTopic 10
-Name Accounting Standards Codification
-Section S99
-Paragraph 2
-Subparagraph (SX 210.5-03(21))
-Publisher FASB
-URI https://asc.fasb.org/1943274/2147483621/220-10-S99-2
Reference 10: http://www.xbrl.org/2003/role/disclosureRef
-Topic 942
-SubTopic 220
-Name Accounting Standards Codification
-Section S99
-Paragraph 1
-Subparagraph (SX 210.9-04(23))
-Publisher FASB
-URI https://asc.fasb.org/1943274/2147478524/942-220-S99-1
Reference 11: http://www.xbrl.org/2003/role/disclosureRef
-Topic 220
-SubTopic 10
-Name Accounting Standards Codification
-Section 45
-Paragraph 1B
-Subparagraph (b)
-Publisher FASB
-URI https://asc.fasb.org/1943274/2147482790/220-10-45-1B
Reference 12: http://fasb.org/us-gaap/role/ref/legacyRef
-Name Accounting Standards Codification
-Section 55
-Paragraph 15
-SubTopic 10
-Topic 220
-Publisher FASB
-URI https://asc.fasb.org/1943274/2147482739/220-10-55-15
Reference 13: http://www.xbrl.org/2003/role/disclosureRef
-Topic 220
-SubTopic 10
-Name Accounting Standards Codification
-Section 45
-Paragraph 1A
-Subparagraph (b)
-Publisher FASB
-URI https://asc.fasb.org/1943274/2147482790/220-10-45-1A
| Name: |
us-gaap_OtherComprehensiveIncomeLossNetOfTax |
| Namespace Prefix: |
us-gaap_ |
| Data Type: |
xbrli:monetaryItemType |
| Balance Type: |
credit |
| Period Type: |
duration |
|
| X |
- DefinitionThe consolidated profit or loss for the period, net of income taxes, including the portion attributable to the noncontrolling interest. Reference 1: http://www.xbrl.org/2003/role/disclosureRef
-Topic 250
-SubTopic 10
-Name Accounting Standards Codification
-Section 50
-Paragraph 6
-Publisher FASB
-URI https://asc.fasb.org/1943274/2147483443/250-10-50-6
Reference 2: http://www.xbrl.org/2003/role/disclosureRef
-Topic 250
-SubTopic 10
-Name Accounting Standards Codification
-Section 50
-Paragraph 9
-Publisher FASB
-URI https://asc.fasb.org/1943274/2147483443/250-10-50-9
Reference 3: http://www.xbrl.org/2003/role/disclosureRef
-Topic 805
-SubTopic 60
-Name Accounting Standards Codification
-Section 65
-Paragraph 1
-Subparagraph (g)
-Publisher FASB
-URI https://asc.fasb.org/1943274/2147476176/805-60-65-1
Reference 4: http://www.xbrl.org/2003/role/disclosureRef
-Topic 740
-SubTopic 323
-Name Accounting Standards Codification
-Section 65
-Paragraph 2
-Subparagraph (g)(3)
-Publisher FASB
-URI https://asc.fasb.org/1943274/2147478666/740-323-65-2
Reference 5: http://www.xbrl.org/2003/role/disclosureRef
-Topic 235
-SubTopic 10
-Name Accounting Standards Codification
-Section S99
-Paragraph 1
-Subparagraph (SX 210.4-08(g)(1)(ii))
-Publisher FASB
-URI https://asc.fasb.org/1943274/2147480678/235-10-S99-1
Reference 6: http://www.xbrl.org/2003/role/disclosureRef
-Topic 323
-SubTopic 10
-Name Accounting Standards Codification
-Section 50
-Paragraph 3
-Subparagraph (c)
-Publisher FASB
-URI https://asc.fasb.org/1943274/2147481687/323-10-50-3
Reference 7: http://www.xbrl.org/2003/role/disclosureRef
-Topic 825
-SubTopic 10
-Name Accounting Standards Codification
-Section 50
-Paragraph 28
-Subparagraph (f)
-Publisher FASB
-URI https://asc.fasb.org/1943274/2147482907/825-10-50-28
Reference 8: http://www.xbrl.org/2003/role/disclosureRef
-Topic 250
-SubTopic 10
-Name Accounting Standards Codification
-Section 50
-Paragraph 1
-Subparagraph (b)(2)
-Publisher FASB
-URI https://asc.fasb.org/1943274/2147483443/250-10-50-1
Reference 9: http://www.xbrl.org/2003/role/disclosureRef
-Topic 815
-SubTopic 40
-Name Accounting Standards Codification
-Section 65
-Paragraph 1
-Subparagraph (f)
-Publisher FASB
-URI https://asc.fasb.org/1943274/2147480175/815-40-65-1
Reference 10: http://www.xbrl.org/2003/role/disclosureRef
-Topic 250
-SubTopic 10
-Name Accounting Standards Codification
-Section 50
-Paragraph 8
-Publisher FASB
-URI https://asc.fasb.org/1943274/2147483443/250-10-50-8
Reference 11: http://www.xbrl.org/2003/role/exampleRef
-Topic 946
-SubTopic 830
-Name Accounting Standards Codification
-Section 55
-Paragraph 11
-Publisher FASB
-URI https://asc.fasb.org/1943274/2147479168/946-830-55-11
Reference 12: http://www.xbrl.org/2003/role/disclosureRef
-Topic 946
-SubTopic 205
-Name Accounting Standards Codification
-Section 45
-Paragraph 3
-Subparagraph (a)
-Publisher FASB
-URI https://asc.fasb.org/1943274/2147478009/946-205-45-3
Reference 13: http://www.xbrl.org/2003/role/disclosureRef
-Topic 946
-SubTopic 220
-Name Accounting Standards Codification
-Section 45
-Paragraph 7
-Publisher FASB
-URI https://asc.fasb.org/1943274/2147479105/946-220-45-7
Reference 14: http://www.xbrl.org/2003/role/disclosureRef
-Topic 944
-SubTopic 220
-Name Accounting Standards Codification
-Section S99
-Paragraph 1
-Subparagraph (SX 210.7-04(16))
-Publisher FASB
-URI https://asc.fasb.org/1943274/2147477250/944-220-S99-1
Reference 15: http://www.xbrl.org/2003/role/disclosureRef
-Topic 946
-SubTopic 220
-Name Accounting Standards Codification
-Section S99
-Paragraph 1
-Subparagraph (SX 210.6-07(9))
-Publisher FASB
-URI https://asc.fasb.org/1943274/2147479134/946-220-S99-1
Reference 16: http://www.xbrl.org/2003/role/disclosureRef
-Topic 946
-SubTopic 220
-Name Accounting Standards Codification
-Section S99
-Paragraph 3
-Subparagraph (SX 210.6-09(1)(d))
-Publisher FASB
-URI https://asc.fasb.org/1943274/2147479134/946-220-S99-3
Reference 17: http://www.xbrl.org/2003/role/disclosureRef
-Topic 810
-SubTopic 10
-Name Accounting Standards Codification
-Section 45
-Paragraph 19
-Publisher FASB
-URI https://asc.fasb.org/1943274/2147481231/810-10-45-19
Reference 18: http://www.xbrl.org/2009/role/commonPracticeRef
-Topic 220
-SubTopic 10
-Name Accounting Standards Codification
-Section 50
-Paragraph 6
-Publisher FASB
-URI https://asc.fasb.org/1943274/2147482765/220-10-50-6
Reference 19: http://www.xbrl.org/2003/role/disclosureRef
-Topic 470
-SubTopic 10
-Name Accounting Standards Codification
-Section S99
-Paragraph 1A
-Subparagraph (SX 210.13-01(a)(4)(i))
-Publisher FASB
-URI https://asc.fasb.org/1943274/2147480097/470-10-S99-1A
Reference 20: http://www.xbrl.org/2009/role/commonPracticeRef
-Topic 470
-SubTopic 10
-Name Accounting Standards Codification
-Section S99
-Paragraph 1A
-Subparagraph (SX 210.13-01(a)(4)(ii))
-Publisher FASB
-URI https://asc.fasb.org/1943274/2147480097/470-10-S99-1A
Reference 21: http://www.xbrl.org/2003/role/disclosureRef
-Topic 470
-SubTopic 10
-Name Accounting Standards Codification
-Section S99
-Paragraph 1A
-Subparagraph (SX 210.13-01(a)(4)(iii)(A))
-Publisher FASB
-URI https://asc.fasb.org/1943274/2147480097/470-10-S99-1A
Reference 22: http://www.xbrl.org/2003/role/disclosureRef
-Topic 470
-SubTopic 10
-Name Accounting Standards Codification
-Section S99
-Paragraph 1A
-Subparagraph (SX 210.13-01(a)(4)(iv))
-Publisher FASB
-URI https://asc.fasb.org/1943274/2147480097/470-10-S99-1A
Reference 23: http://www.xbrl.org/2003/role/disclosureRef
-Topic 470
-SubTopic 10
-Name Accounting Standards Codification
-Section S99
-Paragraph 1A
-Subparagraph (SX 210.13-01(a)(5))
-Publisher FASB
-URI https://asc.fasb.org/1943274/2147480097/470-10-S99-1A
Reference 24: http://www.xbrl.org/2003/role/disclosureRef
-Topic 470
-SubTopic 10
-Name Accounting Standards Codification
-Section S99
-Paragraph 1B
-Subparagraph (SX 210.13-02(a)(4)(i))
-Publisher FASB
-URI https://asc.fasb.org/1943274/2147480097/470-10-S99-1B
Reference 25: http://www.xbrl.org/2003/role/disclosureRef
-Topic 470
-SubTopic 10
-Name Accounting Standards Codification
-Section S99
-Paragraph 1B
-Subparagraph (SX 210.13-02(a)(4)(iii)(A))
-Publisher FASB
-URI https://asc.fasb.org/1943274/2147480097/470-10-S99-1B
Reference 26: http://www.xbrl.org/2003/role/disclosureRef
-Topic 470
-SubTopic 10
-Name Accounting Standards Codification
-Section S99
-Paragraph 1B
-Subparagraph (SX 210.13-02(a)(4)(iii)(B))
-Publisher FASB
-URI https://asc.fasb.org/1943274/2147480097/470-10-S99-1B
Reference 27: http://www.xbrl.org/2003/role/disclosureRef
-Topic 470
-SubTopic 10
-Name Accounting Standards Codification
-Section S99
-Paragraph 1B
-Subparagraph (SX 210.13-02(a)(4)(iv))
-Publisher FASB
-URI https://asc.fasb.org/1943274/2147480097/470-10-S99-1B
Reference 28: http://www.xbrl.org/2003/role/disclosureRef
-Topic 470
-SubTopic 10
-Name Accounting Standards Codification
-Section S99
-Paragraph 1B
-Subparagraph (SX 210.13-02(a)(5))
-Publisher FASB
-URI https://asc.fasb.org/1943274/2147480097/470-10-S99-1B
Reference 29: http://www.xbrl.org/2003/role/disclosureRef
-Topic 942
-SubTopic 235
-Name Accounting Standards Codification
-Section S99
-Paragraph 1
-Subparagraph (SX 210.9-05(b)(2))
-Publisher FASB
-URI https://asc.fasb.org/1943274/2147477314/942-235-S99-1
Reference 30: http://www.xbrl.org/2003/role/disclosureRef
-Topic 205
-SubTopic 20
-Name Accounting Standards Codification
-Section 50
-Paragraph 7
-Publisher FASB
-URI https://asc.fasb.org/1943274/2147483499/205-20-50-7
Reference 31: http://www.xbrl.org/2003/role/exampleRef
-Topic 810
-SubTopic 10
-Name Accounting Standards Codification
-Section 55
-Paragraph 4J
-Publisher FASB
-URI https://asc.fasb.org/1943274/2147481175/810-10-55-4J
Reference 32: http://www.xbrl.org/2003/role/exampleRef
-Topic 810
-SubTopic 10
-Name Accounting Standards Codification
-Section 55
-Paragraph 4K
-Publisher FASB
-URI https://asc.fasb.org/1943274/2147481175/810-10-55-4K
Reference 33: http://www.xbrl.org/2003/role/disclosureRef
-Topic 220
-SubTopic 10
-Name Accounting Standards Codification
-Section 45
-Paragraph 1A
-Subparagraph (a)
-Publisher FASB
-URI https://asc.fasb.org/1943274/2147482790/220-10-45-1A
Reference 34: http://www.xbrl.org/2003/role/disclosureRef
-Topic 220
-SubTopic 10
-Name Accounting Standards Codification
-Section 45
-Paragraph 1B
-Subparagraph (a)
-Publisher FASB
-URI https://asc.fasb.org/1943274/2147482790/220-10-45-1B
Reference 35: http://www.xbrl.org/2003/role/disclosureRef
-Topic 230
-SubTopic 10
-Name Accounting Standards Codification
-Section 45
-Paragraph 2
-Publisher FASB
-URI https://asc.fasb.org/1943274/2147482740/230-10-45-2
Reference 36: http://www.xbrl.org/2003/role/disclosureRef
-Topic 810
-SubTopic 10
-Name Accounting Standards Codification
-Section 50
-Paragraph 1A
-Subparagraph (a)(1)
-Publisher FASB
-URI https://asc.fasb.org/1943274/2147481203/810-10-50-1A
Reference 37: http://www.xbrl.org/2003/role/disclosureRef
-Topic 810
-SubTopic 10
-Name Accounting Standards Codification
-Section 50
-Paragraph 1A
-Subparagraph (c)(1)
-Publisher FASB
-URI https://asc.fasb.org/1943274/2147481203/810-10-50-1A
| Name: |
us-gaap_ProfitLoss |
| Namespace Prefix: |
us-gaap_ |
| Data Type: |
xbrli:monetaryItemType |
| Balance Type: |
credit |
| Period Type: |
duration |
|
| X |
- DefinitionNumber of shares issued under share-based payment arrangement. Reference 1: http://fasb.org/us-gaap/role/ref/legacyRef
-Name Accounting Standards Codification
-Topic 718
-SubTopic 10
-Section 50
-Paragraph 2
-Publisher FASB
-URI https://asc.fasb.org/1943274/2147480429/718-10-50-2
| Name: |
us-gaap_ShareBasedCompensationArrangementByShareBasedPaymentAwardSharesIssuedInPeriod |
| Namespace Prefix: |
us-gaap_ |
| Data Type: |
xbrli:sharesItemType |
| Balance Type: |
na |
| Period Type: |
duration |
|
| X |
- DefinitionValue, after forfeiture, of shares issued under share-based payment arrangement. Excludes employee stock ownership plan (ESOP). Reference 1: http://fasb.org/us-gaap/role/ref/legacyRef
-Topic 210
-SubTopic 10
-Name Accounting Standards Codification
-Section S99
-Paragraph 1
-Subparagraph (SX 210.5-02(28))
-Publisher FASB
-URI https://asc.fasb.org/1943274/2147480566/210-10-S99-1
Reference 2: http://fasb.org/us-gaap/role/ref/legacyRef
-Topic 210
-SubTopic 10
-Name Accounting Standards Codification
-Section S99
-Paragraph 1
-Subparagraph (SX 210.5-02(29))
-Publisher FASB
-URI https://asc.fasb.org/1943274/2147480566/210-10-S99-1
Reference 3: http://fasb.org/us-gaap/role/ref/legacyRef
-Topic 505
-SubTopic 10
-Name Accounting Standards Codification
-Section S99
-Paragraph 1
-Subparagraph (SX 210.3-04)
-Publisher FASB
-URI https://asc.fasb.org/1943274/2147480008/505-10-S99-1
Reference 4: http://fasb.org/us-gaap/role/ref/legacyRef
-Name Accounting Standards Codification
-Topic 718
-SubTopic 10
-Section 50
-Paragraph 2
-Subparagraph (d)(1)
-Publisher FASB
-URI https://asc.fasb.org/1943274/2147480429/718-10-50-2
| Name: |
us-gaap_StockIssuedDuringPeriodValueShareBasedCompensation |
| Namespace Prefix: |
us-gaap_ |
| Data Type: |
xbrli:monetaryItemType |
| Balance Type: |
credit |
| Period Type: |
duration |
|
| X |
- DefinitionEquity impact of the value of stock that has been repurchased and retired during the period. The excess of the purchase price over par value can be charged against retained earnings (once the excess is fully allocated to additional paid in capital). Reference 1: http://fasb.org/us-gaap/role/ref/legacyRef
-Name Accounting Standards Codification
-Section 50
-Paragraph 2
-SubTopic 10
-Topic 505
-Publisher FASB
-URI https://asc.fasb.org/1943274/2147481112/505-10-50-2
Reference 2: http://fasb.org/us-gaap/role/ref/legacyRef
-Topic 210
-SubTopic 10
-Name Accounting Standards Codification
-Section S99
-Paragraph 1
-Subparagraph (SX 210.5-02(28))
-Publisher FASB
-URI https://asc.fasb.org/1943274/2147480566/210-10-S99-1
Reference 3: http://fasb.org/us-gaap/role/ref/legacyRef
-Topic 210
-SubTopic 10
-Name Accounting Standards Codification
-Section S99
-Paragraph 1
-Subparagraph (SX 210.5-02(29))
-Publisher FASB
-URI https://asc.fasb.org/1943274/2147480566/210-10-S99-1
Reference 4: http://fasb.org/us-gaap/role/ref/legacyRef
-Topic 505
-SubTopic 10
-Name Accounting Standards Codification
-Section S99
-Paragraph 1
-Subparagraph (SX 210.3-04)
-Publisher FASB
-URI https://asc.fasb.org/1943274/2147480008/505-10-S99-1
| Name: |
us-gaap_StockRepurchasedAndRetiredDuringPeriodValue |
| Namespace Prefix: |
us-gaap_ |
| Data Type: |
xbrli:monetaryItemType |
| Balance Type: |
debit |
| Period Type: |
duration |
|
| X |
- DefinitionAmount of equity (deficit) attributable to parent and noncontrolling interest. Excludes temporary equity. Reference 1: http://www.xbrl.org/2003/role/disclosureRef
-Topic 250
-SubTopic 10
-Name Accounting Standards Codification
-Section 50
-Paragraph 6
-Publisher FASB
-URI https://asc.fasb.org/1943274/2147483443/250-10-50-6
Reference 2: http://www.xbrl.org/2003/role/disclosureRef
-Topic 805
-SubTopic 60
-Name Accounting Standards Codification
-Section 65
-Paragraph 1
-Subparagraph (g)
-Publisher FASB
-URI https://asc.fasb.org/1943274/2147476176/805-60-65-1
Reference 3: http://www.xbrl.org/2003/role/disclosureRef
-Topic 805
-SubTopic 60
-Name Accounting Standards Codification
-Section 65
-Paragraph 1
-Subparagraph (d)(1)
-Publisher FASB
-URI https://asc.fasb.org/1943274/2147476176/805-60-65-1
Reference 4: http://www.xbrl.org/2003/role/disclosureRef
-Topic 740
-SubTopic 323
-Name Accounting Standards Codification
-Section 65
-Paragraph 2
-Subparagraph (e)
-Publisher FASB
-URI https://asc.fasb.org/1943274/2147478666/740-323-65-2
Reference 5: http://www.xbrl.org/2003/role/disclosureRef
-Topic 740
-SubTopic 323
-Name Accounting Standards Codification
-Section 65
-Paragraph 2
-Subparagraph (g)(4)
-Publisher FASB
-URI https://asc.fasb.org/1943274/2147478666/740-323-65-2
Reference 6: http://www.xbrl.org/2003/role/disclosureRef
-Topic 740
-SubTopic 323
-Name Accounting Standards Codification
-Section 65
-Paragraph 2
-Subparagraph (d)(2)
-Publisher FASB
-URI https://asc.fasb.org/1943274/2147478666/740-323-65-2
Reference 7: http://www.xbrl.org/2003/role/disclosureRef
-Topic 740
-SubTopic 323
-Name Accounting Standards Codification
-Section 65
-Paragraph 2
-Subparagraph (d)(1)
-Publisher FASB
-URI https://asc.fasb.org/1943274/2147478666/740-323-65-2
Reference 8: http://www.xbrl.org/2003/role/disclosureRef
-Topic 848
-SubTopic 10
-Name Accounting Standards Codification
-Section 65
-Paragraph 2
-Subparagraph (a)(3)(iii)(03)
-Publisher FASB
-URI https://asc.fasb.org/1943274/2147483550/848-10-65-2
Reference 9: http://www.xbrl.org/2003/role/disclosureRef
-Topic 842
-SubTopic 10
-Name Accounting Standards Codification
-Section 65
-Paragraph 8
-Subparagraph (c)(3)
-Publisher FASB
-URI https://asc.fasb.org/1943274/2147479832/842-10-65-8
Reference 10: http://www.xbrl.org/2003/role/disclosureRef
-Topic 250
-SubTopic 10
-Name Accounting Standards Codification
-Section 45
-Paragraph 24
-Publisher FASB
-URI https://asc.fasb.org/1943274/2147483421/250-10-45-24
Reference 11: http://www.xbrl.org/2003/role/disclosureRef
-Topic 250
-SubTopic 10
-Name Accounting Standards Codification
-Section 45
-Paragraph 23
-Subparagraph (b)
-Publisher FASB
-URI https://asc.fasb.org/1943274/2147483421/250-10-45-23
Reference 12: http://www.xbrl.org/2003/role/disclosureRef
-Topic 250
-SubTopic 10
-Name Accounting Standards Codification
-Section 45
-Paragraph 5
-Subparagraph (b)
-Publisher FASB
-URI https://asc.fasb.org/1943274/2147483421/250-10-45-5
Reference 13: http://www.xbrl.org/2003/role/disclosureRef
-Topic 326
-SubTopic 10
-Name Accounting Standards Codification
-Section 65
-Paragraph 5
-Subparagraph (c)(2)
-Publisher FASB
-URI https://asc.fasb.org/1943274/2147479654/326-10-65-5
Reference 14: http://www.xbrl.org/2003/role/disclosureRef
-Topic 815
-SubTopic 20
-Name Accounting Standards Codification
-Section 65
-Paragraph 6
-Subparagraph (e)
-Publisher FASB
-URI https://asc.fasb.org/1943274/2147480528/815-20-65-6
Reference 15: http://www.xbrl.org/2003/role/disclosureRef
-Topic 815
-SubTopic 20
-Name Accounting Standards Codification
-Section 65
-Paragraph 6
-Subparagraph (h)(1)
-Publisher FASB
-URI https://asc.fasb.org/1943274/2147480528/815-20-65-6
Reference 16: http://www.xbrl.org/2003/role/disclosureRef
-Topic 815
-SubTopic 20
-Name Accounting Standards Codification
-Section 65
-Paragraph 6
-Subparagraph (h)(1)(i)
-Publisher FASB
-URI https://asc.fasb.org/1943274/2147480528/815-20-65-6
Reference 17: http://www.xbrl.org/2003/role/disclosureRef
-Topic 815
-SubTopic 20
-Name Accounting Standards Codification
-Section 65
-Paragraph 6
-Subparagraph (h)(1)(iii)
-Publisher FASB
-URI https://asc.fasb.org/1943274/2147480528/815-20-65-6
Reference 18: http://www.xbrl.org/2003/role/disclosureRef
-Topic 815
-SubTopic 20
-Name Accounting Standards Codification
-Section 65
-Paragraph 6
-Subparagraph (h)(1)(iv)
-Publisher FASB
-URI https://asc.fasb.org/1943274/2147480528/815-20-65-6
Reference 19: http://www.xbrl.org/2003/role/disclosureRef
-Topic 815
-SubTopic 20
-Name Accounting Standards Codification
-Section 65
-Paragraph 6
-Subparagraph (i)(3)
-Publisher FASB
-URI https://asc.fasb.org/1943274/2147480528/815-20-65-6
Reference 20: http://www.xbrl.org/2003/role/disclosureRef
-Topic 105
-SubTopic 10
-Name Accounting Standards Codification
-Section 65
-Paragraph 6
-Subparagraph (c)
-Publisher FASB
-URI https://asc.fasb.org/1943274/2147479343/105-10-65-6
Reference 21: http://www.xbrl.org/2003/role/disclosureRef
-Topic 105
-SubTopic 10
-Name Accounting Standards Codification
-Section 65
-Paragraph 6
-Subparagraph (d)
-Publisher FASB
-URI https://asc.fasb.org/1943274/2147479343/105-10-65-6
Reference 22: http://www.xbrl.org/2003/role/disclosureRef
-Topic 944
-SubTopic 40
-Name Accounting Standards Codification
-Section 65
-Paragraph 2
-Subparagraph (f)(1)
-Publisher FASB
-URI https://asc.fasb.org/1943274/2147480016/944-40-65-2
Reference 23: http://www.xbrl.org/2003/role/disclosureRef
-Topic 944
-SubTopic 40
-Name Accounting Standards Codification
-Section 65
-Paragraph 2
-Subparagraph (f)(2)
-Publisher FASB
-URI https://asc.fasb.org/1943274/2147480016/944-40-65-2
Reference 24: http://www.xbrl.org/2003/role/disclosureRef
-Topic 740
-SubTopic 10
-Name Accounting Standards Codification
-Section 65
-Paragraph 8
-Subparagraph (d)(2)
-Publisher FASB
-URI https://asc.fasb.org/1943274/2147482615/740-10-65-8
Reference 25: http://www.xbrl.org/2003/role/disclosureRef
-Topic 740
-SubTopic 10
-Name Accounting Standards Codification
-Section 65
-Paragraph 8
-Subparagraph (d)(3)
-Publisher FASB
-URI https://asc.fasb.org/1943274/2147482615/740-10-65-8
Reference 26: http://www.xbrl.org/2003/role/disclosureRef
-Topic 326
-SubTopic 10
-Name Accounting Standards Codification
-Section 65
-Paragraph 4
-Subparagraph (d)
-Publisher FASB
-URI https://asc.fasb.org/1943274/2147479654/326-10-65-4
Reference 27: http://www.xbrl.org/2003/role/disclosureRef
-Topic 250
-SubTopic 10
-Name Accounting Standards Codification
-Section 50
-Paragraph 1
-Subparagraph (b)(3)
-Publisher FASB
-URI https://asc.fasb.org/1943274/2147483443/250-10-50-1
Reference 28: http://www.xbrl.org/2003/role/disclosureRef
-Topic 815
-SubTopic 40
-Name Accounting Standards Codification
-Section 65
-Paragraph 1
-Subparagraph (e)(3)
-Publisher FASB
-URI https://asc.fasb.org/1943274/2147480175/815-40-65-1
Reference 29: http://www.xbrl.org/2003/role/disclosureRef
-Topic 250
-SubTopic 10
-Name Accounting Standards Codification
-Section 50
-Paragraph 7
-Subparagraph (b)
-Publisher FASB
-URI https://asc.fasb.org/1943274/2147483443/250-10-50-7
Reference 30: http://www.xbrl.org/2003/role/disclosureRef
-Topic 220
-SubTopic 10
-Name Accounting Standards Codification
-Section 50
-Paragraph 5
-Publisher FASB
-URI https://asc.fasb.org/1943274/2147482765/220-10-50-5
Reference 31: http://www.xbrl.org/2003/role/disclosureRef
-Topic 830
-SubTopic 30
-Name Accounting Standards Codification
-Section 50
-Paragraph 1
-Publisher FASB
-URI https://asc.fasb.org/1943274/2147481674/830-30-50-1
Reference 32: http://www.xbrl.org/2003/role/disclosureRef
-Topic 830
-SubTopic 30
-Name Accounting Standards Codification
-Section 45
-Paragraph 17
-Publisher FASB
-URI https://asc.fasb.org/1943274/2147481694/830-30-45-17
Reference 33: http://www.xbrl.org/2003/role/disclosureRef
-Topic 830
-SubTopic 30
-Name Accounting Standards Codification
-Section 45
-Paragraph 20
-Subparagraph (a)
-Publisher FASB
-URI https://asc.fasb.org/1943274/2147481694/830-30-45-20
Reference 34: http://www.xbrl.org/2003/role/exampleRef
-Topic 946
-SubTopic 830
-Name Accounting Standards Codification
-Section 55
-Paragraph 11
-Publisher FASB
-URI https://asc.fasb.org/1943274/2147479168/946-830-55-11
Reference 35: http://www.xbrl.org/2003/role/disclosureRef
-Topic 946
-SubTopic 205
-Name Accounting Standards Codification
-Section 45
-Paragraph 3
-Publisher FASB
-URI https://asc.fasb.org/1943274/2147478009/946-205-45-3
Reference 36: http://www.xbrl.org/2003/role/disclosureRef
-Topic 946
-SubTopic 505
-Name Accounting Standards Codification
-Section 50
-Paragraph 3
-Publisher FASB
-URI https://asc.fasb.org/1943274/2147478448/946-505-50-3
Reference 37: http://www.xbrl.org/2003/role/disclosureRef
-Topic 946
-SubTopic 210
-Name Accounting Standards Codification
-Section S99
-Paragraph 1
-Subparagraph (SX 210.6-04(19))
-Publisher FASB
-URI https://asc.fasb.org/1943274/2147479170/946-210-S99-1
Reference 38: http://www.xbrl.org/2003/role/disclosureRef
-Topic 946
-SubTopic 210
-Name Accounting Standards Codification
-Section S99
-Paragraph 2
-Subparagraph (SX 210.6-05(4))
-Publisher FASB
-URI https://asc.fasb.org/1943274/2147479170/946-210-S99-2
Reference 39: http://www.xbrl.org/2009/role/commonPracticeRef
-Topic 946
-SubTopic 220
-Name Accounting Standards Codification
-Section S99
-Paragraph 3
-Subparagraph (SX 210.6-09(4)(b))
-Publisher FASB
-URI https://asc.fasb.org/1943274/2147479134/946-220-S99-3
Reference 40: http://www.xbrl.org/2003/role/disclosureRef
-Topic 946
-SubTopic 220
-Name Accounting Standards Codification
-Section S99
-Paragraph 3
-Subparagraph (SX 210.6-09(6))
-Publisher FASB
-URI https://asc.fasb.org/1943274/2147479134/946-220-S99-3
Reference 41: http://www.xbrl.org/2003/role/disclosureRef
-Topic 946
-SubTopic 220
-Name Accounting Standards Codification
-Section S99
-Paragraph 3
-Subparagraph (SX 210.6-09(7))
-Publisher FASB
-URI https://asc.fasb.org/1943274/2147479134/946-220-S99-3
Reference 42: http://www.xbrl.org/2003/role/disclosureRef
-Topic 505
-SubTopic 10
-Name Accounting Standards Codification
-Section S99
-Paragraph 1
-Subparagraph (SX 210.3-04)
-Publisher FASB
-URI https://asc.fasb.org/1943274/2147480008/505-10-S99-1
Reference 43: http://www.xbrl.org/2009/role/commonPracticeRef
-Topic 235
-SubTopic 10
-Name Accounting Standards Codification
-Section S99
-Paragraph 1
-Subparagraph (SX 210.4-08(g)(1)(ii))
-Publisher FASB
-URI https://asc.fasb.org/1943274/2147480678/235-10-S99-1
Reference 44: http://www.xbrl.org/2009/role/commonPracticeRef
-Topic 323
-SubTopic 10
-Name Accounting Standards Codification
-Section 50
-Paragraph 3
-Subparagraph (c)
-Publisher FASB
-URI https://asc.fasb.org/1943274/2147481687/323-10-50-3
Reference 45: http://www.xbrl.org/2009/role/commonPracticeRef
-Topic 825
-SubTopic 10
-Name Accounting Standards Codification
-Section 50
-Paragraph 28
-Subparagraph (f)
-Publisher FASB
-URI https://asc.fasb.org/1943274/2147482907/825-10-50-28
Reference 46: http://fasb.org/us-gaap/role/ref/legacyRef
-Name Accounting Standards Codification
-Topic 810
-SubTopic 10
-Section 45
-Paragraph 15
-Publisher FASB
-URI https://asc.fasb.org/1943274/2147481231/810-10-45-15
Reference 47: http://fasb.org/us-gaap/role/ref/legacyRef
-Name Accounting Standards Codification
-Topic 810
-SubTopic 10
-Section 45
-Paragraph 16
-Publisher FASB
-URI https://asc.fasb.org/1943274/2147481231/810-10-45-16
Reference 48: http://fasb.org/us-gaap/role/ref/legacyRef
-Name Accounting Standards Codification
-Topic 810
-SubTopic 10
-Section 55
-Paragraph 4I
-Publisher FASB
-URI https://asc.fasb.org/1943274/2147481175/810-10-55-4I
Reference 49: http://www.xbrl.org/2003/role/disclosureRef
-Topic 350
-SubTopic 60
-Name Accounting Standards Codification
-Section 65
-Paragraph 1
-Subparagraph (b)
-Publisher FASB
-URI https://asc.fasb.org/1943274/2147476166/350-60-65-1
| Name: |
us-gaap_StockholdersEquityIncludingPortionAttributableToNoncontrollingInterest |
| Namespace Prefix: |
us-gaap_ |
| Data Type: |
xbrli:monetaryItemType |
| Balance Type: |
credit |
| Period Type: |
instant |
|
v3.24.2
General
|
6 Months Ended |
Jun. 30, 2024 |
|---|
| General |
|
| General |
General The information contained in the following notes to the condensed consolidated financial statements is condensed from that which would appear in the annual consolidated financial statements; accordingly, the condensed consolidated financial statements included herein should be reviewed in conjunction with the consolidated financial statements for the fiscal year ended December 31, 2023, and related notes thereto, included in the 2023 Form 10-K filed by Crown Castle Inc. ("CCI") with the SEC. Capitalized terms used but not defined in these notes to the condensed consolidated financial statements have the same meaning given to them in the 2023 Form 10-K. References to the "Company" refer to CCI and its predecessor, as applicable, and their subsidiaries, unless otherwise indicated or the context indicates otherwise. As used herein, the term "including," and any variation thereof means "including without limitation." The use of the word "or" herein is not exclusive. Unless the context suggests otherwise, references to "U.S." are to the United States of America and Puerto Rico, collectively. The Company owns, operates and leases shared communications infrastructure that is geographically dispersed throughout the U.S., including (1) towers and other structures, such as rooftops (collectively, "towers"), and (2) fiber primarily supporting small cell networks ("small cells") and fiber solutions. The Company's towers, small cells and fiber assets are collectively referred to herein as "communications infrastructure," and the Company's customers on its communications infrastructure are referred to herein as "tenants." The Company's core business is providing access, including space or capacity, to its shared communications infrastructure via long-term contracts in various forms, including lease, license, sublease and service agreements (collectively, "tenant contracts"). The Company's operating segments consist of (1) Towers and (2) Fiber. See note 10. As part of the Company's effort to provide comprehensive communications infrastructure solutions, as an ancillary business, the Company also offers certain services primarily relating to its Towers segment. For the periods presented, such services predominately consisted of (1) site development services relating to existing or new tenant equipment installations, including: site acquisition, architectural and engineering, or zoning and permitting (collectively, "site development services") and (2) tenant equipment installation or subsequent augmentations (collectively, "installation services"). See note 12 to the condensed consolidated financial statements for a discussion of (1) the Company's July 2023 restructuring plan ("2023 Restructuring Plan"), which included discontinuing installation services as a Towers product offering and (2) the Company's June 2024 restructuring plan ("2024 Restructuring Plan, and together with the 2023 Restructuring Plan, "Restructuring Plans"). The Company operates as a REIT for U.S. federal income tax purposes. In addition, the Company has certain taxable REIT subsidiaries ("TRSs"). See note 6. Approximately 53% of the Company's towers are leased or subleased or operated and managed under master leases, subleases, and other agreements with AT&T and T-Mobile (including those which T-Mobile assumed in its merger with Sprint). The Company has the option to purchase these towers at the end of their respective lease terms. The Company has no obligation to exercise such purchase options. Basis of Presentation The condensed consolidated financial statements included herein are unaudited; however, they include all adjustments (consisting only of normal recurring adjustments) which, in the opinion of management, are necessary to state fairly the condensed consolidated financial position of the Company as of June 30, 2024, the condensed consolidated results of operations for the three and six months ended June 30, 2024 and 2023, and the condensed consolidated cash flows for the six months ended June 30, 2024 and 2023. The year-end condensed consolidated balance sheet data was derived from audited financial statements, but does not include all disclosures required by GAAP. The results of operations for the interim periods presented are not necessarily indicative of the results to be expected for the full year. The preparation of financial statements in conformity with GAAP requires management to make estimates and assumptions that affect the reported amounts of assets and liabilities, the disclosure of contingent assets and liabilities as of the date of the financial statements, and the reported amounts of revenues and expenses during the reporting period. Actual results could differ from those estimates.
|
| X |
- DefinitionThe entire disclosure for the business description and basis of presentation concepts. Business description describes the nature and type of organization including but not limited to organizational structure as may be applicable to holding companies, parent and subsidiary relationships, business divisions, business units, business segments, affiliates and information about significant ownership of the reporting entity. Basis of presentation describes the underlying basis used to prepare the financial statements (for example, US Generally Accepted Accounting Principles, Other Comprehensive Basis of Accounting, IFRS). Reference 1: http://fasb.org/us-gaap/role/ref/legacyRef
-Topic 235
-Name Accounting Standards Codification
-Publisher FASB
-URI https://asc.fasb.org/235/tableOfContent
Reference 2: http://fasb.org/us-gaap/role/ref/legacyRef
-Topic 275
-Name Accounting Standards Codification
-Publisher FASB
-URI https://asc.fasb.org/275/tableOfContent
Reference 3: http://fasb.org/us-gaap/role/ref/legacyRef
-Topic 205
-Name Accounting Standards Codification
-Publisher FASB
-URI https://asc.fasb.org/205/tableOfContent
| Name: |
us-gaap_BusinessDescriptionAndBasisOfPresentationTextBlock |
| Namespace Prefix: |
us-gaap_ |
| Data Type: |
dtr-types:textBlockItemType |
| Balance Type: |
na |
| Period Type: |
duration |
|
v3.24.2
Summary of Significant Accounting Policies
|
6 Months Ended |
Jun. 30, 2024 |
|---|
| Accounting Policies [Abstract] |
|
| Significant Accounting Policies |
Summary of Significant Accounting Policies Recently Adopted Accounting Pronouncements No accounting pronouncements adopted during the six months ended June 30, 2024 had a material impact on the Company's condensed consolidated financial statements. Recent Accounting Pronouncements Not Yet Adopted In November 2023, the FASB issued new guidance that is designed to improve reportable segment disclosure requirements, primarily through enhanced disclosure of significant segment expenses. The new guidance also expands interim segment disclosure requirements and requires disclosure of the position and title of the Company's chief operating decision-maker. The guidance will be effective for the Company's fiscal year ending December 31, 2024 and for interim periods starting in the first quarter of fiscal year 2025 with early adoption permitted. The guidance is required to be applied retrospectively to each prior reporting period presented. The Company is currently evaluating the effect of the guidance, including the impact on its consolidated financial statements and related disclosures. In December 2023, the FASB issued new guidance that enhances the transparency and decision usefulness of income tax disclosures, primarily through changes to the rate reconciliation and income taxes paid disclosures. The guidance will be effective for the Company's fiscal year ending December 31, 2025, and can be applied prospectively or retrospectively, with early adoption permitted. The Company is currently evaluating the effect of the guidance, including the impact on its consolidated financial statements and related disclosures.
|
| X |
- References
+ Details
| Name: |
us-gaap_AccountingPoliciesAbstract |
| Namespace Prefix: |
us-gaap_ |
| Data Type: |
xbrli:stringItemType |
| Balance Type: |
na |
| Period Type: |
duration |
|
| X |
- DefinitionThe entire disclosure for all significant accounting policies of the reporting entity. Reference 1: http://www.xbrl.org/2003/role/disclosureRef
-Topic 235
-SubTopic 10
-Name Accounting Standards Codification
-Section 50
-Paragraph 1
-Publisher FASB
-URI https://asc.fasb.org/1943274/2147483426/235-10-50-1
Reference 2: http://fasb.org/us-gaap/role/ref/legacyRef
-Topic 235
-Name Accounting Standards Codification
-Publisher FASB
-URI https://asc.fasb.org/235/tableOfContent
| Name: |
us-gaap_SignificantAccountingPoliciesTextBlock |
| Namespace Prefix: |
us-gaap_ |
| Data Type: |
dtr-types:textBlockItemType |
| Balance Type: |
na |
| Period Type: |
duration |
|
v3.24.2
Revenues (Notes)
|
6 Months Ended |
Jun. 30, 2024 |
|---|
| Revenue from Contract with Customer [Abstract] |
|
| Revenue from Contract with Customer [Text Block] |
Revenues Site Rental Revenues The Company generates site rental revenues from its core business by providing tenants with access, including space or capacity, to its shared communications infrastructure via long-term tenant contracts in various forms, including lease, license, sublease and service agreements. Typically, providing such access over the length of the tenant contract term represents the Company’s sole performance obligation under its tenant contracts. Site rental revenues from the Company's tenant contracts are recognized on a straight-line, ratable basis over the fixed, non-cancelable term of the relevant tenant contract, which generally ranges between five to 15 years for wireless tenants and one to 20 years for fiber solutions tenants (including from organizations with high-bandwidth and multi-location demands), regardless of whether the payments from the tenant are received in equal monthly amounts during the life of the tenant contract. Certain of the Company's tenant contracts contain (1) fixed escalation clauses (such as fixed dollar or fixed percentage increases) or inflation-based escalation clauses (such as those tied to the CPI), (2) multiple renewal periods exercisable at the tenant's option and (3) only limited termination rights at the applicable tenant's option through the current term. If the payment terms call for fixed escalators, upfront payments, or rent-free periods, the revenue is recognized on a straight-line basis over the fixed, non-cancelable term of the tenant contract. When calculating straight-line rental revenues, the Company considers all fixed elements of tenant contractual escalation provisions, even if such escalation provisions contain a variable element in addition to a minimum. The Company's assets related to straight-line site rental revenues are recorded within "Current portion of deferred site rental receivables" and "Deferred site rental receivables" on the Company's condensed consolidated balance sheet. Amounts billed or received prior to being earned are deferred and reflected in "Deferred revenues" and "Other long-term liabilities" on the Company's condensed consolidated balance sheet. Amounts to which the Company has an unconditional right to payment, which are related to both satisfied or partially satisfied performance obligations, are recorded within "Receivables, net" on the Company's condensed consolidated balance sheet. Payments Associated with Sprint Cancellations. For the three and six months ended June 30, 2024, site rental revenues include $1 million and $4 million, respectively, and for three and six months ended June 30, 2023, $106 million and $154 million, respectively, of payments in the Company's Fiber segment to satisfy the remaining rental obligations of certain canceled Sprint leases as a result of the T-Mobile US, Inc. and Sprint network consolidation. In connection with such canceled Sprint leases, the Company also recognized $57 million of accelerated prepaid rent amortization in the Company's Fiber segment during the three and six months ended June 30, 2023. Services and Other Revenues As part of the Company’s effort to provide comprehensive communications infrastructure solutions, as an ancillary business, the Company offers certain services primarily relating to its Towers segment, predominately consisting of (1) site development services and (2) installation services. See note 12 to the condensed consolidated financial statements for a discussion of the Company's 2023 Restructuring Plan, which included discontinuing installation services as a Towers product offering. Upon contract commencement, the Company assesses its services to tenants and identifies performance obligations for each promise to provide a distinct service. The Company may have multiple performance obligations for site development services, which primarily include: structural analysis, zoning, permitting and construction drawings. For each of these performance obligations, services revenues are recognized at completion of the applicable performance obligation, which represents the point at which the Company believes it has transferred goods or services to the tenant. The services revenue recognized is based on an allocation of the transaction price among the performance obligations in a respective tenant contract based on estimated standalone selling price. The volume and mix of site development services may vary among tenant contracts and may include a combination of some or all of the above performance obligations. Amounts are billed per contractual milestones, with payments generally due within 45 to 90 days, and generally do not contain variable-consideration provisions. The transaction price for the Company's tower installation services consists of amounts for (1) permanent improvements to the Company's towers that represent a lease component and (2) the performance of the service. Amounts under the Company's tower installation service agreements that represent a lease component are recognized as site rental revenues on a straight-line basis over the length of the associated estimated lease term. For the performance of the installation service, the Company has one performance obligation, which is satisfied at the time of the applicable installation or augmentation and recognized as services and other revenues on the Company's condensed consolidated statement of operations and comprehensive income (loss). Since performance obligations are typically satisfied prior to receiving payment from tenants, the unconditional right to payment is recorded within "Receivables, net" on the Company’s condensed consolidated balance sheet. Generally, the services the Company provides to its tenants have a duration of one year or less. Additional Information on Revenues As of January 1, 2024 and June 30, 2024, $2.1 billion and $2.0 billion of unrecognized revenues, respectively, were reported in "Deferred revenues" and "Other long-term liabilities" on the Company's condensed consolidated balance sheet. During the six months ended June 30, 2024, approximately $270 million of the January 1, 2024 unrecognized revenues balance was recognized as revenues. As of January 1, 2023, $2.3 billion of unrecognized revenues were reported in "Deferred revenues" and "Other long-term liabilities" on the Company's condensed consolidated balance sheet. During the six months ended June 30, 2023, approximately $360 million of the January 1, 2023 unrecognized revenues balance was recognized as revenues. The following table is a summary of the contracted amounts owed to the Company by tenants pursuant to tenant contracts in effect as of June 30, 2024. | | | | | | | | | | | | | | | | | | | | | | | | | | | | | | | | | | | | | | | | | | | | | | | Six Months Ending December 31, | | Years Ending December 31, | | | | | | | 2024 | | 2025 | | 2026 | | 2027 | | 2028 | | Thereafter | | Total | Contracted amounts(a) | | $ | 2,595 | | | $ | 4,891 | | | $ | 4,729 | | | $ | 4,603 | | | $ | 4,381 | | | $ | 16,134 | | | $ | 37,333 | |
(a)Based on the nature of the contract, tenant contracts are accounted for pursuant to relevant lease accounting (ASC 842) or revenue accounting (ASC 606) guidance. Excludes amounts related to services, as those contracts generally have a duration of one year or less. See note 10 for further information regarding the Company's operating segments.
|
| X |
- References
+ Details
| Name: |
us-gaap_RevenueFromContractWithCustomerAbstract |
| Namespace Prefix: |
us-gaap_ |
| Data Type: |
xbrli:stringItemType |
| Balance Type: |
na |
| Period Type: |
duration |
|
| X |
- DefinitionThe entire disclosure of revenue from contract with customer to transfer good or service and to transfer nonfinancial asset. Includes, but is not limited to, disaggregation of revenue, credit loss recognized from contract with customer, judgment and change in judgment related to contract with customer, and asset recognized from cost incurred to obtain or fulfill contract with customer. Excludes insurance and lease contracts. Reference 1: http://www.xbrl.org/2003/role/disclosureRef
-Topic 606
-SubTopic 10
-Name Accounting Standards Codification
-Section 50
-Paragraph 9
-Publisher FASB
-URI https://asc.fasb.org/1943274/2147479806/606-10-50-9
Reference 2: http://www.xbrl.org/2003/role/disclosureRef
-Topic 606
-SubTopic 10
-Name Accounting Standards Codification
-Section 50
-Paragraph 10
-Publisher FASB
-URI https://asc.fasb.org/1943274/2147479806/606-10-50-10
Reference 3: http://www.xbrl.org/2003/role/disclosureRef
-Topic 606
-SubTopic 10
-Name Accounting Standards Codification
-Section 50
-Paragraph 15
-Publisher FASB
-URI https://asc.fasb.org/1943274/2147479806/606-10-50-15
Reference 4: http://www.xbrl.org/2003/role/disclosureRef
-Topic 606
-SubTopic 10
-Name Accounting Standards Codification
-Section 50
-Paragraph 12
-Subparagraph (a)
-Publisher FASB
-URI https://asc.fasb.org/1943274/2147479806/606-10-50-12
Reference 5: http://www.xbrl.org/2003/role/disclosureRef
-Topic 606
-SubTopic 10
-Name Accounting Standards Codification
-Section 50
-Paragraph 12
-Subparagraph (b)
-Publisher FASB
-URI https://asc.fasb.org/1943274/2147479806/606-10-50-12
Reference 6: http://www.xbrl.org/2003/role/disclosureRef
-Topic 606
-SubTopic 10
-Name Accounting Standards Codification
-Section 50
-Paragraph 12
-Subparagraph (c)
-Publisher FASB
-URI https://asc.fasb.org/1943274/2147479806/606-10-50-12
Reference 7: http://www.xbrl.org/2003/role/disclosureRef
-Topic 606
-SubTopic 10
-Name Accounting Standards Codification
-Section 50
-Paragraph 12
-Subparagraph (d)
-Publisher FASB
-URI https://asc.fasb.org/1943274/2147479806/606-10-50-12
Reference 8: http://www.xbrl.org/2003/role/disclosureRef
-Topic 606
-SubTopic 10
-Name Accounting Standards Codification
-Section 50
-Paragraph 12
-Subparagraph (e)
-Publisher FASB
-URI https://asc.fasb.org/1943274/2147479806/606-10-50-12
Reference 9: http://www.xbrl.org/2003/role/disclosureRef
-Topic 606
-SubTopic 10
-Name Accounting Standards Codification
-Section 50
-Paragraph 13
-Subparagraph (b)(2)
-Publisher FASB
-URI https://asc.fasb.org/1943274/2147479806/606-10-50-13
Reference 10: http://www.xbrl.org/2003/role/disclosureRef
-Name Accounting Standards Codification
-Topic 606
-Publisher FASB
-URI https://asc.fasb.org/606/tableOfContent
| Name: |
us-gaap_RevenueFromContractWithCustomerTextBlock |
| Namespace Prefix: |
us-gaap_ |
| Data Type: |
dtr-types:textBlockItemType |
| Balance Type: |
na |
| Period Type: |
duration |
|
v3.24.2
Debt and Other Obligations
|
6 Months Ended |
Jun. 30, 2024 |
|---|
| Debt and Other Obligations [Abstract] |
|
| Debt Disclosure |
Debt and Other Obligations The table below sets forth the Company's debt and other obligations as of June 30, 2024. | | | | | | | | | | | | | | | | | | | | | | | | | | | | | | | | | | Original
Issue Date | | Final Maturity Date(a) | | Balance as of June 30, 2024 | | Balance as of December 31, 2023 | | Stated Interest Rate as of June 30, 2024(a)(b) | | | Secured Notes, Series 2009-1, Class A-2 | July 2009 | | Aug. 2029 | | $ | 36 | | | $ | 40 | | | 9.0 | % | | | Tower Revenue Notes, Series 2015-2 | May 2015 | | May 2045 | (c) | 699 | | | 698 | | | 3.7 | % | | | Tower Revenue Notes, Series 2018-2 | July 2018 | | July 2048 | (c) | 747 | | | 746 | | | 4.2 | % | | Installment purchase liabilities and finance leases | Various | (d) | Various | (d) | 295 | | (e) | 270 | | (e) | Various | (d) | | Total secured debt | | | | | 1,777 | | | 1,754 | | | | | | 2016 Revolver | Jan. 2016 | | July 2027 | | — | | (f) | 670 | | | N/A | (g) | | 2016 Term Loan A | Jan. 2016 | | July 2027 | | 1,155 | | | 1,162 | | | 6.4 | % | (g) | | Commercial Paper Notes | Various | (h) | Various | (h) | 1,438 | | (h) | — | | | 5.9 | % | | | 3.200% Senior Notes | Aug. 2017 | | Sept. 2024 | | 750 | | | 749 | | | 3.2 | % | | | 1.350% Senior Notes | June 2020 | | July 2025 | | 499 | | | 498 | | | 1.4 | % | | | 4.450% Senior Notes | Feb. 2016 | | Feb. 2026 | | 898 | | | 898 | | | 4.5 | % | | | 3.700% Senior Notes | May 2016 | | June 2026 | | 748 | | | 748 | | | 3.7 | % | | | 1.050% Senior Notes | Feb. 2021 | | July 2026 | | 996 | | | 994 | | | 1.1 | % | | | 4.000% Senior Notes | Feb. 2017 | | Mar. 2027 | | 498 | | | 498 | | | 4.0 | % | | | 2.900% Senior Notes | Mar. 2022 | | Mar. 2027 | | 745 | | | 744 | | | 2.9 | % | | | 3.650% Senior Notes | Aug. 2017 | | Sept. 2027 | | 997 | | | 997 | | | 3.7 | % | | | 5.000% Senior Notes | Jan. 2023 | | Jan. 2028 | | 992 | | | 991 | | | 5.0 | % | | | 3.800% Senior Notes | Jan. 2018 | | Feb. 2028 | | 995 | | | 995 | | | 3.8 | % | | | 4.800% Senior Notes | Apr. 2023 | | Sept. 2028 | | 595 | | | 594 | | | 4.8 | % | | | 4.300% Senior Notes | Feb. 2019 | | Feb. 2029 | | 596 | | | 595 | | | 4.3 | % | | | 5.600% Senior Notes | Dec. 2023 | | June 2029 | | 741 | | | 740 | | | 5.6 | % | | | 3.100% Senior Notes | Aug. 2019 | | Nov. 2029 | | 546 | | | 546 | | | 3.1 | % | | | 3.300% Senior Notes | Apr. 2020 | | July 2030 | | 741 | | | 741 | | | 3.3 | % | | | 2.250% Senior Notes | June 2020 | | Jan. 2031 | | 1,092 | | | 1,091 | | | 2.3 | % | | | 2.100% Senior Notes | Feb. 2021 | | Apr. 2031 | | 991 | | | 990 | | | 2.1 | % | | | 2.500% Senior Notes | June 2021 | | July 2031 | | 743 | | | 743 | | | 2.5 | % | | | 5.100% Senior Notes | Apr. 2023 | | May 2033 | | 743 | | | 743 | | | 5.1 | % | | 5.800% Senior Notes | Dec. 2023 | | Mar. 2034 | | 742 | | | 740 | | | 5.8 | % | | | 2.900% Senior Notes | Feb. 2021 | | Apr. 2041 | | 1,235 | | | 1,234 | | | 2.9 | % | | | 4.750% Senior Notes | May 2017 | | May 2047 | | 344 | | | 344 | | | 4.8 | % | | | 5.200% Senior Notes | Feb. 2019 | | Feb. 2049 | | 396 | | | 396 | | | 5.2 | % | | | 4.000% Senior Notes | Aug. 2019 | | Nov. 2049 | | 346 | | | 346 | | | 4.0 | % | | | 4.150% Senior Notes | Apr. 2020 | | July 2050 | | 490 | | | 490 | | | 4.2 | % | | | 3.250% Senior Notes | June 2020 | | Jan. 2051 | | 890 | | | 890 | | | 3.3 | % | | | Total unsecured debt | | | | | 21,942 | | | 21,167 | | | | | | Total debt and other obligations | | | | | 23,719 | | | 22,921 | | | | | | Less: current maturities of debt and other obligations | | 865 | | | 835 | | | | | | Non-current portion of debt and other long-term obligations | | $ | 22,854 | | | $ | 22,086 | | | | |
(a)See the 2023 Form 10-K, including note 7 to the consolidated financial statements, for additional information regarding the maturity and principal amortization provisions and interest rates relating to the Company's indebtedness. (b)Represents the weighted-average stated interest rate, as applicable. (c)If the Tower Revenue Notes, Series 2015-2 and Series 2018-2 (collectively, "Tower Revenue Notes") are not paid in full on or prior to an applicable anticipated repayment date, then Excess Cash Flow (as defined in the indenture governing the terms of such notes) of the issuers of such notes will be used to repay principal of the applicable series and class of the Tower Revenue Notes, and additional interest (of an additional approximately 5% per annum) will accrue on the respective Tower Revenue Notes. As of June 30, 2024, the Tower Revenue Notes, Series 2015-2 and Series 2018-2 have principal amounts of $700 million and $750 million, with anticipated repayment dates in 2025 and 2028, respectively. (d)The Company's installment purchases primarily relate to land and bear interest rates up to 8% and mature in periods ranging from less than one year to approximately 25 years. (e)For the periods ended June 30, 2024 and December 31, 2023, reflects $27 million and $18 million, respectively, in finance lease obligations (primarily related to vehicles). (f)As of June 30, 2024, the undrawn availability under the Company's senior unsecured revolving credit facility ("2016 Revolver") was $7.0 billion. (g)Both the 2016 Revolver and the senior unsecured term loan A facility ("2016 Term Loan A" and, collectively, "2016 Credit Facility") bear interest, at the Company's option, at either (1) Term SOFR plus (i) a credit spread adjustment of 0.10% per annum and (ii) a credit spread ranging from 0.875% to 1.750% per annum or (2) an alternate base rate plus a credit spread ranging from 0.000% to 0.750% per annum, in each case, with the applicable credit spread based on the Company's senior unsecured debt rating. The Company pays a commitment fee ranging from 0.080% to 0.300%, based on the Company's senior unsecured debt rating, per annum on the undrawn available amount under the 2016 Revolver. See the 2023 Form 10-K, including note 7 to the consolidated financial statements, for information regarding potential adjustments to such percentages. (h)The maturities of the Commercial Paper Notes, when outstanding, may vary but may not exceed 397 days from the date of issue, but there were no Commercial Paper Notes issued or outstanding during the period that had original maturities greater than three months. The Commercial Paper Notes are issued under customary terms in the commercial paper market and are issued at a discount from par or, alternatively, can be issued at par and bear varying interest rates on a fixed or floating basis. At any point in time, the Company intends to maintain available commitments under its 2016 Revolver in an amount at least equal to the amount of Commercial Paper Notes outstanding. While any outstanding Commercial Paper Notes generally have short-term maturities, the Company classifies the outstanding issuances, when applicable, as long-term based on its ability and intent to refinance the outstanding issuances on a long-term basis.
Scheduled Principal Payments and Final Maturities The following are the scheduled principal payments and final maturities of the total debt and other long-term obligations of the Company outstanding as of June 30, 2024, which do not consider the principal payments that will commence following the anticipated repayment dates on the Tower Revenue Notes. | | | | | | | | | | | | | | | | | | | | | | | | | | | | | | | | | | | | | | | | | | | | | | | | | | | | | | | | Six Months Ending December 31, | | Years Ending December 31, | | | | Total Cash Obligations | | Unamortized Adjustments, Net | | Total Debt and Other Obligations Outstanding | | | 2024 | | 2025 | | 2026 | | 2027 | | 2028 | | Thereafter | | | | Scheduled principal payments and final maturities | $ | 2,249 | | (a) | $ | 605 | | | $ | 2,784 | | | $ | 3,254 | | | $ | 2,632 | |
| $ | 12,350 | | | $ | 23,874 | | | $ | (155) | | | $ | 23,719 | |
(a)Predominately consists of outstanding indebtedness under the CP Program as discussed in footnote (h) of the preceding table and $750 million aggregate principal amount of 3.200% senior unsecured notes due September 2024. Interest Expense and Amortization of Deferred Financing Costs, Net The components of interest expense and amortization of deferred financing costs, net are as follows: | | | | | | | | | | | | | | | | | | | | | | | | | Three Months Ended June 30, | | Six Months Ended June 30, | | 2024 | | 2023 | | 2024 | | 2023 | | Interest expense on debt obligations | $ | 227 | | | $ | 205 | | | $ | 450 | | | $ | 403 | | | Amortization of deferred financing costs and adjustments on long-term debt | 8 | | | 7 | | | 16 | | | 14 | | | Capitalized interest | (5) | | | (4) | | | (10) | | | (7) | | | Total | $ | 230 | | | $ | 208 | | | $ | 456 | | | $ | 410 | |
|
| X |
- DefinitionDebt and Other Obligations [Abstract}
| Name: |
cci_DebtAndOtherObligationsAbstract |
| Namespace Prefix: |
cci_ |
| Data Type: |
xbrli:stringItemType |
| Balance Type: |
na |
| Period Type: |
duration |
|
| X |
- DefinitionThe entire disclosure for information about short-term and long-term debt arrangements, which includes amounts of borrowings under each line of credit, note payable, commercial paper issue, bonds indenture, debenture issue, own-share lending arrangements and any other contractual agreement to repay funds, and about the underlying arrangements, rationale for a classification as long-term, including repayment terms, interest rates, collateral provided, restrictions on use of assets and activities, whether or not in compliance with debt covenants, and other matters important to users of the financial statements, such as the effects of refinancing and noncompliance with debt covenants. Reference 1: http://www.xbrl.org/2003/role/disclosureRef
-Topic 470
-SubTopic 10
-Name Accounting Standards Codification
-Section 50
-Paragraph 6
-Subparagraph (b)
-Publisher FASB
-URI https://asc.fasb.org/1943274/2147481544/470-10-50-6
Reference 2: http://www.xbrl.org/2003/role/disclosureRef
-Topic 470
-SubTopic 10
-Name Accounting Standards Codification
-Section 50
-Paragraph 6
-Subparagraph (a)
-Publisher FASB
-URI https://asc.fasb.org/1943274/2147481544/470-10-50-6
Reference 3: http://www.xbrl.org/2003/role/disclosureRef
-Topic 405
-SubTopic 40
-Name Accounting Standards Codification
-Section 50
-Paragraph 1
-Subparagraph (d)
-Publisher FASB
-URI https://asc.fasb.org/1943274/2147477092/405-40-50-1
Reference 4: http://www.xbrl.org/2003/role/disclosureRef
-Topic 405
-SubTopic 40
-Name Accounting Standards Codification
-Section 50
-Paragraph 1
-Subparagraph (a)(3)
-Publisher FASB
-URI https://asc.fasb.org/1943274/2147477092/405-40-50-1
Reference 5: http://www.xbrl.org/2003/role/disclosureRef
-Topic 405
-SubTopic 40
-Name Accounting Standards Codification
-Section 50
-Paragraph 1
-Subparagraph (a)(2)
-Publisher FASB
-URI https://asc.fasb.org/1943274/2147477092/405-40-50-1
Reference 6: http://www.xbrl.org/2003/role/disclosureRef
-Topic 405
-SubTopic 40
-Name Accounting Standards Codification
-Section 50
-Paragraph 1
-Subparagraph (a)(1)
-Publisher FASB
-URI https://asc.fasb.org/1943274/2147477092/405-40-50-1
Reference 7: http://www.xbrl.org/2003/role/disclosureRef
-Topic 405
-SubTopic 40
-Name Accounting Standards Codification
-Section 50
-Paragraph 1
-Subparagraph (a)
-Publisher FASB
-URI https://asc.fasb.org/1943274/2147477092/405-40-50-1
Reference 8: http://www.xbrl.org/2003/role/disclosureRef
-Topic 470
-SubTopic 20
-Name Accounting Standards Codification
-Section 50
-Paragraph 1B
-Subparagraph (h)
-Publisher FASB
-URI https://asc.fasb.org/1943274/2147481139/470-20-50-1B
Reference 9: http://www.xbrl.org/2003/role/disclosureRef
-Topic 235
-SubTopic 10
-Name Accounting Standards Codification
-Section S99
-Paragraph 1
-Subparagraph (SX 210.4-08(c))
-Publisher FASB
-URI https://asc.fasb.org/1943274/2147480678/235-10-S99-1
Reference 10: http://fasb.org/us-gaap/role/ref/legacyRef
-Topic 470
-Name Accounting Standards Codification
-Publisher FASB
-URI https://asc.fasb.org/470/tableOfContent
Reference 11: http://www.xbrl.org/2003/role/disclosureRef
-Topic 835
-SubTopic 30
-Name Accounting Standards Codification
-Section 45
-Paragraph 2
-Publisher FASB
-URI https://asc.fasb.org/1943274/2147482925/835-30-45-2
Reference 12: http://www.xbrl.org/2003/role/disclosureRef
-Topic 470
-SubTopic 20
-Name Accounting Standards Codification
-Section 50
-Paragraph 1B
-Publisher FASB
-URI https://asc.fasb.org/1943274/2147481139/470-20-50-1B
Reference 13: http://www.xbrl.org/2003/role/disclosureRef
-Topic 470
-SubTopic 20
-Name Accounting Standards Codification
-Section 50
-Paragraph 1B
-Subparagraph (g)
-Publisher FASB
-URI https://asc.fasb.org/1943274/2147481139/470-20-50-1B
Reference 14: http://www.xbrl.org/2003/role/disclosureRef
-Topic 470
-SubTopic 20
-Name Accounting Standards Codification
-Section 50
-Paragraph 1B
-Subparagraph (i)
-Publisher FASB
-URI https://asc.fasb.org/1943274/2147481139/470-20-50-1B
Reference 15: http://www.xbrl.org/2003/role/disclosureRef
-Topic 470
-SubTopic 20
-Name Accounting Standards Codification
-Section 50
-Paragraph 1C
-Subparagraph (a)
-Publisher FASB
-URI https://asc.fasb.org/1943274/2147481139/470-20-50-1C
Reference 16: http://www.xbrl.org/2003/role/disclosureRef
-Topic 470
-SubTopic 20
-Name Accounting Standards Codification
-Section 50
-Paragraph 1C
-Subparagraph (b)
-Publisher FASB
-URI https://asc.fasb.org/1943274/2147481139/470-20-50-1C
Reference 17: http://www.xbrl.org/2003/role/disclosureRef
-Topic 470
-SubTopic 20
-Name Accounting Standards Codification
-Section 50
-Paragraph 1C
-Subparagraph (c)
-Publisher FASB
-URI https://asc.fasb.org/1943274/2147481139/470-20-50-1C
Reference 18: http://www.xbrl.org/2003/role/disclosureRef
-Topic 470
-SubTopic 20
-Name Accounting Standards Codification
-Section 50
-Paragraph 1E
-Subparagraph (b)
-Publisher FASB
-URI https://asc.fasb.org/1943274/2147481139/470-20-50-1E
Reference 19: http://www.xbrl.org/2003/role/disclosureRef
-Topic 470
-SubTopic 20
-Name Accounting Standards Codification
-Section 50
-Paragraph 1I
-Subparagraph (a)
-Publisher FASB
-URI https://asc.fasb.org/1943274/2147481139/470-20-50-1I
Reference 20: http://www.xbrl.org/2003/role/disclosureRef
-Topic 470
-SubTopic 20
-Name Accounting Standards Codification
-Section 50
-Paragraph 1I
-Subparagraph (b)
-Publisher FASB
-URI https://asc.fasb.org/1943274/2147481139/470-20-50-1I
Reference 21: http://www.xbrl.org/2003/role/disclosureRef
-Topic 470
-SubTopic 20
-Name Accounting Standards Codification
-Section 50
-Paragraph 1I
-Subparagraph (d)
-Publisher FASB
-URI https://asc.fasb.org/1943274/2147481139/470-20-50-1I
| Name: |
us-gaap_DebtDisclosureTextBlock |
| Namespace Prefix: |
us-gaap_ |
| Data Type: |
dtr-types:textBlockItemType |
| Balance Type: |
na |
| Period Type: |
duration |
|
v3.24.2
Fair Value Disclosures
|
6 Months Ended |
Jun. 30, 2024 |
|---|
| Fair Value Disclosures [Abstract] |
|
| Fair Value Disclosures |
Fair Value Disclosures | | | | | | | | | | | | | | | | | | | | | | | | | | | | | | | Level in Fair Value Hierarchy | | June 30, 2024 | | December 31, 2023 | | | Carrying Amount | | Fair Value | | Carrying Amount | | Fair Value | | Assets: | | | | | | | | | | | Cash and cash equivalents | 1 | | $ | 155 | | | $ | 155 | | | $ | 105 | | | $ | 105 | | Restricted cash and cash equivalents, current and non-current | 1 | | 176 | | | 176 | | | 176 | | | 176 | | | | | | | | | | | | | Liabilities: | | | | | | | | | | | Total debt and other obligations | 2 | | 23,719 | | | 21,834 | | | 22,921 | | | 21,201 | |
The fair values of cash and cash equivalents and restricted cash and cash equivalents approximate the carrying values. The Company determines the fair value of its debt securities based on indicative, non-binding quotes from brokers. Quotes from brokers require judgment and are based on the brokers' interpretation of market information, including implied credit spreads for similar borrowings on recent trades or bid/ask prices or quotes from active markets if available. Since December 31, 2023, there have been no changes in the Company's valuation techniques used to measure fair values.
|
| X |
- References
+ Details
| Name: |
us-gaap_FairValueDisclosuresAbstract |
| Namespace Prefix: |
us-gaap_ |
| Data Type: |
xbrli:stringItemType |
| Balance Type: |
na |
| Period Type: |
duration |
|
| X |
- DefinitionThe entire disclosure for the fair value of financial instruments (as defined), including financial assets and financial liabilities (collectively, as defined), and the measurements of those instruments as well as disclosures related to the fair value of non-financial assets and liabilities. Such disclosures about the financial instruments, assets, and liabilities would include: (1) the fair value of the required items together with their carrying amounts (as appropriate); (2) for items for which it is not practicable to estimate fair value, disclosure would include: (a) information pertinent to estimating fair value (including, carrying amount, effective interest rate, and maturity, and (b) the reasons why it is not practicable to estimate fair value; (3) significant concentrations of credit risk including: (a) information about the activity, region, or economic characteristics identifying a concentration, (b) the maximum amount of loss the entity is exposed to based on the gross fair value of the related item, (c) policy for requiring collateral or other security and information as to accessing such collateral or security, and (d) the nature and brief description of such collateral or security; (4) quantitative information about market risks and how such risks are managed; (5) for items measured on both a recurring and nonrecurring basis information regarding the inputs used to develop the fair value measurement; and (6) for items presented in the financial statement for which fair value measurement is elected: (a) information necessary to understand the reasons for the election, (b) discussion of the effect of fair value changes on earnings, (c) a description of [similar groups] items for which the election is made and the relation thereof to the balance sheet, the aggregate carrying value of items included in the balance sheet that are not eligible for the election; (7) all other required (as defined) and desired information. Reference 1: http://www.xbrl.org/2003/role/exampleRef
-Topic 820
-SubTopic 10
-Name Accounting Standards Codification
-Section 55
-Paragraph 107
-Publisher FASB
-URI https://asc.fasb.org/1943274/2147482078/820-10-55-107
Reference 2: http://www.xbrl.org/2003/role/exampleRef
-Topic 820
-SubTopic 10
-Name Accounting Standards Codification
-Section 55
-Paragraph 100
-Publisher FASB
-URI https://asc.fasb.org/1943274/2147482078/820-10-55-100
Reference 3: http://www.xbrl.org/2003/role/disclosureRef
-Topic 820
-SubTopic 10
-Name Accounting Standards Codification
-Section 50
-Paragraph 2
-Subparagraph (c)(3)
-Publisher FASB
-URI https://asc.fasb.org/1943274/2147482106/820-10-50-2
Reference 4: http://www.xbrl.org/2003/role/disclosureRef
-Topic 820
-SubTopic 10
-Name Accounting Standards Codification
-Section 50
-Paragraph 6A
-Subparagraph (a)
-Publisher FASB
-URI https://asc.fasb.org/1943274/2147482106/820-10-50-6A
Reference 5: http://www.xbrl.org/2003/role/disclosureRef
-Topic 820
-SubTopic 10
-Name Accounting Standards Codification
-Section 50
-Paragraph 2E
-Publisher FASB
-URI https://asc.fasb.org/1943274/2147482106/820-10-50-2E
Reference 6: http://www.xbrl.org/2003/role/disclosureRef
-Topic 820
-SubTopic 10
-Name Accounting Standards Codification
-Section 50
-Paragraph 6A
-Subparagraph (h)
-Publisher FASB
-URI https://asc.fasb.org/1943274/2147482106/820-10-50-6A
Reference 7: http://www.xbrl.org/2003/role/disclosureRef
-Topic 820
-SubTopic 10
-Name Accounting Standards Codification
-Section 50
-Paragraph 6A
-Subparagraph (f)
-Publisher FASB
-URI https://asc.fasb.org/1943274/2147482106/820-10-50-6A
Reference 8: http://www.xbrl.org/2003/role/disclosureRef
-Topic 820
-SubTopic 10
-Name Accounting Standards Codification
-Section 50
-Paragraph 6A
-Subparagraph (e)
-Publisher FASB
-URI https://asc.fasb.org/1943274/2147482106/820-10-50-6A
Reference 9: http://www.xbrl.org/2003/role/disclosureRef
-Topic 820
-SubTopic 10
-Name Accounting Standards Codification
-Section 50
-Paragraph 6A
-Subparagraph (d)
-Publisher FASB
-URI https://asc.fasb.org/1943274/2147482106/820-10-50-6A
Reference 10: http://www.xbrl.org/2003/role/disclosureRef
-Topic 820
-SubTopic 10
-Name Accounting Standards Codification
-Section 50
-Paragraph 2
-Subparagraph (h)
-Publisher FASB
-URI https://asc.fasb.org/1943274/2147482106/820-10-50-2
Reference 11: http://www.xbrl.org/2003/role/disclosureRef
-Topic 820
-SubTopic 10
-Name Accounting Standards Codification
-Section 50
-Paragraph 2
-Subparagraph (g)
-Publisher FASB
-URI https://asc.fasb.org/1943274/2147482106/820-10-50-2
Reference 12: http://www.xbrl.org/2003/role/disclosureRef
-Topic 940
-SubTopic 820
-Name Accounting Standards Codification
-Section 50
-Paragraph 1
-Subparagraph (a)
-Publisher FASB
-URI https://asc.fasb.org/1943274/2147478119/940-820-50-1
| Name: |
us-gaap_FairValueDisclosuresTextBlock |
| Namespace Prefix: |
us-gaap_ |
| Data Type: |
dtr-types:textBlockItemType |
| Balance Type: |
na |
| Period Type: |
duration |
|
v3.24.2
Income Taxes
|
6 Months Ended |
Jun. 30, 2024 |
|---|
| Income Tax Disclosure [Abstract] |
|
| Income Taxes |
Income Taxes The Company operates as a REIT for U.S. federal income tax purposes. As a REIT, the Company is generally entitled to a deduction for dividends that it pays and, therefore, is not subject to U.S. federal corporate income tax on its net taxable income that is currently distributed to its stockholders. The Company may be subject to certain federal, state, local and foreign taxes on its income, including (1) taxes on any undistributed income and (2) taxes related to the TRSs. In addition, the Company could, under certain circumstances, be required to pay an excise or penalty tax, which could be significant in amount, in order to utilize one or more relief provisions under the Internal Revenue Code of 1986, as amended, to maintain qualification for taxation as a REIT. The Company's TRS assets and operations will continue to be subject, as applicable, to federal and state corporate income taxes or to foreign taxes in the jurisdictions in which such assets and operations are located. The Company's foreign assets and operations (including its tower operations in Puerto Rico) are subject to foreign income taxes in the jurisdictions in which such assets and operations are located, regardless of whether they are included in a TRS or not. For the six months ended June 30, 2024 and 2023, the Company's effective tax rate differed from the federal statutory rate predominately due to the Company's REIT status, including the dividends paid deduction.
|
| X |
- DefinitionThe entire disclosure for income tax. Reference 1: http://www.xbrl.org/2003/role/disclosureRef
-Topic 740
-SubTopic 10
-Name Accounting Standards Codification
-Section 50
-Paragraph 12
-Publisher FASB
-URI https://asc.fasb.org/1943274/2147482685/740-10-50-12
Reference 2: http://www.xbrl.org/2003/role/exampleRef
-Topic 740
-SubTopic 10
-Name Accounting Standards Codification
-Section 55
-Paragraph 231
-Publisher FASB
-URI https://asc.fasb.org/1943274/2147482663/740-10-55-231
Reference 3: http://www.xbrl.org/2003/role/disclosureRef
-Topic 740
-SubTopic 10
-Name Accounting Standards Codification
-Section 50
-Paragraph 12C
-Publisher FASB
-URI https://asc.fasb.org/1943274/2147482685/740-10-50-12C
Reference 4: http://www.xbrl.org/2003/role/disclosureRef
-Topic 740
-SubTopic 10
-Name Accounting Standards Codification
-Section 50
-Paragraph 12B
-Publisher FASB
-URI https://asc.fasb.org/1943274/2147482685/740-10-50-12B
Reference 5: http://www.xbrl.org/2003/role/disclosureRef
-Topic 740
-SubTopic 270
-Name Accounting Standards Codification
-Section 50
-Paragraph 1
-Publisher FASB
-URI https://asc.fasb.org/1943274/2147477891/740-270-50-1
Reference 6: http://www.xbrl.org/2003/role/disclosureRef
-Topic 740
-SubTopic 10
-Name Accounting Standards Codification
-Section S99
-Paragraph 1
-Subparagraph (SAB Topic 6.I.5.Q1)
-Publisher FASB
-URI https://asc.fasb.org/1943274/2147479360/740-10-S99-1
Reference 7: http://www.xbrl.org/2003/role/disclosureRef
-Topic 946
-SubTopic 20
-Name Accounting Standards Codification
-Section 50
-Paragraph 13
-Publisher FASB
-URI https://asc.fasb.org/1943274/2147480990/946-20-50-13
Reference 8: http://www.xbrl.org/2003/role/disclosureRef
-Topic 235
-SubTopic 10
-Name Accounting Standards Codification
-Section S99
-Paragraph 1
-Subparagraph (SX 210.4-08(h)(2))
-Publisher FASB
-URI https://asc.fasb.org/1943274/2147480678/235-10-S99-1
Reference 9: http://www.xbrl.org/2003/role/disclosureRef
-Topic 740
-Name Accounting Standards Codification
-Publisher FASB
-URI https://asc.fasb.org/740/tableOfContent
Reference 10: http://www.xbrl.org/2003/role/disclosureRef
-Topic 740
-SubTopic 10
-Name Accounting Standards Codification
-Section 50
-Paragraph 14
-Publisher FASB
-URI https://asc.fasb.org/1943274/2147482685/740-10-50-14
Reference 11: http://www.xbrl.org/2003/role/disclosureRef
-Topic 740
-SubTopic 10
-Name Accounting Standards Codification
-Section 50
-Paragraph 21
-Publisher FASB
-URI https://asc.fasb.org/1943274/2147482685/740-10-50-21
Reference 12: http://www.xbrl.org/2003/role/disclosureRef
-Topic 740
-SubTopic 10
-Name Accounting Standards Codification
-Section 50
-Paragraph 17
-Subparagraph (b)
-Publisher FASB
-URI https://asc.fasb.org/1943274/2147482685/740-10-50-17
Reference 13: http://www.xbrl.org/2003/role/disclosureRef
-Topic 740
-SubTopic 10
-Name Accounting Standards Codification
-Section S99
-Paragraph 2
-Subparagraph (SAB Topic 11.C)
-Publisher FASB
-URI https://asc.fasb.org/1943274/2147479360/740-10-S99-2
Reference 14: http://www.xbrl.org/2003/role/disclosureRef
-Topic 740
-SubTopic 30
-Name Accounting Standards Codification
-Section 50
-Paragraph 2
-Subparagraph (a)
-Publisher FASB
-URI https://asc.fasb.org/1943274/2147482603/740-30-50-2
| Name: |
us-gaap_IncomeTaxDisclosureTextBlock |
| Namespace Prefix: |
us-gaap_ |
| Data Type: |
dtr-types:textBlockItemType |
| Balance Type: |
na |
| Period Type: |
duration |
|
v3.24.2
Per Share Information
|
6 Months Ended |
Jun. 30, 2024 |
|---|
| Earnings Per Share [Abstract] |
|
| Per Share Information |
Per Share Information Basic net income (loss), per common share, excludes dilution and is computed by dividing net income (loss) by the weighted-average number of common shares outstanding during the period. For the three and six months ended June 30, 2024 and 2023, diluted net income (loss), per common share, is computed by dividing net income (loss) by the weighted-average number of common shares outstanding during the period, plus any potential dilutive common share equivalents, including shares issuable upon the vesting of restricted stock units ("RSUs") as determined under the treasury stock method. | | | | | | | | | | | | | | | | | | | | | | | | | | Three Months Ended June 30, | | Six Months Ended June 30, | | | 2024 | | 2023 | | 2024 | | 2023 | | Net income (loss) | $ | 251 | | | $ | 455 | | | $ | 562 | | | $ | 874 | | | | | | | | | | | Weighted-average number of common shares outstanding (in millions): | | | | | | | | | Basic weighted-average number of common stock outstanding | 435 | | | 434 | | | 434 | | | 433 | | | Effect of assumed dilution from potential issuance of common shares relating to restricted stock units | — | | | — | | | 1 | | | 1 | | | Diluted weighted-average number of common shares outstanding | 435 | | | 434 | | | 435 | | | 434 | | | | | | | | | | | Net income (loss), per common share: | | | | | | | | | Basic | $ | 0.58 | | | $ | 1.05 | | | $ | 1.29 | | | $ | 2.02 | | | Diluted | $ | 0.58 | | | $ | 1.05 | | | $ | 1.29 | | | $ | 2.01 | | | | | | | | | | | Dividends/distributions declared per share of common stock | $ | 1.565 | | | $ | 1.565 | | | $ | 3.130 | | | $ | 3.130 | |
During the six months ended June 30, 2024, the Company granted one million RSUs to the Company's executives and certain other employees.
|
| X |
- References
+ Details
| Name: |
us-gaap_EarningsPerShareAbstract |
| Namespace Prefix: |
us-gaap_ |
| Data Type: |
xbrli:stringItemType |
| Balance Type: |
na |
| Period Type: |
duration |
|
| X |
- DefinitionThe entire disclosure for earnings per share. Reference 1: http://www.xbrl.org/2003/role/disclosureRef
-Topic 260
-SubTopic 10
-Name Accounting Standards Codification
-Section 50
-Paragraph 1
-Subparagraph (c)
-Publisher FASB
-URI https://asc.fasb.org/1943274/2147482662/260-10-50-1
Reference 2: http://www.xbrl.org/2003/role/disclosureRef
-Topic 260
-Name Accounting Standards Codification
-Publisher FASB
-URI https://asc.fasb.org/260/tableOfContent
Reference 3: http://www.xbrl.org/2003/role/disclosureRef
-Topic 260
-SubTopic 10
-Name Accounting Standards Codification
-Section 50
-Paragraph 2
-Publisher FASB
-URI https://asc.fasb.org/1943274/2147482662/260-10-50-2
Reference 4: http://www.xbrl.org/2003/role/disclosureRef
-Topic 260
-SubTopic 10
-Name Accounting Standards Codification
-Section 50
-Paragraph 3
-Publisher FASB
-URI https://asc.fasb.org/1943274/2147482662/260-10-50-3
| Name: |
us-gaap_EarningsPerShareTextBlock |
| Namespace Prefix: |
us-gaap_ |
| Data Type: |
dtr-types:textBlockItemType |
| Balance Type: |
na |
| Period Type: |
duration |
|
v3.24.2
Commitments and Contingencies
|
6 Months Ended |
Jun. 30, 2024 |
|---|
| Commitments and Contingencies Disclosure [Abstract] |
|
| Commitments and Contingencies |
Commitments and Contingencies The Company is involved in various claims, assessments, lawsuits or proceedings arising in the ordinary course of business. While there are uncertainties inherent in the ultimate outcome of such matters and it is impossible to presently determine the ultimate costs or losses that may be incurred, if any, management believes the adverse resolution of such uncertainties and the incurrence of such costs should not have a material adverse effect on the Company's condensed consolidated financial position or results of operations. The Company and certain of its subsidiaries are also contingently liable for commitments or performance guarantees arising in the ordinary course of business, including certain letters of credit or surety bonds. In addition, as mentioned in note 1, the Company has the option to purchase approximately 53% of its towers at the end of their respective lease terms. The Company has no obligation to exercise such purchase options.
|
| X |
- References
+ Details
| Name: |
us-gaap_CommitmentsAndContingenciesDisclosureAbstract |
| Namespace Prefix: |
us-gaap_ |
| Data Type: |
xbrli:stringItemType |
| Balance Type: |
na |
| Period Type: |
duration |
|
| X |
- DefinitionThe entire disclosure for commitments and contingencies. Reference 1: http://www.xbrl.org/2009/role/commonPracticeRef
-Topic 405
-SubTopic 30
-Name Accounting Standards Codification
-Publisher FASB
-URI https://asc.fasb.org/405-30/tableOfContent
Reference 2: http://www.xbrl.org/2003/role/disclosureRef
-Topic 440
-SubTopic 10
-Name Accounting Standards Codification
-Section 50
-Paragraph 4
-Subparagraph (a)
-Publisher FASB
-URI https://asc.fasb.org/1943274/2147482648/440-10-50-4
Reference 3: http://www.xbrl.org/2009/role/commonPracticeRef
-Topic 450
-Name Accounting Standards Codification
-Publisher FASB
-URI https://asc.fasb.org/450/tableOfContent
Reference 4: http://www.xbrl.org/2003/role/disclosureRef
-Topic 954
-SubTopic 440
-Name Accounting Standards Codification
-Section 50
-Paragraph 1
-Subparagraph (a)
-Publisher FASB
-URI https://asc.fasb.org/1943274/2147478522/954-440-50-1
Reference 5: http://www.xbrl.org/2003/role/disclosureRef
-Topic 440
-SubTopic 10
-Name Accounting Standards Codification
-Section 50
-Paragraph 4
-Subparagraph (c)
-Publisher FASB
-URI https://asc.fasb.org/1943274/2147482648/440-10-50-4
Reference 6: http://fasb.org/us-gaap/role/ref/legacyRef
-Topic 440
-Name Accounting Standards Codification
-Publisher FASB
-URI https://asc.fasb.org/440/tableOfContent
| Name: |
us-gaap_CommitmentsAndContingenciesDisclosureTextBlock |
| Namespace Prefix: |
us-gaap_ |
| Data Type: |
dtr-types:textBlockItemType |
| Balance Type: |
na |
| Period Type: |
duration |
|
v3.24.2
Equity
|
6 Months Ended |
Jun. 30, 2024 |
|---|
| Equity [Abstract] |
|
| Equity |
Equity Declaration and Payment of Dividends During the six months ended June 30, 2024, the following dividends/distributions were declared or paid: | | | | | | | | | | | | | | | | | | | | | | | | | | | | | | | | | | Equity Type | | Declaration Date | | Record Date | | Payment Date | | Dividends Per Share | | Aggregate Payment Amount(a) | | Common Stock | | February 21, 2024 | | March 15, 2024 | | March 28, 2024 | | $ | 1.565 | | | $ | 683 | | | Common Stock | | May 22, 2024 | | June 14, 2024 | | June 28, 2024 | | $ | 1.565 | | | $ | 684 | | | | | | | | | | | | | | | | | | | | | | | | | | | | | | | | | | | | | | | | | | | | | | | | | | | | | | | | | | | | | | | | | | | |
(a)Inclusive of dividends accrued for holders of unvested RSUs, which will be paid when and if the RSUs vest. Purchases of the Company's Common Stock For the six months ended June 30, 2024, the Company purchased 0.3 million shares of its common stock utilizing $30 million in cash. The shares of common stock purchased relate to shares withheld in connection with the payment of withholding taxes upon vesting of RSUs. 2021 "At-the-Market" Stock Offering Program The Company previously maintained an "at-the-market" stock offering program through which it had the right to issue and sell shares of its common stock having an aggregate gross sales price of up to $750 million ("2021 ATM Program"). The Company terminated its previously outstanding 2021 ATM Program in March 2024 with the entire gross sales price of $750 million remaining unsold. 2024 "At-the-Market" Stock Offering Program In March 2024, the Company established a new "at-the-market" stock offering program through which it may issue and sell shares of its common stock having an aggregate gross sales price of up to $750 million ("2024 ATM Program"). Sales under the 2024 ATM Program may be made by means of ordinary brokers' transactions on the NYSE or otherwise at market prices prevailing at the time of sale, at prices related to prevailing market prices or, subject to the Company's specific instructions, at negotiated prices. The Company intends to use the net proceeds from any sales under the 2024 ATM Program for general corporate purposes, which may include (1) the funding of future acquisitions or investments or (2) the repayment or repurchase of any outstanding indebtedness. The Company has not sold any shares of common stock under the 2024 ATM Program.
|
| X |
- References
+ Details
| Name: |
us-gaap_EquityAbstract |
| Namespace Prefix: |
us-gaap_ |
| Data Type: |
xbrli:stringItemType |
| Balance Type: |
na |
| Period Type: |
duration |
|
| X |
- DefinitionThe entire disclosure for equity. Reference 1: http://www.xbrl.org/2003/role/disclosureRef
-Topic 505
-SubTopic 10
-Name Accounting Standards Codification
-Section 50
-Paragraph 13
-Subparagraph (b)
-Publisher FASB
-URI https://asc.fasb.org/1943274/2147481112/505-10-50-13
Reference 2: http://www.xbrl.org/2003/role/disclosureRef
-Topic 505
-SubTopic 10
-Name Accounting Standards Codification
-Section 50
-Paragraph 13
-Subparagraph (h)
-Publisher FASB
-URI https://asc.fasb.org/1943274/2147481112/505-10-50-13
Reference 3: http://www.xbrl.org/2003/role/disclosureRef
-Topic 505
-SubTopic 10
-Name Accounting Standards Codification
-Section 50
-Paragraph 14
-Subparagraph (b)
-Publisher FASB
-URI https://asc.fasb.org/1943274/2147481112/505-10-50-14
Reference 4: http://www.xbrl.org/2003/role/disclosureRef
-Topic 946
-SubTopic 235
-Name Accounting Standards Codification
-Section 50
-Paragraph 2
-Subparagraph (a)
-Publisher FASB
-URI https://asc.fasb.org/1943274/2147477968/946-235-50-2
Reference 5: http://www.xbrl.org/2003/role/disclosureRef
-Topic 946
-SubTopic 235
-Name Accounting Standards Codification
-Section 50
-Paragraph 2
-Subparagraph (d)
-Publisher FASB
-URI https://asc.fasb.org/1943274/2147477968/946-235-50-2
Reference 6: http://www.xbrl.org/2003/role/disclosureRef
-Topic 946
-SubTopic 505
-Name Accounting Standards Codification
-Section 50
-Paragraph 6
-Publisher FASB
-URI https://asc.fasb.org/1943274/2147478448/946-505-50-6
Reference 7: http://www.xbrl.org/2003/role/disclosureRef
-Topic 815
-SubTopic 40
-Name Accounting Standards Codification
-Section 50
-Paragraph 6
-Subparagraph (a)
-Publisher FASB
-URI https://asc.fasb.org/1943274/2147480237/815-40-50-6
Reference 8: http://www.xbrl.org/2003/role/disclosureRef
-Topic 505
-SubTopic 10
-Name Accounting Standards Codification
-Section S99
-Paragraph 1
-Subparagraph (SX 210.3-04)
-Publisher FASB
-URI https://asc.fasb.org/1943274/2147480008/505-10-S99-1
Reference 9: http://www.xbrl.org/2003/role/disclosureRef
-Topic 235
-SubTopic 10
-Name Accounting Standards Codification
-Section S99
-Paragraph 1
-Subparagraph (SX 210.4-08(e)(1))
-Publisher FASB
-URI https://asc.fasb.org/1943274/2147480678/235-10-S99-1
Reference 10: http://fasb.org/us-gaap/role/ref/legacyRef
-Topic 505
-Name Accounting Standards Codification
-Publisher FASB
-URI https://asc.fasb.org/505/tableOfContent
Reference 11: http://www.xbrl.org/2003/role/disclosureRef
-Topic 505
-SubTopic 10
-Name Accounting Standards Codification
-Section 50
-Paragraph 13
-Publisher FASB
-URI https://asc.fasb.org/1943274/2147481112/505-10-50-13
Reference 12: http://www.xbrl.org/2003/role/disclosureRef
-Topic 505
-SubTopic 10
-Name Accounting Standards Codification
-Section 50
-Paragraph 13
-Subparagraph (g)
-Publisher FASB
-URI https://asc.fasb.org/1943274/2147481112/505-10-50-13
Reference 13: http://www.xbrl.org/2003/role/disclosureRef
-Topic 505
-SubTopic 10
-Name Accounting Standards Codification
-Section 50
-Paragraph 13
-Subparagraph (i)
-Publisher FASB
-URI https://asc.fasb.org/1943274/2147481112/505-10-50-13
Reference 14: http://www.xbrl.org/2003/role/disclosureRef
-Topic 505
-SubTopic 10
-Name Accounting Standards Codification
-Section 50
-Paragraph 14
-Subparagraph (a)
-Publisher FASB
-URI https://asc.fasb.org/1943274/2147481112/505-10-50-14
Reference 15: http://www.xbrl.org/2003/role/disclosureRef
-Topic 505
-SubTopic 10
-Name Accounting Standards Codification
-Section 50
-Paragraph 14
-Subparagraph (c)
-Publisher FASB
-URI https://asc.fasb.org/1943274/2147481112/505-10-50-14
Reference 16: http://www.xbrl.org/2003/role/disclosureRef
-Topic 505
-SubTopic 10
-Name Accounting Standards Codification
-Section 50
-Paragraph 16
-Subparagraph (b)
-Publisher FASB
-URI https://asc.fasb.org/1943274/2147481112/505-10-50-16
Reference 17: http://www.xbrl.org/2003/role/disclosureRef
-Topic 505
-SubTopic 10
-Name Accounting Standards Codification
-Section 50
-Paragraph 18
-Subparagraph (a)
-Publisher FASB
-URI https://asc.fasb.org/1943274/2147481112/505-10-50-18
Reference 18: http://www.xbrl.org/2003/role/disclosureRef
-Topic 505
-SubTopic 10
-Name Accounting Standards Codification
-Section 50
-Paragraph 18
-Subparagraph (b)
-Publisher FASB
-URI https://asc.fasb.org/1943274/2147481112/505-10-50-18
Reference 19: http://www.xbrl.org/2003/role/disclosureRef
-Topic 505
-SubTopic 10
-Name Accounting Standards Codification
-Section 50
-Paragraph 18
-Subparagraph (d)
-Publisher FASB
-URI https://asc.fasb.org/1943274/2147481112/505-10-50-18
| Name: |
us-gaap_StockholdersEquityNoteDisclosureTextBlock |
| Namespace Prefix: |
us-gaap_ |
| Data Type: |
dtr-types:textBlockItemType |
| Balance Type: |
na |
| Period Type: |
duration |
|
v3.24.2
Operating Segments
|
6 Months Ended |
Jun. 30, 2024 |
|---|
| Segment Reporting [Abstract] |
|
| Operating Segments |
Operating Segments The Company's operating segments consist of (1) Towers and (2) Fiber. The Towers segment provides access, including space or capacity, to the Company's more than 40,000 towers geographically dispersed throughout the U.S. The Towers segment also reflects certain ancillary services relating to the Company's towers, predominately consisting of site development services and installation services. See note 12 to the condensed consolidated financial statements for a discussion of the Company's 2023 Restructuring Plan, which included discontinuing installation services as a Towers product offering. The Fiber segment provides access, including space or capacity, to the Company's approximately (1) 115,000 small cells on air or under contract and (2) 90,000 route miles of fiber primarily supporting small cells and fiber solutions geographically dispersed throughout the U.S. The measurement of profit or loss used by the Company's chief operating decision maker ("CODM") to evaluate the performance of its operating segments is segment operating profit (loss). Additionally, the Company CODM also reviews segment site rental gross margin and segment services and other gross margin. The Company defines segment operating profit (loss) as segment site rental gross margin plus segment services and other gross margin, and segment other operating (income) expense, less segment selling, general and administrative expenses. The Company defines segment site rental gross margin as segment site rental revenues less segment site rental costs of operations, excluding stock-based compensation expense, net and amortization of prepaid lease purchase price adjustments recorded in consolidated site rental costs of operations. The Company defines segment services and other gross margin as segment services and other revenues less segment services and other costs of operations, excluding stock-based compensation expense, net recorded in consolidated services and other costs of operations. All of these measurements are exclusive of depreciation, amortization and accretion, which are shown separately. The following tables set forth the Company's segment operating results for the three and six months ended June 30, 2024 and 2023. Costs that are directly attributable to Towers and Fiber are assigned to those respective segments. Additionally, certain costs are shared across segments and are reflected in the Company's segment measures through allocations that management believes to be reasonable. The "Other" column (1) represents amounts excluded from specific segments, such as restructuring charges (credits), asset write-down charges, acquisition and integration costs, depreciation, amortization and accretion, amortization of prepaid lease purchase price adjustments, interest expense and amortization of deferred financing costs, net, gains (losses) on retirement of long-term obligations, interest income, other income (expense), stock-based compensation expense, net and certain selling, general and administrative expenses, and (2) reconciles segment operating profit (loss) to income (loss) before income taxes, as the amounts are not utilized in assessing each segment’s performance. The "Other" total assets balance includes corporate assets such as cash and cash equivalents and restricted cash and cash equivalents which have not been allocated to specific segments. There are no significant revenues resulting from transactions between the Company's operating segments. | | | | | | | | | | | | | | | | | | | | | | | | | | | | | | | | | | | | | | | | | | | | | | | | | Three Months Ended June 30, 2024 | | Three Months Ended June 30, 2023 | | Towers | | Fiber | | Other | |
Total | | Towers | | Fiber | | Other | |
Total | | Segment site rental revenues | $ | 1,064 | | | $ | 516 | | | | | $ | 1,580 | | | $ | 1,080 | | | $ | 648 | | | | | $ | 1,728 | | | Segment services and other revenues | 43 | | | 3 | | | | | 46 | | | 124 | | | 15 | | | | | 139 | | | Segment revenues | 1,107 | | | 519 | | | | | 1,626 | | | 1,204 | | | 663 | | | | | 1,867 | | | Segment site rental costs of operations | 245 | | | 178 | | | | | 423 | | | 243 | | | 171 | | | | | 414 | | | Segment services and other costs of operations | 23 | | | 2 | | | | | 25 | | | 92 | | | 3 | | | | | 95 | | Segment costs of operations(a)(b) | 268 | | | 180 | | | | | 448 | | | 335 | | | 174 | | | | | 509 | | | Segment site rental gross margin | 819 | | | 338 | | | | | 1,157 | | | 837 | | | 477 | | | | | 1,314 | | | Segment services and other gross margin | 20 | | | 1 | | | | | 21 | | | 32 | | | 12 | | | | | 44 | | Segment selling, general and administrative expenses(b) | 16 | | | 50 | | | | | 66 | | | 30 | | | 51 | | | | | 81 | | | Segment operating profit (loss) | 823 | | | 289 | | | | | 1,112 | | | 839 | | | 438 | | | | | 1,277 | | Other selling, general and administrative expenses(b) | | | | | $ | 105 | | | 105 | | | | | | | $ | 88 | | | 88 | | | Stock-based compensation expense, net | | | | | 40 | | | 40 | | | | | | | 50 | | | 50 | | | Depreciation, amortization and accretion | | | | | 430 | | | 430 | | | | | | | 445 | | | 445 | | Restructuring charges | | | | | 45 | | | 45 | | | | | | | — | | | — | | | Interest expense and amortization of deferred financing costs, net | | | | | 230 | | | 230 | | | | | | | 208 | | | 208 | | Other (income) expenses to reconcile to income (loss) before income taxes(c) | | | | | 4 | | | 4 | | | | | | | 24 | | | 24 | | | Income (loss) before income taxes | | | | | | | $ | 258 | | | | | | | | | $ | 462 | | | Capital expenditures | $ | 29 | | | $ | 289 | | | $ | 11 | | | $ | 329 | | | $ | 61 | | | $ | 306 | | | $ | 12 | | | $ | 379 | | | Total assets (at period end) | $ | 21,177 | | | $ | 16,358 | | | $ | 711 | | | $ | 38,246 | | | $ | 21,973 | | | $ | 16,166 | | | $ | 903 | | | $ | 39,042 | |
(a)Exclusive of depreciation, amortization and accretion shown separately. (b)Segment costs of operations excludes (1) stock-based compensation expense, net of $7 million and $9 million for the three months ended June 30, 2024 and 2023, respectively and (2) prepaid lease purchase price adjustments of $4 million for each of the three months ended June 30, 2024 and 2023. Segment selling, general and administrative expenses and other selling, general and administrative expenses exclude stock-based compensation expense, net of $33 million and $41 million for the three months ended June 30, 2024 and 2023, respectively. (c)See condensed consolidated statement of operations and comprehensive income (loss) for further information. | | | | | | | | | | | | | | | | | | | | | | | | | | | | | | | | | | | | | | | | | | | | | | | | | Six Months Ended June 30, 2024 | | Six Months Ended June 30, 2023 | | Towers | | Fiber | | Other | |
Total | | Towers | | Fiber | | Other | |
Total | | Segment site rental revenues | $ | 2,132 | | | $ | 1,036 | | | | | $ | 3,168 | | | $ | 2,161 | | | $ | 1,191 | | | | | $ | 3,352 | | | Segment services and other revenues | 89 | | | 10 | | | | | 99 | | | 270 | | | 18 | | | | | 288 | | | Segment revenues | 2,221 | | | 1,046 | | | | | 3,267 | | | 2,431 | | | 1,209 | | | | | 3,640 | | | Segment site rental costs of operations | 483 | | | 360 | | | | | 843 | | | 477 | | | 343 | | | | | 820 | | | Segment services and other costs of operations | 51 | | | 7 | | | | | 58 | | | 191 | | | 5 | | | | | 196 | | Segment costs of operations(a)(b) | 534 | | | 367 | | | | | 901 | | | 668 | | | 348 | | | | | 1,016 | | | Segment site rental gross margin | 1,649 | | | 676 | | | | | 2,325 | | | 1,684 | | | 848 | | | | | 2,532 | | | Segment services and other gross margin | 38 | | | 3 | | | | | 41 | | | 79 | | | 13 | | | | | 92 | | Segment selling, general and administrative expenses(b) | 37 | | | 97 | | | | | 134 | | | 61 | | | 100 | | | | | 161 | | Segment operating profit (loss) | 1,650 | | | 582 | | | | | 2,232 | | | 1,702 | | | 761 | | | | | 2,463 | | Other selling, general and administrative expenses(b) | | | | | $ | 189 | | | 189 | | | | | | | $ | 170 | | | 170 | | | Stock-based compensation expense | | | | | 78 | | | 78 | | | | | | | 91 | | | 91 | | Depreciation, amortization and accretion | | | | | 869 | | | 869 | | | | | | | 876 | | | 876 | | Restructuring charges | | | | | 56 | | | 56 | | | | | | | — | | | — | | | Interest expense and amortization of deferred financing costs, net | | | | | 456 | | | 456 | | | | | | | 410 | | | 410 | | Other (income) expenses to reconcile to income (loss) before income taxes(c) | | | | | 8 | | | 8 | | | | | | | 28 | | | 28 | | | Income (loss) before income taxes | | | | | | | $ | 576 | | | | | | | | | $ | 888 | | | Capital expenditures | $ | 64 | | | $ | 562 | | | $ | 23 | | | $ | 649 | | | $ | 111 | | | $ | 585 | | | $ | 24 | | | $ | 720 | |
(a)Exclusive of depreciation, amortization and accretion shown separately. (b)Segment costs of operations excludes (1) stock-based compensation expense, net of $14 million and $17 million for the six months ended June 30, 2024 and 2023, respectively, and (2) prepaid lease purchase price adjustments of $8 million for each of the six months ended June 30, 2024 and 2023. Segment selling, general and administrative expenses and other selling, general and administrative expenses exclude stock-based compensation expense, net of $64 million and $74 million for the six months ended June 30, 2024 and 2023, respectively. (c)See condensed consolidated statement of operations and comprehensive income (loss) for further information.
|
| X |
- References
+ Details
| Name: |
us-gaap_SegmentReportingAbstract |
| Namespace Prefix: |
us-gaap_ |
| Data Type: |
xbrli:stringItemType |
| Balance Type: |
na |
| Period Type: |
duration |
|
| X |
- DefinitionThe entire disclosure for reporting segments including data and tables. Reportable segments include those that meet any of the following quantitative thresholds a) it's reported revenue, including sales to external customers and intersegment sales or transfers is 10 percent or more of the combined revenue, internal and external, of all operating segments b) the absolute amount of its reported profit or loss is 10 percent or more of the greater, in absolute amount of 1) the combined reported profit of all operating segments that did not report a loss or 2) the combined reported loss of all operating segments that did report a loss c) its assets are 10 percent or more of the combined assets of all operating segments. Reference 1: http://www.xbrl.org/2003/role/exampleRef
-Topic 280
-SubTopic 10
-Name Accounting Standards Codification
-Section 55
-Paragraph 48
-Publisher FASB
-URI https://asc.fasb.org/1943274/2147482785/280-10-55-48
Reference 2: http://www.xbrl.org/2003/role/disclosureRef
-Topic 280
-SubTopic 10
-Name Accounting Standards Codification
-Section 50
-Paragraph 32
-Subparagraph (f)
-Publisher FASB
-URI https://asc.fasb.org/1943274/2147482810/280-10-50-32
Reference 3: http://www.xbrl.org/2003/role/disclosureRef
-Topic 270
-SubTopic 10
-Name Accounting Standards Codification
-Section 50
-Paragraph 1
-Subparagraph (i)
-Publisher FASB
-URI https://asc.fasb.org/1943274/2147482964/270-10-50-1
Reference 4: http://www.xbrl.org/2003/role/disclosureRef
-Topic 280
-SubTopic 10
-Name Accounting Standards Codification
-Section 50
-Paragraph 32
-Subparagraph (ee)
-Publisher FASB
-URI https://asc.fasb.org/1943274/2147482810/280-10-50-32
Reference 5: http://fasb.org/us-gaap/role/ref/otherTransitionRef
-Topic 280
-SubTopic 10
-Name Accounting Standards Codification
-Section 50
-Paragraph 32
-Subparagraph (d)
-Publisher FASB
-URI https://asc.fasb.org/1943274/2147482810/280-10-50-32
Reference 6: http://www.xbrl.org/2003/role/exampleRef
-Topic 280
-SubTopic 10
-Name Accounting Standards Codification
-Section 55
-Paragraph 54
-Subparagraph (d)
-Publisher FASB
-URI https://asc.fasb.org/1943274/2147482785/280-10-55-54
Reference 7: http://www.xbrl.org/2003/role/exampleRef
-Topic 280
-SubTopic 10
-Name Accounting Standards Codification
-Section 55
-Paragraph 47
-Subparagraph (c)
-Publisher FASB
-URI https://asc.fasb.org/1943274/2147482785/280-10-55-47
Reference 8: http://www.xbrl.org/2003/role/exampleRef
-Topic 280
-SubTopic 10
-Name Accounting Standards Codification
-Section 55
-Paragraph 54
-Subparagraph (a)
-Publisher FASB
-URI https://asc.fasb.org/1943274/2147482785/280-10-55-54
Reference 9: http://www.xbrl.org/2003/role/exampleRef
-Topic 280
-SubTopic 10
-Name Accounting Standards Codification
-Section 55
-Paragraph 47
-Subparagraph (a)
-Publisher FASB
-URI https://asc.fasb.org/1943274/2147482785/280-10-55-47
Reference 10: http://www.xbrl.org/2003/role/exampleRef
-Topic 280
-SubTopic 10
-Name Accounting Standards Codification
-Section 55
-Paragraph 54
-Subparagraph (e)
-Publisher FASB
-URI https://asc.fasb.org/1943274/2147482785/280-10-55-54
Reference 11: http://www.xbrl.org/2003/role/exampleRef
-Topic 280
-SubTopic 10
-Name Accounting Standards Codification
-Section 55
-Paragraph 47
-Subparagraph (d)
-Publisher FASB
-URI https://asc.fasb.org/1943274/2147482785/280-10-55-47
Reference 12: http://www.xbrl.org/2003/role/disclosureRef
-Topic 280
-SubTopic 10
-Name Accounting Standards Codification
-Section 50
-Paragraph 22
-Publisher FASB
-URI https://asc.fasb.org/1943274/2147482810/280-10-50-22
Reference 13: http://www.xbrl.org/2003/role/disclosureRef
-Topic 280
-SubTopic 10
-Name Accounting Standards Codification
-Section 50
-Paragraph 31
-Publisher FASB
-URI https://asc.fasb.org/1943274/2147482810/280-10-50-31
Reference 14: http://www.xbrl.org/2003/role/disclosureRef
-Topic 280
-SubTopic 10
-Name Accounting Standards Codification
-Section 50
-Paragraph 34
-Publisher FASB
-URI https://asc.fasb.org/1943274/2147482810/280-10-50-34
Reference 15: http://www.xbrl.org/2003/role/disclosureRef
-Topic 280
-SubTopic 10
-Name Accounting Standards Codification
-Section 50
-Paragraph 26C
-Publisher FASB
-URI https://asc.fasb.org/1943274/2147482810/280-10-50-26C
Reference 16: http://www.xbrl.org/2003/role/disclosureRef
-Topic 280
-SubTopic 10
-Name Accounting Standards Codification
-Section 50
-Paragraph 26B
-Publisher FASB
-URI https://asc.fasb.org/1943274/2147482810/280-10-50-26B
Reference 17: http://www.xbrl.org/2003/role/disclosureRef
-Topic 280
-SubTopic 10
-Name Accounting Standards Codification
-Section 50
-Paragraph 15
-Publisher FASB
-URI https://asc.fasb.org/1943274/2147482810/280-10-50-15
Reference 18: http://www.xbrl.org/2003/role/disclosureRef
-Topic 280
-SubTopic 10
-Name Accounting Standards Codification
-Section 50
-Paragraph 42
-Publisher FASB
-URI https://asc.fasb.org/1943274/2147482810/280-10-50-42
Reference 19: http://www.xbrl.org/2003/role/disclosureRef
-Topic 280
-SubTopic 10
-Name Accounting Standards Codification
-Section 50
-Paragraph 40
-Publisher FASB
-URI https://asc.fasb.org/1943274/2147482810/280-10-50-40
Reference 20: http://www.xbrl.org/2003/role/disclosureRef
-Topic 280
-Name Accounting Standards Codification
-Publisher FASB
-URI https://asc.fasb.org/280/tableOfContent
Reference 21: http://www.xbrl.org/2003/role/disclosureRef
-Topic 280
-SubTopic 10
-Name Accounting Standards Codification
-Section 50
-Paragraph 26
-Publisher FASB
-URI https://asc.fasb.org/1943274/2147482810/280-10-50-26
Reference 22: http://www.xbrl.org/2003/role/disclosureRef
-Topic 280
-SubTopic 10
-Name Accounting Standards Codification
-Section 50
-Paragraph 41
-Publisher FASB
-URI https://asc.fasb.org/1943274/2147482810/280-10-50-41
Reference 23: http://www.xbrl.org/2003/role/disclosureRef
-Topic 280
-SubTopic 10
-Name Accounting Standards Codification
-Section 50
-Paragraph 21
-Subparagraph (a)
-Publisher FASB
-URI https://asc.fasb.org/1943274/2147482810/280-10-50-21
Reference 24: http://www.xbrl.org/2003/role/disclosureRef
-Topic 280
-SubTopic 10
-Name Accounting Standards Codification
-Section 50
-Paragraph 21
-Subparagraph (b)
-Publisher FASB
-URI https://asc.fasb.org/1943274/2147482810/280-10-50-21
Reference 25: http://www.xbrl.org/2003/role/disclosureRef
-Topic 280
-SubTopic 10
-Name Accounting Standards Codification
-Section 50
-Paragraph 32
-Subparagraph (e)
-Publisher FASB
-URI https://asc.fasb.org/1943274/2147482810/280-10-50-32
| Name: |
us-gaap_SegmentReportingDisclosureTextBlock |
| Namespace Prefix: |
us-gaap_ |
| Data Type: |
dtr-types:textBlockItemType |
| Balance Type: |
na |
| Period Type: |
duration |
|
v3.24.2
Supplemental Cash Flow Information
|
6 Months Ended |
Jun. 30, 2024 |
|---|
| Supplemental Cash Flow Elements [Abstract] |
|
| Supplemental Cash Flow Information |
Supplemental Cash Flow Information The following table is a summary of the Company's supplemental cash flow information for the six months ended June 30, 2024 and 2023: | | | | | | | | | | | | | Six Months Ended June 30, | | 2024 | | 2023 | | Supplemental disclosure of cash flow information: | | | | Cash payments related to operating lease liabilities(a) | $ | 283 | | | $ | 284 | | | Interest paid | 441 | | | 367 | | Income taxes paid | 9 | | | 10 | | | Supplemental disclosure of non-cash operating, investing and financing activities: | | | | ROU assets recorded in exchange for operating lease liabilities | (70) | | | 28 | | | Increase (decrease) in accounts payable for purchases of property and equipment | (18) | | | 16 | | Capitalized stock-based compensation | 13 | | | 14 | | | Purchase of property and equipment under finance leases and installment land purchases | 41 | | | 39 | |
(a)Excludes the Company's contingent payments pursuant to operating leases, which are recorded as expense in the period such contingencies are resolved. The reconciliation of cash and cash equivalents and restricted cash and cash equivalents reported within various lines on the condensed consolidated balance sheet to amounts reported in the condensed consolidated statement of cash flows is shown below. | | | | | | | | | | | | | June 30, 2024 | | December 31, 2023 | | Cash and cash equivalents | $ | 155 | | | $ | 105 | | Restricted cash and cash equivalents, current | 171 | | | 171 | | Restricted cash and cash equivalents reported within other assets, net | 5 | | | 5 | | Cash and cash equivalents and restricted cash and cash equivalents | $ | 331 | | | $ | 281 | |
|
| X |
- DefinitionThe entire disclosure for supplemental cash flow activities, including cash, noncash, and part noncash transactions, for the period. Noncash is defined as information about all investing and financing activities of an enterprise during a period that affect recognized assets or liabilities but that do not result in cash receipts or cash payments in the period. "Part noncash" refers to that portion of the transaction not resulting in cash receipts or cash payments in the period. Reference 1: http://fasb.org/us-gaap/role/ref/legacyRef
-Topic 230
-Name Accounting Standards Codification
-Publisher FASB
-URI https://asc.fasb.org/230/tableOfContent
| Name: |
us-gaap_CashFlowSupplementalDisclosuresTextBlock |
| Namespace Prefix: |
us-gaap_ |
| Data Type: |
dtr-types:textBlockItemType |
| Balance Type: |
na |
| Period Type: |
duration |
|
| X |
- References
+ Details
| Name: |
us-gaap_SupplementalCashFlowElementsAbstract |
| Namespace Prefix: |
us-gaap_ |
| Data Type: |
xbrli:stringItemType |
| Balance Type: |
na |
| Period Type: |
duration |
|
v3.24.2
Restructuring and Related Activities
|
6 Months Ended |
Jun. 30, 2024 |
|---|
| Restructuring and Related Activities [Abstract] |
|
| Restructuring and Related Activities Disclosure |
Restructuring 2023 Restructuring Plan In July 2023, the Company initiated the 2023 Restructuring Plan as part of its efforts to reduce costs to better align the Company's operational needs with lower tower activity. The 2023 Restructuring Plan included reducing the Company's total employee headcount by approximately 15%, discontinuing installation services as a Towers product offering while continuing to offer site development services on Company towers, and consolidating office space. In the first six months ended June 30, 2024, the Company recorded approximately $13 million in charges in connection with the 2023 Restructuring Plan (including $2 million in the three months ended June 30, 2024), $8 million of which is related to remaining obligations under facility leases and $4 million of non-cash charges representing accelerated depreciation. In connection with the headcount reduction, the Company recorded a $1 million charge which represents cash payments that have been made in connection with the employee headcount reduction. The actions associated with the 2023 Restructuring Plan have been substantially completed and related charges have been recorded by June 30, 2024, while the payments are expected to be completed for the employee headcount reduction and office space consolidation in 2024 and 2032, respectively. The following table summarizes the activities related to the 2023 Restructuring Plan for the three and six months ended June 30, 2024: | | | | | | | | | | | | | | | | | | | | | | | | | | | | | | | | | | | | | Three Months Ended June 30, 2024 | | Six Months Ended June 30, 2024 | | Employee Headcount Reduction | | Office Space Consolidation | | Total | | Employee Headcount Reduction | | Office Space Consolidation | | Total | Liability as of the beginning of the respective period | $ | 8 | | | $ | 15 | | | $ | 23 | | | $ | 16 | | | $ | 12 | | | $ | 28 | | Charges | 1 | | | 1 | | | 2 | | | 1 | | | 12 | | | 13 | | Payments | (3) | | | (4) | | | (7) | | | (11) | | | (8) | | | (19) | | Non-cash items | — | | | — | | | — | | | — | | | (4) | | | (4) | | Liability as of June 30, 2024 | $ | 6 | | | $ | 12 | | | $ | 18 | | | $ | 6 | | | $ | 12 | | | $ | 18 | |
2024 Restructuring Plan In June 2024, the Company initiated the 2024 Restructuring Plan as part of its efforts to drive operational efficiencies and reduce operating costs and capital expenditures, with a primary focus on the Company's Fiber segment. As a result, the Company announced a reduction of the Company's total employee headcount by more than 10% and the closing of certain offices. In the second quarter 2024, the Company recorded approximately $43 million in charges in connection with the 2024 Restructuring Plan, $36 million of which represent cash payments that have been or will be made in connection with employee severance and other one-time termination benefits. In connection with the office closures, the Company recorded $7 million of non-cash charges representing accelerated depreciation. The actions associated with the 2024 Restructuring Plan and related charges are expected to be substantially completed and recorded by December 31, 2024, while the payments are expected to be completed for the employee headcount reduction in 2025 and office closures in 2033. The Company expects to incur an additional approximately $70 million of related charges during the second half of 2024, primarily related to office closures. The Company may incur other charges or cash expenditures not currently contemplated due to unanticipated events that may occur, including in connection with the implementation of the 2024 Restructuring Plan. The following table summarizes the activities related to the 2024 Restructuring Plan for the three and six months ended June 30, 2024: | | | | | | | | | | | | | | | | | | | | | | | | | | | Three and Six Months Ended June 30, 2024 | | | | Employee Headcount Reduction | | Office Closures | | | | Total | | | | | | | Charges | 36 | | | 7 | | | | | 43 | | | | | | | | Payments | (2) | | | — | | | | | (2) | | | | | | | | Non-cash items | — | | | (7) | | | | | (7) | | | | | | | | Liability as of June 30, 2024 | $ | 34 | | | $ | — | | | | | $ | 34 | | | | | | | |
As of June 30, 2024, the liability for restructuring charges is included in "Other accrued liabilities" on the consolidated balance sheet, and the corresponding expense is included in "Restructuring charges" on the condensed consolidated statements of operations and comprehensive income. The Company does not allocate restructuring charges between its operating segments. If charges related to the Restructuring Plans were allocated to operating segments, for the three months ended June 30, 2024, $4 million and $27 million of the aforementioned charge would have been allocated to the Company's Towers and Fiber segment, respectively, with the remaining $14 million allocated to Other. Similarly, for the six months ended June 30, 2024, $6 million and $31 million of the aforementioned charge would have been allocated to the Company's Towers and Fiber segment, respectively, with the remaining $19 million allocated to Other.
|
| X |
- DefinitionThe entire disclosure for restructuring and related activities. Description of restructuring activities such as exit and disposal activities, include facts and circumstances leading to the plan, the expected plan completion date, the major types of costs associated with the plan activities, total expected costs, the accrual balance at the end of the period, and the periods over which the remaining accrual will be settled. Reference 1: http://www.xbrl.org/2003/role/disclosureRef
-Topic 420
-SubTopic 10
-Name Accounting Standards Codification
-Section S99
-Paragraph 2
-Subparagraph (SAB Topic 5.P.4.e)
-Publisher FASB
-URI https://asc.fasb.org/1943274/2147479823/420-10-S99-2
Reference 2: http://www.xbrl.org/2003/role/disclosureRef
-Topic 420
-SubTopic 10
-Name Accounting Standards Codification
-Section 50
-Paragraph 1
-Subparagraph (b)(2)
-Publisher FASB
-URI https://asc.fasb.org/1943274/2147482017/420-10-50-1
Reference 3: http://www.xbrl.org/2003/role/disclosureRef
-Topic 420
-SubTopic 10
-Name Accounting Standards Codification
-Section 50
-Paragraph 1
-Subparagraph (a)
-Publisher FASB
-URI https://asc.fasb.org/1943274/2147482017/420-10-50-1
Reference 4: http://www.xbrl.org/2003/role/disclosureRef
-Topic 420
-Name Accounting Standards Codification
-Publisher FASB
-URI https://asc.fasb.org/420/tableOfContent
Reference 5: http://www.xbrl.org/2003/role/disclosureRef
-Topic 420
-SubTopic 10
-Name Accounting Standards Codification
-Section 50
-Paragraph 1
-Subparagraph (e)
-Publisher FASB
-URI https://asc.fasb.org/1943274/2147482017/420-10-50-1
| Name: |
us-gaap_RestructuringAndRelatedActivitiesDisclosureTextBlock |
| Namespace Prefix: |
us-gaap_ |
| Data Type: |
dtr-types:textBlockItemType |
| Balance Type: |
na |
| Period Type: |
duration |
|
v3.24.2
| X |
- ReferencesReference 1: http://www.xbrl.org/2003/role/presentationRef
-Publisher SEC
-Name Regulation S-K
-Number 229
-Section 402
-Subsection v
-Paragraph 1
| Name: |
ecd_PvpTable |
| Namespace Prefix: |
ecd_ |
| Data Type: |
xbrli:stringItemType |
| Balance Type: |
na |
| Period Type: |
duration |
|
| X |
- DefinitionThe portion of profit or loss for the period, net of income taxes, which is attributable to the parent. Reference 1: http://www.xbrl.org/2003/role/disclosureRef
-Topic 250
-SubTopic 10
-Name Accounting Standards Codification
-Section 50
-Paragraph 6
-Publisher FASB
-URI https://asc.fasb.org/1943274/2147483443/250-10-50-6
Reference 2: http://www.xbrl.org/2003/role/disclosureRef
-Topic 250
-SubTopic 10
-Name Accounting Standards Codification
-Section 50
-Paragraph 9
-Publisher FASB
-URI https://asc.fasb.org/1943274/2147483443/250-10-50-9
Reference 3: http://www.xbrl.org/2003/role/disclosureRef
-Topic 805
-SubTopic 60
-Name Accounting Standards Codification
-Section 65
-Paragraph 1
-Subparagraph (g)
-Publisher FASB
-URI https://asc.fasb.org/1943274/2147476176/805-60-65-1
Reference 4: http://www.xbrl.org/2003/role/disclosureRef
-Topic 740
-SubTopic 323
-Name Accounting Standards Codification
-Section 65
-Paragraph 2
-Subparagraph (g)(3)
-Publisher FASB
-URI https://asc.fasb.org/1943274/2147478666/740-323-65-2
Reference 5: http://fasb.org/us-gaap/role/ref/legacyRef
-Topic 220
-SubTopic 10
-Name Accounting Standards Codification
-Section S99
-Paragraph 2
-Subparagraph (SX 210.5-03(20))
-Publisher FASB
-URI https://asc.fasb.org/1943274/2147483621/220-10-S99-2
Reference 6: http://www.xbrl.org/2003/role/disclosureRef
-Topic 235
-SubTopic 10
-Name Accounting Standards Codification
-Section S99
-Paragraph 1
-Subparagraph (SX 210.4-08(g)(1)(ii))
-Publisher FASB
-URI https://asc.fasb.org/1943274/2147480678/235-10-S99-1
Reference 7: http://www.xbrl.org/2003/role/disclosureRef
-Topic 323
-SubTopic 10
-Name Accounting Standards Codification
-Section 50
-Paragraph 3
-Subparagraph (c)
-Publisher FASB
-URI https://asc.fasb.org/1943274/2147481687/323-10-50-3
Reference 8: http://www.xbrl.org/2003/role/disclosureRef
-Topic 825
-SubTopic 10
-Name Accounting Standards Codification
-Section 50
-Paragraph 28
-Subparagraph (f)
-Publisher FASB
-URI https://asc.fasb.org/1943274/2147482907/825-10-50-28
Reference 9: http://www.xbrl.org/2003/role/disclosureRef
-Topic 220
-SubTopic 10
-Name Accounting Standards Codification
-Section 50
-Paragraph 6
-Publisher FASB
-URI https://asc.fasb.org/1943274/2147482765/220-10-50-6
Reference 10: http://www.xbrl.org/2003/role/disclosureRef
-Topic 250
-SubTopic 10
-Name Accounting Standards Codification
-Section 50
-Paragraph 3
-Publisher FASB
-URI https://asc.fasb.org/1943274/2147483443/250-10-50-3
Reference 11: http://www.xbrl.org/2003/role/disclosureRef
-Topic 250
-SubTopic 10
-Name Accounting Standards Codification
-Section 50
-Paragraph 1
-Subparagraph (b)(2)
-Publisher FASB
-URI https://asc.fasb.org/1943274/2147483443/250-10-50-1
Reference 12: http://www.xbrl.org/2003/role/disclosureRef
-Topic 815
-SubTopic 40
-Name Accounting Standards Codification
-Section 65
-Paragraph 1
-Subparagraph (f)
-Publisher FASB
-URI https://asc.fasb.org/1943274/2147480175/815-40-65-1
Reference 13: http://www.xbrl.org/2003/role/disclosureRef
-Topic 250
-SubTopic 10
-Name Accounting Standards Codification
-Section 50
-Paragraph 8
-Publisher FASB
-URI https://asc.fasb.org/1943274/2147483443/250-10-50-8
Reference 14: http://www.xbrl.org/2003/role/disclosureRef
-Topic 250
-SubTopic 10
-Name Accounting Standards Codification
-Section 50
-Paragraph 11
-Subparagraph (a)
-Publisher FASB
-URI https://asc.fasb.org/1943274/2147483443/250-10-50-11
Reference 15: http://www.xbrl.org/2003/role/disclosureRef
-Topic 250
-SubTopic 10
-Name Accounting Standards Codification
-Section 50
-Paragraph 11
-Subparagraph (b)
-Publisher FASB
-URI https://asc.fasb.org/1943274/2147483443/250-10-50-11
Reference 16: http://www.xbrl.org/2003/role/disclosureRef
-Topic 250
-SubTopic 10
-Name Accounting Standards Codification
-Section 50
-Paragraph 4
-Publisher FASB
-URI https://asc.fasb.org/1943274/2147483443/250-10-50-4
Reference 17: http://www.xbrl.org/2003/role/exampleRef
-Topic 946
-SubTopic 830
-Name Accounting Standards Codification
-Section 55
-Paragraph 10
-Publisher FASB
-URI https://asc.fasb.org/1943274/2147479168/946-830-55-10
Reference 18: http://www.xbrl.org/2003/role/disclosureRef
-Topic 946
-SubTopic 220
-Name Accounting Standards Codification
-Section 45
-Paragraph 7
-Publisher FASB
-URI https://asc.fasb.org/1943274/2147479105/946-220-45-7
Reference 19: http://www.xbrl.org/2003/role/disclosureRef
-Topic 944
-SubTopic 220
-Name Accounting Standards Codification
-Section S99
-Paragraph 1
-Subparagraph (SX 210.7-04(18))
-Publisher FASB
-URI https://asc.fasb.org/1943274/2147477250/944-220-S99-1
Reference 20: http://www.xbrl.org/2003/role/disclosureRef
-Topic 946
-SubTopic 220
-Name Accounting Standards Codification
-Section S99
-Paragraph 1
-Subparagraph (SX 210.6-07(9))
-Publisher FASB
-URI https://asc.fasb.org/1943274/2147479134/946-220-S99-1
Reference 21: http://www.xbrl.org/2003/role/disclosureRef
-Topic 946
-SubTopic 220
-Name Accounting Standards Codification
-Section S99
-Paragraph 3
-Subparagraph (SX 210.6-09(1)(d))
-Publisher FASB
-URI https://asc.fasb.org/1943274/2147479134/946-220-S99-3
Reference 22: http://www.xbrl.org/2003/role/disclosureRef
-Topic 470
-SubTopic 10
-Name Accounting Standards Codification
-Section S99
-Paragraph 1A
-Subparagraph (SX 210.13-01(a)(4)(i))
-Publisher FASB
-URI https://asc.fasb.org/1943274/2147480097/470-10-S99-1A
Reference 23: http://www.xbrl.org/2009/role/commonPracticeRef
-Topic 470
-SubTopic 10
-Name Accounting Standards Codification
-Section S99
-Paragraph 1A
-Subparagraph (SX 210.13-01(a)(4)(ii))
-Publisher FASB
-URI https://asc.fasb.org/1943274/2147480097/470-10-S99-1A
Reference 24: http://www.xbrl.org/2003/role/disclosureRef
-Topic 470
-SubTopic 10
-Name Accounting Standards Codification
-Section S99
-Paragraph 1A
-Subparagraph (SX 210.13-01(a)(4)(iii)(A))
-Publisher FASB
-URI https://asc.fasb.org/1943274/2147480097/470-10-S99-1A
Reference 25: http://www.xbrl.org/2003/role/disclosureRef
-Topic 470
-SubTopic 10
-Name Accounting Standards Codification
-Section S99
-Paragraph 1A
-Subparagraph (SX 210.13-01(a)(4)(iv))
-Publisher FASB
-URI https://asc.fasb.org/1943274/2147480097/470-10-S99-1A
Reference 26: http://www.xbrl.org/2003/role/disclosureRef
-Topic 470
-SubTopic 10
-Name Accounting Standards Codification
-Section S99
-Paragraph 1A
-Subparagraph (SX 210.13-01(a)(5))
-Publisher FASB
-URI https://asc.fasb.org/1943274/2147480097/470-10-S99-1A
Reference 27: http://www.xbrl.org/2003/role/disclosureRef
-Topic 470
-SubTopic 10
-Name Accounting Standards Codification
-Section S99
-Paragraph 1B
-Subparagraph (SX 210.13-02(a)(4)(i))
-Publisher FASB
-URI https://asc.fasb.org/1943274/2147480097/470-10-S99-1B
Reference 28: http://www.xbrl.org/2003/role/disclosureRef
-Topic 470
-SubTopic 10
-Name Accounting Standards Codification
-Section S99
-Paragraph 1B
-Subparagraph (SX 210.13-02(a)(4)(iii)(A))
-Publisher FASB
-URI https://asc.fasb.org/1943274/2147480097/470-10-S99-1B
Reference 29: http://www.xbrl.org/2003/role/disclosureRef
-Topic 470
-SubTopic 10
-Name Accounting Standards Codification
-Section S99
-Paragraph 1B
-Subparagraph (SX 210.13-02(a)(4)(iii)(B))
-Publisher FASB
-URI https://asc.fasb.org/1943274/2147480097/470-10-S99-1B
Reference 30: http://www.xbrl.org/2003/role/disclosureRef
-Topic 470
-SubTopic 10
-Name Accounting Standards Codification
-Section S99
-Paragraph 1B
-Subparagraph (SX 210.13-02(a)(4)(iv))
-Publisher FASB
-URI https://asc.fasb.org/1943274/2147480097/470-10-S99-1B
Reference 31: http://www.xbrl.org/2003/role/disclosureRef
-Topic 470
-SubTopic 10
-Name Accounting Standards Codification
-Section S99
-Paragraph 1B
-Subparagraph (SX 210.13-02(a)(5))
-Publisher FASB
-URI https://asc.fasb.org/1943274/2147480097/470-10-S99-1B
Reference 32: http://www.xbrl.org/2003/role/disclosureRef
-Topic 260
-SubTopic 10
-Name Accounting Standards Codification
-Section 45
-Paragraph 60B
-Subparagraph (a)
-Publisher FASB
-URI https://asc.fasb.org/1943274/2147482689/260-10-45-60B
Reference 33: http://www.xbrl.org/2003/role/disclosureRef
-Topic 205
-SubTopic 20
-Name Accounting Standards Codification
-Section 50
-Paragraph 7
-Publisher FASB
-URI https://asc.fasb.org/1943274/2147483499/205-20-50-7
Reference 34: http://fasb.org/us-gaap/role/ref/legacyRef
-Topic 230
-SubTopic 10
-Name Accounting Standards Codification
-Section 45
-Paragraph 28
-Publisher FASB
-URI https://asc.fasb.org/1943274/2147482740/230-10-45-28
Reference 35: http://www.xbrl.org/2003/role/disclosureRef
-Topic 220
-SubTopic 10
-Name Accounting Standards Codification
-Section 45
-Paragraph 1A
-Subparagraph (a)
-Publisher FASB
-URI https://asc.fasb.org/1943274/2147482790/220-10-45-1A
Reference 36: http://www.xbrl.org/2003/role/disclosureRef
-Topic 220
-SubTopic 10
-Name Accounting Standards Codification
-Section 45
-Paragraph 1B
-Subparagraph (a)
-Publisher FASB
-URI https://asc.fasb.org/1943274/2147482790/220-10-45-1B
Reference 37: http://fasb.org/us-gaap/role/ref/legacyRef
-Topic 942
-SubTopic 220
-Name Accounting Standards Codification
-Section S99
-Paragraph 1
-Subparagraph (SX 210.9-04(22))
-Publisher FASB
-URI https://asc.fasb.org/1943274/2147478524/942-220-S99-1
| Name: |
us-gaap_NetIncomeLoss |
| Namespace Prefix: |
us-gaap_ |
| Data Type: |
xbrli:monetaryItemType |
| Balance Type: |
credit |
| Period Type: |
duration |
|
v3.24.2
| X |
- ReferencesReference 1: http://www.xbrl.org/2003/role/presentationRef
-Publisher SEC
-Name Regulation S-K
-Number 229
-Section 408
-Subsection a
-Paragraph 1
| Name: |
ecd_NonRule10b51ArrAdoptedFlag |
| Namespace Prefix: |
ecd_ |
| Data Type: |
xbrli:booleanItemType |
| Balance Type: |
na |
| Period Type: |
duration |
|
| X |
- ReferencesReference 1: http://www.xbrl.org/2003/role/presentationRef
-Publisher SEC
-Name Regulation S-K
-Number 229
-Section 408
-Subsection a
-Paragraph 1
| Name: |
ecd_NonRule10b51ArrTrmntdFlag |
| Namespace Prefix: |
ecd_ |
| Data Type: |
xbrli:booleanItemType |
| Balance Type: |
na |
| Period Type: |
duration |
|
| X |
- ReferencesReference 1: http://www.xbrl.org/2003/role/presentationRef
-Publisher SEC
-Name Regulation S-K
-Number 229
-Section 408
-Subsection a
-Paragraph 1
| Name: |
ecd_Rule10b51ArrAdoptedFlag |
| Namespace Prefix: |
ecd_ |
| Data Type: |
xbrli:booleanItemType |
| Balance Type: |
na |
| Period Type: |
duration |
|
| X |
- ReferencesReference 1: http://www.xbrl.org/2003/role/presentationRef
-Publisher SEC
-Name Regulation S-K
-Number 229
-Section 408
-Subsection a
-Paragraph 1
| Name: |
ecd_Rule10b51ArrTrmntdFlag |
| Namespace Prefix: |
ecd_ |
| Data Type: |
xbrli:booleanItemType |
| Balance Type: |
na |
| Period Type: |
duration |
|
| X |
- ReferencesReference 1: http://www.xbrl.org/2003/role/presentationRef
-Publisher SEC
-Name Regulation S-K
-Number 229
-Section 408
-Subsection a
-Paragraph 2
-Subparagraph A
| Name: |
ecd_TradingArrByIndTable |
| Namespace Prefix: |
ecd_ |
| Data Type: |
xbrli:stringItemType |
| Balance Type: |
na |
| Period Type: |
duration |
|
v3.24.2
Accounting Policies (Policies)
|
6 Months Ended |
Jun. 30, 2024 |
|---|
| Accounting Policies [Abstract] |
|
| Recent accounting prounouncements |
Recently Adopted Accounting Pronouncements No accounting pronouncements adopted during the six months ended June 30, 2024 had a material impact on the Company's condensed consolidated financial statements. Recent Accounting Pronouncements Not Yet Adopted In November 2023, the FASB issued new guidance that is designed to improve reportable segment disclosure requirements, primarily through enhanced disclosure of significant segment expenses. The new guidance also expands interim segment disclosure requirements and requires disclosure of the position and title of the Company's chief operating decision-maker. The guidance will be effective for the Company's fiscal year ending December 31, 2024 and for interim periods starting in the first quarter of fiscal year 2025 with early adoption permitted. The guidance is required to be applied retrospectively to each prior reporting period presented. The Company is currently evaluating the effect of the guidance, including the impact on its consolidated financial statements and related disclosures. In December 2023, the FASB issued new guidance that enhances the transparency and decision usefulness of income tax disclosures, primarily through changes to the rate reconciliation and income taxes paid disclosures. The guidance will be effective for the Company's fiscal year ending December 31, 2025, and can be applied prospectively or retrospectively, with early adoption permitted. The Company is currently evaluating the effect of the guidance, including the impact on its consolidated financial statements and related disclosures.
|
| X |
- References
+ Details
| Name: |
us-gaap_AccountingPoliciesAbstract |
| Namespace Prefix: |
us-gaap_ |
| Data Type: |
xbrli:stringItemType |
| Balance Type: |
na |
| Period Type: |
duration |
|
| X |
- DefinitionDisclosure of accounting policy pertaining to new accounting pronouncements that may impact the entity's financial reporting. Includes, but is not limited to, quantification of the expected or actual impact.
| Name: |
us-gaap_NewAccountingPronouncementsPolicyPolicyTextBlock |
| Namespace Prefix: |
us-gaap_ |
| Data Type: |
dtr-types:textBlockItemType |
| Balance Type: |
na |
| Period Type: |
duration |
|
v3.24.2
Revenues (Tables)
|
6 Months Ended |
Jun. 30, 2024 |
|---|
| Revenue from Contract with Customer [Abstract] |
|
| Lessor, Operating Lease, Payment to be Received, Fiscal Year Maturity |
The following table is a summary of the contracted amounts owed to the Company by tenants pursuant to tenant contracts in effect as of June 30, 2024. | | | | | | | | | | | | | | | | | | | | | | | | | | | | | | | | | | | | | | | | | | | | | | | Six Months Ending December 31, | | Years Ending December 31, | | | | | | | 2024 | | 2025 | | 2026 | | 2027 | | 2028 | | Thereafter | | Total | Contracted amounts(a) | | $ | 2,595 | | | $ | 4,891 | | | $ | 4,729 | | | $ | 4,603 | | | $ | 4,381 | | | $ | 16,134 | | | $ | 37,333 | |
(a)Based on the nature of the contract, tenant contracts are accounted for pursuant to relevant lease accounting (ASC 842) or revenue accounting (ASC 606) guidance. Excludes amounts related to services, as those contracts generally have a duration of one year or less.
|
| X |
- DefinitionTabular disclosure of maturity of undiscounted cash flows to be received by lessor on annual basis for operating lease. Reference 1: http://www.xbrl.org/2009/role/commonPracticeRef
-Topic 842
-SubTopic 30
-Name Accounting Standards Codification
-Section 50
-Paragraph 12
-Publisher FASB
-URI https://asc.fasb.org/1943274/2147479773/842-30-50-12
| Name: |
us-gaap_LessorOperatingLeasePaymentsToBeReceivedMaturityTableTextBlock |
| Namespace Prefix: |
us-gaap_ |
| Data Type: |
dtr-types:textBlockItemType |
| Balance Type: |
na |
| Period Type: |
duration |
|
| X |
- References
+ Details
| Name: |
us-gaap_RevenueFromContractWithCustomerAbstract |
| Namespace Prefix: |
us-gaap_ |
| Data Type: |
xbrli:stringItemType |
| Balance Type: |
na |
| Period Type: |
duration |
|
v3.24.2
Debt and Other Obligations (Tables)
|
6 Months Ended |
Jun. 30, 2024 |
|---|
| Debt and Other Obligations [Abstract] |
|
| Schedule of Long-Term Debt Instruments |
The table below sets forth the Company's debt and other obligations as of June 30, 2024. | | | | | | | | | | | | | | | | | | | | | | | | | | | | | | | | | | Original
Issue Date | | Final Maturity Date(a) | | Balance as of June 30, 2024 | | Balance as of December 31, 2023 | | Stated Interest Rate as of June 30, 2024(a)(b) | | | Secured Notes, Series 2009-1, Class A-2 | July 2009 | | Aug. 2029 | | $ | 36 | | | $ | 40 | | | 9.0 | % | | | Tower Revenue Notes, Series 2015-2 | May 2015 | | May 2045 | (c) | 699 | | | 698 | | | 3.7 | % | | | Tower Revenue Notes, Series 2018-2 | July 2018 | | July 2048 | (c) | 747 | | | 746 | | | 4.2 | % | | Installment purchase liabilities and finance leases | Various | (d) | Various | (d) | 295 | | (e) | 270 | | (e) | Various | (d) | | Total secured debt | | | | | 1,777 | | | 1,754 | | | | | | 2016 Revolver | Jan. 2016 | | July 2027 | | — | | (f) | 670 | | | N/A | (g) | | 2016 Term Loan A | Jan. 2016 | | July 2027 | | 1,155 | | | 1,162 | | | 6.4 | % | (g) | | Commercial Paper Notes | Various | (h) | Various | (h) | 1,438 | | (h) | — | | | 5.9 | % | | | 3.200% Senior Notes | Aug. 2017 | | Sept. 2024 | | 750 | | | 749 | | | 3.2 | % | | | 1.350% Senior Notes | June 2020 | | July 2025 | | 499 | | | 498 | | | 1.4 | % | | | 4.450% Senior Notes | Feb. 2016 | | Feb. 2026 | | 898 | | | 898 | | | 4.5 | % | | | 3.700% Senior Notes | May 2016 | | June 2026 | | 748 | | | 748 | | | 3.7 | % | | | 1.050% Senior Notes | Feb. 2021 | | July 2026 | | 996 | | | 994 | | | 1.1 | % | | | 4.000% Senior Notes | Feb. 2017 | | Mar. 2027 | | 498 | | | 498 | | | 4.0 | % | | | 2.900% Senior Notes | Mar. 2022 | | Mar. 2027 | | 745 | | | 744 | | | 2.9 | % | | | 3.650% Senior Notes | Aug. 2017 | | Sept. 2027 | | 997 | | | 997 | | | 3.7 | % | | | 5.000% Senior Notes | Jan. 2023 | | Jan. 2028 | | 992 | | | 991 | | | 5.0 | % | | | 3.800% Senior Notes | Jan. 2018 | | Feb. 2028 | | 995 | | | 995 | | | 3.8 | % | | | 4.800% Senior Notes | Apr. 2023 | | Sept. 2028 | | 595 | | | 594 | | | 4.8 | % | | | 4.300% Senior Notes | Feb. 2019 | | Feb. 2029 | | 596 | | | 595 | | | 4.3 | % | | | 5.600% Senior Notes | Dec. 2023 | | June 2029 | | 741 | | | 740 | | | 5.6 | % | | | 3.100% Senior Notes | Aug. 2019 | | Nov. 2029 | | 546 | | | 546 | | | 3.1 | % | | | 3.300% Senior Notes | Apr. 2020 | | July 2030 | | 741 | | | 741 | | | 3.3 | % | | | 2.250% Senior Notes | June 2020 | | Jan. 2031 | | 1,092 | | | 1,091 | | | 2.3 | % | | | 2.100% Senior Notes | Feb. 2021 | | Apr. 2031 | | 991 | | | 990 | | | 2.1 | % | | | 2.500% Senior Notes | June 2021 | | July 2031 | | 743 | | | 743 | | | 2.5 | % | | | 5.100% Senior Notes | Apr. 2023 | | May 2033 | | 743 | | | 743 | | | 5.1 | % | | 5.800% Senior Notes | Dec. 2023 | | Mar. 2034 | | 742 | | | 740 | | | 5.8 | % | | | 2.900% Senior Notes | Feb. 2021 | | Apr. 2041 | | 1,235 | | | 1,234 | | | 2.9 | % | | | 4.750% Senior Notes | May 2017 | | May 2047 | | 344 | | | 344 | | | 4.8 | % | | | 5.200% Senior Notes | Feb. 2019 | | Feb. 2049 | | 396 | | | 396 | | | 5.2 | % | | | 4.000% Senior Notes | Aug. 2019 | | Nov. 2049 | | 346 | | | 346 | | | 4.0 | % | | | 4.150% Senior Notes | Apr. 2020 | | July 2050 | | 490 | | | 490 | | | 4.2 | % | | | 3.250% Senior Notes | June 2020 | | Jan. 2051 | | 890 | | | 890 | | | 3.3 | % | | | Total unsecured debt | | | | | 21,942 | | | 21,167 | | | | | | Total debt and other obligations | | | | | 23,719 | | | 22,921 | | | | | | Less: current maturities of debt and other obligations | | 865 | | | 835 | | | | | | Non-current portion of debt and other long-term obligations | | $ | 22,854 | | | $ | 22,086 | | | | |
(a)See the 2023 Form 10-K, including note 7 to the consolidated financial statements, for additional information regarding the maturity and principal amortization provisions and interest rates relating to the Company's indebtedness. (b)Represents the weighted-average stated interest rate, as applicable. (c)If the Tower Revenue Notes, Series 2015-2 and Series 2018-2 (collectively, "Tower Revenue Notes") are not paid in full on or prior to an applicable anticipated repayment date, then Excess Cash Flow (as defined in the indenture governing the terms of such notes) of the issuers of such notes will be used to repay principal of the applicable series and class of the Tower Revenue Notes, and additional interest (of an additional approximately 5% per annum) will accrue on the respective Tower Revenue Notes. As of June 30, 2024, the Tower Revenue Notes, Series 2015-2 and Series 2018-2 have principal amounts of $700 million and $750 million, with anticipated repayment dates in 2025 and 2028, respectively. (d)The Company's installment purchases primarily relate to land and bear interest rates up to 8% and mature in periods ranging from less than one year to approximately 25 years. (e)For the periods ended June 30, 2024 and December 31, 2023, reflects $27 million and $18 million, respectively, in finance lease obligations (primarily related to vehicles). (f)As of June 30, 2024, the undrawn availability under the Company's senior unsecured revolving credit facility ("2016 Revolver") was $7.0 billion. (g)Both the 2016 Revolver and the senior unsecured term loan A facility ("2016 Term Loan A" and, collectively, "2016 Credit Facility") bear interest, at the Company's option, at either (1) Term SOFR plus (i) a credit spread adjustment of 0.10% per annum and (ii) a credit spread ranging from 0.875% to 1.750% per annum or (2) an alternate base rate plus a credit spread ranging from 0.000% to 0.750% per annum, in each case, with the applicable credit spread based on the Company's senior unsecured debt rating. The Company pays a commitment fee ranging from 0.080% to 0.300%, based on the Company's senior unsecured debt rating, per annum on the undrawn available amount under the 2016 Revolver. See the 2023 Form 10-K, including note 7 to the consolidated financial statements, for information regarding potential adjustments to such percentages. (h)The maturities of the Commercial Paper Notes, when outstanding, may vary but may not exceed 397 days from the date of issue, but there were no Commercial Paper Notes issued or outstanding during the period that had original maturities greater than three months. The Commercial Paper Notes are issued under customary terms in the commercial paper market and are issued at a discount from par or, alternatively, can be issued at par and bear varying interest rates on a fixed or floating basis. At any point in time, the Company intends to maintain available commitments under its 2016 Revolver in an amount at least equal to the amount of Commercial Paper Notes outstanding. While any outstanding Commercial Paper Notes generally have short-term maturities, the Company classifies the outstanding issuances, when applicable, as long-term based on its ability and intent to refinance the outstanding issuances on a long-term basis.
|
| Schedule of Maturities of Long-term Debt |
Scheduled Principal Payments and Final Maturities The following are the scheduled principal payments and final maturities of the total debt and other long-term obligations of the Company outstanding as of June 30, 2024, which do not consider the principal payments that will commence following the anticipated repayment dates on the Tower Revenue Notes. | | | | | | | | | | | | | | | | | | | | | | | | | | | | | | | | | | | | | | | | | | | | | | | | | | | | | | | | Six Months Ending December 31, | | Years Ending December 31, | | | | Total Cash Obligations | | Unamortized Adjustments, Net | | Total Debt and Other Obligations Outstanding | | | 2024 | | 2025 | | 2026 | | 2027 | | 2028 | | Thereafter | | | | Scheduled principal payments and final maturities | $ | 2,249 | | (a) | $ | 605 | | | $ | 2,784 | | | $ | 3,254 | | | $ | 2,632 | |
| $ | 12,350 | | | $ | 23,874 | | | $ | (155) | | | $ | 23,719 | |
(a)Predominately consists of outstanding indebtedness under the CP Program as discussed in footnote (h) of the preceding table and $750 million aggregate principal amount of 3.200% senior unsecured notes due September 2024.
|
| Components of Interest Expense and Amortization of Deferred Financing Costs, net |
Interest Expense and Amortization of Deferred Financing Costs, Net The components of interest expense and amortization of deferred financing costs, net are as follows: | | | | | | | | | | | | | | | | | | | | | | | | | Three Months Ended June 30, | | Six Months Ended June 30, | | 2024 | | 2023 | | 2024 | | 2023 | | Interest expense on debt obligations | $ | 227 | | | $ | 205 | | | $ | 450 | | | $ | 403 | | | Amortization of deferred financing costs and adjustments on long-term debt | 8 | | | 7 | | | 16 | | | 14 | | | Capitalized interest | (5) | | | (4) | | | (10) | | | (7) | | | Total | $ | 230 | | | $ | 208 | | | $ | 456 | | | $ | 410 | |
|
| X |
- DefinitionDebt and Other Obligations [Abstract}
| Name: |
cci_DebtAndOtherObligationsAbstract |
| Namespace Prefix: |
cci_ |
| Data Type: |
xbrli:stringItemType |
| Balance Type: |
na |
| Period Type: |
duration |
|
| X |
- DefinitionSchedule of interest expense and amortization of deferred financing costs.
| Name: |
cci_ScheduleOfInterestExpenseAndAmortizationOfDeferredFinancingCostsTableTextBlock |
| Namespace Prefix: |
cci_ |
| Data Type: |
dtr-types1:textBlockItemType |
| Balance Type: |
na |
| Period Type: |
duration |
|
| X |
- DefinitionTabular disclosure of information pertaining to short-term and long-debt instruments or arrangements, including but not limited to identification of terms, features, collateral requirements and other information necessary to a fair presentation.
| Name: |
us-gaap_ScheduleOfDebtTableTextBlock |
| Namespace Prefix: |
us-gaap_ |
| Data Type: |
dtr-types:textBlockItemType |
| Balance Type: |
na |
| Period Type: |
duration |
|
| X |
- DefinitionTabular disclosure of maturity and sinking fund requirement for long-term debt. Reference 1: http://fasb.org/us-gaap/role/ref/legacyRef
-Name Accounting Standards Codification
-Section 50
-Paragraph 1
-SubTopic 10
-Topic 470
-Publisher FASB
-URI https://asc.fasb.org/1943274/2147481544/470-10-50-1
| Name: |
us-gaap_ScheduleOfMaturitiesOfLongTermDebtTableTextBlock |
| Namespace Prefix: |
us-gaap_ |
| Data Type: |
dtr-types:textBlockItemType |
| Balance Type: |
na |
| Period Type: |
duration |
|
v3.24.2
| X |
- DefinitionTabular disclosure of the fair value of financial instruments, including financial assets and financial liabilities, and the measurements of those instruments, assets, and liabilities. Reference 1: http://fasb.org/us-gaap/role/ref/legacyRef
-Name Accounting Standards Codification
-Topic 825
-SubTopic 10
-Section 50
-Paragraph 11
-Publisher FASB
-URI https://asc.fasb.org/1943274/2147482907/825-10-50-11
| Name: |
us-gaap_FairValueByBalanceSheetGroupingTextBlock |
| Namespace Prefix: |
us-gaap_ |
| Data Type: |
dtr-types:textBlockItemType |
| Balance Type: |
na |
| Period Type: |
duration |
|
| X |
- References
+ Details
| Name: |
us-gaap_FairValueDisclosuresAbstract |
| Namespace Prefix: |
us-gaap_ |
| Data Type: |
xbrli:stringItemType |
| Balance Type: |
na |
| Period Type: |
duration |
|
v3.24.2
Per Share Information (Tables)
|
6 Months Ended |
Jun. 30, 2024 |
|---|
| Earnings Per Share [Abstract] |
|
| Reconciliation of the Numerators and Denominators of the Basic and Diluted Per Share Computations |
| | | | | | | | | | | | | | | | | | | | | | | | | | Three Months Ended June 30, | | Six Months Ended June 30, | | | 2024 | | 2023 | | 2024 | | 2023 | | Net income (loss) | $ | 251 | | | $ | 455 | | | $ | 562 | | | $ | 874 | | | | | | | | | | | Weighted-average number of common shares outstanding (in millions): | | | | | | | | | Basic weighted-average number of common stock outstanding | 435 | | | 434 | | | 434 | | | 433 | | | Effect of assumed dilution from potential issuance of common shares relating to restricted stock units | — | | | — | | | 1 | | | 1 | | | Diluted weighted-average number of common shares outstanding | 435 | | | 434 | | | 435 | | | 434 | | | | | | | | | | | Net income (loss), per common share: | | | | | | | | | Basic | $ | 0.58 | | | $ | 1.05 | | | $ | 1.29 | | | $ | 2.02 | | | Diluted | $ | 0.58 | | | $ | 1.05 | | | $ | 1.29 | | | $ | 2.01 | | | | | | | | | | | Dividends/distributions declared per share of common stock | $ | 1.565 | | | $ | 1.565 | | | $ | 3.130 | | | $ | 3.130 | |
|
| X |
- References
+ Details
| Name: |
us-gaap_EarningsPerShareAbstract |
| Namespace Prefix: |
us-gaap_ |
| Data Type: |
xbrli:stringItemType |
| Balance Type: |
na |
| Period Type: |
duration |
|
| X |
- DefinitionTabular disclosure of an entity's basic and diluted earnings per share calculations, including a reconciliation of numerators and denominators of the basic and diluted per-share computations for income from continuing operations. Reference 1: http://www.xbrl.org/2009/role/commonPracticeRef
-Topic 260
-SubTopic 10
-Name Accounting Standards Codification
-Section 50
-Paragraph 1
-Subparagraph (a)
-Publisher FASB
-URI https://asc.fasb.org/1943274/2147482662/260-10-50-1
| Name: |
us-gaap_ScheduleOfEarningsPerShareBasicAndDilutedTableTextBlock |
| Namespace Prefix: |
us-gaap_ |
| Data Type: |
dtr-types:textBlockItemType |
| Balance Type: |
na |
| Period Type: |
duration |
|
v3.24.2
Equity (Tables)
|
6 Months Ended |
Jun. 30, 2024 |
|---|
| Equity [Abstract] |
|
| Dividends Declared |
Declaration and Payment of Dividends During the six months ended June 30, 2024, the following dividends/distributions were declared or paid: | | | | | | | | | | | | | | | | | | | | | | | | | | | | | | | | | | Equity Type | | Declaration Date | | Record Date | | Payment Date | | Dividends Per Share | | Aggregate Payment Amount(a) | | Common Stock | | February 21, 2024 | | March 15, 2024 | | March 28, 2024 | | $ | 1.565 | | | $ | 683 | | | Common Stock | | May 22, 2024 | | June 14, 2024 | | June 28, 2024 | | $ | 1.565 | | | $ | 684 | | | | | | | | | | | | | | | | | | | | | | | | | | | | | | | | | | | | | | | | | | | | | | | | | | | | | | | | | | | | | | | | | | | |
(a)Inclusive of dividends accrued for holders of unvested RSUs, which will be paid when and if the RSUs vest.
|
| X |
- DefinitionTabular disclosure of information related to dividends declared, including paid and unpaid dividends.
| Name: |
us-gaap_DividendsDeclaredTableTextBlock |
| Namespace Prefix: |
us-gaap_ |
| Data Type: |
dtr-types:textBlockItemType |
| Balance Type: |
na |
| Period Type: |
duration |
|
| X |
- References
+ Details
| Name: |
us-gaap_EquityAbstract |
| Namespace Prefix: |
us-gaap_ |
| Data Type: |
xbrli:stringItemType |
| Balance Type: |
na |
| Period Type: |
duration |
|
v3.24.2
Operating Segments Operating Segments (Tables)
|
3 Months Ended |
6 Months Ended |
Jun. 30, 2024 |
Jun. 30, 2024 |
| Segment Reporting [Abstract] |
|
|
| Schedule of Segment Reporting Information, by Segment |
| | | | | | | | | | | | | | | | | | | | | | | | | | | | | | | | | | | | | | | | | | | | | | | | | Three Months Ended June 30, 2024 | | Three Months Ended June 30, 2023 | | Towers | | Fiber | | Other | |
Total | | Towers | | Fiber | | Other | |
Total | | Segment site rental revenues | $ | 1,064 | | | $ | 516 | | | | | $ | 1,580 | | | $ | 1,080 | | | $ | 648 | | | | | $ | 1,728 | | | Segment services and other revenues | 43 | | | 3 | | | | | 46 | | | 124 | | | 15 | | | | | 139 | | | Segment revenues | 1,107 | | | 519 | | | | | 1,626 | | | 1,204 | | | 663 | | | | | 1,867 | | | Segment site rental costs of operations | 245 | | | 178 | | | | | 423 | | | 243 | | | 171 | | | | | 414 | | | Segment services and other costs of operations | 23 | | | 2 | | | | | 25 | | | 92 | | | 3 | | | | | 95 | | Segment costs of operations(a)(b) | 268 | | | 180 | | | | | 448 | | | 335 | | | 174 | | | | | 509 | | | Segment site rental gross margin | 819 | | | 338 | | | | | 1,157 | | | 837 | | | 477 | | | | | 1,314 | | | Segment services and other gross margin | 20 | | | 1 | | | | | 21 | | | 32 | | | 12 | | | | | 44 | | Segment selling, general and administrative expenses(b) | 16 | | | 50 | | | | | 66 | | | 30 | | | 51 | | | | | 81 | | | Segment operating profit (loss) | 823 | | | 289 | | | | | 1,112 | | | 839 | | | 438 | | | | | 1,277 | | Other selling, general and administrative expenses(b) | | | | | $ | 105 | | | 105 | | | | | | | $ | 88 | | | 88 | | | Stock-based compensation expense, net | | | | | 40 | | | 40 | | | | | | | 50 | | | 50 | | | Depreciation, amortization and accretion | | | | | 430 | | | 430 | | | | | | | 445 | | | 445 | | Restructuring charges | | | | | 45 | | | 45 | | | | | | | — | | | — | | | Interest expense and amortization of deferred financing costs, net | | | | | 230 | | | 230 | | | | | | | 208 | | | 208 | | Other (income) expenses to reconcile to income (loss) before income taxes(c) | | | | | 4 | | | 4 | | | | | | | 24 | | | 24 | | | Income (loss) before income taxes | | | | | | | $ | 258 | | | | | | | | | $ | 462 | | | Capital expenditures | $ | 29 | | | $ | 289 | | | $ | 11 | | | $ | 329 | | | $ | 61 | | | $ | 306 | | | $ | 12 | | | $ | 379 | | | Total assets (at period end) | $ | 21,177 | | | $ | 16,358 | | | $ | 711 | | | $ | 38,246 | | | $ | 21,973 | | | $ | 16,166 | | | $ | 903 | | | $ | 39,042 | |
(a)Exclusive of depreciation, amortization and accretion shown separately. (b)Segment costs of operations excludes (1) stock-based compensation expense, net of $7 million and $9 million for the three months ended June 30, 2024 and 2023, respectively and (2) prepaid lease purchase price adjustments of $4 million for each of the three months ended June 30, 2024 and 2023. Segment selling, general and administrative expenses and other selling, general and administrative expenses exclude stock-based compensation expense, net of $33 million and $41 million for the three months ended June 30, 2024 and 2023, respectively. (c)See condensed consolidated statement of operations and comprehensive income (loss) for further information.
|
| | | | | | | | | | | | | | | | | | | | | | | | | | | | | | | | | | | | | | | | | | | | | | | | | Six Months Ended June 30, 2024 | | Six Months Ended June 30, 2023 | | Towers | | Fiber | | Other | |
Total | | Towers | | Fiber | | Other | |
Total | | Segment site rental revenues | $ | 2,132 | | | $ | 1,036 | | | | | $ | 3,168 | | | $ | 2,161 | | | $ | 1,191 | | | | | $ | 3,352 | | | Segment services and other revenues | 89 | | | 10 | | | | | 99 | | | 270 | | | 18 | | | | | 288 | | | Segment revenues | 2,221 | | | 1,046 | | | | | 3,267 | | | 2,431 | | | 1,209 | | | | | 3,640 | | | Segment site rental costs of operations | 483 | | | 360 | | | | | 843 | | | 477 | | | 343 | | | | | 820 | | | Segment services and other costs of operations | 51 | | | 7 | | | | | 58 | | | 191 | | | 5 | | | | | 196 | | Segment costs of operations(a)(b) | 534 | | | 367 | | | | | 901 | | | 668 | | | 348 | | | | | 1,016 | | | Segment site rental gross margin | 1,649 | | | 676 | | | | | 2,325 | | | 1,684 | | | 848 | | | | | 2,532 | | | Segment services and other gross margin | 38 | | | 3 | | | | | 41 | | | 79 | | | 13 | | | | | 92 | | Segment selling, general and administrative expenses(b) | 37 | | | 97 | | | | | 134 | | | 61 | | | 100 | | | | | 161 | | Segment operating profit (loss) | 1,650 | | | 582 | | | | | 2,232 | | | 1,702 | | | 761 | | | | | 2,463 | | Other selling, general and administrative expenses(b) | | | | | $ | 189 | | | 189 | | | | | | | $ | 170 | | | 170 | | | Stock-based compensation expense | | | | | 78 | | | 78 | | | | | | | 91 | | | 91 | | Depreciation, amortization and accretion | | | | | 869 | | | 869 | | | | | | | 876 | | | 876 | | Restructuring charges | | | | | 56 | | | 56 | | | | | | | — | | | — | | | Interest expense and amortization of deferred financing costs, net | | | | | 456 | | | 456 | | | | | | | 410 | | | 410 | | Other (income) expenses to reconcile to income (loss) before income taxes(c) | | | | | 8 | | | 8 | | | | | | | 28 | | | 28 | | | Income (loss) before income taxes | | | | | | | $ | 576 | | | | | | | | | $ | 888 | | | Capital expenditures | $ | 64 | | | $ | 562 | | | $ | 23 | | | $ | 649 | | | $ | 111 | | | $ | 585 | | | $ | 24 | | | $ | 720 | |
(a)Exclusive of depreciation, amortization and accretion shown separately. (b)Segment costs of operations excludes (1) stock-based compensation expense, net of $14 million and $17 million for the six months ended June 30, 2024 and 2023, respectively, and (2) prepaid lease purchase price adjustments of $8 million for each of the six months ended June 30, 2024 and 2023. Segment selling, general and administrative expenses and other selling, general and administrative expenses exclude stock-based compensation expense, net of $64 million and $74 million for the six months ended June 30, 2024 and 2023, respectively. (c)See condensed consolidated statement of operations and comprehensive income (loss) for further information.
|
| X |
- DefinitionTabular disclosure of the profit or loss and total assets for each reportable segment. An entity discloses certain information on each reportable segment if the amounts (a) are included in the measure of segment profit or loss reviewed by the chief operating decision maker or (b) are otherwise regularly provided to the chief operating decision maker, even if not included in that measure of segment profit or loss. Reference 1: http://fasb.org/us-gaap/role/ref/legacyRef
-Name Accounting Standards Codification
-Topic 280
-SubTopic 10
-Section 50
-Paragraph 25
-Publisher FASB
-URI https://asc.fasb.org/1943274/2147482810/280-10-50-25
Reference 2: http://fasb.org/us-gaap/role/ref/legacyRef
-Name Accounting Standards Codification
-Topic 280
-SubTopic 10
-Section 50
-Paragraph 22
-Publisher FASB
-URI https://asc.fasb.org/1943274/2147482810/280-10-50-22
Reference 3: http://fasb.org/us-gaap/role/ref/legacyRef
-Name Accounting Standards Codification
-Topic 280
-SubTopic 10
-Section 50
-Paragraph 30
-Publisher FASB
-URI https://asc.fasb.org/1943274/2147482810/280-10-50-30
| Name: |
us-gaap_ScheduleOfSegmentReportingInformationBySegmentTextBlock |
| Namespace Prefix: |
us-gaap_ |
| Data Type: |
dtr-types:textBlockItemType |
| Balance Type: |
na |
| Period Type: |
duration |
|
| X |
- References
+ Details
| Name: |
us-gaap_SegmentReportingAbstract |
| Namespace Prefix: |
us-gaap_ |
| Data Type: |
xbrli:stringItemType |
| Balance Type: |
na |
| Period Type: |
duration |
|
v3.24.2
Supplemental Cash Flow Information (Tables)
|
6 Months Ended |
Jun. 30, 2024 |
|---|
| Supplemental Cash Flow Elements [Abstract] |
|
| Schedule of Cash Flow, Supplemental Disclosures [Table Text Block] |
The following table is a summary of the Company's supplemental cash flow information for the six months ended June 30, 2024 and 2023: | | | | | | | | | | | | | Six Months Ended June 30, | | 2024 | | 2023 | | Supplemental disclosure of cash flow information: | | | | Cash payments related to operating lease liabilities(a) | $ | 283 | | | $ | 284 | | | Interest paid | 441 | | | 367 | | Income taxes paid | 9 | | | 10 | | | Supplemental disclosure of non-cash operating, investing and financing activities: | | | | ROU assets recorded in exchange for operating lease liabilities | (70) | | | 28 | | | Increase (decrease) in accounts payable for purchases of property and equipment | (18) | | | 16 | | Capitalized stock-based compensation | 13 | | | 14 | | | Purchase of property and equipment under finance leases and installment land purchases | 41 | | | 39 | |
(a)Excludes the Company's contingent payments pursuant to operating leases, which are recorded as expense in the period such contingencies are resolved.
|
| Schedule of Cash, Cash Equivalents and Restricted Cash and Cash Equivalents |
The reconciliation of cash and cash equivalents and restricted cash and cash equivalents reported within various lines on the condensed consolidated balance sheet to amounts reported in the condensed consolidated statement of cash flows is shown below. | | | | | | | | | | | | | June 30, 2024 | | December 31, 2023 | | Cash and cash equivalents | $ | 155 | | | $ | 105 | | Restricted cash and cash equivalents, current | 171 | | | 171 | | Restricted cash and cash equivalents reported within other assets, net | 5 | | | 5 | | Cash and cash equivalents and restricted cash and cash equivalents | $ | 331 | | | $ | 281 | |
|
| X |
- Definition[Table Text Block] for Schedule of Cash, Cash Equivalents and Restricted Cash [Table]
| Name: |
cci_ScheduleofCashCashEquivalentsandRestrictedCashTableTextBlock |
| Namespace Prefix: |
cci_ |
| Data Type: |
dtr-types1:textBlockItemType |
| Balance Type: |
na |
| Period Type: |
duration |
|
| X |
- DefinitionTabular disclosure of supplemental cash flow information for the periods presented.
| Name: |
us-gaap_ScheduleOfCashFlowSupplementalDisclosuresTableTextBlock |
| Namespace Prefix: |
us-gaap_ |
| Data Type: |
dtr-types:textBlockItemType |
| Balance Type: |
na |
| Period Type: |
duration |
|
| X |
- References
+ Details
| Name: |
us-gaap_SupplementalCashFlowElementsAbstract |
| Namespace Prefix: |
us-gaap_ |
| Data Type: |
xbrli:stringItemType |
| Balance Type: |
na |
| Period Type: |
duration |
|
v3.24.2
Restructuring and Related Activities (Tables)
|
6 Months Ended |
Jun. 30, 2024 |
|---|
| Restructuring and Related Activities [Abstract] |
|
| Restructuring and Related Costs |
The following table summarizes the activities related to the 2023 Restructuring Plan for the three and six months ended June 30, 2024: | | | | | | | | | | | | | | | | | | | | | | | | | | | | | | | | | | | | | Three Months Ended June 30, 2024 | | Six Months Ended June 30, 2024 | | Employee Headcount Reduction | | Office Space Consolidation | | Total | | Employee Headcount Reduction | | Office Space Consolidation | | Total | Liability as of the beginning of the respective period | $ | 8 | | | $ | 15 | | | $ | 23 | | | $ | 16 | | | $ | 12 | | | $ | 28 | | Charges | 1 | | | 1 | | | 2 | | | 1 | | | 12 | | | 13 | | Payments | (3) | | | (4) | | | (7) | | | (11) | | | (8) | | | (19) | | Non-cash items | — | | | — | | | — | | | — | | | (4) | | | (4) | | Liability as of June 30, 2024 | $ | 6 | | | $ | 12 | | | $ | 18 | | | $ | 6 | | | $ | 12 | | | $ | 18 | |
|
| 2024 Restructuring and Related Costs |
The following table summarizes the activities related to the 2024 Restructuring Plan for the three and six months ended June 30, 2024: | | | | | | | | | | | | | | | | | | | | | | | | | | | Three and Six Months Ended June 30, 2024 | | | | Employee Headcount Reduction | | Office Closures | | | | Total | | | | | | | Charges | 36 | | | 7 | | | | | 43 | | | | | | | | Payments | (2) | | | — | | | | | (2) | | | | | | | | Non-cash items | — | | | (7) | | | | | (7) | | | | | | | | Liability as of June 30, 2024 | $ | 34 | | | $ | — | | | | | $ | 34 | | | | | | | |
|
| X |
- Definition2024 Restructuring and Related Costs
| Name: |
cci_A2024RestructuringAndRelatedCostsTableTextBlock |
| Namespace Prefix: |
cci_ |
| Data Type: |
dtr-types:textBlockItemType |
| Balance Type: |
na |
| Period Type: |
duration |
|
| X |
- DefinitionTabular disclosure of costs incurred for restructuring including, but not limited to, exit and disposal activities, remediation, implementation, integration, asset impairment, and charges against earnings from the write-down of assets. Reference 1: http://fasb.org/us-gaap/role/ref/legacyRef
-Topic 420
-SubTopic 10
-Name Accounting Standards Codification
-Section S99
-Paragraph 1
-Subparagraph (SAB Topic 5.P.3)
-Publisher FASB
-URI https://asc.fasb.org/1943274/2147479823/420-10-S99-1
Reference 2: http://fasb.org/us-gaap/role/ref/legacyRef
-Topic 420
-SubTopic 10
-Name Accounting Standards Codification
-Section S99
-Paragraph 2
-Subparagraph (SAB Topic 5.P.4)
-Publisher FASB
-URI https://asc.fasb.org/1943274/2147479823/420-10-S99-2
Reference 3: http://fasb.org/us-gaap/role/ref/legacyRef
-Name Accounting Standards Codification
-Topic 420
-SubTopic 10
-Section 50
-Paragraph 1
-Publisher FASB
-URI https://asc.fasb.org/1943274/2147482017/420-10-50-1
| Name: |
us-gaap_ScheduleOfRestructuringAndRelatedCostsTextBlock |
| Namespace Prefix: |
us-gaap_ |
| Data Type: |
dtr-types:textBlockItemType |
| Balance Type: |
na |
| Period Type: |
duration |
|
v3.24.2
| X |
- DefinitionPurchase Option, Percentage of Towers
| Name: |
cci_PurchaseOptionPercentageofTowers |
| Namespace Prefix: |
cci_ |
| Data Type: |
dtr-types1:percentItemType |
| Balance Type: |
na |
| Period Type: |
instant |
|
| X |
- Details
| Name: |
cci_ContractualTermsAxis=cci_SubjectToCapitalLeaseWithTMOOrATTMember |
| Namespace Prefix: |
|
| Data Type: |
na |
| Balance Type: |
|
| Period Type: |
|
|
v3.24.2
Revenues (Details) - USD ($)
$ in Millions |
3 Months Ended |
6 Months Ended |
|
|
Jun. 30, 2024 |
Jun. 30, 2023 |
Jun. 30, 2024 |
Jun. 30, 2023 |
Dec. 31, 2023 |
Dec. 31, 2022 |
| Revenue, Remaining Performance Obligation, Amount |
|
$ 2,000
|
|
$ 2,000
|
|
$ 2,100
|
$ 2,300
|
| Revenue Recognized on Deferred Revenues |
|
|
|
270
|
$ 360
|
|
|
| Contracted Amounts Receivable from Customers, remainder of year |
[1] |
2,595
|
|
2,595
|
|
|
|
| Contracted Amounts Receivable from Customers, in Two Years |
[1] |
4,891
|
|
4,891
|
|
|
|
| Contracted Amounts Receivable from Customers, in Three Years |
[1] |
4,729
|
|
4,729
|
|
|
|
| Contracted Amounts Receivable from Customers, in Four Years |
[1] |
4,603
|
|
4,603
|
|
|
|
| Contracted Amounts Receivable from Customers, in Five Years |
[1] |
4,381
|
|
4,381
|
|
|
|
| Contracted Amounts Receivable from Customers, Thereafter |
[1] |
16,134
|
|
16,134
|
|
|
|
| Lessor, Operating Lease, Payments to be Received |
[1] |
37,333
|
|
37,333
|
|
|
|
| Accelerated prepaid rent amortization |
|
|
$ 57
|
|
57
|
|
|
| Site rental revenue - remaining rental obligation |
|
$ 1
|
$ 106
|
$ 4
|
$ 154
|
|
|
| Minimum [Member] |
|
|
|
|
|
|
|
| Revenue Recognition Non-cancelable Lease Term for Wireless Tenants |
|
|
|
five
|
|
|
|
| Revenue Recognition for Fiber Solutions Tenants |
|
|
|
one
|
|
|
|
| Revenue, Performance Obligation, Description of Payment Terms |
|
|
|
45
|
|
|
|
| Maximum [Member] |
|
|
|
|
|
|
|
| Revenue Recognition Non-cancelable Lease Term for Wireless Tenants |
|
|
|
15
|
|
|
|
| Revenue Recognition for Fiber Solutions Tenants |
|
|
|
20
|
|
|
|
| Revenue, Performance Obligation, Description of Payment Terms |
|
|
|
90
|
|
|
|
|
|
| X |
- DefinitionAccelerated prepaid rent amortization
| Name: |
cci_AcceleratedPrepaidRentAmortization |
| Namespace Prefix: |
cci_ |
| Data Type: |
xbrli:monetaryItemType |
| Balance Type: |
credit |
| Period Type: |
duration |
|
| X |
- DefinitionRevenue Recognition Non-cancelable Lease Term for Wireless Tenants
| Name: |
cci_RevenueRecognitionNoncancelableLeaseTermforWirelessTenants |
| Namespace Prefix: |
cci_ |
| Data Type: |
xbrli:stringItemType |
| Balance Type: |
na |
| Period Type: |
duration |
|
| X |
- DefinitionRevenue Recognition for Fiber Solutions Tenants
| Name: |
cci_RevenueRecognitionforFiberSolutionsTenants |
| Namespace Prefix: |
cci_ |
| Data Type: |
xbrli:stringItemType |
| Balance Type: |
na |
| Period Type: |
duration |
|
| X |
- DefinitionSite rental revenue - remaining rental obligation
| Name: |
cci_SiteRentalRevenueRemainingRentalObligation |
| Namespace Prefix: |
cci_ |
| Data Type: |
xbrli:monetaryItemType |
| Balance Type: |
credit |
| Period Type: |
duration |
|
| X |
- DefinitionAmount of revenue recognized that was previously included in balance of obligation to transfer good or service to customer for which consideration from customer has been received or is due. Reference 1: http://www.xbrl.org/2003/role/disclosureRef
-Topic 606
-SubTopic 10
-Name Accounting Standards Codification
-Section 50
-Paragraph 8
-Subparagraph (b)
-Publisher FASB
-URI https://asc.fasb.org/1943274/2147479806/606-10-50-8
| Name: |
us-gaap_ContractWithCustomerLiabilityRevenueRecognized |
| Namespace Prefix: |
us-gaap_ |
| Data Type: |
xbrli:monetaryItemType |
| Balance Type: |
credit |
| Period Type: |
duration |
|
| X |
- DefinitionAmount of lease payments to be received by lessor for operating lease. Reference 1: http://www.xbrl.org/2003/role/disclosureRef
-Topic 842
-SubTopic 30
-Name Accounting Standards Codification
-Section 50
-Paragraph 12
-Publisher FASB
-URI https://asc.fasb.org/1943274/2147479773/842-30-50-12
| Name: |
us-gaap_LessorOperatingLeasePaymentsToBeReceived |
| Namespace Prefix: |
us-gaap_ |
| Data Type: |
xbrli:monetaryItemType |
| Balance Type: |
debit |
| Period Type: |
instant |
|
| X |
- DefinitionAmount of lease payment to be received by lessor for operating lease in fourth fiscal year following current fiscal year. Excludes interim and annual periods when interim periods are reported from current statement of financial position date (rolling approach). Reference 1: http://www.xbrl.org/2003/role/disclosureRef
-Topic 842
-SubTopic 30
-Name Accounting Standards Codification
-Section 50
-Paragraph 12
-Publisher FASB
-URI https://asc.fasb.org/1943274/2147479773/842-30-50-12
| Name: |
us-gaap_LessorOperatingLeasePaymentsToBeReceivedFourYears |
| Namespace Prefix: |
us-gaap_ |
| Data Type: |
xbrli:monetaryItemType |
| Balance Type: |
debit |
| Period Type: |
instant |
|
| X |
- DefinitionAmount of lease payment to be received by lessor for operating lease in next fiscal year following current fiscal year. Excludes interim and annual periods when interim periods are reported from current statement of financial position date (rolling approach). Reference 1: http://www.xbrl.org/2003/role/disclosureRef
-Topic 842
-SubTopic 30
-Name Accounting Standards Codification
-Section 50
-Paragraph 12
-Publisher FASB
-URI https://asc.fasb.org/1943274/2147479773/842-30-50-12
| Name: |
us-gaap_LessorOperatingLeasePaymentsToBeReceivedNextTwelveMonths |
| Namespace Prefix: |
us-gaap_ |
| Data Type: |
xbrli:monetaryItemType |
| Balance Type: |
debit |
| Period Type: |
instant |
|
| X |
- DefinitionAmount of lease payment to be received by lessor for operating lease in remainder of current fiscal year. Excludes interim and annual periods when interim periods are reported from current statement of financial position date (rolling approach). Reference 1: http://www.xbrl.org/2009/role/commonPracticeRef
-Topic 842
-SubTopic 30
-Name Accounting Standards Codification
-Section 50
-Paragraph 12
-Publisher FASB
-URI https://asc.fasb.org/1943274/2147479773/842-30-50-12
| Name: |
us-gaap_LessorOperatingLeasePaymentsToBeReceivedRemainderOfFiscalYear |
| Namespace Prefix: |
us-gaap_ |
| Data Type: |
xbrli:monetaryItemType |
| Balance Type: |
debit |
| Period Type: |
instant |
|
| X |
- DefinitionAmount of lease payment to be received by lessor for operating lease after fifth fiscal year following current fiscal year. Excludes interim and annual periods when interim periods are reported from current statement of financial position date (rolling approach). Reference 1: http://www.xbrl.org/2003/role/disclosureRef
-Topic 842
-SubTopic 30
-Name Accounting Standards Codification
-Section 50
-Paragraph 12
-Publisher FASB
-URI https://asc.fasb.org/1943274/2147479773/842-30-50-12
| Name: |
us-gaap_LessorOperatingLeasePaymentsToBeReceivedThereafter |
| Namespace Prefix: |
us-gaap_ |
| Data Type: |
xbrli:monetaryItemType |
| Balance Type: |
debit |
| Period Type: |
instant |
|
| X |
- DefinitionAmount of lease payment to be received by lessor for operating lease in third fiscal year following current fiscal year. Excludes interim and annual periods when interim periods are reported from current statement of financial position date (rolling approach). Reference 1: http://www.xbrl.org/2003/role/disclosureRef
-Topic 842
-SubTopic 30
-Name Accounting Standards Codification
-Section 50
-Paragraph 12
-Publisher FASB
-URI https://asc.fasb.org/1943274/2147479773/842-30-50-12
| Name: |
us-gaap_LessorOperatingLeasePaymentsToBeReceivedThreeYears |
| Namespace Prefix: |
us-gaap_ |
| Data Type: |
xbrli:monetaryItemType |
| Balance Type: |
debit |
| Period Type: |
instant |
|
| X |
- DefinitionAmount of lease payment to be received by lessor for operating lease in second fiscal year following current fiscal year. Excludes interim and annual periods when interim periods are reported from current statement of financial position date (rolling approach). Reference 1: http://www.xbrl.org/2003/role/disclosureRef
-Topic 842
-SubTopic 30
-Name Accounting Standards Codification
-Section 50
-Paragraph 12
-Publisher FASB
-URI https://asc.fasb.org/1943274/2147479773/842-30-50-12
| Name: |
us-gaap_LessorOperatingLeasePaymentsToBeReceivedTwoYears |
| Namespace Prefix: |
us-gaap_ |
| Data Type: |
xbrli:monetaryItemType |
| Balance Type: |
debit |
| Period Type: |
instant |
|
| X |
- DefinitionAmount of transaction price allocated to performance obligation that has not been recognized as revenue. Reference 1: http://www.xbrl.org/2003/role/disclosureRef
-Name Accounting Standards Codification
-Section 50
-Paragraph 13
-Subparagraph (a)
-SubTopic 10
-Topic 606
-Publisher FASB
-URI https://asc.fasb.org/1943274/2147479806/606-10-50-13
| Name: |
us-gaap_RevenueRemainingPerformanceObligation |
| Namespace Prefix: |
us-gaap_ |
| Data Type: |
xbrli:monetaryItemType |
| Balance Type: |
credit |
| Period Type: |
instant |
|
| X |
- Details
| Name: |
srt_RangeAxis=srt_MinimumMember |
| Namespace Prefix: |
|
| Data Type: |
na |
| Balance Type: |
|
| Period Type: |
|
|
| X |
- Details
| Name: |
srt_RangeAxis=srt_MaximumMember |
| Namespace Prefix: |
|
| Data Type: |
na |
| Balance Type: |
|
| Period Type: |
|
|
v3.24.2
Debt and Other Obligations (Indebtedness) (Details) - USD ($)
$ in Millions |
6 Months Ended |
|
Jun. 30, 2024 |
Dec. 31, 2023 |
| Debt Instrument [Line Items] |
|
|
|
|
| Debt and Finance Lease Obligations |
|
$ 23,719
|
|
$ 22,921
|
| Less: current maturities of debt and other obligations |
|
865
|
|
835
|
| Non-current portion of long-term debt and other long-term obligations |
|
22,854
|
|
22,086
|
| Capital Lease Obligations |
|
27
|
|
18
|
| 2015 Tower Revenue Notes 3.663% due 2045 [Member] |
|
|
|
|
| Debt Instrument [Line Items] |
|
|
|
|
| Debt Instrument, Face Amount |
|
700
|
|
|
| 2018 Tower Revenue Notes 4.241% due 2048 [Member] |
|
|
|
|
| Debt Instrument [Line Items] |
|
|
|
|
| Debt Instrument, Face Amount |
|
$ 750
|
|
|
| Fixed Rate Securitized Debt July 2018 Tower Revenue Notes [Member] |
|
|
|
|
| Debt Instrument [Line Items] |
|
|
|
|
| Debt Instrument, Interest Rate, Increase (Decrease) |
|
5.00%
|
|
|
| Securitized Debt [Member] |
|
|
|
|
| Debt Instrument [Line Items] |
|
|
|
|
| Debt and Finance Lease Obligations |
|
$ 1,777
|
|
1,754
|
| Securitized Debt [Member] | Fixed Rate Debt 2009 Securitized Notes A-2 [Member] |
|
|
|
|
| Debt Instrument [Line Items] |
|
|
|
|
| Debt Instrument, Interest Rate, Stated Percentage |
[1],[2] |
9.00%
|
|
|
| Debt and Finance Lease Obligations |
|
$ 36
|
|
40
|
| Securitized Debt [Member] | 2015 Tower Revenue Notes 3.663% due 2045 [Member] |
|
|
|
|
| Debt Instrument [Line Items] |
|
|
|
|
| Debt Instrument, Interest Rate, Stated Percentage |
[1],[2] |
3.70%
|
|
|
| Debt and Finance Lease Obligations |
[3] |
$ 699
|
|
698
|
| Securitized Debt [Member] | 2018 Tower Revenue Notes 4.241% due 2048 [Member] |
|
|
|
|
| Debt Instrument [Line Items] |
|
|
|
|
| Debt Instrument, Interest Rate, Stated Percentage |
[1],[2] |
4.20%
|
|
|
| Debt and Finance Lease Obligations |
[3] |
$ 747
|
|
746
|
| Finance Lease Obligations and Other [Member] | Securitized Debt [Member] |
|
|
|
|
| Debt Instrument [Line Items] |
|
|
|
|
| Debt and Finance Lease Obligations |
[4] |
$ 295
|
|
270
|
| Bank Debt [Member] | 2016 Term Loan A [Member] |
|
|
|
|
| Debt Instrument [Line Items] |
|
|
|
|
| Debt Instrument, Interest Rate, Stated Percentage |
[1],[2],[5] |
6.40%
|
|
|
| Debt and Finance Lease Obligations |
|
$ 1,155
|
|
1,162
|
| Bank Debt [Member] | Commercial Paper [Member] |
|
|
|
|
| Debt Instrument [Line Items] |
|
|
|
|
| Debt Instrument, Interest Rate, Stated Percentage |
[1],[2] |
5.90%
|
|
|
| High Yield Bonds [Member] | August 2017 Senior Unsecured 3.200% Notes [Member] |
|
|
|
|
| Debt Instrument [Line Items] |
|
|
|
|
| Debt Instrument, Interest Rate, Stated Percentage |
[1],[2] |
3.20%
|
|
|
| Debt and Finance Lease Obligations |
|
$ 750
|
|
749
|
| High Yield Bonds [Member] | June 2020 Senior Unsecured 1.350% Notes [Domain] |
|
|
|
|
| Debt Instrument [Line Items] |
|
|
|
|
| Debt Instrument, Interest Rate, Stated Percentage |
[1],[2] |
1.40%
|
|
|
| Debt and Finance Lease Obligations |
|
$ 499
|
|
498
|
| High Yield Bonds [Member] | Senior Unsecured 2016 Notes 4.450% [Member] |
|
|
|
|
| Debt Instrument [Line Items] |
|
|
|
|
| Debt Instrument, Interest Rate, Stated Percentage |
[1],[2] |
4.50%
|
|
|
| Debt and Finance Lease Obligations |
|
$ 898
|
|
898
|
| High Yield Bonds [Member] | Senior Unsecured 2016 Notes 3.7% [Member] |
|
|
|
|
| Debt Instrument [Line Items] |
|
|
|
|
| Debt Instrument, Interest Rate, Stated Percentage |
[1],[2] |
3.70%
|
|
|
| Debt and Finance Lease Obligations |
|
$ 748
|
|
748
|
| High Yield Bonds [Member] | February 2021 Senior Unsecured 1.050% Notes |
|
|
|
|
| Debt Instrument [Line Items] |
|
|
|
|
| Debt Instrument, Interest Rate, Stated Percentage |
[1],[2] |
1.10%
|
|
|
| Debt and Finance Lease Obligations |
|
$ 996
|
|
994
|
| High Yield Bonds [Member] | 4.000% Senior Unsecured Notes [Member] |
|
|
|
|
| Debt Instrument [Line Items] |
|
|
|
|
| Debt Instrument, Interest Rate, Stated Percentage |
[1],[2] |
4.00%
|
|
|
| Debt and Finance Lease Obligations |
|
$ 498
|
|
498
|
| High Yield Bonds [Member] | 2.900% Senior Unsecured Notes |
|
|
|
|
| Debt Instrument [Line Items] |
|
|
|
|
| Debt Instrument, Interest Rate, Stated Percentage |
[1],[2] |
2.90%
|
|
|
| Debt and Finance Lease Obligations |
|
$ 745
|
|
744
|
| High Yield Bonds [Member] | August 2017 Senior Unsecured 3.650% Notes [Member] |
|
|
|
|
| Debt Instrument [Line Items] |
|
|
|
|
| Debt Instrument, Interest Rate, Stated Percentage |
[1],[2] |
3.70%
|
|
|
| Debt and Finance Lease Obligations |
|
$ 997
|
|
997
|
| High Yield Bonds [Member] | January 2023 Senior Unsecured 5.000% Notes |
|
|
|
|
| Debt Instrument [Line Items] |
|
|
|
|
| Debt Instrument, Interest Rate, Stated Percentage |
[1],[2] |
5.00%
|
|
|
| Debt and Finance Lease Obligations |
|
$ 992
|
|
991
|
| High Yield Bonds [Member] | 3.800% Senior Notes [Member] |
|
|
|
|
| Debt Instrument [Line Items] |
|
|
|
|
| Debt Instrument, Interest Rate, Stated Percentage |
[1],[2] |
3.80%
|
|
|
| Debt and Finance Lease Obligations |
|
$ 995
|
|
995
|
| High Yield Bonds [Member] | 4.800% Senior Notes |
|
|
|
|
| Debt Instrument [Line Items] |
|
|
|
|
| Debt Instrument, Interest Rate, Stated Percentage |
[1],[2] |
4.80%
|
|
|
| Debt and Finance Lease Obligations |
|
$ 595
|
|
594
|
| High Yield Bonds [Member] | February 2019 Senior Unsecured 4.300% Notes [Member] |
|
|
|
|
| Debt Instrument [Line Items] |
|
|
|
|
| Debt Instrument, Interest Rate, Stated Percentage |
[1],[2] |
4.30%
|
|
|
| Debt and Finance Lease Obligations |
|
$ 596
|
|
595
|
| High Yield Bonds [Member] | December 2023 Senior Unsecured 5.600% Notes |
|
|
|
|
| Debt Instrument [Line Items] |
|
|
|
|
| Debt Instrument, Interest Rate, Stated Percentage |
[1],[2] |
5.60%
|
|
|
| Debt and Finance Lease Obligations |
|
$ 741
|
|
740
|
| High Yield Bonds [Member] | August 2019 Senior Unsecured 3.100% Notes [Member] |
|
|
|
|
| Debt Instrument [Line Items] |
|
|
|
|
| Debt Instrument, Interest Rate, Stated Percentage |
[1],[2] |
3.10%
|
|
|
| Debt and Finance Lease Obligations |
|
$ 546
|
|
546
|
| High Yield Bonds [Member] | April 2020 Senior Unsecured 3.300% Notes [Member] |
|
|
|
|
| Debt Instrument [Line Items] |
|
|
|
|
| Debt Instrument, Interest Rate, Stated Percentage |
[1],[2] |
3.30%
|
|
|
| Debt and Finance Lease Obligations |
|
$ 741
|
|
741
|
| High Yield Bonds [Member] | June 2020 Senior Unsecured 2.250% Notes [Domain] |
|
|
|
|
| Debt Instrument [Line Items] |
|
|
|
|
| Debt Instrument, Interest Rate, Stated Percentage |
[1],[2] |
2.30%
|
|
|
| Debt and Finance Lease Obligations |
|
$ 1,092
|
|
1,091
|
| High Yield Bonds [Member] | February 2021 Senior Unsecured 2.100% Notes |
|
|
|
|
| Debt Instrument [Line Items] |
|
|
|
|
| Debt Instrument, Interest Rate, Stated Percentage |
[1],[2] |
2.10%
|
|
|
| Debt and Finance Lease Obligations |
|
$ 991
|
|
990
|
| High Yield Bonds [Member] | June 2021 Senior Unsecured 2.500% Notes [Domain] |
|
|
|
|
| Debt Instrument [Line Items] |
|
|
|
|
| Debt Instrument, Interest Rate, Stated Percentage |
[1],[2] |
2.50%
|
|
|
| Debt and Finance Lease Obligations |
|
$ 743
|
|
743
|
| High Yield Bonds [Member] | 5.100% Senior Notes |
|
|
|
|
| Debt Instrument [Line Items] |
|
|
|
|
| Debt Instrument, Interest Rate, Stated Percentage |
[1],[2] |
5.10%
|
|
|
| Debt and Finance Lease Obligations |
|
$ 743
|
|
743
|
| High Yield Bonds [Member] | December 2023 Senior Unsecured 5.800% Notes |
|
|
|
|
| Debt Instrument [Line Items] |
|
|
|
|
| Debt Instrument, Interest Rate, Stated Percentage |
[1],[2] |
5.80%
|
|
|
| Debt and Finance Lease Obligations |
|
$ 742
|
|
740
|
| High Yield Bonds [Member] | February 2021 Senior Unsecured 2.900% Notes |
|
|
|
|
| Debt Instrument [Line Items] |
|
|
|
|
| Debt Instrument, Interest Rate, Stated Percentage |
[1],[2] |
2.90%
|
|
|
| Debt and Finance Lease Obligations |
|
$ 1,235
|
|
1,234
|
| High Yield Bonds [Member] | 4.750% Senior Unsecured Notes [Member] [Member] |
|
|
|
|
| Debt Instrument [Line Items] |
|
|
|
|
| Debt Instrument, Interest Rate, Stated Percentage |
[1],[2] |
4.80%
|
|
|
| Debt and Finance Lease Obligations |
|
$ 344
|
|
344
|
| High Yield Bonds [Member] | February 2019 Senior Unsecured 5.200% Notes [Member] |
|
|
|
|
| Debt Instrument [Line Items] |
|
|
|
|
| Debt Instrument, Interest Rate, Stated Percentage |
[1],[2] |
5.20%
|
|
|
| Debt and Finance Lease Obligations |
|
$ 396
|
|
396
|
| High Yield Bonds [Member] | August 2019 Senior Unsecured 4.000% Notes [Member] |
|
|
|
|
| Debt Instrument [Line Items] |
|
|
|
|
| Debt Instrument, Interest Rate, Stated Percentage |
[1],[2] |
4.00%
|
|
|
| Debt and Finance Lease Obligations |
|
$ 346
|
|
346
|
| High Yield Bonds [Member] | April 2020 Senior Unsecured 4.150% Notes [Member] |
|
|
|
|
| Debt Instrument [Line Items] |
|
|
|
|
| Debt Instrument, Interest Rate, Stated Percentage |
[1],[2] |
4.20%
|
|
|
| Debt and Finance Lease Obligations |
|
$ 490
|
|
490
|
| High Yield Bonds [Member] | June 2020 Senior Unsecured 3.250% Notes [Domain] |
|
|
|
|
| Debt Instrument [Line Items] |
|
|
|
|
| Debt Instrument, Interest Rate, Stated Percentage |
[1],[2] |
3.30%
|
|
|
| Debt and Finance Lease Obligations |
|
$ 890
|
|
890
|
| Unsecured Debt [Member] |
|
|
|
|
| Debt Instrument [Line Items] |
|
|
|
|
| Debt and Finance Lease Obligations |
|
$ 21,942
|
|
21,167
|
| Maximum [Member] |
|
|
|
|
| Debt Instrument [Line Items] |
|
|
|
|
| Debt Instrument, Interest Rate, Stated Percentage |
|
0.75%
|
|
|
| Maximum [Member] | Finance Lease Obligations and Other [Member] |
|
|
|
|
| Debt Instrument [Line Items] |
|
|
|
|
| Debt Instrument, Interest Rate, Stated Percentage |
|
8.00%
|
|
|
| Maximum [Member] | Finance Lease Obligations and Other [Member] |
|
|
|
|
| Debt Instrument [Line Items] |
|
|
|
|
| Debt Instrument Maturity Date Range |
|
25 years
|
|
|
| Minimum [Member] |
|
|
|
|
| Debt Instrument [Line Items] |
|
|
|
|
| Debt Instrument, Interest Rate, Stated Percentage |
|
0.00%
|
|
|
| Minimum [Member] | Finance Lease Obligations and Other [Member] |
|
|
|
|
| Debt Instrument [Line Items] |
|
|
|
|
| Debt Instrument Maturity Date Range |
|
one year
|
|
|
| Secured Overnight Financing Rate (SOFR) Overnight Index Swap Rate | Maximum [Member] |
|
|
|
|
| Debt Instrument [Line Items] |
|
|
|
|
| Debt Instrument, Interest Rate, Stated Percentage |
|
1.75%
|
|
|
| Secured Overnight Financing Rate (SOFR) Overnight Index Swap Rate | Minimum [Member] |
|
|
|
|
| Debt Instrument [Line Items] |
|
|
|
|
| Debt Instrument, Interest Rate, Stated Percentage |
|
0.875%
|
|
|
| Revolving Credit Facility [Member] |
|
|
|
|
| Debt Instrument [Line Items] |
|
|
|
|
| Debt Instrument, Unused Borrowing Capacity, Amount |
|
$ 7,000
|
|
|
| Debt and Finance Lease Obligations |
|
$ 0
|
[6] |
670
|
| Revolving Credit Facility [Member] | Maximum [Member] |
|
|
|
|
| Debt Instrument [Line Items] |
|
|
|
|
| Line of Credit Facility, Commitment Fee Percentage |
|
0.30%
|
|
|
| Revolving Credit Facility [Member] | Minimum [Member] |
|
|
|
|
| Debt Instrument [Line Items] |
|
|
|
|
| Line of Credit Facility, Commitment Fee Percentage |
|
0.08%
|
|
|
| Commercial Paper [Member] | Bank Debt [Member] |
|
|
|
|
| Debt Instrument [Line Items] |
|
|
|
|
| Debt and Finance Lease Obligations |
[7] |
$ 1,438
|
|
$ 0
|
| Debt Instrument, Maturity Date, Description |
|
397 days
|
|
|
| Commercial Paper [Member] | Maximum [Member] | Bank Debt [Member] |
|
|
|
|
| Debt Instrument [Line Items] |
|
|
|
|
| Debt Instrument, Maturity Date, Description |
|
three months
|
|
|
| Term SOFR Adjustment |
|
|
|
|
| Debt Instrument [Line Items] |
|
|
|
|
| Debt Instrument, Interest Rate, Stated Percentage |
|
0.10%
|
|
|
|
|
| X |
- DefinitionDate range when the debt instrument is schedule to be fully repaid, which may be presented in a variety of ways (year, month and year, day, month, and year, quarter, etc).
| Name: |
cci_DebtInstrumentMaturityDateRange |
| Namespace Prefix: |
cci_ |
| Data Type: |
xbrli:stringItemType |
| Balance Type: |
na |
| Period Type: |
duration |
|
| X |
- DefinitionAmount equal to the present value (the principal) at the beginning of the lease term of minimum lease payments during the lease term (excluding that portion of the payments representing executory costs such as insurance, maintenance, and taxes to be paid by the lessor, together with any profit thereon) net of payments or other amounts applied to the principal through the balance sheet date. Reference 1: http://fasb.org/us-gaap/role/ref/otherTransitionRef
-Topic 210
-SubTopic 10
-Name Accounting Standards Codification
-Section S99
-Paragraph 1
-Subparagraph (SX 210.5-02(22))
-Publisher FASB
-URI https://asc.fasb.org/1943274/2147480566/210-10-S99-1
Reference 2: http://fasb.org/us-gaap/role/ref/otherTransitionRef
-Topic 840
-SubTopic 30
-Name Accounting Standards Codification
-Section 50
-Paragraph 1
-Subparagraph (b)
-Publisher FASB
-URI https://asc.fasb.org/1943274/2147481161/840-30-50-1
Reference 3: http://fasb.org/us-gaap/role/ref/otherTransitionRef
-Topic 944
-SubTopic 210
-Name Accounting Standards Codification
-Section S99
-Paragraph 1
-Subparagraph (SX 210.7-03(a)(16))
-Publisher FASB
-URI https://asc.fasb.org/1943274/2147478777/944-210-S99-1
| Name: |
us-gaap_CapitalLeaseObligations |
| Namespace Prefix: |
us-gaap_ |
| Data Type: |
xbrli:monetaryItemType |
| Balance Type: |
credit |
| Period Type: |
instant |
|
| X |
- DefinitionAmount of short-term and long-term debt and lease obligation. Reference 1: http://fasb.org/us-gaap/role/ref/legacyRef
-Topic 942
-SubTopic 210
-Name Accounting Standards Codification
-Section S99
-Paragraph 1
-Subparagraph (SX 210.9-03(16))
-Publisher FASB
-URI https://asc.fasb.org/1943274/2147478546/942-210-S99-1
Reference 2: http://fasb.org/us-gaap/role/ref/legacyRef
-Topic 942
-SubTopic 210
-Name Accounting Standards Codification
-Section S99
-Paragraph 1
-Subparagraph (SX 210.9-03(13))
-Publisher FASB
-URI https://asc.fasb.org/1943274/2147478546/942-210-S99-1
| Name: |
us-gaap_DebtAndCapitalLeaseObligations |
| Namespace Prefix: |
us-gaap_ |
| Data Type: |
xbrli:monetaryItemType |
| Balance Type: |
credit |
| Period Type: |
instant |
|
| X |
- DefinitionAmount of debt and lease obligation, classified as current. Reference 1: http://www.xbrl.org/2003/role/disclosureRef
-Topic 210
-SubTopic 10
-Name Accounting Standards Codification
-Section S99
-Paragraph 1
-Subparagraph (SX 210.5-02(21))
-Publisher FASB
-URI https://asc.fasb.org/1943274/2147480566/210-10-S99-1
| Name: |
us-gaap_DebtCurrent |
| Namespace Prefix: |
us-gaap_ |
| Data Type: |
xbrli:monetaryItemType |
| Balance Type: |
credit |
| Period Type: |
instant |
|
| X |
- DefinitionFace (par) amount of debt instrument at time of issuance. Reference 1: http://www.xbrl.org/2003/role/exampleRef
-Topic 835
-SubTopic 30
-Name Accounting Standards Codification
-Section 55
-Paragraph 8
-Publisher FASB
-URI https://asc.fasb.org/1943274/2147482949/835-30-55-8
Reference 2: http://www.xbrl.org/2003/role/disclosureRef
-Topic 470
-SubTopic 20
-Name Accounting Standards Codification
-Section 50
-Paragraph 1B
-Subparagraph (a)
-Publisher FASB
-URI https://asc.fasb.org/1943274/2147481139/470-20-50-1B
Reference 3: http://www.xbrl.org/2003/role/exampleRef
-Topic 470
-SubTopic 20
-Name Accounting Standards Codification
-Section 55
-Paragraph 69B
-Publisher FASB
-URI https://asc.fasb.org/1943274/2147481568/470-20-55-69B
Reference 4: http://www.xbrl.org/2003/role/exampleRef
-Topic 470
-SubTopic 20
-Name Accounting Standards Codification
-Section 55
-Paragraph 69C
-Publisher FASB
-URI https://asc.fasb.org/1943274/2147481568/470-20-55-69C
Reference 5: http://www.xbrl.org/2003/role/disclosureRef
-Topic 835
-SubTopic 30
-Name Accounting Standards Codification
-Section 50
-Paragraph 1
-Publisher FASB
-URI https://asc.fasb.org/1943274/2147482900/835-30-50-1
Reference 6: http://www.xbrl.org/2003/role/disclosureRef
-Topic 835
-SubTopic 30
-Name Accounting Standards Codification
-Section 45
-Paragraph 2
-Publisher FASB
-URI https://asc.fasb.org/1943274/2147482925/835-30-45-2
| Name: |
us-gaap_DebtInstrumentFaceAmount |
| Namespace Prefix: |
us-gaap_ |
| Data Type: |
xbrli:monetaryItemType |
| Balance Type: |
credit |
| Period Type: |
instant |
|
| X |
- DefinitionIncremental percentage increase (decrease) in the stated rate on a debt instrument.
| Name: |
us-gaap_DebtInstrumentInterestRateIncreaseDecrease |
| Namespace Prefix: |
us-gaap_ |
| Data Type: |
dtr-types:percentItemType |
| Balance Type: |
na |
| Period Type: |
duration |
|
| X |
- DefinitionContractual interest rate for funds borrowed, under the debt agreement. Reference 1: http://fasb.org/us-gaap/role/ref/legacyRef
-Topic 210
-SubTopic 10
-Name Accounting Standards Codification
-Section S99
-Paragraph 1
-Subparagraph (SX 210.5-02(22)(a)(1))
-Publisher FASB
-URI https://asc.fasb.org/1943274/2147480566/210-10-S99-1
Reference 2: http://www.xbrl.org/2003/role/disclosureRef
-Topic 470
-SubTopic 20
-Name Accounting Standards Codification
-Section 50
-Paragraph 1B
-Subparagraph (b)
-Publisher FASB
-URI https://asc.fasb.org/1943274/2147481139/470-20-50-1B
| Name: |
us-gaap_DebtInstrumentInterestRateStatedPercentage |
| Namespace Prefix: |
us-gaap_ |
| Data Type: |
dtr-types:percentItemType |
| Balance Type: |
na |
| Period Type: |
instant |
|
| X |
- DefinitionLine items represent financial concepts included in a table. These concepts are used to disclose reportable information associated with domain members defined in one or many axes to the table. Reference 1: http://www.xbrl.org/2003/role/exampleRef
-Topic 835
-SubTopic 30
-Name Accounting Standards Codification
-Section 55
-Paragraph 8
-Publisher FASB
-URI https://asc.fasb.org/1943274/2147482949/835-30-55-8
Reference 2: http://www.xbrl.org/2009/role/commonPracticeRef
-Topic 235
-SubTopic 10
-Name Accounting Standards Codification
-Section S99
-Paragraph 1
-Subparagraph (SX 210.4-08(f))
-Publisher FASB
-URI https://asc.fasb.org/1943274/2147480678/235-10-S99-1
Reference 3: http://www.xbrl.org/2003/role/disclosureRef
-Topic 235
-SubTopic 10
-Name Accounting Standards Codification
-Section S99
-Paragraph 3
-Subparagraph (SX 210.12-04(a))
-Publisher FASB
-URI https://asc.fasb.org/1943274/2147480678/235-10-S99-3
Reference 4: http://www.xbrl.org/2003/role/disclosureRef
-Topic 470
-SubTopic 20
-Name Accounting Standards Codification
-Section 50
-Paragraph 1B
-Subparagraph (a)
-Publisher FASB
-URI https://asc.fasb.org/1943274/2147481139/470-20-50-1B
Reference 5: http://www.xbrl.org/2003/role/exampleRef
-Topic 470
-SubTopic 20
-Name Accounting Standards Codification
-Section 55
-Paragraph 69B
-Publisher FASB
-URI https://asc.fasb.org/1943274/2147481568/470-20-55-69B
Reference 6: http://www.xbrl.org/2003/role/exampleRef
-Topic 470
-SubTopic 20
-Name Accounting Standards Codification
-Section 55
-Paragraph 69C
-Publisher FASB
-URI https://asc.fasb.org/1943274/2147481568/470-20-55-69C
Reference 7: http://www.xbrl.org/2003/role/exampleRef
-Topic 470
-SubTopic 20
-Name Accounting Standards Codification
-Section 55
-Paragraph 69E
-Publisher FASB
-URI https://asc.fasb.org/1943274/2147481568/470-20-55-69E
Reference 8: http://www.xbrl.org/2003/role/exampleRef
-Topic 470
-SubTopic 20
-Name Accounting Standards Codification
-Section 55
-Paragraph 69F
-Publisher FASB
-URI https://asc.fasb.org/1943274/2147481568/470-20-55-69F
Reference 9: http://www.xbrl.org/2003/role/disclosureRef
-Topic 470
-SubTopic 20
-Name Accounting Standards Codification
-Section 50
-Paragraph 1B
-Subparagraph (b)
-Publisher FASB
-URI https://asc.fasb.org/1943274/2147481139/470-20-50-1B
Reference 10: http://www.xbrl.org/2003/role/disclosureRef
-Topic 470
-SubTopic 20
-Name Accounting Standards Codification
-Section 50
-Paragraph 1B
-Subparagraph (c)
-Publisher FASB
-URI https://asc.fasb.org/1943274/2147481139/470-20-50-1B
Reference 11: http://www.xbrl.org/2003/role/exampleRef
-Topic 470
-SubTopic 20
-Name Accounting Standards Codification
-Section 50
-Paragraph 1B
-Subparagraph (d)
-Publisher FASB
-URI https://asc.fasb.org/1943274/2147481139/470-20-50-1B
Reference 12: http://www.xbrl.org/2003/role/disclosureRef
-Topic 470
-SubTopic 20
-Name Accounting Standards Codification
-Section 50
-Paragraph 1B
-Subparagraph (e)
-Publisher FASB
-URI https://asc.fasb.org/1943274/2147481139/470-20-50-1B
Reference 13: http://www.xbrl.org/2003/role/disclosureRef
-Topic 470
-SubTopic 20
-Name Accounting Standards Codification
-Section 50
-Paragraph 1B
-Subparagraph (f)
-Publisher FASB
-URI https://asc.fasb.org/1943274/2147481139/470-20-50-1B
Reference 14: http://www.xbrl.org/2003/role/disclosureRef
-Topic 470
-SubTopic 20
-Name Accounting Standards Codification
-Section 50
-Paragraph 1B
-Subparagraph (h)
-Publisher FASB
-URI https://asc.fasb.org/1943274/2147481139/470-20-50-1B
Reference 15: http://www.xbrl.org/2003/role/disclosureRef
-Topic 470
-SubTopic 20
-Name Accounting Standards Codification
-Section 50
-Paragraph 1D
-Subparagraph (a)
-Publisher FASB
-URI https://asc.fasb.org/1943274/2147481139/470-20-50-1D
Reference 16: http://www.xbrl.org/2003/role/disclosureRef
-Topic 470
-SubTopic 20
-Name Accounting Standards Codification
-Section 50
-Paragraph 1D
-Subparagraph (b)
-Publisher FASB
-URI https://asc.fasb.org/1943274/2147481139/470-20-50-1D
Reference 17: http://www.xbrl.org/2003/role/disclosureRef
-Topic 470
-SubTopic 20
-Name Accounting Standards Codification
-Section 50
-Paragraph 1D
-Subparagraph (c)
-Publisher FASB
-URI https://asc.fasb.org/1943274/2147481139/470-20-50-1D
Reference 18: http://www.xbrl.org/2003/role/disclosureRef
-Topic 470
-SubTopic 20
-Name Accounting Standards Codification
-Section 50
-Paragraph 1E
-Subparagraph (a)
-Publisher FASB
-URI https://asc.fasb.org/1943274/2147481139/470-20-50-1E
Reference 19: http://www.xbrl.org/2003/role/disclosureRef
-Topic 470
-SubTopic 20
-Name Accounting Standards Codification
-Section 50
-Paragraph 1E
-Subparagraph (c)
-Publisher FASB
-URI https://asc.fasb.org/1943274/2147481139/470-20-50-1E
Reference 20: http://www.xbrl.org/2003/role/disclosureRef
-Topic 470
-SubTopic 20
-Name Accounting Standards Codification
-Section 50
-Paragraph 1E
-Subparagraph (d)
-Publisher FASB
-URI https://asc.fasb.org/1943274/2147481139/470-20-50-1E
Reference 21: http://www.xbrl.org/2003/role/disclosureRef
-Topic 470
-SubTopic 20
-Name Accounting Standards Codification
-Section 50
-Paragraph 1F
-Subparagraph (a)
-Publisher FASB
-URI https://asc.fasb.org/1943274/2147481139/470-20-50-1F
Reference 22: http://www.xbrl.org/2003/role/disclosureRef
-Topic 470
-SubTopic 20
-Name Accounting Standards Codification
-Section 50
-Paragraph 1F
-Subparagraph (b)
-Publisher FASB
-URI https://asc.fasb.org/1943274/2147481139/470-20-50-1F
Reference 23: http://www.xbrl.org/2003/role/disclosureRef
-Topic 470
-SubTopic 20
-Name Accounting Standards Codification
-Section 50
-Paragraph 1F
-Subparagraph (b)(1)
-Publisher FASB
-URI https://asc.fasb.org/1943274/2147481139/470-20-50-1F
Reference 24: http://www.xbrl.org/2003/role/disclosureRef
-Topic 470
-SubTopic 20
-Name Accounting Standards Codification
-Section 50
-Paragraph 1F
-Subparagraph (b)(2)
-Publisher FASB
-URI https://asc.fasb.org/1943274/2147481139/470-20-50-1F
Reference 25: http://www.xbrl.org/2003/role/disclosureRef
-Topic 470
-SubTopic 20
-Name Accounting Standards Codification
-Section 50
-Paragraph 1I
-Subparagraph (c)
-Publisher FASB
-URI https://asc.fasb.org/1943274/2147481139/470-20-50-1I
Reference 26: http://www.xbrl.org/2009/role/commonPracticeRef
-Topic 835
-SubTopic 30
-Name Accounting Standards Codification
-Section 45
-Paragraph 2
-Publisher FASB
-URI https://asc.fasb.org/1943274/2147482925/835-30-45-2
Reference 27: http://www.xbrl.org/2009/role/commonPracticeRef
-Topic 835
-SubTopic 30
-Name Accounting Standards Codification
-Section 50
-Paragraph 1
-Publisher FASB
-URI https://asc.fasb.org/1943274/2147482900/835-30-50-1
| Name: |
us-gaap_DebtInstrumentLineItems |
| Namespace Prefix: |
us-gaap_ |
| Data Type: |
xbrli:stringItemType |
| Balance Type: |
na |
| Period Type: |
duration |
|
| X |
- DefinitionDescription of the maturity date of the debt instrument including whether the debt matures serially and, if so, a brief description of the serial maturities. Reference 1: http://fasb.org/us-gaap/role/ref/legacyRef
-Topic 210
-SubTopic 10
-Name Accounting Standards Codification
-Section S99
-Paragraph 1
-Subparagraph (SX 210.5-02(22)(a)(2))
-Publisher FASB
-URI https://asc.fasb.org/1943274/2147480566/210-10-S99-1
| Name: |
us-gaap_DebtInstrumentMaturityDateDescription |
| Namespace Prefix: |
us-gaap_ |
| Data Type: |
xbrli:stringItemType |
| Balance Type: |
na |
| Period Type: |
duration |
|
| X |
- DefinitionThe fee, expressed as a percentage of the line of credit facility, for the line of credit facility regardless of whether the facility has been used.
| Name: |
us-gaap_LineOfCreditFacilityCommitmentFeePercentage |
| Namespace Prefix: |
us-gaap_ |
| Data Type: |
dtr-types:percentItemType |
| Balance Type: |
na |
| Period Type: |
duration |
|
| X |
- DefinitionAmount of borrowing capacity currently available under the credit facility (current borrowing capacity less the amount of borrowings outstanding). Reference 1: http://www.xbrl.org/2003/role/disclosureRef
-Topic 470
-SubTopic 10
-Name Accounting Standards Codification
-Section 50
-Paragraph 6
-Subparagraph (b)
-Publisher FASB
-URI https://asc.fasb.org/1943274/2147481544/470-10-50-6
Reference 2: http://fasb.org/us-gaap/role/ref/legacyRef
-Topic 210
-SubTopic 10
-Name Accounting Standards Codification
-Section S99
-Paragraph 1
-Subparagraph (SX 210.5-02(22)(b))
-Publisher FASB
-URI https://asc.fasb.org/1943274/2147480566/210-10-S99-1
Reference 3: http://fasb.org/us-gaap/role/ref/legacyRef
-Topic 210
-SubTopic 10
-Name Accounting Standards Codification
-Section S99
-Paragraph 1
-Subparagraph (SX 210.5-02(19)(b))
-Publisher FASB
-URI https://asc.fasb.org/1943274/2147480566/210-10-S99-1
| Name: |
us-gaap_LineOfCreditFacilityRemainingBorrowingCapacity |
| Namespace Prefix: |
us-gaap_ |
| Data Type: |
xbrli:monetaryItemType |
| Balance Type: |
credit |
| Period Type: |
instant |
|
| X |
- DefinitionAmount of long-term debt and lease obligation, classified as noncurrent. Reference 1: http://fasb.org/us-gaap/role/ref/legacyRef
-Name Accounting Standards Codification
-Section S99
-Paragraph 1
-Subparagraph (SX 210.5-02(22))
-SubTopic 10
-Topic 210
-Publisher FASB
-URI https://asc.fasb.org/1943274/2147480566/210-10-S99-1
Reference 2: http://www.xbrl.org/2003/role/disclosureRef
-Topic 944
-SubTopic 210
-Name Accounting Standards Codification
-Section S99
-Paragraph 1
-Subparagraph (SX 210.7-03(a)(16)(a)(2))
-Publisher FASB
-URI https://asc.fasb.org/1943274/2147478777/944-210-S99-1
| Name: |
us-gaap_LongTermDebtAndCapitalLeaseObligations |
| Namespace Prefix: |
us-gaap_ |
| Data Type: |
xbrli:monetaryItemType |
| Balance Type: |
credit |
| Period Type: |
instant |
|
| X |
- Details
| Name: |
us-gaap_LongtermDebtTypeAxis=cci_A2015TowerRevenueNotes3.663due2045Member |
| Namespace Prefix: |
|
| Data Type: |
na |
| Balance Type: |
|
| Period Type: |
|
|
| X |
- Details
| Name: |
us-gaap_LongtermDebtTypeAxis=cci_A2018TowerRevenueNotes4.241due2048Member |
| Namespace Prefix: |
|
| Data Type: |
na |
| Balance Type: |
|
| Period Type: |
|
|
| X |
- Details
| Name: |
us-gaap_LongtermDebtTypeAxis=cci_July2018TowerRevenueNotesMember |
| Namespace Prefix: |
|
| Data Type: |
na |
| Balance Type: |
|
| Period Type: |
|
|
| X |
- Details
| Name: |
us-gaap_DebtInstrumentAxis=us-gaap_SecuredDebtMember |
| Namespace Prefix: |
|
| Data Type: |
na |
| Balance Type: |
|
| Period Type: |
|
|
| X |
- Details
| Name: |
us-gaap_LongtermDebtTypeAxis=cci_FixedRateDebt2009SecuritizedNotesA2Member |
| Namespace Prefix: |
|
| Data Type: |
na |
| Balance Type: |
|
| Period Type: |
|
|
| X |
- Details
| Name: |
us-gaap_DebtInstrumentAxis=cci_FinanceLeaseObligationsandOtherMember |
| Namespace Prefix: |
|
| Data Type: |
na |
| Balance Type: |
|
| Period Type: |
|
|
| X |
- Details
| Name: |
us-gaap_LongtermDebtTypeAxis=us-gaap_SecuredDebtMember |
| Namespace Prefix: |
|
| Data Type: |
na |
| Balance Type: |
|
| Period Type: |
|
|
| X |
- Details
| Name: |
us-gaap_DebtInstrumentAxis=cci_BankDebtMember |
| Namespace Prefix: |
|
| Data Type: |
na |
| Balance Type: |
|
| Period Type: |
|
|
| X |
- Details
| Name: |
us-gaap_LongtermDebtTypeAxis=cci_A2016TermLoanAMember |
| Namespace Prefix: |
|
| Data Type: |
na |
| Balance Type: |
|
| Period Type: |
|
|
| X |
- Details
| Name: |
us-gaap_LongtermDebtTypeAxis=us-gaap_CommercialPaperMember |
| Namespace Prefix: |
|
| Data Type: |
na |
| Balance Type: |
|
| Period Type: |
|
|
| X |
- Details
| Name: |
us-gaap_DebtInstrumentAxis=us-gaap_BondsMember |
| Namespace Prefix: |
|
| Data Type: |
na |
| Balance Type: |
|
| Period Type: |
|
|
| X |
- Details
| Name: |
us-gaap_LongtermDebtTypeAxis=cci_August2017SeniorUnsecured3.200NotesMember |
| Namespace Prefix: |
|
| Data Type: |
na |
| Balance Type: |
|
| Period Type: |
|
|
| X |
- Details
| Name: |
us-gaap_LongtermDebtTypeAxis=cci_June2020SeniorUnsecured1.350NotesDomain |
| Namespace Prefix: |
|
| Data Type: |
na |
| Balance Type: |
|
| Period Type: |
|
|
| X |
- Details
| Name: |
us-gaap_LongtermDebtTypeAxis=cci_SeniorUnsecured2016Notes4.450Member |
| Namespace Prefix: |
|
| Data Type: |
na |
| Balance Type: |
|
| Period Type: |
|
|
| X |
- Details
| Name: |
us-gaap_LongtermDebtTypeAxis=cci_SeniorUnsecured2016Notes3.7Member |
| Namespace Prefix: |
|
| Data Type: |
na |
| Balance Type: |
|
| Period Type: |
|
|
| X |
- Details
| Name: |
us-gaap_LongtermDebtTypeAxis=cci_February2021SeniorUnsecured1050NotesMember |
| Namespace Prefix: |
|
| Data Type: |
na |
| Balance Type: |
|
| Period Type: |
|
|
| X |
- Details
| Name: |
us-gaap_LongtermDebtTypeAxis=cci_A4.000SeniorUnsecuredNotesMember |
| Namespace Prefix: |
|
| Data Type: |
na |
| Balance Type: |
|
| Period Type: |
|
|
| X |
- Details
| Name: |
us-gaap_LongtermDebtTypeAxis=cci_A2900SeniorUnsecuredNotesMember |
| Namespace Prefix: |
|
| Data Type: |
na |
| Balance Type: |
|
| Period Type: |
|
|
| X |
- Details
| Name: |
us-gaap_LongtermDebtTypeAxis=cci_August2017SeniorUnsecured3.650NotesMember |
| Namespace Prefix: |
|
| Data Type: |
na |
| Balance Type: |
|
| Period Type: |
|
|
| X |
- Details
| Name: |
us-gaap_LongtermDebtTypeAxis=cci_January2023SeniorUnsecured5000NotesMember |
| Namespace Prefix: |
|
| Data Type: |
na |
| Balance Type: |
|
| Period Type: |
|
|
| X |
- Details
| Name: |
us-gaap_LongtermDebtTypeAxis=cci_A3.800SeniorNotesMember |
| Namespace Prefix: |
|
| Data Type: |
na |
| Balance Type: |
|
| Period Type: |
|
|
| X |
- Details
| Name: |
us-gaap_LongtermDebtTypeAxis=cci_A4800SeniorNotesMember |
| Namespace Prefix: |
|
| Data Type: |
na |
| Balance Type: |
|
| Period Type: |
|
|
| X |
- Details
| Name: |
us-gaap_LongtermDebtTypeAxis=cci_February2019SeniorUnsecured4.300NotesMember |
| Namespace Prefix: |
|
| Data Type: |
na |
| Balance Type: |
|
| Period Type: |
|
|
| X |
- Details
| Name: |
us-gaap_LongtermDebtTypeAxis=cci_December2023SeniorUnsecured5.600NotesMember |
| Namespace Prefix: |
|
| Data Type: |
na |
| Balance Type: |
|
| Period Type: |
|
|
| X |
- Details
| Name: |
us-gaap_LongtermDebtTypeAxis=cci_August2019SeniorUnsecured3.100NotesMember |
| Namespace Prefix: |
|
| Data Type: |
na |
| Balance Type: |
|
| Period Type: |
|
|
| X |
- Details
| Name: |
us-gaap_LongtermDebtTypeAxis=cci_April2020SeniorUnsecured3.300NotesMember |
| Namespace Prefix: |
|
| Data Type: |
na |
| Balance Type: |
|
| Period Type: |
|
|
| X |
- Details
| Name: |
us-gaap_LongtermDebtTypeAxis=cci_June2020SeniorUnsecured2.250NotesDomain |
| Namespace Prefix: |
|
| Data Type: |
na |
| Balance Type: |
|
| Period Type: |
|
|
| X |
- Details
| Name: |
us-gaap_LongtermDebtTypeAxis=cci_February2021SeniorUnsecured2100NotesMember |
| Namespace Prefix: |
|
| Data Type: |
na |
| Balance Type: |
|
| Period Type: |
|
|
| X |
- Details
| Name: |
us-gaap_LongtermDebtTypeAxis=cci_June2021SeniorUnsecured2500NotesDomain |
| Namespace Prefix: |
|
| Data Type: |
na |
| Balance Type: |
|
| Period Type: |
|
|
| X |
- Details
| Name: |
us-gaap_LongtermDebtTypeAxis=cci_A5100SeniorNotesMember |
| Namespace Prefix: |
|
| Data Type: |
na |
| Balance Type: |
|
| Period Type: |
|
|
| X |
- Details
| Name: |
us-gaap_LongtermDebtTypeAxis=cci_December2023SeniorUnsecured5.800NotesMember |
| Namespace Prefix: |
|
| Data Type: |
na |
| Balance Type: |
|
| Period Type: |
|
|
| X |
- Details
| Name: |
us-gaap_LongtermDebtTypeAxis=cci_February2021SeniorUnsecured2900NotesMember |
| Namespace Prefix: |
|
| Data Type: |
na |
| Balance Type: |
|
| Period Type: |
|
|
| X |
- Details
| Name: |
us-gaap_LongtermDebtTypeAxis=cci_A4.750SeniorUnsecuredNotesMemberMember |
| Namespace Prefix: |
|
| Data Type: |
na |
| Balance Type: |
|
| Period Type: |
|
|
| X |
- Details
| Name: |
us-gaap_LongtermDebtTypeAxis=cci_February2019SeniorUnsecured5.200NotesMember |
| Namespace Prefix: |
|
| Data Type: |
na |
| Balance Type: |
|
| Period Type: |
|
|
| X |
- Details
| Name: |
us-gaap_LongtermDebtTypeAxis=cci_August2019SeniorUnsecured4.000NotesMember |
| Namespace Prefix: |
|
| Data Type: |
na |
| Balance Type: |
|
| Period Type: |
|
|
| X |
- Details
| Name: |
us-gaap_LongtermDebtTypeAxis=cci_April2020SeniorUnsecured4.150NotesMember |
| Namespace Prefix: |
|
| Data Type: |
na |
| Balance Type: |
|
| Period Type: |
|
|
| X |
- Details
| Name: |
us-gaap_LongtermDebtTypeAxis=cci_June2020SeniorUnsecured3.250NotesDomain |
| Namespace Prefix: |
|
| Data Type: |
na |
| Balance Type: |
|
| Period Type: |
|
|
| X |
- Details
| Name: |
us-gaap_DebtInstrumentAxis=us-gaap_UnsecuredDebtMember |
| Namespace Prefix: |
|
| Data Type: |
na |
| Balance Type: |
|
| Period Type: |
|
|
| X |
- Details
| Name: |
srt_RangeAxis=srt_MaximumMember |
| Namespace Prefix: |
|
| Data Type: |
na |
| Balance Type: |
|
| Period Type: |
|
|
| X |
- Details
| Name: |
us-gaap_LongtermDebtTypeAxis=cci_FinanceLeaseObligationsandOtherMember |
| Namespace Prefix: |
|
| Data Type: |
na |
| Balance Type: |
|
| Period Type: |
|
|
| X |
- Details
| Name: |
srt_RangeAxis=srt_MinimumMember |
| Namespace Prefix: |
|
| Data Type: |
na |
| Balance Type: |
|
| Period Type: |
|
|
| X |
- Details
| Name: |
us-gaap_VariableRateAxis=us-gaap_SecuredOvernightFinancingRateSofrOvernightIndexSwapRateMember |
| Namespace Prefix: |
|
| Data Type: |
na |
| Balance Type: |
|
| Period Type: |
|
|
| X |
- Details
| Name: |
us-gaap_CreditFacilityAxis=us-gaap_RevolvingCreditFacilityMember |
| Namespace Prefix: |
|
| Data Type: |
na |
| Balance Type: |
|
| Period Type: |
|
|
| X |
- Details
| Name: |
us-gaap_CreditFacilityAxis=us-gaap_CommercialPaperMember |
| Namespace Prefix: |
|
| Data Type: |
na |
| Balance Type: |
|
| Period Type: |
|
|
| X |
- Details
| Name: |
us-gaap_CreditFacilityAxis=cci_TermSOFRAdjustmentMember |
| Namespace Prefix: |
|
| Data Type: |
na |
| Balance Type: |
|
| Period Type: |
|
|
v3.24.2
| X |
- DefinitionDebt and Other Obligations [Abstract}
| Name: |
cci_DebtAndOtherObligationsAbstract |
| Namespace Prefix: |
cci_ |
| Data Type: |
xbrli:stringItemType |
| Balance Type: |
na |
| Period Type: |
duration |
|
| X |
- DefinitionAmount of amortization expense attributable to debt issuance costs. Reference 1: http://fasb.org/us-gaap/role/ref/legacyRef
-Topic 220
-SubTopic 10
-Name Accounting Standards Codification
-Section S99
-Paragraph 2
-Subparagraph (SX 210.5-03(8))
-Publisher FASB
-URI https://asc.fasb.org/1943274/2147483621/220-10-S99-2
Reference 2: http://www.xbrl.org/2003/role/disclosureRef
-Topic 470
-SubTopic 20
-Name Accounting Standards Codification
-Section 50
-Paragraph 1F
-Subparagraph (b)(2)
-Publisher FASB
-URI https://asc.fasb.org/1943274/2147481139/470-20-50-1F
Reference 3: http://www.xbrl.org/2009/role/commonPracticeRef
-Topic 230
-SubTopic 10
-Name Accounting Standards Codification
-Section 45
-Paragraph 28
-Subparagraph (b)
-Publisher FASB
-URI https://asc.fasb.org/1943274/2147482740/230-10-45-28
Reference 4: http://www.xbrl.org/2009/role/commonPracticeRef
-Topic 835
-SubTopic 30
-Name Accounting Standards Codification
-Section 45
-Paragraph 3
-Publisher FASB
-URI https://asc.fasb.org/1943274/2147482925/835-30-45-3
| Name: |
us-gaap_AmortizationOfFinancingCosts |
| Namespace Prefix: |
us-gaap_ |
| Data Type: |
xbrli:monetaryItemType |
| Balance Type: |
debit |
| Period Type: |
duration |
|
| X |
- DefinitionAmount of interest capitalized during the period. Reference 1: http://www.xbrl.org/2003/role/disclosureRef
-Topic 835
-SubTopic 20
-Name Accounting Standards Codification
-Section 50
-Paragraph 1
-Subparagraph (b)
-Publisher FASB
-URI https://asc.fasb.org/1943274/2147483013/835-20-50-1
| Name: |
us-gaap_InterestCostsCapitalized |
| Namespace Prefix: |
us-gaap_ |
| Data Type: |
xbrli:monetaryItemType |
| Balance Type: |
debit |
| Period Type: |
duration |
|
| X |
- DefinitionAmount of the cost of borrowed funds accounted for as interest expense for debt. Reference 1: http://fasb.org/us-gaap/role/ref/legacyRef
-Topic 220
-SubTopic 10
-Name Accounting Standards Codification
-Section S99
-Paragraph 2
-Subparagraph (SX 210.5-03(8))
-Publisher FASB
-URI https://asc.fasb.org/1943274/2147483621/220-10-S99-2
Reference 2: http://www.xbrl.org/2003/role/exampleRef
-Topic 470
-SubTopic 20
-Name Accounting Standards Codification
-Section 55
-Paragraph 69E
-Publisher FASB
-URI https://asc.fasb.org/1943274/2147481568/470-20-55-69E
Reference 3: http://www.xbrl.org/2003/role/exampleRef
-Topic 470
-SubTopic 20
-Name Accounting Standards Codification
-Section 55
-Paragraph 69F
-Publisher FASB
-URI https://asc.fasb.org/1943274/2147481568/470-20-55-69F
Reference 4: http://www.xbrl.org/2003/role/disclosureRef
-Topic 470
-SubTopic 20
-Name Accounting Standards Codification
-Section 50
-Paragraph 1F
-Subparagraph (b)
-Publisher FASB
-URI https://asc.fasb.org/1943274/2147481139/470-20-50-1F
Reference 5: http://www.xbrl.org/2003/role/disclosureRef
-Topic 470
-SubTopic 20
-Name Accounting Standards Codification
-Section 50
-Paragraph 6
-Subparagraph (b)
-Publisher FASB
-URI https://asc.fasb.org/1943274/2147481139/470-20-50-6
| Name: |
us-gaap_InterestExpenseDebt |
| Namespace Prefix: |
us-gaap_ |
| Data Type: |
xbrli:monetaryItemType |
| Balance Type: |
debit |
| Period Type: |
duration |
|
| X |
- DefinitionRepresents the portion of interest incurred in the period on debt arrangements that was charged against earnings, excluding amortization of debt discount (premium) and financing costs. Reference 1: http://fasb.org/us-gaap/role/ref/legacyRef
-Topic 220
-SubTopic 10
-Name Accounting Standards Codification
-Section S99
-Paragraph 2
-Subparagraph (SX 210.5-03(8))
-Publisher FASB
-URI https://asc.fasb.org/1943274/2147483621/220-10-S99-2
Reference 2: http://www.xbrl.org/2003/role/exampleRef
-Topic 470
-SubTopic 20
-Name Accounting Standards Codification
-Section 55
-Paragraph 69E
-Publisher FASB
-URI https://asc.fasb.org/1943274/2147481568/470-20-55-69E
Reference 3: http://www.xbrl.org/2003/role/exampleRef
-Topic 470
-SubTopic 20
-Name Accounting Standards Codification
-Section 55
-Paragraph 69F
-Publisher FASB
-URI https://asc.fasb.org/1943274/2147481568/470-20-55-69F
Reference 4: http://www.xbrl.org/2003/role/disclosureRef
-Topic 470
-SubTopic 20
-Name Accounting Standards Codification
-Section 50
-Paragraph 1F
-Subparagraph (b)(1)
-Publisher FASB
-URI https://asc.fasb.org/1943274/2147481139/470-20-50-1F
| Name: |
us-gaap_InterestExpenseDebtExcludingAmortization |
| Namespace Prefix: |
us-gaap_ |
| Data Type: |
xbrli:monetaryItemType |
| Balance Type: |
debit |
| Period Type: |
duration |
|
v3.24.2
Debt and Other Obligations Contractual Maturities (Details) - USD ($)
$ in Millions |
Jun. 30, 2024 |
Dec. 31, 2023 |
| Contractual Obligation, Fiscal Year Maturity Schedule [Abstract] |
|
|
|
| Long-Term Debt, Maturity, remainder of year |
[1] |
$ 2,249
|
|
| Long-Term Debt, Maturity, Year One |
|
605
|
|
| Long-Term Debt, Maturity, Year Two |
|
2,784
|
|
| Long-Term Debt, Maturity, Year Three |
|
3,254
|
|
| Long-Term Debt, Maturity, Year Four |
|
2,632
|
|
| Long-Term Debt, Maturity, after Year Five |
|
12,350
|
|
| Total Cash Obligations |
|
23,874
|
|
| Unamortized Adjustments, Net |
|
(155)
|
|
| Debt and Finance Lease Obligations |
|
$ 23,719
|
$ 22,921
|
|
|
| X |
- References
+ Details
| Name: |
us-gaap_ContractualObligationFiscalYearMaturityScheduleAbstract |
| Namespace Prefix: |
us-gaap_ |
| Data Type: |
xbrli:stringItemType |
| Balance Type: |
na |
| Period Type: |
duration |
|
| X |
- DefinitionAmount of short-term and long-term debt and lease obligation. Reference 1: http://fasb.org/us-gaap/role/ref/legacyRef
-Topic 942
-SubTopic 210
-Name Accounting Standards Codification
-Section S99
-Paragraph 1
-Subparagraph (SX 210.9-03(16))
-Publisher FASB
-URI https://asc.fasb.org/1943274/2147478546/942-210-S99-1
Reference 2: http://fasb.org/us-gaap/role/ref/legacyRef
-Topic 942
-SubTopic 210
-Name Accounting Standards Codification
-Section S99
-Paragraph 1
-Subparagraph (SX 210.9-03(13))
-Publisher FASB
-URI https://asc.fasb.org/1943274/2147478546/942-210-S99-1
| Name: |
us-gaap_DebtAndCapitalLeaseObligations |
| Namespace Prefix: |
us-gaap_ |
| Data Type: |
xbrli:monetaryItemType |
| Balance Type: |
credit |
| Period Type: |
instant |
|
| X |
- DefinitionAmount, before unamortized (discount) premium and debt issuance costs, of long-term debt. Includes, but is not limited to, notes payable, bonds payable, commercial loans, mortgage loans, convertible debt, subordinated debt and other types of debt. Reference 1: http://fasb.org/us-gaap/role/ref/legacyRef
-Name Accounting Standards Codification
-Section S99
-Paragraph 1
-Subparagraph (SX 210.5-02(22))
-SubTopic 10
-Topic 210
-Publisher FASB
-URI https://asc.fasb.org/1943274/2147480566/210-10-S99-1
Reference 2: http://fasb.org/us-gaap/role/ref/legacyRef
-Topic 942
-SubTopic 210
-Name Accounting Standards Codification
-Section S99
-Paragraph 1
-Subparagraph (SX 210.9-03(16))
-Publisher FASB
-URI https://asc.fasb.org/1943274/2147478546/942-210-S99-1
Reference 3: http://www.xbrl.org/2003/role/disclosureRef
-Topic 470
-SubTopic 20
-Name Accounting Standards Codification
-Section 50
-Paragraph 4
-Subparagraph (b)(1)
-Publisher FASB
-URI https://asc.fasb.org/1943274/2147481139/470-20-50-4
| Name: |
us-gaap_DebtInstrumentCarryingAmount |
| Namespace Prefix: |
us-gaap_ |
| Data Type: |
xbrli:monetaryItemType |
| Balance Type: |
credit |
| Period Type: |
instant |
|
| X |
- DefinitionAmount, after accumulated amortization, of debt discount. Reference 1: http://www.xbrl.org/2009/role/commonPracticeRef
-Topic 835
-SubTopic 30
-Name Accounting Standards Codification
-Section 45
-Paragraph 1A
-Publisher FASB
-URI https://asc.fasb.org/1943274/2147482925/835-30-45-1A
Reference 2: http://www.xbrl.org/2009/role/commonPracticeRef
-Topic 835
-SubTopic 30
-Name Accounting Standards Codification
-Section 45
-Paragraph 2
-Publisher FASB
-URI https://asc.fasb.org/1943274/2147482925/835-30-45-2
Reference 3: http://www.xbrl.org/2009/role/commonPracticeRef
-Topic 835
-SubTopic 30
-Name Accounting Standards Codification
-Section 50
-Paragraph 1
-Publisher FASB
-URI https://asc.fasb.org/1943274/2147482900/835-30-50-1
Reference 4: http://www.xbrl.org/2009/role/commonPracticeRef
-Topic 470
-SubTopic 20
-Name Accounting Standards Codification
-Section 50
-Paragraph 1D
-Subparagraph (a)
-Publisher FASB
-URI https://asc.fasb.org/1943274/2147481139/470-20-50-1D
| Name: |
us-gaap_DebtInstrumentUnamortizedDiscount |
| Namespace Prefix: |
us-gaap_ |
| Data Type: |
xbrli:monetaryItemType |
| Balance Type: |
debit |
| Period Type: |
instant |
|
| X |
- DefinitionAmount of long-term debt payable, sinking fund requirement, and other securities issued that are redeemable by holder at fixed or determinable price and date, maturing after fifth fiscal year following current fiscal year. Excludes interim and annual periods when interim periods are reported from current statement of financial position date (rolling approach). Reference 1: http://www.xbrl.org/2003/role/disclosureRef
-Topic 235
-SubTopic 10
-Name Accounting Standards Codification
-Section S99
-Paragraph 3
-Subparagraph (SX 210.12-04(a))
-Publisher FASB
-URI https://asc.fasb.org/1943274/2147480678/235-10-S99-3
Reference 2: http://fasb.org/us-gaap/role/ref/legacyRef
-Name Accounting Standards Codification
-Section 50
-Paragraph 1
-SubTopic 10
-Topic 470
-Publisher FASB
-URI https://asc.fasb.org/1943274/2147481544/470-10-50-1
Reference 3: http://www.xbrl.org/2009/role/commonPracticeRef
-Topic 470
-SubTopic 20
-Name Accounting Standards Codification
-Section 50
-Paragraph 1E
-Subparagraph (d)
-Publisher FASB
-URI https://asc.fasb.org/1943274/2147481139/470-20-50-1E
| Name: |
us-gaap_LongTermDebtMaturitiesRepaymentsOfPrincipalAfterYearFive |
| Namespace Prefix: |
us-gaap_ |
| Data Type: |
xbrli:monetaryItemType |
| Balance Type: |
credit |
| Period Type: |
instant |
|
| X |
- DefinitionAmount of long-term debt payable, sinking fund requirement, and other securities issued that are redeemable by holder at fixed or determinable price and date, maturing in next fiscal year following current fiscal year. Excludes interim and annual periods when interim periods are reported from current statement of financial position date (rolling approach). Reference 1: http://www.xbrl.org/2003/role/disclosureRef
-Topic 235
-SubTopic 10
-Name Accounting Standards Codification
-Section S99
-Paragraph 3
-Subparagraph (SX 210.12-04(a))
-Publisher FASB
-URI https://asc.fasb.org/1943274/2147480678/235-10-S99-3
Reference 2: http://www.xbrl.org/2003/role/disclosureRef
-Topic 470
-SubTopic 20
-Name Accounting Standards Codification
-Section 50
-Paragraph 1E
-Subparagraph (d)
-Publisher FASB
-URI https://asc.fasb.org/1943274/2147481139/470-20-50-1E
Reference 3: http://fasb.org/us-gaap/role/ref/legacyRef
-Name Accounting Standards Codification
-Section 50
-Paragraph 1
-SubTopic 10
-Topic 470
-Publisher FASB
-URI https://asc.fasb.org/1943274/2147481544/470-10-50-1
| Name: |
us-gaap_LongTermDebtMaturitiesRepaymentsOfPrincipalInNextTwelveMonths |
| Namespace Prefix: |
us-gaap_ |
| Data Type: |
xbrli:monetaryItemType |
| Balance Type: |
credit |
| Period Type: |
instant |
|
| X |
- DefinitionAmount of long-term debt payable, sinking fund requirement, and other securities issued that are redeemable by holder at fixed or determinable price and date, maturing in fourth fiscal year following current fiscal year. Excludes interim and annual periods when interim periods are reported from current statement of financial position date (rolling approach). Reference 1: http://www.xbrl.org/2003/role/disclosureRef
-Topic 235
-SubTopic 10
-Name Accounting Standards Codification
-Section S99
-Paragraph 3
-Subparagraph (SX 210.12-04(a))
-Publisher FASB
-URI https://asc.fasb.org/1943274/2147480678/235-10-S99-3
Reference 2: http://www.xbrl.org/2003/role/disclosureRef
-Topic 470
-SubTopic 20
-Name Accounting Standards Codification
-Section 50
-Paragraph 1E
-Subparagraph (d)
-Publisher FASB
-URI https://asc.fasb.org/1943274/2147481139/470-20-50-1E
Reference 3: http://fasb.org/us-gaap/role/ref/legacyRef
-Name Accounting Standards Codification
-Section 50
-Paragraph 1
-SubTopic 10
-Topic 470
-Publisher FASB
-URI https://asc.fasb.org/1943274/2147481544/470-10-50-1
| Name: |
us-gaap_LongTermDebtMaturitiesRepaymentsOfPrincipalInYearFour |
| Namespace Prefix: |
us-gaap_ |
| Data Type: |
xbrli:monetaryItemType |
| Balance Type: |
credit |
| Period Type: |
instant |
|
| X |
- DefinitionAmount of long-term debt payable, sinking fund requirement, and other securities issued that are redeemable by holder at fixed or determinable price and date, maturing in third fiscal year following current fiscal year. Excludes interim and annual periods when interim periods are reported from current statement of financial position date (rolling approach). Reference 1: http://www.xbrl.org/2003/role/disclosureRef
-Topic 235
-SubTopic 10
-Name Accounting Standards Codification
-Section S99
-Paragraph 3
-Subparagraph (SX 210.12-04(a))
-Publisher FASB
-URI https://asc.fasb.org/1943274/2147480678/235-10-S99-3
Reference 2: http://www.xbrl.org/2003/role/disclosureRef
-Topic 470
-SubTopic 20
-Name Accounting Standards Codification
-Section 50
-Paragraph 1E
-Subparagraph (d)
-Publisher FASB
-URI https://asc.fasb.org/1943274/2147481139/470-20-50-1E
Reference 3: http://fasb.org/us-gaap/role/ref/legacyRef
-Name Accounting Standards Codification
-Section 50
-Paragraph 1
-SubTopic 10
-Topic 470
-Publisher FASB
-URI https://asc.fasb.org/1943274/2147481544/470-10-50-1
| Name: |
us-gaap_LongTermDebtMaturitiesRepaymentsOfPrincipalInYearThree |
| Namespace Prefix: |
us-gaap_ |
| Data Type: |
xbrli:monetaryItemType |
| Balance Type: |
credit |
| Period Type: |
instant |
|
| X |
- DefinitionAmount of long-term debt payable, sinking fund requirement, and other securities issued that are redeemable by holder at fixed or determinable price and date, maturing in second fiscal year following current fiscal year. Excludes interim and annual periods when interim periods are reported from current statement of financial position date (rolling approach). Reference 1: http://www.xbrl.org/2003/role/disclosureRef
-Topic 235
-SubTopic 10
-Name Accounting Standards Codification
-Section S99
-Paragraph 3
-Subparagraph (SX 210.12-04(a))
-Publisher FASB
-URI https://asc.fasb.org/1943274/2147480678/235-10-S99-3
Reference 2: http://www.xbrl.org/2003/role/disclosureRef
-Topic 470
-SubTopic 20
-Name Accounting Standards Codification
-Section 50
-Paragraph 1E
-Subparagraph (d)
-Publisher FASB
-URI https://asc.fasb.org/1943274/2147481139/470-20-50-1E
Reference 3: http://fasb.org/us-gaap/role/ref/legacyRef
-Name Accounting Standards Codification
-Section 50
-Paragraph 1
-SubTopic 10
-Topic 470
-Publisher FASB
-URI https://asc.fasb.org/1943274/2147481544/470-10-50-1
| Name: |
us-gaap_LongTermDebtMaturitiesRepaymentsOfPrincipalInYearTwo |
| Namespace Prefix: |
us-gaap_ |
| Data Type: |
xbrli:monetaryItemType |
| Balance Type: |
credit |
| Period Type: |
instant |
|
| X |
- DefinitionAmount of long-term debt payable, sinking fund requirement, and other securities issued that are redeemable by holder at fixed or determinable price and date, maturing in remainder of current fiscal year. Reference 1: http://www.xbrl.org/2009/role/commonPracticeRef
-Topic 235
-SubTopic 10
-Name Accounting Standards Codification
-Section S99
-Paragraph 3
-Subparagraph (SX 210.12-04(a))
-Publisher FASB
-URI https://asc.fasb.org/1943274/2147480678/235-10-S99-3
| Name: |
us-gaap_LongTermDebtMaturitiesRepaymentsOfPrincipalRemainderOfFiscalYear |
| Namespace Prefix: |
us-gaap_ |
| Data Type: |
xbrli:monetaryItemType |
| Balance Type: |
credit |
| Period Type: |
instant |
|
v3.24.2
| X |
- DefinitionThe fair value of cash and cash equivalent items which are restricted as to withdrawal or usage.
| Name: |
cci_RestrictedCashAndCashEquivalentsFairValueDisclosure |
| Namespace Prefix: |
cci_ |
| Data Type: |
xbrli:monetaryItemType |
| Balance Type: |
debit |
| Period Type: |
instant |
|
| X |
- DefinitionAmount of currency on hand as well as demand deposits with banks or financial institutions. Includes other kinds of accounts that have the general characteristics of demand deposits. Also includes short-term, highly liquid investments that are both readily convertible to known amounts of cash and so near their maturity that they present insignificant risk of changes in value because of changes in interest rates. Excludes cash and cash equivalents within disposal group and discontinued operation. Reference 1: http://www.xbrl.org/2003/role/disclosureRef
-Topic 210
-SubTopic 10
-Name Accounting Standards Codification
-Section S99
-Paragraph 1
-Subparagraph (SX 210.5-02(1))
-Publisher FASB
-URI https://asc.fasb.org/1943274/2147480566/210-10-S99-1
Reference 2: http://www.xbrl.org/2003/role/exampleRef
-Topic 210
-SubTopic 10
-Name Accounting Standards Codification
-Section 45
-Paragraph 1
-Subparagraph (a)
-Publisher FASB
-URI https://asc.fasb.org/1943274/2147483467/210-10-45-1
Reference 3: http://fasb.org/us-gaap/role/ref/legacyRef
-Name Accounting Standards Codification
-Topic 230
-SubTopic 10
-Section 45
-Paragraph 4
-Publisher FASB
-URI https://asc.fasb.org/1943274/2147482740/230-10-45-4
| Name: |
us-gaap_CashAndCashEquivalentsAtCarryingValue |
| Namespace Prefix: |
us-gaap_ |
| Data Type: |
xbrli:monetaryItemType |
| Balance Type: |
debit |
| Period Type: |
instant |
|
| X |
- DefinitionFair value portion of currency on hand as well as demand deposits with banks or financial institutions. Includes other kinds of accounts that have the general characteristics of demand deposits. Also includes short-term, highly liquid investments that are both readily convertible to known amounts of cash and so near their maturity that they present insignificant risk of changes in value because of changes in interest rates. Reference 1: http://www.xbrl.org/2009/role/commonPracticeRef
-Topic 820
-SubTopic 10
-Name Accounting Standards Codification
-Section 50
-Paragraph 2
-Subparagraph (b)
-Publisher FASB
-URI https://asc.fasb.org/1943274/2147482106/820-10-50-2
Reference 2: http://www.xbrl.org/2009/role/commonPracticeRef
-Topic 820
-SubTopic 10
-Name Accounting Standards Codification
-Section 50
-Paragraph 2
-Subparagraph (a)
-Publisher FASB
-URI https://asc.fasb.org/1943274/2147482106/820-10-50-2
| Name: |
us-gaap_CashAndCashEquivalentsFairValueDisclosure |
| Namespace Prefix: |
us-gaap_ |
| Data Type: |
xbrli:monetaryItemType |
| Balance Type: |
debit |
| Period Type: |
instant |
|
| X |
- DefinitionAmount of short-term and long-term debt and lease obligation. Reference 1: http://fasb.org/us-gaap/role/ref/legacyRef
-Topic 942
-SubTopic 210
-Name Accounting Standards Codification
-Section S99
-Paragraph 1
-Subparagraph (SX 210.9-03(16))
-Publisher FASB
-URI https://asc.fasb.org/1943274/2147478546/942-210-S99-1
Reference 2: http://fasb.org/us-gaap/role/ref/legacyRef
-Topic 942
-SubTopic 210
-Name Accounting Standards Codification
-Section S99
-Paragraph 1
-Subparagraph (SX 210.9-03(13))
-Publisher FASB
-URI https://asc.fasb.org/1943274/2147478546/942-210-S99-1
| Name: |
us-gaap_DebtAndCapitalLeaseObligations |
| Namespace Prefix: |
us-gaap_ |
| Data Type: |
xbrli:monetaryItemType |
| Balance Type: |
credit |
| Period Type: |
instant |
|
| X |
- References
+ Details
| Name: |
us-gaap_FairValueDisclosuresAbstract |
| Namespace Prefix: |
us-gaap_ |
| Data Type: |
xbrli:stringItemType |
| Balance Type: |
na |
| Period Type: |
duration |
|
| X |
- DefinitionFair value of obligations measured on a recurring basis. Reference 1: http://www.xbrl.org/2009/role/commonPracticeRef
-Topic 820
-SubTopic 10
-Name Accounting Standards Codification
-Section 50
-Paragraph 2E
-Publisher FASB
-URI https://asc.fasb.org/1943274/2147482106/820-10-50-2E
Reference 2: http://www.xbrl.org/2009/role/commonPracticeRef
-Topic 820
-SubTopic 10
-Name Accounting Standards Codification
-Section 50
-Paragraph 2
-Subparagraph (b)
-Publisher FASB
-URI https://asc.fasb.org/1943274/2147482106/820-10-50-2
Reference 3: http://www.xbrl.org/2009/role/commonPracticeRef
-Topic 820
-SubTopic 10
-Name Accounting Standards Codification
-Section 50
-Paragraph 2
-Subparagraph (a)
-Publisher FASB
-URI https://asc.fasb.org/1943274/2147482106/820-10-50-2
| Name: |
us-gaap_FairValueLiabilitiesMeasuredOnRecurringBasisObligations |
| Namespace Prefix: |
us-gaap_ |
| Data Type: |
xbrli:monetaryItemType |
| Balance Type: |
credit |
| Period Type: |
instant |
|
| X |
- DefinitionAmount of cash and cash equivalents restricted as to withdrawal or usage. Cash includes, but is not limited to, currency on hand, demand deposits with banks or financial institutions, and other accounts with general characteristics of demand deposits. Cash equivalents include, but are not limited to, short-term, highly liquid investments that are both readily convertible to known amounts of cash and so near their maturity that they present insignificant risk of changes in value because of changes in interest rates. Reference 1: http://www.xbrl.org/2003/role/disclosureRef
-Topic 210
-SubTopic 10
-Name Accounting Standards Codification
-Section S99
-Paragraph 1
-Subparagraph (SX 210.5-02(1))
-Publisher FASB
-URI https://asc.fasb.org/1943274/2147480566/210-10-S99-1
Reference 2: http://www.xbrl.org/2003/role/disclosureRef
-Topic 944
-SubTopic 210
-Name Accounting Standards Codification
-Section S99
-Paragraph 1
-Subparagraph (SX 210.7-03(a)(2))
-Publisher FASB
-URI https://asc.fasb.org/1943274/2147478777/944-210-S99-1
Reference 3: http://www.xbrl.org/2003/role/disclosureRef
-Topic 230
-SubTopic 10
-Name Accounting Standards Codification
-Section 50
-Paragraph 8
-Publisher FASB
-URI https://asc.fasb.org/1943274/2147482913/230-10-50-8
Reference 4: http://fasb.org/us-gaap/role/ref/legacyRef
-Topic 942
-SubTopic 210
-Name Accounting Standards Codification
-Section S99
-Paragraph 1
-Subparagraph (SX 210.9-03(1)(a))
-Publisher FASB
-URI https://asc.fasb.org/1943274/2147478546/942-210-S99-1
Reference 5: http://fasb.org/us-gaap/role/ref/legacyRef
-Name Accounting Standards Codification
-Topic 230
-SubTopic 10
-Section 45
-Paragraph 4
-Publisher FASB
-URI https://asc.fasb.org/1943274/2147482740/230-10-45-4
| Name: |
us-gaap_RestrictedCashAndCashEquivalents |
| Namespace Prefix: |
us-gaap_ |
| Data Type: |
xbrli:monetaryItemType |
| Balance Type: |
debit |
| Period Type: |
instant |
|
v3.24.2
| X |
- DefinitionAggregate dividends declared during the period for each share of common stock outstanding. Reference 1: http://fasb.org/us-gaap/role/ref/legacyRef
-Topic 505
-SubTopic 10
-Name Accounting Standards Codification
-Section S99
-Paragraph 1
-Subparagraph (SX 210.3-04)
-Publisher FASB
-URI https://asc.fasb.org/1943274/2147480008/505-10-S99-1
| Name: |
us-gaap_CommonStockDividendsPerShareDeclared |
| Namespace Prefix: |
us-gaap_ |
| Data Type: |
dtr-types:perShareItemType |
| Balance Type: |
na |
| Period Type: |
duration |
|
| X |
- References
+ Details
| Name: |
us-gaap_EarningsPerShareAbstract |
| Namespace Prefix: |
us-gaap_ |
| Data Type: |
xbrli:stringItemType |
| Balance Type: |
na |
| Period Type: |
duration |
|
| X |
- DefinitionThe amount of net income (loss) for the period per each share of common stock or unit outstanding during the reporting period. Reference 1: http://www.xbrl.org/2003/role/disclosureRef
-Topic 250
-SubTopic 10
-Name Accounting Standards Codification
-Section 50
-Paragraph 6
-Publisher FASB
-URI https://asc.fasb.org/1943274/2147483443/250-10-50-6
Reference 2: http://www.xbrl.org/2003/role/exampleRef
-Topic 260
-SubTopic 10
-Name Accounting Standards Codification
-Section 55
-Paragraph 52
-Publisher FASB
-URI https://asc.fasb.org/1943274/2147482635/260-10-55-52
Reference 3: http://www.xbrl.org/2003/role/disclosureRef
-Topic 805
-SubTopic 60
-Name Accounting Standards Codification
-Section 65
-Paragraph 1
-Subparagraph (g)
-Publisher FASB
-URI https://asc.fasb.org/1943274/2147476176/805-60-65-1
Reference 4: http://www.xbrl.org/2003/role/disclosureRef
-Topic 740
-SubTopic 323
-Name Accounting Standards Codification
-Section 65
-Paragraph 2
-Subparagraph (g)(3)
-Publisher FASB
-URI https://asc.fasb.org/1943274/2147478666/740-323-65-2
Reference 5: http://www.xbrl.org/2003/role/disclosureRef
-Topic 250
-SubTopic 10
-Name Accounting Standards Codification
-Section 50
-Paragraph 3
-Publisher FASB
-URI https://asc.fasb.org/1943274/2147483443/250-10-50-3
Reference 6: http://www.xbrl.org/2003/role/disclosureRef
-Topic 260
-SubTopic 10
-Name Accounting Standards Codification
-Section 55
-Paragraph 15
-Publisher FASB
-URI https://asc.fasb.org/1943274/2147482635/260-10-55-15
Reference 7: http://www.xbrl.org/2003/role/disclosureRef
-Topic 815
-SubTopic 40
-Name Accounting Standards Codification
-Section 65
-Paragraph 1
-Subparagraph (e)(4)
-Publisher FASB
-URI https://asc.fasb.org/1943274/2147480175/815-40-65-1
Reference 8: http://www.xbrl.org/2003/role/disclosureRef
-Topic 815
-SubTopic 40
-Name Accounting Standards Codification
-Section 65
-Paragraph 1
-Subparagraph (f)
-Publisher FASB
-URI https://asc.fasb.org/1943274/2147480175/815-40-65-1
Reference 9: http://www.xbrl.org/2003/role/disclosureRef
-Topic 250
-SubTopic 10
-Name Accounting Standards Codification
-Section 50
-Paragraph 11
-Subparagraph (a)
-Publisher FASB
-URI https://asc.fasb.org/1943274/2147483443/250-10-50-11
Reference 10: http://www.xbrl.org/2003/role/disclosureRef
-Topic 250
-SubTopic 10
-Name Accounting Standards Codification
-Section 50
-Paragraph 11
-Subparagraph (b)
-Publisher FASB
-URI https://asc.fasb.org/1943274/2147483443/250-10-50-11
Reference 11: http://www.xbrl.org/2003/role/disclosureRef
-Topic 250
-SubTopic 10
-Name Accounting Standards Codification
-Section 50
-Paragraph 7
-Subparagraph (a)
-Publisher FASB
-URI https://asc.fasb.org/1943274/2147483443/250-10-50-7
Reference 12: http://www.xbrl.org/2003/role/disclosureRef
-Topic 260
-SubTopic 10
-Name Accounting Standards Codification
-Section 45
-Paragraph 2
-Publisher FASB
-URI https://asc.fasb.org/1943274/2147482689/260-10-45-2
Reference 13: http://www.xbrl.org/2003/role/disclosureRef
-Topic 260
-SubTopic 10
-Name Accounting Standards Codification
-Section 45
-Paragraph 60B
-Subparagraph (d)
-Publisher FASB
-URI https://asc.fasb.org/1943274/2147482689/260-10-45-60B
Reference 14: http://www.xbrl.org/2003/role/disclosureRef
-Topic 250
-SubTopic 10
-Name Accounting Standards Codification
-Section 50
-Paragraph 4
-Publisher FASB
-URI https://asc.fasb.org/1943274/2147483443/250-10-50-4
Reference 15: http://www.xbrl.org/2003/role/disclosureRef
-Topic 260
-SubTopic 10
-Name Accounting Standards Codification
-Section 50
-Paragraph 1
-Subparagraph (a)
-Publisher FASB
-URI https://asc.fasb.org/1943274/2147482662/260-10-50-1
Reference 16: http://www.xbrl.org/2003/role/disclosureRef
-Topic 260
-SubTopic 10
-Name Accounting Standards Codification
-Section 45
-Paragraph 10
-Publisher FASB
-URI https://asc.fasb.org/1943274/2147482689/260-10-45-10
Reference 17: http://www.xbrl.org/2003/role/disclosureRef
-Topic 220
-SubTopic 10
-Name Accounting Standards Codification
-Section S99
-Paragraph 2
-Subparagraph (SX 210.5-03(25))
-Publisher FASB
-URI https://asc.fasb.org/1943274/2147483621/220-10-S99-2
Reference 18: http://www.xbrl.org/2003/role/disclosureRef
-Topic 942
-SubTopic 220
-Name Accounting Standards Codification
-Section S99
-Paragraph 1
-Subparagraph (SX 210.9-04(27))
-Publisher FASB
-URI https://asc.fasb.org/1943274/2147478524/942-220-S99-1
Reference 19: http://www.xbrl.org/2003/role/disclosureRef
-Topic 944
-SubTopic 220
-Name Accounting Standards Codification
-Section S99
-Paragraph 1
-Subparagraph (SX 210.7-04(23))
-Publisher FASB
-URI https://asc.fasb.org/1943274/2147477250/944-220-S99-1
Reference 20: http://www.xbrl.org/2003/role/disclosureRef
-Topic 260
-SubTopic 10
-Name Accounting Standards Codification
-Section 45
-Paragraph 7
-Publisher FASB
-URI https://asc.fasb.org/1943274/2147482689/260-10-45-7
| Name: |
us-gaap_EarningsPerShareBasic |
| Namespace Prefix: |
us-gaap_ |
| Data Type: |
dtr-types:perShareItemType |
| Balance Type: |
na |
| Period Type: |
duration |
|
| X |
- DefinitionThe amount of net income (loss) for the period available to each share of common stock or common unit outstanding during the reporting period and to each share or unit that would have been outstanding assuming the issuance of common shares or units for all dilutive potential common shares or units outstanding during the reporting period. Reference 1: http://www.xbrl.org/2003/role/disclosureRef
-Topic 250
-SubTopic 10
-Name Accounting Standards Codification
-Section 50
-Paragraph 6
-Publisher FASB
-URI https://asc.fasb.org/1943274/2147483443/250-10-50-6
Reference 2: http://www.xbrl.org/2003/role/exampleRef
-Topic 260
-SubTopic 10
-Name Accounting Standards Codification
-Section 55
-Paragraph 52
-Publisher FASB
-URI https://asc.fasb.org/1943274/2147482635/260-10-55-52
Reference 3: http://www.xbrl.org/2003/role/disclosureRef
-Topic 805
-SubTopic 60
-Name Accounting Standards Codification
-Section 65
-Paragraph 1
-Subparagraph (g)
-Publisher FASB
-URI https://asc.fasb.org/1943274/2147476176/805-60-65-1
Reference 4: http://www.xbrl.org/2003/role/disclosureRef
-Topic 740
-SubTopic 323
-Name Accounting Standards Codification
-Section 65
-Paragraph 2
-Subparagraph (g)(3)
-Publisher FASB
-URI https://asc.fasb.org/1943274/2147478666/740-323-65-2
Reference 5: http://www.xbrl.org/2003/role/disclosureRef
-Topic 250
-SubTopic 10
-Name Accounting Standards Codification
-Section 50
-Paragraph 3
-Publisher FASB
-URI https://asc.fasb.org/1943274/2147483443/250-10-50-3
Reference 6: http://www.xbrl.org/2003/role/disclosureRef
-Topic 260
-SubTopic 10
-Name Accounting Standards Codification
-Section 55
-Paragraph 15
-Publisher FASB
-URI https://asc.fasb.org/1943274/2147482635/260-10-55-15
Reference 7: http://www.xbrl.org/2003/role/disclosureRef
-Topic 815
-SubTopic 40
-Name Accounting Standards Codification
-Section 65
-Paragraph 1
-Subparagraph (e)(4)
-Publisher FASB
-URI https://asc.fasb.org/1943274/2147480175/815-40-65-1
Reference 8: http://www.xbrl.org/2003/role/disclosureRef
-Topic 815
-SubTopic 40
-Name Accounting Standards Codification
-Section 65
-Paragraph 1
-Subparagraph (f)
-Publisher FASB
-URI https://asc.fasb.org/1943274/2147480175/815-40-65-1
Reference 9: http://www.xbrl.org/2003/role/disclosureRef
-Topic 250
-SubTopic 10
-Name Accounting Standards Codification
-Section 50
-Paragraph 11
-Subparagraph (a)
-Publisher FASB
-URI https://asc.fasb.org/1943274/2147483443/250-10-50-11
Reference 10: http://www.xbrl.org/2003/role/disclosureRef
-Topic 250
-SubTopic 10
-Name Accounting Standards Codification
-Section 50
-Paragraph 11
-Subparagraph (b)
-Publisher FASB
-URI https://asc.fasb.org/1943274/2147483443/250-10-50-11
Reference 11: http://www.xbrl.org/2003/role/disclosureRef
-Topic 250
-SubTopic 10
-Name Accounting Standards Codification
-Section 50
-Paragraph 7
-Subparagraph (a)
-Publisher FASB
-URI https://asc.fasb.org/1943274/2147483443/250-10-50-7
Reference 12: http://www.xbrl.org/2003/role/disclosureRef
-Topic 260
-SubTopic 10
-Name Accounting Standards Codification
-Section 45
-Paragraph 2
-Publisher FASB
-URI https://asc.fasb.org/1943274/2147482689/260-10-45-2
Reference 13: http://www.xbrl.org/2003/role/disclosureRef
-Topic 260
-SubTopic 10
-Name Accounting Standards Codification
-Section 45
-Paragraph 60B
-Subparagraph (d)
-Publisher FASB
-URI https://asc.fasb.org/1943274/2147482689/260-10-45-60B
Reference 14: http://www.xbrl.org/2003/role/disclosureRef
-Topic 250
-SubTopic 10
-Name Accounting Standards Codification
-Section 50
-Paragraph 4
-Publisher FASB
-URI https://asc.fasb.org/1943274/2147483443/250-10-50-4
Reference 15: http://www.xbrl.org/2003/role/disclosureRef
-Topic 260
-SubTopic 10
-Name Accounting Standards Codification
-Section 50
-Paragraph 1
-Subparagraph (a)
-Publisher FASB
-URI https://asc.fasb.org/1943274/2147482662/260-10-50-1
Reference 16: http://www.xbrl.org/2003/role/disclosureRef
-Topic 220
-SubTopic 10
-Name Accounting Standards Codification
-Section S99
-Paragraph 2
-Subparagraph (SX 210.5-03(25))
-Publisher FASB
-URI https://asc.fasb.org/1943274/2147483621/220-10-S99-2
Reference 17: http://www.xbrl.org/2003/role/disclosureRef
-Topic 942
-SubTopic 220
-Name Accounting Standards Codification
-Section S99
-Paragraph 1
-Subparagraph (SX 210.9-04(27))
-Publisher FASB
-URI https://asc.fasb.org/1943274/2147478524/942-220-S99-1
Reference 18: http://www.xbrl.org/2003/role/disclosureRef
-Topic 944
-SubTopic 220
-Name Accounting Standards Codification
-Section S99
-Paragraph 1
-Subparagraph (SX 210.7-04(23))
-Publisher FASB
-URI https://asc.fasb.org/1943274/2147477250/944-220-S99-1
Reference 19: http://www.xbrl.org/2003/role/disclosureRef
-Topic 260
-SubTopic 10
-Name Accounting Standards Codification
-Section 45
-Paragraph 7
-Publisher FASB
-URI https://asc.fasb.org/1943274/2147482689/260-10-45-7
| Name: |
us-gaap_EarningsPerShareDiluted |
| Namespace Prefix: |
us-gaap_ |
| Data Type: |
dtr-types:perShareItemType |
| Balance Type: |
na |
| Period Type: |
duration |
|
| X |
- DefinitionThe portion of profit or loss for the period, net of income taxes, which is attributable to the parent. Reference 1: http://www.xbrl.org/2003/role/disclosureRef
-Topic 250
-SubTopic 10
-Name Accounting Standards Codification
-Section 50
-Paragraph 6
-Publisher FASB
-URI https://asc.fasb.org/1943274/2147483443/250-10-50-6
Reference 2: http://www.xbrl.org/2003/role/disclosureRef
-Topic 250
-SubTopic 10
-Name Accounting Standards Codification
-Section 50
-Paragraph 9
-Publisher FASB
-URI https://asc.fasb.org/1943274/2147483443/250-10-50-9
Reference 3: http://www.xbrl.org/2003/role/disclosureRef
-Topic 805
-SubTopic 60
-Name Accounting Standards Codification
-Section 65
-Paragraph 1
-Subparagraph (g)
-Publisher FASB
-URI https://asc.fasb.org/1943274/2147476176/805-60-65-1
Reference 4: http://www.xbrl.org/2003/role/disclosureRef
-Topic 740
-SubTopic 323
-Name Accounting Standards Codification
-Section 65
-Paragraph 2
-Subparagraph (g)(3)
-Publisher FASB
-URI https://asc.fasb.org/1943274/2147478666/740-323-65-2
Reference 5: http://fasb.org/us-gaap/role/ref/legacyRef
-Topic 220
-SubTopic 10
-Name Accounting Standards Codification
-Section S99
-Paragraph 2
-Subparagraph (SX 210.5-03(20))
-Publisher FASB
-URI https://asc.fasb.org/1943274/2147483621/220-10-S99-2
Reference 6: http://www.xbrl.org/2003/role/disclosureRef
-Topic 235
-SubTopic 10
-Name Accounting Standards Codification
-Section S99
-Paragraph 1
-Subparagraph (SX 210.4-08(g)(1)(ii))
-Publisher FASB
-URI https://asc.fasb.org/1943274/2147480678/235-10-S99-1
Reference 7: http://www.xbrl.org/2003/role/disclosureRef
-Topic 323
-SubTopic 10
-Name Accounting Standards Codification
-Section 50
-Paragraph 3
-Subparagraph (c)
-Publisher FASB
-URI https://asc.fasb.org/1943274/2147481687/323-10-50-3
Reference 8: http://www.xbrl.org/2003/role/disclosureRef
-Topic 825
-SubTopic 10
-Name Accounting Standards Codification
-Section 50
-Paragraph 28
-Subparagraph (f)
-Publisher FASB
-URI https://asc.fasb.org/1943274/2147482907/825-10-50-28
Reference 9: http://www.xbrl.org/2003/role/disclosureRef
-Topic 220
-SubTopic 10
-Name Accounting Standards Codification
-Section 50
-Paragraph 6
-Publisher FASB
-URI https://asc.fasb.org/1943274/2147482765/220-10-50-6
Reference 10: http://www.xbrl.org/2003/role/disclosureRef
-Topic 250
-SubTopic 10
-Name Accounting Standards Codification
-Section 50
-Paragraph 3
-Publisher FASB
-URI https://asc.fasb.org/1943274/2147483443/250-10-50-3
Reference 11: http://www.xbrl.org/2003/role/disclosureRef
-Topic 250
-SubTopic 10
-Name Accounting Standards Codification
-Section 50
-Paragraph 1
-Subparagraph (b)(2)
-Publisher FASB
-URI https://asc.fasb.org/1943274/2147483443/250-10-50-1
Reference 12: http://www.xbrl.org/2003/role/disclosureRef
-Topic 815
-SubTopic 40
-Name Accounting Standards Codification
-Section 65
-Paragraph 1
-Subparagraph (f)
-Publisher FASB
-URI https://asc.fasb.org/1943274/2147480175/815-40-65-1
Reference 13: http://www.xbrl.org/2003/role/disclosureRef
-Topic 250
-SubTopic 10
-Name Accounting Standards Codification
-Section 50
-Paragraph 8
-Publisher FASB
-URI https://asc.fasb.org/1943274/2147483443/250-10-50-8
Reference 14: http://www.xbrl.org/2003/role/disclosureRef
-Topic 250
-SubTopic 10
-Name Accounting Standards Codification
-Section 50
-Paragraph 11
-Subparagraph (a)
-Publisher FASB
-URI https://asc.fasb.org/1943274/2147483443/250-10-50-11
Reference 15: http://www.xbrl.org/2003/role/disclosureRef
-Topic 250
-SubTopic 10
-Name Accounting Standards Codification
-Section 50
-Paragraph 11
-Subparagraph (b)
-Publisher FASB
-URI https://asc.fasb.org/1943274/2147483443/250-10-50-11
Reference 16: http://www.xbrl.org/2003/role/disclosureRef
-Topic 250
-SubTopic 10
-Name Accounting Standards Codification
-Section 50
-Paragraph 4
-Publisher FASB
-URI https://asc.fasb.org/1943274/2147483443/250-10-50-4
Reference 17: http://www.xbrl.org/2003/role/exampleRef
-Topic 946
-SubTopic 830
-Name Accounting Standards Codification
-Section 55
-Paragraph 10
-Publisher FASB
-URI https://asc.fasb.org/1943274/2147479168/946-830-55-10
Reference 18: http://www.xbrl.org/2003/role/disclosureRef
-Topic 946
-SubTopic 220
-Name Accounting Standards Codification
-Section 45
-Paragraph 7
-Publisher FASB
-URI https://asc.fasb.org/1943274/2147479105/946-220-45-7
Reference 19: http://www.xbrl.org/2003/role/disclosureRef
-Topic 944
-SubTopic 220
-Name Accounting Standards Codification
-Section S99
-Paragraph 1
-Subparagraph (SX 210.7-04(18))
-Publisher FASB
-URI https://asc.fasb.org/1943274/2147477250/944-220-S99-1
Reference 20: http://www.xbrl.org/2003/role/disclosureRef
-Topic 946
-SubTopic 220
-Name Accounting Standards Codification
-Section S99
-Paragraph 1
-Subparagraph (SX 210.6-07(9))
-Publisher FASB
-URI https://asc.fasb.org/1943274/2147479134/946-220-S99-1
Reference 21: http://www.xbrl.org/2003/role/disclosureRef
-Topic 946
-SubTopic 220
-Name Accounting Standards Codification
-Section S99
-Paragraph 3
-Subparagraph (SX 210.6-09(1)(d))
-Publisher FASB
-URI https://asc.fasb.org/1943274/2147479134/946-220-S99-3
Reference 22: http://www.xbrl.org/2003/role/disclosureRef
-Topic 470
-SubTopic 10
-Name Accounting Standards Codification
-Section S99
-Paragraph 1A
-Subparagraph (SX 210.13-01(a)(4)(i))
-Publisher FASB
-URI https://asc.fasb.org/1943274/2147480097/470-10-S99-1A
Reference 23: http://www.xbrl.org/2009/role/commonPracticeRef
-Topic 470
-SubTopic 10
-Name Accounting Standards Codification
-Section S99
-Paragraph 1A
-Subparagraph (SX 210.13-01(a)(4)(ii))
-Publisher FASB
-URI https://asc.fasb.org/1943274/2147480097/470-10-S99-1A
Reference 24: http://www.xbrl.org/2003/role/disclosureRef
-Topic 470
-SubTopic 10
-Name Accounting Standards Codification
-Section S99
-Paragraph 1A
-Subparagraph (SX 210.13-01(a)(4)(iii)(A))
-Publisher FASB
-URI https://asc.fasb.org/1943274/2147480097/470-10-S99-1A
Reference 25: http://www.xbrl.org/2003/role/disclosureRef
-Topic 470
-SubTopic 10
-Name Accounting Standards Codification
-Section S99
-Paragraph 1A
-Subparagraph (SX 210.13-01(a)(4)(iv))
-Publisher FASB
-URI https://asc.fasb.org/1943274/2147480097/470-10-S99-1A
Reference 26: http://www.xbrl.org/2003/role/disclosureRef
-Topic 470
-SubTopic 10
-Name Accounting Standards Codification
-Section S99
-Paragraph 1A
-Subparagraph (SX 210.13-01(a)(5))
-Publisher FASB
-URI https://asc.fasb.org/1943274/2147480097/470-10-S99-1A
Reference 27: http://www.xbrl.org/2003/role/disclosureRef
-Topic 470
-SubTopic 10
-Name Accounting Standards Codification
-Section S99
-Paragraph 1B
-Subparagraph (SX 210.13-02(a)(4)(i))
-Publisher FASB
-URI https://asc.fasb.org/1943274/2147480097/470-10-S99-1B
Reference 28: http://www.xbrl.org/2003/role/disclosureRef
-Topic 470
-SubTopic 10
-Name Accounting Standards Codification
-Section S99
-Paragraph 1B
-Subparagraph (SX 210.13-02(a)(4)(iii)(A))
-Publisher FASB
-URI https://asc.fasb.org/1943274/2147480097/470-10-S99-1B
Reference 29: http://www.xbrl.org/2003/role/disclosureRef
-Topic 470
-SubTopic 10
-Name Accounting Standards Codification
-Section S99
-Paragraph 1B
-Subparagraph (SX 210.13-02(a)(4)(iii)(B))
-Publisher FASB
-URI https://asc.fasb.org/1943274/2147480097/470-10-S99-1B
Reference 30: http://www.xbrl.org/2003/role/disclosureRef
-Topic 470
-SubTopic 10
-Name Accounting Standards Codification
-Section S99
-Paragraph 1B
-Subparagraph (SX 210.13-02(a)(4)(iv))
-Publisher FASB
-URI https://asc.fasb.org/1943274/2147480097/470-10-S99-1B
Reference 31: http://www.xbrl.org/2003/role/disclosureRef
-Topic 470
-SubTopic 10
-Name Accounting Standards Codification
-Section S99
-Paragraph 1B
-Subparagraph (SX 210.13-02(a)(5))
-Publisher FASB
-URI https://asc.fasb.org/1943274/2147480097/470-10-S99-1B
Reference 32: http://www.xbrl.org/2003/role/disclosureRef
-Topic 260
-SubTopic 10
-Name Accounting Standards Codification
-Section 45
-Paragraph 60B
-Subparagraph (a)
-Publisher FASB
-URI https://asc.fasb.org/1943274/2147482689/260-10-45-60B
Reference 33: http://www.xbrl.org/2003/role/disclosureRef
-Topic 205
-SubTopic 20
-Name Accounting Standards Codification
-Section 50
-Paragraph 7
-Publisher FASB
-URI https://asc.fasb.org/1943274/2147483499/205-20-50-7
Reference 34: http://fasb.org/us-gaap/role/ref/legacyRef
-Topic 230
-SubTopic 10
-Name Accounting Standards Codification
-Section 45
-Paragraph 28
-Publisher FASB
-URI https://asc.fasb.org/1943274/2147482740/230-10-45-28
Reference 35: http://www.xbrl.org/2003/role/disclosureRef
-Topic 220
-SubTopic 10
-Name Accounting Standards Codification
-Section 45
-Paragraph 1A
-Subparagraph (a)
-Publisher FASB
-URI https://asc.fasb.org/1943274/2147482790/220-10-45-1A
Reference 36: http://www.xbrl.org/2003/role/disclosureRef
-Topic 220
-SubTopic 10
-Name Accounting Standards Codification
-Section 45
-Paragraph 1B
-Subparagraph (a)
-Publisher FASB
-URI https://asc.fasb.org/1943274/2147482790/220-10-45-1B
Reference 37: http://fasb.org/us-gaap/role/ref/legacyRef
-Topic 942
-SubTopic 220
-Name Accounting Standards Codification
-Section S99
-Paragraph 1
-Subparagraph (SX 210.9-04(22))
-Publisher FASB
-URI https://asc.fasb.org/1943274/2147478524/942-220-S99-1
| Name: |
us-gaap_NetIncomeLoss |
| Namespace Prefix: |
us-gaap_ |
| Data Type: |
xbrli:monetaryItemType |
| Balance Type: |
credit |
| Period Type: |
duration |
|
| X |
- DefinitionThe sum of dilutive potential common shares or units used in the calculation of the diluted per-share or per-unit computation. Reference 1: http://www.xbrl.org/2009/role/commonPracticeRef
-Topic 260
-SubTopic 10
-Name Accounting Standards Codification
-Section 50
-Paragraph 1
-Subparagraph (a)
-Publisher FASB
-URI https://asc.fasb.org/1943274/2147482662/260-10-50-1
| Name: |
us-gaap_WeightedAverageNumberDilutedSharesOutstandingAdjustment |
| Namespace Prefix: |
us-gaap_ |
| Data Type: |
xbrli:sharesItemType |
| Balance Type: |
na |
| Period Type: |
duration |
|
| X |
- DefinitionThe average number of shares or units issued and outstanding that are used in calculating diluted EPS or earnings per unit (EPU), determined based on the timing of issuance of shares or units in the period. Reference 1: http://www.xbrl.org/2003/role/disclosureRef
-Topic 260
-SubTopic 10
-Name Accounting Standards Codification
-Section 50
-Paragraph 1
-Subparagraph (a)
-Publisher FASB
-URI https://asc.fasb.org/1943274/2147482662/260-10-50-1
Reference 2: http://www.xbrl.org/2003/role/disclosureRef
-Topic 260
-SubTopic 10
-Name Accounting Standards Codification
-Section 45
-Paragraph 16
-Publisher FASB
-URI https://asc.fasb.org/1943274/2147482689/260-10-45-16
| Name: |
us-gaap_WeightedAverageNumberOfDilutedSharesOutstanding |
| Namespace Prefix: |
us-gaap_ |
| Data Type: |
xbrli:sharesItemType |
| Balance Type: |
na |
| Period Type: |
duration |
|
| X |
- DefinitionNumber of [basic] shares or units, after adjustment for contingently issuable shares or units and other shares or units not deemed outstanding, determined by relating the portion of time within a reporting period that common shares or units have been outstanding to the total time in that period. Reference 1: http://www.xbrl.org/2003/role/disclosureRef
-Topic 260
-SubTopic 10
-Name Accounting Standards Codification
-Section 50
-Paragraph 1
-Subparagraph (a)
-Publisher FASB
-URI https://asc.fasb.org/1943274/2147482662/260-10-50-1
Reference 2: http://www.xbrl.org/2003/role/disclosureRef
-Topic 260
-SubTopic 10
-Name Accounting Standards Codification
-Section 45
-Paragraph 10
-Publisher FASB
-URI https://asc.fasb.org/1943274/2147482689/260-10-45-10
| Name: |
us-gaap_WeightedAverageNumberOfSharesOutstandingBasic |
| Namespace Prefix: |
us-gaap_ |
| Data Type: |
xbrli:sharesItemType |
| Balance Type: |
na |
| Period Type: |
duration |
|
v3.24.2
| X |
- DefinitionRestricted stock units granted [Abstract]
| Name: |
cci_RestrictedstockunitsgrantedAbstract |
| Namespace Prefix: |
cci_ |
| Data Type: |
xbrli:stringItemType |
| Balance Type: |
na |
| Period Type: |
duration |
|
| X |
- DefinitionTotal number of shares issued during the period, including shares forfeited, as a result of Restricted Stock Awards. Reference 1: http://fasb.org/us-gaap/role/ref/legacyRef
-Name Accounting Standards Codification
-Section 50
-Paragraph 2
-SubTopic 10
-Topic 505
-Publisher FASB
-URI https://asc.fasb.org/1943274/2147481112/505-10-50-2
Reference 2: http://fasb.org/us-gaap/role/ref/legacyRef
-Topic 505
-SubTopic 10
-Name Accounting Standards Codification
-Section S99
-Paragraph 1
-Subparagraph (SX 210.3-04)
-Publisher FASB
-URI https://asc.fasb.org/1943274/2147480008/505-10-S99-1
| Name: |
us-gaap_StockIssuedDuringPeriodSharesRestrictedStockAwardGross |
| Namespace Prefix: |
us-gaap_ |
| Data Type: |
xbrli:sharesItemType |
| Balance Type: |
na |
| Period Type: |
duration |
|
v3.24.2
| X |
- DefinitionPurchase Option, Percentage of Towers
| Name: |
cci_PurchaseOptionPercentageofTowers |
| Namespace Prefix: |
cci_ |
| Data Type: |
dtr-types1:percentItemType |
| Balance Type: |
na |
| Period Type: |
instant |
|
| X |
- DefinitionLine items represent financial concepts included in a table. These concepts are used to disclose reportable information associated with domain members defined in one or many axes to the table.
| Name: |
us-gaap_OtherCommitmentsLineItems |
| Namespace Prefix: |
us-gaap_ |
| Data Type: |
xbrli:stringItemType |
| Balance Type: |
na |
| Period Type: |
duration |
|
| X |
- Details
| Name: |
cci_ContractualTermsAxis=cci_SubjectToCapitalLeaseWithTMOOrATTMember |
| Namespace Prefix: |
|
| Data Type: |
na |
| Balance Type: |
|
| Period Type: |
|
|
v3.24.2
Equity (Details) - USD ($)
$ / shares in Units, shares in Millions, $ in Millions |
3 Months Ended |
6 Months Ended |
|
Mar. 31, 2024 |
Jun. 30, 2024 |
Jun. 30, 2023 |
Dec. 31, 2023 |
| Common Stock, Dividends, Per Share, Cash Paid |
|
$ 1.565
|
$ 1.565
|
|
|
| Dividends, Common Stock, Cash |
[1] |
$ 683
|
$ 684
|
|
|
| Common stock repurchased during period, shares |
|
|
0.3
|
|
|
| Purchases of common stock |
|
|
$ (30)
|
$ (29)
|
|
| Availability Under ATM |
|
|
$ 750
|
|
|
| At the Market Stock Offering Program, aggregate value of common stock |
|
|
|
|
$ 750
|
| At the Market Stock Offering Program, terminated 2021 Program remaining unsold |
|
$ 750
|
|
|
|
| Common Stock [Member] |
|
|
|
|
|
| Dividends Payable, Date Declared |
|
Feb. 21, 2024
|
May 22, 2024
|
|
|
| Dividends Payable, Date of Record |
|
Mar. 15, 2024
|
Jun. 14, 2024
|
|
|
| Dividends Payable, Date to be Paid |
|
Mar. 28, 2024
|
Jun. 28, 2024
|
|
|
|
|
| X |
- DefinitionAt the Market Stock Offering Program, aggregate value of common stock
| Name: |
cci_AtTheMarketStockOfferingProgramAggregateValueOfCommonStock |
| Namespace Prefix: |
cci_ |
| Data Type: |
xbrli:monetaryItemType |
| Balance Type: |
debit |
| Period Type: |
instant |
|
| X |
- DefinitionAt the Market Stock Offering Program, terminated 2021 Program remaining unsold
| Name: |
cci_AtTheMarketStockOfferingProgramTerminated2021ProgramRemainingUnsold |
| Namespace Prefix: |
cci_ |
| Data Type: |
xbrli:monetaryItemType |
| Balance Type: |
debit |
| Period Type: |
instant |
|
| X |
- DefinitionAvailability Under 2024 ATM Program
| Name: |
cci_AvailabilityUnder2024ATMProgram |
| Namespace Prefix: |
cci_ |
| Data Type: |
xbrli:monetaryItemType |
| Balance Type: |
credit |
| Period Type: |
instant |
|
| X |
- DefinitionAggregate dividends paid during the period for each share of common stock outstanding. Reference 1: http://fasb.org/us-gaap/role/ref/legacyRef
-Topic 505
-SubTopic 10
-Name Accounting Standards Codification
-Section S99
-Paragraph 1
-Subparagraph (SX 210.3-04)
-Publisher FASB
-URI https://asc.fasb.org/1943274/2147480008/505-10-S99-1
| Name: |
us-gaap_CommonStockDividendsPerShareCashPaid |
| Namespace Prefix: |
us-gaap_ |
| Data Type: |
dtr-types:perShareItemType |
| Balance Type: |
na |
| Period Type: |
duration |
|
| X |
- DefinitionDate the declared dividend will be paid, in YYYY-MM-DD format. Reference 1: http://fasb.org/us-gaap/role/ref/legacyRef
-Name Accounting Standards Codification
-Topic 230
-SubTopic 10
-Section 50
-Paragraph 3
-Publisher FASB
-URI https://asc.fasb.org/1943274/2147482913/230-10-50-3
| Name: |
us-gaap_DividendPayableDateToBePaidDayMonthAndYear |
| Namespace Prefix: |
us-gaap_ |
| Data Type: |
xbrli:dateItemType |
| Balance Type: |
na |
| Period Type: |
duration |
|
| X |
- DefinitionAmount of paid and unpaid common stock dividends declared with the form of settlement in cash. Reference 1: http://fasb.org/us-gaap/role/ref/legacyRef
-Topic 505
-SubTopic 10
-Name Accounting Standards Codification
-Section S99
-Paragraph 1
-Subparagraph (SX 210.3-04)
-Publisher FASB
-URI https://asc.fasb.org/1943274/2147480008/505-10-S99-1
| Name: |
us-gaap_DividendsCommonStockCash |
| Namespace Prefix: |
us-gaap_ |
| Data Type: |
xbrli:monetaryItemType |
| Balance Type: |
debit |
| Period Type: |
duration |
|
| X |
- DefinitionDate the dividend to be paid was declared, in YYYY-MM-DD format. Reference 1: http://fasb.org/us-gaap/role/ref/legacyRef
-Name Accounting Standards Codification
-Topic 230
-SubTopic 10
-Section 50
-Paragraph 3
-Publisher FASB
-URI https://asc.fasb.org/1943274/2147482913/230-10-50-3
| Name: |
us-gaap_DividendsPayableDateDeclaredDayMonthAndYear |
| Namespace Prefix: |
us-gaap_ |
| Data Type: |
xbrli:dateItemType |
| Balance Type: |
na |
| Period Type: |
duration |
|
| X |
- DefinitionDate the holder must own the stock to be entitled to the dividend, in YYYY-MM-DD format.
| Name: |
us-gaap_DividendsPayableDateOfRecordDayMonthAndYear |
| Namespace Prefix: |
us-gaap_ |
| Data Type: |
xbrli:dateItemType |
| Balance Type: |
na |
| Period Type: |
duration |
|
| X |
- DefinitionThe cash outflow to reacquire common stock during the period. Reference 1: http://fasb.org/us-gaap/role/ref/legacyRef
-Topic 230
-SubTopic 10
-Name Accounting Standards Codification
-Section 45
-Paragraph 15
-Subparagraph (a)
-Publisher FASB
-URI https://asc.fasb.org/1943274/2147482740/230-10-45-15
| Name: |
us-gaap_PaymentsForRepurchaseOfCommonStock |
| Namespace Prefix: |
us-gaap_ |
| Data Type: |
xbrli:monetaryItemType |
| Balance Type: |
credit |
| Period Type: |
duration |
|
| X |
- DefinitionNumber of shares that have been repurchased during the period and have not been retired and are not held in treasury. Some state laws may govern the circumstances under which an entity may acquire its own stock and prescribe the accounting treatment therefore. This element is used when state law does not recognize treasury stock. Reference 1: http://fasb.org/us-gaap/role/ref/legacyRef
-Name Accounting Standards Codification
-Section 50
-Paragraph 2
-SubTopic 10
-Topic 505
-Publisher FASB
-URI https://asc.fasb.org/1943274/2147481112/505-10-50-2
Reference 2: http://fasb.org/us-gaap/role/ref/legacyRef
-Topic 210
-SubTopic 10
-Name Accounting Standards Codification
-Section S99
-Paragraph 1
-Subparagraph (SX 210.5-02(28))
-Publisher FASB
-URI https://asc.fasb.org/1943274/2147480566/210-10-S99-1
Reference 3: http://fasb.org/us-gaap/role/ref/legacyRef
-Topic 210
-SubTopic 10
-Name Accounting Standards Codification
-Section S99
-Paragraph 1
-Subparagraph (SX 210.5-02(29))
-Publisher FASB
-URI https://asc.fasb.org/1943274/2147480566/210-10-S99-1
Reference 4: http://www.xbrl.org/2003/role/disclosureRef
-Topic 946
-SubTopic 505
-Name Accounting Standards Codification
-Section 50
-Paragraph 2
-Subparagraph (c)
-Publisher FASB
-URI https://asc.fasb.org/1943274/2147478448/946-505-50-2
Reference 5: http://www.xbrl.org/2003/role/disclosureRef
-Topic 946
-SubTopic 220
-Name Accounting Standards Codification
-Section S99
-Paragraph 3
-Subparagraph (SX 210.6-09(4)(b))
-Publisher FASB
-URI https://asc.fasb.org/1943274/2147479134/946-220-S99-3
Reference 6: http://www.xbrl.org/2003/role/disclosureRef
-Topic 946
-SubTopic 10
-Name Accounting Standards Codification
-Section S99
-Paragraph 3
-Subparagraph (SX 210.6-03(i)(2))
-Publisher FASB
-URI https://asc.fasb.org/1943274/2147479886/946-10-S99-3
Reference 7: http://fasb.org/us-gaap/role/ref/legacyRef
-Topic 505
-SubTopic 10
-Name Accounting Standards Codification
-Section S99
-Paragraph 1
-Subparagraph (SX 210.3-04)
-Publisher FASB
-URI https://asc.fasb.org/1943274/2147480008/505-10-S99-1
| Name: |
us-gaap_StockRepurchasedDuringPeriodShares |
| Namespace Prefix: |
us-gaap_ |
| Data Type: |
xbrli:sharesItemType |
| Balance Type: |
na |
| Period Type: |
duration |
|
| X |
- Details
| Name: |
us-gaap_StatementEquityComponentsAxis=us-gaap_CommonStockMember |
| Namespace Prefix: |
|
| Data Type: |
na |
| Balance Type: |
|
| Period Type: |
|
|
v3.24.2
Operating Segments Operating Segments Table (Details)
$ in Millions |
3 Months Ended |
6 Months Ended |
|
|
Jun. 30, 2024
USD ($)
|
Jun. 30, 2023
USD ($)
|
Jun. 30, 2024
USD ($)
|
Jun. 30, 2023
USD ($)
|
Dec. 31, 2023
USD ($)
|
| Segment Reporting Information [Line Items] |
|
|
|
|
|
|
|
|
|
|
| Tower Count |
|
40,000
|
|
|
|
40,000
|
|
|
|
|
| Fiber Miles |
|
90,000
|
|
|
|
90,000
|
|
|
|
|
| Small Cells on Air or Under Contract |
|
115,000
|
|
|
|
115,000
|
|
|
|
|
| Amortization of prepaid lease purchase price adjustments |
|
$ 4
|
|
$ 4
|
|
$ 8
|
|
$ 8
|
|
|
| Site Rental |
|
1,580
|
|
1,728
|
|
3,168
|
|
3,352
|
|
|
| Services and other |
|
46
|
|
139
|
|
99
|
|
288
|
|
|
| Segment Revenues |
|
1,626
|
|
1,867
|
|
3,267
|
|
3,640
|
|
|
| Segment site rental cost of operations |
[1] |
432
|
|
424
|
|
862
|
|
839
|
|
|
| Services and other |
[1] |
27
|
|
98
|
|
61
|
|
202
|
|
|
| Segment selling, general and administrative expenses |
|
204
|
|
210
|
|
387
|
|
405
|
|
|
| Stock-based compensation expense, net |
|
|
|
|
|
78
|
|
91
|
|
|
| Depreciation, Amortization and Accretion, Net |
|
430
|
|
445
|
|
869
|
|
876
|
|
|
| Restructuring Charges |
|
45
|
|
0
|
|
56
|
|
|
|
|
| Interest expense and amortization of deferred financing costs, net |
|
230
|
|
208
|
|
456
|
|
410
|
|
|
| Capital expenditures |
|
|
|
|
|
649
|
|
720
|
|
|
| Total Assets |
|
38,246
|
|
|
|
38,246
|
|
|
|
$ 38,527
|
| Restricted Cash and Cash Equivalents, Noncurrent |
|
5
|
|
|
|
5
|
|
|
|
$ 5
|
| Segments [Domain] |
|
|
|
|
|
|
|
|
|
|
| Segment Reporting Information [Line Items] |
|
|
|
|
|
|
|
|
|
|
| Site Rental |
|
1,580
|
|
1,728
|
|
3,168
|
|
3,352
|
|
|
| Services and other |
|
46
|
|
139
|
|
99
|
|
288
|
|
|
| Segment Revenues |
|
1,626
|
|
1,867
|
|
3,267
|
|
3,640
|
|
|
| Segment site rental cost of operations |
|
423
|
|
414
|
|
843
|
|
820
|
|
|
| Services and other |
|
25
|
|
95
|
|
58
|
|
196
|
|
|
| Segment cost of operations |
[3] |
448
|
[2] |
509
|
[2] |
901
|
[4] |
1,016
|
[4] |
|
| Segment site rental gross margin |
|
1,157
|
|
1,314
|
|
2,325
|
|
2,532
|
|
|
| Segment services gross margin |
|
21
|
|
44
|
|
41
|
|
92
|
|
|
| Segment selling, general and administrative expenses |
|
105
|
[2] |
88
|
[2] |
189
|
[4] |
170
|
[4] |
|
| Segment General and Administrative Expenses [Line Items] |
|
66
|
[2] |
81
|
[2] |
134
|
[4] |
161
|
[4] |
|
| Segment Operating Profit |
|
1,112
|
|
1,277
|
|
2,232
|
|
2,463
|
|
|
| Stock-based compensation expense, net |
|
40
|
|
50
|
|
78
|
|
91
|
|
|
| Depreciation, Amortization and Accretion, Net |
|
430
|
|
445
|
|
869
|
|
876
|
|
|
| Restructuring Charges |
|
45
|
|
0
|
|
56
|
|
0
|
|
|
| Interest expense and amortization of deferred financing costs, net |
|
230
|
|
208
|
|
456
|
|
410
|
|
|
| Other expenses to reconcile to income (loss) from continuing operations before income taxes |
[5] |
4
|
|
24
|
|
8
|
|
28
|
|
|
| Income (loss) before income taxes |
|
258
|
|
462
|
|
576
|
|
888
|
|
|
| Capital expenditures |
|
329
|
|
379
|
|
649
|
|
720
|
|
|
| Total Assets |
|
38,246
|
|
39,042
|
|
38,246
|
|
39,042
|
|
|
| Segment cost of operations share-based compensation [Member] |
|
|
|
|
|
|
|
|
|
|
| Segment Reporting Information [Line Items] |
|
|
|
|
|
|
|
|
|
|
| Stock-based compensation expense, net |
|
7
|
|
9
|
|
14
|
|
17
|
|
|
| Towers [Member] |
|
|
|
|
|
|
|
|
|
|
| Segment Reporting Information [Line Items] |
|
|
|
|
|
|
|
|
|
|
| Site Rental |
|
1,064
|
|
1,080
|
|
2,132
|
|
2,161
|
|
|
| Services and other |
|
43
|
|
124
|
|
89
|
|
270
|
|
|
| Segment Revenues |
|
1,107
|
|
1,204
|
|
2,221
|
|
2,431
|
|
|
| Segment site rental cost of operations |
|
245
|
|
243
|
|
483
|
|
477
|
|
|
| Services and other |
|
23
|
|
92
|
|
51
|
|
191
|
|
|
| Segment cost of operations |
[3] |
268
|
[2] |
335
|
[2] |
534
|
[4] |
668
|
[4] |
|
| Segment site rental gross margin |
|
819
|
|
837
|
|
1,649
|
|
1,684
|
|
|
| Segment services gross margin |
|
20
|
|
32
|
|
38
|
|
79
|
|
|
| Segment selling, general and administrative expenses |
|
16
|
[2] |
30
|
[2] |
37
|
[4] |
61
|
[4] |
|
| Segment Operating Profit |
|
823
|
|
839
|
|
1,650
|
|
1,702
|
|
|
| Restructuring Charges |
|
6
|
|
|
|
|
|
|
|
|
| Capital expenditures |
|
29
|
|
61
|
|
64
|
|
111
|
|
|
| Total Assets |
|
21,177
|
|
21,973
|
|
21,177
|
|
21,973
|
|
|
| Fiber [Member] |
|
|
|
|
|
|
|
|
|
|
| Segment Reporting Information [Line Items] |
|
|
|
|
|
|
|
|
|
|
| Site Rental |
|
516
|
|
648
|
|
1,036
|
|
1,191
|
|
|
| Services and other |
|
3
|
|
15
|
|
10
|
|
18
|
|
|
| Segment Revenues |
|
519
|
|
663
|
|
1,046
|
|
1,209
|
|
|
| Segment site rental cost of operations |
|
178
|
|
171
|
|
360
|
|
343
|
|
|
| Services and other |
|
2
|
|
3
|
|
7
|
|
5
|
|
|
| Segment cost of operations |
[3] |
180
|
[2] |
174
|
[2] |
367
|
[4] |
348
|
[4] |
|
| Segment site rental gross margin |
|
338
|
|
477
|
|
676
|
|
848
|
|
|
| Segment services gross margin |
|
1
|
|
12
|
|
3
|
|
13
|
|
|
| Segment selling, general and administrative expenses |
|
50
|
[2] |
51
|
[2] |
97
|
[4] |
100
|
[4] |
|
| Segment Operating Profit |
|
289
|
|
438
|
|
582
|
|
761
|
|
|
| Restructuring Charges |
|
31
|
|
|
|
|
|
|
|
|
| Capital expenditures |
|
289
|
|
306
|
|
562
|
|
585
|
|
|
| Total Assets |
|
16,358
|
|
16,166
|
|
16,358
|
|
16,166
|
|
|
| Corporate and Other [Member] |
|
|
|
|
|
|
|
|
|
|
| Segment Reporting Information [Line Items] |
|
|
|
|
|
|
|
|
|
|
| Segment selling, general and administrative expenses |
|
105
|
[2] |
88
|
[2] |
189
|
[4] |
170
|
[4] |
|
| Stock-based compensation expense, net |
|
40
|
|
50
|
|
78
|
|
91
|
|
|
| Depreciation, Amortization and Accretion, Net |
|
430
|
|
445
|
|
869
|
|
876
|
|
|
| Restructuring Charges |
|
45
|
|
0
|
|
56
|
|
0
|
|
|
| Interest expense and amortization of deferred financing costs, net |
|
230
|
|
208
|
|
456
|
|
410
|
|
|
| Other expenses to reconcile to income (loss) from continuing operations before income taxes |
[5] |
4
|
|
24
|
|
8
|
|
28
|
|
|
| Capital expenditures |
|
11
|
|
12
|
|
23
|
|
24
|
|
|
| Total Assets |
|
711
|
|
903
|
|
711
|
|
903
|
|
|
| Segment G&A share-based compensation [Member] |
|
|
|
|
|
|
|
|
|
|
| Segment Reporting Information [Line Items] |
|
|
|
|
|
|
|
|
|
|
| Stock-based compensation expense, net |
|
$ 33
|
|
$ 41
|
|
$ 64
|
|
$ 74
|
|
|
|
|
| X |
- DefinitionRepresents the amortization of prepaid lease purchase price adjustments for the period presented.
| Name: |
cci_AmortizationOfPrepaidLeasePurchasePriceAdjustments |
| Namespace Prefix: |
cci_ |
| Data Type: |
xbrli:monetaryItemType |
| Balance Type: |
debit |
| Period Type: |
duration |
|
| X |
- DefinitionFiber Miles that the Company owns and operates.
| Name: |
cci_FiberMiles |
| Namespace Prefix: |
cci_ |
| Data Type: |
xbrli:pureItemType |
| Balance Type: |
na |
| Period Type: |
instant |
|
| X |
- DefinitionSegment General and Administrative Expenses
| Name: |
cci_SegmentGeneralAndAdministrativeExpenses |
| Namespace Prefix: |
cci_ |
| Data Type: |
xbrli:monetaryItemType |
| Balance Type: |
debit |
| Period Type: |
duration |
|
| X |
- DefinitionSegment Operating Profit is defined as segment site rental gross margin plus segment network services and other gross margin, less general and administrative expenses attributable to the respective segment.
| Name: |
cci_SegmentOperatingProfit |
| Namespace Prefix: |
cci_ |
| Data Type: |
xbrli:monetaryItemType |
| Balance Type: |
credit |
| Period Type: |
duration |
|
| X |
- DefinitionSegment services and other gross margin is defined as segment services and other revenues less segment services and other cost of operations, which excludes stock-based compensation expense recorded in consolidated cost of operations.
| Name: |
cci_Segmentservicesandothergrossmargin |
| Namespace Prefix: |
cci_ |
| Data Type: |
xbrli:monetaryItemType |
| Balance Type: |
credit |
| Period Type: |
duration |
|
| X |
- DefinitionSegment site rental gross margin is defined as segment site rental revenues less segment site rental cost of operations, which excludes stock-based compensation expense and prepaid lease purchase price adjustments recorded in consolidated cost of operations.
| Name: |
cci_Segmentsiterentalgrossmargin |
| Namespace Prefix: |
cci_ |
| Data Type: |
xbrli:monetaryItemType |
| Balance Type: |
credit |
| Period Type: |
duration |
|
| X |
- DefinitionContains revenue from accounted under both Topic 606 (Finance leases) and Topic 842 (Operating leases)
| Name: |
cci_Siterentalrevenues |
| Namespace Prefix: |
cci_ |
| Data Type: |
xbrli:monetaryItemType |
| Balance Type: |
credit |
| Period Type: |
duration |
|
| X |
- DefinitionSmall Cells on Air or Under Contract
| Name: |
cci_SmallCellsOnAirOrUnderContract |
| Namespace Prefix: |
cci_ |
| Data Type: |
xbrli:pureItemType |
| Balance Type: |
na |
| Period Type: |
instant |
|
| X |
- DefinitionRepresents the Company's tower count. Inclusive of towers and other structures, such as rooftops
| Name: |
cci_TowerCount |
| Namespace Prefix: |
cci_ |
| Data Type: |
xbrli:pureItemType |
| Balance Type: |
na |
| Period Type: |
instant |
|
| X |
- DefinitionAmount of asset recognized for present right to economic benefit. Reference 1: http://www.xbrl.org/2003/role/exampleRef
-Topic 280
-SubTopic 10
-Name Accounting Standards Codification
-Section 55
-Paragraph 48
-Publisher FASB
-URI https://asc.fasb.org/1943274/2147482785/280-10-55-48
Reference 2: http://www.xbrl.org/2003/role/exampleRef
-Topic 280
-SubTopic 10
-Name Accounting Standards Codification
-Section 55
-Paragraph 49
-Publisher FASB
-URI https://asc.fasb.org/1943274/2147482785/280-10-55-49
Reference 3: http://www.xbrl.org/2003/role/disclosureRef
-Topic 270
-SubTopic 10
-Name Accounting Standards Codification
-Section 50
-Paragraph 1
-Subparagraph (i)
-Publisher FASB
-URI https://asc.fasb.org/1943274/2147482964/270-10-50-1
Reference 4: http://www.xbrl.org/2003/role/disclosureRef
-Topic 280
-SubTopic 10
-Name Accounting Standards Codification
-Section 50
-Paragraph 32
-Subparagraph (ee)
-Publisher FASB
-URI https://asc.fasb.org/1943274/2147482810/280-10-50-32
Reference 5: http://fasb.org/us-gaap/role/ref/otherTransitionRef
-Topic 280
-SubTopic 10
-Name Accounting Standards Codification
-Section 50
-Paragraph 32
-Subparagraph (d)
-Publisher FASB
-URI https://asc.fasb.org/1943274/2147482810/280-10-50-32
Reference 6: http://www.xbrl.org/2003/role/disclosureRef
-Topic 280
-SubTopic 10
-Name Accounting Standards Codification
-Section 50
-Paragraph 22
-Publisher FASB
-URI https://asc.fasb.org/1943274/2147482810/280-10-50-22
Reference 7: http://www.xbrl.org/2003/role/disclosureRef
-Topic 810
-SubTopic 10
-Name Accounting Standards Codification
-Section 50
-Paragraph 3
-Subparagraph (bb)
-Publisher FASB
-URI https://asc.fasb.org/1943274/2147481203/810-10-50-3
Reference 8: http://www.xbrl.org/2003/role/disclosureRef
-Topic 810
-SubTopic 10
-Name Accounting Standards Codification
-Section 45
-Paragraph 25
-Subparagraph (a)
-Publisher FASB
-URI https://asc.fasb.org/1943274/2147481231/810-10-45-25
Reference 9: http://www.xbrl.org/2003/role/disclosureRef
-Topic 235
-SubTopic 10
-Name Accounting Standards Codification
-Section S99
-Paragraph 1
-Subparagraph (SX 210.4-08(g)(1)(ii))
-Publisher FASB
-URI https://asc.fasb.org/1943274/2147480678/235-10-S99-1
Reference 10: http://www.xbrl.org/2003/role/disclosureRef
-Topic 323
-SubTopic 10
-Name Accounting Standards Codification
-Section 50
-Paragraph 3
-Subparagraph (c)
-Publisher FASB
-URI https://asc.fasb.org/1943274/2147481687/323-10-50-3
Reference 11: http://www.xbrl.org/2003/role/disclosureRef
-Topic 825
-SubTopic 10
-Name Accounting Standards Codification
-Section 50
-Paragraph 28
-Subparagraph (f)
-Publisher FASB
-URI https://asc.fasb.org/1943274/2147482907/825-10-50-28
Reference 12: http://www.xbrl.org/2003/role/exampleRef
-Topic 852
-SubTopic 10
-Name Accounting Standards Codification
-Section 55
-Paragraph 10
-Publisher FASB
-URI https://asc.fasb.org/1943274/2147481372/852-10-55-10
Reference 13: http://www.xbrl.org/2003/role/exampleRef
-Topic 946
-SubTopic 830
-Name Accounting Standards Codification
-Section 55
-Paragraph 12
-Publisher FASB
-URI https://asc.fasb.org/1943274/2147479168/946-830-55-12
Reference 14: http://www.xbrl.org/2003/role/disclosureRef
-Topic 944
-SubTopic 210
-Name Accounting Standards Codification
-Section S99
-Paragraph 1
-Subparagraph (SX 210.7-03(a)(12))
-Publisher FASB
-URI https://asc.fasb.org/1943274/2147478777/944-210-S99-1
Reference 15: http://www.xbrl.org/2003/role/disclosureRef
-Topic 946
-SubTopic 210
-Name Accounting Standards Codification
-Section S99
-Paragraph 1
-Subparagraph (SX 210.6-04(8))
-Publisher FASB
-URI https://asc.fasb.org/1943274/2147479170/946-210-S99-1
Reference 16: http://www.xbrl.org/2003/role/disclosureRef
-Topic 210
-SubTopic 10
-Name Accounting Standards Codification
-Section S99
-Paragraph 1
-Subparagraph (SX 210.5-02(18))
-Publisher FASB
-URI https://asc.fasb.org/1943274/2147480566/210-10-S99-1
Reference 17: http://www.xbrl.org/2003/role/disclosureRef
-Topic 470
-SubTopic 10
-Name Accounting Standards Codification
-Section S99
-Paragraph 1A
-Subparagraph (SX 210.13-01(a)(4)(i))
-Publisher FASB
-URI https://asc.fasb.org/1943274/2147480097/470-10-S99-1A
Reference 18: http://www.xbrl.org/2009/role/commonPracticeRef
-Topic 470
-SubTopic 10
-Name Accounting Standards Codification
-Section S99
-Paragraph 1A
-Subparagraph (SX 210.13-01(a)(4)(ii))
-Publisher FASB
-URI https://asc.fasb.org/1943274/2147480097/470-10-S99-1A
Reference 19: http://www.xbrl.org/2009/role/commonPracticeRef
-Topic 470
-SubTopic 10
-Name Accounting Standards Codification
-Section S99
-Paragraph 1A
-Subparagraph (SX 210.13-01(a)(4)(iii))
-Publisher FASB
-URI https://asc.fasb.org/1943274/2147480097/470-10-S99-1A
Reference 20: http://www.xbrl.org/2003/role/disclosureRef
-Topic 470
-SubTopic 10
-Name Accounting Standards Codification
-Section S99
-Paragraph 1A
-Subparagraph (SX 210.13-01(a)(4)(iii)(A))
-Publisher FASB
-URI https://asc.fasb.org/1943274/2147480097/470-10-S99-1A
Reference 21: http://www.xbrl.org/2003/role/disclosureRef
-Topic 470
-SubTopic 10
-Name Accounting Standards Codification
-Section S99
-Paragraph 1A
-Subparagraph (SX 210.13-01(a)(4)(iv))
-Publisher FASB
-URI https://asc.fasb.org/1943274/2147480097/470-10-S99-1A
Reference 22: http://www.xbrl.org/2003/role/disclosureRef
-Topic 470
-SubTopic 10
-Name Accounting Standards Codification
-Section S99
-Paragraph 1A
-Subparagraph (SX 210.13-01(a)(5))
-Publisher FASB
-URI https://asc.fasb.org/1943274/2147480097/470-10-S99-1A
Reference 23: http://www.xbrl.org/2003/role/disclosureRef
-Topic 470
-SubTopic 10
-Name Accounting Standards Codification
-Section S99
-Paragraph 1B
-Subparagraph (SX 210.13-02(a)(4)(i))
-Publisher FASB
-URI https://asc.fasb.org/1943274/2147480097/470-10-S99-1B
Reference 24: http://www.xbrl.org/2003/role/disclosureRef
-Topic 470
-SubTopic 10
-Name Accounting Standards Codification
-Section S99
-Paragraph 1B
-Subparagraph (SX 210.13-02(a)(4)(iii)(A))
-Publisher FASB
-URI https://asc.fasb.org/1943274/2147480097/470-10-S99-1B
Reference 25: http://www.xbrl.org/2003/role/disclosureRef
-Topic 470
-SubTopic 10
-Name Accounting Standards Codification
-Section S99
-Paragraph 1B
-Subparagraph (SX 210.13-02(a)(4)(iii)(B))
-Publisher FASB
-URI https://asc.fasb.org/1943274/2147480097/470-10-S99-1B
Reference 26: http://www.xbrl.org/2003/role/disclosureRef
-Topic 470
-SubTopic 10
-Name Accounting Standards Codification
-Section S99
-Paragraph 1B
-Subparagraph (SX 210.13-02(a)(4)(iv))
-Publisher FASB
-URI https://asc.fasb.org/1943274/2147480097/470-10-S99-1B
Reference 27: http://www.xbrl.org/2003/role/disclosureRef
-Topic 470
-SubTopic 10
-Name Accounting Standards Codification
-Section S99
-Paragraph 1B
-Subparagraph (SX 210.13-02(a)(5))
-Publisher FASB
-URI https://asc.fasb.org/1943274/2147480097/470-10-S99-1B
Reference 28: http://www.xbrl.org/2009/role/commonPracticeRef
-Topic 852
-SubTopic 10
-Name Accounting Standards Codification
-Section 50
-Paragraph 7
-Subparagraph (a)
-Publisher FASB
-URI https://asc.fasb.org/1943274/2147481404/852-10-50-7
Reference 29: http://www.xbrl.org/2003/role/disclosureRef
-Topic 280
-SubTopic 10
-Name Accounting Standards Codification
-Section 50
-Paragraph 30
-Subparagraph (c)
-Publisher FASB
-URI https://asc.fasb.org/1943274/2147482810/280-10-50-30
Reference 30: http://fasb.org/us-gaap/role/ref/legacyRef
-Topic 942
-SubTopic 210
-Name Accounting Standards Codification
-Section S99
-Paragraph 1
-Subparagraph (SX 210.9-03(11))
-Publisher FASB
-URI https://asc.fasb.org/1943274/2147478546/942-210-S99-1
| Name: |
us-gaap_Assets |
| Namespace Prefix: |
us-gaap_ |
| Data Type: |
xbrli:monetaryItemType |
| Balance Type: |
debit |
| Period Type: |
instant |
|
| X |
- DefinitionThe aggregate costs related to goods produced and sold and services rendered by an entity during the reporting period. This excludes costs incurred during the reporting period related to financial services rendered and other revenue generating activities. Reference 1: http://fasb.org/us-gaap/role/ref/legacyRef
-Topic 220
-SubTopic 10
-Name Accounting Standards Codification
-Section S99
-Paragraph 2
-Subparagraph (SX 210.5-03(2)(d))
-Publisher FASB
-URI https://asc.fasb.org/1943274/2147483621/220-10-S99-2
Reference 2: http://fasb.org/us-gaap/role/ref/legacyRef
-Topic 220
-SubTopic 10
-Name Accounting Standards Codification
-Section S99
-Paragraph 2
-Subparagraph (SX 210.5-03(2)(a))
-Publisher FASB
-URI https://asc.fasb.org/1943274/2147483621/220-10-S99-2
Reference 3: http://www.xbrl.org/2003/role/disclosureRef
-Topic 924
-SubTopic 10
-Name Accounting Standards Codification
-Section S99
-Paragraph 1
-Subparagraph (SAB Topic 11.L)
-Publisher FASB
-URI https://asc.fasb.org/1943274/2147479941/924-10-S99-1
| Name: |
us-gaap_CostOfGoodsAndServicesSold |
| Namespace Prefix: |
us-gaap_ |
| Data Type: |
xbrli:monetaryItemType |
| Balance Type: |
debit |
| Period Type: |
duration |
|
| X |
- DefinitionThe aggregate cost of goods produced and sold and services rendered during the reporting period. Reference 1: http://www.xbrl.org/2003/role/exampleRef
-Topic 280
-SubTopic 10
-Name Accounting Standards Codification
-Section 55
-Paragraph 48
-Publisher FASB
-URI https://asc.fasb.org/1943274/2147482785/280-10-55-48
Reference 2: http://fasb.org/us-gaap/role/ref/legacyRef
-Topic 220
-SubTopic 10
-Name Accounting Standards Codification
-Section S99
-Paragraph 2
-Subparagraph (SX 210.5-03(2))
-Publisher FASB
-URI https://asc.fasb.org/1943274/2147483621/220-10-S99-2
Reference 3: http://www.xbrl.org/2003/role/disclosureRef
-Topic 235
-SubTopic 10
-Name Accounting Standards Codification
-Section S99
-Paragraph 1
-Subparagraph (SX 210.4-08(g)(1)(ii))
-Publisher FASB
-URI https://asc.fasb.org/1943274/2147480678/235-10-S99-1
Reference 4: http://www.xbrl.org/2003/role/disclosureRef
-Topic 323
-SubTopic 10
-Name Accounting Standards Codification
-Section 50
-Paragraph 3
-Subparagraph (c)
-Publisher FASB
-URI https://asc.fasb.org/1943274/2147481687/323-10-50-3
Reference 5: http://www.xbrl.org/2003/role/disclosureRef
-Topic 825
-SubTopic 10
-Name Accounting Standards Codification
-Section 50
-Paragraph 28
-Subparagraph (f)
-Publisher FASB
-URI https://asc.fasb.org/1943274/2147482907/825-10-50-28
Reference 6: http://www.xbrl.org/2003/role/disclosureRef
-Topic 470
-SubTopic 10
-Name Accounting Standards Codification
-Section S99
-Paragraph 1A
-Subparagraph (SX 210.13-01(a)(4)(i))
-Publisher FASB
-URI https://asc.fasb.org/1943274/2147480097/470-10-S99-1A
Reference 7: http://www.xbrl.org/2009/role/commonPracticeRef
-Topic 470
-SubTopic 10
-Name Accounting Standards Codification
-Section S99
-Paragraph 1A
-Subparagraph (SX 210.13-01(a)(4)(ii))
-Publisher FASB
-URI https://asc.fasb.org/1943274/2147480097/470-10-S99-1A
Reference 8: http://www.xbrl.org/2003/role/disclosureRef
-Topic 470
-SubTopic 10
-Name Accounting Standards Codification
-Section S99
-Paragraph 1A
-Subparagraph (SX 210.13-01(a)(4)(iii)(A))
-Publisher FASB
-URI https://asc.fasb.org/1943274/2147480097/470-10-S99-1A
Reference 9: http://www.xbrl.org/2003/role/disclosureRef
-Topic 470
-SubTopic 10
-Name Accounting Standards Codification
-Section S99
-Paragraph 1A
-Subparagraph (SX 210.13-01(a)(4)(iv))
-Publisher FASB
-URI https://asc.fasb.org/1943274/2147480097/470-10-S99-1A
Reference 10: http://www.xbrl.org/2003/role/disclosureRef
-Topic 470
-SubTopic 10
-Name Accounting Standards Codification
-Section S99
-Paragraph 1A
-Subparagraph (SX 210.13-01(a)(5))
-Publisher FASB
-URI https://asc.fasb.org/1943274/2147480097/470-10-S99-1A
Reference 11: http://www.xbrl.org/2003/role/disclosureRef
-Topic 470
-SubTopic 10
-Name Accounting Standards Codification
-Section S99
-Paragraph 1B
-Subparagraph (SX 210.13-02(a)(4)(i))
-Publisher FASB
-URI https://asc.fasb.org/1943274/2147480097/470-10-S99-1B
Reference 12: http://www.xbrl.org/2003/role/disclosureRef
-Topic 470
-SubTopic 10
-Name Accounting Standards Codification
-Section S99
-Paragraph 1B
-Subparagraph (SX 210.13-02(a)(4)(iii)(A))
-Publisher FASB
-URI https://asc.fasb.org/1943274/2147480097/470-10-S99-1B
Reference 13: http://www.xbrl.org/2003/role/disclosureRef
-Topic 470
-SubTopic 10
-Name Accounting Standards Codification
-Section S99
-Paragraph 1B
-Subparagraph (SX 210.13-02(a)(4)(iii)(B))
-Publisher FASB
-URI https://asc.fasb.org/1943274/2147480097/470-10-S99-1B
Reference 14: http://www.xbrl.org/2003/role/disclosureRef
-Topic 470
-SubTopic 10
-Name Accounting Standards Codification
-Section S99
-Paragraph 1B
-Subparagraph (SX 210.13-02(a)(4)(iv))
-Publisher FASB
-URI https://asc.fasb.org/1943274/2147480097/470-10-S99-1B
Reference 15: http://www.xbrl.org/2003/role/disclosureRef
-Topic 470
-SubTopic 10
-Name Accounting Standards Codification
-Section S99
-Paragraph 1B
-Subparagraph (SX 210.13-02(a)(5))
-Publisher FASB
-URI https://asc.fasb.org/1943274/2147480097/470-10-S99-1B
| Name: |
us-gaap_CostOfRevenue |
| Namespace Prefix: |
us-gaap_ |
| Data Type: |
xbrli:monetaryItemType |
| Balance Type: |
debit |
| Period Type: |
duration |
|
| X |
- DefinitionThe aggregate net amount of depreciation, amortization, and accretion recognized during an accounting period. As a noncash item, the net amount is added back to net income when calculating cash provided by or used in operations using the indirect method. Reference 1: http://fasb.org/us-gaap/role/ref/legacyRef
-Name Accounting Standards Codification
-Section 45
-Paragraph 28
-Subparagraph (b)
-SubTopic 10
-Topic 230
-Publisher FASB
-URI https://asc.fasb.org/1943274/2147482740/230-10-45-28
| Name: |
us-gaap_DepreciationAmortizationAndAccretionNet |
| Namespace Prefix: |
us-gaap_ |
| Data Type: |
xbrli:monetaryItemType |
| Balance Type: |
debit |
| Period Type: |
duration |
|
| X |
- DefinitionAmount of expense incurred and directly related to generating revenue by lessor from operating lease of rented property and equipment. Reference 1: http://www.xbrl.org/2009/role/commonPracticeRef
-Name Accounting Standards Codification
-Section S99
-Paragraph 2
-Subparagraph (SX 210.5-03(2)(c))
-SubTopic 10
-Topic 220
-Publisher FASB
-URI https://asc.fasb.org/1943274/2147483621/220-10-S99-2
| Name: |
us-gaap_DirectCostsOfLeasedAndRentedPropertyOrEquipment |
| Namespace Prefix: |
us-gaap_ |
| Data Type: |
xbrli:monetaryItemType |
| Balance Type: |
debit |
| Period Type: |
duration |
|
| X |
- DefinitionAmount of the cost of borrowed funds accounted for as interest expense for debt. Reference 1: http://fasb.org/us-gaap/role/ref/legacyRef
-Topic 220
-SubTopic 10
-Name Accounting Standards Codification
-Section S99
-Paragraph 2
-Subparagraph (SX 210.5-03(8))
-Publisher FASB
-URI https://asc.fasb.org/1943274/2147483621/220-10-S99-2
Reference 2: http://www.xbrl.org/2003/role/exampleRef
-Topic 470
-SubTopic 20
-Name Accounting Standards Codification
-Section 55
-Paragraph 69E
-Publisher FASB
-URI https://asc.fasb.org/1943274/2147481568/470-20-55-69E
Reference 3: http://www.xbrl.org/2003/role/exampleRef
-Topic 470
-SubTopic 20
-Name Accounting Standards Codification
-Section 55
-Paragraph 69F
-Publisher FASB
-URI https://asc.fasb.org/1943274/2147481568/470-20-55-69F
Reference 4: http://www.xbrl.org/2003/role/disclosureRef
-Topic 470
-SubTopic 20
-Name Accounting Standards Codification
-Section 50
-Paragraph 1F
-Subparagraph (b)
-Publisher FASB
-URI https://asc.fasb.org/1943274/2147481139/470-20-50-1F
Reference 5: http://www.xbrl.org/2003/role/disclosureRef
-Topic 470
-SubTopic 20
-Name Accounting Standards Codification
-Section 50
-Paragraph 6
-Subparagraph (b)
-Publisher FASB
-URI https://asc.fasb.org/1943274/2147481139/470-20-50-6
| Name: |
us-gaap_InterestExpenseDebt |
| Namespace Prefix: |
us-gaap_ |
| Data Type: |
xbrli:monetaryItemType |
| Balance Type: |
debit |
| Period Type: |
duration |
|
| X |
- DefinitionAmount of expense classified as other. Reference 1: http://fasb.org/us-gaap/role/ref/legacyRef
-Topic 220
-SubTopic 10
-Name Accounting Standards Codification
-Section S99
-Paragraph 2
-Subparagraph (SX 210.5-03(6))
-Publisher FASB
-URI https://asc.fasb.org/1943274/2147483621/220-10-S99-2
Reference 2: http://fasb.org/us-gaap/role/ref/legacyRef
-Topic 220
-SubTopic 10
-Name Accounting Standards Codification
-Section S99
-Paragraph 2
-Subparagraph (SX 210.5-03(4))
-Publisher FASB
-URI https://asc.fasb.org/1943274/2147483621/220-10-S99-2
| Name: |
us-gaap_OtherExpenses |
| Namespace Prefix: |
us-gaap_ |
| Data Type: |
xbrli:monetaryItemType |
| Balance Type: |
debit |
| Period Type: |
duration |
|
| X |
- DefinitionThe cash outflow for purchases of and capital improvements on property, plant and equipment (capital expenditures), software, and other intangible assets. Reference 1: http://www.xbrl.org/2009/role/commonPracticeRef
-Topic 805
-SubTopic 50
-Name Accounting Standards Codification
-Section 25
-Paragraph 1
-Publisher FASB
-URI https://asc.fasb.org/1943274/2147480060/805-50-25-1
Reference 2: http://www.xbrl.org/2009/role/commonPracticeRef
-Topic 805
-SubTopic 50
-Name Accounting Standards Codification
-Section 30
-Paragraph 1
-Publisher FASB
-URI https://asc.fasb.org/1943274/2147480027/805-50-30-1
Reference 3: http://www.xbrl.org/2009/role/commonPracticeRef
-Topic 805
-SubTopic 50
-Name Accounting Standards Codification
-Section 30
-Paragraph 2
-Publisher FASB
-URI https://asc.fasb.org/1943274/2147480027/805-50-30-2
Reference 4: http://www.xbrl.org/2003/role/disclosureRef
-Name Accounting Standards Codification
-Section 45
-Paragraph 13
-Subparagraph (c)
-SubTopic 10
-Topic 230
-Publisher FASB
-URI https://asc.fasb.org/1943274/2147482740/230-10-45-13
| Name: |
us-gaap_PaymentsToAcquireProductiveAssets |
| Namespace Prefix: |
us-gaap_ |
| Data Type: |
xbrli:monetaryItemType |
| Balance Type: |
credit |
| Period Type: |
duration |
|
| X |
- DefinitionAmount of cash and cash equivalents restricted as to withdrawal or usage, classified as noncurrent. Cash includes, but is not limited to, currency on hand, demand deposits with banks or financial institutions, and other accounts with general characteristics of demand deposits. Cash equivalents include, but are not limited to, short-term, highly liquid investments that are both readily convertible to known amounts of cash and so near their maturity that they present insignificant risk of changes in value because of changes in interest rates. Reference 1: http://www.xbrl.org/2003/role/disclosureRef
-Topic 230
-SubTopic 10
-Name Accounting Standards Codification
-Section 50
-Paragraph 8
-Publisher FASB
-URI https://asc.fasb.org/1943274/2147482913/230-10-50-8
Reference 2: http://fasb.org/us-gaap/role/ref/legacyRef
-Name Accounting Standards Codification
-Topic 230
-SubTopic 10
-Section 45
-Paragraph 4
-Publisher FASB
-URI https://asc.fasb.org/1943274/2147482740/230-10-45-4
Reference 3: http://www.xbrl.org/2003/role/disclosureRef
-Name Accounting Standards Codification
-Section 45
-Paragraph 5
-SubTopic 210
-Topic 954
-Publisher FASB
-URI https://asc.fasb.org/1943274/2147477220/954-210-45-5
| Name: |
us-gaap_RestrictedCashAndCashEquivalentsNoncurrent |
| Namespace Prefix: |
us-gaap_ |
| Data Type: |
xbrli:monetaryItemType |
| Balance Type: |
debit |
| Period Type: |
instant |
|
| X |
- DefinitionAmount of expenses associated with exit or disposal activities pursuant to an authorized plan. Excludes expenses related to a discontinued operation or an asset retirement obligation. Reference 1: http://fasb.org/us-gaap/role/ref/legacyRef
-Name Accounting Standards Codification
-Section 45
-Paragraph 28
-Subparagraph (b)
-SubTopic 10
-Topic 230
-Publisher FASB
-URI https://asc.fasb.org/1943274/2147482740/230-10-45-28
Reference 2: http://www.xbrl.org/2003/role/disclosureRef
-Topic 420
-SubTopic 10
-Name Accounting Standards Codification
-Section S99
-Paragraph 2
-Subparagraph (SAB Topic 5.P.4.b.1)
-Publisher FASB
-URI https://asc.fasb.org/1943274/2147479823/420-10-S99-2
Reference 3: http://www.xbrl.org/2009/role/commonPracticeRef
-Topic 420
-SubTopic 10
-Name Accounting Standards Codification
-Section 45
-Paragraph 3
-Publisher FASB
-URI https://asc.fasb.org/1943274/2147482047/420-10-45-3
Reference 4: http://www.xbrl.org/2003/role/disclosureRef
-Topic 420
-SubTopic 10
-Name Accounting Standards Codification
-Section S99
-Paragraph 1
-Subparagraph (SAB Topic 5.P.3)
-Publisher FASB
-URI https://asc.fasb.org/1943274/2147479823/420-10-S99-1
| Name: |
us-gaap_RestructuringCharges |
| Namespace Prefix: |
us-gaap_ |
| Data Type: |
xbrli:monetaryItemType |
| Balance Type: |
debit |
| Period Type: |
duration |
|
| X |
- DefinitionAmount, excluding tax collected from customer, of revenue from satisfaction of performance obligation by transferring promised good or service to customer. Tax collected from customer is tax assessed by governmental authority that is both imposed on and concurrent with specific revenue-producing transaction, including, but not limited to, sales, use, value added and excise. Reference 1: http://www.xbrl.org/2003/role/disclosureRef
-Topic 280
-SubTopic 10
-Name Accounting Standards Codification
-Section 50
-Paragraph 41
-Subparagraph (a)
-Publisher FASB
-URI https://asc.fasb.org/1943274/2147482810/280-10-50-41
Reference 2: http://www.xbrl.org/2003/role/disclosureRef
-Topic 270
-SubTopic 10
-Name Accounting Standards Codification
-Section 50
-Paragraph 1
-Subparagraph (i)
-Publisher FASB
-URI https://asc.fasb.org/1943274/2147482964/270-10-50-1
Reference 3: http://www.xbrl.org/2003/role/disclosureRef
-Topic 280
-SubTopic 10
-Name Accounting Standards Codification
-Section 50
-Paragraph 32
-Subparagraph (ee)
-Publisher FASB
-URI https://asc.fasb.org/1943274/2147482810/280-10-50-32
Reference 4: http://fasb.org/us-gaap/role/ref/otherTransitionRef
-Topic 280
-SubTopic 10
-Name Accounting Standards Codification
-Section 50
-Paragraph 32
-Subparagraph (b)
-Publisher FASB
-URI https://asc.fasb.org/1943274/2147482810/280-10-50-32
Reference 5: http://fasb.org/us-gaap/role/ref/otherTransitionRef
-Topic 280
-SubTopic 10
-Name Accounting Standards Codification
-Section 50
-Paragraph 32
-Subparagraph (a)
-Publisher FASB
-URI https://asc.fasb.org/1943274/2147482810/280-10-50-32
Reference 6: http://www.xbrl.org/2003/role/disclosureRef
-Topic 924
-SubTopic 10
-Name Accounting Standards Codification
-Section S99
-Paragraph 1
-Subparagraph (SAB Topic 11.L)
-Publisher FASB
-URI https://asc.fasb.org/1943274/2147479941/924-10-S99-1
Reference 7: http://www.xbrl.org/2003/role/disclosureRef
-Topic 606
-SubTopic 10
-Name Accounting Standards Codification
-Section 50
-Paragraph 5
-Publisher FASB
-URI https://asc.fasb.org/1943274/2147479806/606-10-50-5
Reference 8: http://www.xbrl.org/2003/role/disclosureRef
-Topic 280
-SubTopic 10
-Name Accounting Standards Codification
-Section 50
-Paragraph 30
-Subparagraph (a)
-Publisher FASB
-URI https://asc.fasb.org/1943274/2147482810/280-10-50-30
Reference 9: http://www.xbrl.org/2003/role/disclosureRef
-Topic 280
-SubTopic 10
-Name Accounting Standards Codification
-Section 50
-Paragraph 42
-Publisher FASB
-URI https://asc.fasb.org/1943274/2147482810/280-10-50-42
Reference 10: http://www.xbrl.org/2003/role/disclosureRef
-Topic 280
-SubTopic 10
-Name Accounting Standards Codification
-Section 50
-Paragraph 22
-Subparagraph (b)
-Publisher FASB
-URI https://asc.fasb.org/1943274/2147482810/280-10-50-22
Reference 11: http://www.xbrl.org/2003/role/disclosureRef
-Topic 280
-SubTopic 10
-Name Accounting Standards Codification
-Section 50
-Paragraph 40
-Publisher FASB
-URI https://asc.fasb.org/1943274/2147482810/280-10-50-40
Reference 12: http://www.xbrl.org/2003/role/disclosureRef
-Topic 280
-SubTopic 10
-Name Accounting Standards Codification
-Section 50
-Paragraph 22
-Subparagraph (a)
-Publisher FASB
-URI https://asc.fasb.org/1943274/2147482810/280-10-50-22
Reference 13: http://www.xbrl.org/2003/role/disclosureRef
-Topic 606
-SubTopic 10
-Name Accounting Standards Codification
-Section 50
-Paragraph 4
-Subparagraph (a)
-Publisher FASB
-URI https://asc.fasb.org/1943274/2147479806/606-10-50-4
| Name: |
us-gaap_RevenueFromContractWithCustomerExcludingAssessedTax |
| Namespace Prefix: |
us-gaap_ |
| Data Type: |
xbrli:monetaryItemType |
| Balance Type: |
credit |
| Period Type: |
duration |
|
| X |
- DefinitionAmount of revenue recognized from goods sold, services rendered, insurance premiums, or other activities that constitute an earning process. Includes, but is not limited to, investment and interest income before deduction of interest expense when recognized as a component of revenue, and sales and trading gain (loss). Reference 1: http://www.xbrl.org/2003/role/exampleRef
-Topic 280
-SubTopic 10
-Name Accounting Standards Codification
-Section 55
-Paragraph 48
-Publisher FASB
-URI https://asc.fasb.org/1943274/2147482785/280-10-55-48
Reference 2: http://www.xbrl.org/2003/role/disclosureRef
-Topic 280
-SubTopic 10
-Name Accounting Standards Codification
-Section 50
-Paragraph 41
-Subparagraph (a)
-Publisher FASB
-URI https://asc.fasb.org/1943274/2147482810/280-10-50-41
Reference 3: http://www.xbrl.org/2003/role/disclosureRef
-Topic 270
-SubTopic 10
-Name Accounting Standards Codification
-Section 50
-Paragraph 1
-Subparagraph (i)
-Publisher FASB
-URI https://asc.fasb.org/1943274/2147482964/270-10-50-1
Reference 4: http://www.xbrl.org/2003/role/disclosureRef
-Topic 280
-SubTopic 10
-Name Accounting Standards Codification
-Section 50
-Paragraph 32
-Subparagraph (ee)
-Publisher FASB
-URI https://asc.fasb.org/1943274/2147482810/280-10-50-32
Reference 5: http://fasb.org/us-gaap/role/ref/otherTransitionRef
-Topic 280
-SubTopic 10
-Name Accounting Standards Codification
-Section 50
-Paragraph 32
-Subparagraph (b)
-Publisher FASB
-URI https://asc.fasb.org/1943274/2147482810/280-10-50-32
Reference 6: http://fasb.org/us-gaap/role/ref/otherTransitionRef
-Topic 280
-SubTopic 10
-Name Accounting Standards Codification
-Section 50
-Paragraph 32
-Subparagraph (a)
-Publisher FASB
-URI https://asc.fasb.org/1943274/2147482810/280-10-50-32
Reference 7: http://www.xbrl.org/2003/role/disclosureRef
-Topic 235
-SubTopic 10
-Name Accounting Standards Codification
-Section S99
-Paragraph 1
-Subparagraph (SX 210.4-08(g)(1)(ii))
-Publisher FASB
-URI https://asc.fasb.org/1943274/2147480678/235-10-S99-1
Reference 8: http://www.xbrl.org/2003/role/disclosureRef
-Topic 323
-SubTopic 10
-Name Accounting Standards Codification
-Section 50
-Paragraph 3
-Subparagraph (c)
-Publisher FASB
-URI https://asc.fasb.org/1943274/2147481687/323-10-50-3
Reference 9: http://www.xbrl.org/2003/role/disclosureRef
-Topic 825
-SubTopic 10
-Name Accounting Standards Codification
-Section 50
-Paragraph 28
-Subparagraph (f)
-Publisher FASB
-URI https://asc.fasb.org/1943274/2147482907/825-10-50-28
Reference 10: http://www.xbrl.org/2003/role/disclosureRef
-Topic 470
-SubTopic 10
-Name Accounting Standards Codification
-Section S99
-Paragraph 1A
-Subparagraph (SX 210.13-01(a)(4)(i))
-Publisher FASB
-URI https://asc.fasb.org/1943274/2147480097/470-10-S99-1A
Reference 11: http://www.xbrl.org/2009/role/commonPracticeRef
-Topic 470
-SubTopic 10
-Name Accounting Standards Codification
-Section S99
-Paragraph 1A
-Subparagraph (SX 210.13-01(a)(4)(ii))
-Publisher FASB
-URI https://asc.fasb.org/1943274/2147480097/470-10-S99-1A
Reference 12: http://www.xbrl.org/2003/role/disclosureRef
-Topic 470
-SubTopic 10
-Name Accounting Standards Codification
-Section S99
-Paragraph 1A
-Subparagraph (SX 210.13-01(a)(4)(iii)(A))
-Publisher FASB
-URI https://asc.fasb.org/1943274/2147480097/470-10-S99-1A
Reference 13: http://www.xbrl.org/2003/role/disclosureRef
-Topic 470
-SubTopic 10
-Name Accounting Standards Codification
-Section S99
-Paragraph 1A
-Subparagraph (SX 210.13-01(a)(4)(iv))
-Publisher FASB
-URI https://asc.fasb.org/1943274/2147480097/470-10-S99-1A
Reference 14: http://www.xbrl.org/2003/role/disclosureRef
-Topic 470
-SubTopic 10
-Name Accounting Standards Codification
-Section S99
-Paragraph 1A
-Subparagraph (SX 210.13-01(a)(5))
-Publisher FASB
-URI https://asc.fasb.org/1943274/2147480097/470-10-S99-1A
Reference 15: http://www.xbrl.org/2003/role/disclosureRef
-Topic 470
-SubTopic 10
-Name Accounting Standards Codification
-Section S99
-Paragraph 1B
-Subparagraph (SX 210.13-02(a)(4)(i))
-Publisher FASB
-URI https://asc.fasb.org/1943274/2147480097/470-10-S99-1B
Reference 16: http://www.xbrl.org/2003/role/disclosureRef
-Topic 470
-SubTopic 10
-Name Accounting Standards Codification
-Section S99
-Paragraph 1B
-Subparagraph (SX 210.13-02(a)(4)(iii)(A))
-Publisher FASB
-URI https://asc.fasb.org/1943274/2147480097/470-10-S99-1B
Reference 17: http://www.xbrl.org/2003/role/disclosureRef
-Topic 470
-SubTopic 10
-Name Accounting Standards Codification
-Section S99
-Paragraph 1B
-Subparagraph (SX 210.13-02(a)(4)(iii)(B))
-Publisher FASB
-URI https://asc.fasb.org/1943274/2147480097/470-10-S99-1B
Reference 18: http://www.xbrl.org/2003/role/disclosureRef
-Topic 470
-SubTopic 10
-Name Accounting Standards Codification
-Section S99
-Paragraph 1B
-Subparagraph (SX 210.13-02(a)(4)(iv))
-Publisher FASB
-URI https://asc.fasb.org/1943274/2147480097/470-10-S99-1B
Reference 19: http://www.xbrl.org/2003/role/disclosureRef
-Topic 470
-SubTopic 10
-Name Accounting Standards Codification
-Section S99
-Paragraph 1B
-Subparagraph (SX 210.13-02(a)(5))
-Publisher FASB
-URI https://asc.fasb.org/1943274/2147480097/470-10-S99-1B
Reference 20: http://www.xbrl.org/2003/role/disclosureRef
-Topic 280
-SubTopic 10
-Name Accounting Standards Codification
-Section 50
-Paragraph 30
-Subparagraph (a)
-Publisher FASB
-URI https://asc.fasb.org/1943274/2147482810/280-10-50-30
Reference 21: http://www.xbrl.org/2003/role/disclosureRef
-Topic 280
-SubTopic 10
-Name Accounting Standards Codification
-Section 50
-Paragraph 42
-Publisher FASB
-URI https://asc.fasb.org/1943274/2147482810/280-10-50-42
Reference 22: http://www.xbrl.org/2003/role/disclosureRef
-Topic 280
-SubTopic 10
-Name Accounting Standards Codification
-Section 50
-Paragraph 22
-Subparagraph (b)
-Publisher FASB
-URI https://asc.fasb.org/1943274/2147482810/280-10-50-22
Reference 23: http://www.xbrl.org/2003/role/disclosureRef
-Topic 280
-SubTopic 10
-Name Accounting Standards Codification
-Section 50
-Paragraph 40
-Publisher FASB
-URI https://asc.fasb.org/1943274/2147482810/280-10-50-40
Reference 24: http://www.xbrl.org/2003/role/disclosureRef
-Topic 280
-SubTopic 10
-Name Accounting Standards Codification
-Section 50
-Paragraph 22
-Subparagraph (a)
-Publisher FASB
-URI https://asc.fasb.org/1943274/2147482810/280-10-50-22
Reference 25: http://www.xbrl.org/2003/role/disclosureRef
-Topic 942
-SubTopic 235
-Name Accounting Standards Codification
-Section S99
-Paragraph 1
-Subparagraph (SX 210.9-05(b)(2))
-Publisher FASB
-URI https://asc.fasb.org/1943274/2147477314/942-235-S99-1
Reference 26: http://www.xbrl.org/2003/role/disclosureRef
-Topic 220
-SubTopic 10
-Name Accounting Standards Codification
-Section S99
-Paragraph 2
-Subparagraph (SX 210.5-03(1))
-Publisher FASB
-URI https://asc.fasb.org/1943274/2147483621/220-10-S99-2
| Name: |
us-gaap_Revenues |
| Namespace Prefix: |
us-gaap_ |
| Data Type: |
xbrli:monetaryItemType |
| Balance Type: |
credit |
| Period Type: |
duration |
|
| X |
- DefinitionThe aggregate total costs related to selling a firm's product and services, as well as all other general and administrative expenses. Direct selling expenses (for example, credit, warranty, and advertising) are expenses that can be directly linked to the sale of specific products. Indirect selling expenses are expenses that cannot be directly linked to the sale of specific products, for example telephone expenses, Internet, and postal charges. General and administrative expenses include salaries of non-sales personnel, rent, utilities, communication, etc. Reference 1: http://fasb.org/us-gaap/role/ref/legacyRef
-Topic 220
-SubTopic 10
-Name Accounting Standards Codification
-Section S99
-Paragraph 2
-Subparagraph (SX 210.5-03(4))
-Publisher FASB
-URI https://asc.fasb.org/1943274/2147483621/220-10-S99-2
| Name: |
us-gaap_SellingGeneralAndAdministrativeExpense |
| Namespace Prefix: |
us-gaap_ |
| Data Type: |
xbrli:monetaryItemType |
| Balance Type: |
debit |
| Period Type: |
duration |
|
| X |
- DefinitionAmount of noncash expense for share-based payment arrangement. Reference 1: http://fasb.org/us-gaap/role/ref/legacyRef
-Name Accounting Standards Codification
-Section 45
-Paragraph 28
-Subparagraph (a)
-SubTopic 10
-Topic 230
-Publisher FASB
-URI https://asc.fasb.org/1943274/2147482740/230-10-45-28
| Name: |
us-gaap_ShareBasedCompensation |
| Namespace Prefix: |
us-gaap_ |
| Data Type: |
xbrli:monetaryItemType |
| Balance Type: |
debit |
| Period Type: |
duration |
|
| X |
- Details
| Name: |
srt_ConsolidatedEntitiesAxis=us-gaap_SegmentDomain |
| Namespace Prefix: |
|
| Data Type: |
na |
| Balance Type: |
|
| Period Type: |
|
|
| X |
- Details
| Name: |
us-gaap_StatementBusinessSegmentsAxis=cci_SegmentcostofoperationssharebasedcompensationMember |
| Namespace Prefix: |
|
| Data Type: |
na |
| Balance Type: |
|
| Period Type: |
|
|
| X |
- Details
| Name: |
us-gaap_StatementBusinessSegmentsAxis=cci_TowersMember |
| Namespace Prefix: |
|
| Data Type: |
na |
| Balance Type: |
|
| Period Type: |
|
|
| X |
- Details
| Name: |
us-gaap_StatementBusinessSegmentsAxis=cci_FiberMember |
| Namespace Prefix: |
|
| Data Type: |
na |
| Balance Type: |
|
| Period Type: |
|
|
| X |
- Details
| Name: |
us-gaap_StatementBusinessSegmentsAxis=us-gaap_CorporateAndOtherMember |
| Namespace Prefix: |
|
| Data Type: |
na |
| Balance Type: |
|
| Period Type: |
|
|
| X |
- Details
| Name: |
us-gaap_StatementBusinessSegmentsAxis=cci_SegmentGAsharebasedcompensationMember |
| Namespace Prefix: |
|
| Data Type: |
na |
| Balance Type: |
|
| Period Type: |
|
|
v3.24.2
| X |
- DefinitionIncrease (Decrease) in accounts payable for purchases of property and equipment
| Name: |
cci_IncreaseDecreaseinaccountspayableforpurchasesofpropertyandequipment |
| Namespace Prefix: |
cci_ |
| Data Type: |
xbrli:monetaryItemType |
| Balance Type: |
credit |
| Period Type: |
duration |
|
| X |
- DefinitionPurchase of property and equipment under capital leases and installment purchases
| Name: |
cci_Purchaseofpropertyandequipmentundercapitalleasesandinstallmentpurchases |
| Namespace Prefix: |
cci_ |
| Data Type: |
xbrli:monetaryItemType |
| Balance Type: |
credit |
| Period Type: |
duration |
|
| X |
- DefinitionAmount of currency on hand as well as demand deposits with banks or financial institutions. Includes other kinds of accounts that have the general characteristics of demand deposits. Also includes short-term, highly liquid investments that are both readily convertible to known amounts of cash and so near their maturity that they present insignificant risk of changes in value because of changes in interest rates. Excludes cash and cash equivalents within disposal group and discontinued operation. Reference 1: http://www.xbrl.org/2003/role/disclosureRef
-Topic 210
-SubTopic 10
-Name Accounting Standards Codification
-Section S99
-Paragraph 1
-Subparagraph (SX 210.5-02(1))
-Publisher FASB
-URI https://asc.fasb.org/1943274/2147480566/210-10-S99-1
Reference 2: http://www.xbrl.org/2003/role/exampleRef
-Topic 210
-SubTopic 10
-Name Accounting Standards Codification
-Section 45
-Paragraph 1
-Subparagraph (a)
-Publisher FASB
-URI https://asc.fasb.org/1943274/2147483467/210-10-45-1
Reference 3: http://fasb.org/us-gaap/role/ref/legacyRef
-Name Accounting Standards Codification
-Topic 230
-SubTopic 10
-Section 45
-Paragraph 4
-Publisher FASB
-URI https://asc.fasb.org/1943274/2147482740/230-10-45-4
| Name: |
us-gaap_CashAndCashEquivalentsAtCarryingValue |
| Namespace Prefix: |
us-gaap_ |
| Data Type: |
xbrli:monetaryItemType |
| Balance Type: |
debit |
| Period Type: |
instant |
|
| X |
- DefinitionAmount of cash and cash equivalents, and cash and cash equivalents restricted to withdrawal or usage. Excludes amount for disposal group and discontinued operations. Cash includes, but is not limited to, currency on hand, demand deposits with banks or financial institutions, and other accounts with general characteristics of demand deposits. Cash equivalents include, but are not limited to, short-term, highly liquid investments that are both readily convertible to known amounts of cash and so near their maturity that they present insignificant risk of changes in value because of changes in interest rates. Reference 1: http://www.xbrl.org/2003/role/disclosureRef
-Topic 230
-SubTopic 10
-Name Accounting Standards Codification
-Section 50
-Paragraph 8
-Publisher FASB
-URI https://asc.fasb.org/1943274/2147482913/230-10-50-8
Reference 2: http://fasb.org/us-gaap/role/ref/legacyRef
-Topic 230
-SubTopic 10
-Name Accounting Standards Codification
-Section 45
-Paragraph 24
-Publisher FASB
-URI https://asc.fasb.org/1943274/2147482740/230-10-45-24
Reference 3: http://fasb.org/us-gaap/role/ref/legacyRef
-Name Accounting Standards Codification
-Topic 230
-SubTopic 10
-Section 45
-Paragraph 4
-Publisher FASB
-URI https://asc.fasb.org/1943274/2147482740/230-10-45-4
| Name: |
us-gaap_CashCashEquivalentsRestrictedCashAndRestrictedCashEquivalents |
| Namespace Prefix: |
us-gaap_ |
| Data Type: |
xbrli:monetaryItemType |
| Balance Type: |
debit |
| Period Type: |
instant |
|
| X |
- DefinitionAmount of cost capitalized for award under share-based payment arrangement. Reference 1: http://www.xbrl.org/2003/role/disclosureRef
-Topic 718
-SubTopic 10
-Name Accounting Standards Codification
-Section 50
-Paragraph 2
-Subparagraph (h)(1)(ii)
-Publisher FASB
-URI https://asc.fasb.org/1943274/2147480429/718-10-50-2
| Name: |
us-gaap_EmployeeServiceShareBasedCompensationAllocationOfRecognizedPeriodCostsCapitalizedAmount |
| Namespace Prefix: |
us-gaap_ |
| Data Type: |
xbrli:monetaryItemType |
| Balance Type: |
debit |
| Period Type: |
duration |
|
| X |
- DefinitionAmount of cash paid for interest, excluding capitalized interest, classified as operating activity. Includes, but is not limited to, payment to settle zero-coupon bond for accreted interest of debt discount and debt instrument with insignificant coupon interest rate in relation to effective interest rate of borrowing attributable to accreted interest of debt discount. Reference 1: http://www.xbrl.org/2003/role/disclosureRef
-Topic 230
-SubTopic 10
-Name Accounting Standards Codification
-Section 45
-Paragraph 17
-Subparagraph (d)
-Publisher FASB
-URI https://asc.fasb.org/1943274/2147482740/230-10-45-17
Reference 2: http://www.xbrl.org/2003/role/disclosureRef
-Topic 230
-SubTopic 10
-Name Accounting Standards Codification
-Section 45
-Paragraph 25
-Subparagraph (e)
-Publisher FASB
-URI https://asc.fasb.org/1943274/2147482740/230-10-45-25
Reference 3: http://www.xbrl.org/2003/role/disclosureRef
-Topic 230
-SubTopic 10
-Name Accounting Standards Codification
-Section 50
-Paragraph 2
-Publisher FASB
-URI https://asc.fasb.org/1943274/2147482913/230-10-50-2
| Name: |
us-gaap_InterestPaidNet |
| Namespace Prefix: |
us-gaap_ |
| Data Type: |
xbrli:monetaryItemType |
| Balance Type: |
credit |
| Period Type: |
duration |
|
| X |
- DefinitionAmount of cash outflow from operating lease, excluding payments to bring another asset to condition and location necessary for its intended use. Reference 1: http://www.xbrl.org/2003/role/disclosureRef
-Topic 842
-SubTopic 20
-Name Accounting Standards Codification
-Section 45
-Paragraph 5
-Subparagraph (c)
-Publisher FASB
-URI https://asc.fasb.org/1943274/2147479041/842-20-45-5
Reference 2: http://www.xbrl.org/2003/role/disclosureRef
-Topic 842
-SubTopic 20
-Name Accounting Standards Codification
-Section 50
-Paragraph 4
-Subparagraph (g)(1)
-Publisher FASB
-URI https://asc.fasb.org/1943274/2147478964/842-20-50-4
| Name: |
us-gaap_OperatingLeasePayments |
| Namespace Prefix: |
us-gaap_ |
| Data Type: |
xbrli:monetaryItemType |
| Balance Type: |
credit |
| Period Type: |
duration |
|
| X |
- DefinitionAmount of cash and cash equivalents restricted as to withdrawal or usage, classified as current. Cash includes, but is not limited to, currency on hand, demand deposits with banks or financial institutions, and other accounts with general characteristics of demand deposits. Cash equivalents include, but are not limited to, short-term, highly liquid investments that are both readily convertible to known amounts of cash and so near their maturity that they present insignificant risk of changes in value because of changes in interest rates. Reference 1: http://www.xbrl.org/2003/role/disclosureRef
-Topic 210
-SubTopic 10
-Name Accounting Standards Codification
-Section S99
-Paragraph 1
-Subparagraph (SX 210.5-02(1))
-Publisher FASB
-URI https://asc.fasb.org/1943274/2147480566/210-10-S99-1
Reference 2: http://www.xbrl.org/2003/role/disclosureRef
-Topic 230
-SubTopic 10
-Name Accounting Standards Codification
-Section 50
-Paragraph 8
-Publisher FASB
-URI https://asc.fasb.org/1943274/2147482913/230-10-50-8
Reference 3: http://fasb.org/us-gaap/role/ref/legacyRef
-Name Accounting Standards Codification
-Topic 230
-SubTopic 10
-Section 45
-Paragraph 4
-Publisher FASB
-URI https://asc.fasb.org/1943274/2147482740/230-10-45-4
| Name: |
us-gaap_RestrictedCashAndCashEquivalentsAtCarryingValue |
| Namespace Prefix: |
us-gaap_ |
| Data Type: |
xbrli:monetaryItemType |
| Balance Type: |
debit |
| Period Type: |
instant |
|
| X |
- DefinitionAmount of increase in right-of-use asset obtained in exchange for operating lease liability. Reference 1: http://www.xbrl.org/2003/role/exampleRef
-Topic 842
-SubTopic 20
-Name Accounting Standards Codification
-Section 55
-Paragraph 53
-Publisher FASB
-URI https://asc.fasb.org/1943274/2147479589/842-20-55-53
Reference 2: http://www.xbrl.org/2003/role/disclosureRef
-Topic 842
-SubTopic 20
-Name Accounting Standards Codification
-Section 50
-Paragraph 4
-Subparagraph (g)(2)
-Publisher FASB
-URI https://asc.fasb.org/1943274/2147478964/842-20-50-4
| Name: |
us-gaap_RightOfUseAssetObtainedInExchangeForOperatingLeaseLiability |
| Namespace Prefix: |
us-gaap_ |
| Data Type: |
xbrli:monetaryItemType |
| Balance Type: |
debit |
| Period Type: |
duration |
|
| X |
- References
+ Details
| Name: |
us-gaap_SupplementalCashFlowElementsAbstract |
| Namespace Prefix: |
us-gaap_ |
| Data Type: |
xbrli:stringItemType |
| Balance Type: |
na |
| Period Type: |
duration |
|
v3.24.2
Restructuring and Related Activities (Details) - USD ($)
$ in Millions |
3 Months Ended |
6 Months Ended |
|
|
|
Jun. 30, 2024 |
Jun. 30, 2023 |
Jun. 30, 2024 |
Dec. 31, 2024 |
Mar. 31, 2024 |
Dec. 31, 2023 |
| Restructuring Cost and Reserve [Line Items] |
|
|
|
|
|
|
| Restructuring Charges |
$ 45
|
$ 0
|
$ 56
|
|
|
|
| Towers [Member] |
|
|
|
|
|
|
| Restructuring Cost and Reserve [Line Items] |
|
|
|
|
|
|
| Restructuring Charges |
6
|
|
|
|
|
|
| Fiber [Member] |
|
|
|
|
|
|
| Restructuring Cost and Reserve [Line Items] |
|
|
|
|
|
|
| Restructuring Charges |
31
|
|
|
|
|
|
| Other Segments |
|
|
|
|
|
|
| Restructuring Cost and Reserve [Line Items] |
|
|
|
|
|
|
| Restructuring Charges |
19
|
|
|
|
|
|
| Forecast |
|
|
|
|
|
|
| Restructuring Cost and Reserve [Line Items] |
|
|
|
|
|
|
| Restructuring and Related Cost, Expected Cost Remaining |
|
|
|
$ 70
|
|
|
| 2023 Restructuring Plan |
|
|
|
|
|
|
| Restructuring Cost and Reserve [Line Items] |
|
|
|
|
|
|
| Restructuring Charges |
2
|
|
13
|
|
|
|
| Payments for Restructuring |
(7)
|
|
(19)
|
|
|
|
| Restructuring Reserve, Settled without Cash |
0
|
|
(4)
|
|
|
|
| Restructuring Reserve |
18
|
|
18
|
|
$ 23
|
$ 28
|
| Employee headcount reduction |
|
15.00%
|
|
|
|
|
| 2024 Restructuring Plan |
|
|
|
|
|
|
| Restructuring Cost and Reserve [Line Items] |
|
|
|
|
|
|
| Restructuring Charges |
43
|
|
43
|
|
|
|
| Payments for Restructuring |
(2)
|
|
(2)
|
|
|
|
| Restructuring Reserve, Settled without Cash |
(7)
|
|
(7)
|
|
|
|
| Restructuring Reserve |
$ 34
|
|
$ 34
|
|
|
|
| Employee headcount reduction |
10.00%
|
|
10.00%
|
|
|
|
| Employee Severance | 2023 Restructuring Plan |
|
|
|
|
|
|
| Restructuring Cost and Reserve [Line Items] |
|
|
|
|
|
|
| Restructuring Charges |
$ 1
|
|
$ 1
|
|
|
|
| Payments for Restructuring |
(3)
|
|
(11)
|
|
|
|
| Restructuring Reserve, Settled without Cash |
0
|
|
0
|
|
|
|
| Restructuring Reserve |
6
|
|
6
|
|
8
|
16
|
| Employee Severance | 2024 Restructuring Plan |
|
|
|
|
|
|
| Restructuring Cost and Reserve [Line Items] |
|
|
|
|
|
|
| Restructuring Charges |
36
|
|
36
|
|
|
|
| Payments for Restructuring |
(2)
|
|
(2)
|
|
|
|
| Restructuring Reserve, Settled without Cash |
0
|
|
0
|
|
|
|
| Restructuring Reserve |
34
|
|
34
|
|
|
|
| Facility Closing | 2023 Restructuring Plan |
|
|
|
|
|
|
| Restructuring Cost and Reserve [Line Items] |
|
|
|
|
|
|
| Restructuring Charges |
1
|
|
12
|
|
|
|
| Payments for Restructuring |
(4)
|
|
(8)
|
|
|
|
| Restructuring Reserve, Settled without Cash |
0
|
|
(4)
|
|
|
|
| Restructuring Reserve |
12
|
|
12
|
|
$ 15
|
$ 12
|
| Facility Closing | 2024 Restructuring Plan |
|
|
|
|
|
|
| Restructuring Cost and Reserve [Line Items] |
|
|
|
|
|
|
| Restructuring Charges |
7
|
|
7
|
|
|
|
| Payments for Restructuring |
0
|
|
0
|
|
|
|
| Restructuring Reserve, Settled without Cash |
(7)
|
|
(7)
|
|
|
|
| Restructuring Reserve |
$ 0
|
|
0
|
|
|
|
| Accelerated depreciation and asset write downs | 2023 Restructuring Plan |
|
|
|
|
|
|
| Restructuring Cost and Reserve [Line Items] |
|
|
|
|
|
|
| Restructuring Reserve, Settled without Cash |
|
|
(4)
|
|
|
|
| Accelerated depreciation and asset write downs | 2024 Restructuring Plan |
|
|
|
|
|
|
| Restructuring Cost and Reserve [Line Items] |
|
|
|
|
|
|
| Restructuring Reserve, Settled without Cash |
|
|
(7)
|
|
|
|
| Remaining obligations under facility leases | 2023 Restructuring Plan |
|
|
|
|
|
|
| Restructuring Cost and Reserve [Line Items] |
|
|
|
|
|
|
| Restructuring Charges |
|
|
$ 8
|
|
|
|
| X |
- DefinitionEmployee headcount reduction
| Name: |
cci_EmployeeHeadcountReduction |
| Namespace Prefix: |
cci_ |
| Data Type: |
dtr-types:percentItemType |
| Balance Type: |
na |
| Period Type: |
instant |
|
| X |
- DefinitionAmount of cash payments made as the result of exit or disposal activities. Excludes payments associated with a discontinued operation or an asset retirement obligation. Reference 1: http://www.xbrl.org/2003/role/disclosureRef
-Topic 420
-SubTopic 10
-Name Accounting Standards Codification
-Section 50
-Paragraph 1
-Subparagraph (b)(2)
-Publisher FASB
-URI https://asc.fasb.org/1943274/2147482017/420-10-50-1
Reference 2: http://www.xbrl.org/2009/role/commonPracticeRef
-Topic 230
-SubTopic 10
-Name Accounting Standards Codification
-Section 45
-Paragraph 17
-Subparagraph (f)
-Publisher FASB
-URI https://asc.fasb.org/1943274/2147482740/230-10-45-17
| Name: |
us-gaap_PaymentsForRestructuring |
| Namespace Prefix: |
us-gaap_ |
| Data Type: |
xbrli:monetaryItemType |
| Balance Type: |
credit |
| Period Type: |
duration |
|
| X |
- DefinitionAmount of expected cost remaining for the specified restructuring cost.
| Name: |
us-gaap_RestructuringAndRelatedCostExpectedCostRemaining1 |
| Namespace Prefix: |
us-gaap_ |
| Data Type: |
xbrli:monetaryItemType |
| Balance Type: |
debit |
| Period Type: |
instant |
|
| X |
- DefinitionAmount of expenses associated with exit or disposal activities pursuant to an authorized plan. Excludes expenses related to a discontinued operation or an asset retirement obligation. Reference 1: http://fasb.org/us-gaap/role/ref/legacyRef
-Name Accounting Standards Codification
-Section 45
-Paragraph 28
-Subparagraph (b)
-SubTopic 10
-Topic 230
-Publisher FASB
-URI https://asc.fasb.org/1943274/2147482740/230-10-45-28
Reference 2: http://www.xbrl.org/2003/role/disclosureRef
-Topic 420
-SubTopic 10
-Name Accounting Standards Codification
-Section S99
-Paragraph 2
-Subparagraph (SAB Topic 5.P.4.b.1)
-Publisher FASB
-URI https://asc.fasb.org/1943274/2147479823/420-10-S99-2
Reference 3: http://www.xbrl.org/2009/role/commonPracticeRef
-Topic 420
-SubTopic 10
-Name Accounting Standards Codification
-Section 45
-Paragraph 3
-Publisher FASB
-URI https://asc.fasb.org/1943274/2147482047/420-10-45-3
Reference 4: http://www.xbrl.org/2003/role/disclosureRef
-Topic 420
-SubTopic 10
-Name Accounting Standards Codification
-Section S99
-Paragraph 1
-Subparagraph (SAB Topic 5.P.3)
-Publisher FASB
-URI https://asc.fasb.org/1943274/2147479823/420-10-S99-1
| Name: |
us-gaap_RestructuringCharges |
| Namespace Prefix: |
us-gaap_ |
| Data Type: |
xbrli:monetaryItemType |
| Balance Type: |
debit |
| Period Type: |
duration |
|
| X |
- DefinitionLine items represent financial concepts included in a table. These concepts are used to disclose reportable information associated with domain members defined in one or many axes to the table. Reference 1: http://www.xbrl.org/2003/role/disclosureRef
-Topic 420
-SubTopic 10
-Name Accounting Standards Codification
-Section S99
-Paragraph 2
-Subparagraph (SAB Topic 5.P.4.d)
-Publisher FASB
-URI https://asc.fasb.org/1943274/2147479823/420-10-S99-2
Reference 2: http://www.xbrl.org/2003/role/disclosureRef
-Topic 420
-SubTopic 10
-Name Accounting Standards Codification
-Section S99
-Paragraph 2
-Subparagraph (SAB Topic 5.P.4.b.1)
-Publisher FASB
-URI https://asc.fasb.org/1943274/2147479823/420-10-S99-2
Reference 3: http://www.xbrl.org/2003/role/disclosureRef
-Topic 420
-SubTopic 10
-Name Accounting Standards Codification
-Section S99
-Paragraph 2
-Subparagraph (SAB Topic 5.P.4.b.2)
-Publisher FASB
-URI https://asc.fasb.org/1943274/2147479823/420-10-S99-2
Reference 4: http://www.xbrl.org/2003/role/disclosureRef
-Topic 420
-SubTopic 10
-Name Accounting Standards Codification
-Section 50
-Paragraph 1
-Subparagraph (c)
-Publisher FASB
-URI https://asc.fasb.org/1943274/2147482017/420-10-50-1
Reference 5: http://www.xbrl.org/2003/role/disclosureRef
-Topic 420
-SubTopic 10
-Name Accounting Standards Codification
-Section 50
-Paragraph 1
-Subparagraph (b)(2)
-Publisher FASB
-URI https://asc.fasb.org/1943274/2147482017/420-10-50-1
Reference 6: http://www.xbrl.org/2003/role/disclosureRef
-Topic 420
-SubTopic 10
-Name Accounting Standards Codification
-Section 50
-Paragraph 1
-Subparagraph (b)(1)
-Publisher FASB
-URI https://asc.fasb.org/1943274/2147482017/420-10-50-1
Reference 7: http://www.xbrl.org/2003/role/disclosureRef
-Topic 420
-SubTopic 10
-Name Accounting Standards Codification
-Section 50
-Paragraph 1
-Subparagraph (d)
-Publisher FASB
-URI https://asc.fasb.org/1943274/2147482017/420-10-50-1
| Name: |
us-gaap_RestructuringCostAndReserveLineItems |
| Namespace Prefix: |
us-gaap_ |
| Data Type: |
xbrli:stringItemType |
| Balance Type: |
na |
| Period Type: |
duration |
|
| X |
- DefinitionCarrying amount (including both current and noncurrent portions of the accrual) as of the balance sheet date pertaining to a specified type of cost associated with exit from or disposal of business activities or restructuring pursuant to a duly authorized plan. Reference 1: http://www.xbrl.org/2003/role/disclosureRef
-Topic 420
-SubTopic 10
-Name Accounting Standards Codification
-Section S99
-Paragraph 2
-Subparagraph (SAB Topic 5.P.4.b.2)
-Publisher FASB
-URI https://asc.fasb.org/1943274/2147479823/420-10-S99-2
Reference 2: http://www.xbrl.org/2003/role/disclosureRef
-Topic 420
-SubTopic 10
-Name Accounting Standards Codification
-Section 50
-Paragraph 1
-Subparagraph (b)(2)
-Publisher FASB
-URI https://asc.fasb.org/1943274/2147482017/420-10-50-1
| Name: |
us-gaap_RestructuringReserve |
| Namespace Prefix: |
us-gaap_ |
| Data Type: |
xbrli:monetaryItemType |
| Balance Type: |
credit |
| Period Type: |
instant |
|
| X |
- DefinitionAmount of decrease in the reserve for full or partial settlement through consideration other than cash. Reference 1: http://www.xbrl.org/2003/role/disclosureRef
-Topic 420
-SubTopic 10
-Name Accounting Standards Codification
-Section S99
-Paragraph 2
-Subparagraph (SAB Topic 5.P.4.b.2)
-Publisher FASB
-URI https://asc.fasb.org/1943274/2147479823/420-10-S99-2
Reference 2: http://www.xbrl.org/2003/role/disclosureRef
-Topic 420
-SubTopic 10
-Name Accounting Standards Codification
-Section 50
-Paragraph 1
-Subparagraph (b)(2)
-Publisher FASB
-URI https://asc.fasb.org/1943274/2147482017/420-10-50-1
| Name: |
us-gaap_RestructuringReserveSettledWithoutCash2 |
| Namespace Prefix: |
us-gaap_ |
| Data Type: |
xbrli:monetaryItemType |
| Balance Type: |
debit |
| Period Type: |
duration |
|
| X |
- Details
| Name: |
us-gaap_StatementBusinessSegmentsAxis=cci_TowersMember |
| Namespace Prefix: |
|
| Data Type: |
na |
| Balance Type: |
|
| Period Type: |
|
|
| X |
- Details
| Name: |
us-gaap_StatementBusinessSegmentsAxis=cci_FiberMember |
| Namespace Prefix: |
|
| Data Type: |
na |
| Balance Type: |
|
| Period Type: |
|
|
| X |
- Details
| Name: |
us-gaap_StatementBusinessSegmentsAxis=us-gaap_AllOtherSegmentsMember |
| Namespace Prefix: |
|
| Data Type: |
na |
| Balance Type: |
|
| Period Type: |
|
|
| X |
- Details
| Name: |
srt_StatementScenarioAxis=srt_ScenarioForecastMember |
| Namespace Prefix: |
|
| Data Type: |
na |
| Balance Type: |
|
| Period Type: |
|
|
| X |
- Details
| Name: |
us-gaap_RestructuringPlanAxis=cci_A2023RestructuringPlanMember |
| Namespace Prefix: |
|
| Data Type: |
na |
| Balance Type: |
|
| Period Type: |
|
|
| X |
- Details
| Name: |
us-gaap_RestructuringPlanAxis=cci_A2024RestructuringPlanMember |
| Namespace Prefix: |
|
| Data Type: |
na |
| Balance Type: |
|
| Period Type: |
|
|
| X |
- Details
| Name: |
us-gaap_RestructuringCostAndReserveAxis=us-gaap_EmployeeSeveranceMember |
| Namespace Prefix: |
|
| Data Type: |
na |
| Balance Type: |
|
| Period Type: |
|
|
| X |
- Details
| Name: |
us-gaap_RestructuringCostAndReserveAxis=us-gaap_FacilityClosingMember |
| Namespace Prefix: |
|
| Data Type: |
na |
| Balance Type: |
|
| Period Type: |
|
|
| X |
- Details
| Name: |
us-gaap_RestructuringCostAndReserveAxis=cci_AcceleratedDepreciationAndAssetWriteDownsMember |
| Namespace Prefix: |
|
| Data Type: |
na |
| Balance Type: |
|
| Period Type: |
|
|
| X |
- Details
| Name: |
us-gaap_RestructuringCostAndReserveAxis=cci_RemainingObligationsUnderFacilityLeasesMember |
| Namespace Prefix: |
|
| Data Type: |
na |
| Balance Type: |
|
| Period Type: |
|
|
Crown Castle (NYSE:CCI)
過去 株価チャート
から 12 2024 まで 1 2025

Crown Castle (NYSE:CCI)
過去 株価チャート
から 1 2024 まで 1 2025
