false00010138572024Q212/31http://fasb.org/us-gaap/2024#OtherAssetsNoncurrenthttp://fasb.org/us-gaap/2024#OtherAssetsNoncurrenthttp://fasb.org/us-gaap/2024#OtherLiabilitiesCurrenthttp://fasb.org/us-gaap/2024#OtherLiabilitiesCurrent0.0074045111111111111111111111111111111111111365xbrli:sharesiso4217:USDiso4217:USDxbrli:sharesxbrli:purepega:dayiso4217:USDpega:derivative00010138572024-01-012024-06-3000010138572024-07-1700010138572024-06-3000010138572023-12-310001013857pega:SubscriptionServicesMember2024-04-012024-06-300001013857pega:SubscriptionServicesMember2023-04-012023-06-300001013857pega:SubscriptionServicesMember2024-01-012024-06-300001013857pega:SubscriptionServicesMember2023-01-012023-06-300001013857pega:SubscriptionLicenseMember2024-04-012024-06-300001013857pega:SubscriptionLicenseMember2023-04-012023-06-300001013857pega:SubscriptionLicenseMember2024-01-012024-06-300001013857pega:SubscriptionLicenseMember2023-01-012023-06-300001013857pega:ConsultingMember2024-04-012024-06-300001013857pega:ConsultingMember2023-04-012023-06-300001013857pega:ConsultingMember2024-01-012024-06-300001013857pega:ConsultingMember2023-01-012023-06-300001013857pega:PerpetualLicenseMember2024-04-012024-06-300001013857pega:PerpetualLicenseMember2023-04-012023-06-300001013857pega:PerpetualLicenseMember2024-01-012024-06-300001013857pega:PerpetualLicenseMember2023-01-012023-06-3000010138572024-04-012024-06-3000010138572023-04-012023-06-3000010138572023-01-012023-06-300001013857us-gaap:CommonStockMember2022-12-310001013857us-gaap:AdditionalPaidInCapitalMember2022-12-310001013857us-gaap:RetainedEarningsMember2022-12-310001013857us-gaap:AccumulatedOtherComprehensiveIncomeMember2022-12-3100010138572022-12-310001013857us-gaap:CommonStockMember2023-01-012023-03-310001013857us-gaap:AdditionalPaidInCapitalMember2023-01-012023-03-3100010138572023-01-012023-03-310001013857us-gaap:AccumulatedOtherComprehensiveIncomeMember2023-01-012023-03-310001013857us-gaap:RetainedEarningsMember2023-01-012023-03-310001013857us-gaap:CommonStockMember2023-03-310001013857us-gaap:AdditionalPaidInCapitalMember2023-03-310001013857us-gaap:RetainedEarningsMember2023-03-310001013857us-gaap:AccumulatedOtherComprehensiveIncomeMember2023-03-3100010138572023-03-310001013857us-gaap:CommonStockMember2023-04-012023-06-300001013857us-gaap:AdditionalPaidInCapitalMember2023-04-012023-06-300001013857us-gaap:AccumulatedOtherComprehensiveIncomeMember2023-04-012023-06-300001013857us-gaap:RetainedEarningsMember2023-04-012023-06-300001013857us-gaap:CommonStockMember2023-06-300001013857us-gaap:AdditionalPaidInCapitalMember2023-06-300001013857us-gaap:RetainedEarningsMember2023-06-300001013857us-gaap:AccumulatedOtherComprehensiveIncomeMember2023-06-3000010138572023-06-300001013857us-gaap:CommonStockMember2023-12-310001013857us-gaap:AdditionalPaidInCapitalMember2023-12-310001013857us-gaap:RetainedEarningsMember2023-12-310001013857us-gaap:AccumulatedOtherComprehensiveIncomeMember2023-12-310001013857us-gaap:CommonStockMember2024-01-012024-03-310001013857us-gaap:AdditionalPaidInCapitalMember2024-01-012024-03-3100010138572024-01-012024-03-310001013857us-gaap:AccumulatedOtherComprehensiveIncomeMember2024-01-012024-03-310001013857us-gaap:RetainedEarningsMember2024-01-012024-03-310001013857us-gaap:CommonStockMember2024-03-310001013857us-gaap:AdditionalPaidInCapitalMember2024-03-310001013857us-gaap:RetainedEarningsMember2024-03-310001013857us-gaap:AccumulatedOtherComprehensiveIncomeMember2024-03-3100010138572024-03-310001013857us-gaap:CommonStockMember2024-04-012024-06-300001013857us-gaap:AdditionalPaidInCapitalMember2024-04-012024-06-300001013857us-gaap:AccumulatedOtherComprehensiveIncomeMember2024-04-012024-06-300001013857us-gaap:RetainedEarningsMember2024-04-012024-06-300001013857us-gaap:CommonStockMember2024-06-300001013857us-gaap:AdditionalPaidInCapitalMember2024-06-300001013857us-gaap:RetainedEarningsMember2024-06-300001013857us-gaap:AccumulatedOtherComprehensiveIncomeMember2024-06-300001013857us-gaap:USGovernmentAgenciesDebtSecuritiesMember2024-06-300001013857us-gaap:USGovernmentAgenciesDebtSecuritiesMember2023-12-310001013857us-gaap:CorporateDebtSecuritiesMember2024-06-300001013857us-gaap:CorporateDebtSecuritiesMember2023-12-310001013857srt:MinimumMemberpega:ClientRelationshipsMember2024-06-300001013857pega:ClientRelationshipsMembersrt:MaximumMember2024-06-300001013857pega:ClientRelationshipsMember2024-06-300001013857srt:MinimumMemberus-gaap:PatentedTechnologyMember2024-06-300001013857us-gaap:PatentedTechnologyMembersrt:MaximumMember2024-06-300001013857us-gaap:PatentedTechnologyMember2024-06-300001013857srt:MinimumMemberus-gaap:OtherIntangibleAssetsMember2024-06-300001013857us-gaap:OtherIntangibleAssetsMembersrt:MaximumMember2024-06-300001013857us-gaap:OtherIntangibleAssetsMember2024-06-300001013857srt:MinimumMemberpega:ClientRelationshipsMember2023-12-310001013857pega:ClientRelationshipsMembersrt:MaximumMember2023-12-310001013857pega:ClientRelationshipsMember2023-12-310001013857srt:MinimumMemberus-gaap:PatentedTechnologyMember2023-12-310001013857us-gaap:PatentedTechnologyMembersrt:MaximumMember2023-12-310001013857us-gaap:PatentedTechnologyMember2023-12-310001013857srt:MinimumMemberus-gaap:OtherIntangibleAssetsMember2023-12-310001013857us-gaap:OtherIntangibleAssetsMembersrt:MaximumMember2023-12-310001013857us-gaap:OtherIntangibleAssetsMember2023-12-310001013857pega:CostOfRevenueMember2024-04-012024-06-300001013857pega:CostOfRevenueMember2023-04-012023-06-300001013857pega:CostOfRevenueMember2024-01-012024-06-300001013857pega:CostOfRevenueMember2023-01-012023-06-300001013857us-gaap:SellingAndMarketingExpenseMember2024-04-012024-06-300001013857us-gaap:SellingAndMarketingExpenseMember2023-04-012023-06-300001013857us-gaap:SellingAndMarketingExpenseMember2024-01-012024-06-300001013857us-gaap:SellingAndMarketingExpenseMember2023-01-012023-06-300001013857us-gaap:ConvertibleDebtMember2020-02-290001013857us-gaap:ConvertibleDebtMember2020-02-012020-02-290001013857us-gaap:ConvertibleDebtMember2023-04-012023-06-300001013857us-gaap:ConvertibleDebtMember2023-01-012023-06-300001013857us-gaap:ConvertibleDebtMemberus-gaap:DebtInstrumentRedemptionPeriodOneMember2020-02-012020-02-290001013857us-gaap:DebtInstrumentRedemptionPeriodTwoMemberus-gaap:ConvertibleDebtMember2020-02-012020-02-290001013857us-gaap:DebtInstrumentRedemptionPeriodThreeMember2023-03-012024-06-300001013857us-gaap:DebtInstrumentRedemptionPeriodThreeMemberus-gaap:ConvertibleDebtMember2023-03-012024-06-300001013857us-gaap:ConvertibleDebtMember2024-06-300001013857us-gaap:ConvertibleDebtMember2023-12-310001013857us-gaap:ConvertibleDebtMember2024-01-012024-06-300001013857us-gaap:ConvertibleDebtMember2024-04-012024-06-3000010138572020-02-012020-02-2900010138572020-02-290001013857us-gaap:DerivativeFinancialInstrumentsAssetsMember2023-12-310001013857us-gaap:DerivativeFinancialInstrumentsAssetsMember2022-12-310001013857us-gaap:DerivativeFinancialInstrumentsAssetsMember2024-01-012024-06-300001013857us-gaap:DerivativeFinancialInstrumentsAssetsMember2023-01-012023-06-300001013857us-gaap:DerivativeFinancialInstrumentsAssetsMember2024-06-300001013857us-gaap:DerivativeFinancialInstrumentsAssetsMember2023-06-300001013857us-gaap:LineOfCreditMemberpega:PNCBankNationalAssociationMemberus-gaap:RevolvingCreditFacilityMember2019-11-302019-11-300001013857us-gaap:LineOfCreditMemberpega:PNCBankNationalAssociationMemberus-gaap:RevolvingCreditFacilityMember2019-11-300001013857pega:PNCBankNationalAssociationMemberpega:CreditAgreementMember2024-06-300001013857us-gaap:FacilityClosingMember2023-01-012023-03-310001013857us-gaap:EmployeeSeveranceMember2023-04-012023-06-300001013857us-gaap:EmployeeSeveranceMember2023-07-012023-09-300001013857us-gaap:FacilityClosingMember2023-10-012023-12-310001013857us-gaap:FacilityClosingMember2024-04-012024-06-300001013857us-gaap:EmployeeSeveranceMember2023-12-310001013857us-gaap:EmployeeSeveranceMember2022-12-310001013857us-gaap:EmployeeSeveranceMember2024-01-012024-06-300001013857us-gaap:EmployeeSeveranceMember2023-01-012023-06-300001013857us-gaap:EmployeeSeveranceMember2024-06-300001013857us-gaap:EmployeeSeveranceMember2023-06-300001013857us-gaap:FairValueInputsLevel1Memberus-gaap:CashEquivalentsMember2024-06-300001013857us-gaap:FairValueInputsLevel2Memberus-gaap:CashEquivalentsMember2024-06-300001013857us-gaap:FairValueInputsLevel3Memberus-gaap:CashEquivalentsMember2024-06-300001013857us-gaap:CashEquivalentsMember2024-06-300001013857us-gaap:FairValueInputsLevel1Memberus-gaap:CashEquivalentsMember2023-12-310001013857us-gaap:FairValueInputsLevel2Memberus-gaap:CashEquivalentsMember2023-12-310001013857us-gaap:FairValueInputsLevel3Memberus-gaap:CashEquivalentsMember2023-12-310001013857us-gaap:CashEquivalentsMember2023-12-310001013857us-gaap:FairValueInputsLevel1Member2024-06-300001013857us-gaap:FairValueInputsLevel2Member2024-06-300001013857us-gaap:FairValueInputsLevel3Member2024-06-300001013857us-gaap:FairValueInputsLevel1Member2023-12-310001013857us-gaap:FairValueInputsLevel2Member2023-12-310001013857us-gaap:FairValueInputsLevel3Member2023-12-310001013857us-gaap:FairValueInputsLevel1Memberpega:InvestmentsInPrivatelyHeldCompaniesMember2024-06-300001013857us-gaap:FairValueInputsLevel2Memberpega:InvestmentsInPrivatelyHeldCompaniesMember2024-06-300001013857us-gaap:FairValueInputsLevel3Memberpega:InvestmentsInPrivatelyHeldCompaniesMember2024-06-300001013857pega:InvestmentsInPrivatelyHeldCompaniesMember2024-06-300001013857us-gaap:FairValueInputsLevel1Memberpega:InvestmentsInPrivatelyHeldCompaniesMember2023-12-310001013857us-gaap:FairValueInputsLevel2Memberpega:InvestmentsInPrivatelyHeldCompaniesMember2023-12-310001013857us-gaap:FairValueInputsLevel3Memberpega:InvestmentsInPrivatelyHeldCompaniesMember2023-12-310001013857pega:InvestmentsInPrivatelyHeldCompaniesMember2023-12-310001013857pega:PrivatelyHeldInvestmentMember2023-12-310001013857pega:PrivatelyHeldInvestmentMember2022-12-310001013857pega:PrivatelyHeldInvestmentMember2024-01-012024-06-300001013857pega:PrivatelyHeldInvestmentMember2023-01-012023-06-300001013857pega:PrivatelyHeldInvestmentMember2024-06-300001013857pega:PrivatelyHeldInvestmentMember2023-06-300001013857country:US2024-04-012024-06-300001013857us-gaap:GeographicConcentrationRiskMembercountry:USus-gaap:SalesRevenueNetMember2024-04-012024-06-300001013857country:US2023-04-012023-06-300001013857us-gaap:GeographicConcentrationRiskMembercountry:USus-gaap:SalesRevenueNetMember2023-04-012023-06-300001013857country:US2024-01-012024-06-300001013857us-gaap:GeographicConcentrationRiskMembercountry:USus-gaap:SalesRevenueNetMember2024-01-012024-06-300001013857country:US2023-01-012023-06-300001013857us-gaap:GeographicConcentrationRiskMembercountry:USus-gaap:SalesRevenueNetMember2023-01-012023-06-300001013857pega:OtherAmericasMember2024-04-012024-06-300001013857us-gaap:GeographicConcentrationRiskMemberus-gaap:SalesRevenueNetMemberpega:OtherAmericasMember2024-04-012024-06-300001013857pega:OtherAmericasMember2023-04-012023-06-300001013857us-gaap:GeographicConcentrationRiskMemberus-gaap:SalesRevenueNetMemberpega:OtherAmericasMember2023-04-012023-06-300001013857pega:OtherAmericasMember2024-01-012024-06-300001013857us-gaap:GeographicConcentrationRiskMemberus-gaap:SalesRevenueNetMemberpega:OtherAmericasMember2024-01-012024-06-300001013857pega:OtherAmericasMember2023-01-012023-06-300001013857us-gaap:GeographicConcentrationRiskMemberus-gaap:SalesRevenueNetMemberpega:OtherAmericasMember2023-01-012023-06-300001013857country:GB2024-04-012024-06-300001013857us-gaap:GeographicConcentrationRiskMemberus-gaap:SalesRevenueNetMembercountry:GB2024-04-012024-06-300001013857country:GB2023-04-012023-06-300001013857us-gaap:GeographicConcentrationRiskMemberus-gaap:SalesRevenueNetMembercountry:GB2023-04-012023-06-300001013857country:GB2024-01-012024-06-300001013857us-gaap:GeographicConcentrationRiskMemberus-gaap:SalesRevenueNetMembercountry:GB2024-01-012024-06-300001013857country:GB2023-01-012023-06-300001013857us-gaap:GeographicConcentrationRiskMemberus-gaap:SalesRevenueNetMembercountry:GB2023-01-012023-06-300001013857us-gaap:EMEAMember2024-04-012024-06-300001013857us-gaap:GeographicConcentrationRiskMemberus-gaap:EMEAMemberus-gaap:SalesRevenueNetMember2024-04-012024-06-300001013857us-gaap:EMEAMember2023-04-012023-06-300001013857us-gaap:GeographicConcentrationRiskMemberus-gaap:EMEAMemberus-gaap:SalesRevenueNetMember2023-04-012023-06-300001013857us-gaap:EMEAMember2024-01-012024-06-300001013857us-gaap:GeographicConcentrationRiskMemberus-gaap:EMEAMemberus-gaap:SalesRevenueNetMember2024-01-012024-06-300001013857us-gaap:EMEAMember2023-01-012023-06-300001013857us-gaap:GeographicConcentrationRiskMemberus-gaap:EMEAMemberus-gaap:SalesRevenueNetMember2023-01-012023-06-300001013857srt:AsiaPacificMember2024-04-012024-06-300001013857us-gaap:GeographicConcentrationRiskMembersrt:AsiaPacificMemberus-gaap:SalesRevenueNetMember2024-04-012024-06-300001013857srt:AsiaPacificMember2023-04-012023-06-300001013857us-gaap:GeographicConcentrationRiskMembersrt:AsiaPacificMemberus-gaap:SalesRevenueNetMember2023-04-012023-06-300001013857srt:AsiaPacificMember2024-01-012024-06-300001013857us-gaap:GeographicConcentrationRiskMembersrt:AsiaPacificMemberus-gaap:SalesRevenueNetMember2024-01-012024-06-300001013857srt:AsiaPacificMember2023-01-012023-06-300001013857us-gaap:GeographicConcentrationRiskMembersrt:AsiaPacificMemberus-gaap:SalesRevenueNetMember2023-01-012023-06-300001013857us-gaap:GeographicConcentrationRiskMemberus-gaap:SalesRevenueNetMember2024-04-012024-06-300001013857us-gaap:GeographicConcentrationRiskMemberus-gaap:SalesRevenueNetMember2023-04-012023-06-300001013857pega:SubscriptionLicenseMemberus-gaap:TransferredAtPointInTimeMember2024-04-012024-06-300001013857pega:SubscriptionLicenseMemberus-gaap:TransferredAtPointInTimeMember2023-04-012023-06-300001013857pega:SubscriptionLicenseMemberus-gaap:TransferredAtPointInTimeMember2024-01-012024-06-300001013857pega:SubscriptionLicenseMemberus-gaap:TransferredAtPointInTimeMember2023-01-012023-06-300001013857pega:PerpetualLicenseMemberus-gaap:TransferredAtPointInTimeMember2024-04-012024-06-300001013857pega:PerpetualLicenseMemberus-gaap:TransferredAtPointInTimeMember2023-04-012023-06-300001013857pega:PerpetualLicenseMemberus-gaap:TransferredAtPointInTimeMember2024-01-012024-06-300001013857pega:PerpetualLicenseMemberus-gaap:TransferredAtPointInTimeMember2023-01-012023-06-300001013857us-gaap:TransferredAtPointInTimeMember2024-04-012024-06-300001013857us-gaap:TransferredAtPointInTimeMember2023-04-012023-06-300001013857us-gaap:TransferredAtPointInTimeMember2024-01-012024-06-300001013857us-gaap:TransferredAtPointInTimeMember2023-01-012023-06-300001013857us-gaap:TransferredOverTimeMemberus-gaap:MaintenanceMember2024-04-012024-06-300001013857us-gaap:TransferredOverTimeMemberus-gaap:MaintenanceMember2023-04-012023-06-300001013857us-gaap:TransferredOverTimeMemberus-gaap:MaintenanceMember2024-01-012024-06-300001013857us-gaap:TransferredOverTimeMemberus-gaap:MaintenanceMember2023-01-012023-06-300001013857us-gaap:TransferredOverTimeMemberpega:PegaCloudMember2024-04-012024-06-300001013857us-gaap:TransferredOverTimeMemberpega:PegaCloudMember2023-04-012023-06-300001013857us-gaap:TransferredOverTimeMemberpega:PegaCloudMember2024-01-012024-06-300001013857us-gaap:TransferredOverTimeMemberpega:PegaCloudMember2023-01-012023-06-300001013857us-gaap:TransferredOverTimeMemberpega:ConsultingMember2024-04-012024-06-300001013857us-gaap:TransferredOverTimeMemberpega:ConsultingMember2023-04-012023-06-300001013857us-gaap:TransferredOverTimeMemberpega:ConsultingMember2024-01-012024-06-300001013857us-gaap:TransferredOverTimeMemberpega:ConsultingMember2023-01-012023-06-300001013857us-gaap:TransferredOverTimeMember2024-04-012024-06-300001013857us-gaap:TransferredOverTimeMember2023-04-012023-06-300001013857us-gaap:TransferredOverTimeMember2024-01-012024-06-300001013857us-gaap:TransferredOverTimeMember2023-01-012023-06-300001013857pega:PegaCloudMember2024-04-012024-06-300001013857pega:PegaCloudMember2023-04-012023-06-300001013857us-gaap:MaintenanceMember2024-04-012024-06-300001013857us-gaap:MaintenanceMember2023-04-012023-06-300001013857pega:SubscriptionMember2024-04-012024-06-300001013857pega:SubscriptionMember2023-04-012023-06-300001013857pega:SubscriptionMember2024-01-012024-06-300001013857pega:SubscriptionMember2023-01-012023-06-300001013857pega:ConsultingMemberus-gaap:TransferredAtPointInTimeMember2024-01-012024-06-300001013857pega:ConsultingMemberus-gaap:TransferredAtPointInTimeMember2023-01-012023-06-300001013857pega:PerpetualLicenseMemberus-gaap:TransferredOverTimeMember2024-01-012024-06-300001013857pega:PerpetualLicenseMemberus-gaap:TransferredOverTimeMember2023-01-012023-06-3000010138572024-07-01pega:PegaCloudMember2024-06-300001013857us-gaap:MaintenanceMember2024-07-012024-06-300001013857pega:SubscriptionLicenseMember2024-07-012024-06-300001013857pega:PerpetualLicenseMember2024-07-012024-06-300001013857pega:ConsultingMember2024-07-012024-06-3000010138572024-07-012024-06-300001013857pega:PegaCloudMember2025-07-012024-06-300001013857us-gaap:MaintenanceMember2025-07-012024-06-300001013857pega:SubscriptionLicenseMember2025-07-012024-06-300001013857pega:PerpetualLicenseMember2025-07-012024-06-300001013857pega:ConsultingMember2025-07-012024-06-3000010138572025-07-012024-06-3000010138572026-07-01pega:PegaCloudMember2024-06-3000010138572026-07-01us-gaap:MaintenanceMember2024-06-3000010138572026-07-01pega:SubscriptionLicenseMember2024-06-3000010138572026-07-01pega:PerpetualLicenseMember2024-06-3000010138572026-07-01pega:ConsultingMember2024-06-3000010138572026-07-012024-06-300001013857pega:PegaCloudMember2027-07-012024-06-300001013857us-gaap:MaintenanceMember2027-07-012024-06-300001013857pega:SubscriptionLicenseMember2027-07-012024-06-300001013857pega:PerpetualLicenseMember2027-07-012024-06-300001013857pega:ConsultingMember2027-07-012024-06-3000010138572027-07-012024-06-300001013857pega:PegaCloudMember2024-06-300001013857us-gaap:MaintenanceMember2024-06-300001013857pega:SubscriptionLicenseMember2024-06-300001013857pega:PerpetualLicenseMember2024-06-300001013857pega:ConsultingMember2024-06-3000010138572023-07-01pega:PegaCloudMember2023-06-3000010138572023-07-01us-gaap:MaintenanceMember2023-06-300001013857pega:SubscriptionLicenseMember2023-07-012023-06-300001013857pega:PerpetualLicenseMember2023-07-012023-06-300001013857pega:ConsultingMember2023-07-012023-06-3000010138572023-07-012023-06-3000010138572024-07-01pega:PegaCloudMember2023-06-300001013857us-gaap:MaintenanceMember2024-07-012023-06-300001013857pega:SubscriptionLicenseMember2024-07-012023-06-300001013857pega:PerpetualLicenseMember2024-07-012023-06-300001013857pega:ConsultingMember2024-07-012023-06-3000010138572024-07-012023-06-300001013857pega:PegaCloudMember2025-07-012023-06-300001013857us-gaap:MaintenanceMember2025-07-012023-06-300001013857pega:SubscriptionLicenseMember2025-07-012023-06-300001013857pega:PerpetualLicenseMember2025-07-012023-06-300001013857pega:ConsultingMember2025-07-012023-06-3000010138572025-07-012023-06-3000010138572026-07-01pega:PegaCloudMember2023-06-3000010138572026-07-01us-gaap:MaintenanceMember2023-06-3000010138572026-07-01pega:SubscriptionLicenseMember2023-06-3000010138572026-07-01pega:PerpetualLicenseMember2023-06-3000010138572026-07-01pega:ConsultingMember2023-06-3000010138572026-07-012023-06-300001013857pega:PegaCloudMember2023-06-300001013857us-gaap:MaintenanceMember2023-06-300001013857pega:SubscriptionLicenseMember2023-06-300001013857pega:PerpetualLicenseMember2023-06-300001013857pega:ConsultingMember2023-06-300001013857us-gaap:ResearchAndDevelopmentExpenseMember2024-04-012024-06-300001013857us-gaap:ResearchAndDevelopmentExpenseMember2023-04-012023-06-300001013857us-gaap:ResearchAndDevelopmentExpenseMember2024-01-012024-06-300001013857us-gaap:ResearchAndDevelopmentExpenseMember2023-01-012023-06-300001013857us-gaap:GeneralAndAdministrativeExpenseMember2024-04-012024-06-300001013857us-gaap:GeneralAndAdministrativeExpenseMember2023-04-012023-06-300001013857us-gaap:GeneralAndAdministrativeExpenseMember2024-01-012024-06-300001013857us-gaap:GeneralAndAdministrativeExpenseMember2023-01-012023-06-300001013857us-gaap:RestrictedStockUnitsRSUMember2024-01-012024-06-300001013857pega:NonqualifiedStockOptionsMember2024-01-012024-06-300001013857pega:PerformanceStockOptionsMember2024-01-012024-06-300001013857us-gaap:RestrictedStockUnitsRSUMemberpega:CorporateIncentiveCompensationPlanMember2024-01-012024-06-300001013857us-gaap:ShareBasedCompensationAwardTrancheOneMemberpega:PerformanceStockOptionsMember2024-01-012024-06-300001013857us-gaap:ShareBasedCompensationAwardTrancheTwoMemberpega:PerformanceStockOptionsMember2024-01-012024-06-300001013857us-gaap:EmployeeStockOptionMember2024-04-012024-06-300001013857us-gaap:EmployeeStockOptionMember2023-04-012023-06-300001013857us-gaap:EmployeeStockOptionMember2024-01-012024-06-300001013857us-gaap:EmployeeStockOptionMember2023-01-012023-06-300001013857us-gaap:RestrictedStockUnitsRSUMember2024-04-012024-06-300001013857us-gaap:RestrictedStockUnitsRSUMember2023-04-012023-06-300001013857us-gaap:RestrictedStockUnitsRSUMember2023-01-012023-06-300001013857pega:AppianCorpVPegasystemsIncYouyongZouMemberpega:TradeSecretMisappropriationMemberus-gaap:JudicialRulingMember2022-05-092022-05-090001013857pega:AppianCorpVPegasystemsIncYouyongZouMemberus-gaap:JudicialRulingMemberpega:ViolationOfTheVirginiaComputerCrimesActMember2022-05-092022-05-090001013857pega:AppianCorpVPegasystemsIncYouyongZouMemberus-gaap:JudicialRulingMember2022-09-152022-09-150001013857pega:AppianCorpVPegasystemsIncYouyongZouMemberpega:TradeSecretMisappropriationMember2022-09-150001013857pega:AppianCorpVPegasystemsIncYouyongZouMember2022-09-2900010138572024-03-042024-03-0400010138572024-05-012024-05-3100010138572024-05-310001013857pega:RichardH.JonesMember2024-01-012024-06-300001013857pega:RichardH.JonesMember2024-04-012024-06-300001013857pega:RichardH.JonesRuleTradingArrangementCommonStockMemberpega:RichardH.JonesMember2024-06-30
UNITED STATES
SECURITIES AND EXCHANGE COMMISSION
Washington, D.C. 20549
____________________________
FORM 10-Q
_____________________________________
| | | | | |
| ☒ | Quarterly Report pursuant to Section 13 or 15(d) of the Securities Exchange Act of 1934 |
| For the quarterly period ended June 30, 2024 |
OR
| | | | | |
| ☐ | Transition Report pursuant to Section 13 or 15(d) of the Securities Exchange Act of 1934 |
Commission File Number: 1-11859
____________________________
PEGASYSTEMS INC.
(Exact name of Registrant as specified in its charter)
____________________________ | | | | | |
| Massachusetts | 04-2787865 |
| (State or other jurisdiction of incorporation or organization) | (IRS Employer Identification No.) |
One Main Street, Cambridge, MA 02142
(Address of principal executive offices, including zip code)
(617) 374-9600
(Registrant’s telephone number, including area code)
____________________________
Securities registered pursuant to Section 12(b) of the Act: | | | | | | | | |
| Title of each class | Trading symbol(s) | Name of each exchange on which registered |
| Common Stock, $.01 par value per share | PEGA | NASDAQ Global Select Market |
Indicate by check mark whether the Registrant (1) has filed all reports required to be filed by Section 13 or 15(d) of the Securities Exchange Act of 1934 during the preceding 12 months (or for such shorter period that the Registrant was required to file such reports), and (2) has been subject to such filing requirements for the past 90 days. Yes x No ¨
Indicate by check mark whether the Registrant has submitted electronically every Interactive Data File required to be submitted pursuant to Rule 405 of Regulation S-T during the preceding 12 months (or for such shorter period that the Registrant was required to submit such files). Yes x No ¨
Indicate by check mark whether the Registrant is a large accelerated filer, an accelerated filer, a non-accelerated filer, a smaller reporting company, or an emerging growth company. See the definitions of “large accelerated filer,” “accelerated filer,” “smaller reporting company,” and “emerging growth company” in Rule 12b-2 of the Exchange Act. | | | | | | | | | | | | | | | | | | | | | | | | | | | | | |
Large accelerated filer | x | Accelerated filer | ☐ | Non-accelerated filer | ☐ | Smaller reporting company | ☐ | Emerging growth company | ☐ |
If an emerging growth company, indicate by check mark if the Registrant has elected not to use the extended transition period for complying with any new or revised financial accounting standards provided pursuant to Section 13(a) of the Exchange Act. ☐
Indicate by check mark whether the Registrant is a shell company (as defined in Rule 12b-2 of the Exchange Act). Yes ☐ No ☒
There were 85,409,645 shares of the Registrant’s common stock, $0.01 par value per share, outstanding on July 17, 2024.
PEGASYSTEMS INC.
QUARTERLY REPORT ON FORM 10-Q
TABLE OF CONTENTS
| | | | | |
| Page |
| PART I - FINANCIAL INFORMATION |
| |
| Item 1. Financial Statements | |
Unaudited Condensed Consolidated Balance Sheets as of June 30, 2024 and December 31, 2023 | |
Unaudited Condensed Consolidated Statements of Operations for the three and six months ended June 30, 2024 and 2023 | |
Unaudited Condensed Consolidated Statements of Comprehensive Income (Loss) for the three and six months ended June 30, 2024 and 2023 | |
Unaudited Condensed Consolidated Statements of Stockholders’ Equity for the six months ended June 30, 2024 and 2023 | |
Unaudited Condensed Consolidated Statements of Cash Flows for the six months ended June 30, 2024 and 2023 | |
| Notes to Unaudited Condensed Consolidated Financial Statements | |
| Item 2. Management’s Discussion and Analysis of Financial Condition and Results of Operations | |
| Item 3. Quantitative and Qualitative Disclosures About Market Risk | |
| Item 4. Controls and Procedures | |
| |
| PART II - OTHER INFORMATION |
| |
| Item 1. Legal Proceedings | |
| Item 1A. Risk Factors | |
| Item 2. Unregistered Sales of Equity Securities and Use of Proceeds | |
| Item 5. Other Information | |
| Item 6. Exhibits | |
| |
| Signature | |
PART I - FINANCIAL INFORMATION
ITEM 1. FINANCIAL STATEMENTS
| | | | | | | | | | | |
PEGASYSTEMS INC. UNAUDITED CONDENSED CONSOLIDATED BALANCE SHEETS (in thousands) |
| June 30, 2024 | | December 31, 2023 |
| Assets | | | |
| Current assets: | | | |
| Cash and cash equivalents | $ | 258,257 | | | $ | 229,902 | |
| Marketable securities | 406,819 | | | 193,436 | |
| Total cash, cash equivalents, and marketable securities | 665,076 | | | 423,338 | |
Accounts receivable, net | 165,723 | | | 300,173 | |
Unbilled receivables, net | 164,533 | | | 237,379 | |
| Other current assets | 76,323 | | | 68,137 | |
| Total current assets | 1,071,655 | | | 1,029,027 | |
Long-term unbilled receivables, net | 81,218 | | | 85,402 | |
| Goodwill | 81,410 | | | 81,611 | |
| Other long-term assets | 302,249 | | | 314,696 | |
| Total assets | $ | 1,536,532 | | | $ | 1,510,736 | |
| Liabilities and stockholders’ equity | | | |
| Current liabilities: | | | |
| Accounts payable | $ | 16,682 | | | $ | 11,290 | |
| Accrued expenses | 44,875 | | | 39,941 | |
| Accrued compensation and related expenses | 81,110 | | | 126,640 | |
| Deferred revenue | 352,618 | | | 377,845 | |
| Convertible senior notes, net | 500,604 | | | — | |
| Other current liabilities | 20,677 | | | 21,343 | |
| Total current liabilities | 1,016,566 | | | 577,059 | |
Long-term convertible senior notes, net | — | | | 499,368 | |
Long-term operating lease liabilities | 70,202 | | | 66,901 | |
| Other long-term liabilities | 14,362 | | | 13,570 | |
| Total liabilities | 1,101,130 | | | 1,156,898 | |
| Commitments and contingencies (Note 15) | | | |
| Stockholders’ equity: | | | |
Preferred stock, 1,000 shares authorized; none issued | — | | | — | |
Common stock, 200,000 shares authorized; 85,369 and 83,840 shares issued and outstanding at June 30, 2024 and December 31, 2023, respectively | 854 | | | 838 | |
| Additional paid-in capital | 473,030 | | | 379,584 | |
| (Accumulated deficit) | (14,216) | | | (8,705) | |
| Accumulated other comprehensive (loss) | (24,266) | | | (17,879) | |
| Total stockholders’ equity | 435,402 | | | 353,838 | |
| Total liabilities and stockholders’ equity | $ | 1,536,532 | | | $ | 1,510,736 | |
See notes to unaudited condensed consolidated financial statements.
| | | | | | | | | | | | | | | | | | | | | | | |
PEGASYSTEMS INC. UNAUDITED CONDENSED CONSOLIDATED STATEMENTS OF OPERATIONS (in thousands, except per share amounts) |
| Three Months Ended
June 30, | | Six Months Ended
June 30, |
| 2024 | | 2023 | | 2024 | | 2023 |
| Revenue | | | | | | | |
| Subscription services | $ | 214,430 | | | $ | 197,105 | | | $ | 426,333 | | | $ | 384,614 | |
| Subscription license | 84,647 | | | 41,197 | | | 147,985 | | | 125,724 | |
| Consulting | 52,040 | | | 58,387 | | | 106,087 | | | 111,420 | |
| Perpetual license | 36 | | | 1,579 | | | 895 | | | 1,982 | |
| Total revenue | 351,153 | | | 298,268 | | | 681,300 | | | 623,740 | |
| Cost of revenue | | | | | | | |
| Subscription services | 36,238 | | | 36,783 | | | 72,062 | | | 73,647 | |
| Subscription license | 477 | | | 623 | | | 1,120 | | | 1,342 | |
| Consulting | 60,231 | | | 58,710 | | | 118,413 | | | 119,058 | |
| Perpetual license | — | | | 24 | | | 9 | | | 27 | |
| Total cost of revenue | 96,946 | | | 96,140 | | | 191,604 | | | 194,074 | |
| Gross profit | 254,207 | | | 202,128 | | | 489,696 | | | 429,666 | |
| Operating expenses | | | | | | | |
| Selling and marketing | 139,761 | | | 143,858 | | | 267,456 | | | 293,655 | |
| Research and development | 75,425 | | | 73,931 | | | 147,538 | | | 149,307 | |
| General and administrative | 25,420 | | | 23,462 | | | 48,947 | | | 46,572 | |
Litigation settlement, net of recoveries | — | | | — | | | 32,403 | | | — | |
| Restructuring | 635 | | | 2,167 | | | 798 | | | 3,628 | |
| Total operating expenses | 241,241 | | | 243,418 | | | 497,142 | | | 493,162 | |
| Income (loss) from operations | 12,966 | | | (41,290) | | | (7,446) | | | (63,496) | |
| Foreign currency transaction gain (loss) | 437 | | | (3,290) | | | (2,825) | | | (5,965) | |
| Interest income | 6,785 | | | 1,814 | | | 12,066 | | | 3,299 | |
| Interest expense | (1,656) | | | (1,778) | | | (3,408) | | | (3,696) | |
| (Loss) income on capped call transactions | (3,277) | | | (1,361) | | | 22 | | | 1,845 | |
| Other income, net | — | | | 5,702 | | | 1,684 | | | 12,285 | |
| Income (loss) before provision for income taxes | 15,255 | | | (40,203) | | | 93 | | | (55,728) | |
| Provision for income taxes | 8,642 | | | 6,601 | | | 5,604 | | | 11,850 | |
| Net income (loss) | $ | 6,613 | | | $ | (46,804) | | | $ | (5,511) | | | $ | (67,578) | |
| Earnings (loss) per share | | | | | | | |
| Basic | $ | 0.08 | | | $ | (0.56) | | | $ | (0.07) | | | $ | (0.82) | |
| Diluted | $ | 0.07 | | | $ | (0.56) | | | $ | (0.07) | | | $ | (0.82) | |
| Weighted-average number of common shares outstanding | | | | | | | |
| Basic | 85,157 | | | 83,039 | | | 84,712 | | | 82,823 | |
| Diluted | 88,500 | | | 83,039 | | | 84,712 | | | 82,823 | |
See notes to unaudited condensed consolidated financial statements.
| | | | | | | | | | | | | | | | | | | | | | | |
PEGASYSTEMS INC. UNAUDITED CONDENSED CONSOLIDATED STATEMENTS OF COMPREHENSIVE INCOME (LOSS) (in thousands) |
| Three Months Ended
June 30, | | Six Months Ended
June 30, |
| 2024 | | 2023 | | 2024 | | 2023 |
| Net income (loss) | $ | 6,613 | | | $ | (46,804) | | | $ | (5,511) | | | $ | (67,578) | |
| Other comprehensive (loss) income, net of tax | | | | | | | |
| Unrealized (loss) on available-for-sale securities | (72) | | | (195) | | | (818) | | | (241) | |
| Foreign currency translation adjustments | (2,142) | | | 361 | | | (5,569) | | | 1,950 | |
| Total other comprehensive (loss) income, net of tax | (2,214) | | | 166 | | | (6,387) | | | 1,709 | |
| Comprehensive income (loss) | $ | 4,399 | | | $ | (46,638) | | | $ | (11,898) | | | $ | (65,869) | |
See notes to unaudited condensed consolidated financial statements.
| | | | | | | | | | | | | | | | | | | | | | | | | | | | | | | | | | | |
PEGASYSTEMS INC.
UNAUDITED CONDENSED CONSOLIDATED STATEMENTS OF STOCKHOLDERS’ EQUITY
(in thousands, except per share amounts) |
| Common Stock | | Additional paid-in capital | | (Accumulated deficit) | | Accumulated other comprehensive (loss) | | Total stockholders’ equity |
| Number of shares | | Amount | | | | |
| December 31, 2022 | 82,436 | | | $ | 824 | | | $ | 229,602 | | | $ | (76,513) | | | $ | (23,070) | | | $ | 130,843 | |
| | | | | | | | | | | |
| Issuance of common stock for stock compensation plans | 452 | | | 4 | | | 668 | | | — | | | — | | | 672 | |
| Issuance of common stock under the employee stock purchase plan | 52 | | | 1 | | | 2,142 | | | — | | | — | | | 2,143 | |
| Stock-based compensation | — | | | — | | | 42,557 | | | — | | | — | | | 42,557 | |
Cash dividends declared ($0.03 per share) | — | | | — | | | (2,488) | | | — | | | — | | | (2,488) | |
| Other comprehensive income | — | | | — | | | — | | | — | | | 1,543 | | | 1,543 | |
| Net (loss) | — | | | — | | | — | | | (20,774) | | | — | | | (20,774) | |
| March 31, 2023 | 82,940 | | | $ | 829 | | | $ | 272,481 | | | $ | (97,287) | | | $ | (21,527) | | | $ | 154,496 | |
| | | | | | | | | | | |
| Issuance of common stock for stock compensation plans | 225 | | | 2 | | | 1,824 | | | — | | | — | | | 1,826 | |
| Issuance of common stock under the employee stock purchase plan | 47 | | | 1 | | | 1,980 | | | — | | | — | | | 1,981 | |
| Stock-based compensation | — | | | — | | | 36,227 | | | — | | | — | | | 36,227 | |
Cash dividends declared ($0.03 per share) | — | | | — | | | (2,496) | | | — | | | — | | | (2,496) | |
| Other comprehensive income | — | | | — | | | — | | | — | | | 166 | | | 166 | |
| Net (loss) | — | | | — | | | — | | | (46,804) | | | — | | | (46,804) | |
| June 30, 2023 | 83,212 | | | $ | 832 | | | $ | 310,016 | | | $ | (144,091) | | | $ | (21,361) | | | $ | 145,396 | |
| | | | | | | | | | | |
| | | | | | | | | | | |
| | | | | | | | | | | |
| | | | | | | | | | | |
| | | | | | | | | | | |
| | | | | | | | | | | |
| | | | | | | | | | | |
| | | | | | | | | | | |
| | | | | | | | | | | |
| December 31, 2023 | 83,840 | | | $ | 838 | | | $ | 379,584 | | | $ | (8,705) | | | $ | (17,879) | | | $ | 353,838 | |
| | | | | | | | | | | |
| Issuance of common stock for stock compensation plans | 1,139 | | | 12 | | | 18,644 | | | — | | | — | | | 18,656 | |
| Issuance of common stock under the employee stock purchase plan | 32 | | | — | | | 1,758 | | | — | | | — | | | 1,758 | |
| Stock-based compensation | — | | | — | | | 34,781 | | | — | | | — | | | 34,781 | |
Cash dividends declared ($0.03 per share) | — | | | — | | | (2,550) | | | — | | | — | | | (2,550) | |
| Other comprehensive (loss) | — | | | — | | | — | | | — | | | (4,173) | | | (4,173) | |
| Net (loss) | — | | | — | | | — | | | (12,124) | | | — | | | (12,124) | |
| March 31, 2024 | 85,011 | | | $ | 850 | | | $ | 432,217 | | | $ | (20,829) | | | $ | (22,052) | | | $ | 390,186 | |
| | | | | | | | | | | |
| Issuance of common stock for stock compensation plans | 326 | | | 4 | | | 5,481 | | | — | | | — | | | 5,485 | |
| Issuance of common stock under the employee stock purchase plan | 32 | | | — | | | 1,669 | | | — | | | — | | | 1,669 | |
| Stock-based compensation | — | | | — | | | 36,224 | | | — | | | — | | | 36,224 | |
Cash dividends declared ($0.03 per share) | — | | | — | | | (2,561) | | | — | | | — | | | (2,561) | |
| Other comprehensive (loss) | — | | | — | | | — | | | — | | | (2,214) | | | (2,214) | |
| Net income | — | | | — | | | — | | | 6,613 | | | — | | | 6,613 | |
| June 30, 2024 | 85,369 | | | $ | 854 | | | $ | 473,030 | | | $ | (14,216) | | | $ | (24,266) | | | $ | 435,402 | |
| | | | | | | | | | | |
| | | | | | | | | | | |
| | | | | | | | | | | |
| | | | | | | | | | | |
| | | | | | | | | | | |
| | | | | | | | | | | |
| | | | | | | | | | | |
| | | | | | | | | | | |
See notes to unaudited condensed consolidated financial statements.
| | | | | | | | | | | |
PEGASYSTEMS INC. UNAUDITED CONDENSED CONSOLIDATED STATEMENTS OF CASH FLOWS (in thousands) |
| Six Months Ended
June 30, |
| 2024 | | 2023 |
| Operating activities | | | |
| Net (loss) | $ | (5,511) | | | $ | (67,578) | |
| Adjustments to reconcile net (loss) to cash provided by operating activities | | | |
| Stock-based compensation | 71,005 | | | 78,784 | |
| Amortization of deferred commissions | 32,276 | | | 29,027 | |
| Amortization of intangible assets and depreciation | 8,812 | | | 9,553 | |
| Lease expense | 7,844 | | | 8,186 | |
| Foreign currency transaction loss | 2,825 | | | 5,965 | |
| (Gain) on capped call transactions | (22) | | | (1,845) | |
| Deferred income taxes | 232 | | | (136) | |
| (Gain) on investments | (1,628) | | | (4,430) | |
| (Gain) on repurchases of convertible senior notes | — | | | (7,855) | |
| Other non-cash | (5,056) | | | 2,122 | |
| Change in operating assets and liabilities, net | 109,466 | | | 61,959 | |
| Cash provided by operating activities | 220,243 | | | 113,752 | |
| Investing activities | | | |
| Purchases of investments | (291,810) | | | (69,662) | |
| Proceeds from maturities and called investments | 83,967 | | | 88,849 | |
| Sales of investments | — | | | 10,725 | |
| | | |
| Investment in property and equipment | (1,857) | | | (13,933) | |
| Cash (used in) provided by investing activities | (209,700) | | | 15,979 | |
| Financing activities | | | |
| Repurchases of convertible senior notes | — | | | (88,989) | |
| Dividend payments to stockholders | (5,065) | | | (4,962) | |
| | | |
| | | |
| Proceeds from employee stock plans | 29,928 | | | 8,044 | |
| Common stock repurchases for tax withholdings for net settlement of equity awards | (2,360) | | | (1,422) | |
| | | |
| | | |
| Other | — | | | 341 | |
| Cash provided by (used in) financing activities | 22,503 | | | (86,988) | |
| Effect of exchange rate changes on cash, cash equivalents, and restricted cash | (2,842) | | | 1,010 | |
| Net increase in cash, cash equivalents, and restricted cash | 30,204 | | | 43,753 | |
| Cash, cash equivalents, and restricted cash, beginning of period | 232,827 | | | 145,054 | |
| Cash, cash equivalents, and restricted cash, end of period | $ | 263,031 | | | $ | 188,807 | |
| | | |
| Cash and cash equivalents | $ | 258,257 | | | $ | 186,874 | |
| Restricted cash included in other current assets | 768 | | | — | |
| Restricted cash included in other long-term assets | 4,006 | | | 1,933 | |
| Total cash, cash equivalents, and restricted cash | $ | 263,031 | | | $ | 188,807 | |
See notes to unaudited condensed consolidated financial statements.
PEGASYSTEMS INC.
NOTES TO UNAUDITED CONDENSED CONSOLIDATED FINANCIAL STATEMENTS
NOTE 1. BASIS OF PRESENTATION
Pegasystems Inc. (together with its subsidiaries, “the Company”) has prepared the accompanying unaudited condensed consolidated financial statements pursuant to the rules and regulations of the U.S. Securities and Exchange Commission (“SEC”) regarding interim financial reporting. Accordingly, they do not include all the information required by accounting principles generally accepted in the United States of America (“U.S.”) for complete financial statements and should be read in conjunction with the Company’s audited financial statements included in the Annual Report on Form 10-K for the year ended December 31, 2023.
In the opinion of management, the Company has prepared the accompanying unaudited condensed consolidated financial statements on the same basis as its audited financial statements, and these financial statements include all adjustments, consisting only of normal recurring adjustments, necessary for a fair presentation of the results of the interim periods presented.
All intercompany transactions and balances were eliminated in consolidation. The operating results for the interim periods presented do not necessarily indicate the expected results for 2024.
NOTE 2. MARKETABLE SECURITIES | | | | | | | | | | | | | | | | | | | | | | | | | | | | | | | | | | | | | | | | | | | | | | | |
| June 30, 2024 | | December 31, 2023 |
| (in thousands) | Amortized Cost | | Unrealized Gains | | Unrealized Losses | | Fair Value | | Amortized Cost | | Unrealized Gains | | Unrealized Losses | | Fair Value |
| Government debt | $ | 12,942 | | | $ | — | | | $ | (17) | | | $ | 12,925 | | | $ | 11,471 | | | $ | 33 | | | $ | (1) | | | $ | 11,503 | |
| Corporate debt | 394,521 | | | 1 | | | (628) | | | 393,894 | | | 181,960 | | | 200 | | | (227) | | | 181,933 | |
| $ | 407,463 | | | $ | 1 | | | $ | (645) | | | $ | 406,819 | | | $ | 193,431 | | | $ | 233 | | | $ | (228) | | | $ | 193,436 | |
As of June 30, 2024, marketable securities’ maturities ranged from July 2024 to January 2026, with a weighted-average remaining maturity of 0.4 years.
NOTE 3. RECEIVABLES, CONTRACT ASSETS, AND DEFERRED REVENUE
Receivables | | | | | | | | | | | |
(in thousands) | June 30, 2024 | | December 31, 2023 |
| Accounts receivable, net | $ | 165,723 | | | $ | 300,173 | |
| Unbilled receivables, net | 164,533 | | | 237,379 | |
Long-term unbilled receivables, net | 81,218 | | | 85,402 | |
| $ | 411,474 | | | $ | 622,954 | |
Unbilled receivables
Unbilled receivables are client-committed amounts for which revenue recognition precedes billing. Billing is solely subject to the passage of time.
Unbilled receivables by expected collection date: | | | | | | | | |
(Dollars in thousands) | June 30, 2024 |
| 1 year or less | $ | 164,533 | | 67 | % |
| 1-2 years | 58,353 | | 24 | % |
| 2-5 years | 22,865 | | 9 | % |
| $ | 245,751 | | 100 | % |
Unbilled receivables by contract effective date: | | | | | | | | |
(Dollars in thousands) | June 30, 2024 |
| 2024 | $ | 58,562 | | 24 | % |
| 2023 | 130,140 | | 53 | % |
| 2022 | 29,241 | | 12 | % |
| 2021 | 22,830 | | 9 | % |
| 2020 and prior | 4,978 | | 2 | % |
| $ | 245,751 | | 100 | % |
PEGASYSTEMS INC.
NOTES TO UNAUDITED CONDENSED CONSOLIDATED FINANCIAL STATEMENTS (continued)
Contract assets
Contract assets are client-committed amounts for which revenue recognized exceeds the amount billed to the client, and billing is subject to conditions other than the passage of time, such as the completion of a related performance obligation. | | | | | | | | | | | |
(in thousands) | June 30, 2024 | | December 31, 2023 |
Contract assets | $ | 15,374 | | | $ | 16,238 | |
Long-term contract assets | 19,997 | | | 20,635 | |
| $ | 35,371 | | | $ | 36,873 | |
Deferred revenue
Deferred revenue consists of billings made and payments received in advance of revenue recognition. | | | | | | | | | | | |
(in thousands) | June 30, 2024 | | December 31, 2023 |
| Deferred revenue | $ | 352,618 | | | $ | 377,845 | |
Long-term deferred revenue | 2,443 | | | 2,478 | |
| $ | 355,061 | | | $ | 380,323 | |
The decrease in deferred revenue in the six months ended June 30, 2024, was primarily due to $272.7 million of revenue recognized that was in deferred revenue as of December 31, 2023.
NOTE 4. DEFERRED COMMISSIONS | | | | | | | | | | | |
(in thousands) | June 30, 2024 | | December 31, 2023 |
Deferred commissions | $ | 100,490 | | | $ | 114,119 | |
| | | | | | | | | | | | | | | | | | | | | | | |
| Three Months Ended
June 30, | | Six Months Ended
June 30, |
| (in thousands) | 2024 | | 2023 | | 2024 | | 2023 |
Amortization of deferred commissions (1) | $ | 14,994 | | | $ | 14,750 | | | $ | 32,276 | | | $ | 29,027 | |
(1) Included in selling and marketing.
NOTE 5. GOODWILL AND OTHER INTANGIBLES
Goodwill
| | | | | | | | | | | |
| Six Months Ended
June 30, |
(in thousands) | 2024 | | 2023 |
| January 1, | $ | 81,611 | | | $ | 81,399 | |
| | | |
| Currency translation adjustments | (201) | | | 194 | |
| June 30, | $ | 81,410 | | | $ | 81,593 | |
Intangibles
Intangible assets are recorded at cost and amortized using the straight-line method over their estimated useful lives. | | | | | | | | | | | | | | | | | | | | | | | |
| | | June 30, 2024 |
| (in thousands) | Useful Lives | | Cost | | Accumulated Amortization | | Net Book Value |
Client-related | 4-10 years | | $ | 63,112 | | | $ | (60,714) | | | $ | 2,398 | |
Technology | 2-10 years | | 68,005 | | | (65,198) | | | 2,807 | |
Other | 1-5 years | | 5,361 | | | (5,361) | | | — | |
| | | $ | 136,478 | | | $ | (131,273) | | | $ | 5,205 | |
| | | | | | | | | | | | | | | | | | | | | | | |
| | | December 31, 2023 |
| (in thousands) | Useful Lives | | Cost | | Accumulated Amortization | | Net Book Value |
| Client-related | 4-10 years | | $ | 63,117 | | | $ | (60,035) | | | $ | 3,082 | |
| Technology | 2-10 years | | 68,138 | | | (64,218) | | | 3,920 | |
| Other | 1-5 years | | 5,361 | | | (5,361) | | | — | |
| | | $ | 136,616 | | | $ | (129,614) | | | $ | 7,002 | |
PEGASYSTEMS INC.
NOTES TO UNAUDITED CONDENSED CONSOLIDATED FINANCIAL STATEMENTS (continued)
Future estimated amortization of intangible assets: | | | | | |
(in thousands) | June 30, 2024 |
| Remainder of 2024 | $ | 1,399 | |
| 2025 | 2,605 | |
| 2026 | 874 | |
| 2027 | 327 | |
| |
| |
| $ | 5,205 | |
Amortization of intangible assets:
| | | | | | | | | | | | | | | | | | | | | | | |
| Three Months Ended
June 30, | | Six Months Ended
June 30, |
| (in thousands) | 2024 | | 2023 | | 2024 | | 2023 |
Cost of revenue | $ | 447 | | | $ | 621 | | | $ | 1,068 | | | $ | 1,327 | |
Selling and marketing | 342 | | | 342 | | | 685 | | | 685 | |
| | | | | | | |
| $ | 789 | | | $ | 963 | | | $ | 1,753 | | | $ | 2,012 | |
NOTE 6. OTHER ASSETS AND LIABILITIES
Other current assets
| | | | | | | | | | | |
| (in thousands) | June 30, 2024 | | December 31, 2023 |
| Income tax receivables | $ | 16,060 | | | $ | 4,804 | |
| Contract assets | 15,374 | | | 16,238 | |
| Insurance receivable | — | | | 1,954 | |
| Indirect tax receivable | 2,702 | | | 1,924 | |
| Capped call transactions | 915 | | | — | |
| Restricted cash | 768 | | | — | |
| Other | 40,504 | | | 43,217 | |
| $ | 76,323 | | | $ | 68,137 | |
Other long-term assets
| | | | | | | | | | | |
| (in thousands) | June 30, 2024 | | December 31, 2023 |
| Deferred commissions | $ | 100,490 | | | $ | 114,119 | |
| Right of use assets | 68,293 | | | 64,198 | |
| Property and equipment | 42,190 | | | 47,279 | |
| Venture investments | 21,047 | | | 19,450 | |
| Contract assets | 19,997 | | | 20,635 | |
| Intangible assets | 5,205 | | | 7,002 | |
| Capped call transactions | — | | | 893 | |
| Deferred income taxes | 3,666 | | | 3,678 | |
| Restricted cash | 4,006 | | | 2,925 | |
| Other | 37,355 | | | 34,517 | |
| $ | 302,249 | | | $ | 314,696 | |
PEGASYSTEMS INC.
NOTES TO UNAUDITED CONDENSED CONSOLIDATED FINANCIAL STATEMENTS (continued)
Accrued expenses
| | | | | | | | | | | |
| (in thousands) | June 30, 2024 | | December 31, 2023 |
| | | |
| Cloud hosting | $ | 15,152 | | | $ | 1,358 | |
| Outside professional services | 9,539 | | | 10,419 | |
| Marketing and sales program | 7,081 | | | 2,557 | |
| Income and other taxes | 3,422 | | | 15,428 | |
| Employee related | 4,966 | | | 4,486 | |
| Other | 4,715 | | | 5,693 | |
| $ | 44,875 | | | $ | 39,941 | |
Other current liabilities | | | | | | | | | | | |
| (in thousands) | June 30, 2024 | | December 31, 2023 |
| Operating lease liabilities | $ | 15,254 | | | $ | 15,000 | |
| Dividends payable | 2,561 | | | 2,515 | |
| Other | 2,862 | | | 3,828 | |
| $ | 20,677 | | | $ | 21,343 | |
Other long-term liabilities
| | | | | | | | | | | |
| (in thousands) | June 30, 2024 | | December 31, 2023 |
| Deferred revenue | $ | 2,443 | | | $ | 2,478 | |
| Income taxes payable | 858 | | | 859 | |
| Other | 11,061 | | | 10,233 | |
| $ | 14,362 | | | $ | 13,570 | |
NOTE 7. LEASES
Expense
| | | | | | | | | | | | | | | | | | | | | | | |
| Three Months Ended
June 30, | | Six Months Ended
June 30, |
| (in thousands) | 2024 | | 2023 | | 2024 | | 2023 |
| Fixed lease costs | $ | 5,271 | | | $ | 4,495 | | | $ | 9,533 | | | $ | 10,261 | |
| Short-term lease costs | 410 | | | 696 | | | 953 | | | 1,477 | |
| Variable lease costs | 1,763 | | | 2,186 | | | 3,372 | | | 4,160 | |
| $ | 7,444 | | | $ | 7,377 | | | $ | 13,858 | | | $ | 15,898 | |
Right of use assets and lease liabilities | | | | | | | | | | | |
| (in thousands) | June 30, 2024 | | December 31, 2023 |
Right of use assets | $ | 68,293 | | | $ | 64,198 | |
Operating lease liabilities | $ | 15,254 | | | $ | 15,000 | |
| Long-term operating lease liabilities | $ | 70,202 | | | $ | 66,901 | |
Weighted-average remaining lease term and discount rate for the Company’s leases were: | | | | | | | | | | | |
| June 30, 2024 | | December 31, 2023 |
| Weighted-average remaining lease term | 6.4 years | | 6.8 years |
Weighted-average discount rate (1) | 4.6 | % | | 4.0 | % |
(1) The rates implicit in the Company’s leases are not readily determinable. Therefore, the Company uses its incremental borrowing rate as the discount rate when measuring operating lease liabilities. The incremental borrowing rate represents an estimate of the interest rate the Company would incur to borrow an amount equal to the lease payments on a collateralized basis over the lease term in a similar economic environment.
PEGASYSTEMS INC.
NOTES TO UNAUDITED CONDENSED CONSOLIDATED FINANCIAL STATEMENTS (continued)
Maturities of lease liabilities: | | | | | |
| (in thousands) | June 30, 2024 |
| Remainder of 2024 | $ | 7,954 | |
| 2025 | 18,784 | |
| 2026 | 14,384 | |
| 2027 | 13,387 | |
| 2028 | 12,813 | |
| 2029 | 10,099 | |
| Thereafter | 21,650 | |
| Total lease payments | 99,071 | |
Less: imputed interest (1) | (13,615) | |
| $ | 85,456 | |
(1) Lease liabilities are measured at the present value of the remaining lease payments using a discount rate determined at lease commencement unless the discount rate is updated due to a lease reassessment event.
Cash flow information | | | | | | | | | | | |
| Six Months Ended
June 30, |
| (in thousands) | 2024 | | 2023 |
| Cash paid for operating leases, net of tenant improvement allowances | $ | 9,493 | | | $ | 10,540 | |
| Right of use assets recognized for new leases and amendments (non-cash) | $ | 12,290 | | | $ | 1,465 | |
NOTE 8. DEBT
Convertible senior notes and capped calls
Convertible senior notes
In February 2020, the Company issued Convertible Senior Notes (the "Notes") with an aggregate principal of $600 million, due March 1, 2025, in a private placement. No principal payments are due before maturity. The Notes accrue interest at an annual rate of 0.75%, payable semi-annually in arrears on March 1 and September 1, beginning September 1, 2020. In the three and six months ended June 30, 2023, the Company recognized gains of $5.1 million and $7.9 million, respectively, in other income, net from repurchases of Notes representing $64.7 million and $97.7 million, respectively, in aggregate principal amount.
Conversion rights
The conversion rate is 7.4045 shares of common stock per $1,000 principal amount of the Notes, representing an initial conversion price of $135.05 per share of common stock. The conversion rate will be adjusted upon certain events, including spin-offs, tender offers, exchange offers, and certain stockholder distributions. The Company will settle conversions by paying or delivering cash, shares of its common stock, or a combination of cash and shares of its common stock, at the Company’s election, based on the applicable conversion rate.
Beginning on September 1, 2024, noteholders may convert their Notes at any time at their election.
Before September 1, 2024, noteholders may convert their Notes in the following circumstances:
•During any calendar quarter beginning after June 30, 2020 (and only during such calendar quarter), if the last reported sale price per share of the Company’s common stock exceeds 130% of the conversion price for each of at least 20 trading days (whether or not consecutive) during the 30 consecutive trading days ending on, and including, the last trading day of the immediately preceding calendar quarter.
•During the five consecutive business days immediately after any five consecutive trading day period (the “Measurement Period”), if the trading price per $1,000 principal amount of Notes for each trading day of the Measurement Period was less than 98% of the product of the last reported sale price per share of common stock on such trading day and the conversion rate on such trading day.
•Upon certain corporate events or distributions or if the Company calls any Notes for redemption, noteholders may convert before the close of business on the business day immediately before the related redemption date (or, if the Company fails to pay the redemption price in full on the redemption date until the Company pays the redemption price).
As of June 30, 2024, the Notes were not eligible for conversion.
PEGASYSTEMS INC.
NOTES TO UNAUDITED CONDENSED CONSOLIDATED FINANCIAL STATEMENTS (continued)
Repurchase rights
On or after March 1, 2023 and on or before the 40th scheduled trading day immediately before the maturity date, the Company may redeem for cash all or part of the Notes at a repurchase price equal to 100% of the principal amount, plus accrued and unpaid interest, if the last reported sale price of the Company’s common stock exceeded 130% of the conversion price then in effect for at least 20 trading days (whether or not consecutive) during any 30 consecutive trading day period ending on, and including, the trading day immediately preceding the date on which the Company provides a redemption notice.
If certain corporate events that constitute a “Fundamental Change” occur, each noteholder will have the right to require the Company to repurchase for cash all of such noteholder’s Notes, or any portion of the principal thereof that is equal to $1,000 or a multiple of $1,000, at a repurchase price equal to 100% of the principal amount thereof, plus accrued and unpaid interest. A Fundamental Change relates to mergers, changes in control of the Company, liquidation/dissolution of the Company, or the delisting of the Company’s common stock.
Carrying value of the Notes: | | | | | | | | | | | |
| (in thousands) | June 30, 2024 | | December 31, 2023 |
| Principal | $ | 502,270 | | | $ | 502,270 | |
| Unamortized issuance costs | (1,666) | | | (2,902) | |
| Convertible senior notes, net | $ | 500,604 | | | $ | 499,368 | |
Interest expense related to the Notes: | | | | | | | | | | | | | | | | | | | | | | | |
| Three Months Ended
June 30, | | Six Months Ended
June 30, |
| (in thousands) | 2024 | | 2023 | | 2024 | | 2023 |
Contractual interest expense (0.75% coupon) | $ | 942 | | | $ | 997 | | | $ | 1,884 | | | $ | 2,122 | |
Amortization of issuance costs | 619 | | | 647 | | | 1,236 | | | 1,375 | |
| $ | 1,561 | | | $ | 1,644 | | | $ | 3,120 | | | $ | 3,497 | |
The average interest rate on the Notes in the six months ended June 30, 2024 and 2023 was 1.2%.
Future payments: | | | | | | | | | | | | | | | | | |
| June 30, 2024 |
| (in thousands) | Principal | | Interest | | Total |
| Remainder of 2024 | $ | — | | | $ | 1,883 | | | $ | 1,883 | |
| 2025 | 502,270 | | | 1,884 | | | 504,154 | |
| | | | | |
| $ | 502,270 | | | $ | 3,767 | | | $ | 506,037 | |
Capped call transactions
In February 2020, the Company entered into privately negotiated capped call transactions (the “Capped Call Transactions”) with certain financial institutions. The Capped Call Transactions initially covered approximately 4.4 million shares (representing the number of shares for which the Notes were initially convertible) of the Company’s common stock. In the three and six months ended June 30, 2023, Capped Call Transactions covering approximately 0.5 million and 0.7 million shares, respectively, were settled for proceeds of $0.1 million and $0.3 million, respectively. As of June 30, 2024, Capped Call Transactions covering approximately 3.7 million shares were outstanding.
The Capped Call Transactions are expected to reduce common stock dilution and/or offset any potential cash payments the Company must make, other than for principal and interest, upon conversion of the Notes, with such reduction and/or offset subject to a cap of $196.44. The cap price of the Capped Call Transactions is subject to adjustment upon specified extraordinary events affecting the Company, including mergers and tender offers.
The Capped Call Transactions are accounted for as derivative instruments and do not qualify for the Company’s own equity scope exception in ASC 815 since, in some cases of early settlement, the settlement value calculated following the governing documents may not represent a fair value measurement. The Capped Call Transactions are remeasured to fair value each reporting period, resulting in a non-operating gain or loss.
PEGASYSTEMS INC.
NOTES TO UNAUDITED CONDENSED CONSOLIDATED FINANCIAL STATEMENTS (continued)
Change in capped call transactions: | | | | | | | | | | | |
| Six Months Ended
June 30, |
| (in thousands) | 2024 | | 2023 |
| January 1, | $ | 893 | | | $ | 2,582 | |
| Settlements | — | | | (341) | |
| Fair value adjustment | 22 | | | 1,845 | |
| June 30, | $ | 915 | | | $ | 4,086 | |
Credit facility
In November 2019, and as since amended, the Company entered into a five-year $100 million senior secured revolving credit agreement (the “Credit Facility”) with PNC Bank, National Association. The Company may use borrowings for general corporate purposes and to finance working capital needs. Subject to specific conditions and the agreement of the financial institutions lending the additional amount, the aggregate commitment may be increased to $200 million. The commitments expire on November 4, 2024, and any outstanding loans will be payable on such date. On April 23, 2024, the Credit Facility was amended to extend the expiration date to February 4, 2025. The Credit Facility, as amended, contains customary covenants, including, but not limited to, those relating to additional indebtedness, liens, asset divestitures, and affiliate transactions. Beginning with the fiscal quarter ended March 31, 2024, the Company must maintain a maximum net consolidated leverage ratio of 3.5 to 1.0 (with a step-up for certain acquisitions) and a minimum consolidated interest coverage ratio of 3.5 to 1.
As of June 30, 2024 and December 31, 2023, the Company had $27.3 million in outstanding letters of credit under the Credit Facility, reducing available borrowing capacity, but no outstanding cash borrowings.
NOTE 9. RESTRUCTURING
The Company has undertaken the following restructuring activities as it optimizes its go-to-market strategy and reassesses its office space needs:
| | | | | | | | | | | |
| (in thousands) | Three months ended | | Expense |
| Office space reduction | March 31, 2023 | | $ | 1,241 | |
| Employee severance and related benefits | June 30, 2023 | | $ | 1,581 | |
Employee severance and related benefits and office space reduction | September 30, 2023 | | $ | 17,236 | |
| Office space reduction | December 31, 2023 | | $ | 1,497 | |
| Office space reduction | June 30, 2024 | | $ | 1,257 | |
Accrued employee severance and related benefits:
Change for all restructuring actions:
| | | | | | | | | | | |
| Six Months Ended
June 30, |
| (in thousands) | 2024 | | 2023 |
| January 1, | $ | 8,095 | | | $ | 18,573 | |
| Costs incurred | (238) | | | 2,387 | |
| Cash disbursements | (3,852) | | | (17,521) | |
| Currency translation adjustments | (169) | | | 185 | |
| June 30, | $ | 3,836 | | | $ | 3,624 | |
Note: Accrued employee severance and related benefits is included in accrued compensation and related expenses.
NOTE 10. FAIR VALUE MEASUREMENTS
Assets and liabilities measured at fair value on a recurring basis
The Company records its cash equivalents, marketable securities, Capped Call Transactions, and venture investments at fair value on a recurring basis. Fair value is an exit price, representing the amount that would be received from the sale of an asset or paid to transfer a liability in an orderly transaction between market participants based on assumptions that market participants would use in pricing an asset or liability.
As a basis for classifying the fair value measurements, a three-tier fair value hierarchy, which classifies the fair value measurements based on the inputs used in measuring fair value, was established as follows:
•Level 1 - observable inputs, such as quoted prices in active markets for identical assets or liabilities;
•Level 2 - significant other inputs that are observable either directly or indirectly; and
PEGASYSTEMS INC.
NOTES TO UNAUDITED CONDENSED CONSOLIDATED FINANCIAL STATEMENTS (continued)
•Level 3 - significant unobservable inputs with little or no market data, which require the Company to develop its own assumptions.
This hierarchy requires the Company to use observable market data when available and minimize unobservable inputs when determining fair value.
The fair value of the Capped Call Transactions at the end of each reporting period is determined using a Black-Scholes option-pricing model. The valuation model uses various market-based inputs, including stock price, remaining contractual term, expected volatility, risk-free interest rate, and expected dividend yield. The Company applies judgment when determining expected volatility. The Company considers the underlying equity security’s historical and implied volatility levels. The Company’s venture investments are recorded at fair value based on multiple valuation methods, including observable public companies and transaction prices and unobservable inputs, including the volatility, rights, and obligations of the securities the Company holds.
Assets and liabilities measured at fair value on a recurring basis: | | | | | | | | | | | | | | | | | | | | | | | | | | | | | | | | | | | | | | | | | | | | | | | |
| June 30, 2024 | | December 31, 2023 |
| (in thousands) | Level 1 | | Level 2 | | Level 3 | | Total | | Level 1 | | Level 2 | | Level 3 | | Total |
| Cash equivalents | $ | 18,345 | | | $ | — | | | $ | — | | | $ | 18,345 | | | $ | 54,357 | | | $ | — | | | $ | — | | | $ | 54,357 | |
| Marketable securities | $ | — | | | $ | 406,819 | | | $ | — | | | $ | 406,819 | | | $ | — | | | $ | 193,436 | | | $ | — | | | $ | 193,436 | |
Capped Call Transactions | $ | — | | | $ | 915 | | | $ | — | | | $ | 915 | | | $ | — | | | $ | 893 | | | $ | — | | | $ | 893 | |
Venture investments (1) | $ | — | | | $ | — | | | $ | 21,047 | | | $ | 21,047 | | | $ | — | | | $ | — | | | $ | 19,450 | | | $ | 19,450 | |
(1) Investments in privately-held companies
Changes in venture investments: | | | | | | | | | | | |
| Six Months Ended
June 30, |
| (in thousands) | 2024 | | 2023 |
| January 1, | $ | 19,450 | | | $ | 13,069 | |
| New investments | 350 | | | 400 | |
| Sales of investments | — | | | (2,773) | |
| Changes in foreign exchange rates | (19) | | | 119 | |
| Changes in fair value: | | | |
included in other income, net | 1,628 | | | 4,475 | |
included in other comprehensive income (loss) | (362) | | | (1,908) | |
| June 30, | $ | 21,047 | | | $ | 13,382 | |
The carrying value of certain financial instruments, including receivables and accounts payable, approximates fair value due to their short maturities.
Fair value of the Convertible Senior Notes
The fair value of the Notes outstanding (including the embedded conversion feature) was $485.3 million as of June 30, 2024, and $466.5 million as of December 31, 2023.
The fair value was determined based on the Notes’ quoted price in an over-the-counter market on the last trading day of the reporting period and classified within Level 2 in the fair value hierarchy.
NOTE 11. REVENUE
Geographic revenue | | | | | | | | | | | | | | | | | | | | | | | | | | | | | | | | | | | |
| Three Months Ended
June 30, | | Six Months Ended
June 30, |
(Dollars in thousands) | 2024 | | 2023 | | 2024 | | 2023 |
| U.S. | $ | 189,214 | | 54 | % | | $ | 150,385 | | 50 | % | | $ | 370,197 | | 55 | % | | $ | 334,904 | | 54 | % |
| Other Americas | 21,314 | | 6 | % | | 19,505 | | 7 | % | | 43,100 | | 6 | % | | 34,516 | | 6 | % |
| United Kingdom (“U.K.”) | 38,628 | | 11 | % | | 28,892 | | 10 | % | | 70,745 | | 10 | % | | 71,129 | | 11 | % |
| Europe (excluding U.K.), Middle East, and Africa | 53,360 | | 15 | % | | 54,353 | | 18 | % | | 115,207 | | 17 | % | | 105,671 | | 17 | % |
| Asia-Pacific | 48,637 | | 14 | % | | 45,133 | | 15 | % | | 82,051 | | 12 | % | | 77,520 | | 12 | % |
| $ | 351,153 | | 100 | % | | $ | 298,268 | | 100 | % | | $ | 681,300 | | 100 | % | | $ | 623,740 | | 100 | % |
PEGASYSTEMS INC.
NOTES TO UNAUDITED CONDENSED CONSOLIDATED FINANCIAL STATEMENTS (continued)
Revenue streams
| | | | | | | | | | | | | | | | | | | | | | | |
| Three Months Ended
June 30, | | Six Months Ended
June 30, |
(in thousands) | 2024 | | 2023 | | 2024 | | 2023 |
| Subscription license | $ | 84,647 | | | $ | 41,197 | | | $ | 147,985 | | | $ | 125,724 | |
| Perpetual license | 36 | | | 1,579 | | | 895 | | | 1,982 | |
| Revenue recognized at a point in time | 84,683 | | | 42,776 | | | 148,880 | | | 127,706 | |
| Maintenance | 80,344 | | | 82,042 | | | 161,345 | | | 161,672 | |
| Pega Cloud | 134,086 | | | 115,063 | | | 264,988 | | | 222,942 | |
| Consulting | 52,040 | | | 58,387 | | | 106,087 | | | 111,420 | |
| Revenue recognized over time | 266,470 | | | 255,492 | | | 532,420 | | | 496,034 | |
| Total revenue | $ | 351,153 | | | $ | 298,268 | | | $ | 681,300 | | | $ | 623,740 | |
| | | | | | | | | | | | | | | | | | | | | | | |
| Three Months Ended
June 30, | | Six Months Ended
June 30, |
| (in thousands) | 2024 | | 2023 | | 2024 | | 2023 |
| Pega Cloud | $ | 134,086 | | | $ | 115,063 | | | $ | 264,988 | | | $ | 222,942 | |
| Maintenance | 80,344 | | | 82,042 | | | 161,345 | | | 161,672 | |
| Subscription services | 214,430 | | | 197,105 | | | 426,333 | | | 384,614 | |
| Subscription license | 84,647 | | | 41,197 | | | 147,985 | | | 125,724 | |
| Subscription | 299,077 | | | 238,302 | | | 574,318 | | | 510,338 | |
| Consulting | 52,040 | | | 58,387 | | | 106,087 | | | 111,420 | |
| Perpetual license | 36 | | | 1,579 | | | 895 | | | 1,982 | |
| $ | 351,153 | | | $ | 298,268 | | | $ | 681,300 | | | $ | 623,740 | |
Remaining performance obligations ("Backlog")
Expected future revenue from existing non-cancellable contracts:
As of June 30, 2024: | | | | | | | | | | | | | | | | | | | | | | | | | | | | | | | | | | | | | | |
| (Dollars in thousands) | Subscription services | | Subscription license | | Perpetual license | | Consulting | | Total |
| Pega Cloud | | Maintenance | | | | |
1 year or less | $ | 470,379 | | | $ | 209,655 | | | $ | 23,931 | | | $ | 2,696 | | | $ | 25,953 | | | $ | 732,614 | | 52 | % |
1-2 years | 301,070 | | | 63,266 | | | 10,078 | | | — | | | 2,469 | | | 376,883 | | 27 | % |
2-3 years | 152,839 | | | 30,032 | | | 2,884 | | | — | | | 2,473 | | | 188,228 | | 13 | % |
Greater than 3 years | 90,474 | | | 17,953 | | | 97 | | | — | | | — | | | 108,524 | | 8 | % |
| $ | 1,014,762 | | | $ | 320,906 | | | $ | 36,990 | | | $ | 2,696 | | | $ | 30,895 | | | $ | 1,406,249 | | 100 | % |
As of June 30, 2023:
| | | | | | | | | | | | | | | | | | | | | | | | | | | | | | | | | | | | | | |
| (Dollars in thousands) | Subscription services | | Subscription license | | Perpetual license | | Consulting | | Total |
| Pega Cloud | | Maintenance | | | | |
1 year or less | $ | 397,183 | | | $ | 214,579 | | | $ | 35,616 | | | $ | 4,979 | | | $ | 37,355 | | | $ | 689,712 | | 55 | % |
1-2 years | 238,691 | | | 58,551 | | | 3,026 | | | 2,252 | | | 6,772 | | | 309,292 | | 24 | % |
2-3 years | 124,616 | | | 25,103 | | | 6,764 | | | — | | | 1,523 | | | 158,006 | | 12 | % |
Greater than 3 years | 101,494 | | | 7,592 | | | — | | | — | | | — | | | 109,086 | | 9 | % |
| $ | 861,984 | | | $ | 305,825 | | | $ | 45,406 | | | $ | 7,231 | | | $ | 45,650 | | | $ | 1,266,096 | | 100 | % |
PEGASYSTEMS INC.
NOTES TO UNAUDITED CONDENSED CONSOLIDATED FINANCIAL STATEMENTS (continued)
NOTE 12. STOCK-BASED COMPENSATION
Expense
| | | | | | | | | | | | | | | | | | | | | | | |
| Three Months Ended
June 30, | | Six Months Ended
June 30, |
| (in thousands) | 2024 | | 2023 | | 2024 | | 2023 |
Cost of revenue | $ | 7,092 | | | $ | 7,174 | | | $ | 13,664 | | | $ | 16,087 | |
Selling and marketing | 13,564 | | | 15,349 | | | 27,452 | | | 33,009 | |
Research and development | 7,825 | | | 7,851 | | | 15,471 | | | 16,911 | |
General and administrative | 7,743 | | | 5,853 | | | 14,418 | | | 12,777 | |
| $ | 36,224 | | | $ | 36,227 | | | $ | 71,005 | | | $ | 78,784 | |
Income tax benefit | $ | (554) | | | $ | (581) | | | $ | (865) | | | $ | (1,253) | |
As of June 30, 2024, the Company had $149.7 million of unrecognized stock-based compensation expense, net of estimated forfeitures, which is expected to be recognized over a weighted-average period of 1.7 years.
Grants | | | | | | | | | | | |
| Six Months Ended
June 30, 2024 |
| (in thousands) | Quantity | | Total Fair Value |
Restricted stock units (1) | 1,266 | | | $ | 78,071 | |
Non-qualified stock options | 1,738 | | | $ | 44,874 | |
Performance stock options (2) | 566 | | | $ | 13,921 | |
| | | |
(1) Includes units issued when employees elect to receive 50% of the employee’s target incentive compensation under the Company’s Corporate Incentive Compensation Plan (the “CICP”) in the form of RSUs instead of cash.
(2) Performance stock options allow the holder to purchase a specified number of common stock shares at an exercise price equal to or greater than the shares' fair market value at the grant date. For the performance stock options granted in the six months ended June 30, 2024, 25% can vest on the first anniversary of the grant date, and 75% can vest on the second anniversary of the grant date, based on the achievement of specific performance conditions. The options expire ten years from the grant date.
NOTE 13. INCOME TAXES
Effective income tax rate
| | | | | | | | | | | | | | | |
| | | Six Months Ended
June 30, |
| (Dollars in thousands) | | | | | 2024 | | 2023 |
| Provision for income taxes | | | | | $ | 5,604 | | | $ | 11,850 | |
| Effective income tax rate | | | | | * | | (21) | % |
* not meaningful
The Company’s effective income tax rate for the six months ended June 30, 2024, is impacted by the jurisdictional mix and timing of the actual compared to projected earnings (losses). It is also impacted by the valuation allowance on its deferred tax assets in the U.S. and U.K. and a near break-even pretax income resulting in a not meaningful high effective income tax rate.
The Company recognizes deferred tax assets to the extent that it believes that these assets are more likely than not to be realized. A deferred tax valuation allowance requires significant judgment and uncertainties, including assumptions about future taxable income. Quarterly, the Company reassesses the need for a valuation allowance on its net deferred tax assets by weighting all available and objectively verifiable negative and positive evidence, including projected future reversals of existing taxable temporary differences, committed contractual backlog (“Backlog”), projected future taxable income, including the impact of enacted legislation, tax-planning strategies, and recent operating results.
The Company intends to maintain a valuation allowance on its U.S. and U.K. net deferred tax assets until sufficient evidence exists to support their realization.
PEGASYSTEMS INC.
NOTES TO UNAUDITED CONDENSED CONSOLIDATED FINANCIAL STATEMENTS (continued)
NOTE 14. EARNINGS (LOSS) PER SHARE
Basic earnings (loss) per share is calculated using the weighted-average number of common shares outstanding during the period. Diluted earnings (loss) per share is calculated using the weighted-average number of common shares outstanding during the period, plus the dilutive effect of outstanding stock options, RSUs, and convertible senior notes.
Calculation of earnings (loss) per share: | | | | | | | | | | | | | | | | | | | | | | | |
| Three Months Ended
June 30, | | Six Months Ended
June 30, |
| (in thousands, except per share amounts) | 2024 | | 2023 | | 2024 | | 2023 |
| Net income (loss) | $ | 6,613 | | | $ | (46,804) | | | $ | (5,511) | | | $ | (67,578) | |
| Weighted-average common shares outstanding | 85,157 | | | 83,039 | | | 84,712 | | | 82,823 | |
| Earnings (loss) per share, basic | $ | 0.08 | | | $ | (0.56) | | | $ | (0.07) | | | $ | (0.82) | |
| | | | | | | |
| Net income (loss) | $ | 6,613 | | | $ | (46,804) | | | $ | (5,511) | | | $ | (67,578) | |
| | | | | | | |
| Numerator for diluted EPS | $ | 6,613 | | | $ | (46,804) | | | $ | (5,511) | | | $ | (67,578) | |
| Weighted-average effect of dilutive securities: | | | | | | | |
| | | | | | | |
| Stock options | 2,164 | | | — | | | — | | | — | |
| RSUs | 1,179 | | | — | | | — | | | — | |
| Effect of dilutive securities | 3,343 | | | — | | | — | | | — | |
Weighted-average common shares outstanding, assuming dilution (1) (2) (3) | 88,500 | | | 83,039 | | | 84,712 | | | 82,823 | |
| Earnings (loss) per share, diluted | $ | 0.07 | | | $ | (0.56) | | | $ | (0.07) | | | $ | (0.82) | |
| | | | | | | |
Outstanding anti-dilutive stock options and RSUs (4) | 5 | | | 1,354 | | | 3,259 | | | 1,351 | |
(1) All dilutive securities are excluded when their inclusion would be anti-dilutive.
(2) The shares underlying the conversion options in the Company’s Notes are included using the if-converted method, if dilutive in the period. If the outstanding conversion options were fully exercised, the Company would issue approximately 3.7 million shares as of June 30, 2024.
(3) The Company’s Capped Call Transactions represent the equivalent of approximately 3.7 million shares of the Company’s common stock (representing the number of shares for which the Notes are convertible) as of June 30, 2024. The Capped Call Transactions are expected to reduce common stock dilution and/or offset any potential cash payments the Company must make, other than for principal and interest, upon conversion of the Notes, with such reduction and/or offset subject to a cap of $196.44. The Capped Call Transactions are excluded from weighted-average common shares outstanding, assuming dilution, in all periods as their effect would be anti-dilutive.
(4) Outstanding stock options and RSUs that were anti-dilutive under the treasury stock method in the period were excluded from the computation of diluted earnings (loss) per share. These awards may be dilutive in the future.
NOTE 15. COMMITMENTS AND CONTINGENCIES
Commitments
See "Note 7. Leases" for additional information.
Legal proceedings
In addition to the matters below, the Company is or may become involved in a variety of claims, demands, suits, investigations, and proceedings that arise from time to time relating to matters incidental to the ordinary course of the Company’s business, including actions concerning contracts, intellectual property, employment, benefits, and securities matters. Regardless of the outcome, legal disputes can have a material effect on the Company because of defense and settlement costs, diversion of management resources, and other factors.
In addition, as the Company is a party to ongoing litigation, it is at least reasonably possible that the Company’s estimates will change in the near term, and the effect may be material. The Company had no accrued losses for litigation for the below matters as of June 30, 2024 and December 31, 2023.
PEGASYSTEMS INC.
NOTES TO UNAUDITED CONDENSED CONSOLIDATED FINANCIAL STATEMENTS (continued)
Appian Corp. v. Pegasystems Inc. & Youyong Zou
The Company is a defendant in litigation brought by Appian in the Circuit Court of Fairfax County, Virginia (the “Court”) titled Appian Corp. v. Pegasystems Inc. & Youyong Zou, No. 2020-07216 (Fairfax Cty. Ct.). On May 9, 2022, the jury rendered its verdict finding that the Company had misappropriated one or more of Appian’s trade secrets, that the Company had violated the Virginia Computer Crimes Act, and that the trade secret misappropriation was willful and malicious. The jury awarded damages of $2,036,860,045 for trade secret misappropriation and $1.00 for violating the Virginia Computer Crimes Act. On September 15, 2022, the circuit court of Fairfax County entered judgment of $2,060,479,287, consisting of the damages previously awarded by the jury plus attorneys’ fees and costs, and stating that the judgment is subject to post-judgment interest at a rate of 6.0% per annum, from the date of the jury verdict (May 9, 2022) as to the amount of the jury verdict and from September 15, 2022 as to the amount of the award of attorneys’ fees and costs. On September 15, 2022, the Company filed a notice of appeal from the judgment. On September 29, 2022, the circuit court of Fairfax County approved a $25,000,000 letter of credit obtained by the Company to secure the judgment and entered an order suspending the judgment during the pendency of the Company’s appeal. A panel of the Court of Appeals of Virginia heard oral arguments on November 15, 2023, and will issue a written opinion in the future. Although it is not possible to predict timing, the entirety of the appeals process could potentially take years to complete. The Company continues to believe that it did not misappropriate any alleged trade secrets and that its sales of the Company’s products at issue were not caused by, or the result of, any alleged misappropriation of trade secrets. The Company is unable to reasonably estimate possible damages because of, among other things, uncertainty as to the outcome of appellate proceedings and/or any potential new trial resulting from the appellate proceedings.
City of Fort Lauderdale Police and Firefighters’ Retirement System, Individually and on Behalf of All Others Similarly Situated v. Pegasystems Inc., Alan Trefler, and Kenneth Stillwell
On May 19, 2022, a lawsuit was filed against the Company, the Company’s chief executive officer, and the Company’s chief operating and financial officer in the United States District Court for the Eastern District of Virginia Alexandria Division, captioned City of Fort Lauderdale Police and Firefighters’ Retirement System, Individually and on Behalf of All Others Similarly Situated v. Pegasystems Inc., Alan Trefler, and Kenneth Stillwell (Case 1:22-cv-00578-LMB-IDD). The complaint generally alleges, among other things, that the defendants violated Section 10(b) of the Securities Exchange Act of 1934, as amended (the “Exchange Act”) and Rule 10b-5 promulgated thereunder and that the individual defendants violated Section 20(a) of the Exchange Act, in each case by allegedly making materially false and/or misleading statements, as well as allegedly failing to disclose material adverse facts about the Company’s business, operations, and prospects, which caused the Company’s securities to trade at artificially inflated prices. The complaint seeks unspecified damages on behalf of a class of purchasers of the Company’s securities between May 29, 2020 and May 9, 2022. The litigation has since been transferred to the United States District Court for the District of Massachusetts (Case 1:22-cv-11220-WGY), and lead plaintiff class representatives - Central Pennsylvania Teamsters Pension Fund - Defined Benefit Plan, Central Pennsylvania Teamsters Pension Fund - Retirement Income Plan 1987, and Construction Industry Laborers Pension Fund - have been appointed. On October 18, 2022, a consolidated amended complaint was filed that does not add any new parties or legal claims, is based upon the same general factual allegations as the original complaint, and now seeks unspecified damages on behalf of a class of purchasers of the Company’s securities between June 16, 2020 and May 9, 2022. The Company moved to dismiss the consolidated amended complaint on December 19, 2022. The hearing on the Company’s motion to dismiss took place on May 17, 2023. After hearing argument from both sides, the Court denied the Company’s motion from the bench and stated that a written opinion would follow. On June 30, 2023, the Company filed its Answer to the complaint. On July 24, 2023, the Court issued its written opinion denying the motion to dismiss as to the Company and Defendant Trefler but granting the motion without prejudice as to Mr. Stillwell.
On March 4, 2024, the parties agreed in principle to a proposed settlement of the litigation for an aggregate sum of $35 million. On April 23, 2024, the parties executed a stipulation of settlement. On April 23, 2024, the plaintiffs filed a motion seeking preliminary approval of the settlement. On May 15, 2024, the Court granted plaintiffs’ motion for preliminary approval of the settlement and scheduled a settlement hearing for September 19, 2024. The deadline for the proposed class of shareholders to object to the proposed settlement is August 29, 2024. In May 2024, the Company paid $32.4 million and the Company’s insurance carriers paid $2.6 million pending final approval of the settlement. It is possible that actual future losses related to the litigation could exceed the settlement amount if and to the extent that the court does not approve the proposed settlement.
PEGASYSTEMS INC.
NOTES TO UNAUDITED CONDENSED CONSOLIDATED FINANCIAL STATEMENTS (continued)
In re Pegasystems Inc., Derivative Litigation
On November 21, 2022, a lawsuit was filed against the members of the Company’s board of directors, the Company’s chief operating and financial officer and the Company in the United States District Court for the District of Massachusetts, captioned Mary Larkin, derivatively on behalf of nominal defendant Pegasystems Inc. v. Peter Gyenes, Richard Jones, Christopher Lafond, Dianne Ledingham, Sharon Rowlands, Alan Trefler, Larry Weber, and Kenneth Stillwell, defendants, and Pegasystems Inc., nominal defendant (Case 1:22-cv-11985). The complaint generally alleges the defendants sold shares of the Company while in possession of material nonpublic information relating to (i) the litigation brought by Appian in the Circuit Court of Fairfax County, Virginia, described above, and (ii) alleged misconduct by Company employees alleged in that litigation. On April 28, 2023, a lawsuit was filed in the United States District Court for the District of Massachusetts by Dag Sagfors, derivatively on behalf of nominal defendant Pegasystems Inc., asserting breach of fiduciary duty and related claims relating to the Virginia Appian litigation against the same defendants as the Larkin lawsuit. On May 17, 2023, the Larkin and Sagfors cases were consolidated and a joint motion to stay the consolidated case is pending before the Court. The Company also has received confidential demand letters raising substantially the same allegations set forth in the foregoing derivative complaints. On April 12, 2023, the Company’s board of directors (other than Mr. Trefler, who recused himself), formed a committee consisting solely of independent directors, to review, analyze, and investigate the matters raised in the demands and to determine in good faith what actions (if any) are reasonably believed to be appropriate under similar circumstances and reasonably believed to be in the best interests of the Company in response to the demand letters. On June 28, 2024, a lawsuit was filed against members of the Company’s board of directors, certain employees of the Company and the Company in the Business Litigation Section of the Superior Court in Suffolk County, Massachusetts, captioned John Dwyer and Ray Gerber, Plaintiffs, v. Alan Trefler, Peter Gyenes, Richard Jones, Christopher Lafond, Dianne Ledingham, Sharon Rowlands, Larry Weber, Leon Trefler, Don Schuerman, Kerim Akgonul, and Benjamin Baril, Defendants, Pegasystems Inc., Nominal Defendant (Case 2484CV01734). The complaint generally alleges the defendants breached their fiduciary duties in connection with alleged misconduct by Company employees alleged in the litigation brought by Appian in the Circuit Court of Fairfax County, Virginia, described above, and alleges damages from the approximately $2 billion verdict in the litigation brought by Appian in the Circuit Court of Fairfax County, Virginia, described above, the recent class action settlement, and litigation costs from various proceedings. On July 17, 2024, the parties filed a stipulation with the court in which they agreed to extend defendants’ time to respond to the operative complaint to 45 days following a decision from the Virginia Court of Appeals. The Company is unable to reasonably estimate possible damages or a range of possible damages in these matters given the stage of the lawsuits and there being no specified quantum of damages sought in the complaints.
SEC Inquiry
Beginning in March 2023, the U.S. Securities and Exchange Commission (“SEC”) has requested certain information relating to, among other things, the accounting treatment of the Company’s above-described litigation with Appian Corporation. The Company is fully cooperating with the SEC’s requests.
ITEM 2. MANAGEMENT’S DISCUSSION AND ANALYSIS OF FINANCIAL CONDITION AND RESULTS OF OPERATIONS
FORWARD-LOOKING STATEMENTS
This Quarterly Report on Form 10-Q (“Quarterly Report”) contains or incorporates forward-looking statements within the meaning of the Private Securities Litigation Reform Act of 1995.
Words such as expects, anticipates, intends, plans, believes, will, could, should, estimates, may, targets, strategies, intends to, projects, forecasts, guidance, likely, and usually or variations of such words and other similar expressions identify forward-looking statements. These statements represent our views only as of the date the statement was made and are based on current expectations and assumptions.
Forward-looking statements deal with future events and are subject to risks and uncertainties that are difficult to predict, including, but not limited to:
•our future financial performance and business plans;
•the adequacy of our liquidity and capital resources;
•the continued payment of our quarterly dividends;
•the timing of revenue recognition;
•variation in demand for our products and services, including among clients in the public sector;
•reliance on key personnel;
•reliance on third-party service providers, including hosting providers;
•compliance with our debt obligations and covenants;
•the potential impact of our convertible senior notes and Capped Call Transactions;
•foreign currency exchange rates;
•potential legal and financial liabilities, as well as damage to our reputation, due to cyber-attacks;
•security breaches and security flaws;
•our ability to protect our intellectual property rights, costs associated with defending such rights, intellectual property rights claims, and other related claims by third parties against us, including related costs, damages, and other relief that may be granted against us;
•our ongoing litigation with Appian Corp.;
•our client retention rate; and
•management of our growth.
These risks and others that may cause actual results to differ materially from those expressed in such forward-looking statements are described further in Part I of our Annual Report on Form 10-K for the year ended December 31, 2023, Part II of this Quarterly Report on Form 10-Q, and other filings we make with the U.S. Securities and Exchange Commission (“SEC”).
Investors are cautioned not to place undue reliance on such forward-looking statements, and there are no assurances that the results included in such statements will be achieved. Although subsequent events may cause our view to change, except as required by applicable law, we do not undertake and expressly disclaim any obligation to publicly update or revise these forward-looking statements, whether as the result of new information, future events, or otherwise.
The forward-looking statements in this Quarterly Report represent our views as of July 24, 2024.
NON-GAAP MEASURES
Our non-GAAP financial measures should only be read in conjunction with our consolidated financial statements prepared in accordance with GAAP. We believe that these measures help investors understand our core operating results and prospects, which is consistent with how management measures and forecasts our performance without the effect of often one-time charges and other items outside our normal operations. Management uses these measures to assess the performance of the company's operations and establish operational goals and incentives. They are not a substitute for financial measures prepared under U.S. GAAP. A reconciliation of GAAP and non-GAAP measures is located with each non-GAAP measure.
BUSINESS OVERVIEW
We develop, market, license, host, and support enterprise software that helps organizations build agility into their business so they can adapt to change. Our powerful, low-code platform for workflow automation and artificial intelligence-powered decisioning enables the world’s leading brands and government agencies to hyper-personalize customer experiences, streamline customer service, and automate mission-critical business processes and workflows. With Pega, our clients can leverage our artificial intelligence (“AI”) technology and scalable architecture to accelerate their digital transformation. In addition, our client success teams, world-class partners, and clients leverage our Pega Express™ methodology to design and deploy mission-critical applications quickly and collaboratively.
Our target clients are Global 2000 organizations and government agencies that require solutions to distinguish themselves in the markets they serve. Our solutions achieve and facilitate differentiation by increasing business agility, driving growth, improving productivity, attracting and retaining customers, and reducing risk. Along with our partners, we deliver solutions tailored to our clients’ specific industry.
Performance metrics
We use performance metrics to analyze and assess our overall performance, make operating decisions, and forecast and plan for future periods, including:
Annual contract value (“ACV”)
ACV represents the annualized value of our active contracts as of the measurement date. The contract's total value is divided by its duration in years to calculate ACV. ACV is a performance measure that we believe provides useful information to our management and investors. 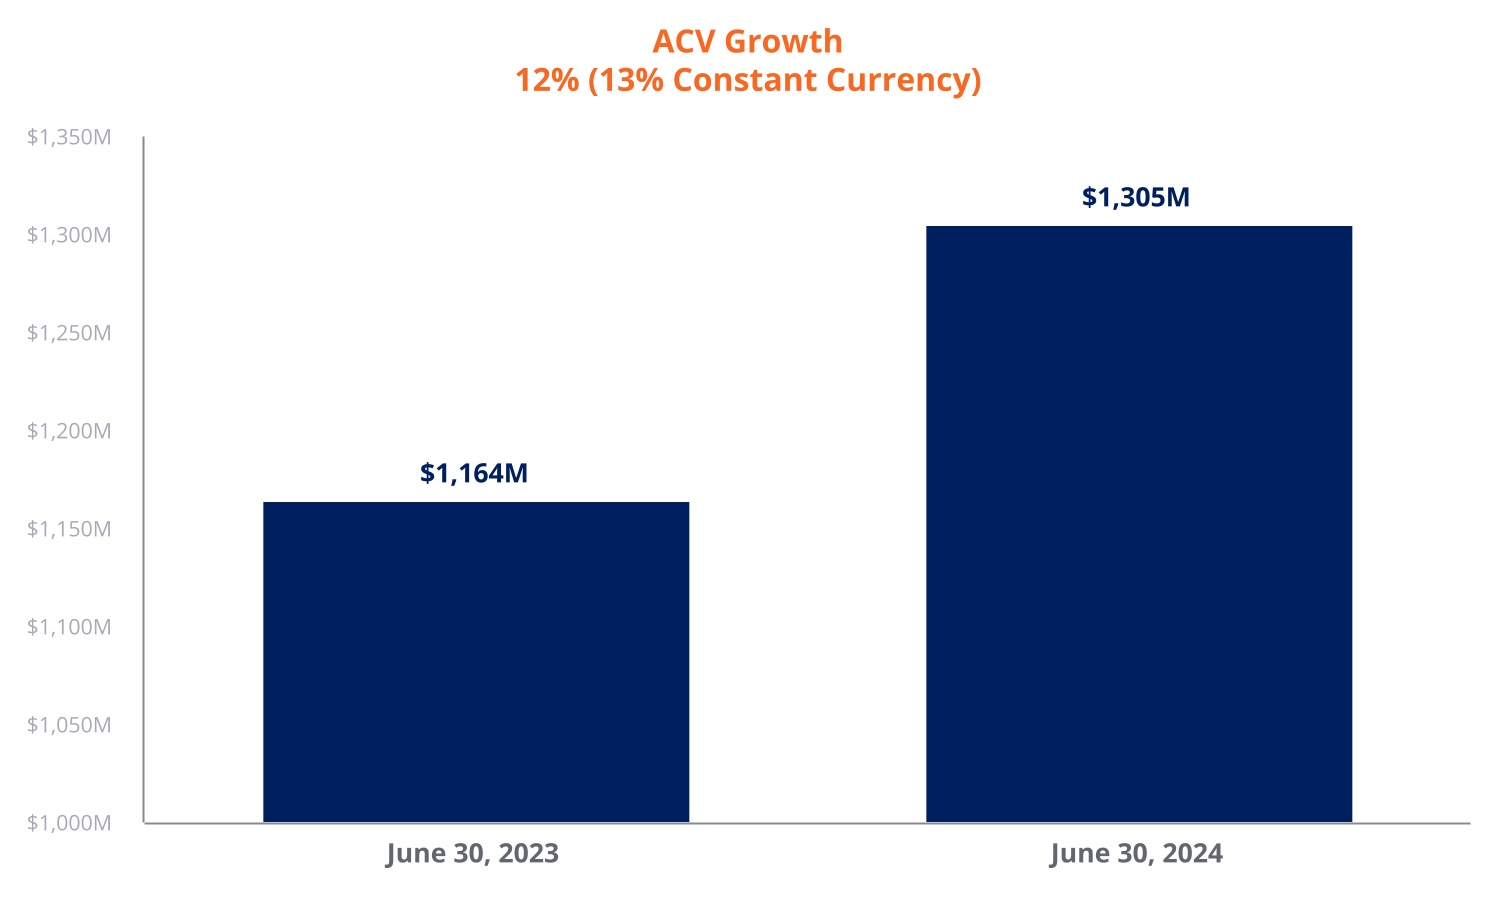
Reconciliation of ACV and constant currency ACV
| | | | | | | | | | | | | | | | | | | | | | | |
| (in millions, except percentages) | June 30, 2023 | | | | | | | | June 30, 2024 | | 1-Year Change |
| ACV | $ | 1,164 | | | | | | | | | $ | 1,305 | | | 12 | % |
| Impact of changes in foreign exchange rates | — | | | | | | | | | 5 | | | |
Constant currency ACV | $ | 1,164 | | | | | | | | | $ | 1,310 | | | 13 | % |
Note: Constant currency ACV is calculated by applying the June 30, 2023 foreign exchange rates to all periods shown.
Cash flow (1)
| | | | | | | | | | | | | | | | | |
(Dollars in thousands) | Six Months Ended
June 30, | | Change |
| 2024 | | 2023 | |
| Cash provided by operating activities | $ | 220,243 | | | $ | 113,752 | | | 94 | % |
| Investment in property and equipment | (1,857) | | | (13,933) | | | |
Free cash flow (1) | $ | 218,386 | | | $ | 99,819 | | | 119 | % |
| | | | | |
Supplemental information (2) | | | | | |
| Litigation settlement, net of recoveries | $ | 32,403 | | | $ | — | | | |
Legal fees | 2,701 | | | 2,950 | | | |
| Restructuring | 3,852 | | | 17,521 | | | |
| Interest on convertible senior notes | 1,884 | | | 2,250 | | | |
| | | | | |
Income taxes | 25,560 | | | 6,627 | | | |
| $ | 66,400 | | | $ | 29,348 | | | |
(1) Our non-GAAP free cash flow is defined as cash provided by operating activities less investment in property and equipment. Investment in property and equipment fluctuates in amount and frequency and is significantly affected by the timing and size of investments in our facilities. We provide information on free cash flow to enable investors to assess our ability to generate cash without incurring additional external financings. This information is not a substitute for financial measures prepared under U.S. GAAP.
(2) The supplemental information discloses items that affect our cash flows and are considered by management not to be representative of our core business operations and ongoing operational performance.
◦Litigation settlement, net of recoveries: Cost to settle litigation, net of insurance recoveries, arising from proceedings outside the ordinary course of business. See Note 15. Commitments and Contingencies in our Quarterly Report for the three months ended June 30, 2024 for additional information.
◦Legal fees: Legal and related fees arising from proceedings outside the ordinary course of business.
◦Restructuring: Restructuring fluctuates in amount and frequency and is significantly affected by the timing and size of our restructuring activities.
◦Interest on convertible senior notes: In February 2020, we issued convertible senior notes, due March 1, 2025, in a private placement. The convertible senior notes accrue interest at an annual rate of 0.75%, payable semi-annually in arrears on March 1 and September 1.
◦Income taxes: Direct income taxes paid net of refunds received.
Remaining performance obligations (“Backlog”)
Reconciliation of Backlog and Constant Currency Backlog (Non-GAAP)
| | | | | | | | | | | | | | | | | |
| (in millions, except percentages) | June 30, 2023 | | June 30, 2024 | | 1-Year Growth Rate |
| Backlog - GAAP | $ | 1,266 | | | $ | 1,406 | | | 11 | % |
| Impact of changes in foreign exchange rates | — | | | 7 | | | |
| Constant currency backlog | $ | 1,266 | | | $ | 1,413 | | | 12 | % |
Note: Constant currency Backlog is calculated by applying the June 30, 2023 foreign exchange rates to all periods shown.CRITICAL ACCOUNTING POLICIES
Management’s Discussion and Analysis of Financial Condition and Results of Operations is based upon our unaudited condensed consolidated financial statements, which have been prepared following accounting principles generally accepted in the United States of America (“U.S.”) and the rules and regulations of the SEC for interim financial reporting. Preparing these financial statements requires us to make estimates and judgments that affect the reported amounts of assets, liabilities, revenues, expenses, and the related disclosure of contingent assets and liabilities. We base our estimates and judgments on historical experience, knowledge of current conditions, and expectations of what could occur in the future based on the available information.
For more information about our critical accounting policies, we encourage you to read the discussion in the following locations in our Annual Report on Form 10-K for the year ended December 31, 2023:
•“Critical Accounting Estimates and Significant Judgments” in Item 7; and
•“Note 2. Significant Accounting Policies” in Item 8.
No significant changes have been made to our critical accounting policies disclosed in our Annual Report on Form 10-K for the year ended December 31, 2023.
RESULTS OF OPERATIONS
Revenue
| | | | | | | | | | | | | | | | | | | | | | | | | | | | | | | | | | | | | | | | | | | | | | | | | | | | | |
| (Dollars in thousands) | Three Months Ended
June 30, | | Change | | Six Months Ended
June 30, | | Change |
| 2024 | | 2023 | | | 2024 | | 2023 | |
| Pega Cloud | $ | 134,086 | | 38 | % | | $ | 115,063 | | 39 | % | | $ | 19,023 | | 17 | % | | $ | 264,988 | | 39 | % | | $ | 222,942 | | 36 | % | | $ | 42,046 | | 19 | % |
| Maintenance | 80,344 | | 23 | % | | 82,042 | | 27 | % | | (1,698) | | (2) | % | | 161,345 | | 23 | % | | 161,672 | | 26 | % | | (327) | | — | % |
| Subscription services | 214,430 | | 61 | % | | 197,105 | | 66 | % | | 17,325 | | 9 | % | | 426,333 | | 62 | % | | 384,614 | | 62 | % | | 41,719 | | 11 | % |
| Subscription license | 84,647 | | 24 | % | | 41,197 | | 14 | % | | 43,450 | | 105 | % | | 147,985 | | 22 | % | | 125,724 | | 20 | % | | 22,261 | | 18 | % |
| Subscription | 299,077 | | 85 | % | | 238,302 | | 80 | % | | 60,775 | | 26 | % | | 574,318 | | 84 | % | | 510,338 | | 82 | % | | 63,980 | | 13 | % |
| Consulting | 52,040 | | 15 | % | | 58,387 | | 19 | % | | (6,347) | | (11) | % | | 106,087 | | 16 | % | | 111,420 | | 18 | % | | (5,333) | | (5) | % |
| Perpetual license | 36 | | — | % | | 1,579 | | 1 | % | | (1,543) | | (98) | % | | 895 | | — | % | | 1,982 | | — | % | | (1,087) | | (55) | % |
| $ | 351,153 | | 100 | % | | $ | 298,268 | | 100 | % | | $ | 52,885 | | 18 | % | | $ | 681,300 | | 100 | % | | $ | 623,740 | | 100 | % | | $ | 57,560 | | 9 | % |
•The increases in Pega Cloud revenue for the three and six months ended June 30, 2024 were primarily due to additional investments made by our existing clients as they continued to deepen and expand their use of Pega Cloud.
•The decreases in maintenance revenue in the three and six months ended June 30, 2024 were primarily due to the shift to Pega Cloud-based offerings, which do not generally result in maintenance revenue.
•The increases in subscription license revenue in the three and six months ended June 30, 2024 were primarily due to several large multi-year contracts recognized in revenue in the three and six months ended June 30, 2024.
•The decreases in consulting revenue in the three and six months ended June 30, 2024 were primarily due to decreases in consultant billable hours.
Gross profit
| | | | | | | | | | | | | | | | | | | | | | | | | | | | | | | | | | | | | | | | | | | | | | | | | | | | | |
| (Dollars in thousands) | Three Months Ended
June 30, | | Change | | Six Months Ended
June 30, | | Change |
| 2024 | | 2023 | | | 2024 | | 2023 | |
| Pega Cloud | $ | 104,331 | | 78 | % | | $ | 84,761 | | 74 | % | | $ | 19,570 | | 23 | % | | $ | 205,636 | | 78 | % | | $ | 162,390 | | 73 | % | | $ | 43,246 | | 27 | % |
| Maintenance | 73,861 | | 92 | % | | 75,561 | | 92 | % | | (1,700) | | (2) | % | | 148,635 | | 92 | % | | 148,577 | | 92 | % | | 58 | | — | % |
| Subscription services | 178,192 | | 83 | % | | 160,322 | | 81 | % | | 17,870 | | 11 | % | | 354,271 | | 83 | % | | 310,967 | | 81 | % | | 43,304 | | 14 | % |
| Subscription license | 84,170 | | 99 | % | | 40,574 | | 98 | % | | 43,596 | | 107 | % | | 146,865 | | 99 | % | | 124,382 | | 99 | % | | 22,483 | | 18 | % |
| Subscription | 262,362 | | 88 | % | | 200,896 | | 84 | % | | 61,466 | | 31 | % | | 501,136 | | 87 | % | | 435,349 | | 85 | % | | 65,787 | | 15 | % |
| Consulting | (8,191) | | (16) | % | | (323) | | (1) | % | | (7,868) | | (2436) | % | | (12,326) | | (12) | % | | (7,638) | | (7) | % | | (4,688) | | (61) | % |
| Perpetual license | 36 | | 100 | % | | 1,555 | | 98 | % | | (1,519) | | (98) | % | | 886 | | 99 | % | | 1,955 | | 99 | % | | (1,069) | | (55) | % |
| $ | 254,207 | | 72 | % | | $ | 202,128 | | 68 | % | | $ | 52,079 | | 26 | % | | $ | 489,696 | | 72 | % | | $ | 429,666 | | 69 | % | | $ | 60,030 | | 14 | % |
•The increases in Pega Cloud gross profit percent in the three and six months ended June 30, 2024 were primarily due to increased cost efficiency, particularly for hosting services and employee compensation and benefits, as Pega Cloud continues to grow and scale.
•The increase in subscription license gross profit percent in the three months ended June 30, 2024 was primarily due to increased cost efficiency as subscription license revenue grew.
•The decreases in consulting gross profit percent in the three and six months ended June 30, 2024 were primarily due to decreases in consultant utilization rates.
Operating expenses
| | | | | | | | | | | | | | | | | | | | | | | | | | | | | | | | | | | | | | | | | |
| (Dollars in thousands) | Three Months Ended
June 30, | | Change | | Six Months Ended
June 30, | | Change |
| 2024 | | 2023 | | | 2024 | | 2023 | |
| Selling and marketing | $ | 139,761 | | | $ | 143,858 | | | $ | (4,097) | | (3) | % | | $ | 267,456 | | | $ | 293,655 | | | $ | (26,199) | | (9) | % |
| % of Revenue | 40 | % | | 48 | % | | | | | 39 | % | | 47 | % | | | |
| Research and development | $ | 75,425 | | | $ | 73,931 | | | $ | 1,494 | | 2 | % | | $ | 147,538 | | | $ | 149,307 | | | $ | (1,769) | | (1) | % |
| % of Revenue | 21 | % | | 25 | % | | | | | 22 | % | | 24 | % | | | |
| General and administrative | $ | 25,420 | | | $ | 23,462 | | | $ | 1,958 | | 8 | % | | $ | 48,947 | | | $ | 46,572 | | | $ | 2,375 | | 5 | % |
| % of Revenue | 7 | % | | 8 | % | | | | | 7 | % | | 7 | % | | | |
| Litigation settlement, net of recoveries | $ | — | | | $ | — | | | $ | — | | * | | $ | 32,403 | | | $ | — | | | $ | 32,403 | | * |
| % of Revenue | — | % | | — | % | | | | | 5 | % | | — | % | | | |
| Restructuring | $ | 635 | | | $ | 2,167 | | | $ | (1,532) | | (71) | % | | $ | 798 | | | $ | 3,628 | | | $ | (2,830) | | (78) | % |
| % of Revenue | — | % | | 1 | % | | | | | — | % | | 1 | % | | | |
* not meaningful
•The decreases in selling and marketing during the three and six months ended June 30, 2024 were primarily due to decreases in compensation and benefits of $7.6 million and $25.1 million from reduced headcount as we optimized our go-to-market strategy. For additional information, see "Note 9. Restructuring" in Part I, Item 1 of this Quarterly Report.
•The increase in research and development for the three months ended June 30, 2024 was primarily due to an increase in compensation and benefits of $1.1 million due to an increase in incentive-based compensation. The decrease in research and development for the six months ended June 30, 2024 was primarily due to a decrease in cloud hosting expenses of $1.4 million.
•The increases in general and administrative during the three and six months ended June 30, 2024 were primarily due to increases in compensation and benefits of $3.3 million and $4.1 million due to increases in incentive-based compensation.
•The increase in litigation settlement, net of recoveries in the six months ended June 30, 2024 was primarily due to the cost to settle litigation arising from proceedings outside the ordinary course of business. See "Note 15. Commitments and Contingencies" in Part I, Item 1 of this Quarterly Report and “Risk Factors” in Part I, Item 1A of our Annual Report for the year ended December 31, 2023 for additional information.
•The decreases in restructuring expenses during the three and six months ended June 30, 2024 were primarily due to efforts to optimize our go-to-market organization and office space. For additional information, see "Note 9. Restructuring" in Part I, Item 1 of this Quarterly Report.
Other income and expenses | | | | | | | | | | | | | | | | | | | | | | | | | | | | | | | | | | | | | | | | | |
| (Dollars in thousands) | Three Months Ended
June 30, | | Change | | Six Months Ended
June 30, | | Change |
| 2024 | | 2023 | | | 2024 | | 2023 | |
| Foreign currency transaction gain (loss) | $ | 437 | | | $ | (3,290) | | | $ | 3,727 | | * | | $ | (2,825) | | | $ | (5,965) | | | $ | 3,140 | | 53 | % |
| Interest income | 6,785 | | | 1,814 | | | 4,971 | | 274 | % | | 12,066 | | | 3,299 | | | 8,767 | | 266 | % |
| Interest expense | (1,656) | | | (1,778) | | | 122 | | 7 | % | | (3,408) | | | (3,696) | | | 288 | | 8 | % |
| (Loss) income on capped call transactions | (3,277) | | | (1,361) | | | (1,916) | | (141) | % | | 22 | | | 1,845 | | | (1,823) | | (99) | % |
| Other income, net | — | | | 5,702 | | | (5,702) | | (100) | % | | 1,684 | | | 12,285 | | | (10,601) | | (86) | % |
| $ | 2,289 | | | $ | 1,087 | | | $ | 1,202 | | 111 | % | | $ | 7,539 | | | $ | 7,768 | | | $ | (229) | | (3) | % |
* not meaningful
•The changes in foreign currency transaction gain (loss) in the three and six months ended June 30, 2024 was primarily due to fluctuations in foreign currency exchange rates associated with foreign currency-denominated cash and receivables held by our subsidiary in the United Kingdom.
•The increases in interest income in the three and six months ended June 30, 2024 were primarily due to higher investment balances and market interest rates.
•The changes in (loss) income on capped call transactions in the three and six months ended June 30, 2024 were due to fair value adjustments for our capped call transactions.
•The decrease in other income, net in the three months ended June 30, 2024 was due to a gain of $0.7 million on our venture investments and a gain of $5.1 million from repurchases of our convertible senior notes in the three months ended June 30, 2023. The decrease in other income, net in the six months ended June 30, 2024 was due to a gain of $7.9 million from repurchases of our convertible senior notes in the six months ended June 30, 2023 and a decrease of $2.8 million in the gain from our venture investments in the six months ended June 30, 2024. For additional information, see “Note 8. Debt” and "Note 10. Fair Value Measurements" in Part I, Item 1 of this Quarterly Report.
Provision for income taxes | | | | | | | | | | | | | | | |
| | | Six Months Ended
June 30, |
| (Dollars in thousands) | | | | | 2024 | | 2023 |
| Provision for income taxes | | | | | $ | 5,604 | | | $ | 11,850 | |
| Effective income tax rate | | | | | * | | (21) | % |
* not meaningful
Our effective income tax rate for the six months ended June 30, 2024, is impacted by the jurisdictional mix and timing of the actual compared to projected earnings (losses). It is also impacted by the valuation allowance on our deferred tax assets in the U.S. and U.K. and a near break-even pretax income resulting in a not meaningful high effective income tax rate.
The Organization for Economic Cooperation and Development (“OECD”) has introduced new global minimum tax regulations, known as Pillar Two, that began to come into effect on January 1, 2024. We are monitoring this development and evaluating its potential impact on our tax rate and eligibility to qualify for the safe harbor provisions. For 2024, we currently anticipate meeting the transitional safe harbors in most jurisdictions, with any remaining top-up tax being immaterial.
LIQUIDITY AND CAPITAL RESOURCES | | | | | | | | | | | |
| Six Months Ended
June 30, |
| (in thousands) | 2024 | | 2023 |
| Cash provided by (used in): | | | |
| Operating activities | $ | 220,243 | | | $ | 113,752 | |
| Investing activities | (209,700) | | | 15,979 | |
| Financing activities | 22,503 | | | (86,988) | |
| Effect of exchange rate changes on cash, cash equivalents, and restricted cash | (2,842) | | | 1,010 | |
| Net increase in cash, cash equivalents, and restricted cash | $ | 30,204 | | | $ | 43,753 | |
| | | | | | | | | | | |
(in thousands) | June 30, 2024 | | December 31, 2023 |
| Held in U.S. entities | $ | 468,286 | | | $ | 263,453 | |
| Held in foreign entities | 196,790 | | | 159,885 | |
| Total cash, cash equivalents, and marketable securities | 665,076 | | | 423,338 | |
| Restricted cash included in other current assets | 768 | | | — | |
| Restricted cash included in other long-term assets | 4,006 | | | 2,925 | |
Total cash, cash equivalents, marketable securities, and restricted cash | $ | 669,850 | | | $ | 426,263 | |
We believe that our current cash, marketable securities, cash flow provided by operations, borrowing capacity, and ability to engage in capital market transactions will be sufficient to fund our operations, settlement of our convertible senior notes due on March 1, 2025, stock repurchases, and quarterly cash dividends for at least the next 12 months and to meet our known long-term cash requirements. Whether these resources are adequate to meet our liquidity needs beyond that period will depend on our future growth, operating results, and the investments needed to support our operations. We may utilize available funds or seek external financing if we require additional capital resources.
If it becomes necessary or desirable to repatriate foreign funds, we may have to pay federal, state, and local income taxes as well as foreign withholding taxes upon repatriation. However, estimating the taxes we would have to pay is impracticable due to the complexity of income tax laws and regulations.
Operating activities
The change in cash provided by operating activities in the six months ended June 30, 2024 was primarily due to growth in client collections and the impact of our cost-efficiency initiatives. For additional information, see “Note 9. Restructuring” and "Note 15. Commitments and Contingencies" in Part I, Item 1 of this Quarterly Report.
Investing activities
The change in cash (used in) provided by investing activities in the six months ended June 30, 2024 was primarily due to our investments in financial instruments and reduced investment in property and equipment as we optimized our office space.
Financing activities
Debt financing
In February 2020, we issued $600 million in aggregate principal amount of convertible senior notes, which mature on March 1, 2025. As of June 30, 2024, we had $502.3 million in aggregate principal amount of convertible senior notes outstanding. For additional information, see "Note 8. Debt" in Part I, Item 1 of this Quarterly Report.
In November 2019, and as since amended, we entered into a $100 million senior secured revolving credit agreement (the “Credit Facility”) with PNC Bank, National Association. On April 23, 2024, the Credit Facility was amended to extend the expiration date to February 4, 2025. As of June 30, 2024 and December 31, 2023, we had $27.3 million in outstanding letters of credit under the Credit Facility, reducing available borrowing capacity, but no outstanding cash borrowings. For additional information, see "Note 8. Debt" in Part I, Item 1 of this Quarterly Report.
Stock repurchase program
Changes in the remaining stock repurchase authority: | | | | | |
| (in thousands) | Six Months Ended
June 30, 2024 |
| December 31, 2023 | $ | 60,000 | |
Authorizations (1) | — | |
| |
| June 30, 2024 | $ | 60,000 | |
(1) On April 23, 2024, our Board of Directors extended the expiration date of our current share repurchase program from June 30, 2024 to June 30, 2025.
Common stock repurchases | | | | | | | | | | | | | | | | | | | | | | | |
| Six Months Ended
June 30, |
| 2024 | | 2023 |
| (in thousands) | Shares | | Amount | | Shares | | Amount |
| | | | | | | |
| Tax withholdings for net settlement of equity awards | 38 | | | $ | 2,360 | | | 34 | | | $ | 1,422 | |
| | | | | | | |
In the six months ended June 30, 2024 and 2023, instead of receiving cash from the equity holders, we withheld shares with a value of $2.8 million and $0.9 million, respectively, for the exercise price of options. These amounts are not included in the table above.
Dividends
We intend to pay a quarterly cash dividend of $0.03 per share. However, the Board of Directors may terminate or modify the dividend program without prior notice. | | | | | | | | | | | |
| Six Months Ended
June 30, |
| (in thousands) | 2024 | | 2023 |
| Dividend payments to stockholders | $ | 5,065 | | | $ | 4,962 | |
Contractual obligations
As of June 30, 2024, our contractual obligations were: | | | | | | | | | | | | | | | | | | | | | | | | | | | | | | | | | | | | | | | | | | | | | | | |
| Payments due by period | | |
| (in thousands) | Remainder of 2024 | | 2025 | | 2026 | | 2027 | | 2028 | | 2029 and after | | Other | | Total |
Convertible senior notes (1) | $ | 1,883 | | | $ | 504,154 | | | $ | — | | | $ | — | | | $ | — | | | $ | — | | | $ | — | | | $ | 506,037 | |
Purchase obligations (2) | 81,896 | | | 142,483 | | | 126,905 | | | 135,488 | | | 990 | | | — | | | — | | | 487,762 | |
Operating lease obligations | 7,954 | | | 18,784 | | | 14,384 | | | 13,387 | | | 12,813 | | | 31,749 | | | — | | | 99,071 | |
Venture investment commitments (3) | 500 | | | 500 | | | — | | | — | | | — | | | — | | | — | | | 1,000 | |
Liability for uncertain tax positions (4) | — | | | — | | | — | | | — | | | — | | | — | | | 858 | | | 858 | |
| $ | 92,233 | | | $ | 665,921 | | | $ | 141,289 | | | $ | 148,875 | | | $ | 13,803 | | | $ | 31,749 | | | $ | 858 | | | $ | 1,094,728 | |
(1) Includes principal and interest.
(2) Represents the fixed amount owed for purchase obligations including for software licenses, hosting services, and sales and marketing programs.
(3) Represents the maximum funding under existing venture investment agreements. Our venture investment agreements generally allow us to withhold unpaid funds at our discretion.
(4) We cannot reasonably estimate the timing of this cash outflow due to uncertainties in the timing of the effective settlement of tax positions.
ITEM 3. QUANTITATIVE AND QUALITATIVE DISCLOSURES ABOUT MARKET RISK
Market risk is the risk of loss from adverse changes in financial market prices and rates.
Foreign currency exposure
Translation risk
Our international operations’ operating expenses are primarily denominated in foreign currencies. However, our international sales are also primarily denominated in foreign currencies, partially offsetting our foreign currency exposure.
A hypothetical 10% strengthening in the U.S. dollar against other currencies would have resulted in the following: | | | | | | | | | | | |
| Six Months Ended
June 30, |
| 2024 | | 2023 |
| (Decrease) in revenue | (4) | % | | (4) | % |
| (Decrease) increase in net income | (56) | % | | 1 | % |
Remeasurement risk
We incur transaction gains and losses from the remeasurement of monetary assets and liabilities denominated in currencies other than the functional currency of the entities in which they are recorded.
We are primarily exposed to changes in foreign currency exchange rates associated with the Australian dollar, Euro, and U.S. dollar-denominated cash, cash equivalents, receivables, and intercompany balances held by our U.K. subsidiary, a British pound functional entity.
A hypothetical 10% strengthening in the British pound exchange rate in comparison to the Australian dollar, Euro, and U.S. dollar would have resulted in the following impact: | | | | | | | | | | | |
| Six Months Ended
June 30, |
| (in thousands) | 2024 | | 2023 |
| Foreign currency (loss) | $ | (12,860) | | | $ | (9,869) | |
ITEM 4. CONTROLS AND PROCEDURES
(a) Evaluation of disclosure controls and procedures
Our management, with the participation of our Chief Executive Officer (“CEO”) and Chief Financial Officer (“CFO”), evaluated the effectiveness of our disclosure controls and procedures (as defined in Rules 13a-15(e) and 15d-15(e) under the Securities Exchange Act of 1934, as amended (“Exchange Act”)) as of June 30, 2024. In designing and evaluating our disclosure controls and procedures, our management recognized that any controls and procedures, no matter how well designed and operated, can provide only reasonable assurance of achieving their objectives, and our management necessarily applied its judgment in evaluating the cost-benefit relationship of possible controls and procedures. Based on this evaluation, our CEO and CFO concluded that our disclosure controls and procedures were effective as of June 30, 2024.
(b) Changes in internal control over financial reporting
There have been no changes in our internal control over financial reporting (as defined in Rules 13a-15(f) and 15d-15(f) under the Exchange Act) during the quarter ended June 30, 2024 that have materially affected or are reasonably likely to materially affect our internal control over financial reporting.
PART II - OTHER INFORMATION
ITEM 1. LEGAL PROCEEDINGS
The information set forth in “Note 15. Commitments and Contingencies”, in Part I, Item 1 of this Quarterly Report is incorporated herein by reference.
ITEM 1A. RISK FACTORS
We encourage you to carefully consider the risk factors identified in Item 1A. “Risk Factors” of our Annual Report on Form 10-K for the year ended December 31, 2023, filed with the U.S. Securities and Exchange Commission. These risk factors could materially affect our business, financial condition, and future results and may cause our actual business and financial results to differ materially from those contained in forward-looking statements made in this Quarterly Report on Form 10-Q or elsewhere by management.
ITEM 2. UNREGISTERED SALES OF EQUITY SECURITIES AND USE OF PROCEEDS
Issuer purchases of equity securities (1)
Common stock repurchased in the three months ended June 30, 2024: | | | | | | | | | | | | | | | | | | | | | | | |
| (in thousands, except per share amounts) | Total Number of Shares Purchased (2) | | Average Price Paid per Share (2) | | Total Number of Shares Purchased as Part of Publicly Announced Share Repurchase Program | | Approximate Dollar Value of Shares That May Yet Be Purchased at Period End Under Publicly Announced Share Repurchased Programs |
| April 1, 2024 - April 30, 2024 | 1 | | | $ | 58.28 | | | — | | | $ | 60,000 | |
| May 1, 2024 - May 31, 2024 | — | | | — | | | — | | | $ | 60,000 | |
| June 1, 2024 - June 30, 2024 | 6 | | | 57.81 | | | — | | | $ | 60,000 | |
| 7 | | | $ | 57.86 | | | — | | | |
(1) For additional information, see "Liquidity and Capital Resources" in Part I, Item 2 of this Quarterly Report.
(2) Includes shares withheld to cover the option exercise price and tax withholding obligations for stock compensation awards subject to net settlement provisions.
ITEM 5. OTHER INFORMATION
Rule 10b5-1 and non-rule 10b5-1 trading arrangements
On April 30, 2024, Richard H. Jones, one of our directors, entered into a trading plan that provides for the sale of an aggregate of 50,000 shares of our common stock. The plan will terminate on April 30, 2025, subject to early termination for certain specified events set forth in the plan.
Other than as disclosed above, during the three months ended June 30, 2024, no director or officer of the Company adopted or terminated a “Rule 10b5-1 trading arrangement” or “non Rule 10b5-1 trading arrangement,” as each term is defined in Item 408(a) of Regulation S-K.
ITEM 6. EXHIBITS | | | | | | | | | | | | | | | | | | | | | | | | | | | | | | | | |
| Exhibit No. | | Description | | Incorporation by Reference | | Filed Herewith |
| | Form | | Exhibit | | Filing Date | |
| 3.1 | | | | 10-Q | | 3.1 | | November 4, 2014 | | |
| 3.2 | | | | 8-K | | 3.2 | | June 15, 2020 | | |
| 31.1 | | | | | | | | | | X |
| 31.2 | | | | | | | | | | X |
| 32 | | | | | | | | | | + |
| 101.INS | | Inline XBRL Instance Document - the instance document does not appear in the Interactive Data File because its XBRL tags are embedded within the Inline XBRL document. | | | | | | | | X |
| 101.SCH | | Inline XBRL Taxonomy Extension Schema Document. | | | | | | | | X |
| 101.CAL | | Inline XBRL Taxonomy Calculation Linkbase Document. | | | | | | | | X |
| 101.DEF | | Inline XBRL Taxonomy Extension Definition Linkbase Document. | | | | | | | | X |
| 101.LAB | | Inline XBRL Taxonomy Label Linkbase Document. | | | | | | | | X |
| 101.PRE | | Inline XBRL Taxonomy Presentation Linkbase Document. | | | | | | | | X |
| 104 | | Cover Page Interactive Data File (formatted as Inline XBRL and contained in Exhibit 101) | | | | | | | | X |
+ Indicates that the exhibit is being furnished with this report and is not filed as a part of it.
SIGNATURE
Pursuant to the requirements of the Securities Exchange Act of 1934, the Registrant has duly caused this report to be signed on its behalf by the undersigned thereunto duly authorized. | | | | | | | | | | | |
| | Pegasystems Inc. |
| | | |
| Dated: | July 24, 2024 | By: | /s/ KENNETH STILLWELL |
| | | Kenneth Stillwell |
| | | Chief Operating Officer and Chief Financial Officer |
| | | (Principal Financial Officer) |
CERTIFICATION
I, Alan Trefler, certify that:
1.I have reviewed this Quarterly Report on Form 10-Q of Pegasystems Inc.;
2.Based on my knowledge, this report does not contain any untrue statement of a material fact or omit to state a material fact necessary to make the statements made, in light of the circumstances under which such statements were made, not misleading with respect to the period covered by this report;
3.Based on my knowledge, the financial statements, and other financial information included in this report, fairly present in all material respects the financial condition, results of operations, and cash flows of the registrant as of, and for, the periods presented in this report;
4.The registrant’s other certifying officer and I are responsible for establishing and maintaining disclosure controls and procedures (as defined in Exchange Act Rules 13a-15(e) and 15d-15(e)) and internal control over financial reporting (as defined in Exchange Act Rules 13a-15(f) and 15d-15(f)) for the registrant and have:
a.designed such disclosure controls and procedures, or caused such disclosure controls and procedures to be designed under our supervision, to ensure that material information relating to the registrant, including its consolidated subsidiaries, is made known to us by others within those entities, particularly during the period in which this report is being prepared;
b.designed such internal control over financial reporting, or caused such internal control over financial reporting to be designed under our supervision, to provide reasonable assurance regarding the reliability of financial reporting and the preparation of financial statements for external purposes in accordance with generally accepted accounting principles;
c.evaluated the effectiveness of the registrant’s disclosure controls and procedures and presented in this report our conclusions about the effectiveness of the disclosure controls and procedures, as of the end of the period covered by this report based on such evaluation; and
d.disclosed in this report any change in the registrant’s internal control over financial reporting that occurred during the registrant’s most recent fiscal quarter (the registrant’s fourth fiscal quarter in the case of an annual report) that has materially affected, or is reasonably likely to materially affect, the registrant’s internal control over financial reporting; and
5.The registrant’s other certifying officer and I have disclosed, based on our most recent evaluation of internal control over financial reporting, to the registrant’s auditors and the audit committee of the registrant’s board of directors (or persons performing the equivalent functions):
a.all significant deficiencies and material weaknesses in the design or operation of internal control over financial reporting which are reasonably likely to adversely affect the registrant’s ability to record, process, summarize and report financial information; and
b.any fraud, whether or not material, that involves management or other employees who have a significant role in the registrant’s internal control over financial reporting.
Dated: July 24, 2024
| | |
| /s/ ALAN TREFLER |
| Alan Trefler |
| Chairman and Chief Executive Officer |
| (Principal Executive Officer) |
CERTIFICATION
I, Kenneth Stillwell, certify that:
1.I have reviewed this Quarterly Report on Form 10-Q of Pegasystems Inc.;
2.Based on my knowledge, this report does not contain any untrue statement of a material fact or omit to state a material fact necessary to make the statements made, in light of the circumstances under which such statements were made, not misleading with respect to the period covered by this report;
3.Based on my knowledge, the financial statements, and other financial information included in this report, fairly present in all material respects the financial condition, results of operations, and cash flows of the registrant as of, and for, the periods presented in this report;
4.The registrant’s other certifying officer and I are responsible for establishing and maintaining disclosure controls and procedures (as defined in Exchange Act Rules 13a-15(e) and 15d-15(e)) and internal control over financial reporting (as defined in Exchange Act Rules 13a-15(f) and 15d-15(f)) for the registrant and have:
a.designed such disclosure controls and procedures, or caused such disclosure controls and procedures to be designed under our supervision, to ensure that material information relating to the registrant, including its consolidated subsidiaries, is made known to us by others within those entities, particularly during the period in which this report is being prepared;
b.designed such internal control over financial reporting, or caused such internal control over financial reporting to be designed under our supervision, to provide reasonable assurance regarding the reliability of financial reporting and the preparation of financial statements for external purposes in accordance with generally accepted accounting principles;
c.evaluated the effectiveness of the registrant’s disclosure controls and procedures and presented in this report our conclusions about the effectiveness of the disclosure controls and procedures, as of the end of the period covered by this report based on such evaluation; and
d.disclosed in this report any change in the registrant’s internal control over financial reporting that occurred during the registrant’s most recent fiscal quarter (the registrant’s fourth fiscal quarter in the case of an annual report) that has materially affected, or is reasonably likely to materially affect, the registrant’s internal control over financial reporting; and
5.The registrant’s other certifying officer and I have disclosed, based on our most recent evaluation of internal control over financial reporting, to the registrant’s auditors and the audit committee of the registrant’s board of directors (or persons performing the equivalent functions):
a.all significant deficiencies and material weaknesses in the design or operation of internal control over financial reporting which are reasonably likely to adversely affect the registrant’s ability to record, process, summarize and report financial information; and
b.any fraud, whether or not material, that involves management or other employees who have a significant role in the registrant’s internal control over financial reporting.
Dated: July 24, 2024
| | |
| /s/ KENNETH STILLWELL |
| Kenneth Stillwell |
| Chief Operating Officer and Chief Financial Officer |
| (Principal Financial Officer) |
CERTIFICATION PURSUANT TO SECTION 1350, AS ADOPTED PURSUANT TO
SECTION 906 OF THE SARBANES-OXLEY ACT OF 2002
In connection with the Quarterly Report of Pegasystems Inc. (the “Company”) on Form 10-Q for the quarter ended June 30, 2024 as filed with the Securities and Exchange Commission on the date hereof (the “Report”), Alan Trefler, Chairman and Chief Executive Officer of Pegasystems Inc., and Kenneth Stillwell, Chief Operating Officer and Chief Financial Officer of Pegasystems Inc., each certifies, pursuant to 18 U.S.C. Section 1350, as adopted pursuant to Section 906 of the Sarbanes-Oxley Act of 2002, that:
1.The Report fully complies with the requirements of Section 13(a) or 15(d) of the Securities Exchange Act of 1934; and
2.The information contained in the Report fairly presents, in all material respects, the financial condition and results of operations of the Company.
Dated: July 24, 2024
| | |
| /s/ ALAN TREFLER |
| Alan Trefler |
| Chairman and Chief Executive Officer |
| (Principal Executive Officer) |
| | |
| /s/ KENNETH STILLWELL |
| Kenneth Stillwell |
| Chief Operating Officer and Chief Financial Officer |
| (Principal Financial Officer) |
v3.24.2
Cover - shares
|
6 Months Ended |
|
Jun. 30, 2024 |
Jul. 17, 2024 |
| Cover [Abstract] |
|
|
| Document Type |
10-Q
|
|
| Document Quarterly Report |
true
|
|
| Document Period End Date |
Jun. 30, 2024
|
|
| Document Transition Report |
false
|
|
| Entity File Number |
1-11859
|
|
| Entity Registrant Name |
PEGASYSTEMS INC.
|
|
| Entity Incorporation, State or Country Code |
MA
|
|
| Entity Tax Identification Number |
04-2787865
|
|
| Entity Address, Address Line One |
One Main Street
|
|
| Entity Address, City or Town |
Cambridge
|
|
| Entity Address, State or Province |
MA
|
|
| Entity Address, Postal Zip Code |
02142
|
|
| City Area Code |
617
|
|
| Local Phone Number |
374-9600
|
|
| Title of 12(b) Security |
Common Stock, $.01 par value per share
|
|
| Trading Symbol |
PEGA
|
|
| Security Exchange Name |
NASDAQ
|
|
| Entity Current Reporting Status |
Yes
|
|
| Entity Interactive Data Current |
Yes
|
|
| Entity Filer Category |
Large Accelerated Filer
|
|
| Entity Small Business |
false
|
|
| Entity Emerging Growth Company |
false
|
|
| Entity Shell Company |
false
|
|
| Entity Common Stock, Shares Outstanding |
|
85,409,645
|
| Amendment Flag |
false
|
|
| Entity Central Index Key |
0001013857
|
|
| Document Fiscal Year Focus |
2024
|
|
| Document Fiscal Period Focus |
Q2
|
|
| Current Fiscal Year End Date |
--12-31
|
|
| X |
- DefinitionBoolean flag that is true when the XBRL content amends previously-filed or accepted submission.
| Name: |
dei_AmendmentFlag |
| Namespace Prefix: |
dei_ |
| Data Type: |
xbrli:booleanItemType |
| Balance Type: |
na |
| Period Type: |
duration |
|
| X |
- DefinitionEnd date of current fiscal year in the format --MM-DD.
| Name: |
dei_CurrentFiscalYearEndDate |
| Namespace Prefix: |
dei_ |
| Data Type: |
xbrli:gMonthDayItemType |
| Balance Type: |
na |
| Period Type: |
duration |
|
| X |
- DefinitionFiscal period values are FY, Q1, Q2, and Q3. 1st, 2nd and 3rd quarter 10-Q or 10-QT statements have value Q1, Q2, and Q3 respectively, with 10-K, 10-KT or other fiscal year statements having FY.
| Name: |
dei_DocumentFiscalPeriodFocus |
| Namespace Prefix: |
dei_ |
| Data Type: |
dei:fiscalPeriodItemType |
| Balance Type: |
na |
| Period Type: |
duration |
|
| X |
- DefinitionThis is focus fiscal year of the document report in YYYY format. For a 2006 annual report, which may also provide financial information from prior periods, fiscal 2006 should be given as the fiscal year focus. Example: 2006.
| Name: |
dei_DocumentFiscalYearFocus |
| Namespace Prefix: |
dei_ |
| Data Type: |
xbrli:gYearItemType |
| Balance Type: |
na |
| Period Type: |
duration |
|
| X |
- DefinitionFor the EDGAR submission types of Form 8-K: the date of the report, the date of the earliest event reported; for the EDGAR submission types of Form N-1A: the filing date; for all other submission types: the end of the reporting or transition period. The format of the date is YYYY-MM-DD.
| Name: |
dei_DocumentPeriodEndDate |
| Namespace Prefix: |
dei_ |
| Data Type: |
xbrli:dateItemType |
| Balance Type: |
na |
| Period Type: |
duration |
|
| X |
- DefinitionBoolean flag that is true only for a form used as an quarterly report. Reference 1: http://www.xbrl.org/2003/role/presentationRef
-Publisher SEC
-Name Form 10-Q
-Number 240
-Section 308
-Subsection a
| Name: |
dei_DocumentQuarterlyReport |
| Namespace Prefix: |
dei_ |
| Data Type: |
xbrli:booleanItemType |
| Balance Type: |
na |
| Period Type: |
duration |
|
| X |
- DefinitionBoolean flag that is true only for a form used as a transition report. Reference 1: http://www.xbrl.org/2003/role/presentationRef
-Publisher SEC
-Name Forms 10-K, 10-Q, 20-F
-Number 240
-Section 13
-Subsection a-1
| Name: |
dei_DocumentTransitionReport |
| Namespace Prefix: |
dei_ |
| Data Type: |
xbrli:booleanItemType |
| Balance Type: |
na |
| Period Type: |
duration |
|
| X |
- DefinitionThe type of document being provided (such as 10-K, 10-Q, 485BPOS, etc). The document type is limited to the same value as the supporting SEC submission type, or the word 'Other'.
| Name: |
dei_DocumentType |
| Namespace Prefix: |
dei_ |
| Data Type: |
dei:submissionTypeItemType |
| Balance Type: |
na |
| Period Type: |
duration |
|
| X |
- DefinitionAddress Line 1 such as Attn, Building Name, Street Name
| Name: |
dei_EntityAddressAddressLine1 |
| Namespace Prefix: |
dei_ |
| Data Type: |
xbrli:normalizedStringItemType |
| Balance Type: |
na |
| Period Type: |
duration |
|
| X |
- Definition
+ References
+ Details
| Name: |
dei_EntityAddressCityOrTown |
| Namespace Prefix: |
dei_ |
| Data Type: |
xbrli:normalizedStringItemType |
| Balance Type: |
na |
| Period Type: |
duration |
|
| X |
- DefinitionCode for the postal or zip code
| Name: |
dei_EntityAddressPostalZipCode |
| Namespace Prefix: |
dei_ |
| Data Type: |
xbrli:normalizedStringItemType |
| Balance Type: |
na |
| Period Type: |
duration |
|
| X |
- DefinitionName of the state or province.
| Name: |
dei_EntityAddressStateOrProvince |
| Namespace Prefix: |
dei_ |
| Data Type: |
dei:stateOrProvinceItemType |
| Balance Type: |
na |
| Period Type: |
duration |
|
| X |
- DefinitionA unique 10-digit SEC-issued value to identify entities that have filed disclosures with the SEC. It is commonly abbreviated as CIK. Reference 1: http://www.xbrl.org/2003/role/presentationRef
-Publisher SEC
-Name Exchange Act
-Number 240
-Section 12
-Subsection b-2
| Name: |
dei_EntityCentralIndexKey |
| Namespace Prefix: |
dei_ |
| Data Type: |
dei:centralIndexKeyItemType |
| Balance Type: |
na |
| Period Type: |
duration |
|
| X |
- DefinitionIndicate number of shares or other units outstanding of each of registrant's classes of capital or common stock or other ownership interests, if and as stated on cover of related periodic report. Where multiple classes or units exist define each class/interest by adding class of stock items such as Common Class A [Member], Common Class B [Member] or Partnership Interest [Member] onto the Instrument [Domain] of the Entity Listings, Instrument.
| Name: |
dei_EntityCommonStockSharesOutstanding |
| Namespace Prefix: |
dei_ |
| Data Type: |
xbrli:sharesItemType |
| Balance Type: |
na |
| Period Type: |
instant |
|
| X |
- DefinitionIndicate 'Yes' or 'No' whether registrants (1) have filed all reports required to be filed by Section 13 or 15(d) of the Securities Exchange Act of 1934 during the preceding 12 months (or for such shorter period that registrants were required to file such reports), and (2) have been subject to such filing requirements for the past 90 days. This information should be based on the registrant's current or most recent filing containing the related disclosure.
| Name: |
dei_EntityCurrentReportingStatus |
| Namespace Prefix: |
dei_ |
| Data Type: |
dei:yesNoItemType |
| Balance Type: |
na |
| Period Type: |
duration |
|
| X |
- DefinitionIndicate if registrant meets the emerging growth company criteria. Reference 1: http://www.xbrl.org/2003/role/presentationRef
-Publisher SEC
-Name Exchange Act
-Number 240
-Section 12
-Subsection b-2
| Name: |
dei_EntityEmergingGrowthCompany |
| Namespace Prefix: |
dei_ |
| Data Type: |
xbrli:booleanItemType |
| Balance Type: |
na |
| Period Type: |
duration |
|
| X |
- DefinitionCommission file number. The field allows up to 17 characters. The prefix may contain 1-3 digits, the sequence number may contain 1-8 digits, the optional suffix may contain 1-4 characters, and the fields are separated with a hyphen.
| Name: |
dei_EntityFileNumber |
| Namespace Prefix: |
dei_ |
| Data Type: |
dei:fileNumberItemType |
| Balance Type: |
na |
| Period Type: |
duration |
|
| X |
- DefinitionIndicate whether the registrant is one of the following: Large Accelerated Filer, Accelerated Filer, Non-accelerated Filer. Definitions of these categories are stated in Rule 12b-2 of the Exchange Act. This information should be based on the registrant's current or most recent filing containing the related disclosure. Reference 1: http://www.xbrl.org/2003/role/presentationRef
-Publisher SEC
-Name Exchange Act
-Number 240
-Section 12
-Subsection b-2
| Name: |
dei_EntityFilerCategory |
| Namespace Prefix: |
dei_ |
| Data Type: |
dei:filerCategoryItemType |
| Balance Type: |
na |
| Period Type: |
duration |
|
| X |
- DefinitionTwo-character EDGAR code representing the state or country of incorporation.
| Name: |
dei_EntityIncorporationStateCountryCode |
| Namespace Prefix: |
dei_ |
| Data Type: |
dei:edgarStateCountryItemType |
| Balance Type: |
na |
| Period Type: |
duration |
|
| X |
- DefinitionBoolean flag that is true when the registrant has submitted electronically every Interactive Data File required to be submitted pursuant to Rule 405 of Regulation S-T during the preceding 12 months (or for such shorter period that the registrant was required to submit such files). Reference 1: http://www.xbrl.org/2003/role/presentationRef
-Publisher SEC
-Name Regulation S-T
-Number 232
-Section 405
| Name: |
dei_EntityInteractiveDataCurrent |
| Namespace Prefix: |
dei_ |
| Data Type: |
dei:yesNoItemType |
| Balance Type: |
na |
| Period Type: |
duration |
|
| X |
- DefinitionThe exact name of the entity filing the report as specified in its charter, which is required by forms filed with the SEC. Reference 1: http://www.xbrl.org/2003/role/presentationRef
-Publisher SEC
-Name Exchange Act
-Number 240
-Section 12
-Subsection b-2
| Name: |
dei_EntityRegistrantName |
| Namespace Prefix: |
dei_ |
| Data Type: |
xbrli:normalizedStringItemType |
| Balance Type: |
na |
| Period Type: |
duration |
|
| X |
- DefinitionBoolean flag that is true when the registrant is a shell company as defined in Rule 12b-2 of the Exchange Act. Reference 1: http://www.xbrl.org/2003/role/presentationRef
-Publisher SEC
-Name Exchange Act
-Number 240
-Section 12
-Subsection b-2
| Name: |
dei_EntityShellCompany |
| Namespace Prefix: |
dei_ |
| Data Type: |
xbrli:booleanItemType |
| Balance Type: |
na |
| Period Type: |
duration |
|
| X |
- DefinitionIndicates that the company is a Smaller Reporting Company (SRC). Reference 1: http://www.xbrl.org/2003/role/presentationRef
-Publisher SEC
-Name Exchange Act
-Number 240
-Section 12
-Subsection b-2
| Name: |
dei_EntitySmallBusiness |
| Namespace Prefix: |
dei_ |
| Data Type: |
xbrli:booleanItemType |
| Balance Type: |
na |
| Period Type: |
duration |
|
| X |
- DefinitionThe Tax Identification Number (TIN), also known as an Employer Identification Number (EIN), is a unique 9-digit value assigned by the IRS. Reference 1: http://www.xbrl.org/2003/role/presentationRef
-Publisher SEC
-Name Exchange Act
-Number 240
-Section 12
-Subsection b-2
| Name: |
dei_EntityTaxIdentificationNumber |
| Namespace Prefix: |
dei_ |
| Data Type: |
dei:employerIdItemType |
| Balance Type: |
na |
| Period Type: |
duration |
|
| X |
- DefinitionLocal phone number for entity.
| Name: |
dei_LocalPhoneNumber |
| Namespace Prefix: |
dei_ |
| Data Type: |
xbrli:normalizedStringItemType |
| Balance Type: |
na |
| Period Type: |
duration |
|
| X |
- DefinitionTitle of a 12(b) registered security. Reference 1: http://www.xbrl.org/2003/role/presentationRef
-Publisher SEC
-Name Exchange Act
-Number 240
-Section 12
-Subsection b
| Name: |
dei_Security12bTitle |
| Namespace Prefix: |
dei_ |
| Data Type: |
dei:securityTitleItemType |
| Balance Type: |
na |
| Period Type: |
duration |
|
| X |
- DefinitionName of the Exchange on which a security is registered. Reference 1: http://www.xbrl.org/2003/role/presentationRef
-Publisher SEC
-Name Exchange Act
-Number 240
-Section 12
-Subsection d1-1
| Name: |
dei_SecurityExchangeName |
| Namespace Prefix: |
dei_ |
| Data Type: |
dei:edgarExchangeCodeItemType |
| Balance Type: |
na |
| Period Type: |
duration |
|
| X |
- DefinitionTrading symbol of an instrument as listed on an exchange.
| Name: |
dei_TradingSymbol |
| Namespace Prefix: |
dei_ |
| Data Type: |
dei:tradingSymbolItemType |
| Balance Type: |
na |
| Period Type: |
duration |
|
v3.24.2
UNAUDITED CONDENSED CONSOLIDATED BALANCE SHEETS - USD ($)
$ in Thousands |
Jun. 30, 2024 |
Dec. 31, 2023 |
| Current assets: |
|
|
| Cash and cash equivalents |
$ 258,257
|
$ 229,902
|
| Marketable securities |
406,819
|
193,436
|
| Total cash, cash equivalents, and marketable securities |
665,076
|
423,338
|
| Accounts receivable, net |
165,723
|
300,173
|
| Unbilled receivables, net |
164,533
|
237,379
|
| Other current assets |
76,323
|
68,137
|
| Total current assets |
1,071,655
|
1,029,027
|
| Long-term unbilled receivables, net |
81,218
|
85,402
|
| Goodwill |
81,410
|
81,611
|
| Other long-term assets |
302,249
|
314,696
|
| Total assets |
1,536,532
|
1,510,736
|
| Current liabilities: |
|
|
| Accounts payable |
16,682
|
11,290
|
| Accrued expenses |
44,875
|
39,941
|
| Accrued compensation and related expenses |
81,110
|
126,640
|
| Deferred revenue |
352,618
|
377,845
|
| Convertible senior notes, net |
500,604
|
|
| Other current liabilities |
20,677
|
21,343
|
| Total current liabilities |
1,016,566
|
577,059
|
| Long-term convertible senior notes, net |
0
|
499,368
|
| Long-term operating lease liabilities |
70,202
|
66,901
|
| Other long-term liabilities |
14,362
|
13,570
|
| Total liabilities |
1,101,130
|
1,156,898
|
| Commitments and contingencies (Note 15) |
|
|
| Stockholders’ equity: |
|
|
| Preferred stock, 1,000 shares authorized; none issued |
0
|
0
|
| Common stock, 200,000 shares authorized; 85,369 and 83,840 shares issued and outstanding at June 30, 2024 and December 31, 2023, respectively |
854
|
838
|
| Additional paid-in capital |
473,030
|
379,584
|
| (Accumulated deficit) |
(14,216)
|
(8,705)
|
| Accumulated other comprehensive (loss) |
(24,266)
|
(17,879)
|
| Total stockholders’ equity |
435,402
|
353,838
|
| Total liabilities and stockholders’ equity |
$ 1,536,532
|
$ 1,510,736
|
| X |
- DefinitionAmount received for services rendered and products shipped, but not yet billed, for non-contractual agreements due greater than one year from period end.
| Name: |
pega_UnbilledReceivablesNonCurrent |
| Namespace Prefix: |
pega_ |
| Data Type: |
xbrli:monetaryItemType |
| Balance Type: |
debit |
| Period Type: |
instant |
|
| X |
- DefinitionCarrying value as of the balance sheet date of liabilities incurred (and for which invoices have typically been received) and payable to vendors for goods and services received that are used in an entity's business. Used to reflect the current portion of the liabilities (due within one year or within the normal operating cycle if longer). Reference 1: http://fasb.org/us-gaap/role/ref/legacyRef
-Topic 210
-SubTopic 10
-Name Accounting Standards Codification
-Section S99
-Paragraph 1
-Subparagraph (SX 210.5-02(19)(a))
-Publisher FASB
-URI https://asc.fasb.org/1943274/2147480566/210-10-S99-1
Reference 2: http://www.xbrl.org/2003/role/exampleRef
-Topic 852
-SubTopic 10
-Name Accounting Standards Codification
-Section 55
-Paragraph 10
-Publisher FASB
-URI https://asc.fasb.org/1943274/2147481372/852-10-55-10
| Name: |
us-gaap_AccountsPayableCurrent |
| Namespace Prefix: |
us-gaap_ |
| Data Type: |
xbrli:monetaryItemType |
| Balance Type: |
credit |
| Period Type: |
instant |
|
| X |
- DefinitionAmount, after allowance for credit loss, of right to consideration from customer for product sold and service rendered in normal course of business, classified as current. Reference 1: http://www.xbrl.org/2009/role/commonPracticeRef
-Topic 310
-SubTopic 10
-Name Accounting Standards Codification
-Section 45
-Paragraph 2
-Publisher FASB
-URI https://asc.fasb.org/1943274/2147481990/310-10-45-2
| Name: |
us-gaap_AccountsReceivableNetCurrent |
| Namespace Prefix: |
us-gaap_ |
| Data Type: |
xbrli:monetaryItemType |
| Balance Type: |
debit |
| Period Type: |
instant |
|
| X |
- DefinitionCarrying value as of the balance sheet date of obligations incurred and payable, pertaining to costs that are statutory in nature, are incurred on contractual obligations, or accumulate over time and for which invoices have not yet been received or will not be rendered. Examples include taxes, interest, rent and utilities. Used to reflect the current portion of the liabilities (due within one year or within the normal operating cycle if longer). Reference 1: http://fasb.org/us-gaap/role/ref/legacyRef
-Topic 210
-SubTopic 10
-Name Accounting Standards Codification
-Section S99
-Paragraph 1
-Subparagraph (SX 210.5-02(20))
-Publisher FASB
-URI https://asc.fasb.org/1943274/2147480566/210-10-S99-1
| Name: |
us-gaap_AccruedLiabilitiesCurrent |
| Namespace Prefix: |
us-gaap_ |
| Data Type: |
xbrli:monetaryItemType |
| Balance Type: |
credit |
| Period Type: |
instant |
|
| X |
- DefinitionAmount, after tax, of accumulated increase (decrease) in equity from transaction and other event and circumstance from nonowner source. Reference 1: http://fasb.org/us-gaap/role/ref/legacyRef
-Name Accounting Standards Codification
-Topic 220
-SubTopic 10
-Section 45
-Paragraph 14A
-Publisher FASB
-URI https://asc.fasb.org/1943274/2147482790/220-10-45-14A
Reference 2: http://fasb.org/us-gaap/role/ref/legacyRef
-Topic 220
-SubTopic 10
-Name Accounting Standards Codification
-Section 45
-Paragraph 11
-Publisher FASB
-URI https://asc.fasb.org/1943274/2147482790/220-10-45-11
Reference 3: http://www.xbrl.org/2003/role/disclosureRef
-Topic 944
-SubTopic 40
-Name Accounting Standards Codification
-Section 65
-Paragraph 2
-Subparagraph (g)(2)(ii)
-Publisher FASB
-URI https://asc.fasb.org/1943274/2147480016/944-40-65-2
Reference 4: http://www.xbrl.org/2003/role/disclosureRef
-Topic 944
-SubTopic 40
-Name Accounting Standards Codification
-Section 65
-Paragraph 2
-Subparagraph (h)(2)
-Publisher FASB
-URI https://asc.fasb.org/1943274/2147480016/944-40-65-2
Reference 5: http://www.xbrl.org/2003/role/disclosureRef
-Topic 210
-SubTopic 10
-Name Accounting Standards Codification
-Section S99
-Paragraph 1
-Subparagraph (SX 210.5-02(30)(a)(4))
-Publisher FASB
-URI https://asc.fasb.org/1943274/2147480566/210-10-S99-1
Reference 6: http://www.xbrl.org/2003/role/disclosureRef
-Topic 944
-SubTopic 210
-Name Accounting Standards Codification
-Section S99
-Paragraph 1
-Subparagraph (SX 210.7-03(a)(23)(a)(3))
-Publisher FASB
-URI https://asc.fasb.org/1943274/2147478777/944-210-S99-1
Reference 7: http://fasb.org/us-gaap/role/ref/legacyRef
-Name Accounting Standards Codification
-Topic 220
-SubTopic 10
-Section 45
-Paragraph 14
-Publisher FASB
-URI https://asc.fasb.org/1943274/2147482790/220-10-45-14
| Name: |
us-gaap_AccumulatedOtherComprehensiveIncomeLossNetOfTax |
| Namespace Prefix: |
us-gaap_ |
| Data Type: |
xbrli:monetaryItemType |
| Balance Type: |
credit |
| Period Type: |
instant |
|
| X |
- DefinitionValue received from shareholders in common stock-related transactions that are in excess of par value or stated value and amounts received from other stock-related transactions. Includes only common stock transactions (excludes preferred stock transactions). May be called contributed capital, capital in excess of par, capital surplus, or paid-in capital. Reference 1: http://fasb.org/us-gaap/role/ref/legacyRef
-Topic 210
-SubTopic 10
-Name Accounting Standards Codification
-Section S99
-Paragraph 1
-Subparagraph (SX 210.5-02(30)(a)(1))
-Publisher FASB
-URI https://asc.fasb.org/1943274/2147480566/210-10-S99-1
| Name: |
us-gaap_AdditionalPaidInCapitalCommonStock |
| Namespace Prefix: |
us-gaap_ |
| Data Type: |
xbrli:monetaryItemType |
| Balance Type: |
credit |
| Period Type: |
instant |
|
| X |
- DefinitionAmount of asset recognized for present right to economic benefit. Reference 1: http://www.xbrl.org/2003/role/exampleRef
-Topic 280
-SubTopic 10
-Name Accounting Standards Codification
-Section 55
-Paragraph 48
-Publisher FASB
-URI https://asc.fasb.org/1943274/2147482785/280-10-55-48
Reference 2: http://www.xbrl.org/2003/role/exampleRef
-Topic 280
-SubTopic 10
-Name Accounting Standards Codification
-Section 55
-Paragraph 49
-Publisher FASB
-URI https://asc.fasb.org/1943274/2147482785/280-10-55-49
Reference 3: http://www.xbrl.org/2003/role/disclosureRef
-Topic 270
-SubTopic 10
-Name Accounting Standards Codification
-Section 50
-Paragraph 1
-Subparagraph (i)
-Publisher FASB
-URI https://asc.fasb.org/1943274/2147482964/270-10-50-1
Reference 4: http://www.xbrl.org/2003/role/disclosureRef
-Topic 280
-SubTopic 10
-Name Accounting Standards Codification
-Section 50
-Paragraph 32
-Subparagraph (ee)
-Publisher FASB
-URI https://asc.fasb.org/1943274/2147482810/280-10-50-32
Reference 5: http://fasb.org/us-gaap/role/ref/otherTransitionRef
-Topic 280
-SubTopic 10
-Name Accounting Standards Codification
-Section 50
-Paragraph 32
-Subparagraph (d)
-Publisher FASB
-URI https://asc.fasb.org/1943274/2147482810/280-10-50-32
Reference 6: http://www.xbrl.org/2003/role/disclosureRef
-Topic 280
-SubTopic 10
-Name Accounting Standards Codification
-Section 50
-Paragraph 22
-Publisher FASB
-URI https://asc.fasb.org/1943274/2147482810/280-10-50-22
Reference 7: http://www.xbrl.org/2003/role/disclosureRef
-Topic 810
-SubTopic 10
-Name Accounting Standards Codification
-Section 50
-Paragraph 3
-Subparagraph (bb)
-Publisher FASB
-URI https://asc.fasb.org/1943274/2147481203/810-10-50-3
Reference 8: http://www.xbrl.org/2003/role/disclosureRef
-Topic 810
-SubTopic 10
-Name Accounting Standards Codification
-Section 45
-Paragraph 25
-Subparagraph (a)
-Publisher FASB
-URI https://asc.fasb.org/1943274/2147481231/810-10-45-25
Reference 9: http://www.xbrl.org/2003/role/disclosureRef
-Topic 235
-SubTopic 10
-Name Accounting Standards Codification
-Section S99
-Paragraph 1
-Subparagraph (SX 210.4-08(g)(1)(ii))
-Publisher FASB
-URI https://asc.fasb.org/1943274/2147480678/235-10-S99-1
Reference 10: http://www.xbrl.org/2003/role/disclosureRef
-Topic 323
-SubTopic 10
-Name Accounting Standards Codification
-Section 50
-Paragraph 3
-Subparagraph (c)
-Publisher FASB
-URI https://asc.fasb.org/1943274/2147481687/323-10-50-3
Reference 11: http://www.xbrl.org/2003/role/disclosureRef
-Topic 825
-SubTopic 10
-Name Accounting Standards Codification
-Section 50
-Paragraph 28
-Subparagraph (f)
-Publisher FASB
-URI https://asc.fasb.org/1943274/2147482907/825-10-50-28
Reference 12: http://www.xbrl.org/2003/role/exampleRef
-Topic 852
-SubTopic 10
-Name Accounting Standards Codification
-Section 55
-Paragraph 10
-Publisher FASB
-URI https://asc.fasb.org/1943274/2147481372/852-10-55-10
Reference 13: http://www.xbrl.org/2003/role/exampleRef
-Topic 946
-SubTopic 830
-Name Accounting Standards Codification
-Section 55
-Paragraph 12
-Publisher FASB
-URI https://asc.fasb.org/1943274/2147479168/946-830-55-12
Reference 14: http://www.xbrl.org/2003/role/disclosureRef
-Topic 944
-SubTopic 210
-Name Accounting Standards Codification
-Section S99
-Paragraph 1
-Subparagraph (SX 210.7-03(a)(12))
-Publisher FASB
-URI https://asc.fasb.org/1943274/2147478777/944-210-S99-1
Reference 15: http://www.xbrl.org/2003/role/disclosureRef
-Topic 946
-SubTopic 210
-Name Accounting Standards Codification
-Section S99
-Paragraph 1
-Subparagraph (SX 210.6-04(8))
-Publisher FASB
-URI https://asc.fasb.org/1943274/2147479170/946-210-S99-1
Reference 16: http://www.xbrl.org/2003/role/disclosureRef
-Topic 210
-SubTopic 10
-Name Accounting Standards Codification
-Section S99
-Paragraph 1
-Subparagraph (SX 210.5-02(18))
-Publisher FASB
-URI https://asc.fasb.org/1943274/2147480566/210-10-S99-1
Reference 17: http://www.xbrl.org/2003/role/disclosureRef
-Topic 470
-SubTopic 10
-Name Accounting Standards Codification
-Section S99
-Paragraph 1A
-Subparagraph (SX 210.13-01(a)(4)(i))
-Publisher FASB
-URI https://asc.fasb.org/1943274/2147480097/470-10-S99-1A
Reference 18: http://www.xbrl.org/2009/role/commonPracticeRef
-Topic 470
-SubTopic 10
-Name Accounting Standards Codification
-Section S99
-Paragraph 1A
-Subparagraph (SX 210.13-01(a)(4)(ii))
-Publisher FASB
-URI https://asc.fasb.org/1943274/2147480097/470-10-S99-1A
Reference 19: http://www.xbrl.org/2009/role/commonPracticeRef
-Topic 470
-SubTopic 10
-Name Accounting Standards Codification
-Section S99
-Paragraph 1A
-Subparagraph (SX 210.13-01(a)(4)(iii))
-Publisher FASB
-URI https://asc.fasb.org/1943274/2147480097/470-10-S99-1A
Reference 20: http://www.xbrl.org/2003/role/disclosureRef
-Topic 470
-SubTopic 10
-Name Accounting Standards Codification
-Section S99
-Paragraph 1A
-Subparagraph (SX 210.13-01(a)(4)(iii)(A))
-Publisher FASB
-URI https://asc.fasb.org/1943274/2147480097/470-10-S99-1A
Reference 21: http://www.xbrl.org/2003/role/disclosureRef
-Topic 470
-SubTopic 10
-Name Accounting Standards Codification
-Section S99
-Paragraph 1A
-Subparagraph (SX 210.13-01(a)(4)(iv))
-Publisher FASB
-URI https://asc.fasb.org/1943274/2147480097/470-10-S99-1A
Reference 22: http://www.xbrl.org/2003/role/disclosureRef
-Topic 470
-SubTopic 10
-Name Accounting Standards Codification
-Section S99
-Paragraph 1A
-Subparagraph (SX 210.13-01(a)(5))
-Publisher FASB
-URI https://asc.fasb.org/1943274/2147480097/470-10-S99-1A
Reference 23: http://www.xbrl.org/2003/role/disclosureRef
-Topic 470
-SubTopic 10
-Name Accounting Standards Codification
-Section S99
-Paragraph 1B
-Subparagraph (SX 210.13-02(a)(4)(i))
-Publisher FASB
-URI https://asc.fasb.org/1943274/2147480097/470-10-S99-1B
Reference 24: http://www.xbrl.org/2003/role/disclosureRef
-Topic 470
-SubTopic 10
-Name Accounting Standards Codification
-Section S99
-Paragraph 1B
-Subparagraph (SX 210.13-02(a)(4)(iii)(A))
-Publisher FASB
-URI https://asc.fasb.org/1943274/2147480097/470-10-S99-1B
Reference 25: http://www.xbrl.org/2003/role/disclosureRef
-Topic 470
-SubTopic 10
-Name Accounting Standards Codification
-Section S99
-Paragraph 1B
-Subparagraph (SX 210.13-02(a)(4)(iii)(B))
-Publisher FASB
-URI https://asc.fasb.org/1943274/2147480097/470-10-S99-1B
Reference 26: http://www.xbrl.org/2003/role/disclosureRef
-Topic 470
-SubTopic 10
-Name Accounting Standards Codification
-Section S99
-Paragraph 1B
-Subparagraph (SX 210.13-02(a)(4)(iv))
-Publisher FASB
-URI https://asc.fasb.org/1943274/2147480097/470-10-S99-1B
Reference 27: http://www.xbrl.org/2003/role/disclosureRef
-Topic 470
-SubTopic 10
-Name Accounting Standards Codification
-Section S99
-Paragraph 1B
-Subparagraph (SX 210.13-02(a)(5))
-Publisher FASB
-URI https://asc.fasb.org/1943274/2147480097/470-10-S99-1B
Reference 28: http://www.xbrl.org/2009/role/commonPracticeRef
-Topic 852
-SubTopic 10
-Name Accounting Standards Codification
-Section 50
-Paragraph 7
-Subparagraph (a)
-Publisher FASB
-URI https://asc.fasb.org/1943274/2147481404/852-10-50-7
Reference 29: http://www.xbrl.org/2003/role/disclosureRef
-Topic 280
-SubTopic 10
-Name Accounting Standards Codification
-Section 50
-Paragraph 30
-Subparagraph (c)
-Publisher FASB
-URI https://asc.fasb.org/1943274/2147482810/280-10-50-30
Reference 30: http://fasb.org/us-gaap/role/ref/legacyRef
-Topic 942
-SubTopic 210
-Name Accounting Standards Codification
-Section S99
-Paragraph 1
-Subparagraph (SX 210.9-03(11))
-Publisher FASB
-URI https://asc.fasb.org/1943274/2147478546/942-210-S99-1
| Name: |
us-gaap_Assets |
| Namespace Prefix: |
us-gaap_ |
| Data Type: |
xbrli:monetaryItemType |
| Balance Type: |
debit |
| Period Type: |
instant |
|
| X |
- DefinitionAmount of asset recognized for present right to economic benefit, classified as current. Reference 1: http://www.xbrl.org/2003/role/disclosureRef
-Topic 810
-SubTopic 10
-Name Accounting Standards Codification
-Section 50
-Paragraph 3
-Subparagraph (bb)
-Publisher FASB
-URI https://asc.fasb.org/1943274/2147481203/810-10-50-3
Reference 2: http://www.xbrl.org/2003/role/disclosureRef
-Topic 810
-SubTopic 10
-Name Accounting Standards Codification
-Section 45
-Paragraph 25
-Subparagraph (a)
-Publisher FASB
-URI https://asc.fasb.org/1943274/2147481231/810-10-45-25
Reference 3: http://www.xbrl.org/2003/role/disclosureRef
-Topic 235
-SubTopic 10
-Name Accounting Standards Codification
-Section S99
-Paragraph 1
-Subparagraph (SX 210.4-08(g)(1)(ii))
-Publisher FASB
-URI https://asc.fasb.org/1943274/2147480678/235-10-S99-1
Reference 4: http://www.xbrl.org/2003/role/disclosureRef
-Topic 323
-SubTopic 10
-Name Accounting Standards Codification
-Section 50
-Paragraph 3
-Subparagraph (c)
-Publisher FASB
-URI https://asc.fasb.org/1943274/2147481687/323-10-50-3
Reference 5: http://www.xbrl.org/2003/role/disclosureRef
-Topic 825
-SubTopic 10
-Name Accounting Standards Codification
-Section 50
-Paragraph 28
-Subparagraph (f)
-Publisher FASB
-URI https://asc.fasb.org/1943274/2147482907/825-10-50-28
Reference 6: http://www.xbrl.org/2003/role/exampleRef
-Topic 852
-SubTopic 10
-Name Accounting Standards Codification
-Section 55
-Paragraph 10
-Publisher FASB
-URI https://asc.fasb.org/1943274/2147481372/852-10-55-10
Reference 7: http://www.xbrl.org/2003/role/disclosureRef
-Topic 210
-SubTopic 10
-Name Accounting Standards Codification
-Section 45
-Paragraph 1
-Publisher FASB
-URI https://asc.fasb.org/1943274/2147483467/210-10-45-1
Reference 8: http://www.xbrl.org/2003/role/disclosureRef
-Topic 210
-SubTopic 10
-Name Accounting Standards Codification
-Section S99
-Paragraph 1
-Subparagraph (SX 210.5-02(9))
-Publisher FASB
-URI https://asc.fasb.org/1943274/2147480566/210-10-S99-1
Reference 9: http://www.xbrl.org/2003/role/disclosureRef
-Topic 470
-SubTopic 10
-Name Accounting Standards Codification
-Section S99
-Paragraph 1A
-Subparagraph (SX 210.13-01(a)(4)(i))
-Publisher FASB
-URI https://asc.fasb.org/1943274/2147480097/470-10-S99-1A
Reference 10: http://www.xbrl.org/2009/role/commonPracticeRef
-Topic 470
-SubTopic 10
-Name Accounting Standards Codification
-Section S99
-Paragraph 1A
-Subparagraph (SX 210.13-01(a)(4)(ii))
-Publisher FASB
-URI https://asc.fasb.org/1943274/2147480097/470-10-S99-1A
Reference 11: http://www.xbrl.org/2009/role/commonPracticeRef
-Topic 470
-SubTopic 10
-Name Accounting Standards Codification
-Section S99
-Paragraph 1A
-Subparagraph (SX 210.13-01(a)(4)(iii))
-Publisher FASB
-URI https://asc.fasb.org/1943274/2147480097/470-10-S99-1A
Reference 12: http://www.xbrl.org/2003/role/disclosureRef
-Topic 470
-SubTopic 10
-Name Accounting Standards Codification
-Section S99
-Paragraph 1A
-Subparagraph (SX 210.13-01(a)(4)(iii)(A))
-Publisher FASB
-URI https://asc.fasb.org/1943274/2147480097/470-10-S99-1A
Reference 13: http://www.xbrl.org/2003/role/disclosureRef
-Topic 470
-SubTopic 10
-Name Accounting Standards Codification
-Section S99
-Paragraph 1A
-Subparagraph (SX 210.13-01(a)(4)(iv))
-Publisher FASB
-URI https://asc.fasb.org/1943274/2147480097/470-10-S99-1A
Reference 14: http://www.xbrl.org/2003/role/disclosureRef
-Topic 470
-SubTopic 10
-Name Accounting Standards Codification
-Section S99
-Paragraph 1A
-Subparagraph (SX 210.13-01(a)(5))
-Publisher FASB
-URI https://asc.fasb.org/1943274/2147480097/470-10-S99-1A
Reference 15: http://www.xbrl.org/2003/role/disclosureRef
-Topic 470
-SubTopic 10
-Name Accounting Standards Codification
-Section S99
-Paragraph 1B
-Subparagraph (SX 210.13-02(a)(4)(i))
-Publisher FASB
-URI https://asc.fasb.org/1943274/2147480097/470-10-S99-1B
Reference 16: http://www.xbrl.org/2003/role/disclosureRef
-Topic 470
-SubTopic 10
-Name Accounting Standards Codification
-Section S99
-Paragraph 1B
-Subparagraph (SX 210.13-02(a)(4)(iii)(A))
-Publisher FASB
-URI https://asc.fasb.org/1943274/2147480097/470-10-S99-1B
Reference 17: http://www.xbrl.org/2003/role/disclosureRef
-Topic 470
-SubTopic 10
-Name Accounting Standards Codification
-Section S99
-Paragraph 1B
-Subparagraph (SX 210.13-02(a)(4)(iii)(B))
-Publisher FASB
-URI https://asc.fasb.org/1943274/2147480097/470-10-S99-1B
Reference 18: http://www.xbrl.org/2003/role/disclosureRef
-Topic 470
-SubTopic 10
-Name Accounting Standards Codification
-Section S99
-Paragraph 1B
-Subparagraph (SX 210.13-02(a)(4)(iv))
-Publisher FASB
-URI https://asc.fasb.org/1943274/2147480097/470-10-S99-1B
Reference 19: http://www.xbrl.org/2003/role/disclosureRef
-Topic 470
-SubTopic 10
-Name Accounting Standards Codification
-Section S99
-Paragraph 1B
-Subparagraph (SX 210.13-02(a)(5))
-Publisher FASB
-URI https://asc.fasb.org/1943274/2147480097/470-10-S99-1B
Reference 20: http://www.xbrl.org/2009/role/commonPracticeRef
-Topic 852
-SubTopic 10
-Name Accounting Standards Codification
-Section 50
-Paragraph 7
-Subparagraph (a)
-Publisher FASB
-URI https://asc.fasb.org/1943274/2147481404/852-10-50-7
| Name: |
us-gaap_AssetsCurrent |
| Namespace Prefix: |
us-gaap_ |
| Data Type: |
xbrli:monetaryItemType |
| Balance Type: |
debit |
| Period Type: |
instant |
|
| X |
- References
+ Details
| Name: |
us-gaap_AssetsCurrentAbstract |
| Namespace Prefix: |
us-gaap_ |
| Data Type: |
xbrli:stringItemType |
| Balance Type: |
na |
| Period Type: |
duration |
|
| X |
- DefinitionAmount of currency on hand as well as demand deposits with banks or financial institutions. Includes other kinds of accounts that have the general characteristics of demand deposits. Also includes short-term, highly liquid investments that are both readily convertible to known amounts of cash and so near their maturity that they present insignificant risk of changes in value because of changes in interest rates. Excludes cash and cash equivalents within disposal group and discontinued operation. Reference 1: http://www.xbrl.org/2003/role/disclosureRef
-Topic 210
-SubTopic 10
-Name Accounting Standards Codification
-Section S99
-Paragraph 1
-Subparagraph (SX 210.5-02(1))
-Publisher FASB
-URI https://asc.fasb.org/1943274/2147480566/210-10-S99-1
Reference 2: http://www.xbrl.org/2003/role/exampleRef
-Topic 210
-SubTopic 10
-Name Accounting Standards Codification
-Section 45
-Paragraph 1
-Subparagraph (a)
-Publisher FASB
-URI https://asc.fasb.org/1943274/2147483467/210-10-45-1
Reference 3: http://fasb.org/us-gaap/role/ref/legacyRef
-Name Accounting Standards Codification
-Topic 230
-SubTopic 10
-Section 45
-Paragraph 4
-Publisher FASB
-URI https://asc.fasb.org/1943274/2147482740/230-10-45-4
| Name: |
us-gaap_CashAndCashEquivalentsAtCarryingValue |
| Namespace Prefix: |
us-gaap_ |
| Data Type: |
xbrli:monetaryItemType |
| Balance Type: |
debit |
| Period Type: |
instant |
|
| X |
- DefinitionCash includes currency on hand as well as demand deposits with banks or financial institutions. It also includes other kinds of accounts that have the general characteristics of demand deposits in that the customer may deposit additional funds at any time and effectively may withdraw funds at any time without prior notice or penalty. Cash equivalents, excluding items classified as marketable securities, include short-term, highly liquid Investments that are both readily convertible to known amounts of cash, and so near their maturity that they present minimal risk of changes in value because of changes in interest rates. Generally, only investments with original maturities of three months or less qualify under that definition. Original maturity means original maturity to the entity holding the investment. For example, both a three-month US Treasury bill and a three-year Treasury note purchased three months from maturity qualify as cash equivalents. However, a Treasury note purchased three years ago does not become a cash equivalent when its remaining maturity is three months. Short-term investments, exclusive of cash equivalents, generally consist of marketable securities intended to be sold within one year (or the normal operating cycle if longer) and may include trading securities, available-for-sale securities, or held-to-maturity securities (if maturing within one year), as applicable. Reference 1: http://www.xbrl.org/2009/role/commonPracticeRef
-Topic 210
-SubTopic 10
-Name Accounting Standards Codification
-Section S99
-Paragraph 1
-Subparagraph (SX 210.5-02(9))
-Publisher FASB
-URI https://asc.fasb.org/1943274/2147480566/210-10-S99-1
| Name: |
us-gaap_CashCashEquivalentsAndShortTermInvestments |
| Namespace Prefix: |
us-gaap_ |
| Data Type: |
xbrli:monetaryItemType |
| Balance Type: |
debit |
| Period Type: |
instant |
|
| X |
- DefinitionRepresents the caption on the face of the balance sheet to indicate that the entity has entered into (1) purchase or supply arrangements that will require expending a portion of its resources to meet the terms thereof, and (2) is exposed to potential losses or, less frequently, gains, arising from (a) possible claims against a company's resources due to future performance under contract terms, and (b) possible losses or likely gains from uncertainties that will ultimately be resolved when one or more future events that are deemed likely to occur do occur or fail to occur. Reference 1: http://fasb.org/us-gaap/role/ref/legacyRef
-Topic 942
-SubTopic 210
-Name Accounting Standards Codification
-Section S99
-Paragraph 1
-Subparagraph (SX 210.9-03(17))
-Publisher FASB
-URI https://asc.fasb.org/1943274/2147478546/942-210-S99-1
Reference 2: http://fasb.org/us-gaap/role/ref/legacyRef
-Topic 210
-SubTopic 10
-Name Accounting Standards Codification
-Section S99
-Paragraph 1
-Subparagraph (SX 210.5-02(25))
-Publisher FASB
-URI https://asc.fasb.org/1943274/2147480566/210-10-S99-1
Reference 3: http://www.xbrl.org/2003/role/disclosureRef
-Topic 944
-SubTopic 210
-Name Accounting Standards Codification
-Section S99
-Paragraph 1
-Subparagraph (SX 210.7-03(a)(19))
-Publisher FASB
-URI https://asc.fasb.org/1943274/2147478777/944-210-S99-1
Reference 4: http://www.xbrl.org/2003/role/disclosureRef
-Topic 946
-SubTopic 210
-Name Accounting Standards Codification
-Section S99
-Paragraph 1
-Subparagraph (SX 210.6-04(15))
-Publisher FASB
-URI https://asc.fasb.org/1943274/2147479170/946-210-S99-1
| Name: |
us-gaap_CommitmentsAndContingencies |
| Namespace Prefix: |
us-gaap_ |
| Data Type: |
xbrli:monetaryItemType |
| Balance Type: |
credit |
| Period Type: |
instant |
|
| X |
- DefinitionAggregate par or stated value of issued nonredeemable common stock (or common stock redeemable solely at the option of the issuer). This item includes treasury stock repurchased by the entity. Note: elements for number of nonredeemable common shares, par value and other disclosure concepts are in another section within stockholders' equity. Reference 1: http://fasb.org/us-gaap/role/ref/legacyRef
-Topic 210
-SubTopic 10
-Name Accounting Standards Codification
-Section S99
-Paragraph 1
-Subparagraph (SX 210.5-02(29))
-Publisher FASB
-URI https://asc.fasb.org/1943274/2147480566/210-10-S99-1
Reference 2: http://www.xbrl.org/2003/role/exampleRef
-Topic 852
-SubTopic 10
-Name Accounting Standards Codification
-Section 55
-Paragraph 10
-Publisher FASB
-URI https://asc.fasb.org/1943274/2147481372/852-10-55-10
Reference 3: http://www.xbrl.org/2003/role/disclosureRef
-Topic 944
-SubTopic 210
-Name Accounting Standards Codification
-Section S99
-Paragraph 1
-Subparagraph (SX 210.7-03(a)(22))
-Publisher FASB
-URI https://asc.fasb.org/1943274/2147478777/944-210-S99-1
| Name: |
us-gaap_CommonStockValue |
| Namespace Prefix: |
us-gaap_ |
| Data Type: |
xbrli:monetaryItemType |
| Balance Type: |
credit |
| Period Type: |
instant |
|
| X |
- DefinitionAmount of obligation to transfer good or service to customer for which consideration has been received or is receivable, classified as current. Reference 1: http://www.xbrl.org/2003/role/disclosureRef
-Topic 606
-SubTopic 10
-Name Accounting Standards Codification
-Section 45
-Paragraph 1
-Publisher FASB
-URI https://asc.fasb.org/1943274/2147479837/606-10-45-1
Reference 2: http://www.xbrl.org/2003/role/disclosureRef
-Topic 606
-SubTopic 10
-Name Accounting Standards Codification
-Section 50
-Paragraph 8
-Subparagraph (a)
-Publisher FASB
-URI https://asc.fasb.org/1943274/2147479806/606-10-50-8
Reference 3: http://www.xbrl.org/2003/role/disclosureRef
-Topic 606
-SubTopic 10
-Name Accounting Standards Codification
-Section 45
-Paragraph 2
-Publisher FASB
-URI https://asc.fasb.org/1943274/2147479837/606-10-45-2
| Name: |
us-gaap_ContractWithCustomerLiabilityCurrent |
| Namespace Prefix: |
us-gaap_ |
| Data Type: |
xbrli:monetaryItemType |
| Balance Type: |
credit |
| Period Type: |
instant |
|
| X |
- DefinitionCarrying value as of the balance sheet date of long-term debt (with maturities initially due after one year or beyond the operating cycle if longer) identified as Convertible Notes Payable, excluding current portion. Convertible Notes Payable is a written promise to pay a note which can be exchanged for a specified amount of another, related security, at the option of the issuer and the holder. Reference 1: http://fasb.org/us-gaap/role/ref/legacyRef
-Name Accounting Standards Codification
-Section S99
-Paragraph 1
-Subparagraph (SX 210.5-02(22))
-SubTopic 10
-Topic 210
-Publisher FASB
-URI https://asc.fasb.org/1943274/2147480566/210-10-S99-1
| Name: |
us-gaap_ConvertibleLongTermNotesPayable |
| Namespace Prefix: |
us-gaap_ |
| Data Type: |
xbrli:monetaryItemType |
| Balance Type: |
credit |
| Period Type: |
instant |
|
| X |
- DefinitionCarrying value as of the balance sheet date of the portion of long-term debt due within one year or the operating cycle if longer identified as Convertible Notes Payable. Convertible Notes Payable is a written promise to pay a note which can be exchanged for a specified amount of another, related security, at the option of the issuer and the holder. Reference 1: http://fasb.org/us-gaap/role/ref/legacyRef
-Topic 210
-SubTopic 10
-Name Accounting Standards Codification
-Section S99
-Paragraph 1
-Subparagraph (SX 210.5-02(20))
-Publisher FASB
-URI https://asc.fasb.org/1943274/2147480566/210-10-S99-1
| Name: |
us-gaap_ConvertibleNotesPayableCurrent |
| Namespace Prefix: |
us-gaap_ |
| Data Type: |
xbrli:monetaryItemType |
| Balance Type: |
credit |
| Period Type: |
instant |
|
| X |
- DefinitionAmount, after accumulated impairment loss, of asset representing future economic benefit arising from other asset acquired in business combination or from joint venture formation or both, that is not individually identified and separately recognized. Reference 1: http://www.xbrl.org/2003/role/exampleRef
-Topic 280
-SubTopic 10
-Name Accounting Standards Codification
-Section 55
-Paragraph 49
-Publisher FASB
-URI https://asc.fasb.org/1943274/2147482785/280-10-55-49
Reference 2: http://www.xbrl.org/2003/role/exampleRef
-Topic 350
-SubTopic 20
-Name Accounting Standards Codification
-Section 55
-Paragraph 24
-Publisher FASB
-URI https://asc.fasb.org/1943274/2147482548/350-20-55-24
Reference 3: http://www.xbrl.org/2003/role/exampleRef
-Topic 820
-SubTopic 10
-Name Accounting Standards Codification
-Section 55
-Paragraph 100
-Subparagraph (d)
-Publisher FASB
-URI https://asc.fasb.org/1943274/2147482078/820-10-55-100
Reference 4: http://www.xbrl.org/2003/role/exampleRef
-Topic 852
-SubTopic 10
-Name Accounting Standards Codification
-Section 55
-Paragraph 10
-Publisher FASB
-URI https://asc.fasb.org/1943274/2147481372/852-10-55-10
Reference 5: http://www.xbrl.org/2003/role/disclosureRef
-Topic 210
-SubTopic 10
-Name Accounting Standards Codification
-Section S99
-Paragraph 1
-Subparagraph (SX 210.5-02(15))
-Publisher FASB
-URI https://asc.fasb.org/1943274/2147480566/210-10-S99-1
Reference 6: http://www.xbrl.org/2003/role/disclosureRef
-Topic 350
-SubTopic 20
-Name Accounting Standards Codification
-Section 45
-Paragraph 1
-Publisher FASB
-URI https://asc.fasb.org/1943274/2147482598/350-20-45-1
Reference 7: http://www.xbrl.org/2009/role/commonPracticeRef
-Topic 350
-SubTopic 20
-Name Accounting Standards Codification
-Section 50
-Paragraph 1
-Subparagraph (a)
-Publisher FASB
-URI https://asc.fasb.org/1943274/2147482573/350-20-50-1
Reference 8: http://www.xbrl.org/2009/role/commonPracticeRef
-Topic 350
-SubTopic 20
-Name Accounting Standards Codification
-Section 50
-Paragraph 1
-Subparagraph (h)
-Publisher FASB
-URI https://asc.fasb.org/1943274/2147482573/350-20-50-1
Reference 9: http://www.xbrl.org/2003/role/disclosureRef
-Topic 942
-SubTopic 210
-Name Accounting Standards Codification
-Section S99
-Paragraph 1
-Subparagraph (SX 210.9-03(10)(1))
-Publisher FASB
-URI https://asc.fasb.org/1943274/2147478546/942-210-S99-1
| Name: |
us-gaap_Goodwill |
| Namespace Prefix: |
us-gaap_ |
| Data Type: |
xbrli:monetaryItemType |
| Balance Type: |
debit |
| Period Type: |
instant |
|
| X |
- DefinitionAmount of liability recognized for present obligation requiring transfer or otherwise providing economic benefit to others. Reference 1: http://fasb.org/us-gaap/role/ref/legacyRef
-Name Accounting Standards Codification
-Section S99
-Paragraph 1
-Subparagraph (SX 210.5-02(22))
-SubTopic 10
-Topic 210
-Publisher FASB
-URI https://asc.fasb.org/1943274/2147480566/210-10-S99-1
Reference 2: http://fasb.org/us-gaap/role/ref/legacyRef
-Topic 210
-SubTopic 10
-Name Accounting Standards Codification
-Section S99
-Paragraph 1
-Subparagraph (SX 210.5-02(20))
-Publisher FASB
-URI https://asc.fasb.org/1943274/2147480566/210-10-S99-1
Reference 3: http://fasb.org/us-gaap/role/ref/legacyRef
-Topic 210
-SubTopic 10
-Name Accounting Standards Codification
-Section S99
-Paragraph 1
-Subparagraph (SX 210.5-02(24))
-Publisher FASB
-URI https://asc.fasb.org/1943274/2147480566/210-10-S99-1
Reference 4: http://fasb.org/us-gaap/role/ref/legacyRef
-Topic 210
-SubTopic 10
-Name Accounting Standards Codification
-Section S99
-Paragraph 1
-Subparagraph (SX 210.5-02(19))
-Publisher FASB
-URI https://asc.fasb.org/1943274/2147480566/210-10-S99-1
Reference 5: http://fasb.org/us-gaap/role/ref/legacyRef
-Topic 210
-SubTopic 10
-Name Accounting Standards Codification
-Section S99
-Paragraph 1
-Subparagraph (SX 210.5-02(25))
-Publisher FASB
-URI https://asc.fasb.org/1943274/2147480566/210-10-S99-1
Reference 6: http://fasb.org/us-gaap/role/ref/legacyRef
-Topic 210
-SubTopic 10
-Name Accounting Standards Codification
-Section S99
-Paragraph 1
-Subparagraph (SX 210.5-02(26))
-Publisher FASB
-URI https://asc.fasb.org/1943274/2147480566/210-10-S99-1
Reference 7: http://fasb.org/us-gaap/role/ref/legacyRef
-Topic 210
-SubTopic 10
-Name Accounting Standards Codification
-Section S99
-Paragraph 1
-Subparagraph (SX 210.5-02(23))
-Publisher FASB
-URI https://asc.fasb.org/1943274/2147480566/210-10-S99-1
Reference 8: http://fasb.org/us-gaap/role/ref/legacyRef
-Topic 210
-SubTopic 10
-Name Accounting Standards Codification
-Section S99
-Paragraph 1
-Subparagraph (SX 210.5-02(21))
-Publisher FASB
-URI https://asc.fasb.org/1943274/2147480566/210-10-S99-1
Reference 9: http://www.xbrl.org/2003/role/disclosureRef
-Topic 810
-SubTopic 10
-Name Accounting Standards Codification
-Section 50
-Paragraph 3
-Subparagraph (c)
-Publisher FASB
-URI https://asc.fasb.org/1943274/2147481203/810-10-50-3
Reference 10: http://www.xbrl.org/2003/role/disclosureRef
-Topic 810
-SubTopic 10
-Name Accounting Standards Codification
-Section 45
-Paragraph 25
-Subparagraph (b)
-Publisher FASB
-URI https://asc.fasb.org/1943274/2147481231/810-10-45-25
Reference 11: http://www.xbrl.org/2003/role/disclosureRef
-Topic 810
-SubTopic 10
-Name Accounting Standards Codification
-Section 50
-Paragraph 3
-Subparagraph (bb)
-Publisher FASB
-URI https://asc.fasb.org/1943274/2147481203/810-10-50-3
Reference 12: http://www.xbrl.org/2003/role/disclosureRef
-Topic 235
-SubTopic 10
-Name Accounting Standards Codification
-Section S99
-Paragraph 1
-Subparagraph (SX 210.4-08(g)(1)(ii))
-Publisher FASB
-URI https://asc.fasb.org/1943274/2147480678/235-10-S99-1
Reference 13: http://www.xbrl.org/2003/role/disclosureRef
-Topic 323
-SubTopic 10
-Name Accounting Standards Codification
-Section 50
-Paragraph 3
-Subparagraph (c)
-Publisher FASB
-URI https://asc.fasb.org/1943274/2147481687/323-10-50-3
Reference 14: http://www.xbrl.org/2003/role/disclosureRef
-Topic 825
-SubTopic 10
-Name Accounting Standards Codification
-Section 50
-Paragraph 28
-Subparagraph (f)
-Publisher FASB
-URI https://asc.fasb.org/1943274/2147482907/825-10-50-28
Reference 15: http://www.xbrl.org/2003/role/exampleRef
-Topic 946
-SubTopic 830
-Name Accounting Standards Codification
-Section 55
-Paragraph 12
-Publisher FASB
-URI https://asc.fasb.org/1943274/2147479168/946-830-55-12
Reference 16: http://www.xbrl.org/2003/role/disclosureRef
-Topic 946
-SubTopic 210
-Name Accounting Standards Codification
-Section S99
-Paragraph 1
-Subparagraph (SX 210.6-04(14))
-Publisher FASB
-URI https://asc.fasb.org/1943274/2147479170/946-210-S99-1
Reference 17: http://www.xbrl.org/2003/role/disclosureRef
-Topic 470
-SubTopic 10
-Name Accounting Standards Codification
-Section S99
-Paragraph 1A
-Subparagraph (SX 210.13-01(a)(4)(i))
-Publisher FASB
-URI https://asc.fasb.org/1943274/2147480097/470-10-S99-1A
Reference 18: http://www.xbrl.org/2009/role/commonPracticeRef
-Topic 470
-SubTopic 10
-Name Accounting Standards Codification
-Section S99
-Paragraph 1A
-Subparagraph (SX 210.13-01(a)(4)(ii))
-Publisher FASB
-URI https://asc.fasb.org/1943274/2147480097/470-10-S99-1A
Reference 19: http://www.xbrl.org/2003/role/disclosureRef
-Topic 470
-SubTopic 10
-Name Accounting Standards Codification
-Section S99
-Paragraph 1A
-Subparagraph (SX 210.13-01(a)(4)(iii)(A))
-Publisher FASB
-URI https://asc.fasb.org/1943274/2147480097/470-10-S99-1A
Reference 20: http://www.xbrl.org/2003/role/disclosureRef
-Topic 470
-SubTopic 10
-Name Accounting Standards Codification
-Section S99
-Paragraph 1A
-Subparagraph (SX 210.13-01(a)(4)(iv))
-Publisher FASB
-URI https://asc.fasb.org/1943274/2147480097/470-10-S99-1A
Reference 21: http://www.xbrl.org/2003/role/disclosureRef
-Topic 470
-SubTopic 10
-Name Accounting Standards Codification
-Section S99
-Paragraph 1A
-Subparagraph (SX 210.13-01(a)(5))
-Publisher FASB
-URI https://asc.fasb.org/1943274/2147480097/470-10-S99-1A
Reference 22: http://www.xbrl.org/2003/role/disclosureRef
-Topic 470
-SubTopic 10
-Name Accounting Standards Codification
-Section S99
-Paragraph 1B
-Subparagraph (SX 210.13-02(a)(4)(i))
-Publisher FASB
-URI https://asc.fasb.org/1943274/2147480097/470-10-S99-1B
Reference 23: http://www.xbrl.org/2003/role/disclosureRef
-Topic 470
-SubTopic 10
-Name Accounting Standards Codification
-Section S99
-Paragraph 1B
-Subparagraph (SX 210.13-02(a)(4)(iii)(A))
-Publisher FASB
-URI https://asc.fasb.org/1943274/2147480097/470-10-S99-1B
Reference 24: http://www.xbrl.org/2003/role/disclosureRef
-Topic 470
-SubTopic 10
-Name Accounting Standards Codification
-Section S99
-Paragraph 1B
-Subparagraph (SX 210.13-02(a)(4)(iii)(B))
-Publisher FASB
-URI https://asc.fasb.org/1943274/2147480097/470-10-S99-1B
Reference 25: http://www.xbrl.org/2003/role/disclosureRef
-Topic 470
-SubTopic 10
-Name Accounting Standards Codification
-Section S99
-Paragraph 1B
-Subparagraph (SX 210.13-02(a)(4)(iv))
-Publisher FASB
-URI https://asc.fasb.org/1943274/2147480097/470-10-S99-1B
Reference 26: http://www.xbrl.org/2003/role/disclosureRef
-Topic 470
-SubTopic 10
-Name Accounting Standards Codification
-Section S99
-Paragraph 1B
-Subparagraph (SX 210.13-02(a)(5))
-Publisher FASB
-URI https://asc.fasb.org/1943274/2147480097/470-10-S99-1B
Reference 27: http://www.xbrl.org/2009/role/commonPracticeRef
-Topic 852
-SubTopic 10
-Name Accounting Standards Codification
-Section 50
-Paragraph 7
-Subparagraph (a)
-Publisher FASB
-URI https://asc.fasb.org/1943274/2147481404/852-10-50-7
Reference 28: http://www.xbrl.org/2009/role/commonPracticeRef
-Topic 852
-SubTopic 10
-Name Accounting Standards Codification
-Section 50
-Paragraph 7
-Subparagraph (b)
-Publisher FASB
-URI https://asc.fasb.org/1943274/2147481404/852-10-50-7
Reference 29: http://www.xbrl.org/2003/role/exampleRef
-Topic 280
-SubTopic 10
-Name Accounting Standards Codification
-Section 50
-Paragraph 30
-Subparagraph (d)
-Publisher FASB
-URI https://asc.fasb.org/1943274/2147482810/280-10-50-30
| Name: |
us-gaap_Liabilities |
| Namespace Prefix: |
us-gaap_ |
| Data Type: |
xbrli:monetaryItemType |
| Balance Type: |
credit |
| Period Type: |
instant |
|
| X |
- DefinitionAmount of liabilities and equity items, including the portion of equity attributable to noncontrolling interests, if any. Reference 1: http://www.xbrl.org/2003/role/exampleRef
-Topic 852
-SubTopic 10
-Name Accounting Standards Codification
-Section 55
-Paragraph 10
-Publisher FASB
-URI https://asc.fasb.org/1943274/2147481372/852-10-55-10
Reference 2: http://www.xbrl.org/2003/role/disclosureRef
-Topic 944
-SubTopic 210
-Name Accounting Standards Codification
-Section S99
-Paragraph 1
-Subparagraph (SX 210.7-03(a)(25))
-Publisher FASB
-URI https://asc.fasb.org/1943274/2147478777/944-210-S99-1
Reference 3: http://www.xbrl.org/2009/role/commonPracticeRef
-Topic 235
-SubTopic 10
-Name Accounting Standards Codification
-Section S99
-Paragraph 1
-Subparagraph (SX 210.4-08(g)(1)(ii))
-Publisher FASB
-URI https://asc.fasb.org/1943274/2147480678/235-10-S99-1
Reference 4: http://www.xbrl.org/2009/role/commonPracticeRef
-Topic 323
-SubTopic 10
-Name Accounting Standards Codification
-Section 50
-Paragraph 3
-Subparagraph (c)
-Publisher FASB
-URI https://asc.fasb.org/1943274/2147481687/323-10-50-3
Reference 5: http://www.xbrl.org/2009/role/commonPracticeRef
-Topic 825
-SubTopic 10
-Name Accounting Standards Codification
-Section 50
-Paragraph 28
-Subparagraph (f)
-Publisher FASB
-URI https://asc.fasb.org/1943274/2147482907/825-10-50-28
Reference 6: http://fasb.org/us-gaap/role/ref/legacyRef
-Topic 942
-SubTopic 210
-Name Accounting Standards Codification
-Section S99
-Paragraph 1
-Subparagraph (SX 210.9-03(23))
-Publisher FASB
-URI https://asc.fasb.org/1943274/2147478546/942-210-S99-1
Reference 7: http://fasb.org/us-gaap/role/ref/legacyRef
-Topic 210
-SubTopic 10
-Name Accounting Standards Codification
-Section S99
-Paragraph 1
-Subparagraph (SX 210.5-02(32))
-Publisher FASB
-URI https://asc.fasb.org/1943274/2147480566/210-10-S99-1
| Name: |
us-gaap_LiabilitiesAndStockholdersEquity |
| Namespace Prefix: |
us-gaap_ |
| Data Type: |
xbrli:monetaryItemType |
| Balance Type: |
credit |
| Period Type: |
instant |
|
| X |
- DefinitionTotal obligations incurred as part of normal operations that are expected to be paid during the following twelve months or within one business cycle, if longer. Reference 1: http://fasb.org/us-gaap/role/ref/legacyRef
-Topic 210
-SubTopic 10
-Name Accounting Standards Codification
-Section S99
-Paragraph 1
-Subparagraph (SX 210.5-02(21))
-Publisher FASB
-URI https://asc.fasb.org/1943274/2147480566/210-10-S99-1
Reference 2: http://www.xbrl.org/2003/role/disclosureRef
-Topic 810
-SubTopic 10
-Name Accounting Standards Codification
-Section 50
-Paragraph 3
-Subparagraph (c)
-Publisher FASB
-URI https://asc.fasb.org/1943274/2147481203/810-10-50-3
Reference 3: http://www.xbrl.org/2003/role/disclosureRef
-Topic 810
-SubTopic 10
-Name Accounting Standards Codification
-Section 45
-Paragraph 25
-Subparagraph (b)
-Publisher FASB
-URI https://asc.fasb.org/1943274/2147481231/810-10-45-25
Reference 4: http://www.xbrl.org/2003/role/disclosureRef
-Topic 810
-SubTopic 10
-Name Accounting Standards Codification
-Section 50
-Paragraph 3
-Subparagraph (bb)
-Publisher FASB
-URI https://asc.fasb.org/1943274/2147481203/810-10-50-3
Reference 5: http://www.xbrl.org/2003/role/disclosureRef
-Topic 235
-SubTopic 10
-Name Accounting Standards Codification
-Section S99
-Paragraph 1
-Subparagraph (SX 210.4-08(g)(1)(ii))
-Publisher FASB
-URI https://asc.fasb.org/1943274/2147480678/235-10-S99-1
Reference 6: http://www.xbrl.org/2003/role/disclosureRef
-Topic 323
-SubTopic 10
-Name Accounting Standards Codification
-Section 50
-Paragraph 3
-Subparagraph (c)
-Publisher FASB
-URI https://asc.fasb.org/1943274/2147481687/323-10-50-3
Reference 7: http://www.xbrl.org/2003/role/disclosureRef
-Topic 825
-SubTopic 10
-Name Accounting Standards Codification
-Section 50
-Paragraph 28
-Subparagraph (f)
-Publisher FASB
-URI https://asc.fasb.org/1943274/2147482907/825-10-50-28
Reference 8: http://www.xbrl.org/2003/role/exampleRef
-Topic 852
-SubTopic 10
-Name Accounting Standards Codification
-Section 55
-Paragraph 10
-Publisher FASB
-URI https://asc.fasb.org/1943274/2147481372/852-10-55-10
Reference 9: http://www.xbrl.org/2003/role/disclosureRef
-Topic 210
-SubTopic 10
-Name Accounting Standards Codification
-Section 45
-Paragraph 5
-Publisher FASB
-URI https://asc.fasb.org/1943274/2147483467/210-10-45-5
Reference 10: http://www.xbrl.org/2003/role/disclosureRef
-Topic 470
-SubTopic 10
-Name Accounting Standards Codification
-Section S99
-Paragraph 1A
-Subparagraph (SX 210.13-01(a)(4)(i))
-Publisher FASB
-URI https://asc.fasb.org/1943274/2147480097/470-10-S99-1A
Reference 11: http://www.xbrl.org/2009/role/commonPracticeRef
-Topic 470
-SubTopic 10
-Name Accounting Standards Codification
-Section S99
-Paragraph 1A
-Subparagraph (SX 210.13-01(a)(4)(ii))
-Publisher FASB
-URI https://asc.fasb.org/1943274/2147480097/470-10-S99-1A
Reference 12: http://www.xbrl.org/2003/role/disclosureRef
-Topic 470
-SubTopic 10
-Name Accounting Standards Codification
-Section S99
-Paragraph 1A
-Subparagraph (SX 210.13-01(a)(4)(iii)(A))
-Publisher FASB
-URI https://asc.fasb.org/1943274/2147480097/470-10-S99-1A
Reference 13: http://www.xbrl.org/2003/role/disclosureRef
-Topic 470
-SubTopic 10
-Name Accounting Standards Codification
-Section S99
-Paragraph 1A
-Subparagraph (SX 210.13-01(a)(4)(iv))
-Publisher FASB
-URI https://asc.fasb.org/1943274/2147480097/470-10-S99-1A
Reference 14: http://www.xbrl.org/2003/role/disclosureRef
-Topic 470
-SubTopic 10
-Name Accounting Standards Codification
-Section S99
-Paragraph 1A
-Subparagraph (SX 210.13-01(a)(5))
-Publisher FASB
-URI https://asc.fasb.org/1943274/2147480097/470-10-S99-1A
Reference 15: http://www.xbrl.org/2003/role/disclosureRef
-Topic 470
-SubTopic 10
-Name Accounting Standards Codification
-Section S99
-Paragraph 1B
-Subparagraph (SX 210.13-02(a)(4)(i))
-Publisher FASB
-URI https://asc.fasb.org/1943274/2147480097/470-10-S99-1B
Reference 16: http://www.xbrl.org/2003/role/disclosureRef
-Topic 470
-SubTopic 10
-Name Accounting Standards Codification
-Section S99
-Paragraph 1B
-Subparagraph (SX 210.13-02(a)(4)(iii)(A))
-Publisher FASB
-URI https://asc.fasb.org/1943274/2147480097/470-10-S99-1B
Reference 17: http://www.xbrl.org/2003/role/disclosureRef
-Topic 470
-SubTopic 10
-Name Accounting Standards Codification
-Section S99
-Paragraph 1B
-Subparagraph (SX 210.13-02(a)(4)(iii)(B))
-Publisher FASB
-URI https://asc.fasb.org/1943274/2147480097/470-10-S99-1B
Reference 18: http://www.xbrl.org/2003/role/disclosureRef
-Topic 470
-SubTopic 10
-Name Accounting Standards Codification
-Section S99
-Paragraph 1B
-Subparagraph (SX 210.13-02(a)(4)(iv))
-Publisher FASB
-URI https://asc.fasb.org/1943274/2147480097/470-10-S99-1B
Reference 19: http://www.xbrl.org/2003/role/disclosureRef
-Topic 470
-SubTopic 10
-Name Accounting Standards Codification
-Section S99
-Paragraph 1B
-Subparagraph (SX 210.13-02(a)(5))
-Publisher FASB
-URI https://asc.fasb.org/1943274/2147480097/470-10-S99-1B
Reference 20: http://www.xbrl.org/2009/role/commonPracticeRef
-Topic 852
-SubTopic 10
-Name Accounting Standards Codification
-Section 50
-Paragraph 7
-Subparagraph (a)
-Publisher FASB
-URI https://asc.fasb.org/1943274/2147481404/852-10-50-7
Reference 21: http://www.xbrl.org/2009/role/commonPracticeRef
-Topic 852
-SubTopic 10
-Name Accounting Standards Codification
-Section 50
-Paragraph 7
-Subparagraph (b)
-Publisher FASB
-URI https://asc.fasb.org/1943274/2147481404/852-10-50-7
| Name: |
us-gaap_LiabilitiesCurrent |
| Namespace Prefix: |
us-gaap_ |
| Data Type: |
xbrli:monetaryItemType |
| Balance Type: |
credit |
| Period Type: |
instant |
|
| X |
- References
+ Details
| Name: |
us-gaap_LiabilitiesCurrentAbstract |
| Namespace Prefix: |
us-gaap_ |
| Data Type: |
xbrli:stringItemType |
| Balance Type: |
na |
| Period Type: |
duration |
|
| X |
- DefinitionAmount of investment in marketable security, classified as current. Reference 1: http://www.xbrl.org/2009/role/commonPracticeRef
-Topic 210
-SubTopic 10
-Name Accounting Standards Codification
-Section S99
-Paragraph 1
-Subparagraph (SX 210.5-02(2))
-Publisher FASB
-URI https://asc.fasb.org/1943274/2147480566/210-10-S99-1
| Name: |
us-gaap_MarketableSecuritiesCurrent |
| Namespace Prefix: |
us-gaap_ |
| Data Type: |
xbrli:monetaryItemType |
| Balance Type: |
debit |
| Period Type: |
instant |
|
| X |
- DefinitionPresent value of lessee's discounted obligation for lease payments from operating lease, classified as noncurrent. Reference 1: http://www.xbrl.org/2003/role/disclosureRef
-Topic 842
-SubTopic 20
-Name Accounting Standards Codification
-Section 45
-Paragraph 1
-Subparagraph (b)
-Publisher FASB
-URI https://asc.fasb.org/1943274/2147479041/842-20-45-1
| Name: |
us-gaap_OperatingLeaseLiabilityNoncurrent |
| Namespace Prefix: |
us-gaap_ |
| Data Type: |
xbrli:monetaryItemType |
| Balance Type: |
credit |
| Period Type: |
instant |
|
| X |
- DefinitionAmount of current assets classified as other. Reference 1: http://www.xbrl.org/2003/role/exampleRef
-Topic 852
-SubTopic 10
-Name Accounting Standards Codification
-Section 55
-Paragraph 10
-Publisher FASB
-URI https://asc.fasb.org/1943274/2147481372/852-10-55-10
Reference 2: http://www.xbrl.org/2003/role/disclosureRef
-Topic 210
-SubTopic 10
-Name Accounting Standards Codification
-Section S99
-Paragraph 1
-Subparagraph (SX 210.5-02(8))
-Publisher FASB
-URI https://asc.fasb.org/1943274/2147480566/210-10-S99-1
| Name: |
us-gaap_OtherAssetsCurrent |
| Namespace Prefix: |
us-gaap_ |
| Data Type: |
xbrli:monetaryItemType |
| Balance Type: |
debit |
| Period Type: |
instant |
|
| X |
- DefinitionAmount of noncurrent assets classified as other. Reference 1: http://www.xbrl.org/2003/role/disclosureRef
-Topic 210
-SubTopic 10
-Name Accounting Standards Codification
-Section S99
-Paragraph 1
-Subparagraph (SX 210.5-02(17))
-Publisher FASB
-URI https://asc.fasb.org/1943274/2147480566/210-10-S99-1
| Name: |
us-gaap_OtherAssetsNoncurrent |
| Namespace Prefix: |
us-gaap_ |
| Data Type: |
xbrli:monetaryItemType |
| Balance Type: |
debit |
| Period Type: |
instant |
|
| X |
- DefinitionAmount of liabilities classified as other, due within one year or the normal operating cycle, if longer. Reference 1: http://fasb.org/us-gaap/role/ref/legacyRef
-Topic 210
-SubTopic 10
-Name Accounting Standards Codification
-Section S99
-Paragraph 1
-Subparagraph (SX 210.5-02(20))
-Publisher FASB
-URI https://asc.fasb.org/1943274/2147480566/210-10-S99-1
Reference 2: http://www.xbrl.org/2003/role/exampleRef
-Topic 852
-SubTopic 10
-Name Accounting Standards Codification
-Section 55
-Paragraph 10
-Publisher FASB
-URI https://asc.fasb.org/1943274/2147481372/852-10-55-10
| Name: |
us-gaap_OtherLiabilitiesCurrent |
| Namespace Prefix: |
us-gaap_ |
| Data Type: |
xbrli:monetaryItemType |
| Balance Type: |
credit |
| Period Type: |
instant |
|
| X |
- DefinitionAmount of liabilities classified as other, due after one year or the normal operating cycle, if longer. Reference 1: http://fasb.org/us-gaap/role/ref/legacyRef
-Topic 210
-SubTopic 10
-Name Accounting Standards Codification
-Section S99
-Paragraph 1
-Subparagraph (SX 210.5-02(24))
-Publisher FASB
-URI https://asc.fasb.org/1943274/2147480566/210-10-S99-1
| Name: |
us-gaap_OtherLiabilitiesNoncurrent |
| Namespace Prefix: |
us-gaap_ |
| Data Type: |
xbrli:monetaryItemType |
| Balance Type: |
credit |
| Period Type: |
instant |
|
| X |
- DefinitionAggregate par or stated value of issued nonredeemable preferred stock (or preferred stock redeemable solely at the option of the issuer). This item includes treasury stock repurchased by the entity. Note: elements for number of nonredeemable preferred shares, par value and other disclosure concepts are in another section within stockholders' equity. Reference 1: http://fasb.org/us-gaap/role/ref/legacyRef
-Topic 210
-SubTopic 10
-Name Accounting Standards Codification
-Section S99
-Paragraph 1
-Subparagraph (SX 210.5-02(28))
-Publisher FASB
-URI https://asc.fasb.org/1943274/2147480566/210-10-S99-1
Reference 2: http://www.xbrl.org/2003/role/exampleRef
-Topic 852
-SubTopic 10
-Name Accounting Standards Codification
-Section 55
-Paragraph 10
-Publisher FASB
-URI https://asc.fasb.org/1943274/2147481372/852-10-55-10
Reference 3: http://www.xbrl.org/2003/role/disclosureRef
-Topic 944
-SubTopic 210
-Name Accounting Standards Codification
-Section S99
-Paragraph 1
-Subparagraph (SX 210.7-03(a)(21))
-Publisher FASB
-URI https://asc.fasb.org/1943274/2147478777/944-210-S99-1
| Name: |
us-gaap_PreferredStockValue |
| Namespace Prefix: |
us-gaap_ |
| Data Type: |
xbrli:monetaryItemType |
| Balance Type: |
credit |
| Period Type: |
instant |
|
| X |
- DefinitionAmount of accumulated undistributed earnings (deficit). Reference 1: http://fasb.org/us-gaap/role/ref/legacyRef
-Topic 210
-SubTopic 10
-Name Accounting Standards Codification
-Section S99
-Paragraph 1
-Subparagraph (SX 210.5-02(30)(a)(3))
-Publisher FASB
-URI https://asc.fasb.org/1943274/2147480566/210-10-S99-1
Reference 2: http://www.xbrl.org/2003/role/exampleRef
-Topic 852
-SubTopic 10
-Name Accounting Standards Codification
-Section 55
-Paragraph 10
-Publisher FASB
-URI https://asc.fasb.org/1943274/2147481372/852-10-55-10
Reference 3: http://www.xbrl.org/2003/role/disclosureRef
-Topic 944
-SubTopic 40
-Name Accounting Standards Codification
-Section 65
-Paragraph 2
-Subparagraph (g)(2)(i)
-Publisher FASB
-URI https://asc.fasb.org/1943274/2147480016/944-40-65-2
Reference 4: http://www.xbrl.org/2003/role/disclosureRef
-Topic 944
-SubTopic 40
-Name Accounting Standards Codification
-Section 65
-Paragraph 2
-Subparagraph (h)(2)
-Publisher FASB
-URI https://asc.fasb.org/1943274/2147480016/944-40-65-2
Reference 5: http://www.xbrl.org/2003/role/disclosureRef
-Topic 946
-SubTopic 20
-Name Accounting Standards Codification
-Section 50
-Paragraph 11
-Publisher FASB
-URI https://asc.fasb.org/1943274/2147480990/946-20-50-11
Reference 6: http://www.xbrl.org/2003/role/disclosureRef
-Topic 944
-SubTopic 210
-Name Accounting Standards Codification
-Section S99
-Paragraph 1
-Subparagraph (SX 210.7-03(a)(23)(a)(4))
-Publisher FASB
-URI https://asc.fasb.org/1943274/2147478777/944-210-S99-1
Reference 7: http://www.xbrl.org/2003/role/disclosureRef
-Topic 946
-SubTopic 210
-Name Accounting Standards Codification
-Section S99
-Paragraph 1
-Subparagraph (SX 210.6-04(17))
-Publisher FASB
-URI https://asc.fasb.org/1943274/2147479170/946-210-S99-1
Reference 8: http://fasb.org/us-gaap/role/ref/legacyRef
-Topic 505
-SubTopic 10
-Name Accounting Standards Codification
-Section S99
-Paragraph 1
-Subparagraph (SX 210.3-04)
-Publisher FASB
-URI https://asc.fasb.org/1943274/2147480008/505-10-S99-1
| Name: |
us-gaap_RetainedEarningsAccumulatedDeficit |
| Namespace Prefix: |
us-gaap_ |
| Data Type: |
xbrli:monetaryItemType |
| Balance Type: |
credit |
| Period Type: |
instant |
|
| X |
- DefinitionAmount of equity (deficit) attributable to parent. Excludes temporary equity and equity attributable to noncontrolling interest. Reference 1: http://fasb.org/us-gaap/role/ref/legacyRef
-Topic 210
-SubTopic 10
-Name Accounting Standards Codification
-Section S99
-Paragraph 1
-Subparagraph (SX 210.5-02(29))
-Publisher FASB
-URI https://asc.fasb.org/1943274/2147480566/210-10-S99-1
Reference 2: http://fasb.org/us-gaap/role/ref/legacyRef
-Topic 210
-SubTopic 10
-Name Accounting Standards Codification
-Section S99
-Paragraph 1
-Subparagraph (SX 210.5-02(30))
-Publisher FASB
-URI https://asc.fasb.org/1943274/2147480566/210-10-S99-1
Reference 3: http://fasb.org/us-gaap/role/ref/legacyRef
-Topic 210
-SubTopic 10
-Name Accounting Standards Codification
-Section S99
-Paragraph 1
-Subparagraph (SX 210.5-02(31))
-Publisher FASB
-URI https://asc.fasb.org/1943274/2147480566/210-10-S99-1
Reference 4: http://www.xbrl.org/2003/role/exampleRef
-Topic 852
-SubTopic 10
-Name Accounting Standards Codification
-Section 55
-Paragraph 10
-Publisher FASB
-URI https://asc.fasb.org/1943274/2147481372/852-10-55-10
Reference 5: http://www.xbrl.org/2003/role/exampleRef
-Topic 946
-SubTopic 830
-Name Accounting Standards Codification
-Section 55
-Paragraph 12
-Publisher FASB
-URI https://asc.fasb.org/1943274/2147479168/946-830-55-12
Reference 6: http://www.xbrl.org/2003/role/disclosureRef
-Topic 946
-SubTopic 210
-Name Accounting Standards Codification
-Section S99
-Paragraph 1
-Subparagraph (SX 210.6-04(19))
-Publisher FASB
-URI https://asc.fasb.org/1943274/2147479170/946-210-S99-1
Reference 7: http://www.xbrl.org/2003/role/disclosureRef
-Topic 946
-SubTopic 210
-Name Accounting Standards Codification
-Section S99
-Paragraph 2
-Subparagraph (SX 210.6-05(4))
-Publisher FASB
-URI https://asc.fasb.org/1943274/2147479170/946-210-S99-2
Reference 8: http://www.xbrl.org/2009/role/commonPracticeRef
-Topic 946
-SubTopic 220
-Name Accounting Standards Codification
-Section S99
-Paragraph 3
-Subparagraph (SX 210.6-09(4)(b))
-Publisher FASB
-URI https://asc.fasb.org/1943274/2147479134/946-220-S99-3
Reference 9: http://www.xbrl.org/2003/role/disclosureRef
-Topic 946
-SubTopic 220
-Name Accounting Standards Codification
-Section S99
-Paragraph 3
-Subparagraph (SX 210.6-09(6))
-Publisher FASB
-URI https://asc.fasb.org/1943274/2147479134/946-220-S99-3
Reference 10: http://www.xbrl.org/2003/role/disclosureRef
-Topic 946
-SubTopic 220
-Name Accounting Standards Codification
-Section S99
-Paragraph 3
-Subparagraph (SX 210.6-09(7))
-Publisher FASB
-URI https://asc.fasb.org/1943274/2147479134/946-220-S99-3
Reference 11: http://www.xbrl.org/2009/role/commonPracticeRef
-Topic 235
-SubTopic 10
-Name Accounting Standards Codification
-Section S99
-Paragraph 1
-Subparagraph (SX 210.4-08(g)(1)(ii))
-Publisher FASB
-URI https://asc.fasb.org/1943274/2147480678/235-10-S99-1
Reference 12: http://www.xbrl.org/2009/role/commonPracticeRef
-Topic 323
-SubTopic 10
-Name Accounting Standards Codification
-Section 50
-Paragraph 3
-Subparagraph (c)
-Publisher FASB
-URI https://asc.fasb.org/1943274/2147481687/323-10-50-3
Reference 13: http://www.xbrl.org/2009/role/commonPracticeRef
-Topic 825
-SubTopic 10
-Name Accounting Standards Codification
-Section 50
-Paragraph 28
-Subparagraph (f)
-Publisher FASB
-URI https://asc.fasb.org/1943274/2147482907/825-10-50-28
Reference 14: http://fasb.org/us-gaap/role/ref/legacyRef
-Topic 310
-SubTopic 10
-Name Accounting Standards Codification
-Section S99
-Paragraph 2
-Subparagraph (SAB Topic 4.E)
-Publisher FASB
-URI https://asc.fasb.org/1943274/2147480418/310-10-S99-2
| Name: |
us-gaap_StockholdersEquity |
| Namespace Prefix: |
us-gaap_ |
| Data Type: |
xbrli:monetaryItemType |
| Balance Type: |
credit |
| Period Type: |
instant |
|
| X |
- References
+ Details
| Name: |
us-gaap_StockholdersEquityAbstract |
| Namespace Prefix: |
us-gaap_ |
| Data Type: |
xbrli:stringItemType |
| Balance Type: |
na |
| Period Type: |
duration |
|
| X |
- DefinitionAmount received for services rendered and products shipped, but not yet billed, for non-contractual agreements due within one year or the normal operating cycle, if longer.
| Name: |
us-gaap_UnbilledReceivablesCurrent |
| Namespace Prefix: |
us-gaap_ |
| Data Type: |
xbrli:monetaryItemType |
| Balance Type: |
debit |
| Period Type: |
instant |
|
v3.24.2
UNAUDITED CONDENSED CONSOLIDATED BALANCE SHEETS (Parenthetical) - shares
shares in Thousands |
Jun. 30, 2024 |
Dec. 31, 2023 |
| Stockholders’ equity: |
|
|
| Preferred stock, shares authorized (in shares) |
1,000
|
1,000
|
| Preferred stock, shares issued (in shares) |
0
|
0
|
| Common stock, shares authorized (in shares) |
200,000
|
200,000
|
| Common stock, shares issued (in shares) |
85,369
|
83,840
|
| Common stock, shares outstanding (in shares) |
85,369
|
83,840
|
| X |
- DefinitionThe maximum number of common shares permitted to be issued by an entity's charter and bylaws. Reference 1: http://fasb.org/us-gaap/role/ref/legacyRef
-Topic 210
-SubTopic 10
-Name Accounting Standards Codification
-Section S99
-Paragraph 1
-Subparagraph (SX 210.5-02(29))
-Publisher FASB
-URI https://asc.fasb.org/1943274/2147480566/210-10-S99-1
Reference 2: http://www.xbrl.org/2003/role/disclosureRef
-Topic 946
-SubTopic 210
-Name Accounting Standards Codification
-Section S99
-Paragraph 1
-Subparagraph (SX 210.6-04(16)(a))
-Publisher FASB
-URI https://asc.fasb.org/1943274/2147479170/946-210-S99-1
| Name: |
us-gaap_CommonStockSharesAuthorized |
| Namespace Prefix: |
us-gaap_ |
| Data Type: |
xbrli:sharesItemType |
| Balance Type: |
na |
| Period Type: |
instant |
|
| X |
- DefinitionTotal number of common shares of an entity that have been sold or granted to shareholders (includes common shares that were issued, repurchased and remain in the treasury). These shares represent capital invested by the firm's shareholders and owners, and may be all or only a portion of the number of shares authorized. Shares issued include shares outstanding and shares held in the treasury. Reference 1: http://fasb.org/us-gaap/role/ref/legacyRef
-Topic 210
-SubTopic 10
-Name Accounting Standards Codification
-Section S99
-Paragraph 1
-Subparagraph (SX 210.5-02(29))
-Publisher FASB
-URI https://asc.fasb.org/1943274/2147480566/210-10-S99-1
| Name: |
us-gaap_CommonStockSharesIssued |
| Namespace Prefix: |
us-gaap_ |
| Data Type: |
xbrli:sharesItemType |
| Balance Type: |
na |
| Period Type: |
instant |
|
| X |
- DefinitionNumber of shares of common stock outstanding. Common stock represent the ownership interest in a corporation. Reference 1: http://fasb.org/us-gaap/role/ref/legacyRef
-Name Accounting Standards Codification
-Section 50
-Paragraph 2
-SubTopic 10
-Topic 505
-Publisher FASB
-URI https://asc.fasb.org/1943274/2147481112/505-10-50-2
Reference 2: http://fasb.org/us-gaap/role/ref/legacyRef
-Topic 210
-SubTopic 10
-Name Accounting Standards Codification
-Section S99
-Paragraph 1
-Subparagraph (SX 210.5-02(29))
-Publisher FASB
-URI https://asc.fasb.org/1943274/2147480566/210-10-S99-1
Reference 3: http://www.xbrl.org/2003/role/disclosureRef
-Topic 946
-SubTopic 210
-Name Accounting Standards Codification
-Section S99
-Paragraph 2
-Subparagraph (SX 210.6-05(4))
-Publisher FASB
-URI https://asc.fasb.org/1943274/2147479170/946-210-S99-2
Reference 4: http://www.xbrl.org/2009/role/commonPracticeRef
-Topic 946
-SubTopic 220
-Name Accounting Standards Codification
-Section S99
-Paragraph 3
-Subparagraph (SX 210.6-09(4)(b))
-Publisher FASB
-URI https://asc.fasb.org/1943274/2147479134/946-220-S99-3
Reference 5: http://www.xbrl.org/2003/role/disclosureRef
-Topic 946
-SubTopic 210
-Name Accounting Standards Codification
-Section S99
-Paragraph 1
-Subparagraph (SX 210.6-04(16)(a))
-Publisher FASB
-URI https://asc.fasb.org/1943274/2147479170/946-210-S99-1
Reference 6: http://www.xbrl.org/2009/role/commonPracticeRef
-Topic 946
-SubTopic 220
-Name Accounting Standards Codification
-Section S99
-Paragraph 3
-Subparagraph (SX 210.6-09(7))
-Publisher FASB
-URI https://asc.fasb.org/1943274/2147479134/946-220-S99-3
| Name: |
us-gaap_CommonStockSharesOutstanding |
| Namespace Prefix: |
us-gaap_ |
| Data Type: |
xbrli:sharesItemType |
| Balance Type: |
na |
| Period Type: |
instant |
|
| X |
- DefinitionThe maximum number of nonredeemable preferred shares (or preferred stock redeemable solely at the option of the issuer) permitted to be issued by an entity's charter and bylaws. Reference 1: http://fasb.org/us-gaap/role/ref/legacyRef
-Topic 210
-SubTopic 10
-Name Accounting Standards Codification
-Section S99
-Paragraph 1
-Subparagraph (SX 210.5-02(28))
-Publisher FASB
-URI https://asc.fasb.org/1943274/2147480566/210-10-S99-1
Reference 2: http://www.xbrl.org/2003/role/disclosureRef
-Topic 946
-SubTopic 210
-Name Accounting Standards Codification
-Section S99
-Paragraph 1
-Subparagraph (SX 210.6-04(16)(a))
-Publisher FASB
-URI https://asc.fasb.org/1943274/2147479170/946-210-S99-1
| Name: |
us-gaap_PreferredStockSharesAuthorized |
| Namespace Prefix: |
us-gaap_ |
| Data Type: |
xbrli:sharesItemType |
| Balance Type: |
na |
| Period Type: |
instant |
|
| X |
- DefinitionNumber of shares issued for nonredeemable preferred shares and preferred shares redeemable solely at option of issuer. Includes, but is not limited to, preferred shares issued, repurchased, and held as treasury shares. Excludes preferred shares classified as debt. Reference 1: http://fasb.org/us-gaap/role/ref/legacyRef
-Topic 210
-SubTopic 10
-Name Accounting Standards Codification
-Section S99
-Paragraph 1
-Subparagraph (SX 210.5-02(28))
-Publisher FASB
-URI https://asc.fasb.org/1943274/2147480566/210-10-S99-1
Reference 2: http://www.xbrl.org/2003/role/disclosureRef
-Topic 505
-SubTopic 10
-Name Accounting Standards Codification
-Section 50
-Paragraph 13
-Subparagraph (a)
-Publisher FASB
-URI https://asc.fasb.org/1943274/2147481112/505-10-50-13
| Name: |
us-gaap_PreferredStockSharesIssued |
| Namespace Prefix: |
us-gaap_ |
| Data Type: |
xbrli:sharesItemType |
| Balance Type: |
na |
| Period Type: |
instant |
|
| X |
- References
+ Details
| Name: |
us-gaap_StockholdersEquityAbstract |
| Namespace Prefix: |
us-gaap_ |
| Data Type: |
xbrli:stringItemType |
| Balance Type: |
na |
| Period Type: |
duration |
|
v3.24.2
UNAUDITED CONDENSED CONSOLIDATED STATEMENTS OF OPERATIONS - USD ($)
shares in Thousands, $ in Thousands |
3 Months Ended |
6 Months Ended |
Jun. 30, 2024 |
Jun. 30, 2023 |
Jun. 30, 2024 |
Jun. 30, 2023 |
| Revenue |
|
|
|
|
| Total revenue |
$ 351,153
|
$ 298,268
|
$ 681,300
|
$ 623,740
|
| Cost of revenue |
|
|
|
|
| Total cost of revenue |
96,946
|
96,140
|
191,604
|
194,074
|
| Gross profit |
254,207
|
202,128
|
489,696
|
429,666
|
| Operating expenses |
|
|
|
|
| Selling and marketing |
139,761
|
143,858
|
267,456
|
293,655
|
| Research and development |
75,425
|
73,931
|
147,538
|
149,307
|
| General and administrative |
25,420
|
23,462
|
48,947
|
46,572
|
| Litigation settlement, net of recoveries |
0
|
0
|
32,403
|
0
|
| Restructuring |
635
|
2,167
|
798
|
3,628
|
| Total operating expenses |
241,241
|
243,418
|
497,142
|
493,162
|
| Income (loss) from operations |
12,966
|
(41,290)
|
(7,446)
|
(63,496)
|
| Foreign currency transaction gain (loss) |
437
|
(3,290)
|
(2,825)
|
(5,965)
|
| Interest income |
6,785
|
1,814
|
12,066
|
3,299
|
| Interest expense |
(1,656)
|
(1,778)
|
(3,408)
|
(3,696)
|
| (Loss) income on capped call transactions |
(3,277)
|
(1,361)
|
22
|
1,845
|
| Other income, net |
0
|
5,702
|
1,684
|
12,285
|
| Income (loss) before provision for income taxes |
15,255
|
(40,203)
|
93
|
(55,728)
|
| Provision for income taxes |
8,642
|
6,601
|
5,604
|
11,850
|
| Net income (loss) |
$ 6,613
|
$ (46,804)
|
$ (5,511)
|
$ (67,578)
|
| Earnings (loss) per share |
|
|
|
|
| Basic (in dollars per share) |
$ 0.08
|
$ (0.56)
|
$ (0.07)
|
$ (0.82)
|
| Diluted (in dollars per share) |
$ 0.07
|
$ (0.56)
|
$ (0.07)
|
$ (0.82)
|
| Weighted-average number of common shares outstanding |
|
|
|
|
| Basic (in shares) |
85,157
|
83,039
|
84,712
|
82,823
|
| Diluted (in shares) |
88,500
|
83,039
|
84,712
|
82,823
|
| Subscription services |
|
|
|
|
| Revenue |
|
|
|
|
| Total revenue |
$ 214,430
|
$ 197,105
|
$ 426,333
|
$ 384,614
|
| Cost of revenue |
|
|
|
|
| Total cost of revenue |
36,238
|
36,783
|
72,062
|
73,647
|
| Subscription license |
|
|
|
|
| Revenue |
|
|
|
|
| Total revenue |
84,647
|
41,197
|
147,985
|
125,724
|
| Cost of revenue |
|
|
|
|
| Total cost of revenue |
477
|
623
|
1,120
|
1,342
|
| Consulting |
|
|
|
|
| Revenue |
|
|
|
|
| Total revenue |
52,040
|
58,387
|
106,087
|
111,420
|
| Cost of revenue |
|
|
|
|
| Total cost of revenue |
60,231
|
58,710
|
118,413
|
119,058
|
| Perpetual license |
|
|
|
|
| Revenue |
|
|
|
|
| Total revenue |
36
|
1,579
|
895
|
1,982
|
| Cost of revenue |
|
|
|
|
| Total cost of revenue |
$ 0
|
$ 24
|
$ 9
|
$ 27
|
| X |
- DefinitionThe aggregate costs related to goods produced and sold and services rendered by an entity during the reporting period. This excludes costs incurred during the reporting period related to financial services rendered and other revenue generating activities. Reference 1: http://fasb.org/us-gaap/role/ref/legacyRef
-Topic 220
-SubTopic 10
-Name Accounting Standards Codification
-Section S99
-Paragraph 2
-Subparagraph (SX 210.5-03(2)(d))
-Publisher FASB
-URI https://asc.fasb.org/1943274/2147483621/220-10-S99-2
Reference 2: http://fasb.org/us-gaap/role/ref/legacyRef
-Topic 220
-SubTopic 10
-Name Accounting Standards Codification
-Section S99
-Paragraph 2
-Subparagraph (SX 210.5-03(2)(a))
-Publisher FASB
-URI https://asc.fasb.org/1943274/2147483621/220-10-S99-2
Reference 3: http://www.xbrl.org/2003/role/disclosureRef
-Topic 924
-SubTopic 10
-Name Accounting Standards Codification
-Section S99
-Paragraph 1
-Subparagraph (SAB Topic 11.L)
-Publisher FASB
-URI https://asc.fasb.org/1943274/2147479941/924-10-S99-1
| Name: |
us-gaap_CostOfGoodsAndServicesSold |
| Namespace Prefix: |
us-gaap_ |
| Data Type: |
xbrli:monetaryItemType |
| Balance Type: |
debit |
| Period Type: |
duration |
|
| X |
- References
+ Details
| Name: |
us-gaap_CostOfRevenueAbstract |
| Namespace Prefix: |
us-gaap_ |
| Data Type: |
xbrli:stringItemType |
| Balance Type: |
na |
| Period Type: |
duration |
|
| X |
- References
+ Details
| Name: |
us-gaap_EarningsPerShareAbstract |
| Namespace Prefix: |
us-gaap_ |
| Data Type: |
xbrli:stringItemType |
| Balance Type: |
na |
| Period Type: |
duration |
|
| X |
- DefinitionThe amount of net income (loss) for the period per each share of common stock or unit outstanding during the reporting period. Reference 1: http://www.xbrl.org/2003/role/disclosureRef
-Topic 250
-SubTopic 10
-Name Accounting Standards Codification
-Section 50
-Paragraph 6
-Publisher FASB
-URI https://asc.fasb.org/1943274/2147483443/250-10-50-6
Reference 2: http://www.xbrl.org/2003/role/exampleRef
-Topic 260
-SubTopic 10
-Name Accounting Standards Codification
-Section 55
-Paragraph 52
-Publisher FASB
-URI https://asc.fasb.org/1943274/2147482635/260-10-55-52
Reference 3: http://www.xbrl.org/2003/role/disclosureRef
-Topic 805
-SubTopic 60
-Name Accounting Standards Codification
-Section 65
-Paragraph 1
-Subparagraph (g)
-Publisher FASB
-URI https://asc.fasb.org/1943274/2147476176/805-60-65-1
Reference 4: http://www.xbrl.org/2003/role/disclosureRef
-Topic 740
-SubTopic 323
-Name Accounting Standards Codification
-Section 65
-Paragraph 2
-Subparagraph (g)(3)
-Publisher FASB
-URI https://asc.fasb.org/1943274/2147478666/740-323-65-2
Reference 5: http://www.xbrl.org/2003/role/disclosureRef
-Topic 250
-SubTopic 10
-Name Accounting Standards Codification
-Section 50
-Paragraph 3
-Publisher FASB
-URI https://asc.fasb.org/1943274/2147483443/250-10-50-3
Reference 6: http://www.xbrl.org/2003/role/disclosureRef
-Topic 260
-SubTopic 10
-Name Accounting Standards Codification
-Section 55
-Paragraph 15
-Publisher FASB
-URI https://asc.fasb.org/1943274/2147482635/260-10-55-15
Reference 7: http://www.xbrl.org/2003/role/disclosureRef
-Topic 815
-SubTopic 40
-Name Accounting Standards Codification
-Section 65
-Paragraph 1
-Subparagraph (e)(4)
-Publisher FASB
-URI https://asc.fasb.org/1943274/2147480175/815-40-65-1
Reference 8: http://www.xbrl.org/2003/role/disclosureRef
-Topic 815
-SubTopic 40
-Name Accounting Standards Codification
-Section 65
-Paragraph 1
-Subparagraph (f)
-Publisher FASB
-URI https://asc.fasb.org/1943274/2147480175/815-40-65-1
Reference 9: http://www.xbrl.org/2003/role/disclosureRef
-Topic 250
-SubTopic 10
-Name Accounting Standards Codification
-Section 50
-Paragraph 11
-Subparagraph (a)
-Publisher FASB
-URI https://asc.fasb.org/1943274/2147483443/250-10-50-11
Reference 10: http://www.xbrl.org/2003/role/disclosureRef
-Topic 250
-SubTopic 10
-Name Accounting Standards Codification
-Section 50
-Paragraph 11
-Subparagraph (b)
-Publisher FASB
-URI https://asc.fasb.org/1943274/2147483443/250-10-50-11
Reference 11: http://www.xbrl.org/2003/role/disclosureRef
-Topic 250
-SubTopic 10
-Name Accounting Standards Codification
-Section 50
-Paragraph 7
-Subparagraph (a)
-Publisher FASB
-URI https://asc.fasb.org/1943274/2147483443/250-10-50-7
Reference 12: http://www.xbrl.org/2003/role/disclosureRef
-Topic 260
-SubTopic 10
-Name Accounting Standards Codification
-Section 45
-Paragraph 2
-Publisher FASB
-URI https://asc.fasb.org/1943274/2147482689/260-10-45-2
Reference 13: http://www.xbrl.org/2003/role/disclosureRef
-Topic 260
-SubTopic 10
-Name Accounting Standards Codification
-Section 45
-Paragraph 60B
-Subparagraph (d)
-Publisher FASB
-URI https://asc.fasb.org/1943274/2147482689/260-10-45-60B
Reference 14: http://www.xbrl.org/2003/role/disclosureRef
-Topic 250
-SubTopic 10
-Name Accounting Standards Codification
-Section 50
-Paragraph 4
-Publisher FASB
-URI https://asc.fasb.org/1943274/2147483443/250-10-50-4
Reference 15: http://www.xbrl.org/2003/role/disclosureRef
-Topic 260
-SubTopic 10
-Name Accounting Standards Codification
-Section 50
-Paragraph 1
-Subparagraph (a)
-Publisher FASB
-URI https://asc.fasb.org/1943274/2147482662/260-10-50-1
Reference 16: http://www.xbrl.org/2003/role/disclosureRef
-Topic 260
-SubTopic 10
-Name Accounting Standards Codification
-Section 45
-Paragraph 10
-Publisher FASB
-URI https://asc.fasb.org/1943274/2147482689/260-10-45-10
Reference 17: http://www.xbrl.org/2003/role/disclosureRef
-Topic 220
-SubTopic 10
-Name Accounting Standards Codification
-Section S99
-Paragraph 2
-Subparagraph (SX 210.5-03(25))
-Publisher FASB
-URI https://asc.fasb.org/1943274/2147483621/220-10-S99-2
Reference 18: http://www.xbrl.org/2003/role/disclosureRef
-Topic 942
-SubTopic 220
-Name Accounting Standards Codification
-Section S99
-Paragraph 1
-Subparagraph (SX 210.9-04(27))
-Publisher FASB
-URI https://asc.fasb.org/1943274/2147478524/942-220-S99-1
Reference 19: http://www.xbrl.org/2003/role/disclosureRef
-Topic 944
-SubTopic 220
-Name Accounting Standards Codification
-Section S99
-Paragraph 1
-Subparagraph (SX 210.7-04(23))
-Publisher FASB
-URI https://asc.fasb.org/1943274/2147477250/944-220-S99-1
Reference 20: http://www.xbrl.org/2003/role/disclosureRef
-Topic 260
-SubTopic 10
-Name Accounting Standards Codification
-Section 45
-Paragraph 7
-Publisher FASB
-URI https://asc.fasb.org/1943274/2147482689/260-10-45-7
| Name: |
us-gaap_EarningsPerShareBasic |
| Namespace Prefix: |
us-gaap_ |
| Data Type: |
dtr-types:perShareItemType |
| Balance Type: |
na |
| Period Type: |
duration |
|
| X |
- References
+ Details
| Name: |
us-gaap_EarningsPerShareBasicOtherDisclosuresAbstract |
| Namespace Prefix: |
us-gaap_ |
| Data Type: |
xbrli:stringItemType |
| Balance Type: |
na |
| Period Type: |
duration |
|
| X |
- DefinitionThe amount of net income (loss) for the period available to each share of common stock or common unit outstanding during the reporting period and to each share or unit that would have been outstanding assuming the issuance of common shares or units for all dilutive potential common shares or units outstanding during the reporting period. Reference 1: http://www.xbrl.org/2003/role/disclosureRef
-Topic 250
-SubTopic 10
-Name Accounting Standards Codification
-Section 50
-Paragraph 6
-Publisher FASB
-URI https://asc.fasb.org/1943274/2147483443/250-10-50-6
Reference 2: http://www.xbrl.org/2003/role/exampleRef
-Topic 260
-SubTopic 10
-Name Accounting Standards Codification
-Section 55
-Paragraph 52
-Publisher FASB
-URI https://asc.fasb.org/1943274/2147482635/260-10-55-52
Reference 3: http://www.xbrl.org/2003/role/disclosureRef
-Topic 805
-SubTopic 60
-Name Accounting Standards Codification
-Section 65
-Paragraph 1
-Subparagraph (g)
-Publisher FASB
-URI https://asc.fasb.org/1943274/2147476176/805-60-65-1
Reference 4: http://www.xbrl.org/2003/role/disclosureRef
-Topic 740
-SubTopic 323
-Name Accounting Standards Codification
-Section 65
-Paragraph 2
-Subparagraph (g)(3)
-Publisher FASB
-URI https://asc.fasb.org/1943274/2147478666/740-323-65-2
Reference 5: http://www.xbrl.org/2003/role/disclosureRef
-Topic 250
-SubTopic 10
-Name Accounting Standards Codification
-Section 50
-Paragraph 3
-Publisher FASB
-URI https://asc.fasb.org/1943274/2147483443/250-10-50-3
Reference 6: http://www.xbrl.org/2003/role/disclosureRef
-Topic 260
-SubTopic 10
-Name Accounting Standards Codification
-Section 55
-Paragraph 15
-Publisher FASB
-URI https://asc.fasb.org/1943274/2147482635/260-10-55-15
Reference 7: http://www.xbrl.org/2003/role/disclosureRef
-Topic 815
-SubTopic 40
-Name Accounting Standards Codification
-Section 65
-Paragraph 1
-Subparagraph (e)(4)
-Publisher FASB
-URI https://asc.fasb.org/1943274/2147480175/815-40-65-1
Reference 8: http://www.xbrl.org/2003/role/disclosureRef
-Topic 815
-SubTopic 40
-Name Accounting Standards Codification
-Section 65
-Paragraph 1
-Subparagraph (f)
-Publisher FASB
-URI https://asc.fasb.org/1943274/2147480175/815-40-65-1
Reference 9: http://www.xbrl.org/2003/role/disclosureRef
-Topic 250
-SubTopic 10
-Name Accounting Standards Codification
-Section 50
-Paragraph 11
-Subparagraph (a)
-Publisher FASB
-URI https://asc.fasb.org/1943274/2147483443/250-10-50-11
Reference 10: http://www.xbrl.org/2003/role/disclosureRef
-Topic 250
-SubTopic 10
-Name Accounting Standards Codification
-Section 50
-Paragraph 11
-Subparagraph (b)
-Publisher FASB
-URI https://asc.fasb.org/1943274/2147483443/250-10-50-11
Reference 11: http://www.xbrl.org/2003/role/disclosureRef
-Topic 250
-SubTopic 10
-Name Accounting Standards Codification
-Section 50
-Paragraph 7
-Subparagraph (a)
-Publisher FASB
-URI https://asc.fasb.org/1943274/2147483443/250-10-50-7
Reference 12: http://www.xbrl.org/2003/role/disclosureRef
-Topic 260
-SubTopic 10
-Name Accounting Standards Codification
-Section 45
-Paragraph 2
-Publisher FASB
-URI https://asc.fasb.org/1943274/2147482689/260-10-45-2
Reference 13: http://www.xbrl.org/2003/role/disclosureRef
-Topic 260
-SubTopic 10
-Name Accounting Standards Codification
-Section 45
-Paragraph 60B
-Subparagraph (d)
-Publisher FASB
-URI https://asc.fasb.org/1943274/2147482689/260-10-45-60B
Reference 14: http://www.xbrl.org/2003/role/disclosureRef
-Topic 250
-SubTopic 10
-Name Accounting Standards Codification
-Section 50
-Paragraph 4
-Publisher FASB
-URI https://asc.fasb.org/1943274/2147483443/250-10-50-4
Reference 15: http://www.xbrl.org/2003/role/disclosureRef
-Topic 260
-SubTopic 10
-Name Accounting Standards Codification
-Section 50
-Paragraph 1
-Subparagraph (a)
-Publisher FASB
-URI https://asc.fasb.org/1943274/2147482662/260-10-50-1
Reference 16: http://www.xbrl.org/2003/role/disclosureRef
-Topic 220
-SubTopic 10
-Name Accounting Standards Codification
-Section S99
-Paragraph 2
-Subparagraph (SX 210.5-03(25))
-Publisher FASB
-URI https://asc.fasb.org/1943274/2147483621/220-10-S99-2
Reference 17: http://www.xbrl.org/2003/role/disclosureRef
-Topic 942
-SubTopic 220
-Name Accounting Standards Codification
-Section S99
-Paragraph 1
-Subparagraph (SX 210.9-04(27))
-Publisher FASB
-URI https://asc.fasb.org/1943274/2147478524/942-220-S99-1
Reference 18: http://www.xbrl.org/2003/role/disclosureRef
-Topic 944
-SubTopic 220
-Name Accounting Standards Codification
-Section S99
-Paragraph 1
-Subparagraph (SX 210.7-04(23))
-Publisher FASB
-URI https://asc.fasb.org/1943274/2147477250/944-220-S99-1
Reference 19: http://www.xbrl.org/2003/role/disclosureRef
-Topic 260
-SubTopic 10
-Name Accounting Standards Codification
-Section 45
-Paragraph 7
-Publisher FASB
-URI https://asc.fasb.org/1943274/2147482689/260-10-45-7
| Name: |
us-gaap_EarningsPerShareDiluted |
| Namespace Prefix: |
us-gaap_ |
| Data Type: |
dtr-types:perShareItemType |
| Balance Type: |
na |
| Period Type: |
duration |
|
| X |
- DefinitionAmount, before tax, of realized and unrealized gain (loss) from foreign currency transaction. Reference 1: http://www.xbrl.org/2003/role/disclosureRef
-Topic 946
-SubTopic 220
-Name Accounting Standards Codification
-Section S99
-Paragraph 1
-Subparagraph (SX 210.6-07(7))
-Publisher FASB
-URI https://asc.fasb.org/1943274/2147479134/946-220-S99-1
Reference 2: http://www.xbrl.org/2003/role/disclosureRef
-Topic 830
-SubTopic 20
-Name Accounting Standards Codification
-Section 35
-Paragraph 1
-Publisher FASB
-URI https://asc.fasb.org/1943274/2147482014/830-20-35-1
Reference 3: http://www.xbrl.org/2003/role/disclosureRef
-Topic 830
-SubTopic 20
-Name Accounting Standards Codification
-Section 45
-Paragraph 1
-Publisher FASB
-URI https://asc.fasb.org/1943274/2147481956/830-20-45-1
Reference 4: http://www.xbrl.org/2003/role/disclosureRef
-Topic 830
-SubTopic 20
-Name Accounting Standards Codification
-Section 50
-Paragraph 1
-Publisher FASB
-URI https://asc.fasb.org/1943274/2147481926/830-20-50-1
Reference 5: http://www.xbrl.org/2003/role/disclosureRef
-Topic 830
-SubTopic 10
-Name Accounting Standards Codification
-Section 45
-Paragraph 17
-Publisher FASB
-URI https://asc.fasb.org/1943274/2147481839/830-10-45-17
| Name: |
us-gaap_ForeignCurrencyTransactionGainLossBeforeTax |
| Namespace Prefix: |
us-gaap_ |
| Data Type: |
xbrli:monetaryItemType |
| Balance Type: |
credit |
| Period Type: |
duration |
|
| X |
- DefinitionAggregate net gain (loss) on all derivative instruments recognized in earnings during the period, before tax effects. Reference 1: http://fasb.org/us-gaap/role/ref/legacyRef
-Name Accounting Standards Codification
-Topic 815
-SubTopic 10
-Section 50
-Paragraph 4A
-Subparagraph (b)
-Publisher FASB
-URI https://asc.fasb.org/1943274/2147480434/815-10-50-4A
| Name: |
us-gaap_GainLossOnDerivativeInstrumentsNetPretax |
| Namespace Prefix: |
us-gaap_ |
| Data Type: |
xbrli:monetaryItemType |
| Balance Type: |
credit |
| Period Type: |
duration |
|
| X |
- DefinitionThe aggregate total of expenses of managing and administering the affairs of an entity, including affiliates of the reporting entity, which are not directly or indirectly associated with the manufacture, sale or creation of a product or product line. Reference 1: http://fasb.org/us-gaap/role/ref/legacyRef
-Topic 220
-SubTopic 10
-Name Accounting Standards Codification
-Section S99
-Paragraph 2
-Subparagraph (SX 210.5-03(4))
-Publisher FASB
-URI https://asc.fasb.org/1943274/2147483621/220-10-S99-2
Reference 2: http://www.xbrl.org/2003/role/disclosureRef
-Topic 946
-SubTopic 220
-Name Accounting Standards Codification
-Section S99
-Paragraph 1
-Subparagraph (SX 210.6-07(2)(a))
-Publisher FASB
-URI https://asc.fasb.org/1943274/2147479134/946-220-S99-1
| Name: |
us-gaap_GeneralAndAdministrativeExpense |
| Namespace Prefix: |
us-gaap_ |
| Data Type: |
xbrli:monetaryItemType |
| Balance Type: |
debit |
| Period Type: |
duration |
|
| X |
- DefinitionAggregate revenue less cost of goods and services sold or operating expenses directly attributable to the revenue generation activity. Reference 1: http://www.xbrl.org/2009/role/commonPracticeRef
-Topic 280
-SubTopic 10
-Name Accounting Standards Codification
-Section 50
-Paragraph 22
-Publisher FASB
-URI https://asc.fasb.org/1943274/2147482810/280-10-50-22
Reference 2: http://www.xbrl.org/2003/role/exampleRef
-Topic 280
-SubTopic 10
-Name Accounting Standards Codification
-Section 55
-Paragraph 48
-Publisher FASB
-URI https://asc.fasb.org/1943274/2147482785/280-10-55-48
Reference 3: http://www.xbrl.org/2009/role/commonPracticeRef
-Topic 280
-SubTopic 10
-Name Accounting Standards Codification
-Section 50
-Paragraph 32
-Subparagraph (f)
-Publisher FASB
-URI https://asc.fasb.org/1943274/2147482810/280-10-50-32
Reference 4: http://www.xbrl.org/2009/role/commonPracticeRef
-Topic 280
-SubTopic 10
-Name Accounting Standards Codification
-Section 50
-Paragraph 30
-Subparagraph (b)
-Publisher FASB
-URI https://asc.fasb.org/1943274/2147482810/280-10-50-30
Reference 5: http://www.xbrl.org/2009/role/commonPracticeRef
-Topic 270
-SubTopic 10
-Name Accounting Standards Codification
-Section 50
-Paragraph 1
-Subparagraph (i)
-Publisher FASB
-URI https://asc.fasb.org/1943274/2147482964/270-10-50-1
Reference 6: http://www.xbrl.org/2009/role/commonPracticeRef
-Topic 280
-SubTopic 10
-Name Accounting Standards Codification
-Section 50
-Paragraph 32
-Subparagraph (ee)
-Publisher FASB
-URI https://asc.fasb.org/1943274/2147482810/280-10-50-32
Reference 7: http://fasb.org/us-gaap/role/ref/otherTransitionRef
-Topic 280
-SubTopic 10
-Name Accounting Standards Codification
-Section 50
-Paragraph 32
-Subparagraph (c)
-Publisher FASB
-URI https://asc.fasb.org/1943274/2147482810/280-10-50-32
Reference 8: http://fasb.org/us-gaap/role/ref/legacyRef
-Topic 220
-SubTopic 10
-Name Accounting Standards Codification
-Section S99
-Paragraph 2
-Subparagraph (SX 210.5-03(2))
-Publisher FASB
-URI https://asc.fasb.org/1943274/2147483621/220-10-S99-2
Reference 9: http://fasb.org/us-gaap/role/ref/legacyRef
-Topic 220
-SubTopic 10
-Name Accounting Standards Codification
-Section S99
-Paragraph 2
-Subparagraph (SX 210.5-03(1))
-Publisher FASB
-URI https://asc.fasb.org/1943274/2147483621/220-10-S99-2
Reference 10: http://www.xbrl.org/2003/role/disclosureRef
-Topic 235
-SubTopic 10
-Name Accounting Standards Codification
-Section S99
-Paragraph 1
-Subparagraph (SX 210.4-08(g)(1)(ii))
-Publisher FASB
-URI https://asc.fasb.org/1943274/2147480678/235-10-S99-1
Reference 11: http://www.xbrl.org/2003/role/disclosureRef
-Topic 323
-SubTopic 10
-Name Accounting Standards Codification
-Section 50
-Paragraph 3
-Subparagraph (c)
-Publisher FASB
-URI https://asc.fasb.org/1943274/2147481687/323-10-50-3
Reference 12: http://www.xbrl.org/2003/role/disclosureRef
-Topic 825
-SubTopic 10
-Name Accounting Standards Codification
-Section 50
-Paragraph 28
-Subparagraph (f)
-Publisher FASB
-URI https://asc.fasb.org/1943274/2147482907/825-10-50-28
Reference 13: http://www.xbrl.org/2003/role/disclosureRef
-Topic 470
-SubTopic 10
-Name Accounting Standards Codification
-Section S99
-Paragraph 1A
-Subparagraph (SX 210.13-01(a)(4)(i))
-Publisher FASB
-URI https://asc.fasb.org/1943274/2147480097/470-10-S99-1A
Reference 14: http://www.xbrl.org/2009/role/commonPracticeRef
-Topic 470
-SubTopic 10
-Name Accounting Standards Codification
-Section S99
-Paragraph 1A
-Subparagraph (SX 210.13-01(a)(4)(ii))
-Publisher FASB
-URI https://asc.fasb.org/1943274/2147480097/470-10-S99-1A
Reference 15: http://www.xbrl.org/2003/role/disclosureRef
-Topic 470
-SubTopic 10
-Name Accounting Standards Codification
-Section S99
-Paragraph 1A
-Subparagraph (SX 210.13-01(a)(4)(iii)(A))
-Publisher FASB
-URI https://asc.fasb.org/1943274/2147480097/470-10-S99-1A
Reference 16: http://www.xbrl.org/2003/role/disclosureRef
-Topic 470
-SubTopic 10
-Name Accounting Standards Codification
-Section S99
-Paragraph 1A
-Subparagraph (SX 210.13-01(a)(4)(iv))
-Publisher FASB
-URI https://asc.fasb.org/1943274/2147480097/470-10-S99-1A
Reference 17: http://www.xbrl.org/2003/role/disclosureRef
-Topic 470
-SubTopic 10
-Name Accounting Standards Codification
-Section S99
-Paragraph 1A
-Subparagraph (SX 210.13-01(a)(5))
-Publisher FASB
-URI https://asc.fasb.org/1943274/2147480097/470-10-S99-1A
Reference 18: http://www.xbrl.org/2003/role/disclosureRef
-Topic 470
-SubTopic 10
-Name Accounting Standards Codification
-Section S99
-Paragraph 1B
-Subparagraph (SX 210.13-02(a)(4)(i))
-Publisher FASB
-URI https://asc.fasb.org/1943274/2147480097/470-10-S99-1B
Reference 19: http://www.xbrl.org/2003/role/disclosureRef
-Topic 470
-SubTopic 10
-Name Accounting Standards Codification
-Section S99
-Paragraph 1B
-Subparagraph (SX 210.13-02(a)(4)(iii)(A))
-Publisher FASB
-URI https://asc.fasb.org/1943274/2147480097/470-10-S99-1B
Reference 20: http://www.xbrl.org/2003/role/disclosureRef
-Topic 470
-SubTopic 10
-Name Accounting Standards Codification
-Section S99
-Paragraph 1B
-Subparagraph (SX 210.13-02(a)(4)(iii)(B))
-Publisher FASB
-URI https://asc.fasb.org/1943274/2147480097/470-10-S99-1B
Reference 21: http://www.xbrl.org/2003/role/disclosureRef
-Topic 470
-SubTopic 10
-Name Accounting Standards Codification
-Section S99
-Paragraph 1B
-Subparagraph (SX 210.13-02(a)(4)(iv))
-Publisher FASB
-URI https://asc.fasb.org/1943274/2147480097/470-10-S99-1B
Reference 22: http://www.xbrl.org/2003/role/disclosureRef
-Topic 470
-SubTopic 10
-Name Accounting Standards Codification
-Section S99
-Paragraph 1B
-Subparagraph (SX 210.13-02(a)(5))
-Publisher FASB
-URI https://asc.fasb.org/1943274/2147480097/470-10-S99-1B
Reference 23: http://www.xbrl.org/2003/role/exampleRef
-Topic 280
-SubTopic 10
-Name Accounting Standards Codification
-Section 50
-Paragraph 31
-Publisher FASB
-URI https://asc.fasb.org/1943274/2147482810/280-10-50-31
| Name: |
us-gaap_GrossProfit |
| Namespace Prefix: |
us-gaap_ |
| Data Type: |
xbrli:monetaryItemType |
| Balance Type: |
credit |
| Period Type: |
duration |
|
| X |
- DefinitionAmount of interest expense classified as nonoperating. Reference 1: http://www.xbrl.org/2003/role/disclosureRef
-Topic 280
-SubTopic 10
-Name Accounting Standards Codification
-Section 50
-Paragraph 22
-Subparagraph (d)
-Publisher FASB
-URI https://asc.fasb.org/1943274/2147482810/280-10-50-22
Reference 2: http://www.xbrl.org/2009/role/commonPracticeRef
-Topic 220
-SubTopic 10
-Name Accounting Standards Codification
-Section S99
-Paragraph 2
-Subparagraph (SX 210.5-03)
-Publisher FASB
-URI https://asc.fasb.org/1943274/2147483621/220-10-S99-2
| Name: |
us-gaap_InterestExpenseNonoperating |
| Namespace Prefix: |
us-gaap_ |
| Data Type: |
xbrli:monetaryItemType |
| Balance Type: |
debit |
| Period Type: |
duration |
|
| X |
- DefinitionAmount after accretion (amortization) of discount (premium), and investment expense, of interest income and dividend income on nonoperating securities. Reference 1: http://fasb.org/us-gaap/role/ref/legacyRef
-Topic 220
-SubTopic 10
-Name Accounting Standards Codification
-Section S99
-Paragraph 2
-Subparagraph (SX 210.5-03(8))
-Publisher FASB
-URI https://asc.fasb.org/1943274/2147483621/220-10-S99-2
Reference 2: http://fasb.org/us-gaap/role/ref/legacyRef
-Topic 220
-SubTopic 10
-Name Accounting Standards Codification
-Section S99
-Paragraph 2
-Subparagraph (SX 210.5-03(7)(a))
-Publisher FASB
-URI https://asc.fasb.org/1943274/2147483621/220-10-S99-2
Reference 3: http://fasb.org/us-gaap/role/ref/legacyRef
-Topic 220
-SubTopic 10
-Name Accounting Standards Codification
-Section S99
-Paragraph 2
-Subparagraph (SX 210.5-03(7)(b))
-Publisher FASB
-URI https://asc.fasb.org/1943274/2147483621/220-10-S99-2
| Name: |
us-gaap_InvestmentIncomeNet |
| Namespace Prefix: |
us-gaap_ |
| Data Type: |
xbrli:monetaryItemType |
| Balance Type: |
credit |
| Period Type: |
duration |
|
| X |
- DefinitionAmount of litigation expense, including but not limited to legal, forensic, accounting, and investigative fees. Reference 1: http://www.xbrl.org/2009/role/commonPracticeRef
-Name Accounting Standards Codification
-Section S99
-Paragraph 2
-Subparagraph (SX 210.5-03(6))
-SubTopic 10
-Topic 220
-Publisher FASB
-URI https://asc.fasb.org/1943274/2147483621/220-10-S99-2
| Name: |
us-gaap_LitigationSettlementExpense |
| Namespace Prefix: |
us-gaap_ |
| Data Type: |
xbrli:monetaryItemType |
| Balance Type: |
debit |
| Period Type: |
duration |
|
| X |
- DefinitionThe portion of profit or loss for the period, net of income taxes, which is attributable to the parent. Reference 1: http://www.xbrl.org/2003/role/disclosureRef
-Topic 250
-SubTopic 10
-Name Accounting Standards Codification
-Section 50
-Paragraph 6
-Publisher FASB
-URI https://asc.fasb.org/1943274/2147483443/250-10-50-6
Reference 2: http://www.xbrl.org/2003/role/disclosureRef
-Topic 250
-SubTopic 10
-Name Accounting Standards Codification
-Section 50
-Paragraph 9
-Publisher FASB
-URI https://asc.fasb.org/1943274/2147483443/250-10-50-9
Reference 3: http://www.xbrl.org/2003/role/disclosureRef
-Topic 805
-SubTopic 60
-Name Accounting Standards Codification
-Section 65
-Paragraph 1
-Subparagraph (g)
-Publisher FASB
-URI https://asc.fasb.org/1943274/2147476176/805-60-65-1
Reference 4: http://www.xbrl.org/2003/role/disclosureRef
-Topic 740
-SubTopic 323
-Name Accounting Standards Codification
-Section 65
-Paragraph 2
-Subparagraph (g)(3)
-Publisher FASB
-URI https://asc.fasb.org/1943274/2147478666/740-323-65-2
Reference 5: http://fasb.org/us-gaap/role/ref/legacyRef
-Topic 220
-SubTopic 10
-Name Accounting Standards Codification
-Section S99
-Paragraph 2
-Subparagraph (SX 210.5-03(20))
-Publisher FASB
-URI https://asc.fasb.org/1943274/2147483621/220-10-S99-2
Reference 6: http://www.xbrl.org/2003/role/disclosureRef
-Topic 235
-SubTopic 10
-Name Accounting Standards Codification
-Section S99
-Paragraph 1
-Subparagraph (SX 210.4-08(g)(1)(ii))
-Publisher FASB
-URI https://asc.fasb.org/1943274/2147480678/235-10-S99-1
Reference 7: http://www.xbrl.org/2003/role/disclosureRef
-Topic 323
-SubTopic 10
-Name Accounting Standards Codification
-Section 50
-Paragraph 3
-Subparagraph (c)
-Publisher FASB
-URI https://asc.fasb.org/1943274/2147481687/323-10-50-3
Reference 8: http://www.xbrl.org/2003/role/disclosureRef
-Topic 825
-SubTopic 10
-Name Accounting Standards Codification
-Section 50
-Paragraph 28
-Subparagraph (f)
-Publisher FASB
-URI https://asc.fasb.org/1943274/2147482907/825-10-50-28
Reference 9: http://www.xbrl.org/2003/role/disclosureRef
-Topic 220
-SubTopic 10
-Name Accounting Standards Codification
-Section 50
-Paragraph 6
-Publisher FASB
-URI https://asc.fasb.org/1943274/2147482765/220-10-50-6
Reference 10: http://www.xbrl.org/2003/role/disclosureRef
-Topic 250
-SubTopic 10
-Name Accounting Standards Codification
-Section 50
-Paragraph 3
-Publisher FASB
-URI https://asc.fasb.org/1943274/2147483443/250-10-50-3
Reference 11: http://www.xbrl.org/2003/role/disclosureRef
-Topic 250
-SubTopic 10
-Name Accounting Standards Codification
-Section 50
-Paragraph 1
-Subparagraph (b)(2)
-Publisher FASB
-URI https://asc.fasb.org/1943274/2147483443/250-10-50-1
Reference 12: http://www.xbrl.org/2003/role/disclosureRef
-Topic 815
-SubTopic 40
-Name Accounting Standards Codification
-Section 65
-Paragraph 1
-Subparagraph (f)
-Publisher FASB
-URI https://asc.fasb.org/1943274/2147480175/815-40-65-1
Reference 13: http://www.xbrl.org/2003/role/disclosureRef
-Topic 250
-SubTopic 10
-Name Accounting Standards Codification
-Section 50
-Paragraph 8
-Publisher FASB
-URI https://asc.fasb.org/1943274/2147483443/250-10-50-8
Reference 14: http://www.xbrl.org/2003/role/disclosureRef
-Topic 250
-SubTopic 10
-Name Accounting Standards Codification
-Section 50
-Paragraph 11
-Subparagraph (a)
-Publisher FASB
-URI https://asc.fasb.org/1943274/2147483443/250-10-50-11
Reference 15: http://www.xbrl.org/2003/role/disclosureRef
-Topic 250
-SubTopic 10
-Name Accounting Standards Codification
-Section 50
-Paragraph 11
-Subparagraph (b)
-Publisher FASB
-URI https://asc.fasb.org/1943274/2147483443/250-10-50-11
Reference 16: http://www.xbrl.org/2003/role/disclosureRef
-Topic 250
-SubTopic 10
-Name Accounting Standards Codification
-Section 50
-Paragraph 4
-Publisher FASB
-URI https://asc.fasb.org/1943274/2147483443/250-10-50-4
Reference 17: http://www.xbrl.org/2003/role/exampleRef
-Topic 946
-SubTopic 830
-Name Accounting Standards Codification
-Section 55
-Paragraph 10
-Publisher FASB
-URI https://asc.fasb.org/1943274/2147479168/946-830-55-10
Reference 18: http://www.xbrl.org/2003/role/disclosureRef
-Topic 946
-SubTopic 220
-Name Accounting Standards Codification
-Section 45
-Paragraph 7
-Publisher FASB
-URI https://asc.fasb.org/1943274/2147479105/946-220-45-7
Reference 19: http://www.xbrl.org/2003/role/disclosureRef
-Topic 944
-SubTopic 220
-Name Accounting Standards Codification
-Section S99
-Paragraph 1
-Subparagraph (SX 210.7-04(18))
-Publisher FASB
-URI https://asc.fasb.org/1943274/2147477250/944-220-S99-1
Reference 20: http://www.xbrl.org/2003/role/disclosureRef
-Topic 946
-SubTopic 220
-Name Accounting Standards Codification
-Section S99
-Paragraph 1
-Subparagraph (SX 210.6-07(9))
-Publisher FASB
-URI https://asc.fasb.org/1943274/2147479134/946-220-S99-1
Reference 21: http://www.xbrl.org/2003/role/disclosureRef
-Topic 946
-SubTopic 220
-Name Accounting Standards Codification
-Section S99
-Paragraph 3
-Subparagraph (SX 210.6-09(1)(d))
-Publisher FASB
-URI https://asc.fasb.org/1943274/2147479134/946-220-S99-3
Reference 22: http://www.xbrl.org/2003/role/disclosureRef
-Topic 470
-SubTopic 10
-Name Accounting Standards Codification
-Section S99
-Paragraph 1A
-Subparagraph (SX 210.13-01(a)(4)(i))
-Publisher FASB
-URI https://asc.fasb.org/1943274/2147480097/470-10-S99-1A
Reference 23: http://www.xbrl.org/2009/role/commonPracticeRef
-Topic 470
-SubTopic 10
-Name Accounting Standards Codification
-Section S99
-Paragraph 1A
-Subparagraph (SX 210.13-01(a)(4)(ii))
-Publisher FASB
-URI https://asc.fasb.org/1943274/2147480097/470-10-S99-1A
Reference 24: http://www.xbrl.org/2003/role/disclosureRef
-Topic 470
-SubTopic 10
-Name Accounting Standards Codification
-Section S99
-Paragraph 1A
-Subparagraph (SX 210.13-01(a)(4)(iii)(A))
-Publisher FASB
-URI https://asc.fasb.org/1943274/2147480097/470-10-S99-1A
Reference 25: http://www.xbrl.org/2003/role/disclosureRef
-Topic 470
-SubTopic 10
-Name Accounting Standards Codification
-Section S99
-Paragraph 1A
-Subparagraph (SX 210.13-01(a)(4)(iv))
-Publisher FASB
-URI https://asc.fasb.org/1943274/2147480097/470-10-S99-1A
Reference 26: http://www.xbrl.org/2003/role/disclosureRef
-Topic 470
-SubTopic 10
-Name Accounting Standards Codification
-Section S99
-Paragraph 1A
-Subparagraph (SX 210.13-01(a)(5))
-Publisher FASB
-URI https://asc.fasb.org/1943274/2147480097/470-10-S99-1A
Reference 27: http://www.xbrl.org/2003/role/disclosureRef
-Topic 470
-SubTopic 10
-Name Accounting Standards Codification
-Section S99
-Paragraph 1B
-Subparagraph (SX 210.13-02(a)(4)(i))
-Publisher FASB
-URI https://asc.fasb.org/1943274/2147480097/470-10-S99-1B
Reference 28: http://www.xbrl.org/2003/role/disclosureRef
-Topic 470
-SubTopic 10
-Name Accounting Standards Codification
-Section S99
-Paragraph 1B
-Subparagraph (SX 210.13-02(a)(4)(iii)(A))
-Publisher FASB
-URI https://asc.fasb.org/1943274/2147480097/470-10-S99-1B
Reference 29: http://www.xbrl.org/2003/role/disclosureRef
-Topic 470
-SubTopic 10
-Name Accounting Standards Codification
-Section S99
-Paragraph 1B
-Subparagraph (SX 210.13-02(a)(4)(iii)(B))
-Publisher FASB
-URI https://asc.fasb.org/1943274/2147480097/470-10-S99-1B
Reference 30: http://www.xbrl.org/2003/role/disclosureRef
-Topic 470
-SubTopic 10
-Name Accounting Standards Codification
-Section S99
-Paragraph 1B
-Subparagraph (SX 210.13-02(a)(4)(iv))
-Publisher FASB
-URI https://asc.fasb.org/1943274/2147480097/470-10-S99-1B
Reference 31: http://www.xbrl.org/2003/role/disclosureRef
-Topic 470
-SubTopic 10
-Name Accounting Standards Codification
-Section S99
-Paragraph 1B
-Subparagraph (SX 210.13-02(a)(5))
-Publisher FASB
-URI https://asc.fasb.org/1943274/2147480097/470-10-S99-1B
Reference 32: http://www.xbrl.org/2003/role/disclosureRef
-Topic 260
-SubTopic 10
-Name Accounting Standards Codification
-Section 45
-Paragraph 60B
-Subparagraph (a)
-Publisher FASB
-URI https://asc.fasb.org/1943274/2147482689/260-10-45-60B
Reference 33: http://www.xbrl.org/2003/role/disclosureRef
-Topic 205
-SubTopic 20
-Name Accounting Standards Codification
-Section 50
-Paragraph 7
-Publisher FASB
-URI https://asc.fasb.org/1943274/2147483499/205-20-50-7
Reference 34: http://fasb.org/us-gaap/role/ref/legacyRef
-Topic 230
-SubTopic 10
-Name Accounting Standards Codification
-Section 45
-Paragraph 28
-Publisher FASB
-URI https://asc.fasb.org/1943274/2147482740/230-10-45-28
Reference 35: http://www.xbrl.org/2003/role/disclosureRef
-Topic 220
-SubTopic 10
-Name Accounting Standards Codification
-Section 45
-Paragraph 1A
-Subparagraph (a)
-Publisher FASB
-URI https://asc.fasb.org/1943274/2147482790/220-10-45-1A
Reference 36: http://www.xbrl.org/2003/role/disclosureRef
-Topic 220
-SubTopic 10
-Name Accounting Standards Codification
-Section 45
-Paragraph 1B
-Subparagraph (a)
-Publisher FASB
-URI https://asc.fasb.org/1943274/2147482790/220-10-45-1B
Reference 37: http://fasb.org/us-gaap/role/ref/legacyRef
-Topic 942
-SubTopic 220
-Name Accounting Standards Codification
-Section S99
-Paragraph 1
-Subparagraph (SX 210.9-04(22))
-Publisher FASB
-URI https://asc.fasb.org/1943274/2147478524/942-220-S99-1
| Name: |
us-gaap_NetIncomeLoss |
| Namespace Prefix: |
us-gaap_ |
| Data Type: |
xbrli:monetaryItemType |
| Balance Type: |
credit |
| Period Type: |
duration |
|
| X |
- DefinitionGenerally recurring costs associated with normal operations except for the portion of these expenses which can be clearly related to production and included in cost of sales or services. Includes selling, general and administrative expense.
| Name: |
us-gaap_OperatingExpenses |
| Namespace Prefix: |
us-gaap_ |
| Data Type: |
xbrli:monetaryItemType |
| Balance Type: |
debit |
| Period Type: |
duration |
|
| X |
- References
+ Details
| Name: |
us-gaap_OperatingExpensesAbstract |
| Namespace Prefix: |
us-gaap_ |
| Data Type: |
xbrli:stringItemType |
| Balance Type: |
na |
| Period Type: |
duration |
|
| X |
- DefinitionThe net result for the period of deducting operating expenses from operating revenues. Reference 1: http://www.xbrl.org/2009/role/commonPracticeRef
-Topic 280
-SubTopic 10
-Name Accounting Standards Codification
-Section 50
-Paragraph 22
-Publisher FASB
-URI https://asc.fasb.org/1943274/2147482810/280-10-50-22
Reference 2: http://www.xbrl.org/2009/role/commonPracticeRef
-Topic 280
-SubTopic 10
-Name Accounting Standards Codification
-Section 50
-Paragraph 32
-Subparagraph (f)
-Publisher FASB
-URI https://asc.fasb.org/1943274/2147482810/280-10-50-32
Reference 3: http://www.xbrl.org/2009/role/commonPracticeRef
-Topic 280
-SubTopic 10
-Name Accounting Standards Codification
-Section 50
-Paragraph 30
-Subparagraph (b)
-Publisher FASB
-URI https://asc.fasb.org/1943274/2147482810/280-10-50-30
Reference 4: http://www.xbrl.org/2009/role/commonPracticeRef
-Topic 270
-SubTopic 10
-Name Accounting Standards Codification
-Section 50
-Paragraph 1
-Subparagraph (i)
-Publisher FASB
-URI https://asc.fasb.org/1943274/2147482964/270-10-50-1
Reference 5: http://www.xbrl.org/2009/role/commonPracticeRef
-Topic 280
-SubTopic 10
-Name Accounting Standards Codification
-Section 50
-Paragraph 32
-Subparagraph (ee)
-Publisher FASB
-URI https://asc.fasb.org/1943274/2147482810/280-10-50-32
Reference 6: http://fasb.org/us-gaap/role/ref/otherTransitionRef
-Topic 280
-SubTopic 10
-Name Accounting Standards Codification
-Section 50
-Paragraph 32
-Subparagraph (c)
-Publisher FASB
-URI https://asc.fasb.org/1943274/2147482810/280-10-50-32
Reference 7: http://www.xbrl.org/2003/role/exampleRef
-Topic 280
-SubTopic 10
-Name Accounting Standards Codification
-Section 50
-Paragraph 31
-Publisher FASB
-URI https://asc.fasb.org/1943274/2147482810/280-10-50-31
| Name: |
us-gaap_OperatingIncomeLoss |
| Namespace Prefix: |
us-gaap_ |
| Data Type: |
xbrli:monetaryItemType |
| Balance Type: |
credit |
| Period Type: |
duration |
|
| X |
- DefinitionAmount of income (expense) related to nonoperating activities, classified as other. Reference 1: http://fasb.org/us-gaap/role/ref/legacyRef
-Topic 220
-SubTopic 10
-Name Accounting Standards Codification
-Section S99
-Paragraph 2
-Subparagraph (SX 210.5-03(9))
-Publisher FASB
-URI https://asc.fasb.org/1943274/2147483621/220-10-S99-2
| Name: |
us-gaap_OtherNonoperatingIncomeExpense |
| Namespace Prefix: |
us-gaap_ |
| Data Type: |
xbrli:monetaryItemType |
| Balance Type: |
credit |
| Period Type: |
duration |
|
| X |
- DefinitionAmount of expense for research and development. Includes, but is not limited to, cost for computer software product to be sold, leased, or otherwise marketed and writeoff of research and development assets acquired in transaction other than business combination or joint venture formation or both. Excludes write-down of intangible asset acquired in business combination or from joint venture formation or both, used in research and development activity. Reference 1: http://www.xbrl.org/2003/role/exampleRef
-Topic 280
-SubTopic 10
-Name Accounting Standards Codification
-Section 55
-Paragraph 48
-Publisher FASB
-URI https://asc.fasb.org/1943274/2147482785/280-10-55-48
Reference 2: http://www.xbrl.org/2003/role/disclosureRef
-Topic 985
-SubTopic 20
-Name Accounting Standards Codification
-Section 50
-Paragraph 2
-Publisher FASB
-URI https://asc.fasb.org/1943274/2147481283/985-20-50-2
Reference 3: http://www.xbrl.org/2003/role/disclosureRef
-Topic 730
-SubTopic 10
-Name Accounting Standards Codification
-Section 50
-Paragraph 1
-Publisher FASB
-URI https://asc.fasb.org/1943274/2147482916/730-10-50-1
Reference 4: http://www.xbrl.org/2009/role/commonPracticeRef
-Topic 912
-SubTopic 730
-Name Accounting Standards Codification
-Section 25
-Paragraph 1
-Publisher FASB
-URI https://asc.fasb.org/1943274/2147479532/912-730-25-1
| Name: |
us-gaap_ResearchAndDevelopmentExpense |
| Namespace Prefix: |
us-gaap_ |
| Data Type: |
xbrli:monetaryItemType |
| Balance Type: |
debit |
| Period Type: |
duration |
|
| X |
- DefinitionAmount of expenses associated with exit or disposal activities pursuant to an authorized plan. Excludes expenses related to a discontinued operation or an asset retirement obligation. Reference 1: http://fasb.org/us-gaap/role/ref/legacyRef
-Name Accounting Standards Codification
-Section 45
-Paragraph 28
-Subparagraph (b)
-SubTopic 10
-Topic 230
-Publisher FASB
-URI https://asc.fasb.org/1943274/2147482740/230-10-45-28
Reference 2: http://www.xbrl.org/2003/role/disclosureRef
-Topic 420
-SubTopic 10
-Name Accounting Standards Codification
-Section S99
-Paragraph 2
-Subparagraph (SAB Topic 5.P.4.b.1)
-Publisher FASB
-URI https://asc.fasb.org/1943274/2147479823/420-10-S99-2
Reference 3: http://www.xbrl.org/2009/role/commonPracticeRef
-Topic 420
-SubTopic 10
-Name Accounting Standards Codification
-Section 45
-Paragraph 3
-Publisher FASB
-URI https://asc.fasb.org/1943274/2147482047/420-10-45-3
Reference 4: http://www.xbrl.org/2003/role/disclosureRef
-Topic 420
-SubTopic 10
-Name Accounting Standards Codification
-Section S99
-Paragraph 1
-Subparagraph (SAB Topic 5.P.3)
-Publisher FASB
-URI https://asc.fasb.org/1943274/2147479823/420-10-S99-1
| Name: |
us-gaap_RestructuringCharges |
| Namespace Prefix: |
us-gaap_ |
| Data Type: |
xbrli:monetaryItemType |
| Balance Type: |
debit |
| Period Type: |
duration |
|
| X |
- DefinitionAmount, excluding tax collected from customer, of revenue from satisfaction of performance obligation by transferring promised good or service to customer. Tax collected from customer is tax assessed by governmental authority that is both imposed on and concurrent with specific revenue-producing transaction, including, but not limited to, sales, use, value added and excise. Reference 1: http://www.xbrl.org/2003/role/disclosureRef
-Topic 280
-SubTopic 10
-Name Accounting Standards Codification
-Section 50
-Paragraph 41
-Subparagraph (a)
-Publisher FASB
-URI https://asc.fasb.org/1943274/2147482810/280-10-50-41
Reference 2: http://www.xbrl.org/2003/role/disclosureRef
-Topic 270
-SubTopic 10
-Name Accounting Standards Codification
-Section 50
-Paragraph 1
-Subparagraph (i)
-Publisher FASB
-URI https://asc.fasb.org/1943274/2147482964/270-10-50-1
Reference 3: http://www.xbrl.org/2003/role/disclosureRef
-Topic 280
-SubTopic 10
-Name Accounting Standards Codification
-Section 50
-Paragraph 32
-Subparagraph (ee)
-Publisher FASB
-URI https://asc.fasb.org/1943274/2147482810/280-10-50-32
Reference 4: http://fasb.org/us-gaap/role/ref/otherTransitionRef
-Topic 280
-SubTopic 10
-Name Accounting Standards Codification
-Section 50
-Paragraph 32
-Subparagraph (b)
-Publisher FASB
-URI https://asc.fasb.org/1943274/2147482810/280-10-50-32
Reference 5: http://fasb.org/us-gaap/role/ref/otherTransitionRef
-Topic 280
-SubTopic 10
-Name Accounting Standards Codification
-Section 50
-Paragraph 32
-Subparagraph (a)
-Publisher FASB
-URI https://asc.fasb.org/1943274/2147482810/280-10-50-32
Reference 6: http://www.xbrl.org/2003/role/disclosureRef
-Topic 924
-SubTopic 10
-Name Accounting Standards Codification
-Section S99
-Paragraph 1
-Subparagraph (SAB Topic 11.L)
-Publisher FASB
-URI https://asc.fasb.org/1943274/2147479941/924-10-S99-1
Reference 7: http://www.xbrl.org/2003/role/disclosureRef
-Topic 606
-SubTopic 10
-Name Accounting Standards Codification
-Section 50
-Paragraph 5
-Publisher FASB
-URI https://asc.fasb.org/1943274/2147479806/606-10-50-5
Reference 8: http://www.xbrl.org/2003/role/disclosureRef
-Topic 280
-SubTopic 10
-Name Accounting Standards Codification
-Section 50
-Paragraph 30
-Subparagraph (a)
-Publisher FASB
-URI https://asc.fasb.org/1943274/2147482810/280-10-50-30
Reference 9: http://www.xbrl.org/2003/role/disclosureRef
-Topic 280
-SubTopic 10
-Name Accounting Standards Codification
-Section 50
-Paragraph 42
-Publisher FASB
-URI https://asc.fasb.org/1943274/2147482810/280-10-50-42
Reference 10: http://www.xbrl.org/2003/role/disclosureRef
-Topic 280
-SubTopic 10
-Name Accounting Standards Codification
-Section 50
-Paragraph 22
-Subparagraph (b)
-Publisher FASB
-URI https://asc.fasb.org/1943274/2147482810/280-10-50-22
Reference 11: http://www.xbrl.org/2003/role/disclosureRef
-Topic 280
-SubTopic 10
-Name Accounting Standards Codification
-Section 50
-Paragraph 40
-Publisher FASB
-URI https://asc.fasb.org/1943274/2147482810/280-10-50-40
Reference 12: http://www.xbrl.org/2003/role/disclosureRef
-Topic 280
-SubTopic 10
-Name Accounting Standards Codification
-Section 50
-Paragraph 22
-Subparagraph (a)
-Publisher FASB
-URI https://asc.fasb.org/1943274/2147482810/280-10-50-22
Reference 13: http://www.xbrl.org/2003/role/disclosureRef
-Topic 606
-SubTopic 10
-Name Accounting Standards Codification
-Section 50
-Paragraph 4
-Subparagraph (a)
-Publisher FASB
-URI https://asc.fasb.org/1943274/2147479806/606-10-50-4
| Name: |
us-gaap_RevenueFromContractWithCustomerExcludingAssessedTax |
| Namespace Prefix: |
us-gaap_ |
| Data Type: |
xbrli:monetaryItemType |
| Balance Type: |
credit |
| Period Type: |
duration |
|
| X |
- References
+ Details
| Name: |
us-gaap_RevenuesAbstract |
| Namespace Prefix: |
us-gaap_ |
| Data Type: |
xbrli:stringItemType |
| Balance Type: |
na |
| Period Type: |
duration |
|
| X |
- DefinitionThe aggregate total amount of expenses directly related to the marketing or selling of products or services.
| Name: |
us-gaap_SellingAndMarketingExpense |
| Namespace Prefix: |
us-gaap_ |
| Data Type: |
xbrli:monetaryItemType |
| Balance Type: |
debit |
| Period Type: |
duration |
|
| X |
- DefinitionThe average number of shares or units issued and outstanding that are used in calculating diluted EPS or earnings per unit (EPU), determined based on the timing of issuance of shares or units in the period. Reference 1: http://www.xbrl.org/2003/role/disclosureRef
-Topic 260
-SubTopic 10
-Name Accounting Standards Codification
-Section 50
-Paragraph 1
-Subparagraph (a)
-Publisher FASB
-URI https://asc.fasb.org/1943274/2147482662/260-10-50-1
Reference 2: http://www.xbrl.org/2003/role/disclosureRef
-Topic 260
-SubTopic 10
-Name Accounting Standards Codification
-Section 45
-Paragraph 16
-Publisher FASB
-URI https://asc.fasb.org/1943274/2147482689/260-10-45-16
| Name: |
us-gaap_WeightedAverageNumberOfDilutedSharesOutstanding |
| Namespace Prefix: |
us-gaap_ |
| Data Type: |
xbrli:sharesItemType |
| Balance Type: |
na |
| Period Type: |
duration |
|
| X |
- DefinitionNumber of [basic] shares or units, after adjustment for contingently issuable shares or units and other shares or units not deemed outstanding, determined by relating the portion of time within a reporting period that common shares or units have been outstanding to the total time in that period. Reference 1: http://www.xbrl.org/2003/role/disclosureRef
-Topic 260
-SubTopic 10
-Name Accounting Standards Codification
-Section 50
-Paragraph 1
-Subparagraph (a)
-Publisher FASB
-URI https://asc.fasb.org/1943274/2147482662/260-10-50-1
Reference 2: http://www.xbrl.org/2003/role/disclosureRef
-Topic 260
-SubTopic 10
-Name Accounting Standards Codification
-Section 45
-Paragraph 10
-Publisher FASB
-URI https://asc.fasb.org/1943274/2147482689/260-10-45-10
| Name: |
us-gaap_WeightedAverageNumberOfSharesOutstandingBasic |
| Namespace Prefix: |
us-gaap_ |
| Data Type: |
xbrli:sharesItemType |
| Balance Type: |
na |
| Period Type: |
duration |
|
| X |
- Details
| Name: |
srt_ProductOrServiceAxis=pega_SubscriptionServicesMember |
| Namespace Prefix: |
|
| Data Type: |
na |
| Balance Type: |
|
| Period Type: |
|
|
| X |
- Details
| Name: |
srt_ProductOrServiceAxis=pega_SubscriptionLicenseMember |
| Namespace Prefix: |
|
| Data Type: |
na |
| Balance Type: |
|
| Period Type: |
|
|
| X |
- Details
| Name: |
srt_ProductOrServiceAxis=pega_ConsultingMember |
| Namespace Prefix: |
|
| Data Type: |
na |
| Balance Type: |
|
| Period Type: |
|
|
| X |
- Details
| Name: |
srt_ProductOrServiceAxis=pega_PerpetualLicenseMember |
| Namespace Prefix: |
|
| Data Type: |
na |
| Balance Type: |
|
| Period Type: |
|
|
v3.24.2
UNAUDITED CONDENSED CONSOLIDATED STATEMENTS OF COMPREHENSIVE INCOME (LOSS) - USD ($)
$ in Thousands |
3 Months Ended |
6 Months Ended |
Jun. 30, 2024 |
Jun. 30, 2023 |
Jun. 30, 2024 |
Jun. 30, 2023 |
| Statement of Comprehensive Income [Abstract] |
|
|
|
|
| Net income (loss) |
$ 6,613
|
$ (46,804)
|
$ (5,511)
|
$ (67,578)
|
| Other comprehensive (loss) income, net of tax |
|
|
|
|
| Unrealized (loss) on available-for-sale securities |
(72)
|
(195)
|
(818)
|
(241)
|
| Foreign currency translation adjustments |
(2,142)
|
361
|
(5,569)
|
1,950
|
| Total other comprehensive (loss) income, net of tax |
(2,214)
|
166
|
(6,387)
|
1,709
|
| Comprehensive income (loss) |
$ 4,399
|
$ (46,638)
|
$ (11,898)
|
$ (65,869)
|
| X |
- DefinitionAmount after tax of increase (decrease) in equity from transactions and other events and circumstances from net income and other comprehensive income, attributable to parent entity. Excludes changes in equity resulting from investments by owners and distributions to owners. Reference 1: http://www.xbrl.org/2003/role/disclosureRef
-Topic 220
-SubTopic 10
-Name Accounting Standards Codification
-Section S99
-Paragraph 2
-Subparagraph (SX 210.5-03(24))
-Publisher FASB
-URI https://asc.fasb.org/1943274/2147483621/220-10-S99-2
Reference 2: http://www.xbrl.org/2003/role/disclosureRef
-Topic 942
-SubTopic 220
-Name Accounting Standards Codification
-Section S99
-Paragraph 1
-Subparagraph (SX 210.9-04(26))
-Publisher FASB
-URI https://asc.fasb.org/1943274/2147478524/942-220-S99-1
Reference 3: http://www.xbrl.org/2003/role/disclosureRef
-Topic 944
-SubTopic 220
-Name Accounting Standards Codification
-Section S99
-Paragraph 1
-Subparagraph (SX 210.7-04(22))
-Publisher FASB
-URI https://asc.fasb.org/1943274/2147477250/944-220-S99-1
Reference 4: http://www.xbrl.org/2003/role/disclosureRef
-Topic 220
-SubTopic 10
-Name Accounting Standards Codification
-Section 45
-Paragraph 1A
-Subparagraph (c)
-Publisher FASB
-URI https://asc.fasb.org/1943274/2147482790/220-10-45-1A
Reference 5: http://www.xbrl.org/2003/role/disclosureRef
-Topic 220
-SubTopic 10
-Name Accounting Standards Codification
-Section 45
-Paragraph 1B
-Subparagraph (b)
-Publisher FASB
-URI https://asc.fasb.org/1943274/2147482790/220-10-45-1B
Reference 6: http://www.xbrl.org/2003/role/disclosureRef
-Topic 944
-SubTopic 220
-Name Accounting Standards Codification
-Section S99
-Paragraph 1
-Subparagraph (SX 210.7-04(20))
-Publisher FASB
-URI https://asc.fasb.org/1943274/2147477250/944-220-S99-1
Reference 7: http://fasb.org/us-gaap/role/ref/legacyRef
-Name Accounting Standards Codification
-Topic 220
-SubTopic 10
-Section 45
-Paragraph 5
-Publisher FASB
-URI https://asc.fasb.org/1943274/2147482790/220-10-45-5
| Name: |
us-gaap_ComprehensiveIncomeNetOfTax |
| Namespace Prefix: |
us-gaap_ |
| Data Type: |
xbrli:monetaryItemType |
| Balance Type: |
credit |
| Period Type: |
duration |
|
| X |
- DefinitionThe portion of profit or loss for the period, net of income taxes, which is attributable to the parent. Reference 1: http://www.xbrl.org/2003/role/disclosureRef
-Topic 250
-SubTopic 10
-Name Accounting Standards Codification
-Section 50
-Paragraph 6
-Publisher FASB
-URI https://asc.fasb.org/1943274/2147483443/250-10-50-6
Reference 2: http://www.xbrl.org/2003/role/disclosureRef
-Topic 250
-SubTopic 10
-Name Accounting Standards Codification
-Section 50
-Paragraph 9
-Publisher FASB
-URI https://asc.fasb.org/1943274/2147483443/250-10-50-9
Reference 3: http://www.xbrl.org/2003/role/disclosureRef
-Topic 805
-SubTopic 60
-Name Accounting Standards Codification
-Section 65
-Paragraph 1
-Subparagraph (g)
-Publisher FASB
-URI https://asc.fasb.org/1943274/2147476176/805-60-65-1
Reference 4: http://www.xbrl.org/2003/role/disclosureRef
-Topic 740
-SubTopic 323
-Name Accounting Standards Codification
-Section 65
-Paragraph 2
-Subparagraph (g)(3)
-Publisher FASB
-URI https://asc.fasb.org/1943274/2147478666/740-323-65-2
Reference 5: http://fasb.org/us-gaap/role/ref/legacyRef
-Topic 220
-SubTopic 10
-Name Accounting Standards Codification
-Section S99
-Paragraph 2
-Subparagraph (SX 210.5-03(20))
-Publisher FASB
-URI https://asc.fasb.org/1943274/2147483621/220-10-S99-2
Reference 6: http://www.xbrl.org/2003/role/disclosureRef
-Topic 235
-SubTopic 10
-Name Accounting Standards Codification
-Section S99
-Paragraph 1
-Subparagraph (SX 210.4-08(g)(1)(ii))
-Publisher FASB
-URI https://asc.fasb.org/1943274/2147480678/235-10-S99-1
Reference 7: http://www.xbrl.org/2003/role/disclosureRef
-Topic 323
-SubTopic 10
-Name Accounting Standards Codification
-Section 50
-Paragraph 3
-Subparagraph (c)
-Publisher FASB
-URI https://asc.fasb.org/1943274/2147481687/323-10-50-3
Reference 8: http://www.xbrl.org/2003/role/disclosureRef
-Topic 825
-SubTopic 10
-Name Accounting Standards Codification
-Section 50
-Paragraph 28
-Subparagraph (f)
-Publisher FASB
-URI https://asc.fasb.org/1943274/2147482907/825-10-50-28
Reference 9: http://www.xbrl.org/2003/role/disclosureRef
-Topic 220
-SubTopic 10
-Name Accounting Standards Codification
-Section 50
-Paragraph 6
-Publisher FASB
-URI https://asc.fasb.org/1943274/2147482765/220-10-50-6
Reference 10: http://www.xbrl.org/2003/role/disclosureRef
-Topic 250
-SubTopic 10
-Name Accounting Standards Codification
-Section 50
-Paragraph 3
-Publisher FASB
-URI https://asc.fasb.org/1943274/2147483443/250-10-50-3
Reference 11: http://www.xbrl.org/2003/role/disclosureRef
-Topic 250
-SubTopic 10
-Name Accounting Standards Codification
-Section 50
-Paragraph 1
-Subparagraph (b)(2)
-Publisher FASB
-URI https://asc.fasb.org/1943274/2147483443/250-10-50-1
Reference 12: http://www.xbrl.org/2003/role/disclosureRef
-Topic 815
-SubTopic 40
-Name Accounting Standards Codification
-Section 65
-Paragraph 1
-Subparagraph (f)
-Publisher FASB
-URI https://asc.fasb.org/1943274/2147480175/815-40-65-1
Reference 13: http://www.xbrl.org/2003/role/disclosureRef
-Topic 250
-SubTopic 10
-Name Accounting Standards Codification
-Section 50
-Paragraph 8
-Publisher FASB
-URI https://asc.fasb.org/1943274/2147483443/250-10-50-8
Reference 14: http://www.xbrl.org/2003/role/disclosureRef
-Topic 250
-SubTopic 10
-Name Accounting Standards Codification
-Section 50
-Paragraph 11
-Subparagraph (a)
-Publisher FASB
-URI https://asc.fasb.org/1943274/2147483443/250-10-50-11
Reference 15: http://www.xbrl.org/2003/role/disclosureRef
-Topic 250
-SubTopic 10
-Name Accounting Standards Codification
-Section 50
-Paragraph 11
-Subparagraph (b)
-Publisher FASB
-URI https://asc.fasb.org/1943274/2147483443/250-10-50-11
Reference 16: http://www.xbrl.org/2003/role/disclosureRef
-Topic 250
-SubTopic 10
-Name Accounting Standards Codification
-Section 50
-Paragraph 4
-Publisher FASB
-URI https://asc.fasb.org/1943274/2147483443/250-10-50-4
Reference 17: http://www.xbrl.org/2003/role/exampleRef
-Topic 946
-SubTopic 830
-Name Accounting Standards Codification
-Section 55
-Paragraph 10
-Publisher FASB
-URI https://asc.fasb.org/1943274/2147479168/946-830-55-10
Reference 18: http://www.xbrl.org/2003/role/disclosureRef
-Topic 946
-SubTopic 220
-Name Accounting Standards Codification
-Section 45
-Paragraph 7
-Publisher FASB
-URI https://asc.fasb.org/1943274/2147479105/946-220-45-7
Reference 19: http://www.xbrl.org/2003/role/disclosureRef
-Topic 944
-SubTopic 220
-Name Accounting Standards Codification
-Section S99
-Paragraph 1
-Subparagraph (SX 210.7-04(18))
-Publisher FASB
-URI https://asc.fasb.org/1943274/2147477250/944-220-S99-1
Reference 20: http://www.xbrl.org/2003/role/disclosureRef
-Topic 946
-SubTopic 220
-Name Accounting Standards Codification
-Section S99
-Paragraph 1
-Subparagraph (SX 210.6-07(9))
-Publisher FASB
-URI https://asc.fasb.org/1943274/2147479134/946-220-S99-1
Reference 21: http://www.xbrl.org/2003/role/disclosureRef
-Topic 946
-SubTopic 220
-Name Accounting Standards Codification
-Section S99
-Paragraph 3
-Subparagraph (SX 210.6-09(1)(d))
-Publisher FASB
-URI https://asc.fasb.org/1943274/2147479134/946-220-S99-3
Reference 22: http://www.xbrl.org/2003/role/disclosureRef
-Topic 470
-SubTopic 10
-Name Accounting Standards Codification
-Section S99
-Paragraph 1A
-Subparagraph (SX 210.13-01(a)(4)(i))
-Publisher FASB
-URI https://asc.fasb.org/1943274/2147480097/470-10-S99-1A
Reference 23: http://www.xbrl.org/2009/role/commonPracticeRef
-Topic 470
-SubTopic 10
-Name Accounting Standards Codification
-Section S99
-Paragraph 1A
-Subparagraph (SX 210.13-01(a)(4)(ii))
-Publisher FASB
-URI https://asc.fasb.org/1943274/2147480097/470-10-S99-1A
Reference 24: http://www.xbrl.org/2003/role/disclosureRef
-Topic 470
-SubTopic 10
-Name Accounting Standards Codification
-Section S99
-Paragraph 1A
-Subparagraph (SX 210.13-01(a)(4)(iii)(A))
-Publisher FASB
-URI https://asc.fasb.org/1943274/2147480097/470-10-S99-1A
Reference 25: http://www.xbrl.org/2003/role/disclosureRef
-Topic 470
-SubTopic 10
-Name Accounting Standards Codification
-Section S99
-Paragraph 1A
-Subparagraph (SX 210.13-01(a)(4)(iv))
-Publisher FASB
-URI https://asc.fasb.org/1943274/2147480097/470-10-S99-1A
Reference 26: http://www.xbrl.org/2003/role/disclosureRef
-Topic 470
-SubTopic 10
-Name Accounting Standards Codification
-Section S99
-Paragraph 1A
-Subparagraph (SX 210.13-01(a)(5))
-Publisher FASB
-URI https://asc.fasb.org/1943274/2147480097/470-10-S99-1A
Reference 27: http://www.xbrl.org/2003/role/disclosureRef
-Topic 470
-SubTopic 10
-Name Accounting Standards Codification
-Section S99
-Paragraph 1B
-Subparagraph (SX 210.13-02(a)(4)(i))
-Publisher FASB
-URI https://asc.fasb.org/1943274/2147480097/470-10-S99-1B
Reference 28: http://www.xbrl.org/2003/role/disclosureRef
-Topic 470
-SubTopic 10
-Name Accounting Standards Codification
-Section S99
-Paragraph 1B
-Subparagraph (SX 210.13-02(a)(4)(iii)(A))
-Publisher FASB
-URI https://asc.fasb.org/1943274/2147480097/470-10-S99-1B
Reference 29: http://www.xbrl.org/2003/role/disclosureRef
-Topic 470
-SubTopic 10
-Name Accounting Standards Codification
-Section S99
-Paragraph 1B
-Subparagraph (SX 210.13-02(a)(4)(iii)(B))
-Publisher FASB
-URI https://asc.fasb.org/1943274/2147480097/470-10-S99-1B
Reference 30: http://www.xbrl.org/2003/role/disclosureRef
-Topic 470
-SubTopic 10
-Name Accounting Standards Codification
-Section S99
-Paragraph 1B
-Subparagraph (SX 210.13-02(a)(4)(iv))
-Publisher FASB
-URI https://asc.fasb.org/1943274/2147480097/470-10-S99-1B
Reference 31: http://www.xbrl.org/2003/role/disclosureRef
-Topic 470
-SubTopic 10
-Name Accounting Standards Codification
-Section S99
-Paragraph 1B
-Subparagraph (SX 210.13-02(a)(5))
-Publisher FASB
-URI https://asc.fasb.org/1943274/2147480097/470-10-S99-1B
Reference 32: http://www.xbrl.org/2003/role/disclosureRef
-Topic 260
-SubTopic 10
-Name Accounting Standards Codification
-Section 45
-Paragraph 60B
-Subparagraph (a)
-Publisher FASB
-URI https://asc.fasb.org/1943274/2147482689/260-10-45-60B
Reference 33: http://www.xbrl.org/2003/role/disclosureRef
-Topic 205
-SubTopic 20
-Name Accounting Standards Codification
-Section 50
-Paragraph 7
-Publisher FASB
-URI https://asc.fasb.org/1943274/2147483499/205-20-50-7
Reference 34: http://fasb.org/us-gaap/role/ref/legacyRef
-Topic 230
-SubTopic 10
-Name Accounting Standards Codification
-Section 45
-Paragraph 28
-Publisher FASB
-URI https://asc.fasb.org/1943274/2147482740/230-10-45-28
Reference 35: http://www.xbrl.org/2003/role/disclosureRef
-Topic 220
-SubTopic 10
-Name Accounting Standards Codification
-Section 45
-Paragraph 1A
-Subparagraph (a)
-Publisher FASB
-URI https://asc.fasb.org/1943274/2147482790/220-10-45-1A
Reference 36: http://www.xbrl.org/2003/role/disclosureRef
-Topic 220
-SubTopic 10
-Name Accounting Standards Codification
-Section 45
-Paragraph 1B
-Subparagraph (a)
-Publisher FASB
-URI https://asc.fasb.org/1943274/2147482790/220-10-45-1B
Reference 37: http://fasb.org/us-gaap/role/ref/legacyRef
-Topic 942
-SubTopic 220
-Name Accounting Standards Codification
-Section S99
-Paragraph 1
-Subparagraph (SX 210.9-04(22))
-Publisher FASB
-URI https://asc.fasb.org/1943274/2147478524/942-220-S99-1
| Name: |
us-gaap_NetIncomeLoss |
| Namespace Prefix: |
us-gaap_ |
| Data Type: |
xbrli:monetaryItemType |
| Balance Type: |
credit |
| Period Type: |
duration |
|
| X |
- DefinitionAmount after tax and reclassification adjustments of gain (loss) on foreign currency translation adjustments, foreign currency transactions designated and effective as economic hedges of a net investment in a foreign entity and intra-entity foreign currency transactions that are of a long-term-investment nature, attributable to parent entity. Reference 1: http://fasb.org/us-gaap/role/ref/legacyRef
-Topic 810
-SubTopic 10
-Name Accounting Standards Codification
-Section 45
-Paragraph 19
-Publisher FASB
-URI https://asc.fasb.org/1943274/2147481231/810-10-45-19
Reference 2: http://fasb.org/us-gaap/role/ref/legacyRef
-Name Accounting Standards Codification
-Section 45
-Paragraph 20
-SubTopic 10
-Topic 810
-Publisher FASB
-URI https://asc.fasb.org/1943274/2147481231/810-10-45-20
Reference 3: http://fasb.org/us-gaap/role/ref/legacyRef
-Name Accounting Standards Codification
-Section 50
-Paragraph 1A
-Subparagraph (c)(3)
-SubTopic 10
-Topic 810
-Publisher FASB
-URI https://asc.fasb.org/1943274/2147481203/810-10-50-1A
| Name: |
us-gaap_OtherComprehensiveIncomeForeignCurrencyTransactionAndTranslationAdjustmentNetOfTaxPortionAttributableToParent |
| Namespace Prefix: |
us-gaap_ |
| Data Type: |
xbrli:monetaryItemType |
| Balance Type: |
credit |
| Period Type: |
duration |
|
| X |
- DefinitionAmount after tax of other comprehensive income (loss) attributable to parent entity. Reference 1: http://fasb.org/us-gaap/role/ref/legacyRef
-Topic 810
-SubTopic 10
-Name Accounting Standards Codification
-Section 45
-Paragraph 19
-Publisher FASB
-URI https://asc.fasb.org/1943274/2147481231/810-10-45-19
Reference 2: http://fasb.org/us-gaap/role/ref/legacyRef
-Name Accounting Standards Codification
-Section 45
-Paragraph 20
-SubTopic 10
-Topic 810
-Publisher FASB
-URI https://asc.fasb.org/1943274/2147481231/810-10-45-20
Reference 3: http://fasb.org/us-gaap/role/ref/legacyRef
-Name Accounting Standards Codification
-Section 50
-Paragraph 1A
-Subparagraph (c)(3)
-SubTopic 10
-Topic 810
-Publisher FASB
-URI https://asc.fasb.org/1943274/2147481203/810-10-50-1A
Reference 4: http://www.xbrl.org/2003/role/disclosureRef
-Topic 250
-SubTopic 10
-Name Accounting Standards Codification
-Section 50
-Paragraph 6
-Publisher FASB
-URI https://asc.fasb.org/1943274/2147483443/250-10-50-6
Reference 5: http://www.xbrl.org/2003/role/disclosureRef
-Topic 220
-SubTopic 10
-Name Accounting Standards Codification
-Section 45
-Paragraph 1B
-Subparagraph (b)
-Publisher FASB
-URI https://asc.fasb.org/1943274/2147482790/220-10-45-1B
Reference 6: http://www.xbrl.org/2003/role/disclosureRef
-Topic 220
-SubTopic 10
-Name Accounting Standards Codification
-Section 45
-Paragraph 1A
-Subparagraph (b)
-Publisher FASB
-URI https://asc.fasb.org/1943274/2147482790/220-10-45-1A
| Name: |
us-gaap_OtherComprehensiveIncomeLossNetOfTaxPortionAttributableToParent |
| Namespace Prefix: |
us-gaap_ |
| Data Type: |
xbrli:monetaryItemType |
| Balance Type: |
credit |
| Period Type: |
duration |
|
| X |
- References
+ Details
| Name: |
us-gaap_OtherComprehensiveIncomeLossNetOfTaxPortionAttributableToParentAbstract |
| Namespace Prefix: |
us-gaap_ |
| Data Type: |
xbrli:stringItemType |
| Balance Type: |
na |
| Period Type: |
duration |
|
| X |
- DefinitionAmount, after tax and before adjustment, of unrealized holding gain (loss) on investment in debt security measured at fair value with change in fair value recognized in other comprehensive income (available-for-sale). Excludes unrealized gain (loss) on investment in debt security measured at amortized cost (held-to-maturity) from transfer to available-for-sale. Reference 1: http://www.xbrl.org/2003/role/disclosureRef
-Topic 320
-SubTopic 10
-Name Accounting Standards Codification
-Section 50
-Paragraph 9
-Subparagraph (d)
-Publisher FASB
-URI https://asc.fasb.org/1943274/2147481800/320-10-50-9
Reference 2: http://www.xbrl.org/2003/role/disclosureRef
-Topic 220
-SubTopic 10
-Name Accounting Standards Codification
-Section 45
-Paragraph 10A
-Subparagraph (e)
-Publisher FASB
-URI https://asc.fasb.org/1943274/2147482790/220-10-45-10A
Reference 3: http://www.xbrl.org/2003/role/disclosureRef
-Topic 220
-SubTopic 10
-Name Accounting Standards Codification
-Section 45
-Paragraph 11
-Publisher FASB
-URI https://asc.fasb.org/1943274/2147482790/220-10-45-11
| Name: |
us-gaap_OtherComprehensiveIncomeUnrealizedHoldingGainLossOnSecuritiesArisingDuringPeriodNetOfTax |
| Namespace Prefix: |
us-gaap_ |
| Data Type: |
xbrli:monetaryItemType |
| Balance Type: |
credit |
| Period Type: |
duration |
|
| X |
- References
+ Details
| Name: |
us-gaap_StatementOfIncomeAndComprehensiveIncomeAbstract |
| Namespace Prefix: |
us-gaap_ |
| Data Type: |
xbrli:stringItemType |
| Balance Type: |
na |
| Period Type: |
duration |
|
v3.24.2
UNAUDITED CONDENSED CONSOLIDATED STATEMENTS OF STOCKHOLDERS' EQUITY - USD ($)
shares in Thousands, $ in Thousands |
Total |
Common Stock |
Additional paid-in capital |
(Accumulated deficit) |
Accumulated other comprehensive (loss) |
| Balance, beginning of period (in shares) at Dec. 31, 2022 |
|
82,436
|
|
|
|
| Balance, beginning of period at Dec. 31, 2022 |
$ 130,843
|
$ 824
|
$ 229,602
|
$ (76,513)
|
$ (23,070)
|
| Increase (Decrease) in Stockholders' Equity [Roll Forward] |
|
|
|
|
|
| Issuance of common stock for stock compensation plans (in shares) |
|
452
|
|
|
|
| Issuance of common stock for stock compensation plans |
672
|
$ 4
|
668
|
|
|
| Issuance of common stock under the employee stock purchase plan (in shares) |
|
52
|
|
|
|
| Issuance of common stock under the employee stock purchase plan |
2,143
|
$ 1
|
2,142
|
|
|
| Stock-based compensation |
42,557
|
|
42,557
|
|
|
| Cash dividends declared |
(2,488)
|
|
(2,488)
|
|
|
| Other comprehensive income (loss) |
1,543
|
|
|
|
1,543
|
| Net income (loss) |
(20,774)
|
|
|
(20,774)
|
|
| Balance, end of period (in shares) at Mar. 31, 2023 |
|
82,940
|
|
|
|
| Balance, end of period at Mar. 31, 2023 |
154,496
|
$ 829
|
272,481
|
(97,287)
|
(21,527)
|
| Balance, beginning of period (in shares) at Dec. 31, 2022 |
|
82,436
|
|
|
|
| Balance, beginning of period at Dec. 31, 2022 |
130,843
|
$ 824
|
229,602
|
(76,513)
|
(23,070)
|
| Increase (Decrease) in Stockholders' Equity [Roll Forward] |
|
|
|
|
|
| Other comprehensive income (loss) |
1,709
|
|
|
|
|
| Net income (loss) |
(67,578)
|
|
|
|
|
| Balance, end of period (in shares) at Jun. 30, 2023 |
|
83,212
|
|
|
|
| Balance, end of period at Jun. 30, 2023 |
145,396
|
$ 832
|
310,016
|
(144,091)
|
(21,361)
|
| Balance, beginning of period (in shares) at Mar. 31, 2023 |
|
82,940
|
|
|
|
| Balance, beginning of period at Mar. 31, 2023 |
154,496
|
$ 829
|
272,481
|
(97,287)
|
(21,527)
|
| Increase (Decrease) in Stockholders' Equity [Roll Forward] |
|
|
|
|
|
| Issuance of common stock for stock compensation plans (in shares) |
|
225
|
|
|
|
| Issuance of common stock for stock compensation plans |
1,826
|
$ 2
|
1,824
|
|
|
| Issuance of common stock under the employee stock purchase plan (in shares) |
|
47
|
|
|
|
| Issuance of common stock under the employee stock purchase plan |
1,981
|
$ 1
|
1,980
|
|
|
| Stock-based compensation |
36,227
|
|
36,227
|
|
|
| Cash dividends declared |
(2,496)
|
|
(2,496)
|
|
|
| Other comprehensive income (loss) |
166
|
|
|
|
166
|
| Net income (loss) |
(46,804)
|
|
|
(46,804)
|
|
| Balance, end of period (in shares) at Jun. 30, 2023 |
|
83,212
|
|
|
|
| Balance, end of period at Jun. 30, 2023 |
$ 145,396
|
$ 832
|
310,016
|
(144,091)
|
(21,361)
|
| Balance, beginning of period (in shares) at Dec. 31, 2023 |
83,840
|
83,840
|
|
|
|
| Balance, beginning of period at Dec. 31, 2023 |
$ 353,838
|
$ 838
|
379,584
|
(8,705)
|
(17,879)
|
| Increase (Decrease) in Stockholders' Equity [Roll Forward] |
|
|
|
|
|
| Issuance of common stock for stock compensation plans (in shares) |
|
1,139
|
|
|
|
| Issuance of common stock for stock compensation plans |
18,656
|
$ 12
|
18,644
|
|
|
| Issuance of common stock under the employee stock purchase plan (in shares) |
|
32
|
|
|
|
| Issuance of common stock under the employee stock purchase plan |
1,758
|
|
1,758
|
|
|
| Stock-based compensation |
34,781
|
|
34,781
|
|
|
| Cash dividends declared |
(2,550)
|
|
(2,550)
|
|
|
| Other comprehensive income (loss) |
(4,173)
|
|
|
|
(4,173)
|
| Net income (loss) |
(12,124)
|
|
|
(12,124)
|
|
| Balance, end of period (in shares) at Mar. 31, 2024 |
|
85,011
|
|
|
|
| Balance, end of period at Mar. 31, 2024 |
$ 390,186
|
$ 850
|
432,217
|
(20,829)
|
(22,052)
|
| Balance, beginning of period (in shares) at Dec. 31, 2023 |
83,840
|
83,840
|
|
|
|
| Balance, beginning of period at Dec. 31, 2023 |
$ 353,838
|
$ 838
|
379,584
|
(8,705)
|
(17,879)
|
| Increase (Decrease) in Stockholders' Equity [Roll Forward] |
|
|
|
|
|
| Other comprehensive income (loss) |
(6,387)
|
|
|
|
|
| Net income (loss) |
$ (5,511)
|
|
|
|
|
| Balance, end of period (in shares) at Jun. 30, 2024 |
85,369
|
85,369
|
|
|
|
| Balance, end of period at Jun. 30, 2024 |
$ 435,402
|
$ 854
|
473,030
|
(14,216)
|
(24,266)
|
| Balance, beginning of period (in shares) at Mar. 31, 2024 |
|
85,011
|
|
|
|
| Balance, beginning of period at Mar. 31, 2024 |
390,186
|
$ 850
|
432,217
|
(20,829)
|
(22,052)
|
| Increase (Decrease) in Stockholders' Equity [Roll Forward] |
|
|
|
|
|
| Issuance of common stock for stock compensation plans (in shares) |
|
326
|
|
|
|
| Issuance of common stock for stock compensation plans |
5,485
|
$ 4
|
5,481
|
|
|
| Issuance of common stock under the employee stock purchase plan (in shares) |
|
32
|
|
|
|
| Issuance of common stock under the employee stock purchase plan |
1,669
|
|
1,669
|
|
|
| Stock-based compensation |
36,224
|
|
36,224
|
|
|
| Cash dividends declared |
(2,561)
|
|
(2,561)
|
|
|
| Other comprehensive income (loss) |
(2,214)
|
|
0
|
|
(2,214)
|
| Net income (loss) |
$ 6,613
|
|
|
6,613
|
|
| Balance, end of period (in shares) at Jun. 30, 2024 |
85,369
|
85,369
|
|
|
|
| Balance, end of period at Jun. 30, 2024 |
$ 435,402
|
$ 854
|
$ 473,030
|
$ (14,216)
|
$ (24,266)
|
| X |
- DefinitionAmount of increase to additional paid-in capital (APIC) for recognition of cost for award under share-based payment arrangement. Reference 1: http://www.xbrl.org/2003/role/disclosureRef
-Topic 718
-SubTopic 10
-Name Accounting Standards Codification
-Section 35
-Paragraph 2
-Publisher FASB
-URI https://asc.fasb.org/1943274/2147480483/718-10-35-2
Reference 2: http://fasb.org/us-gaap/role/ref/legacyRef
-Name Accounting Standards Codification
-Topic 718
-SubTopic 20
-Section 55
-Paragraph 13
-Publisher FASB
-URI https://asc.fasb.org/1943274/2147481089/718-20-55-13
Reference 3: http://fasb.org/us-gaap/role/ref/legacyRef
-Name Accounting Standards Codification
-Topic 718
-SubTopic 20
-Section 55
-Paragraph 12
-Publisher FASB
-URI https://asc.fasb.org/1943274/2147481089/718-20-55-12
| Name: |
us-gaap_AdjustmentsToAdditionalPaidInCapitalSharebasedCompensationRequisiteServicePeriodRecognitionValue |
| Namespace Prefix: |
us-gaap_ |
| Data Type: |
xbrli:monetaryItemType |
| Balance Type: |
credit |
| Period Type: |
duration |
|
| X |
- DefinitionNumber of shares of common stock outstanding. Common stock represent the ownership interest in a corporation. Reference 1: http://fasb.org/us-gaap/role/ref/legacyRef
-Name Accounting Standards Codification
-Section 50
-Paragraph 2
-SubTopic 10
-Topic 505
-Publisher FASB
-URI https://asc.fasb.org/1943274/2147481112/505-10-50-2
Reference 2: http://fasb.org/us-gaap/role/ref/legacyRef
-Topic 210
-SubTopic 10
-Name Accounting Standards Codification
-Section S99
-Paragraph 1
-Subparagraph (SX 210.5-02(29))
-Publisher FASB
-URI https://asc.fasb.org/1943274/2147480566/210-10-S99-1
Reference 3: http://www.xbrl.org/2003/role/disclosureRef
-Topic 946
-SubTopic 210
-Name Accounting Standards Codification
-Section S99
-Paragraph 2
-Subparagraph (SX 210.6-05(4))
-Publisher FASB
-URI https://asc.fasb.org/1943274/2147479170/946-210-S99-2
Reference 4: http://www.xbrl.org/2009/role/commonPracticeRef
-Topic 946
-SubTopic 220
-Name Accounting Standards Codification
-Section S99
-Paragraph 3
-Subparagraph (SX 210.6-09(4)(b))
-Publisher FASB
-URI https://asc.fasb.org/1943274/2147479134/946-220-S99-3
Reference 5: http://www.xbrl.org/2003/role/disclosureRef
-Topic 946
-SubTopic 210
-Name Accounting Standards Codification
-Section S99
-Paragraph 1
-Subparagraph (SX 210.6-04(16)(a))
-Publisher FASB
-URI https://asc.fasb.org/1943274/2147479170/946-210-S99-1
Reference 6: http://www.xbrl.org/2009/role/commonPracticeRef
-Topic 946
-SubTopic 220
-Name Accounting Standards Codification
-Section S99
-Paragraph 3
-Subparagraph (SX 210.6-09(7))
-Publisher FASB
-URI https://asc.fasb.org/1943274/2147479134/946-220-S99-3
| Name: |
us-gaap_CommonStockSharesOutstanding |
| Namespace Prefix: |
us-gaap_ |
| Data Type: |
xbrli:sharesItemType |
| Balance Type: |
na |
| Period Type: |
instant |
|
| X |
- DefinitionAmount of paid and unpaid common stock dividends declared with the form of settlement in cash. Reference 1: http://fasb.org/us-gaap/role/ref/legacyRef
-Topic 505
-SubTopic 10
-Name Accounting Standards Codification
-Section S99
-Paragraph 1
-Subparagraph (SX 210.3-04)
-Publisher FASB
-URI https://asc.fasb.org/1943274/2147480008/505-10-S99-1
| Name: |
us-gaap_DividendsCommonStockCash |
| Namespace Prefix: |
us-gaap_ |
| Data Type: |
xbrli:monetaryItemType |
| Balance Type: |
debit |
| Period Type: |
duration |
|
| X |
- DefinitionA roll forward is a reconciliation of a concept from the beginning of a period to the end of a period.
| Name: |
us-gaap_IncreaseDecreaseInStockholdersEquityRollForward |
| Namespace Prefix: |
us-gaap_ |
| Data Type: |
xbrli:stringItemType |
| Balance Type: |
na |
| Period Type: |
duration |
|
| X |
- DefinitionThe portion of profit or loss for the period, net of income taxes, which is attributable to the parent. Reference 1: http://www.xbrl.org/2003/role/disclosureRef
-Topic 250
-SubTopic 10
-Name Accounting Standards Codification
-Section 50
-Paragraph 6
-Publisher FASB
-URI https://asc.fasb.org/1943274/2147483443/250-10-50-6
Reference 2: http://www.xbrl.org/2003/role/disclosureRef
-Topic 250
-SubTopic 10
-Name Accounting Standards Codification
-Section 50
-Paragraph 9
-Publisher FASB
-URI https://asc.fasb.org/1943274/2147483443/250-10-50-9
Reference 3: http://www.xbrl.org/2003/role/disclosureRef
-Topic 805
-SubTopic 60
-Name Accounting Standards Codification
-Section 65
-Paragraph 1
-Subparagraph (g)
-Publisher FASB
-URI https://asc.fasb.org/1943274/2147476176/805-60-65-1
Reference 4: http://www.xbrl.org/2003/role/disclosureRef
-Topic 740
-SubTopic 323
-Name Accounting Standards Codification
-Section 65
-Paragraph 2
-Subparagraph (g)(3)
-Publisher FASB
-URI https://asc.fasb.org/1943274/2147478666/740-323-65-2
Reference 5: http://fasb.org/us-gaap/role/ref/legacyRef
-Topic 220
-SubTopic 10
-Name Accounting Standards Codification
-Section S99
-Paragraph 2
-Subparagraph (SX 210.5-03(20))
-Publisher FASB
-URI https://asc.fasb.org/1943274/2147483621/220-10-S99-2
Reference 6: http://www.xbrl.org/2003/role/disclosureRef
-Topic 235
-SubTopic 10
-Name Accounting Standards Codification
-Section S99
-Paragraph 1
-Subparagraph (SX 210.4-08(g)(1)(ii))
-Publisher FASB
-URI https://asc.fasb.org/1943274/2147480678/235-10-S99-1
Reference 7: http://www.xbrl.org/2003/role/disclosureRef
-Topic 323
-SubTopic 10
-Name Accounting Standards Codification
-Section 50
-Paragraph 3
-Subparagraph (c)
-Publisher FASB
-URI https://asc.fasb.org/1943274/2147481687/323-10-50-3
Reference 8: http://www.xbrl.org/2003/role/disclosureRef
-Topic 825
-SubTopic 10
-Name Accounting Standards Codification
-Section 50
-Paragraph 28
-Subparagraph (f)
-Publisher FASB
-URI https://asc.fasb.org/1943274/2147482907/825-10-50-28
Reference 9: http://www.xbrl.org/2003/role/disclosureRef
-Topic 220
-SubTopic 10
-Name Accounting Standards Codification
-Section 50
-Paragraph 6
-Publisher FASB
-URI https://asc.fasb.org/1943274/2147482765/220-10-50-6
Reference 10: http://www.xbrl.org/2003/role/disclosureRef
-Topic 250
-SubTopic 10
-Name Accounting Standards Codification
-Section 50
-Paragraph 3
-Publisher FASB
-URI https://asc.fasb.org/1943274/2147483443/250-10-50-3
Reference 11: http://www.xbrl.org/2003/role/disclosureRef
-Topic 250
-SubTopic 10
-Name Accounting Standards Codification
-Section 50
-Paragraph 1
-Subparagraph (b)(2)
-Publisher FASB
-URI https://asc.fasb.org/1943274/2147483443/250-10-50-1
Reference 12: http://www.xbrl.org/2003/role/disclosureRef
-Topic 815
-SubTopic 40
-Name Accounting Standards Codification
-Section 65
-Paragraph 1
-Subparagraph (f)
-Publisher FASB
-URI https://asc.fasb.org/1943274/2147480175/815-40-65-1
Reference 13: http://www.xbrl.org/2003/role/disclosureRef
-Topic 250
-SubTopic 10
-Name Accounting Standards Codification
-Section 50
-Paragraph 8
-Publisher FASB
-URI https://asc.fasb.org/1943274/2147483443/250-10-50-8
Reference 14: http://www.xbrl.org/2003/role/disclosureRef
-Topic 250
-SubTopic 10
-Name Accounting Standards Codification
-Section 50
-Paragraph 11
-Subparagraph (a)
-Publisher FASB
-URI https://asc.fasb.org/1943274/2147483443/250-10-50-11
Reference 15: http://www.xbrl.org/2003/role/disclosureRef
-Topic 250
-SubTopic 10
-Name Accounting Standards Codification
-Section 50
-Paragraph 11
-Subparagraph (b)
-Publisher FASB
-URI https://asc.fasb.org/1943274/2147483443/250-10-50-11
Reference 16: http://www.xbrl.org/2003/role/disclosureRef
-Topic 250
-SubTopic 10
-Name Accounting Standards Codification
-Section 50
-Paragraph 4
-Publisher FASB
-URI https://asc.fasb.org/1943274/2147483443/250-10-50-4
Reference 17: http://www.xbrl.org/2003/role/exampleRef
-Topic 946
-SubTopic 830
-Name Accounting Standards Codification
-Section 55
-Paragraph 10
-Publisher FASB
-URI https://asc.fasb.org/1943274/2147479168/946-830-55-10
Reference 18: http://www.xbrl.org/2003/role/disclosureRef
-Topic 946
-SubTopic 220
-Name Accounting Standards Codification
-Section 45
-Paragraph 7
-Publisher FASB
-URI https://asc.fasb.org/1943274/2147479105/946-220-45-7
Reference 19: http://www.xbrl.org/2003/role/disclosureRef
-Topic 944
-SubTopic 220
-Name Accounting Standards Codification
-Section S99
-Paragraph 1
-Subparagraph (SX 210.7-04(18))
-Publisher FASB
-URI https://asc.fasb.org/1943274/2147477250/944-220-S99-1
Reference 20: http://www.xbrl.org/2003/role/disclosureRef
-Topic 946
-SubTopic 220
-Name Accounting Standards Codification
-Section S99
-Paragraph 1
-Subparagraph (SX 210.6-07(9))
-Publisher FASB
-URI https://asc.fasb.org/1943274/2147479134/946-220-S99-1
Reference 21: http://www.xbrl.org/2003/role/disclosureRef
-Topic 946
-SubTopic 220
-Name Accounting Standards Codification
-Section S99
-Paragraph 3
-Subparagraph (SX 210.6-09(1)(d))
-Publisher FASB
-URI https://asc.fasb.org/1943274/2147479134/946-220-S99-3
Reference 22: http://www.xbrl.org/2003/role/disclosureRef
-Topic 470
-SubTopic 10
-Name Accounting Standards Codification
-Section S99
-Paragraph 1A
-Subparagraph (SX 210.13-01(a)(4)(i))
-Publisher FASB
-URI https://asc.fasb.org/1943274/2147480097/470-10-S99-1A
Reference 23: http://www.xbrl.org/2009/role/commonPracticeRef
-Topic 470
-SubTopic 10
-Name Accounting Standards Codification
-Section S99
-Paragraph 1A
-Subparagraph (SX 210.13-01(a)(4)(ii))
-Publisher FASB
-URI https://asc.fasb.org/1943274/2147480097/470-10-S99-1A
Reference 24: http://www.xbrl.org/2003/role/disclosureRef
-Topic 470
-SubTopic 10
-Name Accounting Standards Codification
-Section S99
-Paragraph 1A
-Subparagraph (SX 210.13-01(a)(4)(iii)(A))
-Publisher FASB
-URI https://asc.fasb.org/1943274/2147480097/470-10-S99-1A
Reference 25: http://www.xbrl.org/2003/role/disclosureRef
-Topic 470
-SubTopic 10
-Name Accounting Standards Codification
-Section S99
-Paragraph 1A
-Subparagraph (SX 210.13-01(a)(4)(iv))
-Publisher FASB
-URI https://asc.fasb.org/1943274/2147480097/470-10-S99-1A
Reference 26: http://www.xbrl.org/2003/role/disclosureRef
-Topic 470
-SubTopic 10
-Name Accounting Standards Codification
-Section S99
-Paragraph 1A
-Subparagraph (SX 210.13-01(a)(5))
-Publisher FASB
-URI https://asc.fasb.org/1943274/2147480097/470-10-S99-1A
Reference 27: http://www.xbrl.org/2003/role/disclosureRef
-Topic 470
-SubTopic 10
-Name Accounting Standards Codification
-Section S99
-Paragraph 1B
-Subparagraph (SX 210.13-02(a)(4)(i))
-Publisher FASB
-URI https://asc.fasb.org/1943274/2147480097/470-10-S99-1B
Reference 28: http://www.xbrl.org/2003/role/disclosureRef
-Topic 470
-SubTopic 10
-Name Accounting Standards Codification
-Section S99
-Paragraph 1B
-Subparagraph (SX 210.13-02(a)(4)(iii)(A))
-Publisher FASB
-URI https://asc.fasb.org/1943274/2147480097/470-10-S99-1B
Reference 29: http://www.xbrl.org/2003/role/disclosureRef
-Topic 470
-SubTopic 10
-Name Accounting Standards Codification
-Section S99
-Paragraph 1B
-Subparagraph (SX 210.13-02(a)(4)(iii)(B))
-Publisher FASB
-URI https://asc.fasb.org/1943274/2147480097/470-10-S99-1B
Reference 30: http://www.xbrl.org/2003/role/disclosureRef
-Topic 470
-SubTopic 10
-Name Accounting Standards Codification
-Section S99
-Paragraph 1B
-Subparagraph (SX 210.13-02(a)(4)(iv))
-Publisher FASB
-URI https://asc.fasb.org/1943274/2147480097/470-10-S99-1B
Reference 31: http://www.xbrl.org/2003/role/disclosureRef
-Topic 470
-SubTopic 10
-Name Accounting Standards Codification
-Section S99
-Paragraph 1B
-Subparagraph (SX 210.13-02(a)(5))
-Publisher FASB
-URI https://asc.fasb.org/1943274/2147480097/470-10-S99-1B
Reference 32: http://www.xbrl.org/2003/role/disclosureRef
-Topic 260
-SubTopic 10
-Name Accounting Standards Codification
-Section 45
-Paragraph 60B
-Subparagraph (a)
-Publisher FASB
-URI https://asc.fasb.org/1943274/2147482689/260-10-45-60B
Reference 33: http://www.xbrl.org/2003/role/disclosureRef
-Topic 205
-SubTopic 20
-Name Accounting Standards Codification
-Section 50
-Paragraph 7
-Publisher FASB
-URI https://asc.fasb.org/1943274/2147483499/205-20-50-7
Reference 34: http://fasb.org/us-gaap/role/ref/legacyRef
-Topic 230
-SubTopic 10
-Name Accounting Standards Codification
-Section 45
-Paragraph 28
-Publisher FASB
-URI https://asc.fasb.org/1943274/2147482740/230-10-45-28
Reference 35: http://www.xbrl.org/2003/role/disclosureRef
-Topic 220
-SubTopic 10
-Name Accounting Standards Codification
-Section 45
-Paragraph 1A
-Subparagraph (a)
-Publisher FASB
-URI https://asc.fasb.org/1943274/2147482790/220-10-45-1A
Reference 36: http://www.xbrl.org/2003/role/disclosureRef
-Topic 220
-SubTopic 10
-Name Accounting Standards Codification
-Section 45
-Paragraph 1B
-Subparagraph (a)
-Publisher FASB
-URI https://asc.fasb.org/1943274/2147482790/220-10-45-1B
Reference 37: http://fasb.org/us-gaap/role/ref/legacyRef
-Topic 942
-SubTopic 220
-Name Accounting Standards Codification
-Section S99
-Paragraph 1
-Subparagraph (SX 210.9-04(22))
-Publisher FASB
-URI https://asc.fasb.org/1943274/2147478524/942-220-S99-1
| Name: |
us-gaap_NetIncomeLoss |
| Namespace Prefix: |
us-gaap_ |
| Data Type: |
xbrli:monetaryItemType |
| Balance Type: |
credit |
| Period Type: |
duration |
|
| X |
- DefinitionAmount after tax of other comprehensive income (loss) attributable to parent entity. Reference 1: http://fasb.org/us-gaap/role/ref/legacyRef
-Topic 810
-SubTopic 10
-Name Accounting Standards Codification
-Section 45
-Paragraph 19
-Publisher FASB
-URI https://asc.fasb.org/1943274/2147481231/810-10-45-19
Reference 2: http://fasb.org/us-gaap/role/ref/legacyRef
-Name Accounting Standards Codification
-Section 45
-Paragraph 20
-SubTopic 10
-Topic 810
-Publisher FASB
-URI https://asc.fasb.org/1943274/2147481231/810-10-45-20
Reference 3: http://fasb.org/us-gaap/role/ref/legacyRef
-Name Accounting Standards Codification
-Section 50
-Paragraph 1A
-Subparagraph (c)(3)
-SubTopic 10
-Topic 810
-Publisher FASB
-URI https://asc.fasb.org/1943274/2147481203/810-10-50-1A
Reference 4: http://www.xbrl.org/2003/role/disclosureRef
-Topic 250
-SubTopic 10
-Name Accounting Standards Codification
-Section 50
-Paragraph 6
-Publisher FASB
-URI https://asc.fasb.org/1943274/2147483443/250-10-50-6
Reference 5: http://www.xbrl.org/2003/role/disclosureRef
-Topic 220
-SubTopic 10
-Name Accounting Standards Codification
-Section 45
-Paragraph 1B
-Subparagraph (b)
-Publisher FASB
-URI https://asc.fasb.org/1943274/2147482790/220-10-45-1B
Reference 6: http://www.xbrl.org/2003/role/disclosureRef
-Topic 220
-SubTopic 10
-Name Accounting Standards Codification
-Section 45
-Paragraph 1A
-Subparagraph (b)
-Publisher FASB
-URI https://asc.fasb.org/1943274/2147482790/220-10-45-1A
| Name: |
us-gaap_OtherComprehensiveIncomeLossNetOfTaxPortionAttributableToParent |
| Namespace Prefix: |
us-gaap_ |
| Data Type: |
xbrli:monetaryItemType |
| Balance Type: |
credit |
| Period Type: |
duration |
|
| X |
- DefinitionNumber of shares issued during the period as a result of an employee stock purchase plan. Reference 1: http://fasb.org/us-gaap/role/ref/legacyRef
-Name Accounting Standards Codification
-Section 50
-Paragraph 2
-SubTopic 10
-Topic 505
-Publisher FASB
-URI https://asc.fasb.org/1943274/2147481112/505-10-50-2
Reference 2: http://fasb.org/us-gaap/role/ref/legacyRef
-Topic 210
-SubTopic 10
-Name Accounting Standards Codification
-Section S99
-Paragraph 1
-Subparagraph (SX 210.5-02(28))
-Publisher FASB
-URI https://asc.fasb.org/1943274/2147480566/210-10-S99-1
Reference 3: http://fasb.org/us-gaap/role/ref/legacyRef
-Topic 210
-SubTopic 10
-Name Accounting Standards Codification
-Section S99
-Paragraph 1
-Subparagraph (SX 210.5-02(29))
-Publisher FASB
-URI https://asc.fasb.org/1943274/2147480566/210-10-S99-1
Reference 4: http://fasb.org/us-gaap/role/ref/legacyRef
-Topic 505
-SubTopic 10
-Name Accounting Standards Codification
-Section S99
-Paragraph 1
-Subparagraph (SX 210.3-04)
-Publisher FASB
-URI https://asc.fasb.org/1943274/2147480008/505-10-S99-1
| Name: |
us-gaap_StockIssuedDuringPeriodSharesEmployeeStockPurchasePlans |
| Namespace Prefix: |
us-gaap_ |
| Data Type: |
xbrli:sharesItemType |
| Balance Type: |
na |
| Period Type: |
duration |
|
| X |
- DefinitionNumber, after forfeiture, of shares or units issued under share-based payment arrangement. Excludes shares or units issued under employee stock ownership plan (ESOP). Reference 1: http://fasb.org/us-gaap/role/ref/legacyRef
-Name Accounting Standards Codification
-Section 50
-Paragraph 2
-SubTopic 10
-Topic 505
-Publisher FASB
-URI https://asc.fasb.org/1943274/2147481112/505-10-50-2
Reference 2: http://fasb.org/us-gaap/role/ref/legacyRef
-Topic 210
-SubTopic 10
-Name Accounting Standards Codification
-Section S99
-Paragraph 1
-Subparagraph (SX 210.5-02(28))
-Publisher FASB
-URI https://asc.fasb.org/1943274/2147480566/210-10-S99-1
Reference 3: http://fasb.org/us-gaap/role/ref/legacyRef
-Topic 210
-SubTopic 10
-Name Accounting Standards Codification
-Section S99
-Paragraph 1
-Subparagraph (SX 210.5-02(29))
-Publisher FASB
-URI https://asc.fasb.org/1943274/2147480566/210-10-S99-1
Reference 4: http://fasb.org/us-gaap/role/ref/legacyRef
-Topic 505
-SubTopic 10
-Name Accounting Standards Codification
-Section S99
-Paragraph 1
-Subparagraph (SX 210.3-04)
-Publisher FASB
-URI https://asc.fasb.org/1943274/2147480008/505-10-S99-1
| Name: |
us-gaap_StockIssuedDuringPeriodSharesShareBasedCompensation |
| Namespace Prefix: |
us-gaap_ |
| Data Type: |
xbrli:sharesItemType |
| Balance Type: |
na |
| Period Type: |
duration |
|
| X |
- DefinitionAggregate change in value for stock issued during the period as a result of employee stock purchase plan. Reference 1: http://fasb.org/us-gaap/role/ref/legacyRef
-Name Accounting Standards Codification
-Section 50
-Paragraph 2
-SubTopic 10
-Topic 505
-Publisher FASB
-URI https://asc.fasb.org/1943274/2147481112/505-10-50-2
Reference 2: http://fasb.org/us-gaap/role/ref/legacyRef
-Topic 210
-SubTopic 10
-Name Accounting Standards Codification
-Section S99
-Paragraph 1
-Subparagraph (SX 210.5-02(28))
-Publisher FASB
-URI https://asc.fasb.org/1943274/2147480566/210-10-S99-1
Reference 3: http://fasb.org/us-gaap/role/ref/legacyRef
-Topic 210
-SubTopic 10
-Name Accounting Standards Codification
-Section S99
-Paragraph 1
-Subparagraph (SX 210.5-02(29))
-Publisher FASB
-URI https://asc.fasb.org/1943274/2147480566/210-10-S99-1
Reference 4: http://fasb.org/us-gaap/role/ref/legacyRef
-Topic 505
-SubTopic 10
-Name Accounting Standards Codification
-Section S99
-Paragraph 1
-Subparagraph (SX 210.3-04)
-Publisher FASB
-URI https://asc.fasb.org/1943274/2147480008/505-10-S99-1
| Name: |
us-gaap_StockIssuedDuringPeriodValueEmployeeStockPurchasePlan |
| Namespace Prefix: |
us-gaap_ |
| Data Type: |
xbrli:monetaryItemType |
| Balance Type: |
credit |
| Period Type: |
duration |
|
| X |
- DefinitionValue, after forfeiture, of shares issued under share-based payment arrangement. Excludes employee stock ownership plan (ESOP). Reference 1: http://fasb.org/us-gaap/role/ref/legacyRef
-Topic 210
-SubTopic 10
-Name Accounting Standards Codification
-Section S99
-Paragraph 1
-Subparagraph (SX 210.5-02(28))
-Publisher FASB
-URI https://asc.fasb.org/1943274/2147480566/210-10-S99-1
Reference 2: http://fasb.org/us-gaap/role/ref/legacyRef
-Topic 210
-SubTopic 10
-Name Accounting Standards Codification
-Section S99
-Paragraph 1
-Subparagraph (SX 210.5-02(29))
-Publisher FASB
-URI https://asc.fasb.org/1943274/2147480566/210-10-S99-1
Reference 3: http://fasb.org/us-gaap/role/ref/legacyRef
-Topic 505
-SubTopic 10
-Name Accounting Standards Codification
-Section S99
-Paragraph 1
-Subparagraph (SX 210.3-04)
-Publisher FASB
-URI https://asc.fasb.org/1943274/2147480008/505-10-S99-1
Reference 4: http://fasb.org/us-gaap/role/ref/legacyRef
-Name Accounting Standards Codification
-Topic 718
-SubTopic 10
-Section 50
-Paragraph 2
-Subparagraph (d)(1)
-Publisher FASB
-URI https://asc.fasb.org/1943274/2147480429/718-10-50-2
| Name: |
us-gaap_StockIssuedDuringPeriodValueShareBasedCompensation |
| Namespace Prefix: |
us-gaap_ |
| Data Type: |
xbrli:monetaryItemType |
| Balance Type: |
credit |
| Period Type: |
duration |
|
| X |
- DefinitionAmount of equity (deficit) attributable to parent. Excludes temporary equity and equity attributable to noncontrolling interest. Reference 1: http://fasb.org/us-gaap/role/ref/legacyRef
-Topic 210
-SubTopic 10
-Name Accounting Standards Codification
-Section S99
-Paragraph 1
-Subparagraph (SX 210.5-02(29))
-Publisher FASB
-URI https://asc.fasb.org/1943274/2147480566/210-10-S99-1
Reference 2: http://fasb.org/us-gaap/role/ref/legacyRef
-Topic 210
-SubTopic 10
-Name Accounting Standards Codification
-Section S99
-Paragraph 1
-Subparagraph (SX 210.5-02(30))
-Publisher FASB
-URI https://asc.fasb.org/1943274/2147480566/210-10-S99-1
Reference 3: http://fasb.org/us-gaap/role/ref/legacyRef
-Topic 210
-SubTopic 10
-Name Accounting Standards Codification
-Section S99
-Paragraph 1
-Subparagraph (SX 210.5-02(31))
-Publisher FASB
-URI https://asc.fasb.org/1943274/2147480566/210-10-S99-1
Reference 4: http://www.xbrl.org/2003/role/exampleRef
-Topic 852
-SubTopic 10
-Name Accounting Standards Codification
-Section 55
-Paragraph 10
-Publisher FASB
-URI https://asc.fasb.org/1943274/2147481372/852-10-55-10
Reference 5: http://www.xbrl.org/2003/role/exampleRef
-Topic 946
-SubTopic 830
-Name Accounting Standards Codification
-Section 55
-Paragraph 12
-Publisher FASB
-URI https://asc.fasb.org/1943274/2147479168/946-830-55-12
Reference 6: http://www.xbrl.org/2003/role/disclosureRef
-Topic 946
-SubTopic 210
-Name Accounting Standards Codification
-Section S99
-Paragraph 1
-Subparagraph (SX 210.6-04(19))
-Publisher FASB
-URI https://asc.fasb.org/1943274/2147479170/946-210-S99-1
Reference 7: http://www.xbrl.org/2003/role/disclosureRef
-Topic 946
-SubTopic 210
-Name Accounting Standards Codification
-Section S99
-Paragraph 2
-Subparagraph (SX 210.6-05(4))
-Publisher FASB
-URI https://asc.fasb.org/1943274/2147479170/946-210-S99-2
Reference 8: http://www.xbrl.org/2009/role/commonPracticeRef
-Topic 946
-SubTopic 220
-Name Accounting Standards Codification
-Section S99
-Paragraph 3
-Subparagraph (SX 210.6-09(4)(b))
-Publisher FASB
-URI https://asc.fasb.org/1943274/2147479134/946-220-S99-3
Reference 9: http://www.xbrl.org/2003/role/disclosureRef
-Topic 946
-SubTopic 220
-Name Accounting Standards Codification
-Section S99
-Paragraph 3
-Subparagraph (SX 210.6-09(6))
-Publisher FASB
-URI https://asc.fasb.org/1943274/2147479134/946-220-S99-3
Reference 10: http://www.xbrl.org/2003/role/disclosureRef
-Topic 946
-SubTopic 220
-Name Accounting Standards Codification
-Section S99
-Paragraph 3
-Subparagraph (SX 210.6-09(7))
-Publisher FASB
-URI https://asc.fasb.org/1943274/2147479134/946-220-S99-3
Reference 11: http://www.xbrl.org/2009/role/commonPracticeRef
-Topic 235
-SubTopic 10
-Name Accounting Standards Codification
-Section S99
-Paragraph 1
-Subparagraph (SX 210.4-08(g)(1)(ii))
-Publisher FASB
-URI https://asc.fasb.org/1943274/2147480678/235-10-S99-1
Reference 12: http://www.xbrl.org/2009/role/commonPracticeRef
-Topic 323
-SubTopic 10
-Name Accounting Standards Codification
-Section 50
-Paragraph 3
-Subparagraph (c)
-Publisher FASB
-URI https://asc.fasb.org/1943274/2147481687/323-10-50-3
Reference 13: http://www.xbrl.org/2009/role/commonPracticeRef
-Topic 825
-SubTopic 10
-Name Accounting Standards Codification
-Section 50
-Paragraph 28
-Subparagraph (f)
-Publisher FASB
-URI https://asc.fasb.org/1943274/2147482907/825-10-50-28
Reference 14: http://fasb.org/us-gaap/role/ref/legacyRef
-Topic 310
-SubTopic 10
-Name Accounting Standards Codification
-Section S99
-Paragraph 2
-Subparagraph (SAB Topic 4.E)
-Publisher FASB
-URI https://asc.fasb.org/1943274/2147480418/310-10-S99-2
| Name: |
us-gaap_StockholdersEquity |
| Namespace Prefix: |
us-gaap_ |
| Data Type: |
xbrli:monetaryItemType |
| Balance Type: |
credit |
| Period Type: |
instant |
|
v3.24.2
| X |
- DefinitionAggregate dividends declared during the period for each share of common stock outstanding. Reference 1: http://fasb.org/us-gaap/role/ref/legacyRef
-Topic 505
-SubTopic 10
-Name Accounting Standards Codification
-Section S99
-Paragraph 1
-Subparagraph (SX 210.3-04)
-Publisher FASB
-URI https://asc.fasb.org/1943274/2147480008/505-10-S99-1
| Name: |
us-gaap_CommonStockDividendsPerShareDeclared |
| Namespace Prefix: |
us-gaap_ |
| Data Type: |
dtr-types:perShareItemType |
| Balance Type: |
na |
| Period Type: |
duration |
|
| X |
- References
+ Details
| Name: |
us-gaap_StatementOfStockholdersEquityAbstract |
| Namespace Prefix: |
us-gaap_ |
| Data Type: |
xbrli:stringItemType |
| Balance Type: |
na |
| Period Type: |
duration |
|
v3.24.2
UNAUDITED CONDENSED CONSOLIDATED STATEMENTS OF CASH FLOWS - USD ($)
$ in Thousands |
3 Months Ended |
6 Months Ended |
Jun. 30, 2024 |
Jun. 30, 2023 |
Jun. 30, 2024 |
Jun. 30, 2023 |
| Operating activities |
|
|
|
|
| Net (loss) |
$ 6,613
|
$ (46,804)
|
$ (5,511)
|
$ (67,578)
|
| Adjustments to reconcile net (loss) to cash provided by operating activities |
|
|
|
|
| Stock-based compensation |
36,224
|
36,227
|
71,005
|
78,784
|
| Amortization of deferred commissions |
14,994
|
14,750
|
32,276
|
29,027
|
| Amortization of intangible assets and depreciation |
|
|
8,812
|
9,553
|
| Lease expense |
|
|
7,844
|
8,186
|
| Foreign currency transaction loss |
(437)
|
3,290
|
2,825
|
5,965
|
| (Gain) on capped call transactions |
3,277
|
1,361
|
(22)
|
(1,845)
|
| Deferred income taxes |
|
|
232
|
(136)
|
| (Gain) on investments |
|
|
(1,628)
|
(4,430)
|
| (Gain) on repurchases of convertible senior notes |
|
|
0
|
(7,855)
|
| Other non-cash |
|
|
(5,056)
|
2,122
|
| Change in operating assets and liabilities, net |
|
|
109,466
|
61,959
|
| Cash provided by operating activities |
|
|
220,243
|
113,752
|
| Investing activities |
|
|
|
|
| Purchases of investments |
|
|
(291,810)
|
(69,662)
|
| Proceeds from maturities and called investments |
|
|
83,967
|
88,849
|
| Sales of investments |
|
|
0
|
10,725
|
| Investment in property and equipment |
|
|
(1,857)
|
(13,933)
|
| Cash (used in) provided by investing activities |
|
|
(209,700)
|
15,979
|
| Financing activities |
|
|
|
|
| Repurchases of convertible senior notes |
|
|
0
|
(88,989)
|
| Dividend payments to stockholders |
|
|
(5,065)
|
(4,962)
|
| Proceeds from employee stock plans |
|
|
29,928
|
8,044
|
| Common stock repurchases for tax withholdings for net settlement of equity awards |
|
|
(2,360)
|
(1,422)
|
| Other |
|
|
0
|
341
|
| Cash provided by (used in) financing activities |
|
|
22,503
|
(86,988)
|
| Effect of exchange rate changes on cash, cash equivalents, and restricted cash |
|
|
(2,842)
|
1,010
|
| Net increase in cash, cash equivalents, and restricted cash |
|
|
30,204
|
43,753
|
| Cash, cash equivalents, and restricted cash, beginning of period |
|
|
232,827
|
145,054
|
| Cash, cash equivalents, and restricted cash, end of period |
263,031
|
188,807
|
263,031
|
188,807
|
| Cash, Cash Equivalents, Restricted Cash, and Restricted Cash Equivalents [Abstract] |
|
|
|
|
| Cash and cash equivalents |
258,257
|
186,874
|
258,257
|
186,874
|
| Restricted cash included in other current assets |
768
|
|
768
|
|
| Restricted cash included in other long-term assets |
4,006
|
1,933
|
4,006
|
1,933
|
| Total cash, cash equivalents, and restricted cash |
$ 263,031
|
$ 188,807
|
$ 263,031
|
$ 188,807
|
| X |
- References
+ Details
| Name: |
us-gaap_AdjustmentsToReconcileNetIncomeLossToCashProvidedByUsedInOperatingActivitiesAbstract |
| Namespace Prefix: |
us-gaap_ |
| Data Type: |
xbrli:stringItemType |
| Balance Type: |
na |
| Period Type: |
duration |
|
| X |
- DefinitionThe amount of expense recognized in the current period for the periodic realization of capitalized fees that were paid to salespeople, distributors, brokers, and agents at the time of the conclusion of the sale. As a noncash expense, this element is added back to net income when calculating cash provided by or used in operations using the indirect method. Reference 1: http://fasb.org/us-gaap/role/ref/legacyRef
-Name Accounting Standards Codification
-Section 45
-Paragraph 28
-Subparagraph (b)
-SubTopic 10
-Topic 230
-Publisher FASB
-URI https://asc.fasb.org/1943274/2147482740/230-10-45-28
Reference 2: http://fasb.org/us-gaap/role/ref/legacyRef
-Topic 220
-SubTopic 10
-Name Accounting Standards Codification
-Section S99
-Paragraph 2
-Subparagraph (SX 210.5-03(3))
-Publisher FASB
-URI https://asc.fasb.org/1943274/2147483621/220-10-S99-2
| Name: |
us-gaap_AmortizationOfDeferredSalesCommissions |
| Namespace Prefix: |
us-gaap_ |
| Data Type: |
xbrli:monetaryItemType |
| Balance Type: |
debit |
| Period Type: |
duration |
|
| X |
- DefinitionAmount of currency on hand as well as demand deposits with banks or financial institutions. Includes other kinds of accounts that have the general characteristics of demand deposits. Also includes short-term, highly liquid investments that are both readily convertible to known amounts of cash and so near their maturity that they present insignificant risk of changes in value because of changes in interest rates. Excludes cash and cash equivalents within disposal group and discontinued operation. Reference 1: http://www.xbrl.org/2003/role/disclosureRef
-Topic 210
-SubTopic 10
-Name Accounting Standards Codification
-Section S99
-Paragraph 1
-Subparagraph (SX 210.5-02(1))
-Publisher FASB
-URI https://asc.fasb.org/1943274/2147480566/210-10-S99-1
Reference 2: http://www.xbrl.org/2003/role/exampleRef
-Topic 210
-SubTopic 10
-Name Accounting Standards Codification
-Section 45
-Paragraph 1
-Subparagraph (a)
-Publisher FASB
-URI https://asc.fasb.org/1943274/2147483467/210-10-45-1
Reference 3: http://fasb.org/us-gaap/role/ref/legacyRef
-Name Accounting Standards Codification
-Topic 230
-SubTopic 10
-Section 45
-Paragraph 4
-Publisher FASB
-URI https://asc.fasb.org/1943274/2147482740/230-10-45-4
| Name: |
us-gaap_CashAndCashEquivalentsAtCarryingValue |
| Namespace Prefix: |
us-gaap_ |
| Data Type: |
xbrli:monetaryItemType |
| Balance Type: |
debit |
| Period Type: |
instant |
|
| X |
- DefinitionAmount of cash and cash equivalents, and cash and cash equivalents restricted to withdrawal or usage. Excludes amount for disposal group and discontinued operations. Cash includes, but is not limited to, currency on hand, demand deposits with banks or financial institutions, and other accounts with general characteristics of demand deposits. Cash equivalents include, but are not limited to, short-term, highly liquid investments that are both readily convertible to known amounts of cash and so near their maturity that they present insignificant risk of changes in value because of changes in interest rates. Reference 1: http://www.xbrl.org/2003/role/disclosureRef
-Topic 230
-SubTopic 10
-Name Accounting Standards Codification
-Section 50
-Paragraph 8
-Publisher FASB
-URI https://asc.fasb.org/1943274/2147482913/230-10-50-8
Reference 2: http://fasb.org/us-gaap/role/ref/legacyRef
-Topic 230
-SubTopic 10
-Name Accounting Standards Codification
-Section 45
-Paragraph 24
-Publisher FASB
-URI https://asc.fasb.org/1943274/2147482740/230-10-45-24
Reference 3: http://fasb.org/us-gaap/role/ref/legacyRef
-Name Accounting Standards Codification
-Topic 230
-SubTopic 10
-Section 45
-Paragraph 4
-Publisher FASB
-URI https://asc.fasb.org/1943274/2147482740/230-10-45-4
| Name: |
us-gaap_CashCashEquivalentsRestrictedCashAndRestrictedCashEquivalents |
| Namespace Prefix: |
us-gaap_ |
| Data Type: |
xbrli:monetaryItemType |
| Balance Type: |
debit |
| Period Type: |
instant |
|
| X |
- References
+ Details
| Name: |
us-gaap_CashCashEquivalentsRestrictedCashAndRestrictedCashEquivalentsAbstract |
| Namespace Prefix: |
us-gaap_ |
| Data Type: |
xbrli:stringItemType |
| Balance Type: |
na |
| Period Type: |
duration |
|
| X |
- DefinitionAmount of increase (decrease) in cash, cash equivalents, and cash and cash equivalents restricted to withdrawal or usage; including effect from exchange rate change. Cash includes, but is not limited to, currency on hand, demand deposits with banks or financial institutions, and other accounts with general characteristics of demand deposits. Cash equivalents include, but are not limited to, short-term, highly liquid investments that are both readily convertible to known amounts of cash and so near their maturity that they present insignificant risk of changes in value because of changes in interest rates. Reference 1: http://fasb.org/us-gaap/role/ref/legacyRef
-Topic 230
-SubTopic 10
-Name Accounting Standards Codification
-Section 45
-Paragraph 24
-Publisher FASB
-URI https://asc.fasb.org/1943274/2147482740/230-10-45-24
Reference 2: http://fasb.org/us-gaap/role/ref/legacyRef
-Name Accounting Standards Codification
-Section 45
-Paragraph 1
-SubTopic 230
-Topic 830
-Publisher FASB
-URI https://asc.fasb.org/1943274/2147477401/830-230-45-1
| Name: |
us-gaap_CashCashEquivalentsRestrictedCashAndRestrictedCashEquivalentsPeriodIncreaseDecreaseIncludingExchangeRateEffect |
| Namespace Prefix: |
us-gaap_ |
| Data Type: |
xbrli:monetaryItemType |
| Balance Type: |
debit |
| Period Type: |
duration |
|
| X |
- DefinitionThe aggregate expense recognized in the current period that allocates the cost of tangible assets, intangible assets, or depleting assets to periods that benefit from use of the assets. Reference 1: http://fasb.org/us-gaap/role/ref/legacyRef
-Name Accounting Standards Codification
-Section 45
-Paragraph 28
-Subparagraph (b)
-SubTopic 10
-Topic 230
-Publisher FASB
-URI https://asc.fasb.org/1943274/2147482740/230-10-45-28
Reference 2: http://www.xbrl.org/2003/role/exampleRef
-Topic 280
-SubTopic 10
-Name Accounting Standards Codification
-Section 55
-Paragraph 48
-Publisher FASB
-URI https://asc.fasb.org/1943274/2147482785/280-10-55-48
Reference 3: http://www.xbrl.org/2003/role/exampleRef
-Topic 280
-SubTopic 10
-Name Accounting Standards Codification
-Section 55
-Paragraph 49
-Publisher FASB
-URI https://asc.fasb.org/1943274/2147482785/280-10-55-49
Reference 4: http://www.xbrl.org/2003/role/disclosureRef
-Topic 270
-SubTopic 10
-Name Accounting Standards Codification
-Section 50
-Paragraph 1
-Subparagraph (i)
-Publisher FASB
-URI https://asc.fasb.org/1943274/2147482964/270-10-50-1
Reference 5: http://www.xbrl.org/2003/role/disclosureRef
-Topic 280
-SubTopic 10
-Name Accounting Standards Codification
-Section 50
-Paragraph 32
-Subparagraph (ee)
-Publisher FASB
-URI https://asc.fasb.org/1943274/2147482810/280-10-50-32
Reference 6: http://www.xbrl.org/2003/role/disclosureRef
-Topic 280
-SubTopic 10
-Name Accounting Standards Codification
-Section 50
-Paragraph 22
-Subparagraph (e)
-Publisher FASB
-URI https://asc.fasb.org/1943274/2147482810/280-10-50-22
| Name: |
us-gaap_DepreciationDepletionAndAmortization |
| Namespace Prefix: |
us-gaap_ |
| Data Type: |
xbrli:monetaryItemType |
| Balance Type: |
debit |
| Period Type: |
duration |
|
| X |
- DefinitionAmount of increase (decrease) from effect of exchange rate changes on cash and cash equivalents, and cash and cash equivalents restricted to withdrawal or usage; held in foreign currencies. Excludes amounts for disposal group and discontinued operations. Cash includes, but is not limited to, currency on hand, demand deposits with banks or financial institutions, and other accounts with general characteristics of demand deposits. Cash equivalents include, but are not limited to, short-term, highly liquid investments that are both readily convertible to known amounts of cash and so near their maturity that they present insignificant risk of changes in value because of changes in interest rates. Reference 1: http://www.xbrl.org/2003/role/disclosureRef
-Topic 830
-SubTopic 230
-Name Accounting Standards Codification
-Section 45
-Paragraph 1
-Publisher FASB
-URI https://asc.fasb.org/1943274/2147477401/830-230-45-1
| Name: |
us-gaap_EffectOfExchangeRateOnCashCashEquivalentsRestrictedCashAndRestrictedCashEquivalents |
| Namespace Prefix: |
us-gaap_ |
| Data Type: |
xbrli:monetaryItemType |
| Balance Type: |
debit |
| Period Type: |
duration |
|
| X |
- DefinitionAmount, before tax, of realized and unrealized gain (loss) from foreign currency transaction. Reference 1: http://www.xbrl.org/2003/role/disclosureRef
-Topic 946
-SubTopic 220
-Name Accounting Standards Codification
-Section S99
-Paragraph 1
-Subparagraph (SX 210.6-07(7))
-Publisher FASB
-URI https://asc.fasb.org/1943274/2147479134/946-220-S99-1
Reference 2: http://www.xbrl.org/2003/role/disclosureRef
-Topic 830
-SubTopic 20
-Name Accounting Standards Codification
-Section 35
-Paragraph 1
-Publisher FASB
-URI https://asc.fasb.org/1943274/2147482014/830-20-35-1
Reference 3: http://www.xbrl.org/2003/role/disclosureRef
-Topic 830
-SubTopic 20
-Name Accounting Standards Codification
-Section 45
-Paragraph 1
-Publisher FASB
-URI https://asc.fasb.org/1943274/2147481956/830-20-45-1
Reference 4: http://www.xbrl.org/2003/role/disclosureRef
-Topic 830
-SubTopic 20
-Name Accounting Standards Codification
-Section 50
-Paragraph 1
-Publisher FASB
-URI https://asc.fasb.org/1943274/2147481926/830-20-50-1
Reference 5: http://www.xbrl.org/2003/role/disclosureRef
-Topic 830
-SubTopic 10
-Name Accounting Standards Codification
-Section 45
-Paragraph 17
-Publisher FASB
-URI https://asc.fasb.org/1943274/2147481839/830-10-45-17
| Name: |
us-gaap_ForeignCurrencyTransactionGainLossBeforeTax |
| Namespace Prefix: |
us-gaap_ |
| Data Type: |
xbrli:monetaryItemType |
| Balance Type: |
credit |
| Period Type: |
duration |
|
| X |
- DefinitionAggregate net gain (loss) on all derivative instruments recognized in earnings during the period, before tax effects. Reference 1: http://fasb.org/us-gaap/role/ref/legacyRef
-Name Accounting Standards Codification
-Topic 815
-SubTopic 10
-Section 50
-Paragraph 4A
-Subparagraph (b)
-Publisher FASB
-URI https://asc.fasb.org/1943274/2147480434/815-10-50-4A
| Name: |
us-gaap_GainLossOnDerivativeInstrumentsNetPretax |
| Namespace Prefix: |
us-gaap_ |
| Data Type: |
xbrli:monetaryItemType |
| Balance Type: |
credit |
| Period Type: |
duration |
|
| X |
- DefinitionAmount of realized and unrealized gain (loss) on investment. Reference 1: http://fasb.org/us-gaap/role/ref/legacyRef
-Topic 220
-SubTopic 10
-Name Accounting Standards Codification
-Section S99
-Paragraph 2
-Subparagraph (SX 210.5-03(9)(a))
-Publisher FASB
-URI https://asc.fasb.org/1943274/2147483621/220-10-S99-2
Reference 2: http://fasb.org/us-gaap/role/ref/legacyRef
-Topic 220
-SubTopic 10
-Name Accounting Standards Codification
-Section S99
-Paragraph 2
-Subparagraph (SX 210.5-03(7)(c))
-Publisher FASB
-URI https://asc.fasb.org/1943274/2147483621/220-10-S99-2
Reference 3: http://www.xbrl.org/2003/role/recommendedDisclosureRef
-Topic 230
-SubTopic 10
-Name Accounting Standards Codification
-Section 45
-Paragraph 28
-Subparagraph (b)
-Publisher FASB
-URI https://asc.fasb.org/1943274/2147482740/230-10-45-28
| Name: |
us-gaap_GainLossOnInvestments |
| Namespace Prefix: |
us-gaap_ |
| Data Type: |
xbrli:monetaryItemType |
| Balance Type: |
credit |
| Period Type: |
duration |
|
| X |
- DefinitionDifference between the fair value of payments made and the carrying amount of debt which is extinguished prior to maturity. Reference 1: http://fasb.org/us-gaap/role/ref/legacyRef
-Name Accounting Standards Codification
-Section 45
-Paragraph 28
-Subparagraph (b)
-SubTopic 10
-Topic 230
-Publisher FASB
-URI https://asc.fasb.org/1943274/2147482740/230-10-45-28
Reference 2: http://fasb.org/us-gaap/role/ref/legacyRef
-Name Accounting Standards Codification
-Topic 470
-SubTopic 50
-Section 40
-Paragraph 2
-Publisher FASB
-URI https://asc.fasb.org/1943274/2147481303/470-50-40-2
Reference 3: http://fasb.org/us-gaap/role/ref/legacyRef
-Name Accounting Standards Codification
-Topic 470
-SubTopic 50
-Section 40
-Paragraph 4
-Publisher FASB
-URI https://asc.fasb.org/1943274/2147481303/470-50-40-4
| Name: |
us-gaap_GainsLossesOnExtinguishmentOfDebt |
| Namespace Prefix: |
us-gaap_ |
| Data Type: |
xbrli:monetaryItemType |
| Balance Type: |
credit |
| Period Type: |
duration |
|
| X |
- DefinitionThe increase (decrease) during the reporting period of all assets and liabilities used in operating activities. Reference 1: http://fasb.org/us-gaap/role/ref/legacyRef
-Name Accounting Standards Codification
-Section 45
-Paragraph 28
-Subparagraph (a)
-SubTopic 10
-Topic 230
-Publisher FASB
-URI https://asc.fasb.org/1943274/2147482740/230-10-45-28
| Name: |
us-gaap_IncreaseDecreaseInOperatingCapital |
| Namespace Prefix: |
us-gaap_ |
| Data Type: |
xbrli:monetaryItemType |
| Balance Type: |
credit |
| Period Type: |
duration |
|
| X |
- DefinitionAmount of cash inflow (outflow) from financing activities, including discontinued operations. Financing activity cash flows include obtaining resources from owners and providing them with a return on, and a return of, their investment; borrowing money and repaying amounts borrowed, or settling the obligation; and obtaining and paying for other resources obtained from creditors on long-term credit. Reference 1: http://www.xbrl.org/2003/role/disclosureRef
-Topic 230
-SubTopic 10
-Name Accounting Standards Codification
-Section 45
-Paragraph 24
-Publisher FASB
-URI https://asc.fasb.org/1943274/2147482740/230-10-45-24
| Name: |
us-gaap_NetCashProvidedByUsedInFinancingActivities |
| Namespace Prefix: |
us-gaap_ |
| Data Type: |
xbrli:monetaryItemType |
| Balance Type: |
debit |
| Period Type: |
duration |
|
| X |
- References
+ Details
| Name: |
us-gaap_NetCashProvidedByUsedInFinancingActivitiesAbstract |
| Namespace Prefix: |
us-gaap_ |
| Data Type: |
xbrli:stringItemType |
| Balance Type: |
na |
| Period Type: |
duration |
|
| X |
- DefinitionAmount of cash inflow (outflow) from investing activities, including discontinued operations. Investing activity cash flows include making and collecting loans and acquiring and disposing of debt or equity instruments and property, plant, and equipment and other productive assets. Reference 1: http://www.xbrl.org/2003/role/disclosureRef
-Topic 230
-SubTopic 10
-Name Accounting Standards Codification
-Section 45
-Paragraph 24
-Publisher FASB
-URI https://asc.fasb.org/1943274/2147482740/230-10-45-24
| Name: |
us-gaap_NetCashProvidedByUsedInInvestingActivities |
| Namespace Prefix: |
us-gaap_ |
| Data Type: |
xbrli:monetaryItemType |
| Balance Type: |
debit |
| Period Type: |
duration |
|
| X |
- References
+ Details
| Name: |
us-gaap_NetCashProvidedByUsedInInvestingActivitiesAbstract |
| Namespace Prefix: |
us-gaap_ |
| Data Type: |
xbrli:stringItemType |
| Balance Type: |
na |
| Period Type: |
duration |
|
| X |
- DefinitionAmount of cash inflow (outflow) from operating activities, including discontinued operations. Operating activity cash flows include transactions, adjustments, and changes in value not defined as investing or financing activities. Reference 1: http://fasb.org/us-gaap/role/ref/legacyRef
-Topic 230
-SubTopic 10
-Name Accounting Standards Codification
-Section 45
-Paragraph 28
-Publisher FASB
-URI https://asc.fasb.org/1943274/2147482740/230-10-45-28
Reference 2: http://fasb.org/us-gaap/role/ref/legacyRef
-Topic 230
-SubTopic 10
-Name Accounting Standards Codification
-Section 45
-Paragraph 24
-Publisher FASB
-URI https://asc.fasb.org/1943274/2147482740/230-10-45-24
Reference 3: http://fasb.org/us-gaap/role/ref/legacyRef
-Topic 230
-SubTopic 10
-Name Accounting Standards Codification
-Section 45
-Paragraph 25
-Publisher FASB
-URI https://asc.fasb.org/1943274/2147482740/230-10-45-25
| Name: |
us-gaap_NetCashProvidedByUsedInOperatingActivities |
| Namespace Prefix: |
us-gaap_ |
| Data Type: |
xbrli:monetaryItemType |
| Balance Type: |
na |
| Period Type: |
duration |
|
| X |
- References
+ Details
| Name: |
us-gaap_NetCashProvidedByUsedInOperatingActivitiesAbstract |
| Namespace Prefix: |
us-gaap_ |
| Data Type: |
xbrli:stringItemType |
| Balance Type: |
na |
| Period Type: |
duration |
|
| X |
- DefinitionThe portion of profit or loss for the period, net of income taxes, which is attributable to the parent. Reference 1: http://www.xbrl.org/2003/role/disclosureRef
-Topic 250
-SubTopic 10
-Name Accounting Standards Codification
-Section 50
-Paragraph 6
-Publisher FASB
-URI https://asc.fasb.org/1943274/2147483443/250-10-50-6
Reference 2: http://www.xbrl.org/2003/role/disclosureRef
-Topic 250
-SubTopic 10
-Name Accounting Standards Codification
-Section 50
-Paragraph 9
-Publisher FASB
-URI https://asc.fasb.org/1943274/2147483443/250-10-50-9
Reference 3: http://www.xbrl.org/2003/role/disclosureRef
-Topic 805
-SubTopic 60
-Name Accounting Standards Codification
-Section 65
-Paragraph 1
-Subparagraph (g)
-Publisher FASB
-URI https://asc.fasb.org/1943274/2147476176/805-60-65-1
Reference 4: http://www.xbrl.org/2003/role/disclosureRef
-Topic 740
-SubTopic 323
-Name Accounting Standards Codification
-Section 65
-Paragraph 2
-Subparagraph (g)(3)
-Publisher FASB
-URI https://asc.fasb.org/1943274/2147478666/740-323-65-2
Reference 5: http://fasb.org/us-gaap/role/ref/legacyRef
-Topic 220
-SubTopic 10
-Name Accounting Standards Codification
-Section S99
-Paragraph 2
-Subparagraph (SX 210.5-03(20))
-Publisher FASB
-URI https://asc.fasb.org/1943274/2147483621/220-10-S99-2
Reference 6: http://www.xbrl.org/2003/role/disclosureRef
-Topic 235
-SubTopic 10
-Name Accounting Standards Codification
-Section S99
-Paragraph 1
-Subparagraph (SX 210.4-08(g)(1)(ii))
-Publisher FASB
-URI https://asc.fasb.org/1943274/2147480678/235-10-S99-1
Reference 7: http://www.xbrl.org/2003/role/disclosureRef
-Topic 323
-SubTopic 10
-Name Accounting Standards Codification
-Section 50
-Paragraph 3
-Subparagraph (c)
-Publisher FASB
-URI https://asc.fasb.org/1943274/2147481687/323-10-50-3
Reference 8: http://www.xbrl.org/2003/role/disclosureRef
-Topic 825
-SubTopic 10
-Name Accounting Standards Codification
-Section 50
-Paragraph 28
-Subparagraph (f)
-Publisher FASB
-URI https://asc.fasb.org/1943274/2147482907/825-10-50-28
Reference 9: http://www.xbrl.org/2003/role/disclosureRef
-Topic 220
-SubTopic 10
-Name Accounting Standards Codification
-Section 50
-Paragraph 6
-Publisher FASB
-URI https://asc.fasb.org/1943274/2147482765/220-10-50-6
Reference 10: http://www.xbrl.org/2003/role/disclosureRef
-Topic 250
-SubTopic 10
-Name Accounting Standards Codification
-Section 50
-Paragraph 3
-Publisher FASB
-URI https://asc.fasb.org/1943274/2147483443/250-10-50-3
Reference 11: http://www.xbrl.org/2003/role/disclosureRef
-Topic 250
-SubTopic 10
-Name Accounting Standards Codification
-Section 50
-Paragraph 1
-Subparagraph (b)(2)
-Publisher FASB
-URI https://asc.fasb.org/1943274/2147483443/250-10-50-1
Reference 12: http://www.xbrl.org/2003/role/disclosureRef
-Topic 815
-SubTopic 40
-Name Accounting Standards Codification
-Section 65
-Paragraph 1
-Subparagraph (f)
-Publisher FASB
-URI https://asc.fasb.org/1943274/2147480175/815-40-65-1
Reference 13: http://www.xbrl.org/2003/role/disclosureRef
-Topic 250
-SubTopic 10
-Name Accounting Standards Codification
-Section 50
-Paragraph 8
-Publisher FASB
-URI https://asc.fasb.org/1943274/2147483443/250-10-50-8
Reference 14: http://www.xbrl.org/2003/role/disclosureRef
-Topic 250
-SubTopic 10
-Name Accounting Standards Codification
-Section 50
-Paragraph 11
-Subparagraph (a)
-Publisher FASB
-URI https://asc.fasb.org/1943274/2147483443/250-10-50-11
Reference 15: http://www.xbrl.org/2003/role/disclosureRef
-Topic 250
-SubTopic 10
-Name Accounting Standards Codification
-Section 50
-Paragraph 11
-Subparagraph (b)
-Publisher FASB
-URI https://asc.fasb.org/1943274/2147483443/250-10-50-11
Reference 16: http://www.xbrl.org/2003/role/disclosureRef
-Topic 250
-SubTopic 10
-Name Accounting Standards Codification
-Section 50
-Paragraph 4
-Publisher FASB
-URI https://asc.fasb.org/1943274/2147483443/250-10-50-4
Reference 17: http://www.xbrl.org/2003/role/exampleRef
-Topic 946
-SubTopic 830
-Name Accounting Standards Codification
-Section 55
-Paragraph 10
-Publisher FASB
-URI https://asc.fasb.org/1943274/2147479168/946-830-55-10
Reference 18: http://www.xbrl.org/2003/role/disclosureRef
-Topic 946
-SubTopic 220
-Name Accounting Standards Codification
-Section 45
-Paragraph 7
-Publisher FASB
-URI https://asc.fasb.org/1943274/2147479105/946-220-45-7
Reference 19: http://www.xbrl.org/2003/role/disclosureRef
-Topic 944
-SubTopic 220
-Name Accounting Standards Codification
-Section S99
-Paragraph 1
-Subparagraph (SX 210.7-04(18))
-Publisher FASB
-URI https://asc.fasb.org/1943274/2147477250/944-220-S99-1
Reference 20: http://www.xbrl.org/2003/role/disclosureRef
-Topic 946
-SubTopic 220
-Name Accounting Standards Codification
-Section S99
-Paragraph 1
-Subparagraph (SX 210.6-07(9))
-Publisher FASB
-URI https://asc.fasb.org/1943274/2147479134/946-220-S99-1
Reference 21: http://www.xbrl.org/2003/role/disclosureRef
-Topic 946
-SubTopic 220
-Name Accounting Standards Codification
-Section S99
-Paragraph 3
-Subparagraph (SX 210.6-09(1)(d))
-Publisher FASB
-URI https://asc.fasb.org/1943274/2147479134/946-220-S99-3
Reference 22: http://www.xbrl.org/2003/role/disclosureRef
-Topic 470
-SubTopic 10
-Name Accounting Standards Codification
-Section S99
-Paragraph 1A
-Subparagraph (SX 210.13-01(a)(4)(i))
-Publisher FASB
-URI https://asc.fasb.org/1943274/2147480097/470-10-S99-1A
Reference 23: http://www.xbrl.org/2009/role/commonPracticeRef
-Topic 470
-SubTopic 10
-Name Accounting Standards Codification
-Section S99
-Paragraph 1A
-Subparagraph (SX 210.13-01(a)(4)(ii))
-Publisher FASB
-URI https://asc.fasb.org/1943274/2147480097/470-10-S99-1A
Reference 24: http://www.xbrl.org/2003/role/disclosureRef
-Topic 470
-SubTopic 10
-Name Accounting Standards Codification
-Section S99
-Paragraph 1A
-Subparagraph (SX 210.13-01(a)(4)(iii)(A))
-Publisher FASB
-URI https://asc.fasb.org/1943274/2147480097/470-10-S99-1A
Reference 25: http://www.xbrl.org/2003/role/disclosureRef
-Topic 470
-SubTopic 10
-Name Accounting Standards Codification
-Section S99
-Paragraph 1A
-Subparagraph (SX 210.13-01(a)(4)(iv))
-Publisher FASB
-URI https://asc.fasb.org/1943274/2147480097/470-10-S99-1A
Reference 26: http://www.xbrl.org/2003/role/disclosureRef
-Topic 470
-SubTopic 10
-Name Accounting Standards Codification
-Section S99
-Paragraph 1A
-Subparagraph (SX 210.13-01(a)(5))
-Publisher FASB
-URI https://asc.fasb.org/1943274/2147480097/470-10-S99-1A
Reference 27: http://www.xbrl.org/2003/role/disclosureRef
-Topic 470
-SubTopic 10
-Name Accounting Standards Codification
-Section S99
-Paragraph 1B
-Subparagraph (SX 210.13-02(a)(4)(i))
-Publisher FASB
-URI https://asc.fasb.org/1943274/2147480097/470-10-S99-1B
Reference 28: http://www.xbrl.org/2003/role/disclosureRef
-Topic 470
-SubTopic 10
-Name Accounting Standards Codification
-Section S99
-Paragraph 1B
-Subparagraph (SX 210.13-02(a)(4)(iii)(A))
-Publisher FASB
-URI https://asc.fasb.org/1943274/2147480097/470-10-S99-1B
Reference 29: http://www.xbrl.org/2003/role/disclosureRef
-Topic 470
-SubTopic 10
-Name Accounting Standards Codification
-Section S99
-Paragraph 1B
-Subparagraph (SX 210.13-02(a)(4)(iii)(B))
-Publisher FASB
-URI https://asc.fasb.org/1943274/2147480097/470-10-S99-1B
Reference 30: http://www.xbrl.org/2003/role/disclosureRef
-Topic 470
-SubTopic 10
-Name Accounting Standards Codification
-Section S99
-Paragraph 1B
-Subparagraph (SX 210.13-02(a)(4)(iv))
-Publisher FASB
-URI https://asc.fasb.org/1943274/2147480097/470-10-S99-1B
Reference 31: http://www.xbrl.org/2003/role/disclosureRef
-Topic 470
-SubTopic 10
-Name Accounting Standards Codification
-Section S99
-Paragraph 1B
-Subparagraph (SX 210.13-02(a)(5))
-Publisher FASB
-URI https://asc.fasb.org/1943274/2147480097/470-10-S99-1B
Reference 32: http://www.xbrl.org/2003/role/disclosureRef
-Topic 260
-SubTopic 10
-Name Accounting Standards Codification
-Section 45
-Paragraph 60B
-Subparagraph (a)
-Publisher FASB
-URI https://asc.fasb.org/1943274/2147482689/260-10-45-60B
Reference 33: http://www.xbrl.org/2003/role/disclosureRef
-Topic 205
-SubTopic 20
-Name Accounting Standards Codification
-Section 50
-Paragraph 7
-Publisher FASB
-URI https://asc.fasb.org/1943274/2147483499/205-20-50-7
Reference 34: http://fasb.org/us-gaap/role/ref/legacyRef
-Topic 230
-SubTopic 10
-Name Accounting Standards Codification
-Section 45
-Paragraph 28
-Publisher FASB
-URI https://asc.fasb.org/1943274/2147482740/230-10-45-28
Reference 35: http://www.xbrl.org/2003/role/disclosureRef
-Topic 220
-SubTopic 10
-Name Accounting Standards Codification
-Section 45
-Paragraph 1A
-Subparagraph (a)
-Publisher FASB
-URI https://asc.fasb.org/1943274/2147482790/220-10-45-1A
Reference 36: http://www.xbrl.org/2003/role/disclosureRef
-Topic 220
-SubTopic 10
-Name Accounting Standards Codification
-Section 45
-Paragraph 1B
-Subparagraph (a)
-Publisher FASB
-URI https://asc.fasb.org/1943274/2147482790/220-10-45-1B
Reference 37: http://fasb.org/us-gaap/role/ref/legacyRef
-Topic 942
-SubTopic 220
-Name Accounting Standards Codification
-Section S99
-Paragraph 1
-Subparagraph (SX 210.9-04(22))
-Publisher FASB
-URI https://asc.fasb.org/1943274/2147478524/942-220-S99-1
| Name: |
us-gaap_NetIncomeLoss |
| Namespace Prefix: |
us-gaap_ |
| Data Type: |
xbrli:monetaryItemType |
| Balance Type: |
credit |
| Period Type: |
duration |
|
| X |
- DefinitionAmount of operating lease expense. Excludes sublease income. Reference 1: http://www.xbrl.org/2009/role/commonPracticeRef
-Topic 842
-SubTopic 20
-Name Accounting Standards Codification
-Section 45
-Paragraph 4
-Subparagraph (b)
-Publisher FASB
-URI https://asc.fasb.org/1943274/2147479041/842-20-45-4
| Name: |
us-gaap_OperatingLeaseExpense |
| Namespace Prefix: |
us-gaap_ |
| Data Type: |
xbrli:monetaryItemType |
| Balance Type: |
debit |
| Period Type: |
duration |
|
| X |
- DefinitionAmount of income (expense) included in net income that results in no cash inflow (outflow), classified as other. Reference 1: http://fasb.org/us-gaap/role/ref/legacyRef
-Topic 230
-SubTopic 10
-Name Accounting Standards Codification
-Section 45
-Paragraph 28
-Publisher FASB
-URI https://asc.fasb.org/1943274/2147482740/230-10-45-28
| Name: |
us-gaap_OtherNoncashIncomeExpense |
| Namespace Prefix: |
us-gaap_ |
| Data Type: |
xbrli:monetaryItemType |
| Balance Type: |
credit |
| Period Type: |
duration |
|
| X |
- DefinitionAmount of cash outflow in the form of ordinary dividends to common shareholders of the parent entity. Reference 1: http://fasb.org/us-gaap/role/ref/legacyRef
-Topic 230
-SubTopic 10
-Name Accounting Standards Codification
-Section 45
-Paragraph 15
-Subparagraph (a)
-Publisher FASB
-URI https://asc.fasb.org/1943274/2147482740/230-10-45-15
| Name: |
us-gaap_PaymentsOfDividendsCommonStock |
| Namespace Prefix: |
us-gaap_ |
| Data Type: |
xbrli:monetaryItemType |
| Balance Type: |
credit |
| Period Type: |
duration |
|
| X |
- DefinitionThe cash outflow associated with the purchase of all investments (debt, security, other) during the period. Reference 1: http://fasb.org/us-gaap/role/ref/legacyRef
-Topic 230
-SubTopic 10
-Name Accounting Standards Codification
-Section 45
-Paragraph 13
-Publisher FASB
-URI https://asc.fasb.org/1943274/2147482740/230-10-45-13
| Name: |
us-gaap_PaymentsToAcquireInvestments |
| Namespace Prefix: |
us-gaap_ |
| Data Type: |
xbrli:monetaryItemType |
| Balance Type: |
credit |
| Period Type: |
duration |
|
| X |
- DefinitionThe cash outflow associated with the acquisition of long-lived, physical assets that are used in the normal conduct of business to produce goods and services and not intended for resale; includes cash outflows to pay for construction of self-constructed assets. Reference 1: http://fasb.org/us-gaap/role/ref/legacyRef
-Topic 230
-SubTopic 10
-Name Accounting Standards Codification
-Section 45
-Paragraph 13
-Subparagraph (c)
-Publisher FASB
-URI https://asc.fasb.org/1943274/2147482740/230-10-45-13
| Name: |
us-gaap_PaymentsToAcquirePropertyPlantAndEquipment |
| Namespace Prefix: |
us-gaap_ |
| Data Type: |
xbrli:monetaryItemType |
| Balance Type: |
credit |
| Period Type: |
duration |
|
| X |
- DefinitionAmount of cash inflow from maturity, prepayment and call of investment in debt security measured at fair value with change in fair value recognized in other comprehensive income (available-for-sale). Reference 1: http://www.xbrl.org/2009/role/commonPracticeRef
-Topic 320
-SubTopic 10
-Name Accounting Standards Codification
-Section 45
-Paragraph 11
-Publisher FASB
-URI https://asc.fasb.org/1943274/2147481830/320-10-45-11
Reference 2: http://www.xbrl.org/2003/role/disclosureRef
-Topic 230
-SubTopic 10
-Name Accounting Standards Codification
-Section 45
-Paragraph 11
-Publisher FASB
-URI https://asc.fasb.org/1943274/2147482740/230-10-45-11
Reference 3: http://www.xbrl.org/2003/role/disclosureRef
-Topic 230
-SubTopic 10
-Name Accounting Standards Codification
-Section 45
-Paragraph 12
-Subparagraph (a)
-Publisher FASB
-URI https://asc.fasb.org/1943274/2147482740/230-10-45-12
| Name: |
us-gaap_ProceedsFromMaturitiesPrepaymentsAndCallsOfAvailableForSaleSecurities |
| Namespace Prefix: |
us-gaap_ |
| Data Type: |
xbrli:monetaryItemType |
| Balance Type: |
debit |
| Period Type: |
duration |
|
| X |
- DefinitionAmount of cash inflow (outflow) from financing activities classified as other. Reference 1: http://www.xbrl.org/2009/role/commonPracticeRef
-Topic 230
-SubTopic 10
-Name Accounting Standards Codification
-Section 45
-Paragraph 14
-Publisher FASB
-URI https://asc.fasb.org/1943274/2147482740/230-10-45-14
Reference 2: http://www.xbrl.org/2009/role/commonPracticeRef
-Name Accounting Standards Codification
-Section 45
-Paragraph 15
-SubTopic 10
-Topic 230
-Publisher FASB
-URI https://asc.fasb.org/1943274/2147482740/230-10-45-15
| Name: |
us-gaap_ProceedsFromPaymentsForOtherFinancingActivities |
| Namespace Prefix: |
us-gaap_ |
| Data Type: |
xbrli:monetaryItemType |
| Balance Type: |
debit |
| Period Type: |
duration |
|
| X |
- DefinitionAmount of cash inflow from sale of investment in debt security measured at fair value with change in fair value recognized in other comprehensive income (available-for-sale). Reference 1: http://www.xbrl.org/2003/role/disclosureRef
-Topic 320
-SubTopic 10
-Name Accounting Standards Codification
-Section 45
-Paragraph 11
-Publisher FASB
-URI https://asc.fasb.org/1943274/2147481830/320-10-45-11
Reference 2: http://www.xbrl.org/2003/role/disclosureRef
-Topic 320
-SubTopic 10
-Name Accounting Standards Codification
-Section 50
-Paragraph 9
-Subparagraph (a)
-Publisher FASB
-URI https://asc.fasb.org/1943274/2147481800/320-10-50-9
Reference 3: http://fasb.org/us-gaap/role/ref/legacyRef
-Name Accounting Standards Codification
-Topic 230
-SubTopic 10
-Section 45
-Paragraph 12
-Subparagraph (a)
-Publisher FASB
-URI https://asc.fasb.org/1943274/2147482740/230-10-45-12
Reference 4: http://www.xbrl.org/2003/role/disclosureRef
-Topic 230
-SubTopic 10
-Name Accounting Standards Codification
-Section 45
-Paragraph 11
-Publisher FASB
-URI https://asc.fasb.org/1943274/2147482740/230-10-45-11
| Name: |
us-gaap_ProceedsFromSaleOfAvailableForSaleSecuritiesDebt |
| Namespace Prefix: |
us-gaap_ |
| Data Type: |
xbrli:monetaryItemType |
| Balance Type: |
debit |
| Period Type: |
duration |
|
| X |
- DefinitionThe cash inflow associated with the amount received from the stock plan during the period. Reference 1: http://fasb.org/us-gaap/role/ref/legacyRef
-Name Accounting Standards Codification
-Section 45
-Paragraph 14
-Subparagraph (a)
-SubTopic 10
-Topic 230
-Publisher FASB
-URI https://asc.fasb.org/1943274/2147482740/230-10-45-14
| Name: |
us-gaap_ProceedsFromStockPlans |
| Namespace Prefix: |
us-gaap_ |
| Data Type: |
xbrli:monetaryItemType |
| Balance Type: |
debit |
| Period Type: |
duration |
|
| X |
- DefinitionThe cash outflow from the repayment of a long-term debt instrument which can be exchanged for a specified amount of another security, typically the entity's common stock, at the option of the issuer or the holder. Reference 1: http://fasb.org/us-gaap/role/ref/legacyRef
-Topic 230
-SubTopic 10
-Name Accounting Standards Codification
-Section 45
-Paragraph 15
-Subparagraph (b)
-Publisher FASB
-URI https://asc.fasb.org/1943274/2147482740/230-10-45-15
| Name: |
us-gaap_RepaymentsOfConvertibleDebt |
| Namespace Prefix: |
us-gaap_ |
| Data Type: |
xbrli:monetaryItemType |
| Balance Type: |
credit |
| Period Type: |
duration |
|
| X |
- DefinitionAmount of cash restricted as to withdrawal or usage, classified as current. Cash includes, but is not limited to, currency on hand, demand deposits with banks or financial institutions, and other accounts with general characteristics of demand deposits. Reference 1: http://www.xbrl.org/2009/role/commonPracticeRef
-Topic 210
-SubTopic 10
-Name Accounting Standards Codification
-Section S99
-Paragraph 1
-Subparagraph (SX 210.5-02(1))
-Publisher FASB
-URI https://asc.fasb.org/1943274/2147480566/210-10-S99-1
Reference 2: http://www.xbrl.org/2009/role/commonPracticeRef
-Topic 230
-SubTopic 10
-Name Accounting Standards Codification
-Section 50
-Paragraph 8
-Publisher FASB
-URI https://asc.fasb.org/1943274/2147482913/230-10-50-8
| Name: |
us-gaap_RestrictedCashCurrent |
| Namespace Prefix: |
us-gaap_ |
| Data Type: |
xbrli:monetaryItemType |
| Balance Type: |
debit |
| Period Type: |
instant |
|
| X |
- DefinitionAmount of cash restricted as to withdrawal or usage, classified as noncurrent. Cash includes, but is not limited to, currency on hand, demand deposits with banks or financial institutions, and other accounts with general characteristics of demand deposits. Reference 1: http://www.xbrl.org/2009/role/commonPracticeRef
-Topic 210
-SubTopic 10
-Name Accounting Standards Codification
-Section S99
-Paragraph 1
-Subparagraph (SX 210.5-02(17))
-Publisher FASB
-URI https://asc.fasb.org/1943274/2147480566/210-10-S99-1
Reference 2: http://www.xbrl.org/2003/role/disclosureRef
-Name Accounting Standards Codification
-Section 45
-Paragraph 5
-SubTopic 210
-Topic 954
-Publisher FASB
-URI https://asc.fasb.org/1943274/2147477220/954-210-45-5
Reference 3: http://www.xbrl.org/2009/role/commonPracticeRef
-Topic 230
-SubTopic 10
-Name Accounting Standards Codification
-Section 50
-Paragraph 8
-Publisher FASB
-URI https://asc.fasb.org/1943274/2147482913/230-10-50-8
| Name: |
us-gaap_RestrictedCashNoncurrent |
| Namespace Prefix: |
us-gaap_ |
| Data Type: |
xbrli:monetaryItemType |
| Balance Type: |
debit |
| Period Type: |
instant |
|
| X |
- DefinitionAmount of noncash expense for share-based payment arrangement. Reference 1: http://fasb.org/us-gaap/role/ref/legacyRef
-Name Accounting Standards Codification
-Section 45
-Paragraph 28
-Subparagraph (a)
-SubTopic 10
-Topic 230
-Publisher FASB
-URI https://asc.fasb.org/1943274/2147482740/230-10-45-28
| Name: |
us-gaap_ShareBasedCompensation |
| Namespace Prefix: |
us-gaap_ |
| Data Type: |
xbrli:monetaryItemType |
| Balance Type: |
debit |
| Period Type: |
duration |
|
v3.24.2
BASIS OF PRESENTATION
|
6 Months Ended |
Jun. 30, 2024 |
|---|
| Accounting Policies [Abstract] |
|
| BASIS OF PRESENTATION |
NOTE 1. BASIS OF PRESENTATION Pegasystems Inc. (together with its subsidiaries, “the Company”) has prepared the accompanying unaudited condensed consolidated financial statements pursuant to the rules and regulations of the U.S. Securities and Exchange Commission (“SEC”) regarding interim financial reporting. Accordingly, they do not include all the information required by accounting principles generally accepted in the United States of America (“U.S.”) for complete financial statements and should be read in conjunction with the Company’s audited financial statements included in the Annual Report on Form 10-K for the year ended December 31, 2023. In the opinion of management, the Company has prepared the accompanying unaudited condensed consolidated financial statements on the same basis as its audited financial statements, and these financial statements include all adjustments, consisting only of normal recurring adjustments, necessary for a fair presentation of the results of the interim periods presented. All intercompany transactions and balances were eliminated in consolidation. The operating results for the interim periods presented do not necessarily indicate the expected results for 2024.
|
| X |
- References
+ Details
| Name: |
us-gaap_AccountingPoliciesAbstract |
| Namespace Prefix: |
us-gaap_ |
| Data Type: |
xbrli:stringItemType |
| Balance Type: |
na |
| Period Type: |
duration |
|
| X |
- DefinitionThe entire disclosure for the business description and basis of presentation concepts. Business description describes the nature and type of organization including but not limited to organizational structure as may be applicable to holding companies, parent and subsidiary relationships, business divisions, business units, business segments, affiliates and information about significant ownership of the reporting entity. Basis of presentation describes the underlying basis used to prepare the financial statements (for example, US Generally Accepted Accounting Principles, Other Comprehensive Basis of Accounting, IFRS). Reference 1: http://fasb.org/us-gaap/role/ref/legacyRef
-Topic 235
-Name Accounting Standards Codification
-Publisher FASB
-URI https://asc.fasb.org/235/tableOfContent
Reference 2: http://fasb.org/us-gaap/role/ref/legacyRef
-Topic 275
-Name Accounting Standards Codification
-Publisher FASB
-URI https://asc.fasb.org/275/tableOfContent
Reference 3: http://fasb.org/us-gaap/role/ref/legacyRef
-Topic 205
-Name Accounting Standards Codification
-Publisher FASB
-URI https://asc.fasb.org/205/tableOfContent
| Name: |
us-gaap_BusinessDescriptionAndBasisOfPresentationTextBlock |
| Namespace Prefix: |
us-gaap_ |
| Data Type: |
dtr-types:textBlockItemType |
| Balance Type: |
na |
| Period Type: |
duration |
|
v3.24.2
MARKETABLE SECURITIES
|
6 Months Ended |
Jun. 30, 2024 |
|---|
| Investments, Debt and Equity Securities [Abstract] |
|
| MARKETABLE SECURITIES |
NOTE 2. MARKETABLE SECURITIES | | | | | | | | | | | | | | | | | | | | | | | | | | | | | | | | | | | | | | | | | | | | | | | | | June 30, 2024 | | December 31, 2023 | | (in thousands) | Amortized Cost | | Unrealized Gains | | Unrealized Losses | | Fair Value | | Amortized Cost | | Unrealized Gains | | Unrealized Losses | | Fair Value | | Government debt | $ | 12,942 | | | $ | — | | | $ | (17) | | | $ | 12,925 | | | $ | 11,471 | | | $ | 33 | | | $ | (1) | | | $ | 11,503 | | | Corporate debt | 394,521 | | | 1 | | | (628) | | | 393,894 | | | 181,960 | | | 200 | | | (227) | | | 181,933 | | | $ | 407,463 | | | $ | 1 | | | $ | (645) | | | $ | 406,819 | | | $ | 193,431 | | | $ | 233 | | | $ | (228) | | | $ | 193,436 | |
As of June 30, 2024, marketable securities’ maturities ranged from July 2024 to January 2026, with a weighted-average remaining maturity of 0.4 years.
|
| X |
- References
+ Details
| Name: |
us-gaap_InvestmentsDebtAndEquitySecuritiesAbstract |
| Namespace Prefix: |
us-gaap_ |
| Data Type: |
xbrli:stringItemType |
| Balance Type: |
na |
| Period Type: |
duration |
|
| X |
- DefinitionThe entire disclosure for investments in certain debt and equity securities. Reference 1: http://www.xbrl.org/2009/role/commonPracticeRef
-Topic 940
-SubTopic 320
-Name Accounting Standards Codification
-Publisher FASB
-URI https://asc.fasb.org/940-320/tableOfContent
Reference 2: http://www.xbrl.org/2003/role/disclosureRef
-Name Regulation S-K (SK)
-Number 229
-Section 1403
-Paragraph b
-Publisher SEC
Reference 3: http://www.xbrl.org/2003/role/disclosureRef
-Topic 320
-Name Accounting Standards Codification
-Publisher FASB
-URI https://asc.fasb.org/320/tableOfContent
Reference 4: http://www.xbrl.org/2003/role/disclosureRef
-Topic 320
-SubTopic 10
-Name Accounting Standards Codification
-Section 50
-Paragraph 10
-Subparagraph (d)
-Publisher FASB
-URI https://asc.fasb.org/1943274/2147481800/320-10-50-10
Reference 5: http://www.xbrl.org/2003/role/disclosureRef
-Topic 820
-SubTopic 10
-Name Accounting Standards Codification
-Section 50
-Paragraph 6B
-Subparagraph (b)
-Publisher FASB
-URI https://asc.fasb.org/1943274/2147482106/820-10-50-6B
Reference 6: http://www.xbrl.org/2003/role/disclosureRef
-Topic 820
-SubTopic 10
-Name Accounting Standards Codification
-Section 50
-Paragraph 6B
-Subparagraph (c)
-Publisher FASB
-URI https://asc.fasb.org/1943274/2147482106/820-10-50-6B
Reference 7: http://fasb.org/us-gaap/role/ref/legacyRef
-Topic 942
-SubTopic 320
-Name Accounting Standards Codification
-Publisher FASB
-URI https://asc.fasb.org/942-320/tableOfContent
| Name: |
us-gaap_InvestmentsInDebtAndMarketableEquitySecuritiesAndCertainTradingAssetsDisclosureTextBlock |
| Namespace Prefix: |
us-gaap_ |
| Data Type: |
dtr-types:textBlockItemType |
| Balance Type: |
na |
| Period Type: |
duration |
|
v3.24.2
RECEIVABLES, CONTRACT ASSETS, AND DEFERRED REVENUE
|
6 Months Ended |
Jun. 30, 2024 |
|---|
| Receivables [Abstract] |
|
| RECEIVABLES, CONTRACT ASSETS, AND DEFERRED REVENUE |
NOTE 3. RECEIVABLES, CONTRACT ASSETS, AND DEFERRED REVENUE Receivables | | | | | | | | | | | | (in thousands) | June 30, 2024 | | December 31, 2023 | | Accounts receivable, net | $ | 165,723 | | | $ | 300,173 | | | Unbilled receivables, net | 164,533 | | | 237,379 | | Long-term unbilled receivables, net | 81,218 | | | 85,402 | | | $ | 411,474 | | | $ | 622,954 | |
Unbilled receivables Unbilled receivables are client-committed amounts for which revenue recognition precedes billing. Billing is solely subject to the passage of time. Unbilled receivables by expected collection date: | | | | | | | | | (Dollars in thousands) | June 30, 2024 | | 1 year or less | $ | 164,533 | | 67 | % | | 1-2 years | 58,353 | | 24 | % | | 2-5 years | 22,865 | | 9 | % | | $ | 245,751 | | 100 | % |
Unbilled receivables by contract effective date: | | | | | | | | | (Dollars in thousands) | June 30, 2024 | | 2024 | $ | 58,562 | | 24 | % | | 2023 | 130,140 | | 53 | % | | 2022 | 29,241 | | 12 | % | | 2021 | 22,830 | | 9 | % | | 2020 and prior | 4,978 | | 2 | % | | $ | 245,751 | | 100 | % |
Contract assets Contract assets are client-committed amounts for which revenue recognized exceeds the amount billed to the client, and billing is subject to conditions other than the passage of time, such as the completion of a related performance obligation. | | | | | | | | | | | | (in thousands) | June 30, 2024 | | December 31, 2023 | Contract assets | $ | 15,374 | | | $ | 16,238 | | Long-term contract assets | 19,997 | | | 20,635 | | | $ | 35,371 | | | $ | 36,873 | |
Deferred revenue Deferred revenue consists of billings made and payments received in advance of revenue recognition. | | | | | | | | | | | | (in thousands) | June 30, 2024 | | December 31, 2023 | | Deferred revenue | $ | 352,618 | | | $ | 377,845 | | Long-term deferred revenue | 2,443 | | | 2,478 | | | $ | 355,061 | | | $ | 380,323 | |
The decrease in deferred revenue in the six months ended June 30, 2024, was primarily due to $272.7 million of revenue recognized that was in deferred revenue as of December 31, 2023.
|
| X |
- DefinitionReceivables, Contract Assets, And Deferred Revenue [Text Block]
| Name: |
pega_ReceivablesContractAssetsAndDeferredRevenueTextBlock |
| Namespace Prefix: |
pega_ |
| Data Type: |
dtr-types1:textBlockItemType |
| Balance Type: |
na |
| Period Type: |
duration |
|
| X |
- References
+ Details
| Name: |
us-gaap_ReceivablesAbstract |
| Namespace Prefix: |
us-gaap_ |
| Data Type: |
xbrli:stringItemType |
| Balance Type: |
na |
| Period Type: |
duration |
|
v3.24.2
DEFERRED COMMISSIONS
|
6 Months Ended |
Jun. 30, 2024 |
|---|
| Deferred Costs, Capitalized, Prepaid, and Other Assets Disclosure [Abstract] |
|
| DEFERRED COMMISSIONS |
NOTE 4. DEFERRED COMMISSIONS | | | | | | | | | | | | (in thousands) | June 30, 2024 | | December 31, 2023 | Deferred commissions | $ | 100,490 | | | $ | 114,119 | |
| | | | | | | | | | | | | | | | | | | | | | | | | Three Months Ended
June 30, | | Six Months Ended
June 30, | | (in thousands) | 2024 | | 2023 | | 2024 | | 2023 | Amortization of deferred commissions (1) | $ | 14,994 | | | $ | 14,750 | | | $ | 32,276 | | | $ | 29,027 | |
(1) Included in selling and marketing.
|
| X |
- DefinitionThe entire disclosure for deferred contract costs and related amortization.
| Name: |
pega_DeferredCostsNetTextBlock |
| Namespace Prefix: |
pega_ |
| Data Type: |
dtr-types1:textBlockItemType |
| Balance Type: |
na |
| Period Type: |
duration |
|
| X |
- References
+ Details
| Name: |
us-gaap_DeferredCostsCapitalizedPrepaidAndOtherAssetsDisclosureAbstract |
| Namespace Prefix: |
us-gaap_ |
| Data Type: |
xbrli:stringItemType |
| Balance Type: |
na |
| Period Type: |
duration |
|
v3.24.2
GOODWILL AND OTHER INTANGIBLES
|
6 Months Ended |
Jun. 30, 2024 |
|---|
| Goodwill and Intangible Assets Disclosure [Abstract] |
|
| GOODWILL AND OTHER INTANGIBLES |
NOTE 5. GOODWILL AND OTHER INTANGIBLES Goodwill | | | | | | | | | | | | | Six Months Ended
June 30, | (in thousands) | 2024 | | 2023 | | January 1, | $ | 81,611 | | | $ | 81,399 | | | | | | | Currency translation adjustments | (201) | | | 194 | | | June 30, | $ | 81,410 | | | $ | 81,593 | |
Intangibles Intangible assets are recorded at cost and amortized using the straight-line method over their estimated useful lives. | | | | | | | | | | | | | | | | | | | | | | | | | | | June 30, 2024 | | (in thousands) | Useful Lives | | Cost | | Accumulated Amortization | | Net Book Value | Client-related | 4-10 years | | $ | 63,112 | | | $ | (60,714) | | | $ | 2,398 | | Technology | 2-10 years | | 68,005 | | | (65,198) | | | 2,807 | | Other | 1-5 years | | 5,361 | | | (5,361) | | | — | | | | | $ | 136,478 | | | $ | (131,273) | | | $ | 5,205 | |
| | | | | | | | | | | | | | | | | | | | | | | | | | | December 31, 2023 | | (in thousands) | Useful Lives | | Cost | | Accumulated Amortization | | Net Book Value | | Client-related | 4-10 years | | $ | 63,117 | | | $ | (60,035) | | | $ | 3,082 | | | Technology | 2-10 years | | 68,138 | | | (64,218) | | | 3,920 | | | Other | 1-5 years | | 5,361 | | | (5,361) | | | — | | | | | $ | 136,616 | | | $ | (129,614) | | | $ | 7,002 | |
Future estimated amortization of intangible assets: | | | | | | (in thousands) | June 30, 2024 | | Remainder of 2024 | $ | 1,399 | | | 2025 | 2,605 | | | 2026 | 874 | | | 2027 | 327 | | | | | | | $ | 5,205 | |
Amortization of intangible assets: | | | | | | | | | | | | | | | | | | | | | | | | | Three Months Ended
June 30, | | Six Months Ended
June 30, | | (in thousands) | 2024 | | 2023 | | 2024 | | 2023 | Cost of revenue | $ | 447 | | | $ | 621 | | | $ | 1,068 | | | $ | 1,327 | | Selling and marketing | 342 | | | 342 | | | 685 | | | 685 | | | | | | | | | | | $ | 789 | | | $ | 963 | | | $ | 1,753 | | | $ | 2,012 | |
|
| X |
- References
+ Details
| Name: |
us-gaap_GoodwillAndIntangibleAssetsDisclosureAbstract |
| Namespace Prefix: |
us-gaap_ |
| Data Type: |
xbrli:stringItemType |
| Balance Type: |
na |
| Period Type: |
duration |
|
| X |
- DefinitionThe entire disclosure for goodwill and intangible assets. Reference 1: http://www.xbrl.org/2009/role/commonPracticeRef
-Topic 350
-SubTopic 30
-Name Accounting Standards Codification
-Publisher FASB
-URI https://asc.fasb.org/350-30/tableOfContent
Reference 2: http://www.xbrl.org/2009/role/commonPracticeRef
-Topic 350
-SubTopic 20
-Name Accounting Standards Codification
-Publisher FASB
-URI https://asc.fasb.org/350-20/tableOfContent
| Name: |
us-gaap_GoodwillAndIntangibleAssetsDisclosureTextBlock |
| Namespace Prefix: |
us-gaap_ |
| Data Type: |
dtr-types:textBlockItemType |
| Balance Type: |
na |
| Period Type: |
duration |
|
v3.24.2
OTHER ASSETS AND LIABILITIES
|
6 Months Ended |
Jun. 30, 2024 |
|---|
| Other Assets and Liabilities [Abstract] |
|
| OTHER ASSETS AND LIABILITIES |
NOTE 6. OTHER ASSETS AND LIABILITIES Other current assets | | | | | | | | | | | | | (in thousands) | June 30, 2024 | | December 31, 2023 | | Income tax receivables | $ | 16,060 | | | $ | 4,804 | | | Contract assets | 15,374 | | | 16,238 | | | Insurance receivable | — | | | 1,954 | | | Indirect tax receivable | 2,702 | | | 1,924 | | | Capped call transactions | 915 | | | — | | | Restricted cash | 768 | | | — | | | Other | 40,504 | | | 43,217 | | | $ | 76,323 | | | $ | 68,137 | |
Other long-term assets | | | | | | | | | | | | | (in thousands) | June 30, 2024 | | December 31, 2023 | | Deferred commissions | $ | 100,490 | | | $ | 114,119 | | | Right of use assets | 68,293 | | | 64,198 | | | Property and equipment | 42,190 | | | 47,279 | | | Venture investments | 21,047 | | | 19,450 | | | Contract assets | 19,997 | | | 20,635 | | | Intangible assets | 5,205 | | | 7,002 | | | Capped call transactions | — | | | 893 | | | Deferred income taxes | 3,666 | | | 3,678 | | | Restricted cash | 4,006 | | | 2,925 | | | Other | 37,355 | | | 34,517 | | | $ | 302,249 | | | $ | 314,696 | |
Accrued expenses | | | | | | | | | | | | | (in thousands) | June 30, 2024 | | December 31, 2023 | | | | | | Cloud hosting | $ | 15,152 | | | $ | 1,358 | | | Outside professional services | 9,539 | | | 10,419 | | | Marketing and sales program | 7,081 | | | 2,557 | | | Income and other taxes | 3,422 | | | 15,428 | | | Employee related | 4,966 | | | 4,486 | | | Other | 4,715 | | | 5,693 | | | $ | 44,875 | | | $ | 39,941 | |
Other current liabilities | | | | | | | | | | | | | (in thousands) | June 30, 2024 | | December 31, 2023 | | Operating lease liabilities | $ | 15,254 | | | $ | 15,000 | | | Dividends payable | 2,561 | | | 2,515 | | | Other | 2,862 | | | 3,828 | | | $ | 20,677 | | | $ | 21,343 | |
Other long-term liabilities | | | | | | | | | | | | | (in thousands) | June 30, 2024 | | December 31, 2023 | | Deferred revenue | $ | 2,443 | | | $ | 2,478 | | | Income taxes payable | 858 | | | 859 | | | Other | 11,061 | | | 10,233 | | | $ | 14,362 | | | $ | 13,570 | |
|
| X |
- DefinitionOther Assets and Liabilities
| Name: |
pega_OtherAssetsAndLiabilitiesAbstract |
| Namespace Prefix: |
pega_ |
| Data Type: |
xbrli:stringItemType |
| Balance Type: |
na |
| Period Type: |
duration |
|
| X |
- DefinitionThe entire disclosure for supplemental balance sheet disclosures, including descriptions and amounts for assets, liabilities, and equity. Reference 1: http://www.xbrl.org/2009/role/commonPracticeRef
-Topic 210
-Name Accounting Standards Codification
-Publisher FASB
-URI https://asc.fasb.org/210/tableOfContent
| Name: |
us-gaap_SupplementalBalanceSheetDisclosuresTextBlock |
| Namespace Prefix: |
us-gaap_ |
| Data Type: |
dtr-types:textBlockItemType |
| Balance Type: |
na |
| Period Type: |
duration |
|
v3.24.2
LEASES
|
6 Months Ended |
Jun. 30, 2024 |
|---|
| Leases [Abstract] |
|
| LEASES |
NOTE 7. LEASES Expense | | | | | | | | | | | | | | | | | | | | | | | | | Three Months Ended
June 30, | | Six Months Ended
June 30, | | (in thousands) | 2024 | | 2023 | | 2024 | | 2023 | | Fixed lease costs | $ | 5,271 | | | $ | 4,495 | | | $ | 9,533 | | | $ | 10,261 | | | Short-term lease costs | 410 | | | 696 | | | 953 | | | 1,477 | | | Variable lease costs | 1,763 | | | 2,186 | | | 3,372 | | | 4,160 | | | $ | 7,444 | | | $ | 7,377 | | | $ | 13,858 | | | $ | 15,898 | |
Right of use assets and lease liabilities | | | | | | | | | | | | | (in thousands) | June 30, 2024 | | December 31, 2023 | Right of use assets | $ | 68,293 | | | $ | 64,198 | | Operating lease liabilities | $ | 15,254 | | | $ | 15,000 | | | Long-term operating lease liabilities | $ | 70,202 | | | $ | 66,901 | |
Weighted-average remaining lease term and discount rate for the Company’s leases were: | | | | | | | | | | | | | June 30, 2024 | | December 31, 2023 | | Weighted-average remaining lease term | 6.4 years | | 6.8 years | Weighted-average discount rate (1) | 4.6 | % | | 4.0 | % |
(1) The rates implicit in the Company’s leases are not readily determinable. Therefore, the Company uses its incremental borrowing rate as the discount rate when measuring operating lease liabilities. The incremental borrowing rate represents an estimate of the interest rate the Company would incur to borrow an amount equal to the lease payments on a collateralized basis over the lease term in a similar economic environment. Maturities of lease liabilities: | | | | | | | (in thousands) | June 30, 2024 | | Remainder of 2024 | $ | 7,954 | | | 2025 | 18,784 | | | 2026 | 14,384 | | | 2027 | 13,387 | | | 2028 | 12,813 | | | 2029 | 10,099 | | | Thereafter | 21,650 | | | Total lease payments | 99,071 | | Less: imputed interest (1) | (13,615) | | | $ | 85,456 | |
(1) Lease liabilities are measured at the present value of the remaining lease payments using a discount rate determined at lease commencement unless the discount rate is updated due to a lease reassessment event. Cash flow information | | | | | | | | | | | | | Six Months Ended
June 30, | | (in thousands) | 2024 | | 2023 | | Cash paid for operating leases, net of tenant improvement allowances | $ | 9,493 | | | $ | 10,540 | | | Right of use assets recognized for new leases and amendments (non-cash) | $ | 12,290 | | | $ | 1,465 | |
|
| X |
- References
+ Details
| Name: |
us-gaap_LeasesAbstract |
| Namespace Prefix: |
us-gaap_ |
| Data Type: |
xbrli:stringItemType |
| Balance Type: |
na |
| Period Type: |
duration |
|
| X |
- DefinitionThe entire disclosure for operating leases of lessee. Includes, but is not limited to, description of operating lease and maturity analysis of operating lease liability. Reference 1: http://www.xbrl.org/2003/role/disclosureRef
-Topic 842
-SubTopic 20
-Name Accounting Standards Codification
-Publisher FASB
-URI https://asc.fasb.org/842-20/tableOfContent
| Name: |
us-gaap_LesseeOperatingLeasesTextBlock |
| Namespace Prefix: |
us-gaap_ |
| Data Type: |
dtr-types:textBlockItemType |
| Balance Type: |
na |
| Period Type: |
duration |
|
v3.24.2
DEBT
|
6 Months Ended |
Jun. 30, 2024 |
|---|
| Debt Disclosure [Abstract] |
|
| DEBT |
NOTE 8. DEBT Convertible senior notes and capped calls Convertible senior notes In February 2020, the Company issued Convertible Senior Notes (the "Notes") with an aggregate principal of $600 million, due March 1, 2025, in a private placement. No principal payments are due before maturity. The Notes accrue interest at an annual rate of 0.75%, payable semi-annually in arrears on March 1 and September 1, beginning September 1, 2020. In the three and six months ended June 30, 2023, the Company recognized gains of $5.1 million and $7.9 million, respectively, in other income, net from repurchases of Notes representing $64.7 million and $97.7 million, respectively, in aggregate principal amount. Conversion rights The conversion rate is 7.4045 shares of common stock per $1,000 principal amount of the Notes, representing an initial conversion price of $135.05 per share of common stock. The conversion rate will be adjusted upon certain events, including spin-offs, tender offers, exchange offers, and certain stockholder distributions. The Company will settle conversions by paying or delivering cash, shares of its common stock, or a combination of cash and shares of its common stock, at the Company’s election, based on the applicable conversion rate. Beginning on September 1, 2024, noteholders may convert their Notes at any time at their election. Before September 1, 2024, noteholders may convert their Notes in the following circumstances: •During any calendar quarter beginning after June 30, 2020 (and only during such calendar quarter), if the last reported sale price per share of the Company’s common stock exceeds 130% of the conversion price for each of at least 20 trading days (whether or not consecutive) during the 30 consecutive trading days ending on, and including, the last trading day of the immediately preceding calendar quarter. •During the five consecutive business days immediately after any five consecutive trading day period (the “Measurement Period”), if the trading price per $1,000 principal amount of Notes for each trading day of the Measurement Period was less than 98% of the product of the last reported sale price per share of common stock on such trading day and the conversion rate on such trading day. •Upon certain corporate events or distributions or if the Company calls any Notes for redemption, noteholders may convert before the close of business on the business day immediately before the related redemption date (or, if the Company fails to pay the redemption price in full on the redemption date until the Company pays the redemption price). As of June 30, 2024, the Notes were not eligible for conversion. Repurchase rights On or after March 1, 2023 and on or before the 40th scheduled trading day immediately before the maturity date, the Company may redeem for cash all or part of the Notes at a repurchase price equal to 100% of the principal amount, plus accrued and unpaid interest, if the last reported sale price of the Company’s common stock exceeded 130% of the conversion price then in effect for at least 20 trading days (whether or not consecutive) during any 30 consecutive trading day period ending on, and including, the trading day immediately preceding the date on which the Company provides a redemption notice. If certain corporate events that constitute a “Fundamental Change” occur, each noteholder will have the right to require the Company to repurchase for cash all of such noteholder’s Notes, or any portion of the principal thereof that is equal to $1,000 or a multiple of $1,000, at a repurchase price equal to 100% of the principal amount thereof, plus accrued and unpaid interest. A Fundamental Change relates to mergers, changes in control of the Company, liquidation/dissolution of the Company, or the delisting of the Company’s common stock. Carrying value of the Notes: | | | | | | | | | | | | | (in thousands) | June 30, 2024 | | December 31, 2023 | | Principal | $ | 502,270 | | | $ | 502,270 | | | Unamortized issuance costs | (1,666) | | | (2,902) | | | Convertible senior notes, net | $ | 500,604 | | | $ | 499,368 | |
Interest expense related to the Notes: | | | | | | | | | | | | | | | | | | | | | | | | | Three Months Ended
June 30, | | Six Months Ended
June 30, | | (in thousands) | 2024 | | 2023 | | 2024 | | 2023 | Contractual interest expense (0.75% coupon) | $ | 942 | | | $ | 997 | | | $ | 1,884 | | | $ | 2,122 | | Amortization of issuance costs | 619 | | | 647 | | | 1,236 | | | 1,375 | | | $ | 1,561 | | | $ | 1,644 | | | $ | 3,120 | | | $ | 3,497 | |
The average interest rate on the Notes in the six months ended June 30, 2024 and 2023 was 1.2%. Future payments: | | | | | | | | | | | | | | | | | | | June 30, 2024 | | (in thousands) | Principal | | Interest | | Total | | Remainder of 2024 | $ | — | | | $ | 1,883 | | | $ | 1,883 | | | 2025 | 502,270 | | | 1,884 | | | 504,154 | | | | | | | | | $ | 502,270 | | | $ | 3,767 | | | $ | 506,037 | |
Capped call transactions In February 2020, the Company entered into privately negotiated capped call transactions (the “Capped Call Transactions”) with certain financial institutions. The Capped Call Transactions initially covered approximately 4.4 million shares (representing the number of shares for which the Notes were initially convertible) of the Company’s common stock. In the three and six months ended June 30, 2023, Capped Call Transactions covering approximately 0.5 million and 0.7 million shares, respectively, were settled for proceeds of $0.1 million and $0.3 million, respectively. As of June 30, 2024, Capped Call Transactions covering approximately 3.7 million shares were outstanding. The Capped Call Transactions are expected to reduce common stock dilution and/or offset any potential cash payments the Company must make, other than for principal and interest, upon conversion of the Notes, with such reduction and/or offset subject to a cap of $196.44. The cap price of the Capped Call Transactions is subject to adjustment upon specified extraordinary events affecting the Company, including mergers and tender offers. The Capped Call Transactions are accounted for as derivative instruments and do not qualify for the Company’s own equity scope exception in ASC 815 since, in some cases of early settlement, the settlement value calculated following the governing documents may not represent a fair value measurement. The Capped Call Transactions are remeasured to fair value each reporting period, resulting in a non-operating gain or loss. Change in capped call transactions: | | | | | | | | | | | | | Six Months Ended
June 30, | | (in thousands) | 2024 | | 2023 | | January 1, | $ | 893 | | | $ | 2,582 | | | Settlements | — | | | (341) | | | Fair value adjustment | 22 | | | 1,845 | | | June 30, | $ | 915 | | | $ | 4,086 | |
Credit facility In November 2019, and as since amended, the Company entered into a five-year $100 million senior secured revolving credit agreement (the “Credit Facility”) with PNC Bank, National Association. The Company may use borrowings for general corporate purposes and to finance working capital needs. Subject to specific conditions and the agreement of the financial institutions lending the additional amount, the aggregate commitment may be increased to $200 million. The commitments expire on November 4, 2024, and any outstanding loans will be payable on such date. On April 23, 2024, the Credit Facility was amended to extend the expiration date to February 4, 2025. The Credit Facility, as amended, contains customary covenants, including, but not limited to, those relating to additional indebtedness, liens, asset divestitures, and affiliate transactions. Beginning with the fiscal quarter ended March 31, 2024, the Company must maintain a maximum net consolidated leverage ratio of 3.5 to 1.0 (with a step-up for certain acquisitions) and a minimum consolidated interest coverage ratio of 3.5 to 1. As of June 30, 2024 and December 31, 2023, the Company had $27.3 million in outstanding letters of credit under the Credit Facility, reducing available borrowing capacity, but no outstanding cash borrowings.
|
| X |
- References
+ Details
| Name: |
us-gaap_DebtDisclosureAbstract |
| Namespace Prefix: |
us-gaap_ |
| Data Type: |
xbrli:stringItemType |
| Balance Type: |
na |
| Period Type: |
duration |
|
| X |
- DefinitionThe entire disclosure for information about short-term and long-term debt arrangements, which includes amounts of borrowings under each line of credit, note payable, commercial paper issue, bonds indenture, debenture issue, own-share lending arrangements and any other contractual agreement to repay funds, and about the underlying arrangements, rationale for a classification as long-term, including repayment terms, interest rates, collateral provided, restrictions on use of assets and activities, whether or not in compliance with debt covenants, and other matters important to users of the financial statements, such as the effects of refinancing and noncompliance with debt covenants. Reference 1: http://www.xbrl.org/2003/role/disclosureRef
-Topic 470
-SubTopic 10
-Name Accounting Standards Codification
-Section 50
-Paragraph 6
-Subparagraph (b)
-Publisher FASB
-URI https://asc.fasb.org/1943274/2147481544/470-10-50-6
Reference 2: http://www.xbrl.org/2003/role/disclosureRef
-Topic 470
-SubTopic 10
-Name Accounting Standards Codification
-Section 50
-Paragraph 6
-Subparagraph (a)
-Publisher FASB
-URI https://asc.fasb.org/1943274/2147481544/470-10-50-6
Reference 3: http://www.xbrl.org/2003/role/disclosureRef
-Topic 405
-SubTopic 40
-Name Accounting Standards Codification
-Section 50
-Paragraph 1
-Subparagraph (d)
-Publisher FASB
-URI https://asc.fasb.org/1943274/2147477092/405-40-50-1
Reference 4: http://www.xbrl.org/2003/role/disclosureRef
-Topic 405
-SubTopic 40
-Name Accounting Standards Codification
-Section 50
-Paragraph 1
-Subparagraph (a)(3)
-Publisher FASB
-URI https://asc.fasb.org/1943274/2147477092/405-40-50-1
Reference 5: http://www.xbrl.org/2003/role/disclosureRef
-Topic 405
-SubTopic 40
-Name Accounting Standards Codification
-Section 50
-Paragraph 1
-Subparagraph (a)(2)
-Publisher FASB
-URI https://asc.fasb.org/1943274/2147477092/405-40-50-1
Reference 6: http://www.xbrl.org/2003/role/disclosureRef
-Topic 405
-SubTopic 40
-Name Accounting Standards Codification
-Section 50
-Paragraph 1
-Subparagraph (a)(1)
-Publisher FASB
-URI https://asc.fasb.org/1943274/2147477092/405-40-50-1
Reference 7: http://www.xbrl.org/2003/role/disclosureRef
-Topic 405
-SubTopic 40
-Name Accounting Standards Codification
-Section 50
-Paragraph 1
-Subparagraph (a)
-Publisher FASB
-URI https://asc.fasb.org/1943274/2147477092/405-40-50-1
Reference 8: http://www.xbrl.org/2003/role/disclosureRef
-Topic 470
-SubTopic 20
-Name Accounting Standards Codification
-Section 50
-Paragraph 1B
-Subparagraph (h)
-Publisher FASB
-URI https://asc.fasb.org/1943274/2147481139/470-20-50-1B
Reference 9: http://www.xbrl.org/2003/role/disclosureRef
-Topic 235
-SubTopic 10
-Name Accounting Standards Codification
-Section S99
-Paragraph 1
-Subparagraph (SX 210.4-08(c))
-Publisher FASB
-URI https://asc.fasb.org/1943274/2147480678/235-10-S99-1
Reference 10: http://fasb.org/us-gaap/role/ref/legacyRef
-Topic 470
-Name Accounting Standards Codification
-Publisher FASB
-URI https://asc.fasb.org/470/tableOfContent
Reference 11: http://www.xbrl.org/2003/role/disclosureRef
-Topic 835
-SubTopic 30
-Name Accounting Standards Codification
-Section 45
-Paragraph 2
-Publisher FASB
-URI https://asc.fasb.org/1943274/2147482925/835-30-45-2
Reference 12: http://www.xbrl.org/2003/role/disclosureRef
-Topic 470
-SubTopic 20
-Name Accounting Standards Codification
-Section 50
-Paragraph 1B
-Publisher FASB
-URI https://asc.fasb.org/1943274/2147481139/470-20-50-1B
Reference 13: http://www.xbrl.org/2003/role/disclosureRef
-Topic 470
-SubTopic 20
-Name Accounting Standards Codification
-Section 50
-Paragraph 1B
-Subparagraph (g)
-Publisher FASB
-URI https://asc.fasb.org/1943274/2147481139/470-20-50-1B
Reference 14: http://www.xbrl.org/2003/role/disclosureRef
-Topic 470
-SubTopic 20
-Name Accounting Standards Codification
-Section 50
-Paragraph 1B
-Subparagraph (i)
-Publisher FASB
-URI https://asc.fasb.org/1943274/2147481139/470-20-50-1B
Reference 15: http://www.xbrl.org/2003/role/disclosureRef
-Topic 470
-SubTopic 20
-Name Accounting Standards Codification
-Section 50
-Paragraph 1C
-Subparagraph (a)
-Publisher FASB
-URI https://asc.fasb.org/1943274/2147481139/470-20-50-1C
Reference 16: http://www.xbrl.org/2003/role/disclosureRef
-Topic 470
-SubTopic 20
-Name Accounting Standards Codification
-Section 50
-Paragraph 1C
-Subparagraph (b)
-Publisher FASB
-URI https://asc.fasb.org/1943274/2147481139/470-20-50-1C
Reference 17: http://www.xbrl.org/2003/role/disclosureRef
-Topic 470
-SubTopic 20
-Name Accounting Standards Codification
-Section 50
-Paragraph 1C
-Subparagraph (c)
-Publisher FASB
-URI https://asc.fasb.org/1943274/2147481139/470-20-50-1C
Reference 18: http://www.xbrl.org/2003/role/disclosureRef
-Topic 470
-SubTopic 20
-Name Accounting Standards Codification
-Section 50
-Paragraph 1E
-Subparagraph (b)
-Publisher FASB
-URI https://asc.fasb.org/1943274/2147481139/470-20-50-1E
Reference 19: http://www.xbrl.org/2003/role/disclosureRef
-Topic 470
-SubTopic 20
-Name Accounting Standards Codification
-Section 50
-Paragraph 1I
-Subparagraph (a)
-Publisher FASB
-URI https://asc.fasb.org/1943274/2147481139/470-20-50-1I
Reference 20: http://www.xbrl.org/2003/role/disclosureRef
-Topic 470
-SubTopic 20
-Name Accounting Standards Codification
-Section 50
-Paragraph 1I
-Subparagraph (b)
-Publisher FASB
-URI https://asc.fasb.org/1943274/2147481139/470-20-50-1I
Reference 21: http://www.xbrl.org/2003/role/disclosureRef
-Topic 470
-SubTopic 20
-Name Accounting Standards Codification
-Section 50
-Paragraph 1I
-Subparagraph (d)
-Publisher FASB
-URI https://asc.fasb.org/1943274/2147481139/470-20-50-1I
| Name: |
us-gaap_DebtDisclosureTextBlock |
| Namespace Prefix: |
us-gaap_ |
| Data Type: |
dtr-types:textBlockItemType |
| Balance Type: |
na |
| Period Type: |
duration |
|
v3.24.2
RESTRUCTURING
|
6 Months Ended |
Jun. 30, 2024 |
|---|
| Restructuring and Related Activities [Abstract] |
|
| RESTRUCTURING |
NOTE 9. RESTRUCTURING The Company has undertaken the following restructuring activities as it optimizes its go-to-market strategy and reassesses its office space needs: | | | | | | | | | | | | | (in thousands) | Three months ended | | Expense | | Office space reduction | March 31, 2023 | | $ | 1,241 | | | Employee severance and related benefits | June 30, 2023 | | $ | 1,581 | | Employee severance and related benefits and office space reduction | September 30, 2023 | | $ | 17,236 | | | Office space reduction | December 31, 2023 | | $ | 1,497 | | | Office space reduction | June 30, 2024 | | $ | 1,257 | |
Accrued employee severance and related benefits: Change for all restructuring actions: | | | | | | | | | | | | | Six Months Ended
June 30, | | (in thousands) | 2024 | | 2023 | | January 1, | $ | 8,095 | | | $ | 18,573 | | | Costs incurred | (238) | | | 2,387 | | | Cash disbursements | (3,852) | | | (17,521) | | | Currency translation adjustments | (169) | | | 185 | | | June 30, | $ | 3,836 | | | $ | 3,624 | |
Note: Accrued employee severance and related benefits is included in accrued compensation and related expenses.
|
| X |
- DefinitionThe entire disclosure for restructuring and related activities. Description of restructuring activities such as exit and disposal activities, include facts and circumstances leading to the plan, the expected plan completion date, the major types of costs associated with the plan activities, total expected costs, the accrual balance at the end of the period, and the periods over which the remaining accrual will be settled. Reference 1: http://www.xbrl.org/2003/role/disclosureRef
-Topic 420
-SubTopic 10
-Name Accounting Standards Codification
-Section S99
-Paragraph 2
-Subparagraph (SAB Topic 5.P.4.e)
-Publisher FASB
-URI https://asc.fasb.org/1943274/2147479823/420-10-S99-2
Reference 2: http://www.xbrl.org/2003/role/disclosureRef
-Topic 420
-SubTopic 10
-Name Accounting Standards Codification
-Section 50
-Paragraph 1
-Subparagraph (b)(2)
-Publisher FASB
-URI https://asc.fasb.org/1943274/2147482017/420-10-50-1
Reference 3: http://www.xbrl.org/2003/role/disclosureRef
-Topic 420
-SubTopic 10
-Name Accounting Standards Codification
-Section 50
-Paragraph 1
-Subparagraph (a)
-Publisher FASB
-URI https://asc.fasb.org/1943274/2147482017/420-10-50-1
Reference 4: http://www.xbrl.org/2003/role/disclosureRef
-Topic 420
-Name Accounting Standards Codification
-Publisher FASB
-URI https://asc.fasb.org/420/tableOfContent
Reference 5: http://www.xbrl.org/2003/role/disclosureRef
-Topic 420
-SubTopic 10
-Name Accounting Standards Codification
-Section 50
-Paragraph 1
-Subparagraph (e)
-Publisher FASB
-URI https://asc.fasb.org/1943274/2147482017/420-10-50-1
| Name: |
us-gaap_RestructuringAndRelatedActivitiesDisclosureTextBlock |
| Namespace Prefix: |
us-gaap_ |
| Data Type: |
dtr-types:textBlockItemType |
| Balance Type: |
na |
| Period Type: |
duration |
|
v3.24.2
FAIR VALUE MEASUREMENTS
|
6 Months Ended |
Jun. 30, 2024 |
|---|
| Fair Value Disclosures [Abstract] |
|
| FAIR VALUE MEASUREMENTS |
NOTE 10. FAIR VALUE MEASUREMENTS Assets and liabilities measured at fair value on a recurring basis The Company records its cash equivalents, marketable securities, Capped Call Transactions, and venture investments at fair value on a recurring basis. Fair value is an exit price, representing the amount that would be received from the sale of an asset or paid to transfer a liability in an orderly transaction between market participants based on assumptions that market participants would use in pricing an asset or liability. As a basis for classifying the fair value measurements, a three-tier fair value hierarchy, which classifies the fair value measurements based on the inputs used in measuring fair value, was established as follows: •Level 1 - observable inputs, such as quoted prices in active markets for identical assets or liabilities; •Level 2 - significant other inputs that are observable either directly or indirectly; and •Level 3 - significant unobservable inputs with little or no market data, which require the Company to develop its own assumptions. This hierarchy requires the Company to use observable market data when available and minimize unobservable inputs when determining fair value. The fair value of the Capped Call Transactions at the end of each reporting period is determined using a Black-Scholes option-pricing model. The valuation model uses various market-based inputs, including stock price, remaining contractual term, expected volatility, risk-free interest rate, and expected dividend yield. The Company applies judgment when determining expected volatility. The Company considers the underlying equity security’s historical and implied volatility levels. The Company’s venture investments are recorded at fair value based on multiple valuation methods, including observable public companies and transaction prices and unobservable inputs, including the volatility, rights, and obligations of the securities the Company holds. Assets and liabilities measured at fair value on a recurring basis: | | | | | | | | | | | | | | | | | | | | | | | | | | | | | | | | | | | | | | | | | | | | | | | | | June 30, 2024 | | December 31, 2023 | | (in thousands) | Level 1 | | Level 2 | | Level 3 | | Total | | Level 1 | | Level 2 | | Level 3 | | Total | | Cash equivalents | $ | 18,345 | | | $ | — | | | $ | — | | | $ | 18,345 | | | $ | 54,357 | | | $ | — | | | $ | — | | | $ | 54,357 | | | Marketable securities | $ | — | | | $ | 406,819 | | | $ | — | | | $ | 406,819 | | | $ | — | | | $ | 193,436 | | | $ | — | | | $ | 193,436 | | Capped Call Transactions | $ | — | | | $ | 915 | | | $ | — | | | $ | 915 | | | $ | — | | | $ | 893 | | | $ | — | | | $ | 893 | | Venture investments (1) | $ | — | | | $ | — | | | $ | 21,047 | | | $ | 21,047 | | | $ | — | | | $ | — | | | $ | 19,450 | | | $ | 19,450 | |
(1) Investments in privately-held companies Changes in venture investments: | | | | | | | | | | | | | Six Months Ended
June 30, | | (in thousands) | 2024 | | 2023 | | January 1, | $ | 19,450 | | | $ | 13,069 | | | New investments | 350 | | | 400 | | | Sales of investments | — | | | (2,773) | | | Changes in foreign exchange rates | (19) | | | 119 | | | Changes in fair value: | | | | included in other income, net | 1,628 | | | 4,475 | | included in other comprehensive income (loss) | (362) | | | (1,908) | | | June 30, | $ | 21,047 | | | $ | 13,382 | |
The carrying value of certain financial instruments, including receivables and accounts payable, approximates fair value due to their short maturities. Fair value of the Convertible Senior Notes The fair value of the Notes outstanding (including the embedded conversion feature) was $485.3 million as of June 30, 2024, and $466.5 million as of December 31, 2023. The fair value was determined based on the Notes’ quoted price in an over-the-counter market on the last trading day of the reporting period and classified within Level 2 in the fair value hierarchy.
|
| X |
- References
+ Details
| Name: |
us-gaap_FairValueDisclosuresAbstract |
| Namespace Prefix: |
us-gaap_ |
| Data Type: |
xbrli:stringItemType |
| Balance Type: |
na |
| Period Type: |
duration |
|
| X |
- DefinitionThe entire disclosure for the fair value of financial instruments (as defined), including financial assets and financial liabilities (collectively, as defined), and the measurements of those instruments as well as disclosures related to the fair value of non-financial assets and liabilities. Such disclosures about the financial instruments, assets, and liabilities would include: (1) the fair value of the required items together with their carrying amounts (as appropriate); (2) for items for which it is not practicable to estimate fair value, disclosure would include: (a) information pertinent to estimating fair value (including, carrying amount, effective interest rate, and maturity, and (b) the reasons why it is not practicable to estimate fair value; (3) significant concentrations of credit risk including: (a) information about the activity, region, or economic characteristics identifying a concentration, (b) the maximum amount of loss the entity is exposed to based on the gross fair value of the related item, (c) policy for requiring collateral or other security and information as to accessing such collateral or security, and (d) the nature and brief description of such collateral or security; (4) quantitative information about market risks and how such risks are managed; (5) for items measured on both a recurring and nonrecurring basis information regarding the inputs used to develop the fair value measurement; and (6) for items presented in the financial statement for which fair value measurement is elected: (a) information necessary to understand the reasons for the election, (b) discussion of the effect of fair value changes on earnings, (c) a description of [similar groups] items for which the election is made and the relation thereof to the balance sheet, the aggregate carrying value of items included in the balance sheet that are not eligible for the election; (7) all other required (as defined) and desired information. Reference 1: http://www.xbrl.org/2003/role/exampleRef
-Topic 820
-SubTopic 10
-Name Accounting Standards Codification
-Section 55
-Paragraph 107
-Publisher FASB
-URI https://asc.fasb.org/1943274/2147482078/820-10-55-107
Reference 2: http://www.xbrl.org/2003/role/exampleRef
-Topic 820
-SubTopic 10
-Name Accounting Standards Codification
-Section 55
-Paragraph 100
-Publisher FASB
-URI https://asc.fasb.org/1943274/2147482078/820-10-55-100
Reference 3: http://www.xbrl.org/2003/role/disclosureRef
-Topic 820
-SubTopic 10
-Name Accounting Standards Codification
-Section 50
-Paragraph 2
-Subparagraph (c)(3)
-Publisher FASB
-URI https://asc.fasb.org/1943274/2147482106/820-10-50-2
Reference 4: http://www.xbrl.org/2003/role/disclosureRef
-Topic 820
-SubTopic 10
-Name Accounting Standards Codification
-Section 50
-Paragraph 6A
-Subparagraph (a)
-Publisher FASB
-URI https://asc.fasb.org/1943274/2147482106/820-10-50-6A
Reference 5: http://www.xbrl.org/2003/role/disclosureRef
-Topic 820
-SubTopic 10
-Name Accounting Standards Codification
-Section 50
-Paragraph 2E
-Publisher FASB
-URI https://asc.fasb.org/1943274/2147482106/820-10-50-2E
Reference 6: http://www.xbrl.org/2003/role/disclosureRef
-Topic 820
-SubTopic 10
-Name Accounting Standards Codification
-Section 50
-Paragraph 6A
-Subparagraph (h)
-Publisher FASB
-URI https://asc.fasb.org/1943274/2147482106/820-10-50-6A
Reference 7: http://www.xbrl.org/2003/role/disclosureRef
-Topic 820
-SubTopic 10
-Name Accounting Standards Codification
-Section 50
-Paragraph 6A
-Subparagraph (f)
-Publisher FASB
-URI https://asc.fasb.org/1943274/2147482106/820-10-50-6A
Reference 8: http://www.xbrl.org/2003/role/disclosureRef
-Topic 820
-SubTopic 10
-Name Accounting Standards Codification
-Section 50
-Paragraph 6A
-Subparagraph (e)
-Publisher FASB
-URI https://asc.fasb.org/1943274/2147482106/820-10-50-6A
Reference 9: http://www.xbrl.org/2003/role/disclosureRef
-Topic 820
-SubTopic 10
-Name Accounting Standards Codification
-Section 50
-Paragraph 6A
-Subparagraph (d)
-Publisher FASB
-URI https://asc.fasb.org/1943274/2147482106/820-10-50-6A
Reference 10: http://www.xbrl.org/2003/role/disclosureRef
-Topic 820
-SubTopic 10
-Name Accounting Standards Codification
-Section 50
-Paragraph 2
-Subparagraph (h)
-Publisher FASB
-URI https://asc.fasb.org/1943274/2147482106/820-10-50-2
Reference 11: http://www.xbrl.org/2003/role/disclosureRef
-Topic 820
-SubTopic 10
-Name Accounting Standards Codification
-Section 50
-Paragraph 2
-Subparagraph (g)
-Publisher FASB
-URI https://asc.fasb.org/1943274/2147482106/820-10-50-2
Reference 12: http://www.xbrl.org/2003/role/disclosureRef
-Topic 940
-SubTopic 820
-Name Accounting Standards Codification
-Section 50
-Paragraph 1
-Subparagraph (a)
-Publisher FASB
-URI https://asc.fasb.org/1943274/2147478119/940-820-50-1
| Name: |
us-gaap_FairValueDisclosuresTextBlock |
| Namespace Prefix: |
us-gaap_ |
| Data Type: |
dtr-types:textBlockItemType |
| Balance Type: |
na |
| Period Type: |
duration |
|
v3.24.2
REVENUE
|
6 Months Ended |
Jun. 30, 2024 |
|---|
| Revenue from Contract with Customer [Abstract] |
|
| REVENUE |
NOTE 11. REVENUE Geographic revenue | | | | | | | | | | | | | | | | | | | | | | | | | | | | | | | | | | | | | Three Months Ended
June 30, | | Six Months Ended
June 30, | (Dollars in thousands) | 2024 | | 2023 | | 2024 | | 2023 | | U.S. | $ | 189,214 | | 54 | % | | $ | 150,385 | | 50 | % | | $ | 370,197 | | 55 | % | | $ | 334,904 | | 54 | % | | Other Americas | 21,314 | | 6 | % | | 19,505 | | 7 | % | | 43,100 | | 6 | % | | 34,516 | | 6 | % | | United Kingdom (“U.K.”) | 38,628 | | 11 | % | | 28,892 | | 10 | % | | 70,745 | | 10 | % | | 71,129 | | 11 | % | | Europe (excluding U.K.), Middle East, and Africa | 53,360 | | 15 | % | | 54,353 | | 18 | % | | 115,207 | | 17 | % | | 105,671 | | 17 | % | | Asia-Pacific | 48,637 | | 14 | % | | 45,133 | | 15 | % | | 82,051 | | 12 | % | | 77,520 | | 12 | % | | $ | 351,153 | | 100 | % | | $ | 298,268 | | 100 | % | | $ | 681,300 | | 100 | % | | $ | 623,740 | | 100 | % |
Revenue streams | | | | | | | | | | | | | | | | | | | | | | | | | Three Months Ended
June 30, | | Six Months Ended
June 30, | (in thousands) | 2024 | | 2023 | | 2024 | | 2023 | | Subscription license | $ | 84,647 | | | $ | 41,197 | | | $ | 147,985 | | | $ | 125,724 | | | Perpetual license | 36 | | | 1,579 | | | 895 | | | 1,982 | | | Revenue recognized at a point in time | 84,683 | | | 42,776 | | | 148,880 | | | 127,706 | | | Maintenance | 80,344 | | | 82,042 | | | 161,345 | | | 161,672 | | | Pega Cloud | 134,086 | | | 115,063 | | | 264,988 | | | 222,942 | | | Consulting | 52,040 | | | 58,387 | | | 106,087 | | | 111,420 | | | Revenue recognized over time | 266,470 | | | 255,492 | | | 532,420 | | | 496,034 | | | Total revenue | $ | 351,153 | | | $ | 298,268 | | | $ | 681,300 | | | $ | 623,740 | |
| | | | | | | | | | | | | | | | | | | | | | | | | Three Months Ended
June 30, | | Six Months Ended
June 30, | | (in thousands) | 2024 | | 2023 | | 2024 | | 2023 | | Pega Cloud | $ | 134,086 | | | $ | 115,063 | | | $ | 264,988 | | | $ | 222,942 | | | Maintenance | 80,344 | | | 82,042 | | | 161,345 | | | 161,672 | | | Subscription services | 214,430 | | | 197,105 | | | 426,333 | | | 384,614 | | | Subscription license | 84,647 | | | 41,197 | | | 147,985 | | | 125,724 | | | Subscription | 299,077 | | | 238,302 | | | 574,318 | | | 510,338 | | | Consulting | 52,040 | | | 58,387 | | | 106,087 | | | 111,420 | | | Perpetual license | 36 | | | 1,579 | | | 895 | | | 1,982 | | | $ | 351,153 | | | $ | 298,268 | | | $ | 681,300 | | | $ | 623,740 | |
Remaining performance obligations ("Backlog") Expected future revenue from existing non-cancellable contracts: As of June 30, 2024: | | | | | | | | | | | | | | | | | | | | | | | | | | | | | | | | | | | | | | | | (Dollars in thousands) | Subscription services | | Subscription license | | Perpetual license | | Consulting | | Total | | Pega Cloud | | Maintenance | | | | | 1 year or less | $ | 470,379 | | | $ | 209,655 | | | $ | 23,931 | | | $ | 2,696 | | | $ | 25,953 | | | $ | 732,614 | | 52 | % | 1-2 years | 301,070 | | | 63,266 | | | 10,078 | | | — | | | 2,469 | | | 376,883 | | 27 | % | 2-3 years | 152,839 | | | 30,032 | | | 2,884 | | | — | | | 2,473 | | | 188,228 | | 13 | % | Greater than 3 years | 90,474 | | | 17,953 | | | 97 | | | — | | | — | | | 108,524 | | 8 | % | | $ | 1,014,762 | | | $ | 320,906 | | | $ | 36,990 | | | $ | 2,696 | | | $ | 30,895 | | | $ | 1,406,249 | | 100 | % |
As of June 30, 2023: | | | | | | | | | | | | | | | | | | | | | | | | | | | | | | | | | | | | | | | | (Dollars in thousands) | Subscription services | | Subscription license | | Perpetual license | | Consulting | | Total | | Pega Cloud | | Maintenance | | | | | 1 year or less | $ | 397,183 | | | $ | 214,579 | | | $ | 35,616 | | | $ | 4,979 | | | $ | 37,355 | | | $ | 689,712 | | 55 | % | 1-2 years | 238,691 | | | 58,551 | | | 3,026 | | | 2,252 | | | 6,772 | | | 309,292 | | 24 | % | 2-3 years | 124,616 | | | 25,103 | | | 6,764 | | | — | | | 1,523 | | | 158,006 | | 12 | % | Greater than 3 years | 101,494 | | | 7,592 | | | — | | | — | | | — | | | 109,086 | | 9 | % | | $ | 861,984 | | | $ | 305,825 | | | $ | 45,406 | | | $ | 7,231 | | | $ | 45,650 | | | $ | 1,266,096 | | 100 | % |
|
| X |
- References
+ Details
| Name: |
us-gaap_RevenueFromContractWithCustomerAbstract |
| Namespace Prefix: |
us-gaap_ |
| Data Type: |
xbrli:stringItemType |
| Balance Type: |
na |
| Period Type: |
duration |
|
| X |
- DefinitionThe entire disclosure of revenue from contract with customer to transfer good or service and to transfer nonfinancial asset. Includes, but is not limited to, disaggregation of revenue, credit loss recognized from contract with customer, judgment and change in judgment related to contract with customer, and asset recognized from cost incurred to obtain or fulfill contract with customer. Excludes insurance and lease contracts. Reference 1: http://www.xbrl.org/2003/role/disclosureRef
-Topic 606
-SubTopic 10
-Name Accounting Standards Codification
-Section 50
-Paragraph 9
-Publisher FASB
-URI https://asc.fasb.org/1943274/2147479806/606-10-50-9
Reference 2: http://www.xbrl.org/2003/role/disclosureRef
-Topic 606
-SubTopic 10
-Name Accounting Standards Codification
-Section 50
-Paragraph 10
-Publisher FASB
-URI https://asc.fasb.org/1943274/2147479806/606-10-50-10
Reference 3: http://www.xbrl.org/2003/role/disclosureRef
-Topic 606
-SubTopic 10
-Name Accounting Standards Codification
-Section 50
-Paragraph 15
-Publisher FASB
-URI https://asc.fasb.org/1943274/2147479806/606-10-50-15
Reference 4: http://www.xbrl.org/2003/role/disclosureRef
-Topic 606
-SubTopic 10
-Name Accounting Standards Codification
-Section 50
-Paragraph 12
-Subparagraph (a)
-Publisher FASB
-URI https://asc.fasb.org/1943274/2147479806/606-10-50-12
Reference 5: http://www.xbrl.org/2003/role/disclosureRef
-Topic 606
-SubTopic 10
-Name Accounting Standards Codification
-Section 50
-Paragraph 12
-Subparagraph (b)
-Publisher FASB
-URI https://asc.fasb.org/1943274/2147479806/606-10-50-12
Reference 6: http://www.xbrl.org/2003/role/disclosureRef
-Topic 606
-SubTopic 10
-Name Accounting Standards Codification
-Section 50
-Paragraph 12
-Subparagraph (c)
-Publisher FASB
-URI https://asc.fasb.org/1943274/2147479806/606-10-50-12
Reference 7: http://www.xbrl.org/2003/role/disclosureRef
-Topic 606
-SubTopic 10
-Name Accounting Standards Codification
-Section 50
-Paragraph 12
-Subparagraph (d)
-Publisher FASB
-URI https://asc.fasb.org/1943274/2147479806/606-10-50-12
Reference 8: http://www.xbrl.org/2003/role/disclosureRef
-Topic 606
-SubTopic 10
-Name Accounting Standards Codification
-Section 50
-Paragraph 12
-Subparagraph (e)
-Publisher FASB
-URI https://asc.fasb.org/1943274/2147479806/606-10-50-12
Reference 9: http://www.xbrl.org/2003/role/disclosureRef
-Topic 606
-SubTopic 10
-Name Accounting Standards Codification
-Section 50
-Paragraph 13
-Subparagraph (b)(2)
-Publisher FASB
-URI https://asc.fasb.org/1943274/2147479806/606-10-50-13
Reference 10: http://www.xbrl.org/2003/role/disclosureRef
-Name Accounting Standards Codification
-Topic 606
-Publisher FASB
-URI https://asc.fasb.org/606/tableOfContent
| Name: |
us-gaap_RevenueFromContractWithCustomerTextBlock |
| Namespace Prefix: |
us-gaap_ |
| Data Type: |
dtr-types:textBlockItemType |
| Balance Type: |
na |
| Period Type: |
duration |
|
v3.24.2
STOCK-BASED COMPENSATION
|
6 Months Ended |
Jun. 30, 2024 |
|---|
| Share-Based Payment Arrangement [Abstract] |
|
| STOCK-BASED COMPENSATION |
NOTE 12. STOCK-BASED COMPENSATION Expense | | | | | | | | | | | | | | | | | | | | | | | | | Three Months Ended
June 30, | | Six Months Ended
June 30, | | (in thousands) | 2024 | | 2023 | | 2024 | | 2023 | Cost of revenue | $ | 7,092 | | | $ | 7,174 | | | $ | 13,664 | | | $ | 16,087 | | Selling and marketing | 13,564 | | | 15,349 | | | 27,452 | | | 33,009 | | Research and development | 7,825 | | | 7,851 | | | 15,471 | | | 16,911 | | General and administrative | 7,743 | | | 5,853 | | | 14,418 | | | 12,777 | | | $ | 36,224 | | | $ | 36,227 | | | $ | 71,005 | | | $ | 78,784 | | Income tax benefit | $ | (554) | | | $ | (581) | | | $ | (865) | | | $ | (1,253) | |
As of June 30, 2024, the Company had $149.7 million of unrecognized stock-based compensation expense, net of estimated forfeitures, which is expected to be recognized over a weighted-average period of 1.7 years. Grants | | | | | | | | | | | | | Six Months Ended
June 30, 2024 | | (in thousands) | Quantity | | Total Fair Value | Restricted stock units (1) | 1,266 | | | $ | 78,071 | | Non-qualified stock options | 1,738 | | | $ | 44,874 | | Performance stock options (2) | 566 | | | $ | 13,921 | | | | | |
(1) Includes units issued when employees elect to receive 50% of the employee’s target incentive compensation under the Company’s Corporate Incentive Compensation Plan (the “CICP”) in the form of RSUs instead of cash. (2) Performance stock options allow the holder to purchase a specified number of common stock shares at an exercise price equal to or greater than the shares' fair market value at the grant date. For the performance stock options granted in the six months ended June 30, 2024, 25% can vest on the first anniversary of the grant date, and 75% can vest on the second anniversary of the grant date, based on the achievement of specific performance conditions. The options expire ten years from the grant date.
|
| X |
- DefinitionThe entire disclosure for share-based payment arrangement. Reference 1: http://www.xbrl.org/2003/role/exampleRef
-Topic 718
-SubTopic 10
-Name Accounting Standards Codification
-Section 50
-Paragraph 2
-Subparagraph (a)(1)
-Publisher FASB
-URI https://asc.fasb.org/1943274/2147480429/718-10-50-2
Reference 2: http://www.xbrl.org/2003/role/disclosureRef
-Topic 718
-Name Accounting Standards Codification
-Publisher FASB
-URI https://asc.fasb.org/718/tableOfContent
Reference 3: http://www.xbrl.org/2003/role/disclosureRef
-Topic 718
-SubTopic 10
-Name Accounting Standards Codification
-Section 50
-Paragraph 2
-Subparagraph (a)
-Publisher FASB
-URI https://asc.fasb.org/1943274/2147480429/718-10-50-2
Reference 4: http://www.xbrl.org/2003/role/disclosureRef
-Topic 718
-SubTopic 10
-Name Accounting Standards Codification
-Section 50
-Paragraph 2
-Subparagraph (h)(2)
-Publisher FASB
-URI https://asc.fasb.org/1943274/2147480429/718-10-50-2
Reference 5: http://www.xbrl.org/2003/role/disclosureRef
-Topic 718
-SubTopic 10
-Name Accounting Standards Codification
-Section 50
-Paragraph 2
-Subparagraph (h)(2)(i)
-Publisher FASB
-URI https://asc.fasb.org/1943274/2147480429/718-10-50-2
Reference 6: http://www.xbrl.org/2003/role/disclosureRef
-Topic 718
-SubTopic 10
-Name Accounting Standards Codification
-Section 50
-Paragraph 2
-Subparagraph (l)
-Publisher FASB
-URI https://asc.fasb.org/1943274/2147480429/718-10-50-2
| Name: |
us-gaap_DisclosureOfCompensationRelatedCostsShareBasedPaymentsTextBlock |
| Namespace Prefix: |
us-gaap_ |
| Data Type: |
dtr-types:textBlockItemType |
| Balance Type: |
na |
| Period Type: |
duration |
|
v3.24.2
INCOME TAXES
|
6 Months Ended |
Jun. 30, 2024 |
|---|
| Income Tax Disclosure [Abstract] |
|
| INCOME TAXES |
NOTE 13. INCOME TAXES Effective income tax rate | | | | | | | | | | | | | | | | | | | Six Months Ended
June 30, | | (Dollars in thousands) | | | | | 2024 | | 2023 | | Provision for income taxes | | | | | $ | 5,604 | | | $ | 11,850 | | | Effective income tax rate | | | | | * | | (21) | % |
* not meaningful The Company’s effective income tax rate for the six months ended June 30, 2024, is impacted by the jurisdictional mix and timing of the actual compared to projected earnings (losses). It is also impacted by the valuation allowance on its deferred tax assets in the U.S. and U.K. and a near break-even pretax income resulting in a not meaningful high effective income tax rate. The Company recognizes deferred tax assets to the extent that it believes that these assets are more likely than not to be realized. A deferred tax valuation allowance requires significant judgment and uncertainties, including assumptions about future taxable income. Quarterly, the Company reassesses the need for a valuation allowance on its net deferred tax assets by weighting all available and objectively verifiable negative and positive evidence, including projected future reversals of existing taxable temporary differences, committed contractual backlog (“Backlog”), projected future taxable income, including the impact of enacted legislation, tax-planning strategies, and recent operating results. The Company intends to maintain a valuation allowance on its U.S. and U.K. net deferred tax assets until sufficient evidence exists to support their realization.
|
| X |
- DefinitionThe entire disclosure for income tax. Reference 1: http://www.xbrl.org/2003/role/disclosureRef
-Topic 740
-SubTopic 10
-Name Accounting Standards Codification
-Section 50
-Paragraph 12
-Publisher FASB
-URI https://asc.fasb.org/1943274/2147482685/740-10-50-12
Reference 2: http://www.xbrl.org/2003/role/exampleRef
-Topic 740
-SubTopic 10
-Name Accounting Standards Codification
-Section 55
-Paragraph 231
-Publisher FASB
-URI https://asc.fasb.org/1943274/2147482663/740-10-55-231
Reference 3: http://www.xbrl.org/2003/role/disclosureRef
-Topic 740
-SubTopic 10
-Name Accounting Standards Codification
-Section 50
-Paragraph 12C
-Publisher FASB
-URI https://asc.fasb.org/1943274/2147482685/740-10-50-12C
Reference 4: http://www.xbrl.org/2003/role/disclosureRef
-Topic 740
-SubTopic 10
-Name Accounting Standards Codification
-Section 50
-Paragraph 12B
-Publisher FASB
-URI https://asc.fasb.org/1943274/2147482685/740-10-50-12B
Reference 5: http://www.xbrl.org/2003/role/disclosureRef
-Topic 740
-SubTopic 270
-Name Accounting Standards Codification
-Section 50
-Paragraph 1
-Publisher FASB
-URI https://asc.fasb.org/1943274/2147477891/740-270-50-1
Reference 6: http://www.xbrl.org/2003/role/disclosureRef
-Topic 740
-SubTopic 10
-Name Accounting Standards Codification
-Section S99
-Paragraph 1
-Subparagraph (SAB Topic 6.I.5.Q1)
-Publisher FASB
-URI https://asc.fasb.org/1943274/2147479360/740-10-S99-1
Reference 7: http://www.xbrl.org/2003/role/disclosureRef
-Topic 946
-SubTopic 20
-Name Accounting Standards Codification
-Section 50
-Paragraph 13
-Publisher FASB
-URI https://asc.fasb.org/1943274/2147480990/946-20-50-13
Reference 8: http://www.xbrl.org/2003/role/disclosureRef
-Topic 235
-SubTopic 10
-Name Accounting Standards Codification
-Section S99
-Paragraph 1
-Subparagraph (SX 210.4-08(h)(2))
-Publisher FASB
-URI https://asc.fasb.org/1943274/2147480678/235-10-S99-1
Reference 9: http://www.xbrl.org/2003/role/disclosureRef
-Topic 740
-Name Accounting Standards Codification
-Publisher FASB
-URI https://asc.fasb.org/740/tableOfContent
Reference 10: http://www.xbrl.org/2003/role/disclosureRef
-Topic 740
-SubTopic 10
-Name Accounting Standards Codification
-Section 50
-Paragraph 14
-Publisher FASB
-URI https://asc.fasb.org/1943274/2147482685/740-10-50-14
Reference 11: http://www.xbrl.org/2003/role/disclosureRef
-Topic 740
-SubTopic 10
-Name Accounting Standards Codification
-Section 50
-Paragraph 21
-Publisher FASB
-URI https://asc.fasb.org/1943274/2147482685/740-10-50-21
Reference 12: http://www.xbrl.org/2003/role/disclosureRef
-Topic 740
-SubTopic 10
-Name Accounting Standards Codification
-Section 50
-Paragraph 17
-Subparagraph (b)
-Publisher FASB
-URI https://asc.fasb.org/1943274/2147482685/740-10-50-17
Reference 13: http://www.xbrl.org/2003/role/disclosureRef
-Topic 740
-SubTopic 10
-Name Accounting Standards Codification
-Section S99
-Paragraph 2
-Subparagraph (SAB Topic 11.C)
-Publisher FASB
-URI https://asc.fasb.org/1943274/2147479360/740-10-S99-2
Reference 14: http://www.xbrl.org/2003/role/disclosureRef
-Topic 740
-SubTopic 30
-Name Accounting Standards Codification
-Section 50
-Paragraph 2
-Subparagraph (a)
-Publisher FASB
-URI https://asc.fasb.org/1943274/2147482603/740-30-50-2
| Name: |
us-gaap_IncomeTaxDisclosureTextBlock |
| Namespace Prefix: |
us-gaap_ |
| Data Type: |
dtr-types:textBlockItemType |
| Balance Type: |
na |
| Period Type: |
duration |
|
v3.24.2
EARNINGS (LOSS) PER SHARE
|
6 Months Ended |
Jun. 30, 2024 |
|---|
| Earnings Per Share [Abstract] |
|
| EARNINGS (LOSS) PER SHARE |
NOTE 14. EARNINGS (LOSS) PER SHARE Basic earnings (loss) per share is calculated using the weighted-average number of common shares outstanding during the period. Diluted earnings (loss) per share is calculated using the weighted-average number of common shares outstanding during the period, plus the dilutive effect of outstanding stock options, RSUs, and convertible senior notes. Calculation of earnings (loss) per share: | | | | | | | | | | | | | | | | | | | | | | | | | Three Months Ended
June 30, | | Six Months Ended
June 30, | | (in thousands, except per share amounts) | 2024 | | 2023 | | 2024 | | 2023 | | Net income (loss) | $ | 6,613 | | | $ | (46,804) | | | $ | (5,511) | | | $ | (67,578) | | | Weighted-average common shares outstanding | 85,157 | | | 83,039 | | | 84,712 | | | 82,823 | | | Earnings (loss) per share, basic | $ | 0.08 | | | $ | (0.56) | | | $ | (0.07) | | | $ | (0.82) | | | | | | | | | | | Net income (loss) | $ | 6,613 | | | $ | (46,804) | | | $ | (5,511) | | | $ | (67,578) | | | | | | | | | | | Numerator for diluted EPS | $ | 6,613 | | | $ | (46,804) | | | $ | (5,511) | | | $ | (67,578) | | | Weighted-average effect of dilutive securities: | | | | | | | | | | | | | | | | | Stock options | 2,164 | | | — | | | — | | | — | | | RSUs | 1,179 | | | — | | | — | | | — | | | Effect of dilutive securities | 3,343 | | | — | | | — | | | — | | Weighted-average common shares outstanding, assuming dilution (1) (2) (3) | 88,500 | | | 83,039 | | | 84,712 | | | 82,823 | | | Earnings (loss) per share, diluted | $ | 0.07 | | | $ | (0.56) | | | $ | (0.07) | | | $ | (0.82) | | | | | | | | | | Outstanding anti-dilutive stock options and RSUs (4) | 5 | | | 1,354 | | | 3,259 | | | 1,351 | |
(1) All dilutive securities are excluded when their inclusion would be anti-dilutive. (2) The shares underlying the conversion options in the Company’s Notes are included using the if-converted method, if dilutive in the period. If the outstanding conversion options were fully exercised, the Company would issue approximately 3.7 million shares as of June 30, 2024. (3) The Company’s Capped Call Transactions represent the equivalent of approximately 3.7 million shares of the Company’s common stock (representing the number of shares for which the Notes are convertible) as of June 30, 2024. The Capped Call Transactions are expected to reduce common stock dilution and/or offset any potential cash payments the Company must make, other than for principal and interest, upon conversion of the Notes, with such reduction and/or offset subject to a cap of $196.44. The Capped Call Transactions are excluded from weighted-average common shares outstanding, assuming dilution, in all periods as their effect would be anti-dilutive. (4) Outstanding stock options and RSUs that were anti-dilutive under the treasury stock method in the period were excluded from the computation of diluted earnings (loss) per share. These awards may be dilutive in the future.
|
| X |
- References
+ Details
| Name: |
us-gaap_EarningsPerShareAbstract |
| Namespace Prefix: |
us-gaap_ |
| Data Type: |
xbrli:stringItemType |
| Balance Type: |
na |
| Period Type: |
duration |
|
| X |
- DefinitionThe entire disclosure for earnings per share. Reference 1: http://www.xbrl.org/2003/role/disclosureRef
-Topic 260
-SubTopic 10
-Name Accounting Standards Codification
-Section 50
-Paragraph 1
-Subparagraph (c)
-Publisher FASB
-URI https://asc.fasb.org/1943274/2147482662/260-10-50-1
Reference 2: http://www.xbrl.org/2003/role/disclosureRef
-Topic 260
-Name Accounting Standards Codification
-Publisher FASB
-URI https://asc.fasb.org/260/tableOfContent
Reference 3: http://www.xbrl.org/2003/role/disclosureRef
-Topic 260
-SubTopic 10
-Name Accounting Standards Codification
-Section 50
-Paragraph 2
-Publisher FASB
-URI https://asc.fasb.org/1943274/2147482662/260-10-50-2
Reference 4: http://www.xbrl.org/2003/role/disclosureRef
-Topic 260
-SubTopic 10
-Name Accounting Standards Codification
-Section 50
-Paragraph 3
-Publisher FASB
-URI https://asc.fasb.org/1943274/2147482662/260-10-50-3
| Name: |
us-gaap_EarningsPerShareTextBlock |
| Namespace Prefix: |
us-gaap_ |
| Data Type: |
dtr-types:textBlockItemType |
| Balance Type: |
na |
| Period Type: |
duration |
|
v3.24.2
COMMITMENTS AND CONTINGENCIES
|
6 Months Ended |
Jun. 30, 2024 |
|---|
| Commitments and Contingencies Disclosure [Abstract] |
|
| COMMITMENTS AND CONTINGENCIES |
NOTE 15. COMMITMENTS AND CONTINGENCIES Commitments See "Note 7. Leases" for additional information. Legal proceedings In addition to the matters below, the Company is or may become involved in a variety of claims, demands, suits, investigations, and proceedings that arise from time to time relating to matters incidental to the ordinary course of the Company’s business, including actions concerning contracts, intellectual property, employment, benefits, and securities matters. Regardless of the outcome, legal disputes can have a material effect on the Company because of defense and settlement costs, diversion of management resources, and other factors. In addition, as the Company is a party to ongoing litigation, it is at least reasonably possible that the Company’s estimates will change in the near term, and the effect may be material. The Company had no accrued losses for litigation for the below matters as of June 30, 2024 and December 31, 2023. Appian Corp. v. Pegasystems Inc. & Youyong Zou The Company is a defendant in litigation brought by Appian in the Circuit Court of Fairfax County, Virginia (the “Court”) titled Appian Corp. v. Pegasystems Inc. & Youyong Zou, No. 2020-07216 (Fairfax Cty. Ct.). On May 9, 2022, the jury rendered its verdict finding that the Company had misappropriated one or more of Appian’s trade secrets, that the Company had violated the Virginia Computer Crimes Act, and that the trade secret misappropriation was willful and malicious. The jury awarded damages of $2,036,860,045 for trade secret misappropriation and $1.00 for violating the Virginia Computer Crimes Act. On September 15, 2022, the circuit court of Fairfax County entered judgment of $2,060,479,287, consisting of the damages previously awarded by the jury plus attorneys’ fees and costs, and stating that the judgment is subject to post-judgment interest at a rate of 6.0% per annum, from the date of the jury verdict (May 9, 2022) as to the amount of the jury verdict and from September 15, 2022 as to the amount of the award of attorneys’ fees and costs. On September 15, 2022, the Company filed a notice of appeal from the judgment. On September 29, 2022, the circuit court of Fairfax County approved a $25,000,000 letter of credit obtained by the Company to secure the judgment and entered an order suspending the judgment during the pendency of the Company’s appeal. A panel of the Court of Appeals of Virginia heard oral arguments on November 15, 2023, and will issue a written opinion in the future. Although it is not possible to predict timing, the entirety of the appeals process could potentially take years to complete. The Company continues to believe that it did not misappropriate any alleged trade secrets and that its sales of the Company’s products at issue were not caused by, or the result of, any alleged misappropriation of trade secrets. The Company is unable to reasonably estimate possible damages because of, among other things, uncertainty as to the outcome of appellate proceedings and/or any potential new trial resulting from the appellate proceedings. City of Fort Lauderdale Police and Firefighters’ Retirement System, Individually and on Behalf of All Others Similarly Situated v. Pegasystems Inc., Alan Trefler, and Kenneth Stillwell On May 19, 2022, a lawsuit was filed against the Company, the Company’s chief executive officer, and the Company’s chief operating and financial officer in the United States District Court for the Eastern District of Virginia Alexandria Division, captioned City of Fort Lauderdale Police and Firefighters’ Retirement System, Individually and on Behalf of All Others Similarly Situated v. Pegasystems Inc., Alan Trefler, and Kenneth Stillwell (Case 1:22-cv-00578-LMB-IDD). The complaint generally alleges, among other things, that the defendants violated Section 10(b) of the Securities Exchange Act of 1934, as amended (the “Exchange Act”) and Rule 10b-5 promulgated thereunder and that the individual defendants violated Section 20(a) of the Exchange Act, in each case by allegedly making materially false and/or misleading statements, as well as allegedly failing to disclose material adverse facts about the Company’s business, operations, and prospects, which caused the Company’s securities to trade at artificially inflated prices. The complaint seeks unspecified damages on behalf of a class of purchasers of the Company’s securities between May 29, 2020 and May 9, 2022. The litigation has since been transferred to the United States District Court for the District of Massachusetts (Case 1:22-cv-11220-WGY), and lead plaintiff class representatives - Central Pennsylvania Teamsters Pension Fund - Defined Benefit Plan, Central Pennsylvania Teamsters Pension Fund - Retirement Income Plan 1987, and Construction Industry Laborers Pension Fund - have been appointed. On October 18, 2022, a consolidated amended complaint was filed that does not add any new parties or legal claims, is based upon the same general factual allegations as the original complaint, and now seeks unspecified damages on behalf of a class of purchasers of the Company’s securities between June 16, 2020 and May 9, 2022. The Company moved to dismiss the consolidated amended complaint on December 19, 2022. The hearing on the Company’s motion to dismiss took place on May 17, 2023. After hearing argument from both sides, the Court denied the Company’s motion from the bench and stated that a written opinion would follow. On June 30, 2023, the Company filed its Answer to the complaint. On July 24, 2023, the Court issued its written opinion denying the motion to dismiss as to the Company and Defendant Trefler but granting the motion without prejudice as to Mr. Stillwell. On March 4, 2024, the parties agreed in principle to a proposed settlement of the litigation for an aggregate sum of $35 million. On April 23, 2024, the parties executed a stipulation of settlement. On April 23, 2024, the plaintiffs filed a motion seeking preliminary approval of the settlement. On May 15, 2024, the Court granted plaintiffs’ motion for preliminary approval of the settlement and scheduled a settlement hearing for September 19, 2024. The deadline for the proposed class of shareholders to object to the proposed settlement is August 29, 2024. In May 2024, the Company paid $32.4 million and the Company’s insurance carriers paid $2.6 million pending final approval of the settlement. It is possible that actual future losses related to the litigation could exceed the settlement amount if and to the extent that the court does not approve the proposed settlement. In re Pegasystems Inc., Derivative Litigation On November 21, 2022, a lawsuit was filed against the members of the Company’s board of directors, the Company’s chief operating and financial officer and the Company in the United States District Court for the District of Massachusetts, captioned Mary Larkin, derivatively on behalf of nominal defendant Pegasystems Inc. v. Peter Gyenes, Richard Jones, Christopher Lafond, Dianne Ledingham, Sharon Rowlands, Alan Trefler, Larry Weber, and Kenneth Stillwell, defendants, and Pegasystems Inc., nominal defendant (Case 1:22-cv-11985). The complaint generally alleges the defendants sold shares of the Company while in possession of material nonpublic information relating to (i) the litigation brought by Appian in the Circuit Court of Fairfax County, Virginia, described above, and (ii) alleged misconduct by Company employees alleged in that litigation. On April 28, 2023, a lawsuit was filed in the United States District Court for the District of Massachusetts by Dag Sagfors, derivatively on behalf of nominal defendant Pegasystems Inc., asserting breach of fiduciary duty and related claims relating to the Virginia Appian litigation against the same defendants as the Larkin lawsuit. On May 17, 2023, the Larkin and Sagfors cases were consolidated and a joint motion to stay the consolidated case is pending before the Court. The Company also has received confidential demand letters raising substantially the same allegations set forth in the foregoing derivative complaints. On April 12, 2023, the Company’s board of directors (other than Mr. Trefler, who recused himself), formed a committee consisting solely of independent directors, to review, analyze, and investigate the matters raised in the demands and to determine in good faith what actions (if any) are reasonably believed to be appropriate under similar circumstances and reasonably believed to be in the best interests of the Company in response to the demand letters. On June 28, 2024, a lawsuit was filed against members of the Company’s board of directors, certain employees of the Company and the Company in the Business Litigation Section of the Superior Court in Suffolk County, Massachusetts, captioned John Dwyer and Ray Gerber, Plaintiffs, v. Alan Trefler, Peter Gyenes, Richard Jones, Christopher Lafond, Dianne Ledingham, Sharon Rowlands, Larry Weber, Leon Trefler, Don Schuerman, Kerim Akgonul, and Benjamin Baril, Defendants, Pegasystems Inc., Nominal Defendant (Case 2484CV01734). The complaint generally alleges the defendants breached their fiduciary duties in connection with alleged misconduct by Company employees alleged in the litigation brought by Appian in the Circuit Court of Fairfax County, Virginia, described above, and alleges damages from the approximately $2 billion verdict in the litigation brought by Appian in the Circuit Court of Fairfax County, Virginia, described above, the recent class action settlement, and litigation costs from various proceedings. On July 17, 2024, the parties filed a stipulation with the court in which they agreed to extend defendants’ time to respond to the operative complaint to 45 days following a decision from the Virginia Court of Appeals. The Company is unable to reasonably estimate possible damages or a range of possible damages in these matters given the stage of the lawsuits and there being no specified quantum of damages sought in the complaints. SEC Inquiry Beginning in March 2023, the U.S. Securities and Exchange Commission (“SEC”) has requested certain information relating to, among other things, the accounting treatment of the Company’s above-described litigation with Appian Corporation. The Company is fully cooperating with the SEC’s requests.
|
| X |
- References
+ Details
| Name: |
us-gaap_CommitmentsAndContingenciesDisclosureAbstract |
| Namespace Prefix: |
us-gaap_ |
| Data Type: |
xbrli:stringItemType |
| Balance Type: |
na |
| Period Type: |
duration |
|
| X |
- DefinitionThe entire disclosure for commitments and contingencies. Reference 1: http://www.xbrl.org/2009/role/commonPracticeRef
-Topic 405
-SubTopic 30
-Name Accounting Standards Codification
-Publisher FASB
-URI https://asc.fasb.org/405-30/tableOfContent
Reference 2: http://www.xbrl.org/2003/role/disclosureRef
-Topic 440
-SubTopic 10
-Name Accounting Standards Codification
-Section 50
-Paragraph 4
-Subparagraph (a)
-Publisher FASB
-URI https://asc.fasb.org/1943274/2147482648/440-10-50-4
Reference 3: http://www.xbrl.org/2009/role/commonPracticeRef
-Topic 450
-Name Accounting Standards Codification
-Publisher FASB
-URI https://asc.fasb.org/450/tableOfContent
Reference 4: http://www.xbrl.org/2003/role/disclosureRef
-Topic 954
-SubTopic 440
-Name Accounting Standards Codification
-Section 50
-Paragraph 1
-Subparagraph (a)
-Publisher FASB
-URI https://asc.fasb.org/1943274/2147478522/954-440-50-1
Reference 5: http://www.xbrl.org/2003/role/disclosureRef
-Topic 440
-SubTopic 10
-Name Accounting Standards Codification
-Section 50
-Paragraph 4
-Subparagraph (c)
-Publisher FASB
-URI https://asc.fasb.org/1943274/2147482648/440-10-50-4
Reference 6: http://fasb.org/us-gaap/role/ref/legacyRef
-Topic 440
-Name Accounting Standards Codification
-Publisher FASB
-URI https://asc.fasb.org/440/tableOfContent
| Name: |
us-gaap_CommitmentsAndContingenciesDisclosureTextBlock |
| Namespace Prefix: |
us-gaap_ |
| Data Type: |
dtr-types:textBlockItemType |
| Balance Type: |
na |
| Period Type: |
duration |
|
v3.24.2
Pay vs Performance Disclosure - USD ($)
$ in Thousands |
3 Months Ended |
6 Months Ended |
Jun. 30, 2024 |
Mar. 31, 2024 |
Jun. 30, 2023 |
Mar. 31, 2023 |
Jun. 30, 2024 |
Jun. 30, 2023 |
| Pay vs Performance Disclosure |
|
|
|
|
|
|
| Net income (loss) |
$ 6,613
|
$ (12,124)
|
$ (46,804)
|
$ (20,774)
|
$ (5,511)
|
$ (67,578)
|
| X |
- ReferencesReference 1: http://www.xbrl.org/2003/role/presentationRef
-Publisher SEC
-Name Regulation S-K
-Number 229
-Section 402
-Subsection v
-Paragraph 1
| Name: |
ecd_PvpTable |
| Namespace Prefix: |
ecd_ |
| Data Type: |
xbrli:stringItemType |
| Balance Type: |
na |
| Period Type: |
duration |
|
| X |
- DefinitionThe portion of profit or loss for the period, net of income taxes, which is attributable to the parent. Reference 1: http://www.xbrl.org/2003/role/disclosureRef
-Topic 250
-SubTopic 10
-Name Accounting Standards Codification
-Section 50
-Paragraph 6
-Publisher FASB
-URI https://asc.fasb.org/1943274/2147483443/250-10-50-6
Reference 2: http://www.xbrl.org/2003/role/disclosureRef
-Topic 250
-SubTopic 10
-Name Accounting Standards Codification
-Section 50
-Paragraph 9
-Publisher FASB
-URI https://asc.fasb.org/1943274/2147483443/250-10-50-9
Reference 3: http://www.xbrl.org/2003/role/disclosureRef
-Topic 805
-SubTopic 60
-Name Accounting Standards Codification
-Section 65
-Paragraph 1
-Subparagraph (g)
-Publisher FASB
-URI https://asc.fasb.org/1943274/2147476176/805-60-65-1
Reference 4: http://www.xbrl.org/2003/role/disclosureRef
-Topic 740
-SubTopic 323
-Name Accounting Standards Codification
-Section 65
-Paragraph 2
-Subparagraph (g)(3)
-Publisher FASB
-URI https://asc.fasb.org/1943274/2147478666/740-323-65-2
Reference 5: http://fasb.org/us-gaap/role/ref/legacyRef
-Topic 220
-SubTopic 10
-Name Accounting Standards Codification
-Section S99
-Paragraph 2
-Subparagraph (SX 210.5-03(20))
-Publisher FASB
-URI https://asc.fasb.org/1943274/2147483621/220-10-S99-2
Reference 6: http://www.xbrl.org/2003/role/disclosureRef
-Topic 235
-SubTopic 10
-Name Accounting Standards Codification
-Section S99
-Paragraph 1
-Subparagraph (SX 210.4-08(g)(1)(ii))
-Publisher FASB
-URI https://asc.fasb.org/1943274/2147480678/235-10-S99-1
Reference 7: http://www.xbrl.org/2003/role/disclosureRef
-Topic 323
-SubTopic 10
-Name Accounting Standards Codification
-Section 50
-Paragraph 3
-Subparagraph (c)
-Publisher FASB
-URI https://asc.fasb.org/1943274/2147481687/323-10-50-3
Reference 8: http://www.xbrl.org/2003/role/disclosureRef
-Topic 825
-SubTopic 10
-Name Accounting Standards Codification
-Section 50
-Paragraph 28
-Subparagraph (f)
-Publisher FASB
-URI https://asc.fasb.org/1943274/2147482907/825-10-50-28
Reference 9: http://www.xbrl.org/2003/role/disclosureRef
-Topic 220
-SubTopic 10
-Name Accounting Standards Codification
-Section 50
-Paragraph 6
-Publisher FASB
-URI https://asc.fasb.org/1943274/2147482765/220-10-50-6
Reference 10: http://www.xbrl.org/2003/role/disclosureRef
-Topic 250
-SubTopic 10
-Name Accounting Standards Codification
-Section 50
-Paragraph 3
-Publisher FASB
-URI https://asc.fasb.org/1943274/2147483443/250-10-50-3
Reference 11: http://www.xbrl.org/2003/role/disclosureRef
-Topic 250
-SubTopic 10
-Name Accounting Standards Codification
-Section 50
-Paragraph 1
-Subparagraph (b)(2)
-Publisher FASB
-URI https://asc.fasb.org/1943274/2147483443/250-10-50-1
Reference 12: http://www.xbrl.org/2003/role/disclosureRef
-Topic 815
-SubTopic 40
-Name Accounting Standards Codification
-Section 65
-Paragraph 1
-Subparagraph (f)
-Publisher FASB
-URI https://asc.fasb.org/1943274/2147480175/815-40-65-1
Reference 13: http://www.xbrl.org/2003/role/disclosureRef
-Topic 250
-SubTopic 10
-Name Accounting Standards Codification
-Section 50
-Paragraph 8
-Publisher FASB
-URI https://asc.fasb.org/1943274/2147483443/250-10-50-8
Reference 14: http://www.xbrl.org/2003/role/disclosureRef
-Topic 250
-SubTopic 10
-Name Accounting Standards Codification
-Section 50
-Paragraph 11
-Subparagraph (a)
-Publisher FASB
-URI https://asc.fasb.org/1943274/2147483443/250-10-50-11
Reference 15: http://www.xbrl.org/2003/role/disclosureRef
-Topic 250
-SubTopic 10
-Name Accounting Standards Codification
-Section 50
-Paragraph 11
-Subparagraph (b)
-Publisher FASB
-URI https://asc.fasb.org/1943274/2147483443/250-10-50-11
Reference 16: http://www.xbrl.org/2003/role/disclosureRef
-Topic 250
-SubTopic 10
-Name Accounting Standards Codification
-Section 50
-Paragraph 4
-Publisher FASB
-URI https://asc.fasb.org/1943274/2147483443/250-10-50-4
Reference 17: http://www.xbrl.org/2003/role/exampleRef
-Topic 946
-SubTopic 830
-Name Accounting Standards Codification
-Section 55
-Paragraph 10
-Publisher FASB
-URI https://asc.fasb.org/1943274/2147479168/946-830-55-10
Reference 18: http://www.xbrl.org/2003/role/disclosureRef
-Topic 946
-SubTopic 220
-Name Accounting Standards Codification
-Section 45
-Paragraph 7
-Publisher FASB
-URI https://asc.fasb.org/1943274/2147479105/946-220-45-7
Reference 19: http://www.xbrl.org/2003/role/disclosureRef
-Topic 944
-SubTopic 220
-Name Accounting Standards Codification
-Section S99
-Paragraph 1
-Subparagraph (SX 210.7-04(18))
-Publisher FASB
-URI https://asc.fasb.org/1943274/2147477250/944-220-S99-1
Reference 20: http://www.xbrl.org/2003/role/disclosureRef
-Topic 946
-SubTopic 220
-Name Accounting Standards Codification
-Section S99
-Paragraph 1
-Subparagraph (SX 210.6-07(9))
-Publisher FASB
-URI https://asc.fasb.org/1943274/2147479134/946-220-S99-1
Reference 21: http://www.xbrl.org/2003/role/disclosureRef
-Topic 946
-SubTopic 220
-Name Accounting Standards Codification
-Section S99
-Paragraph 3
-Subparagraph (SX 210.6-09(1)(d))
-Publisher FASB
-URI https://asc.fasb.org/1943274/2147479134/946-220-S99-3
Reference 22: http://www.xbrl.org/2003/role/disclosureRef
-Topic 470
-SubTopic 10
-Name Accounting Standards Codification
-Section S99
-Paragraph 1A
-Subparagraph (SX 210.13-01(a)(4)(i))
-Publisher FASB
-URI https://asc.fasb.org/1943274/2147480097/470-10-S99-1A
Reference 23: http://www.xbrl.org/2009/role/commonPracticeRef
-Topic 470
-SubTopic 10
-Name Accounting Standards Codification
-Section S99
-Paragraph 1A
-Subparagraph (SX 210.13-01(a)(4)(ii))
-Publisher FASB
-URI https://asc.fasb.org/1943274/2147480097/470-10-S99-1A
Reference 24: http://www.xbrl.org/2003/role/disclosureRef
-Topic 470
-SubTopic 10
-Name Accounting Standards Codification
-Section S99
-Paragraph 1A
-Subparagraph (SX 210.13-01(a)(4)(iii)(A))
-Publisher FASB
-URI https://asc.fasb.org/1943274/2147480097/470-10-S99-1A
Reference 25: http://www.xbrl.org/2003/role/disclosureRef
-Topic 470
-SubTopic 10
-Name Accounting Standards Codification
-Section S99
-Paragraph 1A
-Subparagraph (SX 210.13-01(a)(4)(iv))
-Publisher FASB
-URI https://asc.fasb.org/1943274/2147480097/470-10-S99-1A
Reference 26: http://www.xbrl.org/2003/role/disclosureRef
-Topic 470
-SubTopic 10
-Name Accounting Standards Codification
-Section S99
-Paragraph 1A
-Subparagraph (SX 210.13-01(a)(5))
-Publisher FASB
-URI https://asc.fasb.org/1943274/2147480097/470-10-S99-1A
Reference 27: http://www.xbrl.org/2003/role/disclosureRef
-Topic 470
-SubTopic 10
-Name Accounting Standards Codification
-Section S99
-Paragraph 1B
-Subparagraph (SX 210.13-02(a)(4)(i))
-Publisher FASB
-URI https://asc.fasb.org/1943274/2147480097/470-10-S99-1B
Reference 28: http://www.xbrl.org/2003/role/disclosureRef
-Topic 470
-SubTopic 10
-Name Accounting Standards Codification
-Section S99
-Paragraph 1B
-Subparagraph (SX 210.13-02(a)(4)(iii)(A))
-Publisher FASB
-URI https://asc.fasb.org/1943274/2147480097/470-10-S99-1B
Reference 29: http://www.xbrl.org/2003/role/disclosureRef
-Topic 470
-SubTopic 10
-Name Accounting Standards Codification
-Section S99
-Paragraph 1B
-Subparagraph (SX 210.13-02(a)(4)(iii)(B))
-Publisher FASB
-URI https://asc.fasb.org/1943274/2147480097/470-10-S99-1B
Reference 30: http://www.xbrl.org/2003/role/disclosureRef
-Topic 470
-SubTopic 10
-Name Accounting Standards Codification
-Section S99
-Paragraph 1B
-Subparagraph (SX 210.13-02(a)(4)(iv))
-Publisher FASB
-URI https://asc.fasb.org/1943274/2147480097/470-10-S99-1B
Reference 31: http://www.xbrl.org/2003/role/disclosureRef
-Topic 470
-SubTopic 10
-Name Accounting Standards Codification
-Section S99
-Paragraph 1B
-Subparagraph (SX 210.13-02(a)(5))
-Publisher FASB
-URI https://asc.fasb.org/1943274/2147480097/470-10-S99-1B
Reference 32: http://www.xbrl.org/2003/role/disclosureRef
-Topic 260
-SubTopic 10
-Name Accounting Standards Codification
-Section 45
-Paragraph 60B
-Subparagraph (a)
-Publisher FASB
-URI https://asc.fasb.org/1943274/2147482689/260-10-45-60B
Reference 33: http://www.xbrl.org/2003/role/disclosureRef
-Topic 205
-SubTopic 20
-Name Accounting Standards Codification
-Section 50
-Paragraph 7
-Publisher FASB
-URI https://asc.fasb.org/1943274/2147483499/205-20-50-7
Reference 34: http://fasb.org/us-gaap/role/ref/legacyRef
-Topic 230
-SubTopic 10
-Name Accounting Standards Codification
-Section 45
-Paragraph 28
-Publisher FASB
-URI https://asc.fasb.org/1943274/2147482740/230-10-45-28
Reference 35: http://www.xbrl.org/2003/role/disclosureRef
-Topic 220
-SubTopic 10
-Name Accounting Standards Codification
-Section 45
-Paragraph 1A
-Subparagraph (a)
-Publisher FASB
-URI https://asc.fasb.org/1943274/2147482790/220-10-45-1A
Reference 36: http://www.xbrl.org/2003/role/disclosureRef
-Topic 220
-SubTopic 10
-Name Accounting Standards Codification
-Section 45
-Paragraph 1B
-Subparagraph (a)
-Publisher FASB
-URI https://asc.fasb.org/1943274/2147482790/220-10-45-1B
Reference 37: http://fasb.org/us-gaap/role/ref/legacyRef
-Topic 942
-SubTopic 220
-Name Accounting Standards Codification
-Section S99
-Paragraph 1
-Subparagraph (SX 210.9-04(22))
-Publisher FASB
-URI https://asc.fasb.org/1943274/2147478524/942-220-S99-1
| Name: |
us-gaap_NetIncomeLoss |
| Namespace Prefix: |
us-gaap_ |
| Data Type: |
xbrli:monetaryItemType |
| Balance Type: |
credit |
| Period Type: |
duration |
|
v3.24.2
Insider Trading Arrangements
shares in Thousands |
3 Months Ended |
6 Months Ended |
|
Jun. 30, 2024
shares
|
Jun. 30, 2024
shares
|
| Trading Arrangements, by Individual |
|
|
| Non-Rule 10b5-1 Arrangement Adopted |
false
|
|
| Rule 10b5-1 Arrangement Terminated |
false
|
|
| Non-Rule 10b5-1 Arrangement Terminated |
false
|
|
| Richard H. Jones [Member] |
|
|
| Trading Arrangements, by Individual |
|
|
| Material Terms of Trading Arrangement |
|
On April 30, 2024, Richard H. Jones, one of our directors, entered into a trading plan that provides for the sale of an aggregate of 50,000 shares of our common stock. The plan will terminate on April 30, 2025, subject to early termination for certain specified events set forth in the plan.
|
| Name |
Richard H. Jones
|
|
| Title |
directors
|
|
| Rule 10b5-1 Arrangement Adopted |
true
|
|
| Adoption Date |
April 30, 2024
|
|
| Arrangement Duration |
365 days
|
|
| Richard H. Jones Rule Trading Arrangement, Common Stock [Member] | Richard H. Jones [Member] |
|
|
| Trading Arrangements, by Individual |
|
|
| Aggregate Available |
50
|
50
|
| X |
- ReferencesReference 1: http://www.xbrl.org/2003/role/presentationRef
-Publisher SEC
-Name Regulation S-K
-Number 229
-Section 408
-Subsection a
-Paragraph 1
| Name: |
ecd_MtrlTermsOfTrdArrTextBlock |
| Namespace Prefix: |
ecd_ |
| Data Type: |
dtr-types:textBlockItemType |
| Balance Type: |
na |
| Period Type: |
duration |
|
| X |
- ReferencesReference 1: http://www.xbrl.org/2003/role/presentationRef
-Publisher SEC
-Name Regulation S-K
-Number 229
-Section 408
-Subsection a
-Paragraph 1
| Name: |
ecd_NonRule10b51ArrAdoptedFlag |
| Namespace Prefix: |
ecd_ |
| Data Type: |
xbrli:booleanItemType |
| Balance Type: |
na |
| Period Type: |
duration |
|
| X |
- ReferencesReference 1: http://www.xbrl.org/2003/role/presentationRef
-Publisher SEC
-Name Regulation S-K
-Number 229
-Section 408
-Subsection a
-Paragraph 1
| Name: |
ecd_NonRule10b51ArrTrmntdFlag |
| Namespace Prefix: |
ecd_ |
| Data Type: |
xbrli:booleanItemType |
| Balance Type: |
na |
| Period Type: |
duration |
|
| X |
- ReferencesReference 1: http://www.xbrl.org/2003/role/presentationRef
-Publisher SEC
-Name Regulation S-K
-Number 229
-Section 408
-Subsection a
-Paragraph 1
| Name: |
ecd_Rule10b51ArrAdoptedFlag |
| Namespace Prefix: |
ecd_ |
| Data Type: |
xbrli:booleanItemType |
| Balance Type: |
na |
| Period Type: |
duration |
|
| X |
- ReferencesReference 1: http://www.xbrl.org/2003/role/presentationRef
-Publisher SEC
-Name Regulation S-K
-Number 229
-Section 408
-Subsection a
-Paragraph 1
| Name: |
ecd_Rule10b51ArrTrmntdFlag |
| Namespace Prefix: |
ecd_ |
| Data Type: |
xbrli:booleanItemType |
| Balance Type: |
na |
| Period Type: |
duration |
|
| X |
- ReferencesReference 1: http://www.xbrl.org/2003/role/presentationRef
-Publisher SEC
-Name Regulation S-K
-Number 229
-Section 408
-Subsection a
-Paragraph 2
-Subparagraph A
| Name: |
ecd_TradingArrByIndTable |
| Namespace Prefix: |
ecd_ |
| Data Type: |
xbrli:stringItemType |
| Balance Type: |
na |
| Period Type: |
duration |
|
| X |
- ReferencesReference 1: http://www.xbrl.org/2003/role/presentationRef
-Publisher SEC
-Name Regulation S-K
-Number 229
-Section 408
-Subsection a
-Paragraph 2
-Subparagraph B
| Name: |
ecd_TrdArrAdoptionDate |
| Namespace Prefix: |
ecd_ |
| Data Type: |
xbrli:stringItemType |
| Balance Type: |
na |
| Period Type: |
duration |
|
| X |
- ReferencesReference 1: http://www.xbrl.org/2003/role/presentationRef
-Publisher SEC
-Name Regulation S-K
-Number 229
-Section 408
-Subsection a
-Paragraph 2
-Subparagraph C
| Name: |
ecd_TrdArrDuration |
| Namespace Prefix: |
ecd_ |
| Data Type: |
xbrli:durationItemType |
| Balance Type: |
na |
| Period Type: |
duration |
|
| X |
- ReferencesReference 1: http://www.xbrl.org/2003/role/presentationRef
-Publisher SEC
-Name Regulation S-K
-Number 229
-Section 408
-Subsection a
-Paragraph 2
-Subparagraph A
| Name: |
ecd_TrdArrIndName |
| Namespace Prefix: |
ecd_ |
| Data Type: |
xbrli:stringItemType |
| Balance Type: |
na |
| Period Type: |
duration |
|
| X |
- ReferencesReference 1: http://www.xbrl.org/2003/role/presentationRef
-Publisher SEC
-Name Regulation S-K
-Number 229
-Section 408
-Subsection a
-Paragraph 2
-Subparagraph A
| Name: |
ecd_TrdArrIndTitle |
| Namespace Prefix: |
ecd_ |
| Data Type: |
xbrli:stringItemType |
| Balance Type: |
na |
| Period Type: |
duration |
|
| X |
- ReferencesReference 1: http://www.xbrl.org/2003/role/presentationRef
-Publisher SEC
-Name Regulation S-K
-Number 229
-Section 408
-Subsection a
-Paragraph 2
-Subparagraph D
| Name: |
ecd_TrdArrSecuritiesAggAvailAmt |
| Namespace Prefix: |
ecd_ |
| Data Type: |
xbrli:sharesItemType |
| Balance Type: |
na |
| Period Type: |
instant |
|
| X |
- Details
| Name: |
ecd_IndividualAxis=pega_RichardH.JonesMember |
| Namespace Prefix: |
|
| Data Type: |
na |
| Balance Type: |
|
| Period Type: |
|
|
| X |
- Details
| Name: |
ecd_TradingArrAxis=pega_RichardH.JonesRuleTradingArrangementCommonStockMember |
| Namespace Prefix: |
|
| Data Type: |
na |
| Balance Type: |
|
| Period Type: |
|
|
v3.24.2
BASIS OF PRESENTATION (Policies)
|
6 Months Ended |
Jun. 30, 2024 |
|---|
| Accounting Policies [Abstract] |
|
| Basis of presentation |
Pegasystems Inc. (together with its subsidiaries, “the Company”) has prepared the accompanying unaudited condensed consolidated financial statements pursuant to the rules and regulations of the U.S. Securities and Exchange Commission (“SEC”) regarding interim financial reporting. Accordingly, they do not include all the information required by accounting principles generally accepted in the United States of America (“U.S.”) for complete financial statements and should be read in conjunction with the Company’s audited financial statements included in the Annual Report on Form 10-K for the year ended December 31, 2023. In the opinion of management, the Company has prepared the accompanying unaudited condensed consolidated financial statements on the same basis as its audited financial statements, and these financial statements include all adjustments, consisting only of normal recurring adjustments, necessary for a fair presentation of the results of the interim periods presented. All intercompany transactions and balances were eliminated in consolidation. The operating results for the interim periods presented do not necessarily indicate the expected results for 2024.
|
| Assets and liabilities measured at fair value on a recurring basis |
Assets and liabilities measured at fair value on a recurring basis The Company records its cash equivalents, marketable securities, Capped Call Transactions, and venture investments at fair value on a recurring basis. Fair value is an exit price, representing the amount that would be received from the sale of an asset or paid to transfer a liability in an orderly transaction between market participants based on assumptions that market participants would use in pricing an asset or liability. As a basis for classifying the fair value measurements, a three-tier fair value hierarchy, which classifies the fair value measurements based on the inputs used in measuring fair value, was established as follows: •Level 1 - observable inputs, such as quoted prices in active markets for identical assets or liabilities; •Level 2 - significant other inputs that are observable either directly or indirectly; and •Level 3 - significant unobservable inputs with little or no market data, which require the Company to develop its own assumptions. This hierarchy requires the Company to use observable market data when available and minimize unobservable inputs when determining fair value. The fair value of the Capped Call Transactions at the end of each reporting period is determined using a Black-Scholes option-pricing model. The valuation model uses various market-based inputs, including stock price, remaining contractual term, expected volatility, risk-free interest rate, and expected dividend yield. The Company applies judgment when determining expected volatility. The Company considers the underlying equity security’s historical and implied volatility levels. The Company’s venture investments are recorded at fair value based on multiple valuation methods, including observable public companies and transaction prices and unobservable inputs, including the volatility, rights, and obligations of the securities the Company holds.
|
| X |
- References
+ Details
| Name: |
us-gaap_AccountingPoliciesAbstract |
| Namespace Prefix: |
us-gaap_ |
| Data Type: |
xbrli:stringItemType |
| Balance Type: |
na |
| Period Type: |
duration |
|
| X |
- DefinitionDisclosure of accounting policy for basis of accounting, or basis of presentation, used to prepare the financial statements (for example, US Generally Accepted Accounting Principles, Other Comprehensive Basis of Accounting, IFRS).
| Name: |
us-gaap_BasisOfAccountingPolicyPolicyTextBlock |
| Namespace Prefix: |
us-gaap_ |
| Data Type: |
dtr-types:textBlockItemType |
| Balance Type: |
na |
| Period Type: |
duration |
|
| X |
- DefinitionDisclosure of accounting policy for fair value measurements of financial and non-financial assets, liabilities and instruments classified in shareholders' equity. Disclosures include, but are not limited to, how an entity that manages a group of financial assets and liabilities on the basis of its net exposure measures the fair value of those assets and liabilities.
| Name: |
us-gaap_FairValueMeasurementPolicyPolicyTextBlock |
| Namespace Prefix: |
us-gaap_ |
| Data Type: |
dtr-types:textBlockItemType |
| Balance Type: |
na |
| Period Type: |
duration |
|
v3.24.2
MARKETABLE SECURITIES (Tables)
|
6 Months Ended |
Jun. 30, 2024 |
|---|
| Investments, Debt and Equity Securities [Abstract] |
|
| Schedule of Marketable Securities |
| | | | | | | | | | | | | | | | | | | | | | | | | | | | | | | | | | | | | | | | | | | | | | | | | June 30, 2024 | | December 31, 2023 | | (in thousands) | Amortized Cost | | Unrealized Gains | | Unrealized Losses | | Fair Value | | Amortized Cost | | Unrealized Gains | | Unrealized Losses | | Fair Value | | Government debt | $ | 12,942 | | | $ | — | | | $ | (17) | | | $ | 12,925 | | | $ | 11,471 | | | $ | 33 | | | $ | (1) | | | $ | 11,503 | | | Corporate debt | 394,521 | | | 1 | | | (628) | | | 393,894 | | | 181,960 | | | 200 | | | (227) | | | 181,933 | | | $ | 407,463 | | | $ | 1 | | | $ | (645) | | | $ | 406,819 | | | $ | 193,431 | | | $ | 233 | | | $ | (228) | | | $ | 193,436 | |
|
| X |
- References
+ Details
| Name: |
us-gaap_InvestmentsDebtAndEquitySecuritiesAbstract |
| Namespace Prefix: |
us-gaap_ |
| Data Type: |
xbrli:stringItemType |
| Balance Type: |
na |
| Period Type: |
duration |
|
| X |
- DefinitionTabular disclosure of the reconciliation of available-for-sale securities from cost basis to fair value.
| Name: |
us-gaap_ScheduleOfAvailableForSaleSecuritiesReconciliationTableTextBlock |
| Namespace Prefix: |
us-gaap_ |
| Data Type: |
dtr-types:textBlockItemType |
| Balance Type: |
na |
| Period Type: |
duration |
|
v3.24.2
RECEIVABLES, CONTRACT ASSETS, AND DEFERRED REVENUE (Tables)
|
6 Months Ended |
Jun. 30, 2024 |
|---|
| Receivables [Abstract] |
|
| Schedule of Receivables |
Receivables | | | | | | | | | | | | (in thousands) | June 30, 2024 | | December 31, 2023 | | Accounts receivable, net | $ | 165,723 | | | $ | 300,173 | | | Unbilled receivables, net | 164,533 | | | 237,379 | | Long-term unbilled receivables, net | 81,218 | | | 85,402 | | | $ | 411,474 | | | $ | 622,954 | |
|
| Schedule of Unbilled Receivables |
Unbilled receivables by expected collection date: | | | | | | | | | (Dollars in thousands) | June 30, 2024 | | 1 year or less | $ | 164,533 | | 67 | % | | 1-2 years | 58,353 | | 24 | % | | 2-5 years | 22,865 | | 9 | % | | $ | 245,751 | | 100 | % |
|
| Schedule of Unbilled Receivables by Contract Effective Date |
Unbilled receivables by contract effective date: | | | | | | | | | (Dollars in thousands) | June 30, 2024 | | 2024 | $ | 58,562 | | 24 | % | | 2023 | 130,140 | | 53 | % | | 2022 | 29,241 | | 12 | % | | 2021 | 22,830 | | 9 | % | | 2020 and prior | 4,978 | | 2 | % | | $ | 245,751 | | 100 | % |
|
| Schedule of Contract Assets and Deferred Revenue |
Contract assets Contract assets are client-committed amounts for which revenue recognized exceeds the amount billed to the client, and billing is subject to conditions other than the passage of time, such as the completion of a related performance obligation. | | | | | | | | | | | | (in thousands) | June 30, 2024 | | December 31, 2023 | Contract assets | $ | 15,374 | | | $ | 16,238 | | Long-term contract assets | 19,997 | | | 20,635 | | | $ | 35,371 | | | $ | 36,873 | |
Deferred revenue Deferred revenue consists of billings made and payments received in advance of revenue recognition. | | | | | | | | | | | | (in thousands) | June 30, 2024 | | December 31, 2023 | | Deferred revenue | $ | 352,618 | | | $ | 377,845 | | Long-term deferred revenue | 2,443 | | | 2,478 | | | $ | 355,061 | | | $ | 380,323 | |
|
| X |
- DefinitionAccounts Receivable and Unbilled Receivable
| Name: |
pega_AccountsReceivableAndUnbilledReceivableTableTextBlock |
| Namespace Prefix: |
pega_ |
| Data Type: |
dtr-types1:textBlockItemType |
| Balance Type: |
na |
| Period Type: |
duration |
|
| X |
- DefinitionContract assets and deferred revenue [Table Text Block].
| Name: |
pega_ContractAssetsAndDeferredRevenueTableTextBlock |
| Namespace Prefix: |
pega_ |
| Data Type: |
dtr-types1:textBlockItemType |
| Balance Type: |
na |
| Period Type: |
duration |
|
| X |
- DefinitionSchedule of unbilled receivables not billable at balance sheet date.
| Name: |
pega_ScheduleOfUnbilledReceivablesNotBillableAtBalanceSheetDateTableTextBlock |
| Namespace Prefix: |
pega_ |
| Data Type: |
dtr-types1:textBlockItemType |
| Balance Type: |
na |
| Period Type: |
duration |
|
| X |
- DefinitionSummary of Unbilled Receivables Based Upon Contract Effective Date
| Name: |
pega_SummaryOfUnbilledReceivablesBasedUponContractEffectiveDateTableTextBlock |
| Namespace Prefix: |
pega_ |
| Data Type: |
dtr-types1:textBlockItemType |
| Balance Type: |
na |
| Period Type: |
duration |
|
| X |
- References
+ Details
| Name: |
us-gaap_ReceivablesAbstract |
| Namespace Prefix: |
us-gaap_ |
| Data Type: |
xbrli:stringItemType |
| Balance Type: |
na |
| Period Type: |
duration |
|
v3.24.2
DEFERRED COMMISSIONS (Tables)
|
6 Months Ended |
Jun. 30, 2024 |
|---|
| Deferred Costs, Capitalized, Prepaid, and Other Assets Disclosure [Abstract] |
|
| Schedule of Impairment of Deferred Contract Costs |
| | | | | | | | | | | | (in thousands) | June 30, 2024 | | December 31, 2023 | Deferred commissions | $ | 100,490 | | | $ | 114,119 | |
|
| Schedule of Amortization of Deferred Contract Costs |
| | | | | | | | | | | | | | | | | | | | | | | | | Three Months Ended
June 30, | | Six Months Ended
June 30, | | (in thousands) | 2024 | | 2023 | | 2024 | | 2023 | Amortization of deferred commissions (1) | $ | 14,994 | | | $ | 14,750 | | | $ | 32,276 | | | $ | 29,027 | |
(1) Included in selling and marketing.
|
| X |
- DefinitionSchedule of amortization of deferred costs.
| Name: |
pega_ScheduleOfAmortizationOfDeferredCostsTableTextBlock |
| Namespace Prefix: |
pega_ |
| Data Type: |
dtr-types1:textBlockItemType |
| Balance Type: |
na |
| Period Type: |
duration |
|
| X |
- References
+ Details
| Name: |
us-gaap_DeferredCostsCapitalizedPrepaidAndOtherAssetsDisclosureAbstract |
| Namespace Prefix: |
us-gaap_ |
| Data Type: |
xbrli:stringItemType |
| Balance Type: |
na |
| Period Type: |
duration |
|
| X |
- DefinitionTabular disclosure of the amounts paid in advance for capitalized costs that will be expensed with the passage of time or the occurrence of a triggering event, and will be charged against earnings within one year or the normal operating cycle, if longer; the aggregate carrying amount of current assets, not separately presented elsewhere in the balance sheet; and other deferred costs.
| Name: |
us-gaap_DeferredCostsCapitalizedPrepaidAndOtherAssetsDisclosureTextBlock |
| Namespace Prefix: |
us-gaap_ |
| Data Type: |
dtr-types:textBlockItemType |
| Balance Type: |
na |
| Period Type: |
duration |
|
v3.24.2
GOODWILL AND OTHER INTANGIBLES (Tables)
|
6 Months Ended |
Jun. 30, 2024 |
|---|
| Goodwill and Intangible Assets Disclosure [Abstract] |
|
| Schedule of Goodwill |
| | | | | | | | | | | | | Six Months Ended
June 30, | (in thousands) | 2024 | | 2023 | | January 1, | $ | 81,611 | | | $ | 81,399 | | | | | | | Currency translation adjustments | (201) | | | 194 | | | June 30, | $ | 81,410 | | | $ | 81,593 | |
|
| Schedule of Intangibles |
Intangible assets are recorded at cost and amortized using the straight-line method over their estimated useful lives. | | | | | | | | | | | | | | | | | | | | | | | | | | | June 30, 2024 | | (in thousands) | Useful Lives | | Cost | | Accumulated Amortization | | Net Book Value | Client-related | 4-10 years | | $ | 63,112 | | | $ | (60,714) | | | $ | 2,398 | | Technology | 2-10 years | | 68,005 | | | (65,198) | | | 2,807 | | Other | 1-5 years | | 5,361 | | | (5,361) | | | — | | | | | $ | 136,478 | | | $ | (131,273) | | | $ | 5,205 | |
| | | | | | | | | | | | | | | | | | | | | | | | | | | December 31, 2023 | | (in thousands) | Useful Lives | | Cost | | Accumulated Amortization | | Net Book Value | | Client-related | 4-10 years | | $ | 63,117 | | | $ | (60,035) | | | $ | 3,082 | | | Technology | 2-10 years | | 68,138 | | | (64,218) | | | 3,920 | | | Other | 1-5 years | | 5,361 | | | (5,361) | | | — | | | | | $ | 136,616 | | | $ | (129,614) | | | $ | 7,002 | |
|
| Schedule of Future Estimated Intangibles Assets Amortization |
Future estimated amortization of intangible assets: | | | | | | (in thousands) | June 30, 2024 | | Remainder of 2024 | $ | 1,399 | | | 2025 | 2,605 | | | 2026 | 874 | | | 2027 | 327 | | | | | | | $ | 5,205 | |
|
| Schedule of Amortization of Intangible Assets |
Amortization of intangible assets: | | | | | | | | | | | | | | | | | | | | | | | | | Three Months Ended
June 30, | | Six Months Ended
June 30, | | (in thousands) | 2024 | | 2023 | | 2024 | | 2023 | Cost of revenue | $ | 447 | | | $ | 621 | | | $ | 1,068 | | | $ | 1,327 | | Selling and marketing | 342 | | | 342 | | | 685 | | | 685 | | | | | | | | | | | $ | 789 | | | $ | 963 | | | $ | 1,753 | | | $ | 2,012 | |
|
| X |
- DefinitionTabular disclosure of amortization expense of assets, excluding financial assets, that lack physical substance, having a limited useful life.
| Name: |
us-gaap_FiniteLivedIntangibleAssetsAmortizationExpenseTableTextBlock |
| Namespace Prefix: |
us-gaap_ |
| Data Type: |
dtr-types:textBlockItemType |
| Balance Type: |
na |
| Period Type: |
duration |
|
| X |
- References
+ Details
| Name: |
us-gaap_GoodwillAndIntangibleAssetsDisclosureAbstract |
| Namespace Prefix: |
us-gaap_ |
| Data Type: |
xbrli:stringItemType |
| Balance Type: |
na |
| Period Type: |
duration |
|
| X |
- DefinitionTabular disclosure of assets, excluding financial assets and goodwill, lacking physical substance with a finite life, by either major class or business segment. Reference 1: http://www.xbrl.org/2003/role/exampleRef
-Topic 350
-SubTopic 30
-Name Accounting Standards Codification
-Section 55
-Paragraph 40
-Publisher FASB
-URI https://asc.fasb.org/1943274/2147482640/350-30-55-40
Reference 2: http://www.xbrl.org/2009/role/commonPracticeRef
-Topic 350
-SubTopic 30
-Name Accounting Standards Codification
-Section 50
-Paragraph 2
-Subparagraph (a)
-Publisher FASB
-URI https://asc.fasb.org/1943274/2147482665/350-30-50-2
| Name: |
us-gaap_ScheduleOfFiniteLivedIntangibleAssetsTableTextBlock |
| Namespace Prefix: |
us-gaap_ |
| Data Type: |
dtr-types:textBlockItemType |
| Balance Type: |
na |
| Period Type: |
duration |
|
| X |
- DefinitionTabular disclosure of goodwill by reportable segment and in total which includes a rollforward schedule. Reference 1: http://www.xbrl.org/2003/role/exampleRef
-Topic 350
-SubTopic 20
-Name Accounting Standards Codification
-Section 55
-Paragraph 24
-Publisher FASB
-URI https://asc.fasb.org/1943274/2147482548/350-20-55-24
Reference 2: http://www.xbrl.org/2009/role/commonPracticeRef
-Topic 350
-SubTopic 20
-Name Accounting Standards Codification
-Section 50
-Paragraph 1
-Subparagraph (a)
-Publisher FASB
-URI https://asc.fasb.org/1943274/2147482573/350-20-50-1
Reference 3: http://www.xbrl.org/2009/role/commonPracticeRef
-Topic 350
-SubTopic 20
-Name Accounting Standards Codification
-Section 50
-Paragraph 1
-Subparagraph (h)
-Publisher FASB
-URI https://asc.fasb.org/1943274/2147482573/350-20-50-1
Reference 4: http://www.xbrl.org/2009/role/commonPracticeRef
-Topic 350
-SubTopic 20
-Name Accounting Standards Codification
-Section 50
-Paragraph 1
-Publisher FASB
-URI https://asc.fasb.org/1943274/2147482573/350-20-50-1
Reference 5: http://www.xbrl.org/2009/role/commonPracticeRef
-Topic 350
-SubTopic 20
-Name Accounting Standards Codification
-Section 50
-Paragraph 1
-Subparagraph (b)
-Publisher FASB
-URI https://asc.fasb.org/1943274/2147482573/350-20-50-1
Reference 6: http://www.xbrl.org/2009/role/commonPracticeRef
-Topic 350
-SubTopic 20
-Name Accounting Standards Codification
-Section 50
-Paragraph 1
-Subparagraph (c)
-Publisher FASB
-URI https://asc.fasb.org/1943274/2147482573/350-20-50-1
Reference 7: http://www.xbrl.org/2009/role/commonPracticeRef
-Topic 350
-SubTopic 20
-Name Accounting Standards Codification
-Section 50
-Paragraph 1
-Subparagraph (d)
-Publisher FASB
-URI https://asc.fasb.org/1943274/2147482573/350-20-50-1
Reference 8: http://www.xbrl.org/2009/role/commonPracticeRef
-Topic 350
-SubTopic 20
-Name Accounting Standards Codification
-Section 50
-Paragraph 1
-Subparagraph (e)
-Publisher FASB
-URI https://asc.fasb.org/1943274/2147482573/350-20-50-1
Reference 9: http://www.xbrl.org/2009/role/commonPracticeRef
-Topic 350
-SubTopic 20
-Name Accounting Standards Codification
-Section 50
-Paragraph 1
-Subparagraph (f)
-Publisher FASB
-URI https://asc.fasb.org/1943274/2147482573/350-20-50-1
Reference 10: http://www.xbrl.org/2009/role/commonPracticeRef
-Topic 350
-SubTopic 20
-Name Accounting Standards Codification
-Section 50
-Paragraph 1
-Subparagraph (g)
-Publisher FASB
-URI https://asc.fasb.org/1943274/2147482573/350-20-50-1
Reference 11: http://www.xbrl.org/2009/role/commonPracticeRef
-Topic 350
-SubTopic 20
-Name Accounting Standards Codification
-Section 50
-Paragraph 1A
-Publisher FASB
-URI https://asc.fasb.org/1943274/2147482573/350-20-50-1A
Reference 12: http://www.xbrl.org/2009/role/commonPracticeRef
-Topic 350
-SubTopic 20
-Name Accounting Standards Codification
-Section 50
-Paragraph 2
-Subparagraph (b)
-Publisher FASB
-URI https://asc.fasb.org/1943274/2147482573/350-20-50-2
| Name: |
us-gaap_ScheduleOfGoodwillTextBlock |
| Namespace Prefix: |
us-gaap_ |
| Data Type: |
dtr-types:textBlockItemType |
| Balance Type: |
na |
| Period Type: |
duration |
|
| X |
- DefinitionTabular disclosure of the amount of amortization expense expected to be recorded in succeeding fiscal years for finite-lived intangible assets. Reference 1: http://www.xbrl.org/2003/role/exampleRef
-Topic 350
-SubTopic 30
-Name Accounting Standards Codification
-Section 55
-Paragraph 40
-Publisher FASB
-URI https://asc.fasb.org/1943274/2147482640/350-30-55-40
Reference 2: http://www.xbrl.org/2009/role/commonPracticeRef
-Topic 350
-SubTopic 30
-Name Accounting Standards Codification
-Section 50
-Paragraph 2
-Subparagraph (a)(3)
-Publisher FASB
-URI https://asc.fasb.org/1943274/2147482665/350-30-50-2
| Name: |
us-gaap_ScheduleofFiniteLivedIntangibleAssetsFutureAmortizationExpenseTableTextBlock |
| Namespace Prefix: |
us-gaap_ |
| Data Type: |
dtr-types:textBlockItemType |
| Balance Type: |
na |
| Period Type: |
duration |
|
v3.24.2
OTHER ASSETS AND LIABILITIES (Tables)
|
6 Months Ended |
Jun. 30, 2024 |
|---|
| Other Assets and Liabilities [Abstract] |
|
| Schedule of Other Assets and Other Liabilities |
Other current assets | | | | | | | | | | | | | (in thousands) | June 30, 2024 | | December 31, 2023 | | Income tax receivables | $ | 16,060 | | | $ | 4,804 | | | Contract assets | 15,374 | | | 16,238 | | | Insurance receivable | — | | | 1,954 | | | Indirect tax receivable | 2,702 | | | 1,924 | | | Capped call transactions | 915 | | | — | | | Restricted cash | 768 | | | — | | | Other | 40,504 | | | 43,217 | | | $ | 76,323 | | | $ | 68,137 | |
Other long-term assets | | | | | | | | | | | | | (in thousands) | June 30, 2024 | | December 31, 2023 | | Deferred commissions | $ | 100,490 | | | $ | 114,119 | | | Right of use assets | 68,293 | | | 64,198 | | | Property and equipment | 42,190 | | | 47,279 | | | Venture investments | 21,047 | | | 19,450 | | | Contract assets | 19,997 | | | 20,635 | | | Intangible assets | 5,205 | | | 7,002 | | | Capped call transactions | — | | | 893 | | | Deferred income taxes | 3,666 | | | 3,678 | | | Restricted cash | 4,006 | | | 2,925 | | | Other | 37,355 | | | 34,517 | | | $ | 302,249 | | | $ | 314,696 | |
| | | | | | | | | | | | | (in thousands) | June 30, 2024 | | December 31, 2023 | | Operating lease liabilities | $ | 15,254 | | | $ | 15,000 | | | Dividends payable | 2,561 | | | 2,515 | | | Other | 2,862 | | | 3,828 | | | $ | 20,677 | | | $ | 21,343 | |
Other long-term liabilities | | | | | | | | | | | | | (in thousands) | June 30, 2024 | | December 31, 2023 | | Deferred revenue | $ | 2,443 | | | $ | 2,478 | | | Income taxes payable | 858 | | | 859 | | | Other | 11,061 | | | 10,233 | | | $ | 14,362 | | | $ | 13,570 | |
|
| Schedule of Accrued expenses |
Accrued expenses | | | | | | | | | | | | | (in thousands) | June 30, 2024 | | December 31, 2023 | | | | | | Cloud hosting | $ | 15,152 | | | $ | 1,358 | | | Outside professional services | 9,539 | | | 10,419 | | | Marketing and sales program | 7,081 | | | 2,557 | | | Income and other taxes | 3,422 | | | 15,428 | | | Employee related | 4,966 | | | 4,486 | | | Other | 4,715 | | | 5,693 | | | $ | 44,875 | | | $ | 39,941 | |
|
| X |
- DefinitionOther Assets and Liabilities
| Name: |
pega_OtherAssetsAndLiabilitiesAbstract |
| Namespace Prefix: |
pega_ |
| Data Type: |
xbrli:stringItemType |
| Balance Type: |
na |
| Period Type: |
duration |
|
| X |
- DefinitionTabular disclosure of the (a) carrying value as of the balance sheet date of liabilities incurred (and for which invoices have typically been received) and payable to vendors for goods and services received that are used in an entity's business (accounts payable); (b) other payables; and (c) accrued liabilities. Examples include taxes, interest, rent and utilities. Used to reflect the current portion of the liabilities (due within one year or within the normal operating cycle if longer). An alternative caption includes accrued expenses.
| Name: |
us-gaap_ScheduleOfAccountsPayableAndAccruedLiabilitiesTableTextBlock |
| Namespace Prefix: |
us-gaap_ |
| Data Type: |
dtr-types:textBlockItemType |
| Balance Type: |
na |
| Period Type: |
duration |
|
| X |
- DefinitionTabular disclosure of assets and liabilities, classified as other.
| Name: |
us-gaap_ScheduleOfOtherAssetsAndOtherLiabilitiesTableTextBlock |
| Namespace Prefix: |
us-gaap_ |
| Data Type: |
dtr-types:textBlockItemType |
| Balance Type: |
na |
| Period Type: |
duration |
|
v3.24.2
LEASES (Tables)
|
6 Months Ended |
Jun. 30, 2024 |
|---|
| Leases [Abstract] |
|
| Schedule of Expense |
| | | | | | | | | | | | | | | | | | | | | | | | | Three Months Ended
June 30, | | Six Months Ended
June 30, | | (in thousands) | 2024 | | 2023 | | 2024 | | 2023 | | Fixed lease costs | $ | 5,271 | | | $ | 4,495 | | | $ | 9,533 | | | $ | 10,261 | | | Short-term lease costs | 410 | | | 696 | | | 953 | | | 1,477 | | | Variable lease costs | 1,763 | | | 2,186 | | | 3,372 | | | 4,160 | | | $ | 7,444 | | | $ | 7,377 | | | $ | 13,858 | | | $ | 15,898 | |
|
| Schedule of Right of Use Asset and Lease Liabilities |
| | | | | | | | | | | | | (in thousands) | June 30, 2024 | | December 31, 2023 | Right of use assets | $ | 68,293 | | | $ | 64,198 | | Operating lease liabilities | $ | 15,254 | | | $ | 15,000 | | | Long-term operating lease liabilities | $ | 70,202 | | | $ | 66,901 | |
|
| Schedule of Weighted Average and Discount Rate |
Weighted-average remaining lease term and discount rate for the Company’s leases were: | | | | | | | | | | | | | June 30, 2024 | | December 31, 2023 | | Weighted-average remaining lease term | 6.4 years | | 6.8 years | Weighted-average discount rate (1) | 4.6 | % | | 4.0 | % |
(1) The rates implicit in the Company’s leases are not readily determinable. Therefore, the Company uses its incremental borrowing rate as the discount rate when measuring operating lease liabilities. The incremental borrowing rate represents an estimate of the interest rate the Company would incur to borrow an amount equal to the lease payments on a collateralized basis over the lease term in a similar economic environment.
|
| Schedule of Maturities of Lease Liabilities |
Maturities of lease liabilities: | | | | | | | (in thousands) | June 30, 2024 | | Remainder of 2024 | $ | 7,954 | | | 2025 | 18,784 | | | 2026 | 14,384 | | | 2027 | 13,387 | | | 2028 | 12,813 | | | 2029 | 10,099 | | | Thereafter | 21,650 | | | Total lease payments | 99,071 | | Less: imputed interest (1) | (13,615) | | | $ | 85,456 | |
(1) Lease liabilities are measured at the present value of the remaining lease payments using a discount rate determined at lease commencement unless the discount rate is updated due to a lease reassessment event.
|
| Schedule of Cash Flow Lease Information |
| | | | | | | | | | | | | Six Months Ended
June 30, | | (in thousands) | 2024 | | 2023 | | Cash paid for operating leases, net of tenant improvement allowances | $ | 9,493 | | | $ | 10,540 | | | Right of use assets recognized for new leases and amendments (non-cash) | $ | 12,290 | | | $ | 1,465 | |
|
| X |
- DefinitionAssets And Liabilities, Lessee [Table Text Block]
| Name: |
pega_AssetsAndLiabilitiesLesseeTableTextBlock |
| Namespace Prefix: |
pega_ |
| Data Type: |
dtr-types1:textBlockItemType |
| Balance Type: |
na |
| Period Type: |
duration |
|
| X |
- DefinitionSchedule Of Supplemental Cash Flow Lease Information [Table Text Block]
| Name: |
pega_ScheduleOfSupplementalCashFlowLeaseInformationTableTextBlock |
| Namespace Prefix: |
pega_ |
| Data Type: |
dtr-types1:textBlockItemType |
| Balance Type: |
na |
| Period Type: |
duration |
|
| X |
- DefinitionSchedule of Weighted Average and Discount Rate
| Name: |
pega_ScheduleOfWeightedAverageAndDiscountRateTableTextBlock |
| Namespace Prefix: |
pega_ |
| Data Type: |
dtr-types1:textBlockItemType |
| Balance Type: |
na |
| Period Type: |
duration |
|
| X |
- DefinitionTabular disclosure of lessee's lease cost. Includes, but is not limited to, interest expense for finance lease, amortization of right-of-use asset for finance lease, operating lease cost, short-term lease cost, variable lease cost and sublease income. Reference 1: http://www.xbrl.org/2009/role/commonPracticeRef
-Topic 842
-SubTopic 20
-Name Accounting Standards Codification
-Section 50
-Paragraph 4
-Publisher FASB
-URI https://asc.fasb.org/1943274/2147478964/842-20-50-4
| Name: |
us-gaap_LeaseCostTableTextBlock |
| Namespace Prefix: |
us-gaap_ |
| Data Type: |
dtr-types:textBlockItemType |
| Balance Type: |
na |
| Period Type: |
duration |
|
| X |
- References
+ Details
| Name: |
us-gaap_LeasesAbstract |
| Namespace Prefix: |
us-gaap_ |
| Data Type: |
xbrli:stringItemType |
| Balance Type: |
na |
| Period Type: |
duration |
|
| X |
- DefinitionTabular disclosure of undiscounted cash flows of lessee's operating lease liability. Includes, but is not limited to, reconciliation of undiscounted cash flows to operating lease liability recognized in statement of financial position. Reference 1: http://www.xbrl.org/2009/role/commonPracticeRef
-Topic 842
-SubTopic 20
-Name Accounting Standards Codification
-Section 50
-Paragraph 6
-Publisher FASB
-URI https://asc.fasb.org/1943274/2147478964/842-20-50-6
| Name: |
us-gaap_LesseeOperatingLeaseLiabilityMaturityTableTextBlock |
| Namespace Prefix: |
us-gaap_ |
| Data Type: |
dtr-types:textBlockItemType |
| Balance Type: |
na |
| Period Type: |
duration |
|
v3.24.2
DEBT (Tables)
|
6 Months Ended |
Jun. 30, 2024 |
|---|
| Debt Disclosure [Abstract] |
|
| Schedule of Carrying Value and Interest Expense Related to the Notes |
Carrying value of the Notes: | | | | | | | | | | | | | (in thousands) | June 30, 2024 | | December 31, 2023 | | Principal | $ | 502,270 | | | $ | 502,270 | | | Unamortized issuance costs | (1,666) | | | (2,902) | | | Convertible senior notes, net | $ | 500,604 | | | $ | 499,368 | |
Interest expense related to the Notes: | | | | | | | | | | | | | | | | | | | | | | | | | Three Months Ended
June 30, | | Six Months Ended
June 30, | | (in thousands) | 2024 | | 2023 | | 2024 | | 2023 | Contractual interest expense (0.75% coupon) | $ | 942 | | | $ | 997 | | | $ | 1,884 | | | $ | 2,122 | | Amortization of issuance costs | 619 | | | 647 | | | 1,236 | | | 1,375 | | | $ | 1,561 | | | $ | 1,644 | | | $ | 3,120 | | | $ | 3,497 | |
|
| Schedule of Future Payments |
Future payments: | | | | | | | | | | | | | | | | | | | June 30, 2024 | | (in thousands) | Principal | | Interest | | Total | | Remainder of 2024 | $ | — | | | $ | 1,883 | | | $ | 1,883 | | | 2025 | 502,270 | | | 1,884 | | | 504,154 | | | | | | | | | $ | 502,270 | | | $ | 3,767 | | | $ | 506,037 | |
|
| Schedule of Change in Capped Call Transactions |
Change in capped call transactions: | | | | | | | | | | | | | Six Months Ended
June 30, | | (in thousands) | 2024 | | 2023 | | January 1, | $ | 893 | | | $ | 2,582 | | | Settlements | — | | | (341) | | | Fair value adjustment | 22 | | | 1,845 | | | June 30, | $ | 915 | | | $ | 4,086 | |
|
| X |
- DefinitionTabular disclosure of contractual obligation by timing of payment due. Includes, but is not limited to, long-term debt obligation, lease obligation, and purchase obligation. Reference 1: http://www.xbrl.org/2009/role/commonPracticeRef
-Name Regulation S-X (SX)
-Number 210
-Section 12
-Subsection 04
-Subparagraph (a)
-Publisher SEC
Reference 2: http://www.xbrl.org/2009/role/commonPracticeRef
-Topic 235
-SubTopic 10
-Name Accounting Standards Codification
-Section S99
-Paragraph 3
-Subparagraph (SX 210.12-04(a))
-Publisher FASB
-URI https://asc.fasb.org/1943274/2147480678/235-10-S99-3
| Name: |
srt_ContractualObligationFiscalYearMaturityScheduleTableTextBlock |
| Namespace Prefix: |
srt_ |
| Data Type: |
dtr-types:textBlockItemType |
| Balance Type: |
na |
| Period Type: |
duration |
|
| X |
- References
+ Details
| Name: |
us-gaap_DebtDisclosureAbstract |
| Namespace Prefix: |
us-gaap_ |
| Data Type: |
xbrli:stringItemType |
| Balance Type: |
na |
| Period Type: |
duration |
|
| X |
- DefinitionTabular disclosure of long-debt instruments or arrangements, including identification, terms, features, collateral requirements and other information necessary to a fair presentation. These are debt arrangements that originally required repayment more than twelve months after issuance or greater than the normal operating cycle of the entity, if longer. Reference 1: http://fasb.org/us-gaap/role/ref/legacyRef
-Name Accounting Standards Codification
-Section S99
-Paragraph 1
-Subparagraph (SX 210.5-02(22))
-SubTopic 10
-Topic 210
-Publisher FASB
-URI https://asc.fasb.org/1943274/2147480566/210-10-S99-1
Reference 2: http://www.xbrl.org/2003/role/exampleRef
-Topic 470
-SubTopic 20
-Name Accounting Standards Codification
-Section 55
-Paragraph 69B
-Publisher FASB
-URI https://asc.fasb.org/1943274/2147481568/470-20-55-69B
Reference 3: http://www.xbrl.org/2003/role/exampleRef
-Topic 470
-SubTopic 20
-Name Accounting Standards Codification
-Section 55
-Paragraph 69E
-Publisher FASB
-URI https://asc.fasb.org/1943274/2147481568/470-20-55-69E
Reference 4: http://www.xbrl.org/2009/role/commonPracticeRef
-Topic 235
-SubTopic 10
-Name Accounting Standards Codification
-Section S99
-Paragraph 3
-Subparagraph (SX 210.12-04(a))
-Publisher FASB
-URI https://asc.fasb.org/1943274/2147480678/235-10-S99-3
Reference 5: http://www.xbrl.org/2009/role/commonPracticeRef
-Topic 835
-SubTopic 30
-Name Accounting Standards Codification
-Section 45
-Paragraph 2
-Publisher FASB
-URI https://asc.fasb.org/1943274/2147482925/835-30-45-2
Reference 6: http://fasb.org/us-gaap/role/ref/legacyRef
-Name Accounting Standards Codification
-Topic 505
-SubTopic 10
-Section 50
-Paragraph 3
-Publisher FASB
-URI https://asc.fasb.org/1943274/2147481112/505-10-50-3
Reference 7: http://fasb.org/us-gaap/role/ref/legacyRef
-Name Accounting Standards Codification
-Topic 942
-SubTopic 470
-Section 50
-Paragraph 3
-Publisher FASB
-URI https://asc.fasb.org/1943274/2147477734/942-470-50-3
Reference 8: http://fasb.org/us-gaap/role/ref/legacyRef
-Name Accounting Standards Codification
-Topic 505
-SubTopic 10
-Section 50
-Paragraph 8
-Publisher FASB
-URI https://asc.fasb.org/1943274/2147481112/505-10-50-8
Reference 9: http://fasb.org/us-gaap/role/ref/legacyRef
-Topic 505
-SubTopic 10
-Name Accounting Standards Codification
-Section 50
-Paragraph 6
-Publisher FASB
-URI https://asc.fasb.org/1943274/2147481112/505-10-50-6
Reference 10: http://fasb.org/us-gaap/role/ref/legacyRef
-Topic 505
-SubTopic 10
-Name Accounting Standards Codification
-Section 50
-Paragraph 7
-Publisher FASB
-URI https://asc.fasb.org/1943274/2147481112/505-10-50-7
| Name: |
us-gaap_ScheduleOfDebtInstrumentsTextBlock |
| Namespace Prefix: |
us-gaap_ |
| Data Type: |
dtr-types:textBlockItemType |
| Balance Type: |
na |
| Period Type: |
duration |
|
| X |
- DefinitionTabular disclosure of pertinent information about a derivative or group of derivatives on a disaggregated basis, such as for individual instruments, or small groups of similar instruments. May include a combination of the type of instrument, risks being hedged, notional amount, hedge designation, related hedged item, inception date, maturity date, or other relevant item. Reference 1: http://fasb.org/us-gaap/role/ref/legacyRef
-Name Accounting Standards Codification
-Section 50
-Paragraph 2
-SubTopic 10
-Topic 815
-Publisher FASB
-URI https://asc.fasb.org/1943274/2147480434/815-10-50-2
Reference 2: http://fasb.org/us-gaap/role/ref/legacyRef
-Name Accounting Standards Codification
-Topic 815
-SubTopic 10
-Section 50
-Paragraph 1A
-Publisher FASB
-URI https://asc.fasb.org/1943274/2147480434/815-10-50-1A
Reference 3: http://fasb.org/us-gaap/role/ref/legacyRef
-Name Accounting Standards Codification
-Topic 815
-SubTopic 10
-Section 50
-Paragraph 1B
-Publisher FASB
-URI https://asc.fasb.org/1943274/2147480434/815-10-50-1B
Reference 4: http://fasb.org/us-gaap/role/ref/legacyRef
-Name Accounting Standards Codification
-Topic 815
-SubTopic 10
-Section 50
-Paragraph 8
-Publisher FASB
-URI https://asc.fasb.org/1943274/2147480434/815-10-50-8
Reference 5: http://fasb.org/us-gaap/role/ref/legacyRef
-Name Accounting Standards Codification
-Topic 815
-SubTopic 10
-Section 50
-Paragraph 4B
-Publisher FASB
-URI https://asc.fasb.org/1943274/2147480434/815-10-50-4B
Reference 6: http://fasb.org/us-gaap/role/ref/legacyRef
-Name Accounting Standards Codification
-Topic 815
-SubTopic 10
-Section 50
-Paragraph 1
-Publisher FASB
-URI https://asc.fasb.org/1943274/2147480434/815-10-50-1
Reference 7: http://fasb.org/us-gaap/role/ref/legacyRef
-Name Accounting Standards Codification
-Topic 815
-SubTopic 10
-Section 50
-Paragraph 4
-Publisher FASB
-URI https://asc.fasb.org/1943274/2147480434/815-10-50-4
Reference 8: http://fasb.org/us-gaap/role/ref/legacyRef
-Name Accounting Standards Codification
-Topic 815
-SubTopic 10
-Section 50
-Paragraph 5
-Publisher FASB
-URI https://asc.fasb.org/1943274/2147480434/815-10-50-5
Reference 9: http://fasb.org/us-gaap/role/ref/legacyRef
-Name Accounting Standards Codification
-Topic 815
-SubTopic 10
-Section 50
-Paragraph 4C
-Publisher FASB
-URI https://asc.fasb.org/1943274/2147480434/815-10-50-4C
| Name: |
us-gaap_ScheduleOfDerivativeInstrumentsTextBlock |
| Namespace Prefix: |
us-gaap_ |
| Data Type: |
dtr-types:textBlockItemType |
| Balance Type: |
na |
| Period Type: |
duration |
|
v3.24.2
RESTRUCTURING (Tables)
|
6 Months Ended |
Jun. 30, 2024 |
|---|
| Restructuring and Related Activities [Abstract] |
|
| Schedule of Restructuring Activities and Accrued Employee Severance and Related Benefit |
The Company has undertaken the following restructuring activities as it optimizes its go-to-market strategy and reassesses its office space needs: | | | | | | | | | | | | | (in thousands) | Three months ended | | Expense | | Office space reduction | March 31, 2023 | | $ | 1,241 | | | Employee severance and related benefits | June 30, 2023 | | $ | 1,581 | | Employee severance and related benefits and office space reduction | September 30, 2023 | | $ | 17,236 | | | Office space reduction | December 31, 2023 | | $ | 1,497 | | | Office space reduction | June 30, 2024 | | $ | 1,257 | |
Accrued employee severance and related benefits: Change for all restructuring actions: | | | | | | | | | | | | | Six Months Ended
June 30, | | (in thousands) | 2024 | | 2023 | | January 1, | $ | 8,095 | | | $ | 18,573 | | | Costs incurred | (238) | | | 2,387 | | | Cash disbursements | (3,852) | | | (17,521) | | | Currency translation adjustments | (169) | | | 185 | | | June 30, | $ | 3,836 | | | $ | 3,624 | |
Note: Accrued employee severance and related benefits is included in accrued compensation and related expenses.
|
| X |
- DefinitionTabular disclosure of costs incurred for restructuring including, but not limited to, exit and disposal activities, remediation, implementation, integration, asset impairment, and charges against earnings from the write-down of assets. Reference 1: http://fasb.org/us-gaap/role/ref/legacyRef
-Topic 420
-SubTopic 10
-Name Accounting Standards Codification
-Section S99
-Paragraph 1
-Subparagraph (SAB Topic 5.P.3)
-Publisher FASB
-URI https://asc.fasb.org/1943274/2147479823/420-10-S99-1
Reference 2: http://fasb.org/us-gaap/role/ref/legacyRef
-Topic 420
-SubTopic 10
-Name Accounting Standards Codification
-Section S99
-Paragraph 2
-Subparagraph (SAB Topic 5.P.4)
-Publisher FASB
-URI https://asc.fasb.org/1943274/2147479823/420-10-S99-2
Reference 3: http://fasb.org/us-gaap/role/ref/legacyRef
-Name Accounting Standards Codification
-Topic 420
-SubTopic 10
-Section 50
-Paragraph 1
-Publisher FASB
-URI https://asc.fasb.org/1943274/2147482017/420-10-50-1
| Name: |
us-gaap_ScheduleOfRestructuringAndRelatedCostsTextBlock |
| Namespace Prefix: |
us-gaap_ |
| Data Type: |
dtr-types:textBlockItemType |
| Balance Type: |
na |
| Period Type: |
duration |
|
v3.24.2
FAIR VALUE MEASUREMENTS (Tables)
|
6 Months Ended |
Jun. 30, 2024 |
|---|
| Fair Value Disclosures [Abstract] |
|
| Schedule of Assets and Liabilities Measured at Fair Value |
Assets and liabilities measured at fair value on a recurring basis: | | | | | | | | | | | | | | | | | | | | | | | | | | | | | | | | | | | | | | | | | | | | | | | | | June 30, 2024 | | December 31, 2023 | | (in thousands) | Level 1 | | Level 2 | | Level 3 | | Total | | Level 1 | | Level 2 | | Level 3 | | Total | | Cash equivalents | $ | 18,345 | | | $ | — | | | $ | — | | | $ | 18,345 | | | $ | 54,357 | | | $ | — | | | $ | — | | | $ | 54,357 | | | Marketable securities | $ | — | | | $ | 406,819 | | | $ | — | | | $ | 406,819 | | | $ | — | | | $ | 193,436 | | | $ | — | | | $ | 193,436 | | Capped Call Transactions | $ | — | | | $ | 915 | | | $ | — | | | $ | 915 | | | $ | — | | | $ | 893 | | | $ | — | | | $ | 893 | | Venture investments (1) | $ | — | | | $ | — | | | $ | 21,047 | | | $ | 21,047 | | | $ | — | | | $ | — | | | $ | 19,450 | | | $ | 19,450 | |
(1) Investments in privately-held companies
|
| Schedule of Changes in Venture Investments |
Changes in venture investments: | | | | | | | | | | | | | Six Months Ended
June 30, | | (in thousands) | 2024 | | 2023 | | January 1, | $ | 19,450 | | | $ | 13,069 | | | New investments | 350 | | | 400 | | | Sales of investments | — | | | (2,773) | | | Changes in foreign exchange rates | (19) | | | 119 | | | Changes in fair value: | | | | included in other income, net | 1,628 | | | 4,475 | | included in other comprehensive income (loss) | (362) | | | (1,908) | | | June 30, | $ | 21,047 | | | $ | 13,382 | |
|
| X |
- DefinitionTabular disclosure of the fair value measurement of assets using significant unobservable inputs (Level 3), a reconciliation of the beginning and ending balances, separately presenting changes during the period attributable to the following: (1) total gains or losses for the period (realized and unrealized), segregating those gains or losses included in earnings (or changes in net assets) and gains or losses recognized in other comprehensive income (loss), and a description of where those gains or losses included in earnings (or changes in net assets) are reported in the statement of income (or activities); (2) purchases, sales, issues, and settlements (each type disclosed separately); and (3) transfers in and transfers out of Level 3 (for example, transfers due to changes in the observability of significant inputs), by class of asset. Reference 1: http://www.xbrl.org/2003/role/exampleRef
-Topic 820
-SubTopic 10
-Name Accounting Standards Codification
-Section 55
-Paragraph 101
-Publisher FASB
-URI https://asc.fasb.org/1943274/2147482078/820-10-55-101
Reference 2: http://www.xbrl.org/2003/role/disclosureRef
-Topic 820
-SubTopic 10
-Name Accounting Standards Codification
-Section 50
-Paragraph 3
-Subparagraph (b)
-Publisher FASB
-URI https://asc.fasb.org/1943274/2147482106/820-10-50-3
Reference 3: http://www.xbrl.org/2003/role/disclosureRef
-Topic 820
-SubTopic 10
-Name Accounting Standards Codification
-Section 50
-Paragraph 2
-Subparagraph (d)
-Publisher FASB
-URI https://asc.fasb.org/1943274/2147482106/820-10-50-2
Reference 4: http://www.xbrl.org/2003/role/disclosureRef
-Topic 820
-SubTopic 10
-Name Accounting Standards Codification
-Section 50
-Paragraph 2
-Subparagraph (c)
-Publisher FASB
-URI https://asc.fasb.org/1943274/2147482106/820-10-50-2
| Name: |
us-gaap_FairValueAssetsMeasuredOnRecurringBasisUnobservableInputReconciliationTextBlock |
| Namespace Prefix: |
us-gaap_ |
| Data Type: |
dtr-types:textBlockItemType |
| Balance Type: |
na |
| Period Type: |
duration |
|
| X |
- References
+ Details
| Name: |
us-gaap_FairValueDisclosuresAbstract |
| Namespace Prefix: |
us-gaap_ |
| Data Type: |
xbrli:stringItemType |
| Balance Type: |
na |
| Period Type: |
duration |
|
| X |
- DefinitionTabular disclosure of assets and liabilities, including [financial] instruments measured at fair value that are classified in stockholders' equity, if any, that are measured at fair value on a recurring basis. The disclosures contemplated herein include the fair value measurements at the reporting date by the level within the fair value hierarchy in which the fair value measurements in their entirety fall, segregating fair value measurements using quoted prices in active markets for identical assets (Level 1), significant other observable inputs (Level 2), and significant unobservable inputs (Level 3). Reference 1: http://www.xbrl.org/2009/role/commonPracticeRef
-Topic 820
-SubTopic 10
-Name Accounting Standards Codification
-Section 50
-Paragraph 2
-Subparagraph (b)
-Publisher FASB
-URI https://asc.fasb.org/1943274/2147482106/820-10-50-2
Reference 2: http://www.xbrl.org/2009/role/commonPracticeRef
-Topic 820
-SubTopic 10
-Name Accounting Standards Codification
-Section 50
-Paragraph 2
-Subparagraph (a)
-Publisher FASB
-URI https://asc.fasb.org/1943274/2147482106/820-10-50-2
| Name: |
us-gaap_ScheduleOfFairValueAssetsAndLiabilitiesMeasuredOnRecurringBasisTableTextBlock |
| Namespace Prefix: |
us-gaap_ |
| Data Type: |
dtr-types:textBlockItemType |
| Balance Type: |
na |
| Period Type: |
duration |
|
v3.24.2
REVENUE (Tables)
|
6 Months Ended |
Jun. 30, 2024 |
|---|
| Revenue from Contract with Customer [Abstract] |
|
| Schedule of Geographic Revenue |
Geographic revenue | | | | | | | | | | | | | | | | | | | | | | | | | | | | | | | | | | | | | Three Months Ended
June 30, | | Six Months Ended
June 30, | (Dollars in thousands) | 2024 | | 2023 | | 2024 | | 2023 | | U.S. | $ | 189,214 | | 54 | % | | $ | 150,385 | | 50 | % | | $ | 370,197 | | 55 | % | | $ | 334,904 | | 54 | % | | Other Americas | 21,314 | | 6 | % | | 19,505 | | 7 | % | | 43,100 | | 6 | % | | 34,516 | | 6 | % | | United Kingdom (“U.K.”) | 38,628 | | 11 | % | | 28,892 | | 10 | % | | 70,745 | | 10 | % | | 71,129 | | 11 | % | | Europe (excluding U.K.), Middle East, and Africa | 53,360 | | 15 | % | | 54,353 | | 18 | % | | 115,207 | | 17 | % | | 105,671 | | 17 | % | | Asia-Pacific | 48,637 | | 14 | % | | 45,133 | | 15 | % | | 82,051 | | 12 | % | | 77,520 | | 12 | % | | $ | 351,153 | | 100 | % | | $ | 298,268 | | 100 | % | | $ | 681,300 | | 100 | % | | $ | 623,740 | | 100 | % |
|
| Schedule of Revenue Streams |
Revenue streams | | | | | | | | | | | | | | | | | | | | | | | | | Three Months Ended
June 30, | | Six Months Ended
June 30, | (in thousands) | 2024 | | 2023 | | 2024 | | 2023 | | Subscription license | $ | 84,647 | | | $ | 41,197 | | | $ | 147,985 | | | $ | 125,724 | | | Perpetual license | 36 | | | 1,579 | | | 895 | | | 1,982 | | | Revenue recognized at a point in time | 84,683 | | | 42,776 | | | 148,880 | | | 127,706 | | | Maintenance | 80,344 | | | 82,042 | | | 161,345 | | | 161,672 | | | Pega Cloud | 134,086 | | | 115,063 | | | 264,988 | | | 222,942 | | | Consulting | 52,040 | | | 58,387 | | | 106,087 | | | 111,420 | | | Revenue recognized over time | 266,470 | | | 255,492 | | | 532,420 | | | 496,034 | | | Total revenue | $ | 351,153 | | | $ | 298,268 | | | $ | 681,300 | | | $ | 623,740 | |
| | | | | | | | | | | | | | | | | | | | | | | | | Three Months Ended
June 30, | | Six Months Ended
June 30, | | (in thousands) | 2024 | | 2023 | | 2024 | | 2023 | | Pega Cloud | $ | 134,086 | | | $ | 115,063 | | | $ | 264,988 | | | $ | 222,942 | | | Maintenance | 80,344 | | | 82,042 | | | 161,345 | | | 161,672 | | | Subscription services | 214,430 | | | 197,105 | | | 426,333 | | | 384,614 | | | Subscription license | 84,647 | | | 41,197 | | | 147,985 | | | 125,724 | | | Subscription | 299,077 | | | 238,302 | | | 574,318 | | | 510,338 | | | Consulting | 52,040 | | | 58,387 | | | 106,087 | | | 111,420 | | | Perpetual license | 36 | | | 1,579 | | | 895 | | | 1,982 | | | $ | 351,153 | | | $ | 298,268 | | | $ | 681,300 | | | $ | 623,740 | |
|
| Schedule of Remaining Performance Obligations |
Expected future revenue from existing non-cancellable contracts: As of June 30, 2024: | | | | | | | | | | | | | | | | | | | | | | | | | | | | | | | | | | | | | | | | (Dollars in thousands) | Subscription services | | Subscription license | | Perpetual license | | Consulting | | Total | | Pega Cloud | | Maintenance | | | | | 1 year or less | $ | 470,379 | | | $ | 209,655 | | | $ | 23,931 | | | $ | 2,696 | | | $ | 25,953 | | | $ | 732,614 | | 52 | % | 1-2 years | 301,070 | | | 63,266 | | | 10,078 | | | — | | | 2,469 | | | 376,883 | | 27 | % | 2-3 years | 152,839 | | | 30,032 | | | 2,884 | | | — | | | 2,473 | | | 188,228 | | 13 | % | Greater than 3 years | 90,474 | | | 17,953 | | | 97 | | | — | | | — | | | 108,524 | | 8 | % | | $ | 1,014,762 | | | $ | 320,906 | | | $ | 36,990 | | | $ | 2,696 | | | $ | 30,895 | | | $ | 1,406,249 | | 100 | % |
As of June 30, 2023: | | | | | | | | | | | | | | | | | | | | | | | | | | | | | | | | | | | | | | | | (Dollars in thousands) | Subscription services | | Subscription license | | Perpetual license | | Consulting | | Total | | Pega Cloud | | Maintenance | | | | | 1 year or less | $ | 397,183 | | | $ | 214,579 | | | $ | 35,616 | | | $ | 4,979 | | | $ | 37,355 | | | $ | 689,712 | | 55 | % | 1-2 years | 238,691 | | | 58,551 | | | 3,026 | | | 2,252 | | | 6,772 | | | 309,292 | | 24 | % | 2-3 years | 124,616 | | | 25,103 | | | 6,764 | | | — | | | 1,523 | | | 158,006 | | 12 | % | Greater than 3 years | 101,494 | | | 7,592 | | | — | | | — | | | — | | | 109,086 | | 9 | % | | $ | 861,984 | | | $ | 305,825 | | | $ | 45,406 | | | $ | 7,231 | | | $ | 45,650 | | | $ | 1,266,096 | | 100 | % |
|
| X |
- DefinitionTabular disclosure of disaggregation of revenue into categories depicting how nature, amount, timing, and uncertainty of revenue and cash flows are affected by economic factor. Reference 1: http://www.xbrl.org/2009/role/commonPracticeRef
-Topic 606
-SubTopic 10
-Name Accounting Standards Codification
-Section 50
-Paragraph 5
-Publisher FASB
-URI https://asc.fasb.org/1943274/2147479806/606-10-50-5
| Name: |
us-gaap_DisaggregationOfRevenueTableTextBlock |
| Namespace Prefix: |
us-gaap_ |
| Data Type: |
dtr-types:textBlockItemType |
| Balance Type: |
na |
| Period Type: |
duration |
|
| X |
- References
+ Details
| Name: |
us-gaap_RevenueFromContractWithCustomerAbstract |
| Namespace Prefix: |
us-gaap_ |
| Data Type: |
xbrli:stringItemType |
| Balance Type: |
na |
| Period Type: |
duration |
|
| X |
- DefinitionTabular disclosure of revenue from external customers by geographic areas attributed to the entity's country of domicile and to foreign countries from which the entity derives revenue. Reference 1: http://fasb.org/us-gaap/role/ref/legacyRef
-Topic 280
-SubTopic 10
-Name Accounting Standards Codification
-Section 50
-Paragraph 41
-Subparagraph (a)
-Publisher FASB
-URI https://asc.fasb.org/1943274/2147482810/280-10-50-41
| Name: |
us-gaap_RevenueFromExternalCustomersByGeographicAreasTableTextBlock |
| Namespace Prefix: |
us-gaap_ |
| Data Type: |
dtr-types:textBlockItemType |
| Balance Type: |
na |
| Period Type: |
duration |
|
| X |
- DefinitionTabular disclosure of expected timing for satisfying remaining performance obligation. Reference 1: http://www.xbrl.org/2009/role/commonPracticeRef
-Name Accounting Standards Codification
-Section 50
-Paragraph 13
-Subparagraph (b)(1)
-SubTopic 10
-Topic 606
-Publisher FASB
-URI https://asc.fasb.org/1943274/2147479806/606-10-50-13
| Name: |
us-gaap_RevenueRemainingPerformanceObligationExpectedTimingOfSatisfactionTableTextBlock |
| Namespace Prefix: |
us-gaap_ |
| Data Type: |
dtr-types:textBlockItemType |
| Balance Type: |
na |
| Period Type: |
duration |
|
v3.24.2
STOCK-BASED COMPENSATION (Tables)
|
6 Months Ended |
Jun. 30, 2024 |
|---|
| Share-Based Payment Arrangement [Abstract] |
|
| Schedule of Stock Based Compensation Expense |
Expense | | | | | | | | | | | | | | | | | | | | | | | | | Three Months Ended
June 30, | | Six Months Ended
June 30, | | (in thousands) | 2024 | | 2023 | | 2024 | | 2023 | Cost of revenue | $ | 7,092 | | | $ | 7,174 | | | $ | 13,664 | | | $ | 16,087 | | Selling and marketing | 13,564 | | | 15,349 | | | 27,452 | | | 33,009 | | Research and development | 7,825 | | | 7,851 | | | 15,471 | | | 16,911 | | General and administrative | 7,743 | | | 5,853 | | | 14,418 | | | 12,777 | | | $ | 36,224 | | | $ | 36,227 | | | $ | 71,005 | | | $ | 78,784 | | Income tax benefit | $ | (554) | | | $ | (581) | | | $ | (865) | | | $ | (1,253) | |
|
| Schedule of Stock Based Compensation Award Granted |
Grants | | | | | | | | | | | | | Six Months Ended
June 30, 2024 | | (in thousands) | Quantity | | Total Fair Value | Restricted stock units (1) | 1,266 | | | $ | 78,071 | | Non-qualified stock options | 1,738 | | | $ | 44,874 | | Performance stock options (2) | 566 | | | $ | 13,921 | | | | | |
(1) Includes units issued when employees elect to receive 50% of the employee’s target incentive compensation under the Company’s Corporate Incentive Compensation Plan (the “CICP”) in the form of RSUs instead of cash. (2) Performance stock options allow the holder to purchase a specified number of common stock shares at an exercise price equal to or greater than the shares' fair market value at the grant date. For the performance stock options granted in the six months ended June 30, 2024, 25% can vest on the first anniversary of the grant date, and 75% can vest on the second anniversary of the grant date, based on the achievement of specific performance conditions. The options expire ten years from the grant date.
|
| X |
- DefinitionTabular disclosure of allocation of amount expensed and capitalized for award under share-based payment arrangement to statement of income or comprehensive income and statement of financial position. Includes, but is not limited to, corresponding line item in financial statement. Reference 1: http://fasb.org/us-gaap/role/ref/legacyRef
-Name Accounting Standards Codification
-Topic 718
-SubTopic 10
-Section 50
-Paragraph 2
-Subparagraph (h)(1)
-Publisher FASB
-URI https://asc.fasb.org/1943274/2147480429/718-10-50-2
| Name: |
us-gaap_ScheduleOfEmployeeServiceShareBasedCompensationAllocationOfRecognizedPeriodCostsTextBlock |
| Namespace Prefix: |
us-gaap_ |
| Data Type: |
dtr-types:textBlockItemType |
| Balance Type: |
na |
| Period Type: |
duration |
|
| X |
- DefinitionTabular disclosure of activity for award under share-based payment arrangement. Includes, but is not limited to, outstanding award at beginning and end of year, granted, exercised, forfeited, and weighted-average grant date fair value. Reference 1: http://fasb.org/us-gaap/role/ref/legacyRef
-Topic 718
-SubTopic 10
-Name Accounting Standards Codification
-Section 50
-Paragraph 2
-Subparagraph (c)(2)
-Publisher FASB
-URI https://asc.fasb.org/1943274/2147480429/718-10-50-2
Reference 2: http://fasb.org/us-gaap/role/ref/legacyRef
-Name Accounting Standards Codification
-Section 50
-Paragraph 2
-Subparagraph (d)
-SubTopic 10
-Topic 718
-Publisher FASB
-URI https://asc.fasb.org/1943274/2147480429/718-10-50-2
Reference 3: http://fasb.org/us-gaap/role/ref/legacyRef
-Name Accounting Standards Codification
-Section 50
-Paragraph 2
-Subparagraph (e)
-SubTopic 10
-Topic 718
-Publisher FASB
-URI https://asc.fasb.org/1943274/2147480429/718-10-50-2
| Name: |
us-gaap_ScheduleOfShareBasedCompensationActivityTableTextBlock |
| Namespace Prefix: |
us-gaap_ |
| Data Type: |
dtr-types:textBlockItemType |
| Balance Type: |
na |
| Period Type: |
duration |
|
v3.24.2
| X |
- DefinitionTabular disclosure of the reconciliation using percentage or dollar amounts of the reported amount of income tax expense attributable to continuing operations for the year to the amount of income tax expense that would result from applying domestic federal statutory tax rates to pretax income from continuing operations. Reference 1: http://www.xbrl.org/2003/role/exampleRef
-Topic 740
-SubTopic 10
-Name Accounting Standards Codification
-Section 55
-Paragraph 231
-Publisher FASB
-URI https://asc.fasb.org/1943274/2147482663/740-10-55-231
Reference 2: http://www.xbrl.org/2003/role/disclosureRef
-Topic 740
-SubTopic 10
-Name Accounting Standards Codification
-Section 50
-Paragraph 12A
-Publisher FASB
-URI https://asc.fasb.org/1943274/2147482685/740-10-50-12A
Reference 3: http://www.xbrl.org/2009/role/commonPracticeRef
-Topic 740
-SubTopic 10
-Name Accounting Standards Codification
-Section 50
-Paragraph 12
-Publisher FASB
-URI https://asc.fasb.org/1943274/2147482685/740-10-50-12
| Name: |
us-gaap_ScheduleOfEffectiveIncomeTaxRateReconciliationTableTextBlock |
| Namespace Prefix: |
us-gaap_ |
| Data Type: |
dtr-types:textBlockItemType |
| Balance Type: |
na |
| Period Type: |
duration |
|
v3.24.2
EARNINGS (LOSS) PER SHARE (Tables)
|
6 Months Ended |
Jun. 30, 2024 |
|---|
| Earnings Per Share [Abstract] |
|
| Schedule of Calculation of Earnings (Loss) Per Share |
Calculation of earnings (loss) per share: | | | | | | | | | | | | | | | | | | | | | | | | | Three Months Ended
June 30, | | Six Months Ended
June 30, | | (in thousands, except per share amounts) | 2024 | | 2023 | | 2024 | | 2023 | | Net income (loss) | $ | 6,613 | | | $ | (46,804) | | | $ | (5,511) | | | $ | (67,578) | | | Weighted-average common shares outstanding | 85,157 | | | 83,039 | | | 84,712 | | | 82,823 | | | Earnings (loss) per share, basic | $ | 0.08 | | | $ | (0.56) | | | $ | (0.07) | | | $ | (0.82) | | | | | | | | | | | Net income (loss) | $ | 6,613 | | | $ | (46,804) | | | $ | (5,511) | | | $ | (67,578) | | | | | | | | | | | Numerator for diluted EPS | $ | 6,613 | | | $ | (46,804) | | | $ | (5,511) | | | $ | (67,578) | | | Weighted-average effect of dilutive securities: | | | | | | | | | | | | | | | | | Stock options | 2,164 | | | — | | | — | | | — | | | RSUs | 1,179 | | | — | | | — | | | — | | | Effect of dilutive securities | 3,343 | | | — | | | — | | | — | | Weighted-average common shares outstanding, assuming dilution (1) (2) (3) | 88,500 | | | 83,039 | | | 84,712 | | | 82,823 | | | Earnings (loss) per share, diluted | $ | 0.07 | | | $ | (0.56) | | | $ | (0.07) | | | $ | (0.82) | | | | | | | | | | Outstanding anti-dilutive stock options and RSUs (4) | 5 | | | 1,354 | | | 3,259 | | | 1,351 | |
(1) All dilutive securities are excluded when their inclusion would be anti-dilutive. (2) The shares underlying the conversion options in the Company’s Notes are included using the if-converted method, if dilutive in the period. If the outstanding conversion options were fully exercised, the Company would issue approximately 3.7 million shares as of June 30, 2024. (3) The Company’s Capped Call Transactions represent the equivalent of approximately 3.7 million shares of the Company’s common stock (representing the number of shares for which the Notes are convertible) as of June 30, 2024. The Capped Call Transactions are expected to reduce common stock dilution and/or offset any potential cash payments the Company must make, other than for principal and interest, upon conversion of the Notes, with such reduction and/or offset subject to a cap of $196.44. The Capped Call Transactions are excluded from weighted-average common shares outstanding, assuming dilution, in all periods as their effect would be anti-dilutive. (4) Outstanding stock options and RSUs that were anti-dilutive under the treasury stock method in the period were excluded from the computation of diluted earnings (loss) per share. These awards may be dilutive in the future.
|
| X |
- References
+ Details
| Name: |
us-gaap_EarningsPerShareAbstract |
| Namespace Prefix: |
us-gaap_ |
| Data Type: |
xbrli:stringItemType |
| Balance Type: |
na |
| Period Type: |
duration |
|
| X |
- DefinitionTabular disclosure of an entity's basic and diluted earnings per share calculations, including a reconciliation of numerators and denominators of the basic and diluted per-share computations for income from continuing operations. Reference 1: http://www.xbrl.org/2009/role/commonPracticeRef
-Topic 260
-SubTopic 10
-Name Accounting Standards Codification
-Section 50
-Paragraph 1
-Subparagraph (a)
-Publisher FASB
-URI https://asc.fasb.org/1943274/2147482662/260-10-50-1
| Name: |
us-gaap_ScheduleOfEarningsPerShareBasicAndDilutedTableTextBlock |
| Namespace Prefix: |
us-gaap_ |
| Data Type: |
dtr-types:textBlockItemType |
| Balance Type: |
na |
| Period Type: |
duration |
|
v3.24.2
MARKETABLE SECURITIES - Schedule of Marketable Securities (Details) - USD ($)
$ in Thousands |
Jun. 30, 2024 |
Dec. 31, 2023 |
| Marketable Securities [Line Items] |
|
|
| Amortized Cost |
$ 407,463
|
$ 193,431
|
| Unrealized Gains |
1
|
233
|
| Unrealized Losses |
(645)
|
(228)
|
| Fair Value |
406,819
|
193,436
|
| US Government Agencies Debt Securities |
|
|
| Marketable Securities [Line Items] |
|
|
| Amortized Cost |
12,942
|
11,471
|
| Unrealized Gains |
0
|
33
|
| Unrealized Losses |
(17)
|
(1)
|
| Fair Value |
12,925
|
11,503
|
| Corporate Debt Securities |
|
|
| Marketable Securities [Line Items] |
|
|
| Amortized Cost |
394,521
|
181,960
|
| Unrealized Gains |
1
|
200
|
| Unrealized Losses |
(628)
|
(227)
|
| Fair Value |
$ 393,894
|
$ 181,933
|
| X |
- DefinitionAmount, before tax, of unrealized gain in accumulated other comprehensive income (AOCI) on investment in debt security measured at fair value with change in fair value recognized in other comprehensive income (available-for-sale). Reference 1: http://www.xbrl.org/2003/role/disclosureRef
-Topic 320
-SubTopic 10
-Name Accounting Standards Codification
-Section 50
-Paragraph 2
-Subparagraph (b)
-Publisher FASB
-URI https://asc.fasb.org/1943274/2147481800/320-10-50-2
| Name: |
us-gaap_AvailableForSaleDebtSecuritiesAccumulatedGrossUnrealizedGainBeforeTax |
| Namespace Prefix: |
us-gaap_ |
| Data Type: |
xbrli:monetaryItemType |
| Balance Type: |
credit |
| Period Type: |
instant |
|
| X |
- DefinitionAmount, before tax, of unrealized loss in accumulated other comprehensive income (AOCI) on investment in debt security measured at fair value with change in fair value recognized in other comprehensive income (available-for-sale). Reference 1: http://www.xbrl.org/2003/role/disclosureRef
-Topic 320
-SubTopic 10
-Name Accounting Standards Codification
-Section 50
-Paragraph 2
-Subparagraph (c)
-Publisher FASB
-URI https://asc.fasb.org/1943274/2147481800/320-10-50-2
| Name: |
us-gaap_AvailableForSaleDebtSecuritiesAccumulatedGrossUnrealizedLossBeforeTax |
| Namespace Prefix: |
us-gaap_ |
| Data Type: |
xbrli:monetaryItemType |
| Balance Type: |
debit |
| Period Type: |
instant |
|
| X |
- DefinitionAmortized cost excluding accrued interest, before allowance for credit loss, of investment in debt security measured at fair value with change in fair value recognized in other comprehensive income (available-for-sale). Reference 1: http://www.xbrl.org/2003/role/disclosureRef
-Topic 326
-SubTopic 30
-Name Accounting Standards Codification
-Section 45
-Paragraph 1
-Publisher FASB
-URI https://asc.fasb.org/1943274/2147479130/326-30-45-1
| Name: |
us-gaap_DebtSecuritiesAvailableForSaleAmortizedCostExcludingAccruedInterestBeforeAllowanceForCreditLoss |
| Namespace Prefix: |
us-gaap_ |
| Data Type: |
xbrli:monetaryItemType |
| Balance Type: |
debit |
| Period Type: |
instant |
|
| X |
- DefinitionAmount excluding accrued interest, of investment in debt security measured at fair value with change in fair value recognized in other comprehensive income (available-for-sale). Reference 1: http://www.xbrl.org/2009/role/commonPracticeRef
-Topic 326
-SubTopic 30
-Name Accounting Standards Codification
-Section 45
-Paragraph 1
-Publisher FASB
-URI https://asc.fasb.org/1943274/2147479130/326-30-45-1
| Name: |
us-gaap_DebtSecuritiesAvailableForSaleExcludingAccruedInterest |
| Namespace Prefix: |
us-gaap_ |
| Data Type: |
xbrli:monetaryItemType |
| Balance Type: |
debit |
| Period Type: |
instant |
|
| X |
- DefinitionLine items represent financial concepts included in a table. These concepts are used to disclose reportable information associated with domain members defined in one or many axes to the table.
| Name: |
us-gaap_MarketableSecuritiesLineItems |
| Namespace Prefix: |
us-gaap_ |
| Data Type: |
xbrli:stringItemType |
| Balance Type: |
na |
| Period Type: |
duration |
|
| X |
- Details
| Name: |
us-gaap_FinancialInstrumentAxis=us-gaap_USGovernmentAgenciesDebtSecuritiesMember |
| Namespace Prefix: |
|
| Data Type: |
na |
| Balance Type: |
|
| Period Type: |
|
|
| X |
- Details
| Name: |
us-gaap_FinancialInstrumentAxis=us-gaap_CorporateDebtSecuritiesMember |
| Namespace Prefix: |
|
| Data Type: |
na |
| Balance Type: |
|
| Period Type: |
|
|
v3.24.2
| X |
- DefinitionPeriod between issuance and maturity of investment in debt security measured at fair value with change in fair value recognized in other comprehensive income (available-for-sale), in 'PnYnMnDTnHnMnS' format, for example, 'P1Y5M13D' represents reported fact of one year, five months, and thirteen days. Reference 1: http://www.xbrl.org/2009/role/commonPracticeRef
-Topic 820
-SubTopic 10
-Name Accounting Standards Codification
-Section 50
-Paragraph 2
-Subparagraph (bbb)(2)(i)
-Publisher FASB
-URI https://asc.fasb.org/1943274/2147482106/820-10-50-2
Reference 2: http://www.xbrl.org/2009/role/commonPracticeRef
-Topic 820
-SubTopic 10
-Name Accounting Standards Codification
-Section 50
-Paragraph 2
-Subparagraph (bbb)(2)
-Publisher FASB
-URI https://asc.fasb.org/1943274/2147482106/820-10-50-2
Reference 3: http://www.xbrl.org/2009/role/commonPracticeRef
-Topic 820
-SubTopic 10
-Name Accounting Standards Codification
-Section 50
-Paragraph 2
-Subparagraph (bbb)(1)
-Publisher FASB
-URI https://asc.fasb.org/1943274/2147482106/820-10-50-2
| Name: |
us-gaap_DebtSecuritiesAvailableForSaleTerm |
| Namespace Prefix: |
us-gaap_ |
| Data Type: |
xbrli:durationItemType |
| Balance Type: |
na |
| Period Type: |
instant |
|
| X |
- References
+ Details
| Name: |
us-gaap_InvestmentsDebtAndEquitySecuritiesAbstract |
| Namespace Prefix: |
us-gaap_ |
| Data Type: |
xbrli:stringItemType |
| Balance Type: |
na |
| Period Type: |
duration |
|
v3.24.2
RECEIVABLES, CONTRACT ASSETS, AND DEFERRED REVENUE - Schedule of Receivables (Details) - USD ($)
$ in Thousands |
Jun. 30, 2024 |
Dec. 31, 2023 |
| Receivables [Abstract] |
|
|
| Accounts receivable, net |
$ 165,723
|
$ 300,173
|
| Unbilled receivables, net |
164,533
|
237,379
|
| Long-term unbilled receivables, net |
81,218
|
85,402
|
| Total receivables |
$ 411,474
|
$ 622,954
|
| X |
- DefinitionAccounts receivable and unbilled receivable.
| Name: |
pega_AccountsReceivableAndUnbilledReceivable |
| Namespace Prefix: |
pega_ |
| Data Type: |
xbrli:monetaryItemType |
| Balance Type: |
debit |
| Period Type: |
instant |
|
| X |
- DefinitionAmount received for services rendered and products shipped, but not yet billed, for non-contractual agreements due greater than one year from period end.
| Name: |
pega_UnbilledReceivablesNonCurrent |
| Namespace Prefix: |
pega_ |
| Data Type: |
xbrli:monetaryItemType |
| Balance Type: |
debit |
| Period Type: |
instant |
|
| X |
- DefinitionAmount, after allowance for credit loss, of right to consideration from customer for product sold and service rendered in normal course of business, classified as current. Reference 1: http://www.xbrl.org/2009/role/commonPracticeRef
-Topic 310
-SubTopic 10
-Name Accounting Standards Codification
-Section 45
-Paragraph 2
-Publisher FASB
-URI https://asc.fasb.org/1943274/2147481990/310-10-45-2
| Name: |
us-gaap_AccountsReceivableNetCurrent |
| Namespace Prefix: |
us-gaap_ |
| Data Type: |
xbrli:monetaryItemType |
| Balance Type: |
debit |
| Period Type: |
instant |
|
| X |
- References
+ Details
| Name: |
us-gaap_ReceivablesAbstract |
| Namespace Prefix: |
us-gaap_ |
| Data Type: |
xbrli:stringItemType |
| Balance Type: |
na |
| Period Type: |
duration |
|
| X |
- DefinitionAmount received for services rendered and products shipped, but not yet billed, for non-contractual agreements due within one year or the normal operating cycle, if longer.
| Name: |
us-gaap_UnbilledReceivablesCurrent |
| Namespace Prefix: |
us-gaap_ |
| Data Type: |
xbrli:monetaryItemType |
| Balance Type: |
debit |
| Period Type: |
instant |
|
v3.24.2
RECEIVABLES, CONTRACT ASSETS, AND DEFERRED REVENUE - Schedule of Unbilled Receivables (Details)
$ in Thousands |
Jun. 30, 2024
USD ($)
|
| Receivables [Abstract] |
|
| 1 year or less |
$ 164,533
|
| 1-2 years |
58,353
|
| 2-5 years |
22,865
|
| Total |
$ 245,751
|
| Percentage of unbilled receivables, 1 year or less |
67.00%
|
| Percentage of unbilled receivables, 1-2 years |
24.00%
|
| Percentage of unbilled receivables, 2-5 years |
9.00%
|
| Total percentage of unbilled receivables |
100.00%
|
| X |
- DefinitionUnbilled Receivables Current and Non Current
| Name: |
pega_UnbilledReceivablesCurrentAndNonCurrent |
| Namespace Prefix: |
pega_ |
| Data Type: |
xbrli:monetaryItemType |
| Balance Type: |
debit |
| Period Type: |
instant |
|
| X |
- DefinitionUnbilled receivables current and non current percentage.
| Name: |
pega_UnbilledReceivablesCurrentAndNonCurrentPercentage |
| Namespace Prefix: |
pega_ |
| Data Type: |
dtr-types1:percentItemType |
| Balance Type: |
na |
| Period Type: |
instant |
|
| X |
- DefinitionUnbilled receivables not billable at balance sheet date amount expected to be collected within year one and two.
| Name: |
pega_UnbilledReceivablesNotBillableAtBalanceSheetDateAmountExpectedToBeCollectedWithinYearOneAndTwo |
| Namespace Prefix: |
pega_ |
| Data Type: |
xbrli:monetaryItemType |
| Balance Type: |
debit |
| Period Type: |
instant |
|
| X |
- DefinitionUnbilled Receivables Not Billable at Balance Sheet Date Amount Expected to be Collected within Year One or Less
| Name: |
pega_UnbilledReceivablesNotBillableAtBalanceSheetDateAmountExpectedToBeCollectedWithinYearOneOrLess |
| Namespace Prefix: |
pega_ |
| Data Type: |
xbrli:monetaryItemType |
| Balance Type: |
debit |
| Period Type: |
instant |
|
| X |
- DefinitionUnbilled receivables not billable at balance sheet date amount expected to be collected within year two and five.
| Name: |
pega_UnbilledReceivablesNotBillableAtBalanceSheetDateAmountExpectedToBeCollectedWithinYearTwoAndFive |
| Namespace Prefix: |
pega_ |
| Data Type: |
xbrli:monetaryItemType |
| Balance Type: |
debit |
| Period Type: |
instant |
|
| X |
- DefinitionUnbilled receivables not billable at balance sheet date expected percentage to be collected within one year.
| Name: |
pega_UnbilledReceivablesNotBillableAtBalanceSheetDateExpectedPercentageToBeCollectedWithinOneYear |
| Namespace Prefix: |
pega_ |
| Data Type: |
dtr-types1:percentItemType |
| Balance Type: |
na |
| Period Type: |
instant |
|
| X |
- DefinitionUnbilled receivables not billable at balance sheet date expected percentage to be collected within year one and two.
| Name: |
pega_UnbilledReceivablesNotBillableAtBalanceSheetDateExpectedPercentageToBeCollectedWithinYearOneAndTwo |
| Namespace Prefix: |
pega_ |
| Data Type: |
dtr-types1:percentItemType |
| Balance Type: |
na |
| Period Type: |
instant |
|
| X |
- DefinitionUnbilled receivables not billable at balance sheet date expected percentage to be collected within year two and five.
| Name: |
pega_UnbilledReceivablesNotBillableAtBalanceSheetDateExpectedPercentageToBeCollectedWithinYearTwoAndFive |
| Namespace Prefix: |
pega_ |
| Data Type: |
dtr-types1:percentItemType |
| Balance Type: |
na |
| Period Type: |
instant |
|
| X |
- References
+ Details
| Name: |
us-gaap_ReceivablesAbstract |
| Namespace Prefix: |
us-gaap_ |
| Data Type: |
xbrli:stringItemType |
| Balance Type: |
na |
| Period Type: |
duration |
|
v3.24.2
| X |
- DefinitionPercentage of Unbilled Receivables, Not Billable, Amount Expected to be Collected in Remainder of Fiscal Year
| Name: |
pega_PercentageOfUnbilledReceivablesNotBillableAmountExpectedToBeCollectedInRemainderOfFiscalYear |
| Namespace Prefix: |
pega_ |
| Data Type: |
dtr-types1:percentItemType |
| Balance Type: |
na |
| Period Type: |
instant |
|
| X |
- DefinitionPercentage of Unbilled Receivables, Not Billable, Contract Date, Year Four and Prior
| Name: |
pega_PercentageOfUnbilledReceivablesNotBillableContractDateYearFourAndPrior |
| Namespace Prefix: |
pega_ |
| Data Type: |
dtr-types1:percentItemType |
| Balance Type: |
na |
| Period Type: |
instant |
|
| X |
- DefinitionPercentage of Unbilled Receivables, Not Billable, Contract Date, Year One
| Name: |
pega_PercentageOfUnbilledReceivablesNotBillableContractDateYearOne |
| Namespace Prefix: |
pega_ |
| Data Type: |
dtr-types1:percentItemType |
| Balance Type: |
na |
| Period Type: |
instant |
|
| X |
- DefinitionPercentage of Unbilled Receivables, Not Billable, Contract Date, Year Three
| Name: |
pega_PercentageOfUnbilledReceivablesNotBillableContractDateYearThree |
| Namespace Prefix: |
pega_ |
| Data Type: |
dtr-types1:percentItemType |
| Balance Type: |
na |
| Period Type: |
instant |
|
| X |
- DefinitionPercentage of Unbilled Receivables, Not Billable, Contract Date, Year Two
| Name: |
pega_PercentageOfUnbilledReceivablesNotBillableContractDateYearTwo |
| Namespace Prefix: |
pega_ |
| Data Type: |
dtr-types1:percentItemType |
| Balance Type: |
na |
| Period Type: |
instant |
|
| X |
- DefinitionTotal Percentage of Unbilled Revenue
| Name: |
pega_TotalPercentageOfUnbilledRevenue |
| Namespace Prefix: |
pega_ |
| Data Type: |
dtr-types1:percentItemType |
| Balance Type: |
na |
| Period Type: |
instant |
|
| X |
- DefinitionUnbilled Receivables, Not Billable, Contract Date, Remainder of Fiscal Year
| Name: |
pega_UnbilledReceivablesNotBillableContractDateRemainderOfFiscalYear |
| Namespace Prefix: |
pega_ |
| Data Type: |
xbrli:monetaryItemType |
| Balance Type: |
debit |
| Period Type: |
instant |
|
| X |
- DefinitionUnbilled Receivables, Not Billable, Contract Date, Year Four and Prior
| Name: |
pega_UnbilledReceivablesNotBillableContractDateYearFourAndPrior |
| Namespace Prefix: |
pega_ |
| Data Type: |
xbrli:monetaryItemType |
| Balance Type: |
debit |
| Period Type: |
instant |
|
| X |
- DefinitionUnbilled Receivables, Not Billable, Contract Date, Year One
| Name: |
pega_UnbilledReceivablesNotBillableContractDateYearOne |
| Namespace Prefix: |
pega_ |
| Data Type: |
xbrli:monetaryItemType |
| Balance Type: |
debit |
| Period Type: |
instant |
|
| X |
- DefinitionUnbilled Receivables, Not Billable, Contract Date, Year Three
| Name: |
pega_UnbilledReceivablesNotBillableContractDateYearThree |
| Namespace Prefix: |
pega_ |
| Data Type: |
xbrli:monetaryItemType |
| Balance Type: |
debit |
| Period Type: |
instant |
|
| X |
- DefinitionUnbilled Receivables, Not Billable, Contract Date, Year Two
| Name: |
pega_UnbilledReceivablesNotBillableContractDateYearTwo |
| Namespace Prefix: |
pega_ |
| Data Type: |
xbrli:monetaryItemType |
| Balance Type: |
debit |
| Period Type: |
instant |
|
| X |
- References
+ Details
| Name: |
us-gaap_ReceivablesAbstract |
| Namespace Prefix: |
us-gaap_ |
| Data Type: |
xbrli:stringItemType |
| Balance Type: |
na |
| Period Type: |
duration |
|
v3.24.2
RECEIVABLES, CONTRACT ASSETS, AND DEFERRED REVENUE - Schedule of Contract Assets and Deferred Revenue (Details) - USD ($)
$ in Thousands |
6 Months Ended |
|
Jun. 30, 2024 |
Dec. 31, 2023 |
| Receivables [Abstract] |
|
|
| Contract assets |
$ 15,374
|
$ 16,238
|
| Long-term contract assets |
19,997
|
20,635
|
| Total contract assets |
35,371
|
36,873
|
| Deferred revenue |
352,618
|
377,845
|
| Long-term deferred revenue |
2,443
|
2,478
|
| Total deferred revenue |
355,061
|
$ 380,323
|
| Revenue recognized during the period that was included in deferred revenue |
$ 272,700
|
|
| X |
- DefinitionAmount, after allowance for credit loss, of right to consideration in exchange for good or service transferred to customer when right is conditioned on something other than passage of time. Reference 1: http://www.xbrl.org/2003/role/disclosureRef
-Topic 606
-SubTopic 10
-Name Accounting Standards Codification
-Section 45
-Paragraph 3
-Publisher FASB
-URI https://asc.fasb.org/1943274/2147479837/606-10-45-3
Reference 2: http://www.xbrl.org/2003/role/disclosureRef
-Topic 606
-SubTopic 10
-Name Accounting Standards Codification
-Section 45
-Paragraph 1
-Publisher FASB
-URI https://asc.fasb.org/1943274/2147479837/606-10-45-1
Reference 3: http://www.xbrl.org/2003/role/disclosureRef
-Topic 606
-SubTopic 10
-Name Accounting Standards Codification
-Section 50
-Paragraph 8
-Subparagraph (a)
-Publisher FASB
-URI https://asc.fasb.org/1943274/2147479806/606-10-50-8
| Name: |
us-gaap_ContractWithCustomerAssetNet |
| Namespace Prefix: |
us-gaap_ |
| Data Type: |
xbrli:monetaryItemType |
| Balance Type: |
debit |
| Period Type: |
instant |
|
| X |
- DefinitionAmount, after allowance for credit loss, of right to consideration in exchange for good or service transferred to customer when right is conditioned on something other than passage of time, classified as current. Reference 1: http://www.xbrl.org/2003/role/disclosureRef
-Topic 606
-SubTopic 10
-Name Accounting Standards Codification
-Section 45
-Paragraph 3
-Publisher FASB
-URI https://asc.fasb.org/1943274/2147479837/606-10-45-3
Reference 2: http://www.xbrl.org/2003/role/disclosureRef
-Topic 606
-SubTopic 10
-Name Accounting Standards Codification
-Section 45
-Paragraph 1
-Publisher FASB
-URI https://asc.fasb.org/1943274/2147479837/606-10-45-1
Reference 3: http://www.xbrl.org/2003/role/disclosureRef
-Topic 606
-SubTopic 10
-Name Accounting Standards Codification
-Section 50
-Paragraph 8
-Subparagraph (a)
-Publisher FASB
-URI https://asc.fasb.org/1943274/2147479806/606-10-50-8
| Name: |
us-gaap_ContractWithCustomerAssetNetCurrent |
| Namespace Prefix: |
us-gaap_ |
| Data Type: |
xbrli:monetaryItemType |
| Balance Type: |
debit |
| Period Type: |
instant |
|
| X |
- DefinitionAmount, after allowance for credit loss, of right to consideration in exchange for good or service transferred to customer when right is conditioned on something other than passage of time, classified as noncurrent. Reference 1: http://www.xbrl.org/2003/role/disclosureRef
-Topic 606
-SubTopic 10
-Name Accounting Standards Codification
-Section 45
-Paragraph 3
-Publisher FASB
-URI https://asc.fasb.org/1943274/2147479837/606-10-45-3
Reference 2: http://www.xbrl.org/2003/role/disclosureRef
-Topic 606
-SubTopic 10
-Name Accounting Standards Codification
-Section 45
-Paragraph 1
-Publisher FASB
-URI https://asc.fasb.org/1943274/2147479837/606-10-45-1
Reference 3: http://www.xbrl.org/2003/role/disclosureRef
-Topic 606
-SubTopic 10
-Name Accounting Standards Codification
-Section 50
-Paragraph 8
-Subparagraph (a)
-Publisher FASB
-URI https://asc.fasb.org/1943274/2147479806/606-10-50-8
| Name: |
us-gaap_ContractWithCustomerAssetNetNoncurrent |
| Namespace Prefix: |
us-gaap_ |
| Data Type: |
xbrli:monetaryItemType |
| Balance Type: |
debit |
| Period Type: |
instant |
|
| X |
- DefinitionAmount of obligation to transfer good or service to customer for which consideration has been received or is receivable. Reference 1: http://www.xbrl.org/2003/role/disclosureRef
-Topic 606
-SubTopic 10
-Name Accounting Standards Codification
-Section 45
-Paragraph 1
-Publisher FASB
-URI https://asc.fasb.org/1943274/2147479837/606-10-45-1
Reference 2: http://www.xbrl.org/2003/role/disclosureRef
-Topic 606
-SubTopic 10
-Name Accounting Standards Codification
-Section 50
-Paragraph 8
-Subparagraph (a)
-Publisher FASB
-URI https://asc.fasb.org/1943274/2147479806/606-10-50-8
Reference 3: http://www.xbrl.org/2003/role/disclosureRef
-Topic 606
-SubTopic 10
-Name Accounting Standards Codification
-Section 45
-Paragraph 2
-Publisher FASB
-URI https://asc.fasb.org/1943274/2147479837/606-10-45-2
| Name: |
us-gaap_ContractWithCustomerLiability |
| Namespace Prefix: |
us-gaap_ |
| Data Type: |
xbrli:monetaryItemType |
| Balance Type: |
credit |
| Period Type: |
instant |
|
| X |
- DefinitionAmount of revenue recognized that was previously included in balance of obligation to transfer good or service to customer for which consideration from customer has been received or is due. Reference 1: http://www.xbrl.org/2003/role/disclosureRef
-Topic 606
-SubTopic 10
-Name Accounting Standards Codification
-Section 50
-Paragraph 8
-Subparagraph (b)
-Publisher FASB
-URI https://asc.fasb.org/1943274/2147479806/606-10-50-8
| Name: |
us-gaap_ContractWithCustomerLiabilityRevenueRecognized |
| Namespace Prefix: |
us-gaap_ |
| Data Type: |
xbrli:monetaryItemType |
| Balance Type: |
credit |
| Period Type: |
duration |
|
| X |
- DefinitionCarrying amount as of the balance sheet date of unearned revenue or income, not otherwise specified in the taxonomy, which is expected to be taken into income during the current period and current obligations not separately disclosed in the balance sheet (other liabilities, current).
| Name: |
us-gaap_DeferredCreditsAndOtherLiabilitiesCurrent |
| Namespace Prefix: |
us-gaap_ |
| Data Type: |
xbrli:monetaryItemType |
| Balance Type: |
credit |
| Period Type: |
instant |
|
| X |
- DefinitionCarrying amount as of the balance sheet date of unearned revenue or income, not otherwise specified in the taxonomy, which is expected to be taken into income after one year or beyond the normal operating cycle, if longer and noncurrent obligations not separately disclosed in the balance sheet (other liabilities, noncurrent).
| Name: |
us-gaap_DeferredCreditsAndOtherLiabilitiesNoncurrent |
| Namespace Prefix: |
us-gaap_ |
| Data Type: |
xbrli:monetaryItemType |
| Balance Type: |
credit |
| Period Type: |
instant |
|
| X |
- References
+ Details
| Name: |
us-gaap_ReceivablesAbstract |
| Namespace Prefix: |
us-gaap_ |
| Data Type: |
xbrli:stringItemType |
| Balance Type: |
na |
| Period Type: |
duration |
|
v3.24.2
| X |
- DefinitionAmount of deferred cost, excluding capitalized cost related to contract with customer; classified as noncurrent. Reference 1: http://www.xbrl.org/2009/role/commonPracticeRef
-Topic 210
-SubTopic 10
-Name Accounting Standards Codification
-Section S99
-Paragraph 1
-Subparagraph (SX 210.5-02(17))
-Publisher FASB
-URI https://asc.fasb.org/1943274/2147480566/210-10-S99-1
Reference 2: http://fasb.org/us-gaap/role/ref/legacyRef
-Topic 942
-SubTopic 210
-Name Accounting Standards Codification
-Section S99
-Paragraph 1
-Subparagraph (SX 210.9-03(10))
-Publisher FASB
-URI https://asc.fasb.org/1943274/2147478546/942-210-S99-1
| Name: |
us-gaap_DeferredCosts |
| Namespace Prefix: |
us-gaap_ |
| Data Type: |
xbrli:monetaryItemType |
| Balance Type: |
debit |
| Period Type: |
instant |
|
| X |
- References
+ Details
| Name: |
us-gaap_DeferredCostsCapitalizedPrepaidAndOtherAssetsDisclosureAbstract |
| Namespace Prefix: |
us-gaap_ |
| Data Type: |
xbrli:stringItemType |
| Balance Type: |
na |
| Period Type: |
duration |
|
v3.24.2
DEFERRED COMMISSIONS - Schedule of Amortization of Deferred Commissions (Details) - USD ($)
$ in Thousands |
3 Months Ended |
6 Months Ended |
Jun. 30, 2024 |
Jun. 30, 2023 |
Jun. 30, 2024 |
Jun. 30, 2023 |
| Deferred Costs, Capitalized, Prepaid, and Other Assets Disclosure [Abstract] |
|
|
|
|
| Amortization of deferred commissions |
$ 14,994
|
$ 14,750
|
$ 32,276
|
$ 29,027
|
| X |
- DefinitionThe amount of expense recognized in the current period for the periodic realization of capitalized fees that were paid to salespeople, distributors, brokers, and agents at the time of the conclusion of the sale. As a noncash expense, this element is added back to net income when calculating cash provided by or used in operations using the indirect method. Reference 1: http://fasb.org/us-gaap/role/ref/legacyRef
-Name Accounting Standards Codification
-Section 45
-Paragraph 28
-Subparagraph (b)
-SubTopic 10
-Topic 230
-Publisher FASB
-URI https://asc.fasb.org/1943274/2147482740/230-10-45-28
Reference 2: http://fasb.org/us-gaap/role/ref/legacyRef
-Topic 220
-SubTopic 10
-Name Accounting Standards Codification
-Section S99
-Paragraph 2
-Subparagraph (SX 210.5-03(3))
-Publisher FASB
-URI https://asc.fasb.org/1943274/2147483621/220-10-S99-2
| Name: |
us-gaap_AmortizationOfDeferredSalesCommissions |
| Namespace Prefix: |
us-gaap_ |
| Data Type: |
xbrli:monetaryItemType |
| Balance Type: |
debit |
| Period Type: |
duration |
|
| X |
- References
+ Details
| Name: |
us-gaap_DeferredCostsCapitalizedPrepaidAndOtherAssetsDisclosureAbstract |
| Namespace Prefix: |
us-gaap_ |
| Data Type: |
xbrli:stringItemType |
| Balance Type: |
na |
| Period Type: |
duration |
|
v3.24.2
| X |
- DefinitionAmount, after accumulated impairment loss, of asset representing future economic benefit arising from other asset acquired in business combination or from joint venture formation or both, that is not individually identified and separately recognized. Reference 1: http://www.xbrl.org/2003/role/exampleRef
-Topic 280
-SubTopic 10
-Name Accounting Standards Codification
-Section 55
-Paragraph 49
-Publisher FASB
-URI https://asc.fasb.org/1943274/2147482785/280-10-55-49
Reference 2: http://www.xbrl.org/2003/role/exampleRef
-Topic 350
-SubTopic 20
-Name Accounting Standards Codification
-Section 55
-Paragraph 24
-Publisher FASB
-URI https://asc.fasb.org/1943274/2147482548/350-20-55-24
Reference 3: http://www.xbrl.org/2003/role/exampleRef
-Topic 820
-SubTopic 10
-Name Accounting Standards Codification
-Section 55
-Paragraph 100
-Subparagraph (d)
-Publisher FASB
-URI https://asc.fasb.org/1943274/2147482078/820-10-55-100
Reference 4: http://www.xbrl.org/2003/role/exampleRef
-Topic 852
-SubTopic 10
-Name Accounting Standards Codification
-Section 55
-Paragraph 10
-Publisher FASB
-URI https://asc.fasb.org/1943274/2147481372/852-10-55-10
Reference 5: http://www.xbrl.org/2003/role/disclosureRef
-Topic 210
-SubTopic 10
-Name Accounting Standards Codification
-Section S99
-Paragraph 1
-Subparagraph (SX 210.5-02(15))
-Publisher FASB
-URI https://asc.fasb.org/1943274/2147480566/210-10-S99-1
Reference 6: http://www.xbrl.org/2003/role/disclosureRef
-Topic 350
-SubTopic 20
-Name Accounting Standards Codification
-Section 45
-Paragraph 1
-Publisher FASB
-URI https://asc.fasb.org/1943274/2147482598/350-20-45-1
Reference 7: http://www.xbrl.org/2009/role/commonPracticeRef
-Topic 350
-SubTopic 20
-Name Accounting Standards Codification
-Section 50
-Paragraph 1
-Subparagraph (a)
-Publisher FASB
-URI https://asc.fasb.org/1943274/2147482573/350-20-50-1
Reference 8: http://www.xbrl.org/2009/role/commonPracticeRef
-Topic 350
-SubTopic 20
-Name Accounting Standards Codification
-Section 50
-Paragraph 1
-Subparagraph (h)
-Publisher FASB
-URI https://asc.fasb.org/1943274/2147482573/350-20-50-1
Reference 9: http://www.xbrl.org/2003/role/disclosureRef
-Topic 942
-SubTopic 210
-Name Accounting Standards Codification
-Section S99
-Paragraph 1
-Subparagraph (SX 210.9-03(10)(1))
-Publisher FASB
-URI https://asc.fasb.org/1943274/2147478546/942-210-S99-1
| Name: |
us-gaap_Goodwill |
| Namespace Prefix: |
us-gaap_ |
| Data Type: |
xbrli:monetaryItemType |
| Balance Type: |
debit |
| Period Type: |
instant |
|
| X |
- DefinitionAmount of foreign currency translation gain (loss) which increases (decreases) asset representing future economic benefit from other asset acquired in business combination or from joint venture formation or both, that is not individually identified and separately recognized. Reference 1: http://www.xbrl.org/2003/role/disclosureRef
-Topic 350
-SubTopic 20
-Name Accounting Standards Codification
-Section 50
-Paragraph 1
-Subparagraph (f)
-Publisher FASB
-URI https://asc.fasb.org/1943274/2147482573/350-20-50-1
| Name: |
us-gaap_GoodwillForeignCurrencyTranslationGainLoss |
| Namespace Prefix: |
us-gaap_ |
| Data Type: |
xbrli:monetaryItemType |
| Balance Type: |
credit |
| Period Type: |
duration |
|
| X |
- DefinitionA roll forward is a reconciliation of a concept from the beginning of a period to the end of a period.
| Name: |
us-gaap_GoodwillRollForward |
| Namespace Prefix: |
us-gaap_ |
| Data Type: |
xbrli:stringItemType |
| Balance Type: |
na |
| Period Type: |
duration |
|
v3.24.2
GOODWILL AND OTHER INTANGIBLES - Schedule of Intangibles (Details) - USD ($)
$ in Thousands |
Jun. 30, 2024 |
Dec. 31, 2023 |
| Goodwill and Other Intangible Assets [Line Items] |
|
|
| Cost |
$ 136,478
|
$ 136,616
|
| Accumulated Amortization |
(131,273)
|
(129,614)
|
| Net Book Value |
5,205
|
7,002
|
| Client-related |
|
|
| Goodwill and Other Intangible Assets [Line Items] |
|
|
| Cost |
63,112
|
63,117
|
| Accumulated Amortization |
(60,714)
|
(60,035)
|
| Net Book Value |
2,398
|
3,082
|
| Technology |
|
|
| Goodwill and Other Intangible Assets [Line Items] |
|
|
| Cost |
68,005
|
68,138
|
| Accumulated Amortization |
(65,198)
|
(64,218)
|
| Net Book Value |
2,807
|
3,920
|
| Other |
|
|
| Goodwill and Other Intangible Assets [Line Items] |
|
|
| Cost |
5,361
|
5,361
|
| Accumulated Amortization |
(5,361)
|
(5,361)
|
| Net Book Value |
$ 0
|
$ 0
|
| Minimum | Client-related |
|
|
| Goodwill and Other Intangible Assets [Line Items] |
|
|
| Useful Lives |
4 years
|
4 years
|
| Minimum | Technology |
|
|
| Goodwill and Other Intangible Assets [Line Items] |
|
|
| Useful Lives |
2 years
|
2 years
|
| Minimum | Other |
|
|
| Goodwill and Other Intangible Assets [Line Items] |
|
|
| Useful Lives |
1 year
|
1 year
|
| Maximum | Client-related |
|
|
| Goodwill and Other Intangible Assets [Line Items] |
|
|
| Useful Lives |
10 years
|
10 years
|
| Maximum | Technology |
|
|
| Goodwill and Other Intangible Assets [Line Items] |
|
|
| Useful Lives |
10 years
|
10 years
|
| Maximum | Other |
|
|
| Goodwill and Other Intangible Assets [Line Items] |
|
|
| Useful Lives |
5 years
|
5 years
|
| X |
- DefinitionUseful life of finite-lived intangible assets, in 'PnYnMnDTnHnMnS' format, for example, 'P1Y5M13D' represents the reported fact of one year, five months, and thirteen days.
| Name: |
us-gaap_FiniteLivedIntangibleAssetUsefulLife |
| Namespace Prefix: |
us-gaap_ |
| Data Type: |
xbrli:durationItemType |
| Balance Type: |
na |
| Period Type: |
instant |
|
| X |
- DefinitionAccumulated amount of amortization of assets, excluding financial assets and goodwill, lacking physical substance with a finite life. Reference 1: http://www.xbrl.org/2003/role/exampleRef
-Topic 350
-SubTopic 30
-Name Accounting Standards Codification
-Section 55
-Paragraph 40
-Publisher FASB
-URI https://asc.fasb.org/1943274/2147482640/350-30-55-40
Reference 2: http://www.xbrl.org/2003/role/disclosureRef
-Topic 350
-SubTopic 10
-Name Accounting Standards Codification
-Section S45
-Paragraph 1
-Publisher FASB
-URI https://asc.fasb.org/1943274/2147480265/350-10-S45-1
Reference 3: http://www.xbrl.org/2003/role/disclosureRef
-Topic 350
-SubTopic 30
-Name Accounting Standards Codification
-Section 50
-Paragraph 2
-Subparagraph (a)(1)
-Publisher FASB
-URI https://asc.fasb.org/1943274/2147482665/350-30-50-2
Reference 4: http://www.xbrl.org/2003/role/disclosureRef
-Topic 210
-SubTopic 10
-Name Accounting Standards Codification
-Section S99
-Paragraph 1
-Subparagraph (SX 210.5-02(16))
-Publisher FASB
-URI https://asc.fasb.org/1943274/2147480566/210-10-S99-1
| Name: |
us-gaap_FiniteLivedIntangibleAssetsAccumulatedAmortization |
| Namespace Prefix: |
us-gaap_ |
| Data Type: |
xbrli:monetaryItemType |
| Balance Type: |
credit |
| Period Type: |
instant |
|
| X |
- DefinitionAmount before amortization of assets, excluding financial assets and goodwill, lacking physical substance with a finite life. Reference 1: http://www.xbrl.org/2003/role/exampleRef
-Topic 350
-SubTopic 30
-Name Accounting Standards Codification
-Section 55
-Paragraph 40
-Publisher FASB
-URI https://asc.fasb.org/1943274/2147482640/350-30-55-40
Reference 2: http://www.xbrl.org/2003/role/disclosureRef
-Topic 350
-SubTopic 10
-Name Accounting Standards Codification
-Section S45
-Paragraph 1
-Publisher FASB
-URI https://asc.fasb.org/1943274/2147480265/350-10-S45-1
Reference 3: http://www.xbrl.org/2003/role/disclosureRef
-Topic 350
-SubTopic 30
-Name Accounting Standards Codification
-Section 50
-Paragraph 2
-Subparagraph (a)(1)
-Publisher FASB
-URI https://asc.fasb.org/1943274/2147482665/350-30-50-2
Reference 4: http://www.xbrl.org/2003/role/disclosureRef
-Topic 928
-SubTopic 340
-Name Accounting Standards Codification
-Section 50
-Paragraph 1
-Publisher FASB
-URI https://asc.fasb.org/1943274/2147478859/928-340-50-1
| Name: |
us-gaap_FiniteLivedIntangibleAssetsGross |
| Namespace Prefix: |
us-gaap_ |
| Data Type: |
xbrli:monetaryItemType |
| Balance Type: |
debit |
| Period Type: |
instant |
|
| X |
- DefinitionLine items represent financial concepts included in a table. These concepts are used to disclose reportable information associated with domain members defined in one or many axes to the table. Reference 1: http://www.xbrl.org/2003/role/exampleRef
-Topic 350
-SubTopic 30
-Name Accounting Standards Codification
-Section 55
-Paragraph 40
-Publisher FASB
-URI https://asc.fasb.org/1943274/2147482640/350-30-55-40
Reference 2: http://www.xbrl.org/2003/role/disclosureRef
-Topic 350
-SubTopic 30
-Name Accounting Standards Codification
-Section 50
-Paragraph 2
-Subparagraph (d)(2)
-Publisher FASB
-URI https://asc.fasb.org/1943274/2147482665/350-30-50-2
Reference 3: http://www.xbrl.org/2003/role/disclosureRef
-Topic 350
-SubTopic 30
-Name Accounting Standards Codification
-Section 50
-Paragraph 2
-Subparagraph (d)(1)
-Publisher FASB
-URI https://asc.fasb.org/1943274/2147482665/350-30-50-2
Reference 4: http://www.xbrl.org/2003/role/disclosureRef
-Topic 350
-SubTopic 30
-Name Accounting Standards Codification
-Section 45
-Paragraph 1
-Publisher FASB
-URI https://asc.fasb.org/1943274/2147482686/350-30-45-1
Reference 5: http://www.xbrl.org/2003/role/disclosureRef
-Topic 350
-SubTopic 30
-Name Accounting Standards Codification
-Section 50
-Paragraph 2
-Subparagraph (a)(1)
-Publisher FASB
-URI https://asc.fasb.org/1943274/2147482665/350-30-50-2
Reference 6: http://www.xbrl.org/2003/role/disclosureRef
-Topic 350
-SubTopic 30
-Name Accounting Standards Codification
-Section 50
-Paragraph 3
-Subparagraph (d)
-Publisher FASB
-URI https://asc.fasb.org/1943274/2147482665/350-30-50-3
Reference 7: http://www.xbrl.org/2003/role/disclosureRef
-Topic 985
-SubTopic 20
-Name Accounting Standards Codification
-Section 50
-Paragraph 2
-Publisher FASB
-URI https://asc.fasb.org/1943274/2147481283/985-20-50-2
Reference 8: http://www.xbrl.org/2003/role/disclosureRef
-Topic 926
-SubTopic 20
-Name Accounting Standards Codification
-Section 50
-Paragraph 5
-Publisher FASB
-URI https://asc.fasb.org/1943274/2147483154/926-20-50-5
| Name: |
us-gaap_FiniteLivedIntangibleAssetsLineItems |
| Namespace Prefix: |
us-gaap_ |
| Data Type: |
xbrli:stringItemType |
| Balance Type: |
na |
| Period Type: |
duration |
|
| X |
- DefinitionAmount after amortization of assets, excluding financial assets and goodwill, lacking physical substance with a finite life. Reference 1: http://www.xbrl.org/2009/role/commonPracticeRef
-Topic 350
-SubTopic 30
-Name Accounting Standards Codification
-Section 50
-Paragraph 2
-Subparagraph (a)(1)
-Publisher FASB
-URI https://asc.fasb.org/1943274/2147482665/350-30-50-2
Reference 2: http://www.xbrl.org/2003/role/disclosureRef
-Topic 926
-SubTopic 20
-Name Accounting Standards Codification
-Section 50
-Paragraph 5
-Publisher FASB
-URI https://asc.fasb.org/1943274/2147483154/926-20-50-5
| Name: |
us-gaap_FiniteLivedIntangibleAssetsNet |
| Namespace Prefix: |
us-gaap_ |
| Data Type: |
xbrli:monetaryItemType |
| Balance Type: |
debit |
| Period Type: |
instant |
|
| X |
- Details
| Name: |
us-gaap_FiniteLivedIntangibleAssetsByMajorClassAxis=pega_ClientRelationshipsMember |
| Namespace Prefix: |
|
| Data Type: |
na |
| Balance Type: |
|
| Period Type: |
|
|
| X |
- Details
| Name: |
us-gaap_FiniteLivedIntangibleAssetsByMajorClassAxis=us-gaap_PatentedTechnologyMember |
| Namespace Prefix: |
|
| Data Type: |
na |
| Balance Type: |
|
| Period Type: |
|
|
| X |
- Details
| Name: |
us-gaap_FiniteLivedIntangibleAssetsByMajorClassAxis=us-gaap_OtherIntangibleAssetsMember |
| Namespace Prefix: |
|
| Data Type: |
na |
| Balance Type: |
|
| Period Type: |
|
|
| X |
- Details
| Name: |
srt_RangeAxis=srt_MinimumMember |
| Namespace Prefix: |
|
| Data Type: |
na |
| Balance Type: |
|
| Period Type: |
|
|
| X |
- Details
| Name: |
srt_RangeAxis=srt_MaximumMember |
| Namespace Prefix: |
|
| Data Type: |
na |
| Balance Type: |
|
| Period Type: |
|
|
v3.24.2
| X |
- DefinitionAmount of amortization for assets, excluding financial assets and goodwill, lacking physical substance with finite life expected to be recognized in next fiscal year following current fiscal year. Excludes interim and annual periods when interim periods are reported from current statement of financial position date (rolling approach). Reference 1: http://www.xbrl.org/2003/role/exampleRef
-Topic 350
-SubTopic 30
-Name Accounting Standards Codification
-Section 55
-Paragraph 40
-Publisher FASB
-URI https://asc.fasb.org/1943274/2147482640/350-30-55-40
Reference 2: http://www.xbrl.org/2003/role/disclosureRef
-Topic 350
-SubTopic 30
-Name Accounting Standards Codification
-Section 50
-Paragraph 2
-Subparagraph (a)(3)
-Publisher FASB
-URI https://asc.fasb.org/1943274/2147482665/350-30-50-2
Reference 3: http://www.xbrl.org/2003/role/disclosureRef
-Topic 985
-SubTopic 20
-Name Accounting Standards Codification
-Section 50
-Paragraph 2
-Publisher FASB
-URI https://asc.fasb.org/1943274/2147481283/985-20-50-2
| Name: |
us-gaap_FiniteLivedIntangibleAssetsAmortizationExpenseNextTwelveMonths |
| Namespace Prefix: |
us-gaap_ |
| Data Type: |
xbrli:monetaryItemType |
| Balance Type: |
debit |
| Period Type: |
instant |
|
| X |
- DefinitionAmount of amortization for assets, excluding financial assets and goodwill, lacking physical substance with finite life expected to be recognized in remainder of current fiscal year. Reference 1: http://www.xbrl.org/2009/role/commonPracticeRef
-Topic 985
-SubTopic 20
-Name Accounting Standards Codification
-Section 50
-Paragraph 2
-Publisher FASB
-URI https://asc.fasb.org/1943274/2147481283/985-20-50-2
| Name: |
us-gaap_FiniteLivedIntangibleAssetsAmortizationExpenseRemainderOfFiscalYear |
| Namespace Prefix: |
us-gaap_ |
| Data Type: |
xbrli:monetaryItemType |
| Balance Type: |
debit |
| Period Type: |
instant |
|
| X |
- DefinitionAmount of amortization for assets, excluding financial assets and goodwill, lacking physical substance with finite life expected to be recognized in third fiscal year following current fiscal year. Excludes interim and annual periods when interim periods are reported from current statement of financial position date (rolling approach). Reference 1: http://www.xbrl.org/2003/role/exampleRef
-Topic 350
-SubTopic 30
-Name Accounting Standards Codification
-Section 55
-Paragraph 40
-Publisher FASB
-URI https://asc.fasb.org/1943274/2147482640/350-30-55-40
Reference 2: http://www.xbrl.org/2003/role/disclosureRef
-Topic 350
-SubTopic 30
-Name Accounting Standards Codification
-Section 50
-Paragraph 2
-Subparagraph (a)(3)
-Publisher FASB
-URI https://asc.fasb.org/1943274/2147482665/350-30-50-2
Reference 3: http://www.xbrl.org/2003/role/disclosureRef
-Topic 985
-SubTopic 20
-Name Accounting Standards Codification
-Section 50
-Paragraph 2
-Publisher FASB
-URI https://asc.fasb.org/1943274/2147481283/985-20-50-2
| Name: |
us-gaap_FiniteLivedIntangibleAssetsAmortizationExpenseYearThree |
| Namespace Prefix: |
us-gaap_ |
| Data Type: |
xbrli:monetaryItemType |
| Balance Type: |
debit |
| Period Type: |
instant |
|
| X |
- DefinitionAmount of amortization for assets, excluding financial assets and goodwill, lacking physical substance with finite life expected to be recognized in second fiscal year following current fiscal year. Excludes interim and annual periods when interim periods are reported from current statement of financial position date (rolling approach). Reference 1: http://www.xbrl.org/2003/role/exampleRef
-Topic 350
-SubTopic 30
-Name Accounting Standards Codification
-Section 55
-Paragraph 40
-Publisher FASB
-URI https://asc.fasb.org/1943274/2147482640/350-30-55-40
Reference 2: http://www.xbrl.org/2003/role/disclosureRef
-Topic 350
-SubTopic 30
-Name Accounting Standards Codification
-Section 50
-Paragraph 2
-Subparagraph (a)(3)
-Publisher FASB
-URI https://asc.fasb.org/1943274/2147482665/350-30-50-2
Reference 3: http://www.xbrl.org/2003/role/disclosureRef
-Topic 985
-SubTopic 20
-Name Accounting Standards Codification
-Section 50
-Paragraph 2
-Publisher FASB
-URI https://asc.fasb.org/1943274/2147481283/985-20-50-2
| Name: |
us-gaap_FiniteLivedIntangibleAssetsAmortizationExpenseYearTwo |
| Namespace Prefix: |
us-gaap_ |
| Data Type: |
xbrli:monetaryItemType |
| Balance Type: |
debit |
| Period Type: |
instant |
|
| X |
- DefinitionAmount after amortization of assets, excluding financial assets and goodwill, lacking physical substance with a finite life. Reference 1: http://www.xbrl.org/2009/role/commonPracticeRef
-Topic 350
-SubTopic 30
-Name Accounting Standards Codification
-Section 50
-Paragraph 2
-Subparagraph (a)(1)
-Publisher FASB
-URI https://asc.fasb.org/1943274/2147482665/350-30-50-2
Reference 2: http://www.xbrl.org/2003/role/disclosureRef
-Topic 926
-SubTopic 20
-Name Accounting Standards Codification
-Section 50
-Paragraph 5
-Publisher FASB
-URI https://asc.fasb.org/1943274/2147483154/926-20-50-5
| Name: |
us-gaap_FiniteLivedIntangibleAssetsNet |
| Namespace Prefix: |
us-gaap_ |
| Data Type: |
xbrli:monetaryItemType |
| Balance Type: |
debit |
| Period Type: |
instant |
|
| X |
- References
+ Details
| Name: |
us-gaap_GoodwillAndIntangibleAssetsDisclosureAbstract |
| Namespace Prefix: |
us-gaap_ |
| Data Type: |
xbrli:stringItemType |
| Balance Type: |
na |
| Period Type: |
duration |
|
v3.24.2
| X |
- DefinitionLine items represent financial concepts included in a table. These concepts are used to disclose reportable information associated with domain members defined in one or many axes to the table. Reference 1: http://www.xbrl.org/2003/role/disclosureRef
-Topic 350
-SubTopic 30
-Name Accounting Standards Codification
-Section 50
-Paragraph 1
-Subparagraph (a)(2)
-Publisher FASB
-URI https://asc.fasb.org/1943274/2147482665/350-30-50-1
Reference 2: http://www.xbrl.org/2003/role/disclosureRef
-Topic 350
-SubTopic 30
-Name Accounting Standards Codification
-Section 50
-Paragraph 1
-Subparagraph (d)
-Publisher FASB
-URI https://asc.fasb.org/1943274/2147482665/350-30-50-1
Reference 3: http://www.xbrl.org/2003/role/disclosureRef
-Topic 350
-SubTopic 30
-Name Accounting Standards Codification
-Section 50
-Paragraph 1
-Subparagraph (a)(3)
-Publisher FASB
-URI https://asc.fasb.org/1943274/2147482665/350-30-50-1
Reference 4: http://www.xbrl.org/2003/role/disclosureRef
-Topic 350
-SubTopic 30
-Name Accounting Standards Codification
-Section 50
-Paragraph 1
-Subparagraph (a)(1)
-Publisher FASB
-URI https://asc.fasb.org/1943274/2147482665/350-30-50-1
Reference 5: http://www.xbrl.org/2003/role/disclosureRef
-Topic 985
-SubTopic 20
-Name Accounting Standards Codification
-Section 50
-Paragraph 2
-Publisher FASB
-URI https://asc.fasb.org/1943274/2147481283/985-20-50-2
| Name: |
us-gaap_AcquiredFiniteLivedIntangibleAssetsLineItems |
| Namespace Prefix: |
us-gaap_ |
| Data Type: |
xbrli:stringItemType |
| Balance Type: |
na |
| Period Type: |
duration |
|
| X |
- DefinitionThe aggregate expense charged against earnings to allocate the cost of intangible assets (nonphysical assets not used in production) in a systematic and rational manner to the periods expected to benefit from such assets. As a noncash expense, this element is added back to net income when calculating cash provided by or used in operations using the indirect method. Reference 1: http://fasb.org/us-gaap/role/ref/legacyRef
-Name Accounting Standards Codification
-Section 45
-Paragraph 28
-Subparagraph (b)
-SubTopic 10
-Topic 230
-Publisher FASB
-URI https://asc.fasb.org/1943274/2147482740/230-10-45-28
Reference 2: http://www.xbrl.org/2003/role/exampleRef
-Topic 350
-SubTopic 30
-Name Accounting Standards Codification
-Section 55
-Paragraph 40
-Publisher FASB
-URI https://asc.fasb.org/1943274/2147482640/350-30-55-40
Reference 3: http://www.xbrl.org/2003/role/disclosureRef
-Topic 350
-SubTopic 30
-Name Accounting Standards Codification
-Section 50
-Paragraph 2
-Subparagraph (a)(2)
-Publisher FASB
-URI https://asc.fasb.org/1943274/2147482665/350-30-50-2
Reference 4: http://www.xbrl.org/2003/role/disclosureRef
-Topic 350
-SubTopic 30
-Name Accounting Standards Codification
-Section 45
-Paragraph 2
-Publisher FASB
-URI https://asc.fasb.org/1943274/2147482686/350-30-45-2
| Name: |
us-gaap_AmortizationOfIntangibleAssets |
| Namespace Prefix: |
us-gaap_ |
| Data Type: |
xbrli:monetaryItemType |
| Balance Type: |
debit |
| Period Type: |
duration |
|
| X |
- Details
| Name: |
us-gaap_IncomeStatementLocationAxis=pega_CostOfRevenueMember |
| Namespace Prefix: |
|
| Data Type: |
na |
| Balance Type: |
|
| Period Type: |
|
|
| X |
- Details
| Name: |
us-gaap_IncomeStatementLocationAxis=us-gaap_SellingAndMarketingExpenseMember |
| Namespace Prefix: |
|
| Data Type: |
na |
| Balance Type: |
|
| Period Type: |
|
|
v3.24.2
OTHER ASSETS AND LIABILITIES - Schedule of Other Assets and Other Liabilities (Details) - USD ($)
$ in Thousands |
Jun. 30, 2024 |
Dec. 31, 2023 |
Jun. 30, 2023 |
| Other current assets |
|
|
|
| Income tax receivables |
$ 16,060
|
$ 4,804
|
|
| Contract assets |
15,374
|
16,238
|
|
| Insurance receivable |
0
|
1,954
|
|
| Indirect Tax Receivable |
2,702
|
1,924
|
|
| Capped call transactions |
915
|
0
|
|
| Restricted cash |
768
|
0
|
|
| Other |
40,504
|
43,217
|
|
| Other current assets |
76,323
|
68,137
|
|
| Other long-term assets |
|
|
|
| Deferred commissions |
100,490
|
114,119
|
|
| Right of use assets |
68,293
|
64,198
|
|
| Property and equipment |
42,190
|
47,279
|
|
| Venture investments |
21,047
|
19,450
|
|
| Contract assets |
19,997
|
20,635
|
|
| Intangible assets |
5,205
|
7,002
|
|
| Capped call transactions |
0
|
893
|
|
| Deferred income taxes |
3,666
|
3,678
|
|
| Restricted cash |
4,006
|
2,925
|
$ 1,933
|
| Other |
37,355
|
34,517
|
|
| Other long-term assets |
302,249
|
314,696
|
|
| Other current liabilities |
|
|
|
| Operating lease liabilities |
15,254
|
15,000
|
|
| Dividends payable |
2,561
|
2,515
|
|
| Other |
2,862
|
3,828
|
|
| Other current liabilities |
20,677
|
21,343
|
|
| Other long-term liabilities |
|
|
|
| Deferred revenue |
2,443
|
2,478
|
|
| Income taxes payable |
858
|
859
|
|
| Other |
11,061
|
10,233
|
|
| Other long-term liabilities |
$ 14,362
|
$ 13,570
|
|
| X |
- Definition
+ References
+ Details
| Name: |
pega_OtherAssetsCurrentAbstract |
| Namespace Prefix: |
pega_ |
| Data Type: |
xbrli:stringItemType |
| Balance Type: |
na |
| Period Type: |
duration |
|
| X |
- DefinitionOther, Current Liabilities
| Name: |
pega_OtherCurrentLiabilities |
| Namespace Prefix: |
pega_ |
| Data Type: |
xbrli:monetaryItemType |
| Balance Type: |
credit |
| Period Type: |
instant |
|
| X |
- DefinitionOther, Long-term Liabilities
| Name: |
pega_OtherLongTermLiabilities |
| Namespace Prefix: |
pega_ |
| Data Type: |
xbrli:monetaryItemType |
| Balance Type: |
credit |
| Period Type: |
instant |
|
| X |
- DefinitionAmount, after allowance for credit loss, of right to consideration in exchange for good or service transferred to customer when right is conditioned on something other than passage of time, classified as current. Reference 1: http://www.xbrl.org/2003/role/disclosureRef
-Topic 606
-SubTopic 10
-Name Accounting Standards Codification
-Section 45
-Paragraph 3
-Publisher FASB
-URI https://asc.fasb.org/1943274/2147479837/606-10-45-3
Reference 2: http://www.xbrl.org/2003/role/disclosureRef
-Topic 606
-SubTopic 10
-Name Accounting Standards Codification
-Section 45
-Paragraph 1
-Publisher FASB
-URI https://asc.fasb.org/1943274/2147479837/606-10-45-1
Reference 3: http://www.xbrl.org/2003/role/disclosureRef
-Topic 606
-SubTopic 10
-Name Accounting Standards Codification
-Section 50
-Paragraph 8
-Subparagraph (a)
-Publisher FASB
-URI https://asc.fasb.org/1943274/2147479806/606-10-50-8
| Name: |
us-gaap_ContractWithCustomerAssetNetCurrent |
| Namespace Prefix: |
us-gaap_ |
| Data Type: |
xbrli:monetaryItemType |
| Balance Type: |
debit |
| Period Type: |
instant |
|
| X |
- DefinitionAmount, after allowance for credit loss, of right to consideration in exchange for good or service transferred to customer when right is conditioned on something other than passage of time, classified as noncurrent. Reference 1: http://www.xbrl.org/2003/role/disclosureRef
-Topic 606
-SubTopic 10
-Name Accounting Standards Codification
-Section 45
-Paragraph 3
-Publisher FASB
-URI https://asc.fasb.org/1943274/2147479837/606-10-45-3
Reference 2: http://www.xbrl.org/2003/role/disclosureRef
-Topic 606
-SubTopic 10
-Name Accounting Standards Codification
-Section 45
-Paragraph 1
-Publisher FASB
-URI https://asc.fasb.org/1943274/2147479837/606-10-45-1
Reference 3: http://www.xbrl.org/2003/role/disclosureRef
-Topic 606
-SubTopic 10
-Name Accounting Standards Codification
-Section 50
-Paragraph 8
-Subparagraph (a)
-Publisher FASB
-URI https://asc.fasb.org/1943274/2147479806/606-10-50-8
| Name: |
us-gaap_ContractWithCustomerAssetNetNoncurrent |
| Namespace Prefix: |
us-gaap_ |
| Data Type: |
xbrli:monetaryItemType |
| Balance Type: |
debit |
| Period Type: |
instant |
|
| X |
- DefinitionAmount of deferred cost, excluding capitalized cost related to contract with customer; classified as noncurrent. Reference 1: http://www.xbrl.org/2009/role/commonPracticeRef
-Topic 210
-SubTopic 10
-Name Accounting Standards Codification
-Section S99
-Paragraph 1
-Subparagraph (SX 210.5-02(17))
-Publisher FASB
-URI https://asc.fasb.org/1943274/2147480566/210-10-S99-1
Reference 2: http://fasb.org/us-gaap/role/ref/legacyRef
-Topic 942
-SubTopic 210
-Name Accounting Standards Codification
-Section S99
-Paragraph 1
-Subparagraph (SX 210.9-03(10))
-Publisher FASB
-URI https://asc.fasb.org/1943274/2147478546/942-210-S99-1
| Name: |
us-gaap_DeferredCosts |
| Namespace Prefix: |
us-gaap_ |
| Data Type: |
xbrli:monetaryItemType |
| Balance Type: |
debit |
| Period Type: |
instant |
|
| X |
- DefinitionAmount of deferred income and obligation to transfer product and service to customer for which consideration has been received or is receivable, classified as noncurrent. Reference 1: http://www.xbrl.org/2009/role/commonPracticeRef
-Topic 210
-SubTopic 10
-Name Accounting Standards Codification
-Section S99
-Paragraph 1
-Subparagraph (SX 210.5-02(26)(c))
-Publisher FASB
-URI https://asc.fasb.org/1943274/2147480566/210-10-S99-1
| Name: |
us-gaap_DeferredRevenueNoncurrent |
| Namespace Prefix: |
us-gaap_ |
| Data Type: |
xbrli:monetaryItemType |
| Balance Type: |
credit |
| Period Type: |
instant |
|
| X |
- DefinitionFair value, after the effects of master netting arrangements, of a financial asset or other contract with one or more underlyings, notional amount or payment provision or both, and the contract can be net settled by means outside the contract or delivery of an asset, expected to be settled within one year or normal operating cycle, if longer. Includes assets not subject to a master netting arrangement and not elected to be offset. Reference 1: http://www.xbrl.org/2003/role/disclosureRef
-Topic 210
-SubTopic 20
-Name Accounting Standards Codification
-Section 50
-Paragraph 3
-Subparagraph (c)
-Publisher FASB
-URI https://asc.fasb.org/1943274/2147483466/210-20-50-3
| Name: |
us-gaap_DerivativeAssetsCurrent |
| Namespace Prefix: |
us-gaap_ |
| Data Type: |
xbrli:monetaryItemType |
| Balance Type: |
debit |
| Period Type: |
instant |
|
| X |
- DefinitionFair value, after the effects of master netting arrangements, of a financial asset or other contract with one or more underlyings, notional amount or payment provision or both, and the contract can be net settled by means outside the contract or delivery of an asset, expected to be settled after one year or the normal operating cycle, if longer. Includes assets not subject to a master netting arrangement and not elected to be offset. Reference 1: http://www.xbrl.org/2003/role/disclosureRef
-Topic 210
-SubTopic 20
-Name Accounting Standards Codification
-Section 50
-Paragraph 3
-Subparagraph (c)
-Publisher FASB
-URI https://asc.fasb.org/1943274/2147483466/210-20-50-3
| Name: |
us-gaap_DerivativeAssetsNoncurrent |
| Namespace Prefix: |
us-gaap_ |
| Data Type: |
xbrli:monetaryItemType |
| Balance Type: |
debit |
| Period Type: |
instant |
|
| X |
- DefinitionCarrying value as of the balance sheet date of dividends declared but unpaid on equity securities issued by the entity and outstanding. Used to reflect the current portion of the liabilities (due within one year or within the normal operating cycle if longer). Reference 1: http://fasb.org/us-gaap/role/ref/legacyRef
-Topic 210
-SubTopic 10
-Name Accounting Standards Codification
-Section S99
-Paragraph 1
-Subparagraph (SX 210.5-02(20))
-Publisher FASB
-URI https://asc.fasb.org/1943274/2147480566/210-10-S99-1
| Name: |
us-gaap_DividendsPayableCurrent |
| Namespace Prefix: |
us-gaap_ |
| Data Type: |
xbrli:monetaryItemType |
| Balance Type: |
credit |
| Period Type: |
instant |
|
| X |
- DefinitionAmount due in settlement of a claim for reimbursement from an insurance company when the Company has suffered a loss covered under an insurance policy. For classified balance sheets, represents the current amount receivable, that is amounts expected to be collected within one year or the normal operating cycle, if longer. Reference 1: http://www.xbrl.org/2009/role/commonPracticeRef
-Topic 210
-SubTopic 10
-Name Accounting Standards Codification
-Section S99
-Paragraph 1
-Subparagraph (SX 210.5-02(3)(a)(4))
-Publisher FASB
-URI https://asc.fasb.org/1943274/2147480566/210-10-S99-1
| Name: |
us-gaap_InsuranceSettlementsReceivableCurrent |
| Namespace Prefix: |
us-gaap_ |
| Data Type: |
xbrli:monetaryItemType |
| Balance Type: |
debit |
| Period Type: |
instant |
|
| X |
- DefinitionAmount, after impairment and amortization, of goodwill, indefinite-lived, and finite-lived intangible assets. Reference 1: http://www.xbrl.org/2009/role/commonPracticeRef
-Topic 350
-SubTopic 10
-Name Accounting Standards Codification
-Section S45
-Paragraph 1
-Publisher FASB
-URI https://asc.fasb.org/1943274/2147480265/350-10-S45-1
| Name: |
us-gaap_IntangibleAssetsNetIncludingGoodwill |
| Namespace Prefix: |
us-gaap_ |
| Data Type: |
xbrli:monetaryItemType |
| Balance Type: |
debit |
| Period Type: |
instant |
|
| X |
- DefinitionPresent value of lessee's discounted obligation for lease payments from operating lease, classified as current. Reference 1: http://www.xbrl.org/2003/role/disclosureRef
-Topic 842
-SubTopic 20
-Name Accounting Standards Codification
-Section 45
-Paragraph 1
-Subparagraph (b)
-Publisher FASB
-URI https://asc.fasb.org/1943274/2147479041/842-20-45-1
| Name: |
us-gaap_OperatingLeaseLiabilityCurrent |
| Namespace Prefix: |
us-gaap_ |
| Data Type: |
xbrli:monetaryItemType |
| Balance Type: |
credit |
| Period Type: |
instant |
|
| X |
- DefinitionAmount of lessee's right to use underlying asset under operating lease. Reference 1: http://www.xbrl.org/2003/role/disclosureRef
-Topic 842
-SubTopic 20
-Name Accounting Standards Codification
-Section 45
-Paragraph 1
-Subparagraph (a)
-Publisher FASB
-URI https://asc.fasb.org/1943274/2147479041/842-20-45-1
| Name: |
us-gaap_OperatingLeaseRightOfUseAsset |
| Namespace Prefix: |
us-gaap_ |
| Data Type: |
xbrli:monetaryItemType |
| Balance Type: |
debit |
| Period Type: |
instant |
|
| X |
- DefinitionAmount of current assets classified as other. Reference 1: http://www.xbrl.org/2003/role/exampleRef
-Topic 852
-SubTopic 10
-Name Accounting Standards Codification
-Section 55
-Paragraph 10
-Publisher FASB
-URI https://asc.fasb.org/1943274/2147481372/852-10-55-10
Reference 2: http://www.xbrl.org/2003/role/disclosureRef
-Topic 210
-SubTopic 10
-Name Accounting Standards Codification
-Section S99
-Paragraph 1
-Subparagraph (SX 210.5-02(8))
-Publisher FASB
-URI https://asc.fasb.org/1943274/2147480566/210-10-S99-1
| Name: |
us-gaap_OtherAssetsCurrent |
| Namespace Prefix: |
us-gaap_ |
| Data Type: |
xbrli:monetaryItemType |
| Balance Type: |
debit |
| Period Type: |
instant |
|
| X |
- DefinitionAmount of noncurrent assets classified as other. Reference 1: http://www.xbrl.org/2003/role/disclosureRef
-Topic 210
-SubTopic 10
-Name Accounting Standards Codification
-Section S99
-Paragraph 1
-Subparagraph (SX 210.5-02(17))
-Publisher FASB
-URI https://asc.fasb.org/1943274/2147480566/210-10-S99-1
| Name: |
us-gaap_OtherAssetsNoncurrent |
| Namespace Prefix: |
us-gaap_ |
| Data Type: |
xbrli:monetaryItemType |
| Balance Type: |
debit |
| Period Type: |
instant |
|
| X |
- References
+ Details
| Name: |
us-gaap_OtherAssetsNoncurrentAbstract |
| Namespace Prefix: |
us-gaap_ |
| Data Type: |
xbrli:stringItemType |
| Balance Type: |
na |
| Period Type: |
duration |
|
| X |
- DefinitionAmount of liabilities classified as other, due within one year or the normal operating cycle, if longer. Reference 1: http://fasb.org/us-gaap/role/ref/legacyRef
-Topic 210
-SubTopic 10
-Name Accounting Standards Codification
-Section S99
-Paragraph 1
-Subparagraph (SX 210.5-02(20))
-Publisher FASB
-URI https://asc.fasb.org/1943274/2147480566/210-10-S99-1
Reference 2: http://www.xbrl.org/2003/role/exampleRef
-Topic 852
-SubTopic 10
-Name Accounting Standards Codification
-Section 55
-Paragraph 10
-Publisher FASB
-URI https://asc.fasb.org/1943274/2147481372/852-10-55-10
| Name: |
us-gaap_OtherLiabilitiesCurrent |
| Namespace Prefix: |
us-gaap_ |
| Data Type: |
xbrli:monetaryItemType |
| Balance Type: |
credit |
| Period Type: |
instant |
|
| X |
- References
+ Details
| Name: |
us-gaap_OtherLiabilitiesCurrentAbstract |
| Namespace Prefix: |
us-gaap_ |
| Data Type: |
xbrli:stringItemType |
| Balance Type: |
na |
| Period Type: |
duration |
|
| X |
- DefinitionAmount of liabilities classified as other, due after one year or the normal operating cycle, if longer. Reference 1: http://fasb.org/us-gaap/role/ref/legacyRef
-Topic 210
-SubTopic 10
-Name Accounting Standards Codification
-Section S99
-Paragraph 1
-Subparagraph (SX 210.5-02(24))
-Publisher FASB
-URI https://asc.fasb.org/1943274/2147480566/210-10-S99-1
| Name: |
us-gaap_OtherLiabilitiesNoncurrent |
| Namespace Prefix: |
us-gaap_ |
| Data Type: |
xbrli:monetaryItemType |
| Balance Type: |
credit |
| Period Type: |
instant |
|
| X |
- References
+ Details
| Name: |
us-gaap_OtherLiabilitiesNoncurrentAbstract |
| Namespace Prefix: |
us-gaap_ |
| Data Type: |
xbrli:stringItemType |
| Balance Type: |
na |
| Period Type: |
duration |
|
| X |
- DefinitionAmount after accumulated depreciation, depletion and amortization of physical assets used in the normal conduct of business to produce goods and services and not intended for resale. Examples include, but are not limited to, land, buildings, machinery and equipment, office equipment, and furniture and fixtures. Reference 1: http://fasb.org/us-gaap/role/ref/legacyRef
-Name Accounting Standards Codification
-Section 50
-Paragraph 1
-SubTopic 10
-Topic 360
-Publisher FASB
-URI https://asc.fasb.org/1943274/2147482099/360-10-50-1
Reference 2: http://www.xbrl.org/2003/role/disclosureRef
-Topic 842
-SubTopic 20
-Name Accounting Standards Codification
-Section 50
-Paragraph 7A
-Subparagraph (a)
-Publisher FASB
-URI https://asc.fasb.org/1943274/2147478964/842-20-50-7A
Reference 3: http://www.xbrl.org/2003/role/exampleRef
-Topic 852
-SubTopic 10
-Name Accounting Standards Codification
-Section 55
-Paragraph 10
-Publisher FASB
-URI https://asc.fasb.org/1943274/2147481372/852-10-55-10
Reference 4: http://www.xbrl.org/2003/role/disclosureRef
-Topic 944
-SubTopic 210
-Name Accounting Standards Codification
-Section S99
-Paragraph 1
-Subparagraph (SX 210.7-03(a)(8))
-Publisher FASB
-URI https://asc.fasb.org/1943274/2147478777/944-210-S99-1
Reference 5: http://www.xbrl.org/2003/role/disclosureRef
-Topic 942
-SubTopic 360
-Name Accounting Standards Codification
-Section 50
-Paragraph 1
-Publisher FASB
-URI https://asc.fasb.org/1943274/2147478451/942-360-50-1
| Name: |
us-gaap_PropertyPlantAndEquipmentNet |
| Namespace Prefix: |
us-gaap_ |
| Data Type: |
xbrli:monetaryItemType |
| Balance Type: |
debit |
| Period Type: |
instant |
|
| X |
- DefinitionAmount of cash restricted as to withdrawal or usage, classified as current. Cash includes, but is not limited to, currency on hand, demand deposits with banks or financial institutions, and other accounts with general characteristics of demand deposits. Reference 1: http://www.xbrl.org/2009/role/commonPracticeRef
-Topic 210
-SubTopic 10
-Name Accounting Standards Codification
-Section S99
-Paragraph 1
-Subparagraph (SX 210.5-02(1))
-Publisher FASB
-URI https://asc.fasb.org/1943274/2147480566/210-10-S99-1
Reference 2: http://www.xbrl.org/2009/role/commonPracticeRef
-Topic 230
-SubTopic 10
-Name Accounting Standards Codification
-Section 50
-Paragraph 8
-Publisher FASB
-URI https://asc.fasb.org/1943274/2147482913/230-10-50-8
| Name: |
us-gaap_RestrictedCashCurrent |
| Namespace Prefix: |
us-gaap_ |
| Data Type: |
xbrli:monetaryItemType |
| Balance Type: |
debit |
| Period Type: |
instant |
|
| X |
- DefinitionAmount of cash restricted as to withdrawal or usage, classified as noncurrent. Cash includes, but is not limited to, currency on hand, demand deposits with banks or financial institutions, and other accounts with general characteristics of demand deposits. Reference 1: http://www.xbrl.org/2009/role/commonPracticeRef
-Topic 210
-SubTopic 10
-Name Accounting Standards Codification
-Section S99
-Paragraph 1
-Subparagraph (SX 210.5-02(17))
-Publisher FASB
-URI https://asc.fasb.org/1943274/2147480566/210-10-S99-1
Reference 2: http://www.xbrl.org/2003/role/disclosureRef
-Name Accounting Standards Codification
-Section 45
-Paragraph 5
-SubTopic 210
-Topic 954
-Publisher FASB
-URI https://asc.fasb.org/1943274/2147477220/954-210-45-5
Reference 3: http://www.xbrl.org/2009/role/commonPracticeRef
-Topic 230
-SubTopic 10
-Name Accounting Standards Codification
-Section 50
-Paragraph 8
-Publisher FASB
-URI https://asc.fasb.org/1943274/2147482913/230-10-50-8
| Name: |
us-gaap_RestrictedCashNoncurrent |
| Namespace Prefix: |
us-gaap_ |
| Data Type: |
xbrli:monetaryItemType |
| Balance Type: |
debit |
| Period Type: |
instant |
|
v3.24.2
OTHER ASSETS AND LIABILITIES - Schedule of Accrued expenses (Details) - USD ($)
$ in Thousands |
Jun. 30, 2024 |
Dec. 31, 2023 |
| Other Assets and Liabilities [Abstract] |
|
|
| Cloud hosting |
$ 15,152
|
$ 1,358
|
| Outside professional services |
9,539
|
10,419
|
| Marketing and sales program |
7,081
|
2,557
|
| Income and other taxes |
3,422
|
15,428
|
| Employee related |
4,966
|
4,486
|
| Other |
4,715
|
5,693
|
| Accrued expenses |
$ 44,875
|
$ 39,941
|
| X |
- DefinitionAccrued Cloud Hosting, Current
| Name: |
pega_AccruedCloudHostingCurrent |
| Namespace Prefix: |
pega_ |
| Data Type: |
xbrli:monetaryItemType |
| Balance Type: |
credit |
| Period Type: |
instant |
|
| X |
- DefinitionOther Assets and Liabilities
| Name: |
pega_OtherAssetsAndLiabilitiesAbstract |
| Namespace Prefix: |
pega_ |
| Data Type: |
xbrli:stringItemType |
| Balance Type: |
na |
| Period Type: |
duration |
|
| X |
- DefinitionAmount of obligations incurred classified as other, payable within one year or the normal operating cycle, if longer. Reference 1: http://fasb.org/us-gaap/role/ref/legacyRef
-Topic 210
-SubTopic 10
-Name Accounting Standards Codification
-Section S99
-Paragraph 1
-Subparagraph (SX 210.5-02(19)(a))
-Publisher FASB
-URI https://asc.fasb.org/1943274/2147480566/210-10-S99-1
| Name: |
us-gaap_AccountsPayableOtherCurrent |
| Namespace Prefix: |
us-gaap_ |
| Data Type: |
xbrli:monetaryItemType |
| Balance Type: |
credit |
| Period Type: |
instant |
|
| X |
- DefinitionCarrying value as of the balance sheet date of obligations incurred and payable, pertaining to costs that are statutory in nature, are incurred on contractual obligations, or accumulate over time and for which invoices have not yet been received or will not be rendered. Examples include taxes, interest, rent and utilities. Used to reflect the current portion of the liabilities (due within one year or within the normal operating cycle if longer). Reference 1: http://fasb.org/us-gaap/role/ref/legacyRef
-Topic 210
-SubTopic 10
-Name Accounting Standards Codification
-Section S99
-Paragraph 1
-Subparagraph (SX 210.5-02(20))
-Publisher FASB
-URI https://asc.fasb.org/1943274/2147480566/210-10-S99-1
| Name: |
us-gaap_AccruedLiabilitiesCurrent |
| Namespace Prefix: |
us-gaap_ |
| Data Type: |
xbrli:monetaryItemType |
| Balance Type: |
credit |
| Period Type: |
instant |
|
| X |
- DefinitionCarrying value as of the balance sheet date of obligations incurred through that date and payable for the marketing, trade and selling of the entity's goods and services. Marketing costs would include expenditures for planning and executing the conception, pricing, promotion, and distribution of ideas, goods, and services; costs of public relations and corporate promotions; and obligations incurred and payable for sales discounts, rebates, price protection programs, etc. offered to customers and under government programs. Used to reflect the current portion of the liabilities (due within one year or within the normal operating cycle if longer).
| Name: |
us-gaap_AccruedMarketingCostsCurrent |
| Namespace Prefix: |
us-gaap_ |
| Data Type: |
xbrli:monetaryItemType |
| Balance Type: |
credit |
| Period Type: |
instant |
|
| X |
- DefinitionCarrying value as of the balance sheet date of obligations incurred through that date and payable for professional fees, such as for legal and accounting services received. Used to reflect the current portion of the liabilities (due within one year or within the normal operating cycle if longer). Reference 1: http://fasb.org/us-gaap/role/ref/legacyRef
-Topic 210
-SubTopic 10
-Name Accounting Standards Codification
-Section S99
-Paragraph 1
-Subparagraph (SX 210.5-02(20))
-Publisher FASB
-URI https://asc.fasb.org/1943274/2147480566/210-10-S99-1
| Name: |
us-gaap_AccruedProfessionalFeesCurrent |
| Namespace Prefix: |
us-gaap_ |
| Data Type: |
xbrli:monetaryItemType |
| Balance Type: |
credit |
| Period Type: |
instant |
|
v3.24.2
LEASES - Schedule of Expense (Details) - USD ($)
$ in Thousands |
3 Months Ended |
6 Months Ended |
Jun. 30, 2024 |
Jun. 30, 2023 |
Jun. 30, 2024 |
Jun. 30, 2023 |
| Leases [Abstract] |
|
|
|
|
| Fixed lease costs |
$ 5,271
|
$ 4,495
|
$ 9,533
|
$ 10,261
|
| Short-term lease costs |
410
|
696
|
953
|
1,477
|
| Variable lease costs |
1,763
|
2,186
|
3,372
|
4,160
|
| Lease, cost |
$ 7,444
|
$ 7,377
|
$ 13,858
|
$ 15,898
|
| X |
- DefinitionAmount of lease cost recognized by lessee for lease contract. Reference 1: http://www.xbrl.org/2003/role/exampleRef
-Topic 842
-SubTopic 20
-Name Accounting Standards Codification
-Section 55
-Paragraph 53
-Publisher FASB
-URI https://asc.fasb.org/1943274/2147479589/842-20-55-53
Reference 2: http://www.xbrl.org/2003/role/disclosureRef
-Topic 842
-SubTopic 20
-Name Accounting Standards Codification
-Section 50
-Paragraph 4
-Publisher FASB
-URI https://asc.fasb.org/1943274/2147478964/842-20-50-4
| Name: |
us-gaap_LeaseCost |
| Namespace Prefix: |
us-gaap_ |
| Data Type: |
xbrli:monetaryItemType |
| Balance Type: |
debit |
| Period Type: |
duration |
|
| X |
- References
+ Details
| Name: |
us-gaap_LeasesAbstract |
| Namespace Prefix: |
us-gaap_ |
| Data Type: |
xbrli:stringItemType |
| Balance Type: |
na |
| Period Type: |
duration |
|
| X |
- DefinitionAmount of single lease cost, calculated by allocation of remaining cost of lease over remaining lease term. Includes, but is not limited to, single lease cost, after impairment of right-of-use asset, calculated by amortization of remaining right-of-use asset and accretion of lease liability. Reference 1: http://www.xbrl.org/2003/role/exampleRef
-Topic 842
-SubTopic 20
-Name Accounting Standards Codification
-Section 55
-Paragraph 53
-Publisher FASB
-URI https://asc.fasb.org/1943274/2147479589/842-20-55-53
Reference 2: http://www.xbrl.org/2003/role/disclosureRef
-Topic 842
-SubTopic 20
-Name Accounting Standards Codification
-Section 50
-Paragraph 4
-Subparagraph (b)
-Publisher FASB
-URI https://asc.fasb.org/1943274/2147478964/842-20-50-4
| Name: |
us-gaap_OperatingLeaseCost |
| Namespace Prefix: |
us-gaap_ |
| Data Type: |
xbrli:monetaryItemType |
| Balance Type: |
debit |
| Period Type: |
duration |
|
| X |
- DefinitionAmount of short-term lease cost, excluding expense for lease with term of one month or less. Reference 1: http://www.xbrl.org/2003/role/exampleRef
-Topic 842
-SubTopic 20
-Name Accounting Standards Codification
-Section 55
-Paragraph 53
-Publisher FASB
-URI https://asc.fasb.org/1943274/2147479589/842-20-55-53
Reference 2: http://www.xbrl.org/2003/role/disclosureRef
-Topic 842
-SubTopic 20
-Name Accounting Standards Codification
-Section 50
-Paragraph 4
-Subparagraph (c)
-Publisher FASB
-URI https://asc.fasb.org/1943274/2147478964/842-20-50-4
| Name: |
us-gaap_ShortTermLeaseCost |
| Namespace Prefix: |
us-gaap_ |
| Data Type: |
xbrli:monetaryItemType |
| Balance Type: |
debit |
| Period Type: |
duration |
|
| X |
- DefinitionAmount of variable lease cost, excluded from lease liability, recognized when obligation for payment is incurred for finance and operating leases. Reference 1: http://www.xbrl.org/2003/role/exampleRef
-Topic 842
-SubTopic 20
-Name Accounting Standards Codification
-Section 55
-Paragraph 53
-Publisher FASB
-URI https://asc.fasb.org/1943274/2147479589/842-20-55-53
Reference 2: http://www.xbrl.org/2003/role/disclosureRef
-Topic 842
-SubTopic 20
-Name Accounting Standards Codification
-Section 50
-Paragraph 4
-Subparagraph (d)
-Publisher FASB
-URI https://asc.fasb.org/1943274/2147478964/842-20-50-4
| Name: |
us-gaap_VariableLeaseCost |
| Namespace Prefix: |
us-gaap_ |
| Data Type: |
xbrli:monetaryItemType |
| Balance Type: |
debit |
| Period Type: |
duration |
|
v3.24.2
LEASES - Schedule of Right of Use Asset and Lease Liabilities (Details) - USD ($)
$ in Thousands |
Jun. 30, 2024 |
Dec. 31, 2023 |
| Leases [Abstract] |
|
|
| Operating Lease, Right-of-Use Asset, Statement of Financial Position [Extensible Enumeration] |
Other long-term assets
|
Other long-term assets
|
| Right of use assets |
$ 68,293
|
$ 64,198
|
| Operating Lease, Liability, Current, Statement of Financial Position [Extensible Enumeration] |
Other current liabilities
|
Other current liabilities
|
| Operating lease liabilities |
$ 15,254
|
$ 15,000
|
| Long-term operating lease liabilities |
$ 70,202
|
$ 66,901
|
| X |
- References
+ Details
| Name: |
us-gaap_LeasesAbstract |
| Namespace Prefix: |
us-gaap_ |
| Data Type: |
xbrli:stringItemType |
| Balance Type: |
na |
| Period Type: |
duration |
|
| X |
- DefinitionPresent value of lessee's discounted obligation for lease payments from operating lease, classified as current. Reference 1: http://www.xbrl.org/2003/role/disclosureRef
-Topic 842
-SubTopic 20
-Name Accounting Standards Codification
-Section 45
-Paragraph 1
-Subparagraph (b)
-Publisher FASB
-URI https://asc.fasb.org/1943274/2147479041/842-20-45-1
| Name: |
us-gaap_OperatingLeaseLiabilityCurrent |
| Namespace Prefix: |
us-gaap_ |
| Data Type: |
xbrli:monetaryItemType |
| Balance Type: |
credit |
| Period Type: |
instant |
|
| X |
- DefinitionIndicates line item in statement of financial position that includes current operating lease liability. Reference 1: http://www.xbrl.org/2003/role/disclosureRef
-Topic 842
-SubTopic 20
-Name Accounting Standards Codification
-Section 45
-Paragraph 2
-Publisher FASB
-URI https://asc.fasb.org/1943274/2147479041/842-20-45-2
| Name: |
us-gaap_OperatingLeaseLiabilityCurrentStatementOfFinancialPositionExtensibleList |
| Namespace Prefix: |
us-gaap_ |
| Data Type: |
enum2:enumerationSetItemType |
| Balance Type: |
na |
| Period Type: |
instant |
|
| X |
- DefinitionPresent value of lessee's discounted obligation for lease payments from operating lease, classified as noncurrent. Reference 1: http://www.xbrl.org/2003/role/disclosureRef
-Topic 842
-SubTopic 20
-Name Accounting Standards Codification
-Section 45
-Paragraph 1
-Subparagraph (b)
-Publisher FASB
-URI https://asc.fasb.org/1943274/2147479041/842-20-45-1
| Name: |
us-gaap_OperatingLeaseLiabilityNoncurrent |
| Namespace Prefix: |
us-gaap_ |
| Data Type: |
xbrli:monetaryItemType |
| Balance Type: |
credit |
| Period Type: |
instant |
|
| X |
- DefinitionAmount of lessee's right to use underlying asset under operating lease. Reference 1: http://www.xbrl.org/2003/role/disclosureRef
-Topic 842
-SubTopic 20
-Name Accounting Standards Codification
-Section 45
-Paragraph 1
-Subparagraph (a)
-Publisher FASB
-URI https://asc.fasb.org/1943274/2147479041/842-20-45-1
| Name: |
us-gaap_OperatingLeaseRightOfUseAsset |
| Namespace Prefix: |
us-gaap_ |
| Data Type: |
xbrli:monetaryItemType |
| Balance Type: |
debit |
| Period Type: |
instant |
|
| X |
- DefinitionIndicates line item in statement of financial position that includes operating lease right-of-use asset. Reference 1: http://www.xbrl.org/2003/role/disclosureRef
-Topic 842
-SubTopic 20
-Name Accounting Standards Codification
-Section 45
-Paragraph 2
-Publisher FASB
-URI https://asc.fasb.org/1943274/2147479041/842-20-45-2
| Name: |
us-gaap_OperatingLeaseRightOfUseAssetStatementOfFinancialPositionExtensibleList |
| Namespace Prefix: |
us-gaap_ |
| Data Type: |
enum2:enumerationSetItemType |
| Balance Type: |
na |
| Period Type: |
instant |
|
v3.24.2
| X |
- References
+ Details
| Name: |
us-gaap_LeasesAbstract |
| Namespace Prefix: |
us-gaap_ |
| Data Type: |
xbrli:stringItemType |
| Balance Type: |
na |
| Period Type: |
duration |
|
| X |
- DefinitionWeighted average discount rate for operating lease calculated at point in time. Reference 1: http://www.xbrl.org/2003/role/exampleRef
-Topic 842
-SubTopic 20
-Name Accounting Standards Codification
-Section 55
-Paragraph 53
-Publisher FASB
-URI https://asc.fasb.org/1943274/2147479589/842-20-55-53
Reference 2: http://www.xbrl.org/2003/role/disclosureRef
-Topic 842
-SubTopic 20
-Name Accounting Standards Codification
-Section 50
-Paragraph 4
-Subparagraph (g)(4)
-Publisher FASB
-URI https://asc.fasb.org/1943274/2147478964/842-20-50-4
| Name: |
us-gaap_OperatingLeaseWeightedAverageDiscountRatePercent |
| Namespace Prefix: |
us-gaap_ |
| Data Type: |
dtr-types:percentItemType |
| Balance Type: |
na |
| Period Type: |
instant |
|
| X |
- DefinitionWeighted average remaining lease term for operating lease, in 'PnYnMnDTnHnMnS' format, for example, 'P1Y5M13D' represents reported fact of one year, five months, and thirteen days. Reference 1: http://www.xbrl.org/2003/role/exampleRef
-Topic 842
-SubTopic 20
-Name Accounting Standards Codification
-Section 55
-Paragraph 53
-Publisher FASB
-URI https://asc.fasb.org/1943274/2147479589/842-20-55-53
Reference 2: http://www.xbrl.org/2003/role/disclosureRef
-Topic 842
-SubTopic 20
-Name Accounting Standards Codification
-Section 50
-Paragraph 4
-Subparagraph (g)(3)
-Publisher FASB
-URI https://asc.fasb.org/1943274/2147478964/842-20-50-4
| Name: |
us-gaap_OperatingLeaseWeightedAverageRemainingLeaseTerm1 |
| Namespace Prefix: |
us-gaap_ |
| Data Type: |
xbrli:durationItemType |
| Balance Type: |
na |
| Period Type: |
instant |
|
v3.24.2
LEASES - Schedule of Maturities of Lease Liabilities (Details)
$ in Thousands |
Jun. 30, 2024
USD ($)
|
| Leases [Abstract] |
|
| Remainder of 2024 |
$ 7,954
|
| 2025 |
18,784
|
| 2026 |
14,384
|
| 2027 |
13,387
|
| 2028 |
12,813
|
| 2029 |
10,099
|
| Thereafter |
21,650
|
| Total lease payments |
99,071
|
| Less: imputed interest |
(13,615)
|
| Total lease liability |
$ 85,456
|
| X |
- References
+ Details
| Name: |
us-gaap_LeasesAbstract |
| Namespace Prefix: |
us-gaap_ |
| Data Type: |
xbrli:stringItemType |
| Balance Type: |
na |
| Period Type: |
duration |
|
| X |
- DefinitionAmount of lessee's undiscounted obligation for lease payment for operating lease. Reference 1: http://www.xbrl.org/2003/role/disclosureRef
-Topic 842
-SubTopic 20
-Name Accounting Standards Codification
-Section 50
-Paragraph 6
-Publisher FASB
-URI https://asc.fasb.org/1943274/2147478964/842-20-50-6
| Name: |
us-gaap_LesseeOperatingLeaseLiabilityPaymentsDue |
| Namespace Prefix: |
us-gaap_ |
| Data Type: |
xbrli:monetaryItemType |
| Balance Type: |
credit |
| Period Type: |
instant |
|
| X |
- DefinitionAmount of lessee's undiscounted obligation for lease payment for operating lease due after fifth fiscal year following current fiscal year. Excludes interim and annual periods when interim periods are reported from current statement of financial position date (rolling approach). Reference 1: http://www.xbrl.org/2003/role/disclosureRef
-Topic 842
-SubTopic 20
-Name Accounting Standards Codification
-Section 50
-Paragraph 6
-Publisher FASB
-URI https://asc.fasb.org/1943274/2147478964/842-20-50-6
| Name: |
us-gaap_LesseeOperatingLeaseLiabilityPaymentsDueAfterYearFive |
| Namespace Prefix: |
us-gaap_ |
| Data Type: |
xbrli:monetaryItemType |
| Balance Type: |
credit |
| Period Type: |
instant |
|
| X |
- DefinitionAmount of lessee's undiscounted obligation for lease payment for operating lease to be paid in next fiscal year following current fiscal year. Excludes interim and annual periods when interim periods are reported from current statement of financial position date (rolling approach). Reference 1: http://www.xbrl.org/2003/role/disclosureRef
-Topic 842
-SubTopic 20
-Name Accounting Standards Codification
-Section 50
-Paragraph 6
-Publisher FASB
-URI https://asc.fasb.org/1943274/2147478964/842-20-50-6
| Name: |
us-gaap_LesseeOperatingLeaseLiabilityPaymentsDueNextTwelveMonths |
| Namespace Prefix: |
us-gaap_ |
| Data Type: |
xbrli:monetaryItemType |
| Balance Type: |
credit |
| Period Type: |
instant |
|
| X |
- DefinitionAmount of lessee's undiscounted obligation for lease payment for operating lease to be paid in fifth fiscal year following current fiscal year. Excludes interim and annual periods when interim periods are reported from current statement of financial position date (rolling approach). Reference 1: http://www.xbrl.org/2003/role/disclosureRef
-Topic 842
-SubTopic 20
-Name Accounting Standards Codification
-Section 50
-Paragraph 6
-Publisher FASB
-URI https://asc.fasb.org/1943274/2147478964/842-20-50-6
| Name: |
us-gaap_LesseeOperatingLeaseLiabilityPaymentsDueYearFive |
| Namespace Prefix: |
us-gaap_ |
| Data Type: |
xbrli:monetaryItemType |
| Balance Type: |
credit |
| Period Type: |
instant |
|
| X |
- DefinitionAmount of lessee's undiscounted obligation for lease payment for operating lease to be paid in fourth fiscal year following current fiscal year. Excludes interim and annual periods when interim periods are reported from current statement of financial position date (rolling approach). Reference 1: http://www.xbrl.org/2003/role/disclosureRef
-Topic 842
-SubTopic 20
-Name Accounting Standards Codification
-Section 50
-Paragraph 6
-Publisher FASB
-URI https://asc.fasb.org/1943274/2147478964/842-20-50-6
| Name: |
us-gaap_LesseeOperatingLeaseLiabilityPaymentsDueYearFour |
| Namespace Prefix: |
us-gaap_ |
| Data Type: |
xbrli:monetaryItemType |
| Balance Type: |
credit |
| Period Type: |
instant |
|
| X |
- DefinitionAmount of lessee's undiscounted obligation for lease payment for operating lease to be paid in third fiscal year following current fiscal year. Excludes interim and annual periods when interim periods are reported from current statement of financial position date (rolling approach). Reference 1: http://www.xbrl.org/2003/role/disclosureRef
-Topic 842
-SubTopic 20
-Name Accounting Standards Codification
-Section 50
-Paragraph 6
-Publisher FASB
-URI https://asc.fasb.org/1943274/2147478964/842-20-50-6
| Name: |
us-gaap_LesseeOperatingLeaseLiabilityPaymentsDueYearThree |
| Namespace Prefix: |
us-gaap_ |
| Data Type: |
xbrli:monetaryItemType |
| Balance Type: |
credit |
| Period Type: |
instant |
|
| X |
- DefinitionAmount of lessee's undiscounted obligation for lease payment for operating lease to be paid in second fiscal year following current fiscal year. Excludes interim and annual periods when interim periods are reported from current statement of financial position date (rolling approach). Reference 1: http://www.xbrl.org/2003/role/disclosureRef
-Topic 842
-SubTopic 20
-Name Accounting Standards Codification
-Section 50
-Paragraph 6
-Publisher FASB
-URI https://asc.fasb.org/1943274/2147478964/842-20-50-6
| Name: |
us-gaap_LesseeOperatingLeaseLiabilityPaymentsDueYearTwo |
| Namespace Prefix: |
us-gaap_ |
| Data Type: |
xbrli:monetaryItemType |
| Balance Type: |
credit |
| Period Type: |
instant |
|
| X |
- DefinitionAmount of lessee's undiscounted obligation for lease payment for operating lease having initial or remaining lease term in excess of one year to be paid in remainder of current fiscal year. Reference 1: http://www.xbrl.org/2009/role/commonPracticeRef
-Topic 842
-SubTopic 20
-Name Accounting Standards Codification
-Section 50
-Paragraph 6
-Publisher FASB
-URI https://asc.fasb.org/1943274/2147478964/842-20-50-6
| Name: |
us-gaap_LesseeOperatingLeaseLiabilityPaymentsRemainderOfFiscalYear |
| Namespace Prefix: |
us-gaap_ |
| Data Type: |
xbrli:monetaryItemType |
| Balance Type: |
credit |
| Period Type: |
instant |
|
| X |
- DefinitionAmount of lessee's undiscounted obligation for lease payments in excess of discounted obligation for lease payments for operating lease. Reference 1: http://www.xbrl.org/2003/role/disclosureRef
-Topic 842
-SubTopic 20
-Name Accounting Standards Codification
-Section 50
-Paragraph 6
-Publisher FASB
-URI https://asc.fasb.org/1943274/2147478964/842-20-50-6
| Name: |
us-gaap_LesseeOperatingLeaseLiabilityUndiscountedExcessAmount |
| Namespace Prefix: |
us-gaap_ |
| Data Type: |
xbrli:monetaryItemType |
| Balance Type: |
credit |
| Period Type: |
instant |
|
| X |
- DefinitionPresent value of lessee's discounted obligation for lease payments from operating lease. Reference 1: http://www.xbrl.org/2003/role/disclosureRef
-Topic 842
-SubTopic 20
-Name Accounting Standards Codification
-Section 45
-Paragraph 1
-Subparagraph (b)
-Publisher FASB
-URI https://asc.fasb.org/1943274/2147479041/842-20-45-1
| Name: |
us-gaap_OperatingLeaseLiability |
| Namespace Prefix: |
us-gaap_ |
| Data Type: |
xbrli:monetaryItemType |
| Balance Type: |
credit |
| Period Type: |
instant |
|
v3.24.2
| X |
- References
+ Details
| Name: |
us-gaap_LeasesAbstract |
| Namespace Prefix: |
us-gaap_ |
| Data Type: |
xbrli:stringItemType |
| Balance Type: |
na |
| Period Type: |
duration |
|
| X |
- DefinitionAmount of cash outflow from operating lease, excluding payments to bring another asset to condition and location necessary for its intended use. Reference 1: http://www.xbrl.org/2003/role/disclosureRef
-Topic 842
-SubTopic 20
-Name Accounting Standards Codification
-Section 45
-Paragraph 5
-Subparagraph (c)
-Publisher FASB
-URI https://asc.fasb.org/1943274/2147479041/842-20-45-5
Reference 2: http://www.xbrl.org/2003/role/disclosureRef
-Topic 842
-SubTopic 20
-Name Accounting Standards Codification
-Section 50
-Paragraph 4
-Subparagraph (g)(1)
-Publisher FASB
-URI https://asc.fasb.org/1943274/2147478964/842-20-50-4
| Name: |
us-gaap_OperatingLeasePayments |
| Namespace Prefix: |
us-gaap_ |
| Data Type: |
xbrli:monetaryItemType |
| Balance Type: |
credit |
| Period Type: |
duration |
|
| X |
- DefinitionAmount of increase in right-of-use asset obtained in exchange for operating lease liability. Reference 1: http://www.xbrl.org/2003/role/exampleRef
-Topic 842
-SubTopic 20
-Name Accounting Standards Codification
-Section 55
-Paragraph 53
-Publisher FASB
-URI https://asc.fasb.org/1943274/2147479589/842-20-55-53
Reference 2: http://www.xbrl.org/2003/role/disclosureRef
-Topic 842
-SubTopic 20
-Name Accounting Standards Codification
-Section 50
-Paragraph 4
-Subparagraph (g)(2)
-Publisher FASB
-URI https://asc.fasb.org/1943274/2147478964/842-20-50-4
| Name: |
us-gaap_RightOfUseAssetObtainedInExchangeForOperatingLeaseLiability |
| Namespace Prefix: |
us-gaap_ |
| Data Type: |
xbrli:monetaryItemType |
| Balance Type: |
debit |
| Period Type: |
duration |
|
v3.24.2
DEBT - Convertible senior notes and capped calls (Details)
|
1 Months Ended |
3 Months Ended |
6 Months Ended |
16 Months Ended |
|
Feb. 29, 2020
USD ($)
day
$ / shares
|
Jun. 30, 2023
USD ($)
|
Jun. 30, 2024
USD ($)
|
Jun. 30, 2023
USD ($)
|
Jun. 30, 2024
day
|
| Debt Instrument [Line Items] |
|
|
|
|
|
| Gain (loss) on repurchase of convertible debt | $ |
|
|
$ 0
|
$ 7,855,000
|
|
| Redemption percentage |
|
|
100.00%
|
|
|
| On or After March 1, 2023 |
|
|
|
|
|
| Debt Instrument [Line Items] |
|
|
|
|
|
| Redemption threshold trading days |
|
|
|
|
40
|
| Redemption percentage |
|
|
|
|
100.00%
|
| Convertible senior notes |
|
|
|
|
|
| Debt Instrument [Line Items] |
|
|
|
|
|
| Face amount | $ |
$ 600,000,000
|
|
|
|
|
| Interest rate |
0.75%
|
|
0.75%
|
0.75%
|
|
| Gain (loss) on repurchase of convertible debt | $ |
|
$ 5,100,000
|
|
$ 7,900,000
|
|
| Principal amount repurchased | $ |
|
$ 64,700,000
|
|
$ 97,700,000
|
|
| Initial conversion rate |
0.0074045
|
|
|
|
|
| Initial conversion price (in dollars per share) | $ / shares |
$ 135.05
|
|
|
|
|
| Average interest rate |
|
|
1.20%
|
1.20%
|
|
| Convertible senior notes | After the Calendar Quarter Ending on June 30, 2020 |
|
|
|
|
|
| Debt Instrument [Line Items] |
|
|
|
|
|
| Threshold percentage of stock price trigger |
130.00%
|
|
|
|
|
| Threshold trading days |
20
|
|
|
|
|
| Threshold consecutive trading days |
30
|
|
|
|
|
| Convertible senior notes | Measurement Period |
|
|
|
|
|
| Debt Instrument [Line Items] |
|
|
|
|
|
| Threshold percentage of stock price trigger |
98.00%
|
|
|
|
|
| Threshold consecutive trading days |
5
|
|
|
|
|
| Threshold consecutive business days |
5
|
|
|
|
|
| Convertible senior notes | On or After March 1, 2023 |
|
|
|
|
|
| Debt Instrument [Line Items] |
|
|
|
|
|
| Threshold percentage of stock price trigger |
|
|
|
|
130.00%
|
| Threshold trading days |
|
|
|
|
20
|
| Threshold consecutive trading days |
|
|
|
|
30
|
| X |
- DefinitionDebt Instrument, Redemption, Threshold Trading Days Before Maturity
| Name: |
pega_DebtInstrumentRedemptionThresholdTradingDaysBeforeMaturity |
| Namespace Prefix: |
pega_ |
| Data Type: |
xbrli:integerItemType |
| Balance Type: |
na |
| Period Type: |
duration |
|
| X |
- DefinitionThe rate of interest that was being paid on the original debt issue that is being converted in the noncash (or part noncash) transaction. "Part noncash" refers to that portion of the transaction not resulting in cash receipts or cash payments in the period. Reference 1: http://fasb.org/us-gaap/role/ref/legacyRef
-Name Accounting Standards Codification
-Topic 230
-SubTopic 10
-Section 50
-Paragraph 3
-Publisher FASB
-URI https://asc.fasb.org/1943274/2147482913/230-10-50-3
Reference 2: http://fasb.org/us-gaap/role/ref/legacyRef
-Name Accounting Standards Codification
-Topic 230
-SubTopic 10
-Section 50
-Paragraph 5
-Publisher FASB
-URI https://asc.fasb.org/1943274/2147482913/230-10-50-5
| Name: |
us-gaap_DebtConversionOriginalDebtInterestRateOfDebt |
| Namespace Prefix: |
us-gaap_ |
| Data Type: |
dtr-types:percentItemType |
| Balance Type: |
na |
| Period Type: |
duration |
|
| X |
- DefinitionThe price per share of the conversion feature embedded in the debt instrument. Reference 1: http://www.xbrl.org/2003/role/disclosureRef
-Topic 470
-SubTopic 20
-Name Accounting Standards Codification
-Section 50
-Paragraph 1B
-Subparagraph (c)
-Publisher FASB
-URI https://asc.fasb.org/1943274/2147481139/470-20-50-1B
Reference 2: http://fasb.org/us-gaap/role/ref/legacyRef
-Topic 470
-SubTopic 20
-Name Accounting Standards Codification
-Section 50
-Paragraph 5
-Subparagraph (b)
-Publisher FASB
-URI https://asc.fasb.org/1943274/2147481139/470-20-50-5
| Name: |
us-gaap_DebtInstrumentConvertibleConversionPrice1 |
| Namespace Prefix: |
us-gaap_ |
| Data Type: |
dtr-types:perShareItemType |
| Balance Type: |
na |
| Period Type: |
instant |
|
| X |
- DefinitionRatio applied to the conversion of debt instrument into equity with equity shares divided by debt principal amount. Reference 1: http://fasb.org/us-gaap/role/ref/legacyRef
-Topic 210
-SubTopic 10
-Name Accounting Standards Codification
-Section S99
-Paragraph 1
-Subparagraph (SX 210.5-02(22)(a)(5))
-Publisher FASB
-URI https://asc.fasb.org/1943274/2147480566/210-10-S99-1
Reference 2: http://www.xbrl.org/2003/role/disclosureRef
-Topic 470
-SubTopic 20
-Name Accounting Standards Codification
-Section 50
-Paragraph 1B
-Subparagraph (c)
-Publisher FASB
-URI https://asc.fasb.org/1943274/2147481139/470-20-50-1B
Reference 3: http://fasb.org/us-gaap/role/ref/legacyRef
-Name Accounting Standards Codification
-Topic 505
-SubTopic 10
-Section 50
-Paragraph 3
-Publisher FASB
-URI https://asc.fasb.org/1943274/2147481112/505-10-50-3
Reference 4: http://fasb.org/us-gaap/role/ref/legacyRef
-Topic 505
-SubTopic 10
-Name Accounting Standards Codification
-Section 50
-Paragraph 7
-Publisher FASB
-URI https://asc.fasb.org/1943274/2147481112/505-10-50-7
Reference 5: http://fasb.org/us-gaap/role/ref/legacyRef
-Topic 505
-SubTopic 10
-Name Accounting Standards Codification
-Section 50
-Paragraph 6
-Subparagraph (b)
-Publisher FASB
-URI https://asc.fasb.org/1943274/2147481112/505-10-50-6
| Name: |
us-gaap_DebtInstrumentConvertibleConversionRatio1 |
| Namespace Prefix: |
us-gaap_ |
| Data Type: |
xbrli:pureItemType |
| Balance Type: |
na |
| Period Type: |
duration |
|
| X |
- DefinitionThreshold period of specified consecutive trading days within which common stock price to conversion price of convertible debt instrument must exceed threshold percentage for specified number of trading days to trigger conversion feature.
| Name: |
us-gaap_DebtInstrumentConvertibleThresholdConsecutiveTradingDays1 |
| Namespace Prefix: |
us-gaap_ |
| Data Type: |
xbrli:integerItemType |
| Balance Type: |
na |
| Period Type: |
duration |
|
| X |
- DefinitionMinimum percentage of common stock price to conversion price of convertible debt instruments to determine eligibility of conversion.
| Name: |
us-gaap_DebtInstrumentConvertibleThresholdPercentageOfStockPriceTrigger |
| Namespace Prefix: |
us-gaap_ |
| Data Type: |
dtr-types:percentItemType |
| Balance Type: |
na |
| Period Type: |
duration |
|
| X |
- DefinitionThreshold number of specified trading days that common stock price to conversion price of convertible debt instruments must exceed threshold percentage within a specified consecutive trading period to trigger conversion feature.
| Name: |
us-gaap_DebtInstrumentConvertibleThresholdTradingDays |
| Namespace Prefix: |
us-gaap_ |
| Data Type: |
xbrli:integerItemType |
| Balance Type: |
na |
| Period Type: |
duration |
|
| X |
- DefinitionFace (par) amount of debt instrument at time of issuance. Reference 1: http://www.xbrl.org/2003/role/exampleRef
-Topic 835
-SubTopic 30
-Name Accounting Standards Codification
-Section 55
-Paragraph 8
-Publisher FASB
-URI https://asc.fasb.org/1943274/2147482949/835-30-55-8
Reference 2: http://www.xbrl.org/2003/role/disclosureRef
-Topic 470
-SubTopic 20
-Name Accounting Standards Codification
-Section 50
-Paragraph 1B
-Subparagraph (a)
-Publisher FASB
-URI https://asc.fasb.org/1943274/2147481139/470-20-50-1B
Reference 3: http://www.xbrl.org/2003/role/exampleRef
-Topic 470
-SubTopic 20
-Name Accounting Standards Codification
-Section 55
-Paragraph 69B
-Publisher FASB
-URI https://asc.fasb.org/1943274/2147481568/470-20-55-69B
Reference 4: http://www.xbrl.org/2003/role/exampleRef
-Topic 470
-SubTopic 20
-Name Accounting Standards Codification
-Section 55
-Paragraph 69C
-Publisher FASB
-URI https://asc.fasb.org/1943274/2147481568/470-20-55-69C
Reference 5: http://www.xbrl.org/2003/role/disclosureRef
-Topic 835
-SubTopic 30
-Name Accounting Standards Codification
-Section 50
-Paragraph 1
-Publisher FASB
-URI https://asc.fasb.org/1943274/2147482900/835-30-50-1
Reference 6: http://www.xbrl.org/2003/role/disclosureRef
-Topic 835
-SubTopic 30
-Name Accounting Standards Codification
-Section 45
-Paragraph 2
-Publisher FASB
-URI https://asc.fasb.org/1943274/2147482925/835-30-45-2
| Name: |
us-gaap_DebtInstrumentFaceAmount |
| Namespace Prefix: |
us-gaap_ |
| Data Type: |
xbrli:monetaryItemType |
| Balance Type: |
credit |
| Period Type: |
instant |
|
| X |
- DefinitionThe average effective interest rate during the reporting period. Reference 1: http://fasb.org/us-gaap/role/ref/legacyRef
-Topic 210
-SubTopic 10
-Name Accounting Standards Codification
-Section S99
-Paragraph 1
-Subparagraph (SX 210.5-02(22)(a)(1))
-Publisher FASB
-URI https://asc.fasb.org/1943274/2147480566/210-10-S99-1
Reference 2: http://www.xbrl.org/2003/role/disclosureRef
-Topic 470
-SubTopic 20
-Name Accounting Standards Codification
-Section 50
-Paragraph 1F
-Subparagraph (a)
-Publisher FASB
-URI https://asc.fasb.org/1943274/2147481139/470-20-50-1F
Reference 3: http://www.xbrl.org/2009/role/commonPracticeRef
-Topic 835
-SubTopic 30
-Name Accounting Standards Codification
-Section 45
-Paragraph 2
-Publisher FASB
-URI https://asc.fasb.org/1943274/2147482925/835-30-45-2
| Name: |
us-gaap_DebtInstrumentInterestRateDuringPeriod |
| Namespace Prefix: |
us-gaap_ |
| Data Type: |
dtr-types:percentItemType |
| Balance Type: |
na |
| Period Type: |
duration |
|
| X |
- DefinitionLine items represent financial concepts included in a table. These concepts are used to disclose reportable information associated with domain members defined in one or many axes to the table. Reference 1: http://www.xbrl.org/2003/role/exampleRef
-Topic 835
-SubTopic 30
-Name Accounting Standards Codification
-Section 55
-Paragraph 8
-Publisher FASB
-URI https://asc.fasb.org/1943274/2147482949/835-30-55-8
Reference 2: http://www.xbrl.org/2009/role/commonPracticeRef
-Topic 235
-SubTopic 10
-Name Accounting Standards Codification
-Section S99
-Paragraph 1
-Subparagraph (SX 210.4-08(f))
-Publisher FASB
-URI https://asc.fasb.org/1943274/2147480678/235-10-S99-1
Reference 3: http://www.xbrl.org/2003/role/disclosureRef
-Topic 235
-SubTopic 10
-Name Accounting Standards Codification
-Section S99
-Paragraph 3
-Subparagraph (SX 210.12-04(a))
-Publisher FASB
-URI https://asc.fasb.org/1943274/2147480678/235-10-S99-3
Reference 4: http://www.xbrl.org/2003/role/disclosureRef
-Topic 470
-SubTopic 20
-Name Accounting Standards Codification
-Section 50
-Paragraph 1B
-Subparagraph (a)
-Publisher FASB
-URI https://asc.fasb.org/1943274/2147481139/470-20-50-1B
Reference 5: http://www.xbrl.org/2003/role/exampleRef
-Topic 470
-SubTopic 20
-Name Accounting Standards Codification
-Section 55
-Paragraph 69B
-Publisher FASB
-URI https://asc.fasb.org/1943274/2147481568/470-20-55-69B
Reference 6: http://www.xbrl.org/2003/role/exampleRef
-Topic 470
-SubTopic 20
-Name Accounting Standards Codification
-Section 55
-Paragraph 69C
-Publisher FASB
-URI https://asc.fasb.org/1943274/2147481568/470-20-55-69C
Reference 7: http://www.xbrl.org/2003/role/exampleRef
-Topic 470
-SubTopic 20
-Name Accounting Standards Codification
-Section 55
-Paragraph 69E
-Publisher FASB
-URI https://asc.fasb.org/1943274/2147481568/470-20-55-69E
Reference 8: http://www.xbrl.org/2003/role/exampleRef
-Topic 470
-SubTopic 20
-Name Accounting Standards Codification
-Section 55
-Paragraph 69F
-Publisher FASB
-URI https://asc.fasb.org/1943274/2147481568/470-20-55-69F
Reference 9: http://www.xbrl.org/2003/role/disclosureRef
-Topic 470
-SubTopic 20
-Name Accounting Standards Codification
-Section 50
-Paragraph 1B
-Subparagraph (b)
-Publisher FASB
-URI https://asc.fasb.org/1943274/2147481139/470-20-50-1B
Reference 10: http://www.xbrl.org/2003/role/disclosureRef
-Topic 470
-SubTopic 20
-Name Accounting Standards Codification
-Section 50
-Paragraph 1B
-Subparagraph (c)
-Publisher FASB
-URI https://asc.fasb.org/1943274/2147481139/470-20-50-1B
Reference 11: http://www.xbrl.org/2003/role/exampleRef
-Topic 470
-SubTopic 20
-Name Accounting Standards Codification
-Section 50
-Paragraph 1B
-Subparagraph (d)
-Publisher FASB
-URI https://asc.fasb.org/1943274/2147481139/470-20-50-1B
Reference 12: http://www.xbrl.org/2003/role/disclosureRef
-Topic 470
-SubTopic 20
-Name Accounting Standards Codification
-Section 50
-Paragraph 1B
-Subparagraph (e)
-Publisher FASB
-URI https://asc.fasb.org/1943274/2147481139/470-20-50-1B
Reference 13: http://www.xbrl.org/2003/role/disclosureRef
-Topic 470
-SubTopic 20
-Name Accounting Standards Codification
-Section 50
-Paragraph 1B
-Subparagraph (f)
-Publisher FASB
-URI https://asc.fasb.org/1943274/2147481139/470-20-50-1B
Reference 14: http://www.xbrl.org/2003/role/disclosureRef
-Topic 470
-SubTopic 20
-Name Accounting Standards Codification
-Section 50
-Paragraph 1B
-Subparagraph (h)
-Publisher FASB
-URI https://asc.fasb.org/1943274/2147481139/470-20-50-1B
Reference 15: http://www.xbrl.org/2003/role/disclosureRef
-Topic 470
-SubTopic 20
-Name Accounting Standards Codification
-Section 50
-Paragraph 1D
-Subparagraph (a)
-Publisher FASB
-URI https://asc.fasb.org/1943274/2147481139/470-20-50-1D
Reference 16: http://www.xbrl.org/2003/role/disclosureRef
-Topic 470
-SubTopic 20
-Name Accounting Standards Codification
-Section 50
-Paragraph 1D
-Subparagraph (b)
-Publisher FASB
-URI https://asc.fasb.org/1943274/2147481139/470-20-50-1D
Reference 17: http://www.xbrl.org/2003/role/disclosureRef
-Topic 470
-SubTopic 20
-Name Accounting Standards Codification
-Section 50
-Paragraph 1D
-Subparagraph (c)
-Publisher FASB
-URI https://asc.fasb.org/1943274/2147481139/470-20-50-1D
Reference 18: http://www.xbrl.org/2003/role/disclosureRef
-Topic 470
-SubTopic 20
-Name Accounting Standards Codification
-Section 50
-Paragraph 1E
-Subparagraph (a)
-Publisher FASB
-URI https://asc.fasb.org/1943274/2147481139/470-20-50-1E
Reference 19: http://www.xbrl.org/2003/role/disclosureRef
-Topic 470
-SubTopic 20
-Name Accounting Standards Codification
-Section 50
-Paragraph 1E
-Subparagraph (c)
-Publisher FASB
-URI https://asc.fasb.org/1943274/2147481139/470-20-50-1E
Reference 20: http://www.xbrl.org/2003/role/disclosureRef
-Topic 470
-SubTopic 20
-Name Accounting Standards Codification
-Section 50
-Paragraph 1E
-Subparagraph (d)
-Publisher FASB
-URI https://asc.fasb.org/1943274/2147481139/470-20-50-1E
Reference 21: http://www.xbrl.org/2003/role/disclosureRef
-Topic 470
-SubTopic 20
-Name Accounting Standards Codification
-Section 50
-Paragraph 1F
-Subparagraph (a)
-Publisher FASB
-URI https://asc.fasb.org/1943274/2147481139/470-20-50-1F
Reference 22: http://www.xbrl.org/2003/role/disclosureRef
-Topic 470
-SubTopic 20
-Name Accounting Standards Codification
-Section 50
-Paragraph 1F
-Subparagraph (b)
-Publisher FASB
-URI https://asc.fasb.org/1943274/2147481139/470-20-50-1F
Reference 23: http://www.xbrl.org/2003/role/disclosureRef
-Topic 470
-SubTopic 20
-Name Accounting Standards Codification
-Section 50
-Paragraph 1F
-Subparagraph (b)(1)
-Publisher FASB
-URI https://asc.fasb.org/1943274/2147481139/470-20-50-1F
Reference 24: http://www.xbrl.org/2003/role/disclosureRef
-Topic 470
-SubTopic 20
-Name Accounting Standards Codification
-Section 50
-Paragraph 1F
-Subparagraph (b)(2)
-Publisher FASB
-URI https://asc.fasb.org/1943274/2147481139/470-20-50-1F
Reference 25: http://www.xbrl.org/2003/role/disclosureRef
-Topic 470
-SubTopic 20
-Name Accounting Standards Codification
-Section 50
-Paragraph 1I
-Subparagraph (c)
-Publisher FASB
-URI https://asc.fasb.org/1943274/2147481139/470-20-50-1I
Reference 26: http://www.xbrl.org/2009/role/commonPracticeRef
-Topic 835
-SubTopic 30
-Name Accounting Standards Codification
-Section 45
-Paragraph 2
-Publisher FASB
-URI https://asc.fasb.org/1943274/2147482925/835-30-45-2
Reference 27: http://www.xbrl.org/2009/role/commonPracticeRef
-Topic 835
-SubTopic 30
-Name Accounting Standards Codification
-Section 50
-Paragraph 1
-Publisher FASB
-URI https://asc.fasb.org/1943274/2147482900/835-30-50-1
| Name: |
us-gaap_DebtInstrumentLineItems |
| Namespace Prefix: |
us-gaap_ |
| Data Type: |
xbrli:stringItemType |
| Balance Type: |
na |
| Period Type: |
duration |
|
| X |
- DefinitionPercentage price of original principal amount of debt at which debt can be redeemed by the issuer. Reference 1: http://fasb.org/us-gaap/role/ref/legacyRef
-Topic 942
-SubTopic 470
-Name Accounting Standards Codification
-Section 50
-Paragraph 3
-Subparagraph (e)
-Publisher FASB
-URI https://asc.fasb.org/1943274/2147477734/942-470-50-3
| Name: |
us-gaap_DebtInstrumentRedemptionPricePercentage |
| Namespace Prefix: |
us-gaap_ |
| Data Type: |
dtr-types:percentItemType |
| Balance Type: |
na |
| Period Type: |
duration |
|
| X |
- DefinitionGross amount of debt extinguished.
| Name: |
us-gaap_ExtinguishmentOfDebtAmount |
| Namespace Prefix: |
us-gaap_ |
| Data Type: |
xbrli:monetaryItemType |
| Balance Type: |
debit |
| Period Type: |
duration |
|
| X |
- DefinitionDifference between the fair value of payments made and the carrying amount of debt which is extinguished prior to maturity. Reference 1: http://fasb.org/us-gaap/role/ref/legacyRef
-Name Accounting Standards Codification
-Section 45
-Paragraph 28
-Subparagraph (b)
-SubTopic 10
-Topic 230
-Publisher FASB
-URI https://asc.fasb.org/1943274/2147482740/230-10-45-28
Reference 2: http://fasb.org/us-gaap/role/ref/legacyRef
-Name Accounting Standards Codification
-Topic 470
-SubTopic 50
-Section 40
-Paragraph 2
-Publisher FASB
-URI https://asc.fasb.org/1943274/2147481303/470-50-40-2
Reference 3: http://fasb.org/us-gaap/role/ref/legacyRef
-Name Accounting Standards Codification
-Topic 470
-SubTopic 50
-Section 40
-Paragraph 4
-Publisher FASB
-URI https://asc.fasb.org/1943274/2147481303/470-50-40-4
| Name: |
us-gaap_GainsLossesOnExtinguishmentOfDebt |
| Namespace Prefix: |
us-gaap_ |
| Data Type: |
xbrli:monetaryItemType |
| Balance Type: |
credit |
| Period Type: |
duration |
|
| X |
- Details
| Name: |
us-gaap_DebtInstrumentRedemptionPeriodAxis=us-gaap_DebtInstrumentRedemptionPeriodThreeMember |
| Namespace Prefix: |
|
| Data Type: |
na |
| Balance Type: |
|
| Period Type: |
|
|
| X |
- Details
| Name: |
us-gaap_LongtermDebtTypeAxis=us-gaap_ConvertibleDebtMember |
| Namespace Prefix: |
|
| Data Type: |
na |
| Balance Type: |
|
| Period Type: |
|
|
| X |
- Details
| Name: |
us-gaap_DebtInstrumentRedemptionPeriodAxis=us-gaap_DebtInstrumentRedemptionPeriodOneMember |
| Namespace Prefix: |
|
| Data Type: |
na |
| Balance Type: |
|
| Period Type: |
|
|
| X |
- Details
| Name: |
us-gaap_DebtInstrumentRedemptionPeriodAxis=us-gaap_DebtInstrumentRedemptionPeriodTwoMember |
| Namespace Prefix: |
|
| Data Type: |
na |
| Balance Type: |
|
| Period Type: |
|
|
v3.24.2
| X |
- DefinitionAmount, before unamortized (discount) premium and debt issuance costs, of long-term debt. Includes, but is not limited to, notes payable, bonds payable, commercial loans, mortgage loans, convertible debt, subordinated debt and other types of debt. Reference 1: http://fasb.org/us-gaap/role/ref/legacyRef
-Name Accounting Standards Codification
-Section S99
-Paragraph 1
-Subparagraph (SX 210.5-02(22))
-SubTopic 10
-Topic 210
-Publisher FASB
-URI https://asc.fasb.org/1943274/2147480566/210-10-S99-1
Reference 2: http://fasb.org/us-gaap/role/ref/legacyRef
-Topic 942
-SubTopic 210
-Name Accounting Standards Codification
-Section S99
-Paragraph 1
-Subparagraph (SX 210.9-03(16))
-Publisher FASB
-URI https://asc.fasb.org/1943274/2147478546/942-210-S99-1
Reference 3: http://www.xbrl.org/2003/role/disclosureRef
-Topic 470
-SubTopic 20
-Name Accounting Standards Codification
-Section 50
-Paragraph 4
-Subparagraph (b)(1)
-Publisher FASB
-URI https://asc.fasb.org/1943274/2147481139/470-20-50-4
| Name: |
us-gaap_DebtInstrumentCarryingAmount |
| Namespace Prefix: |
us-gaap_ |
| Data Type: |
xbrli:monetaryItemType |
| Balance Type: |
credit |
| Period Type: |
instant |
|
| X |
- DefinitionLine items represent financial concepts included in a table. These concepts are used to disclose reportable information associated with domain members defined in one or many axes to the table. Reference 1: http://www.xbrl.org/2003/role/exampleRef
-Topic 835
-SubTopic 30
-Name Accounting Standards Codification
-Section 55
-Paragraph 8
-Publisher FASB
-URI https://asc.fasb.org/1943274/2147482949/835-30-55-8
Reference 2: http://www.xbrl.org/2009/role/commonPracticeRef
-Topic 235
-SubTopic 10
-Name Accounting Standards Codification
-Section S99
-Paragraph 1
-Subparagraph (SX 210.4-08(f))
-Publisher FASB
-URI https://asc.fasb.org/1943274/2147480678/235-10-S99-1
Reference 3: http://www.xbrl.org/2003/role/disclosureRef
-Topic 235
-SubTopic 10
-Name Accounting Standards Codification
-Section S99
-Paragraph 3
-Subparagraph (SX 210.12-04(a))
-Publisher FASB
-URI https://asc.fasb.org/1943274/2147480678/235-10-S99-3
Reference 4: http://www.xbrl.org/2003/role/disclosureRef
-Topic 470
-SubTopic 20
-Name Accounting Standards Codification
-Section 50
-Paragraph 1B
-Subparagraph (a)
-Publisher FASB
-URI https://asc.fasb.org/1943274/2147481139/470-20-50-1B
Reference 5: http://www.xbrl.org/2003/role/exampleRef
-Topic 470
-SubTopic 20
-Name Accounting Standards Codification
-Section 55
-Paragraph 69B
-Publisher FASB
-URI https://asc.fasb.org/1943274/2147481568/470-20-55-69B
Reference 6: http://www.xbrl.org/2003/role/exampleRef
-Topic 470
-SubTopic 20
-Name Accounting Standards Codification
-Section 55
-Paragraph 69C
-Publisher FASB
-URI https://asc.fasb.org/1943274/2147481568/470-20-55-69C
Reference 7: http://www.xbrl.org/2003/role/exampleRef
-Topic 470
-SubTopic 20
-Name Accounting Standards Codification
-Section 55
-Paragraph 69E
-Publisher FASB
-URI https://asc.fasb.org/1943274/2147481568/470-20-55-69E
Reference 8: http://www.xbrl.org/2003/role/exampleRef
-Topic 470
-SubTopic 20
-Name Accounting Standards Codification
-Section 55
-Paragraph 69F
-Publisher FASB
-URI https://asc.fasb.org/1943274/2147481568/470-20-55-69F
Reference 9: http://www.xbrl.org/2003/role/disclosureRef
-Topic 470
-SubTopic 20
-Name Accounting Standards Codification
-Section 50
-Paragraph 1B
-Subparagraph (b)
-Publisher FASB
-URI https://asc.fasb.org/1943274/2147481139/470-20-50-1B
Reference 10: http://www.xbrl.org/2003/role/disclosureRef
-Topic 470
-SubTopic 20
-Name Accounting Standards Codification
-Section 50
-Paragraph 1B
-Subparagraph (c)
-Publisher FASB
-URI https://asc.fasb.org/1943274/2147481139/470-20-50-1B
Reference 11: http://www.xbrl.org/2003/role/exampleRef
-Topic 470
-SubTopic 20
-Name Accounting Standards Codification
-Section 50
-Paragraph 1B
-Subparagraph (d)
-Publisher FASB
-URI https://asc.fasb.org/1943274/2147481139/470-20-50-1B
Reference 12: http://www.xbrl.org/2003/role/disclosureRef
-Topic 470
-SubTopic 20
-Name Accounting Standards Codification
-Section 50
-Paragraph 1B
-Subparagraph (e)
-Publisher FASB
-URI https://asc.fasb.org/1943274/2147481139/470-20-50-1B
Reference 13: http://www.xbrl.org/2003/role/disclosureRef
-Topic 470
-SubTopic 20
-Name Accounting Standards Codification
-Section 50
-Paragraph 1B
-Subparagraph (f)
-Publisher FASB
-URI https://asc.fasb.org/1943274/2147481139/470-20-50-1B
Reference 14: http://www.xbrl.org/2003/role/disclosureRef
-Topic 470
-SubTopic 20
-Name Accounting Standards Codification
-Section 50
-Paragraph 1B
-Subparagraph (h)
-Publisher FASB
-URI https://asc.fasb.org/1943274/2147481139/470-20-50-1B
Reference 15: http://www.xbrl.org/2003/role/disclosureRef
-Topic 470
-SubTopic 20
-Name Accounting Standards Codification
-Section 50
-Paragraph 1D
-Subparagraph (a)
-Publisher FASB
-URI https://asc.fasb.org/1943274/2147481139/470-20-50-1D
Reference 16: http://www.xbrl.org/2003/role/disclosureRef
-Topic 470
-SubTopic 20
-Name Accounting Standards Codification
-Section 50
-Paragraph 1D
-Subparagraph (b)
-Publisher FASB
-URI https://asc.fasb.org/1943274/2147481139/470-20-50-1D
Reference 17: http://www.xbrl.org/2003/role/disclosureRef
-Topic 470
-SubTopic 20
-Name Accounting Standards Codification
-Section 50
-Paragraph 1D
-Subparagraph (c)
-Publisher FASB
-URI https://asc.fasb.org/1943274/2147481139/470-20-50-1D
Reference 18: http://www.xbrl.org/2003/role/disclosureRef
-Topic 470
-SubTopic 20
-Name Accounting Standards Codification
-Section 50
-Paragraph 1E
-Subparagraph (a)
-Publisher FASB
-URI https://asc.fasb.org/1943274/2147481139/470-20-50-1E
Reference 19: http://www.xbrl.org/2003/role/disclosureRef
-Topic 470
-SubTopic 20
-Name Accounting Standards Codification
-Section 50
-Paragraph 1E
-Subparagraph (c)
-Publisher FASB
-URI https://asc.fasb.org/1943274/2147481139/470-20-50-1E
Reference 20: http://www.xbrl.org/2003/role/disclosureRef
-Topic 470
-SubTopic 20
-Name Accounting Standards Codification
-Section 50
-Paragraph 1E
-Subparagraph (d)
-Publisher FASB
-URI https://asc.fasb.org/1943274/2147481139/470-20-50-1E
Reference 21: http://www.xbrl.org/2003/role/disclosureRef
-Topic 470
-SubTopic 20
-Name Accounting Standards Codification
-Section 50
-Paragraph 1F
-Subparagraph (a)
-Publisher FASB
-URI https://asc.fasb.org/1943274/2147481139/470-20-50-1F
Reference 22: http://www.xbrl.org/2003/role/disclosureRef
-Topic 470
-SubTopic 20
-Name Accounting Standards Codification
-Section 50
-Paragraph 1F
-Subparagraph (b)
-Publisher FASB
-URI https://asc.fasb.org/1943274/2147481139/470-20-50-1F
Reference 23: http://www.xbrl.org/2003/role/disclosureRef
-Topic 470
-SubTopic 20
-Name Accounting Standards Codification
-Section 50
-Paragraph 1F
-Subparagraph (b)(1)
-Publisher FASB
-URI https://asc.fasb.org/1943274/2147481139/470-20-50-1F
Reference 24: http://www.xbrl.org/2003/role/disclosureRef
-Topic 470
-SubTopic 20
-Name Accounting Standards Codification
-Section 50
-Paragraph 1F
-Subparagraph (b)(2)
-Publisher FASB
-URI https://asc.fasb.org/1943274/2147481139/470-20-50-1F
Reference 25: http://www.xbrl.org/2003/role/disclosureRef
-Topic 470
-SubTopic 20
-Name Accounting Standards Codification
-Section 50
-Paragraph 1I
-Subparagraph (c)
-Publisher FASB
-URI https://asc.fasb.org/1943274/2147481139/470-20-50-1I
Reference 26: http://www.xbrl.org/2009/role/commonPracticeRef
-Topic 835
-SubTopic 30
-Name Accounting Standards Codification
-Section 45
-Paragraph 2
-Publisher FASB
-URI https://asc.fasb.org/1943274/2147482925/835-30-45-2
Reference 27: http://www.xbrl.org/2009/role/commonPracticeRef
-Topic 835
-SubTopic 30
-Name Accounting Standards Codification
-Section 50
-Paragraph 1
-Publisher FASB
-URI https://asc.fasb.org/1943274/2147482900/835-30-50-1
| Name: |
us-gaap_DebtInstrumentLineItems |
| Namespace Prefix: |
us-gaap_ |
| Data Type: |
xbrli:stringItemType |
| Balance Type: |
na |
| Period Type: |
duration |
|
| X |
- DefinitionAmount, before accumulated amortization, of debt issuance costs. Includes, but is not limited to, legal, accounting, underwriting, printing, and registration costs. Reference 1: http://www.xbrl.org/2009/role/commonPracticeRef
-Topic 835
-SubTopic 30
-Name Accounting Standards Codification
-Section 45
-Paragraph 2
-Publisher FASB
-URI https://asc.fasb.org/1943274/2147482925/835-30-45-2
Reference 2: http://www.xbrl.org/2009/role/commonPracticeRef
-Topic 835
-SubTopic 30
-Name Accounting Standards Codification
-Section 50
-Paragraph 1
-Publisher FASB
-URI https://asc.fasb.org/1943274/2147482900/835-30-50-1
| Name: |
us-gaap_DeferredFinanceCostsGross |
| Namespace Prefix: |
us-gaap_ |
| Data Type: |
xbrli:monetaryItemType |
| Balance Type: |
debit |
| Period Type: |
instant |
|
| X |
- DefinitionAmount, after deduction of unamortized premium (discount) and debt issuance cost, of long-term debt. Excludes lease obligation. Reference 1: http://fasb.org/us-gaap/role/ref/legacyRef
-Name Accounting Standards Codification
-Section S99
-Paragraph 1
-Subparagraph (SX 210.5-02(22))
-SubTopic 10
-Topic 210
-Publisher FASB
-URI https://asc.fasb.org/1943274/2147480566/210-10-S99-1
Reference 2: http://www.xbrl.org/2003/role/exampleRef
-Topic 835
-SubTopic 30
-Name Accounting Standards Codification
-Section 55
-Paragraph 8
-Publisher FASB
-URI https://asc.fasb.org/1943274/2147482949/835-30-55-8
Reference 3: http://fasb.org/us-gaap/role/ref/legacyRef
-Topic 942
-SubTopic 210
-Name Accounting Standards Codification
-Section S99
-Paragraph 1
-Subparagraph (SX 210.9-03(16))
-Publisher FASB
-URI https://asc.fasb.org/1943274/2147478546/942-210-S99-1
Reference 4: http://www.xbrl.org/2003/role/exampleRef
-Topic 470
-SubTopic 20
-Name Accounting Standards Codification
-Section 55
-Paragraph 69B
-Publisher FASB
-URI https://asc.fasb.org/1943274/2147481568/470-20-55-69B
Reference 5: http://www.xbrl.org/2003/role/exampleRef
-Topic 470
-SubTopic 20
-Name Accounting Standards Codification
-Section 55
-Paragraph 69C
-Publisher FASB
-URI https://asc.fasb.org/1943274/2147481568/470-20-55-69C
Reference 6: http://www.xbrl.org/2003/role/disclosureRef
-Topic 470
-SubTopic 20
-Name Accounting Standards Codification
-Section 50
-Paragraph 1D
-Subparagraph (b)
-Publisher FASB
-URI https://asc.fasb.org/1943274/2147481139/470-20-50-1D
Reference 7: http://www.xbrl.org/2009/role/commonPracticeRef
-Topic 944
-SubTopic 210
-Name Accounting Standards Codification
-Section S99
-Paragraph 1
-Subparagraph (SX 210.7-03(a)(16)(a)(2))
-Publisher FASB
-URI https://asc.fasb.org/1943274/2147478777/944-210-S99-1
Reference 8: http://www.xbrl.org/2003/role/disclosureRef
-Topic 470
-SubTopic 20
-Name Accounting Standards Codification
-Section 50
-Paragraph 4
-Subparagraph (b)(3)
-Publisher FASB
-URI https://asc.fasb.org/1943274/2147481139/470-20-50-4
| Name: |
us-gaap_LongTermDebt |
| Namespace Prefix: |
us-gaap_ |
| Data Type: |
xbrli:monetaryItemType |
| Balance Type: |
credit |
| Period Type: |
instant |
|
| X |
- Details
| Name: |
us-gaap_LongtermDebtTypeAxis=us-gaap_ConvertibleDebtMember |
| Namespace Prefix: |
|
| Data Type: |
na |
| Balance Type: |
|
| Period Type: |
|
|
v3.24.2
DEBT - Schedule of Interest Expense Related to the Notes (Details) - Convertible senior notes - USD ($)
$ in Thousands |
1 Months Ended |
3 Months Ended |
6 Months Ended |
Feb. 29, 2020 |
Jun. 30, 2024 |
Jun. 30, 2023 |
Jun. 30, 2024 |
Jun. 30, 2023 |
| Debt Instrument [Line Items] |
|
|
|
|
|
| Interest rate |
0.75%
|
|
|
0.75%
|
0.75%
|
| Contractual interest expense (0.75% coupon) |
|
$ 942
|
$ 997
|
$ 1,884
|
$ 2,122
|
| Amortization of issuance costs |
|
619
|
647
|
1,236
|
1,375
|
| Interest expense |
|
$ 1,561
|
$ 1,644
|
$ 3,120
|
$ 3,497
|
| X |
- DefinitionAmount of amortization expense attributable to debt issuance costs. Reference 1: http://fasb.org/us-gaap/role/ref/legacyRef
-Topic 220
-SubTopic 10
-Name Accounting Standards Codification
-Section S99
-Paragraph 2
-Subparagraph (SX 210.5-03(8))
-Publisher FASB
-URI https://asc.fasb.org/1943274/2147483621/220-10-S99-2
Reference 2: http://www.xbrl.org/2003/role/disclosureRef
-Topic 470
-SubTopic 20
-Name Accounting Standards Codification
-Section 50
-Paragraph 1F
-Subparagraph (b)(2)
-Publisher FASB
-URI https://asc.fasb.org/1943274/2147481139/470-20-50-1F
Reference 3: http://www.xbrl.org/2009/role/commonPracticeRef
-Topic 230
-SubTopic 10
-Name Accounting Standards Codification
-Section 45
-Paragraph 28
-Subparagraph (b)
-Publisher FASB
-URI https://asc.fasb.org/1943274/2147482740/230-10-45-28
Reference 4: http://www.xbrl.org/2009/role/commonPracticeRef
-Topic 835
-SubTopic 30
-Name Accounting Standards Codification
-Section 45
-Paragraph 3
-Publisher FASB
-URI https://asc.fasb.org/1943274/2147482925/835-30-45-3
| Name: |
us-gaap_AmortizationOfFinancingCosts |
| Namespace Prefix: |
us-gaap_ |
| Data Type: |
xbrli:monetaryItemType |
| Balance Type: |
debit |
| Period Type: |
duration |
|
| X |
- DefinitionThe rate of interest that was being paid on the original debt issue that is being converted in the noncash (or part noncash) transaction. "Part noncash" refers to that portion of the transaction not resulting in cash receipts or cash payments in the period. Reference 1: http://fasb.org/us-gaap/role/ref/legacyRef
-Name Accounting Standards Codification
-Topic 230
-SubTopic 10
-Section 50
-Paragraph 3
-Publisher FASB
-URI https://asc.fasb.org/1943274/2147482913/230-10-50-3
Reference 2: http://fasb.org/us-gaap/role/ref/legacyRef
-Name Accounting Standards Codification
-Topic 230
-SubTopic 10
-Section 50
-Paragraph 5
-Publisher FASB
-URI https://asc.fasb.org/1943274/2147482913/230-10-50-5
| Name: |
us-gaap_DebtConversionOriginalDebtInterestRateOfDebt |
| Namespace Prefix: |
us-gaap_ |
| Data Type: |
dtr-types:percentItemType |
| Balance Type: |
na |
| Period Type: |
duration |
|
| X |
- DefinitionLine items represent financial concepts included in a table. These concepts are used to disclose reportable information associated with domain members defined in one or many axes to the table. Reference 1: http://www.xbrl.org/2003/role/exampleRef
-Topic 835
-SubTopic 30
-Name Accounting Standards Codification
-Section 55
-Paragraph 8
-Publisher FASB
-URI https://asc.fasb.org/1943274/2147482949/835-30-55-8
Reference 2: http://www.xbrl.org/2009/role/commonPracticeRef
-Topic 235
-SubTopic 10
-Name Accounting Standards Codification
-Section S99
-Paragraph 1
-Subparagraph (SX 210.4-08(f))
-Publisher FASB
-URI https://asc.fasb.org/1943274/2147480678/235-10-S99-1
Reference 3: http://www.xbrl.org/2003/role/disclosureRef
-Topic 235
-SubTopic 10
-Name Accounting Standards Codification
-Section S99
-Paragraph 3
-Subparagraph (SX 210.12-04(a))
-Publisher FASB
-URI https://asc.fasb.org/1943274/2147480678/235-10-S99-3
Reference 4: http://www.xbrl.org/2003/role/disclosureRef
-Topic 470
-SubTopic 20
-Name Accounting Standards Codification
-Section 50
-Paragraph 1B
-Subparagraph (a)
-Publisher FASB
-URI https://asc.fasb.org/1943274/2147481139/470-20-50-1B
Reference 5: http://www.xbrl.org/2003/role/exampleRef
-Topic 470
-SubTopic 20
-Name Accounting Standards Codification
-Section 55
-Paragraph 69B
-Publisher FASB
-URI https://asc.fasb.org/1943274/2147481568/470-20-55-69B
Reference 6: http://www.xbrl.org/2003/role/exampleRef
-Topic 470
-SubTopic 20
-Name Accounting Standards Codification
-Section 55
-Paragraph 69C
-Publisher FASB
-URI https://asc.fasb.org/1943274/2147481568/470-20-55-69C
Reference 7: http://www.xbrl.org/2003/role/exampleRef
-Topic 470
-SubTopic 20
-Name Accounting Standards Codification
-Section 55
-Paragraph 69E
-Publisher FASB
-URI https://asc.fasb.org/1943274/2147481568/470-20-55-69E
Reference 8: http://www.xbrl.org/2003/role/exampleRef
-Topic 470
-SubTopic 20
-Name Accounting Standards Codification
-Section 55
-Paragraph 69F
-Publisher FASB
-URI https://asc.fasb.org/1943274/2147481568/470-20-55-69F
Reference 9: http://www.xbrl.org/2003/role/disclosureRef
-Topic 470
-SubTopic 20
-Name Accounting Standards Codification
-Section 50
-Paragraph 1B
-Subparagraph (b)
-Publisher FASB
-URI https://asc.fasb.org/1943274/2147481139/470-20-50-1B
Reference 10: http://www.xbrl.org/2003/role/disclosureRef
-Topic 470
-SubTopic 20
-Name Accounting Standards Codification
-Section 50
-Paragraph 1B
-Subparagraph (c)
-Publisher FASB
-URI https://asc.fasb.org/1943274/2147481139/470-20-50-1B
Reference 11: http://www.xbrl.org/2003/role/exampleRef
-Topic 470
-SubTopic 20
-Name Accounting Standards Codification
-Section 50
-Paragraph 1B
-Subparagraph (d)
-Publisher FASB
-URI https://asc.fasb.org/1943274/2147481139/470-20-50-1B
Reference 12: http://www.xbrl.org/2003/role/disclosureRef
-Topic 470
-SubTopic 20
-Name Accounting Standards Codification
-Section 50
-Paragraph 1B
-Subparagraph (e)
-Publisher FASB
-URI https://asc.fasb.org/1943274/2147481139/470-20-50-1B
Reference 13: http://www.xbrl.org/2003/role/disclosureRef
-Topic 470
-SubTopic 20
-Name Accounting Standards Codification
-Section 50
-Paragraph 1B
-Subparagraph (f)
-Publisher FASB
-URI https://asc.fasb.org/1943274/2147481139/470-20-50-1B
Reference 14: http://www.xbrl.org/2003/role/disclosureRef
-Topic 470
-SubTopic 20
-Name Accounting Standards Codification
-Section 50
-Paragraph 1B
-Subparagraph (h)
-Publisher FASB
-URI https://asc.fasb.org/1943274/2147481139/470-20-50-1B
Reference 15: http://www.xbrl.org/2003/role/disclosureRef
-Topic 470
-SubTopic 20
-Name Accounting Standards Codification
-Section 50
-Paragraph 1D
-Subparagraph (a)
-Publisher FASB
-URI https://asc.fasb.org/1943274/2147481139/470-20-50-1D
Reference 16: http://www.xbrl.org/2003/role/disclosureRef
-Topic 470
-SubTopic 20
-Name Accounting Standards Codification
-Section 50
-Paragraph 1D
-Subparagraph (b)
-Publisher FASB
-URI https://asc.fasb.org/1943274/2147481139/470-20-50-1D
Reference 17: http://www.xbrl.org/2003/role/disclosureRef
-Topic 470
-SubTopic 20
-Name Accounting Standards Codification
-Section 50
-Paragraph 1D
-Subparagraph (c)
-Publisher FASB
-URI https://asc.fasb.org/1943274/2147481139/470-20-50-1D
Reference 18: http://www.xbrl.org/2003/role/disclosureRef
-Topic 470
-SubTopic 20
-Name Accounting Standards Codification
-Section 50
-Paragraph 1E
-Subparagraph (a)
-Publisher FASB
-URI https://asc.fasb.org/1943274/2147481139/470-20-50-1E
Reference 19: http://www.xbrl.org/2003/role/disclosureRef
-Topic 470
-SubTopic 20
-Name Accounting Standards Codification
-Section 50
-Paragraph 1E
-Subparagraph (c)
-Publisher FASB
-URI https://asc.fasb.org/1943274/2147481139/470-20-50-1E
Reference 20: http://www.xbrl.org/2003/role/disclosureRef
-Topic 470
-SubTopic 20
-Name Accounting Standards Codification
-Section 50
-Paragraph 1E
-Subparagraph (d)
-Publisher FASB
-URI https://asc.fasb.org/1943274/2147481139/470-20-50-1E
Reference 21: http://www.xbrl.org/2003/role/disclosureRef
-Topic 470
-SubTopic 20
-Name Accounting Standards Codification
-Section 50
-Paragraph 1F
-Subparagraph (a)
-Publisher FASB
-URI https://asc.fasb.org/1943274/2147481139/470-20-50-1F
Reference 22: http://www.xbrl.org/2003/role/disclosureRef
-Topic 470
-SubTopic 20
-Name Accounting Standards Codification
-Section 50
-Paragraph 1F
-Subparagraph (b)
-Publisher FASB
-URI https://asc.fasb.org/1943274/2147481139/470-20-50-1F
Reference 23: http://www.xbrl.org/2003/role/disclosureRef
-Topic 470
-SubTopic 20
-Name Accounting Standards Codification
-Section 50
-Paragraph 1F
-Subparagraph (b)(1)
-Publisher FASB
-URI https://asc.fasb.org/1943274/2147481139/470-20-50-1F
Reference 24: http://www.xbrl.org/2003/role/disclosureRef
-Topic 470
-SubTopic 20
-Name Accounting Standards Codification
-Section 50
-Paragraph 1F
-Subparagraph (b)(2)
-Publisher FASB
-URI https://asc.fasb.org/1943274/2147481139/470-20-50-1F
Reference 25: http://www.xbrl.org/2003/role/disclosureRef
-Topic 470
-SubTopic 20
-Name Accounting Standards Codification
-Section 50
-Paragraph 1I
-Subparagraph (c)
-Publisher FASB
-URI https://asc.fasb.org/1943274/2147481139/470-20-50-1I
Reference 26: http://www.xbrl.org/2009/role/commonPracticeRef
-Topic 835
-SubTopic 30
-Name Accounting Standards Codification
-Section 45
-Paragraph 2
-Publisher FASB
-URI https://asc.fasb.org/1943274/2147482925/835-30-45-2
Reference 27: http://www.xbrl.org/2009/role/commonPracticeRef
-Topic 835
-SubTopic 30
-Name Accounting Standards Codification
-Section 50
-Paragraph 1
-Publisher FASB
-URI https://asc.fasb.org/1943274/2147482900/835-30-50-1
| Name: |
us-gaap_DebtInstrumentLineItems |
| Namespace Prefix: |
us-gaap_ |
| Data Type: |
xbrli:stringItemType |
| Balance Type: |
na |
| Period Type: |
duration |
|
| X |
- DefinitionAmount of the cost of borrowed funds accounted for as interest expense for debt. Reference 1: http://fasb.org/us-gaap/role/ref/legacyRef
-Topic 220
-SubTopic 10
-Name Accounting Standards Codification
-Section S99
-Paragraph 2
-Subparagraph (SX 210.5-03(8))
-Publisher FASB
-URI https://asc.fasb.org/1943274/2147483621/220-10-S99-2
Reference 2: http://www.xbrl.org/2003/role/exampleRef
-Topic 470
-SubTopic 20
-Name Accounting Standards Codification
-Section 55
-Paragraph 69E
-Publisher FASB
-URI https://asc.fasb.org/1943274/2147481568/470-20-55-69E
Reference 3: http://www.xbrl.org/2003/role/exampleRef
-Topic 470
-SubTopic 20
-Name Accounting Standards Codification
-Section 55
-Paragraph 69F
-Publisher FASB
-URI https://asc.fasb.org/1943274/2147481568/470-20-55-69F
Reference 4: http://www.xbrl.org/2003/role/disclosureRef
-Topic 470
-SubTopic 20
-Name Accounting Standards Codification
-Section 50
-Paragraph 1F
-Subparagraph (b)
-Publisher FASB
-URI https://asc.fasb.org/1943274/2147481139/470-20-50-1F
Reference 5: http://www.xbrl.org/2003/role/disclosureRef
-Topic 470
-SubTopic 20
-Name Accounting Standards Codification
-Section 50
-Paragraph 6
-Subparagraph (b)
-Publisher FASB
-URI https://asc.fasb.org/1943274/2147481139/470-20-50-6
| Name: |
us-gaap_InterestExpenseDebt |
| Namespace Prefix: |
us-gaap_ |
| Data Type: |
xbrli:monetaryItemType |
| Balance Type: |
debit |
| Period Type: |
duration |
|
| X |
- DefinitionRepresents the portion of interest incurred in the period on debt arrangements that was charged against earnings, excluding amortization of debt discount (premium) and financing costs. Reference 1: http://fasb.org/us-gaap/role/ref/legacyRef
-Topic 220
-SubTopic 10
-Name Accounting Standards Codification
-Section S99
-Paragraph 2
-Subparagraph (SX 210.5-03(8))
-Publisher FASB
-URI https://asc.fasb.org/1943274/2147483621/220-10-S99-2
Reference 2: http://www.xbrl.org/2003/role/exampleRef
-Topic 470
-SubTopic 20
-Name Accounting Standards Codification
-Section 55
-Paragraph 69E
-Publisher FASB
-URI https://asc.fasb.org/1943274/2147481568/470-20-55-69E
Reference 3: http://www.xbrl.org/2003/role/exampleRef
-Topic 470
-SubTopic 20
-Name Accounting Standards Codification
-Section 55
-Paragraph 69F
-Publisher FASB
-URI https://asc.fasb.org/1943274/2147481568/470-20-55-69F
Reference 4: http://www.xbrl.org/2003/role/disclosureRef
-Topic 470
-SubTopic 20
-Name Accounting Standards Codification
-Section 50
-Paragraph 1F
-Subparagraph (b)(1)
-Publisher FASB
-URI https://asc.fasb.org/1943274/2147481139/470-20-50-1F
| Name: |
us-gaap_InterestExpenseDebtExcludingAmortization |
| Namespace Prefix: |
us-gaap_ |
| Data Type: |
xbrli:monetaryItemType |
| Balance Type: |
debit |
| Period Type: |
duration |
|
| X |
- Details
| Name: |
us-gaap_LongtermDebtTypeAxis=us-gaap_ConvertibleDebtMember |
| Namespace Prefix: |
|
| Data Type: |
na |
| Balance Type: |
|
| Period Type: |
|
|
v3.24.2
DEBT - Schedule of Future Payments (Details) - Convertible senior notes - USD ($)
$ in Thousands |
Jun. 30, 2024 |
Dec. 31, 2023 |
| Principal |
|
|
| Remainder of 2024 |
$ 0
|
|
| 2025 |
502,270
|
|
| Principal, total due |
502,270
|
$ 502,270
|
| Interest |
|
|
| Remainder of 2024 |
1,883
|
|
| 2025 |
1,884
|
|
| Interest expense, total due |
3,767
|
|
| Total |
|
|
| Remainder of 2024 |
1,883
|
|
| 2025 |
504,154
|
|
| Principal and interest, total due |
$ 506,037
|
|
| X |
- DefinitionInterest, Long-term Debt, Maturities, Repayments of Principal, Remainder of Fiscal Year
| Name: |
pega_InterestLongTermDebtMaturitiesRepaymentsOfPrincipalRemainderOfFiscalYear |
| Namespace Prefix: |
pega_ |
| Data Type: |
xbrli:monetaryItemType |
| Balance Type: |
credit |
| Period Type: |
instant |
|
| X |
- DefinitionInterest, Long-term Debt, Maturities, Repayments of Principal, Year One
| Name: |
pega_InterestLongTermDebtMaturitiesRepaymentsOfPrincipalYearOne |
| Namespace Prefix: |
pega_ |
| Data Type: |
xbrli:monetaryItemType |
| Balance Type: |
credit |
| Period Type: |
instant |
|
| X |
- DefinitionInterest, Long-term Debt, Maturities, Total Due
| Name: |
pega_InterestLongTermDebtMaturitiesTotalDue |
| Namespace Prefix: |
pega_ |
| Data Type: |
xbrli:monetaryItemType |
| Balance Type: |
credit |
| Period Type: |
instant |
|
| X |
- DefinitionMaturities of Interest and Principal
| Name: |
pega_MaturitiesOfInterestAndPrincipalAbstract |
| Namespace Prefix: |
pega_ |
| Data Type: |
xbrli:stringItemType |
| Balance Type: |
na |
| Period Type: |
duration |
|
| X |
- DefinitionPrincipal and Interest, Long-term Debt, Maturities, Repayments of Principal, Remainder of Fiscal Year
| Name: |
pega_PrincipalAndInterestLongTermDebtMaturitiesRepaymentsOfPrincipalRemainderOfFiscalYear |
| Namespace Prefix: |
pega_ |
| Data Type: |
xbrli:monetaryItemType |
| Balance Type: |
credit |
| Period Type: |
instant |
|
| X |
- DefinitionPrincipal and Interest, Long-term Debt, Maturities, Repayments of Principal, Year One
| Name: |
pega_PrincipalAndInterestLongTermDebtMaturitiesRepaymentsOfPrincipalYearOne |
| Namespace Prefix: |
pega_ |
| Data Type: |
xbrli:monetaryItemType |
| Balance Type: |
credit |
| Period Type: |
instant |
|
| X |
- DefinitionPrincipal and Interest, Long-term Debt, Maturities, Total Due
| Name: |
pega_PrincipalAndInterestLongTermDebtMaturitiesTotalDue |
| Namespace Prefix: |
pega_ |
| Data Type: |
xbrli:monetaryItemType |
| Balance Type: |
credit |
| Period Type: |
instant |
|
| X |
- DefinitionAmount, before unamortized (discount) premium and debt issuance costs, of long-term debt. Includes, but is not limited to, notes payable, bonds payable, commercial loans, mortgage loans, convertible debt, subordinated debt and other types of debt. Reference 1: http://fasb.org/us-gaap/role/ref/legacyRef
-Name Accounting Standards Codification
-Section S99
-Paragraph 1
-Subparagraph (SX 210.5-02(22))
-SubTopic 10
-Topic 210
-Publisher FASB
-URI https://asc.fasb.org/1943274/2147480566/210-10-S99-1
Reference 2: http://fasb.org/us-gaap/role/ref/legacyRef
-Topic 942
-SubTopic 210
-Name Accounting Standards Codification
-Section S99
-Paragraph 1
-Subparagraph (SX 210.9-03(16))
-Publisher FASB
-URI https://asc.fasb.org/1943274/2147478546/942-210-S99-1
Reference 3: http://www.xbrl.org/2003/role/disclosureRef
-Topic 470
-SubTopic 20
-Name Accounting Standards Codification
-Section 50
-Paragraph 4
-Subparagraph (b)(1)
-Publisher FASB
-URI https://asc.fasb.org/1943274/2147481139/470-20-50-4
| Name: |
us-gaap_DebtInstrumentCarryingAmount |
| Namespace Prefix: |
us-gaap_ |
| Data Type: |
xbrli:monetaryItemType |
| Balance Type: |
credit |
| Period Type: |
instant |
|
| X |
- References
+ Details
| Name: |
us-gaap_InterestExpenseDebtAbstract |
| Namespace Prefix: |
us-gaap_ |
| Data Type: |
xbrli:stringItemType |
| Balance Type: |
na |
| Period Type: |
duration |
|
| X |
- References
+ Details
| Name: |
us-gaap_LongTermDebtByMaturityAbstract |
| Namespace Prefix: |
us-gaap_ |
| Data Type: |
xbrli:stringItemType |
| Balance Type: |
na |
| Period Type: |
duration |
|
| X |
- DefinitionAmount of long-term debt payable, sinking fund requirement, and other securities issued that are redeemable by holder at fixed or determinable price and date, maturing in next fiscal year following current fiscal year. Excludes interim and annual periods when interim periods are reported from current statement of financial position date (rolling approach). Reference 1: http://www.xbrl.org/2003/role/disclosureRef
-Topic 235
-SubTopic 10
-Name Accounting Standards Codification
-Section S99
-Paragraph 3
-Subparagraph (SX 210.12-04(a))
-Publisher FASB
-URI https://asc.fasb.org/1943274/2147480678/235-10-S99-3
Reference 2: http://www.xbrl.org/2003/role/disclosureRef
-Topic 470
-SubTopic 20
-Name Accounting Standards Codification
-Section 50
-Paragraph 1E
-Subparagraph (d)
-Publisher FASB
-URI https://asc.fasb.org/1943274/2147481139/470-20-50-1E
Reference 3: http://fasb.org/us-gaap/role/ref/legacyRef
-Name Accounting Standards Codification
-Section 50
-Paragraph 1
-SubTopic 10
-Topic 470
-Publisher FASB
-URI https://asc.fasb.org/1943274/2147481544/470-10-50-1
| Name: |
us-gaap_LongTermDebtMaturitiesRepaymentsOfPrincipalInNextTwelveMonths |
| Namespace Prefix: |
us-gaap_ |
| Data Type: |
xbrli:monetaryItemType |
| Balance Type: |
credit |
| Period Type: |
instant |
|
| X |
- DefinitionAmount of long-term debt payable, sinking fund requirement, and other securities issued that are redeemable by holder at fixed or determinable price and date, maturing in remainder of current fiscal year. Reference 1: http://www.xbrl.org/2009/role/commonPracticeRef
-Topic 235
-SubTopic 10
-Name Accounting Standards Codification
-Section S99
-Paragraph 3
-Subparagraph (SX 210.12-04(a))
-Publisher FASB
-URI https://asc.fasb.org/1943274/2147480678/235-10-S99-3
| Name: |
us-gaap_LongTermDebtMaturitiesRepaymentsOfPrincipalRemainderOfFiscalYear |
| Namespace Prefix: |
us-gaap_ |
| Data Type: |
xbrli:monetaryItemType |
| Balance Type: |
credit |
| Period Type: |
instant |
|
| X |
- Details
| Name: |
us-gaap_LongtermDebtTypeAxis=us-gaap_ConvertibleDebtMember |
| Namespace Prefix: |
|
| Data Type: |
na |
| Balance Type: |
|
| Period Type: |
|
|
v3.24.2
| X |
- DefinitionDebt Conversion, Converted Instrument, Shares if fully Exercised
| Name: |
pega_DebtConversionConvertedInstrumentSharesIfFullyExercised |
| Namespace Prefix: |
pega_ |
| Data Type: |
xbrli:sharesItemType |
| Balance Type: |
na |
| Period Type: |
instant |
|
| X |
- DefinitionThe number of shares issued in exchange for the original debt being converted in a noncash (or part noncash) transaction. "Part noncash" refers to that portion of the transaction not resulting in cash receipts or payments in the period. Reference 1: http://fasb.org/us-gaap/role/ref/legacyRef
-Name Accounting Standards Codification
-Topic 230
-SubTopic 10
-Section 50
-Paragraph 3
-Publisher FASB
-URI https://asc.fasb.org/1943274/2147482913/230-10-50-3
Reference 2: http://fasb.org/us-gaap/role/ref/legacyRef
-Name Accounting Standards Codification
-Topic 230
-SubTopic 10
-Section 50
-Paragraph 5
-Publisher FASB
-URI https://asc.fasb.org/1943274/2147482913/230-10-50-5
| Name: |
us-gaap_DebtConversionConvertedInstrumentSharesIssued1 |
| Namespace Prefix: |
us-gaap_ |
| Data Type: |
xbrli:sharesItemType |
| Balance Type: |
na |
| Period Type: |
duration |
|
| X |
- References
+ Details
| Name: |
us-gaap_DebtDisclosureAbstract |
| Namespace Prefix: |
us-gaap_ |
| Data Type: |
xbrli:stringItemType |
| Balance Type: |
na |
| Period Type: |
duration |
|
| X |
- DefinitionThe cap rate on a price risk derivative such as a cap or collar. A payment or receipt is triggered if the market rate exceeds the cap rate on the contract.
| Name: |
us-gaap_DerivativeCapPrice |
| Namespace Prefix: |
us-gaap_ |
| Data Type: |
srt-types:perUnitItemType |
| Balance Type: |
na |
| Period Type: |
instant |
|
| X |
- DefinitionThe cash inflow provided by derivative instruments during the period, which are classified as financing activities, excluding those designated as hedging instruments. Reference 1: http://www.xbrl.org/2003/role/exampleRef
-Topic 230
-SubTopic 10
-Name Accounting Standards Codification
-Section 45
-Paragraph 23
-Publisher FASB
-URI https://asc.fasb.org/1943274/2147482740/230-10-45-23
Reference 2: http://www.xbrl.org/2003/role/disclosureRef
-Topic 230
-SubTopic 10
-Name Accounting Standards Codification
-Section 45
-Paragraph 14
-Subparagraph (d)
-Publisher FASB
-URI https://asc.fasb.org/1943274/2147482740/230-10-45-14
| Name: |
us-gaap_ProceedsFromDerivativeInstrumentFinancingActivities |
| Namespace Prefix: |
us-gaap_ |
| Data Type: |
xbrli:monetaryItemType |
| Balance Type: |
debit |
| Period Type: |
duration |
|
v3.24.2
| X |
- Details
| Name: |
us-gaap_FairValueByAssetClassAxis=us-gaap_DerivativeFinancialInstrumentsAssetsMember |
| Namespace Prefix: |
|
| Data Type: |
na |
| Balance Type: |
|
| Period Type: |
|
|
v3.24.2
DEBT - Credit Facility (Details)
|
Nov. 30, 2019
USD ($)
|
Jun. 30, 2024
USD ($)
|
Dec. 31, 2023
USD ($)
|
| Debt Instrument [Line Items] |
|
|
|
| Outstanding letters of credit |
|
$ 27,300,000
|
$ 27,300,000
|
| Remaining borrowing capacity |
|
$ 0
|
$ 0
|
| Credit Agreement | PNC Bank, National Association |
|
|
|
| Debt Instrument [Line Items] |
|
|
|
| Maximum consolidated net leverage ratio |
|
3.5
|
|
| Minimum consolidated coverage ratio |
|
3.5
|
|
| Line of Credit | PNC Bank, National Association | Revolving Credit Facility |
|
|
|
| Debt Instrument [Line Items] |
|
|
|
| Revolving credit agreement term |
5 years
|
|
|
| Senior notes |
$ 100,000,000
|
|
|
| Increase in aggregate commitment amount |
$ 200,000,000
|
|
|
| X |
- DefinitionDebt Instrument, Covenant, Interest Coverage Ratio, Minimum
| Name: |
pega_DebtInstrumentCovenantInterestCoverageRatioMinimum |
| Namespace Prefix: |
pega_ |
| Data Type: |
xbrli:pureItemType |
| Balance Type: |
na |
| Period Type: |
instant |
|
| X |
- DefinitionDebt Instrument, Covenants, Leverage Ratio, Maximum
| Name: |
pega_DebtInstrumentCovenantsLeverageRatioMaximum |
| Namespace Prefix: |
pega_ |
| Data Type: |
xbrli:pureItemType |
| Balance Type: |
na |
| Period Type: |
instant |
|
| X |
- DefinitionLine items represent financial concepts included in a table. These concepts are used to disclose reportable information associated with domain members defined in one or many axes to the table. Reference 1: http://www.xbrl.org/2003/role/exampleRef
-Topic 835
-SubTopic 30
-Name Accounting Standards Codification
-Section 55
-Paragraph 8
-Publisher FASB
-URI https://asc.fasb.org/1943274/2147482949/835-30-55-8
Reference 2: http://www.xbrl.org/2009/role/commonPracticeRef
-Topic 235
-SubTopic 10
-Name Accounting Standards Codification
-Section S99
-Paragraph 1
-Subparagraph (SX 210.4-08(f))
-Publisher FASB
-URI https://asc.fasb.org/1943274/2147480678/235-10-S99-1
Reference 3: http://www.xbrl.org/2003/role/disclosureRef
-Topic 235
-SubTopic 10
-Name Accounting Standards Codification
-Section S99
-Paragraph 3
-Subparagraph (SX 210.12-04(a))
-Publisher FASB
-URI https://asc.fasb.org/1943274/2147480678/235-10-S99-3
Reference 4: http://www.xbrl.org/2003/role/disclosureRef
-Topic 470
-SubTopic 20
-Name Accounting Standards Codification
-Section 50
-Paragraph 1B
-Subparagraph (a)
-Publisher FASB
-URI https://asc.fasb.org/1943274/2147481139/470-20-50-1B
Reference 5: http://www.xbrl.org/2003/role/exampleRef
-Topic 470
-SubTopic 20
-Name Accounting Standards Codification
-Section 55
-Paragraph 69B
-Publisher FASB
-URI https://asc.fasb.org/1943274/2147481568/470-20-55-69B
Reference 6: http://www.xbrl.org/2003/role/exampleRef
-Topic 470
-SubTopic 20
-Name Accounting Standards Codification
-Section 55
-Paragraph 69C
-Publisher FASB
-URI https://asc.fasb.org/1943274/2147481568/470-20-55-69C
Reference 7: http://www.xbrl.org/2003/role/exampleRef
-Topic 470
-SubTopic 20
-Name Accounting Standards Codification
-Section 55
-Paragraph 69E
-Publisher FASB
-URI https://asc.fasb.org/1943274/2147481568/470-20-55-69E
Reference 8: http://www.xbrl.org/2003/role/exampleRef
-Topic 470
-SubTopic 20
-Name Accounting Standards Codification
-Section 55
-Paragraph 69F
-Publisher FASB
-URI https://asc.fasb.org/1943274/2147481568/470-20-55-69F
Reference 9: http://www.xbrl.org/2003/role/disclosureRef
-Topic 470
-SubTopic 20
-Name Accounting Standards Codification
-Section 50
-Paragraph 1B
-Subparagraph (b)
-Publisher FASB
-URI https://asc.fasb.org/1943274/2147481139/470-20-50-1B
Reference 10: http://www.xbrl.org/2003/role/disclosureRef
-Topic 470
-SubTopic 20
-Name Accounting Standards Codification
-Section 50
-Paragraph 1B
-Subparagraph (c)
-Publisher FASB
-URI https://asc.fasb.org/1943274/2147481139/470-20-50-1B
Reference 11: http://www.xbrl.org/2003/role/exampleRef
-Topic 470
-SubTopic 20
-Name Accounting Standards Codification
-Section 50
-Paragraph 1B
-Subparagraph (d)
-Publisher FASB
-URI https://asc.fasb.org/1943274/2147481139/470-20-50-1B
Reference 12: http://www.xbrl.org/2003/role/disclosureRef
-Topic 470
-SubTopic 20
-Name Accounting Standards Codification
-Section 50
-Paragraph 1B
-Subparagraph (e)
-Publisher FASB
-URI https://asc.fasb.org/1943274/2147481139/470-20-50-1B
Reference 13: http://www.xbrl.org/2003/role/disclosureRef
-Topic 470
-SubTopic 20
-Name Accounting Standards Codification
-Section 50
-Paragraph 1B
-Subparagraph (f)
-Publisher FASB
-URI https://asc.fasb.org/1943274/2147481139/470-20-50-1B
Reference 14: http://www.xbrl.org/2003/role/disclosureRef
-Topic 470
-SubTopic 20
-Name Accounting Standards Codification
-Section 50
-Paragraph 1B
-Subparagraph (h)
-Publisher FASB
-URI https://asc.fasb.org/1943274/2147481139/470-20-50-1B
Reference 15: http://www.xbrl.org/2003/role/disclosureRef
-Topic 470
-SubTopic 20
-Name Accounting Standards Codification
-Section 50
-Paragraph 1D
-Subparagraph (a)
-Publisher FASB
-URI https://asc.fasb.org/1943274/2147481139/470-20-50-1D
Reference 16: http://www.xbrl.org/2003/role/disclosureRef
-Topic 470
-SubTopic 20
-Name Accounting Standards Codification
-Section 50
-Paragraph 1D
-Subparagraph (b)
-Publisher FASB
-URI https://asc.fasb.org/1943274/2147481139/470-20-50-1D
Reference 17: http://www.xbrl.org/2003/role/disclosureRef
-Topic 470
-SubTopic 20
-Name Accounting Standards Codification
-Section 50
-Paragraph 1D
-Subparagraph (c)
-Publisher FASB
-URI https://asc.fasb.org/1943274/2147481139/470-20-50-1D
Reference 18: http://www.xbrl.org/2003/role/disclosureRef
-Topic 470
-SubTopic 20
-Name Accounting Standards Codification
-Section 50
-Paragraph 1E
-Subparagraph (a)
-Publisher FASB
-URI https://asc.fasb.org/1943274/2147481139/470-20-50-1E
Reference 19: http://www.xbrl.org/2003/role/disclosureRef
-Topic 470
-SubTopic 20
-Name Accounting Standards Codification
-Section 50
-Paragraph 1E
-Subparagraph (c)
-Publisher FASB
-URI https://asc.fasb.org/1943274/2147481139/470-20-50-1E
Reference 20: http://www.xbrl.org/2003/role/disclosureRef
-Topic 470
-SubTopic 20
-Name Accounting Standards Codification
-Section 50
-Paragraph 1E
-Subparagraph (d)
-Publisher FASB
-URI https://asc.fasb.org/1943274/2147481139/470-20-50-1E
Reference 21: http://www.xbrl.org/2003/role/disclosureRef
-Topic 470
-SubTopic 20
-Name Accounting Standards Codification
-Section 50
-Paragraph 1F
-Subparagraph (a)
-Publisher FASB
-URI https://asc.fasb.org/1943274/2147481139/470-20-50-1F
Reference 22: http://www.xbrl.org/2003/role/disclosureRef
-Topic 470
-SubTopic 20
-Name Accounting Standards Codification
-Section 50
-Paragraph 1F
-Subparagraph (b)
-Publisher FASB
-URI https://asc.fasb.org/1943274/2147481139/470-20-50-1F
Reference 23: http://www.xbrl.org/2003/role/disclosureRef
-Topic 470
-SubTopic 20
-Name Accounting Standards Codification
-Section 50
-Paragraph 1F
-Subparagraph (b)(1)
-Publisher FASB
-URI https://asc.fasb.org/1943274/2147481139/470-20-50-1F
Reference 24: http://www.xbrl.org/2003/role/disclosureRef
-Topic 470
-SubTopic 20
-Name Accounting Standards Codification
-Section 50
-Paragraph 1F
-Subparagraph (b)(2)
-Publisher FASB
-URI https://asc.fasb.org/1943274/2147481139/470-20-50-1F
Reference 25: http://www.xbrl.org/2003/role/disclosureRef
-Topic 470
-SubTopic 20
-Name Accounting Standards Codification
-Section 50
-Paragraph 1I
-Subparagraph (c)
-Publisher FASB
-URI https://asc.fasb.org/1943274/2147481139/470-20-50-1I
Reference 26: http://www.xbrl.org/2009/role/commonPracticeRef
-Topic 835
-SubTopic 30
-Name Accounting Standards Codification
-Section 45
-Paragraph 2
-Publisher FASB
-URI https://asc.fasb.org/1943274/2147482925/835-30-45-2
Reference 27: http://www.xbrl.org/2009/role/commonPracticeRef
-Topic 835
-SubTopic 30
-Name Accounting Standards Codification
-Section 50
-Paragraph 1
-Publisher FASB
-URI https://asc.fasb.org/1943274/2147482900/835-30-50-1
| Name: |
us-gaap_DebtInstrumentLineItems |
| Namespace Prefix: |
us-gaap_ |
| Data Type: |
xbrli:stringItemType |
| Balance Type: |
na |
| Period Type: |
duration |
|
| X |
- DefinitionPeriod of time between issuance and maturity of debt instrument, in PnYnMnDTnHnMnS' format, for example, 'P1Y5M13D' represents the reported fact of one year, five months, and thirteen days.
| Name: |
us-gaap_DebtInstrumentTerm |
| Namespace Prefix: |
us-gaap_ |
| Data Type: |
xbrli:durationItemType |
| Balance Type: |
na |
| Period Type: |
duration |
|
| X |
- DefinitionThe total amount of the contingent obligation under letters of credit outstanding as of the reporting date.
| Name: |
us-gaap_LettersOfCreditOutstandingAmount |
| Namespace Prefix: |
us-gaap_ |
| Data Type: |
xbrli:monetaryItemType |
| Balance Type: |
credit |
| Period Type: |
instant |
|
| X |
- DefinitionFair value of the amount outstanding under the credit facility. Reference 1: http://www.xbrl.org/2003/role/disclosureRef
-Topic 825
-SubTopic 10
-Name Accounting Standards Codification
-Section 50
-Paragraph 10
-Publisher FASB
-URI https://asc.fasb.org/1943274/2147482907/825-10-50-10
| Name: |
us-gaap_LineOfCreditFacilityFairValueOfAmountOutstanding |
| Namespace Prefix: |
us-gaap_ |
| Data Type: |
xbrli:monetaryItemType |
| Balance Type: |
credit |
| Period Type: |
instant |
|
| X |
- DefinitionMaximum borrowing capacity under the credit facility without consideration of any current restrictions on the amount that could be borrowed or the amounts currently outstanding under the facility. Reference 1: http://fasb.org/us-gaap/role/ref/legacyRef
-Topic 210
-SubTopic 10
-Name Accounting Standards Codification
-Section S99
-Paragraph 1
-Subparagraph (SX 210.5-02(22)(b))
-Publisher FASB
-URI https://asc.fasb.org/1943274/2147480566/210-10-S99-1
Reference 2: http://fasb.org/us-gaap/role/ref/legacyRef
-Topic 210
-SubTopic 10
-Name Accounting Standards Codification
-Section S99
-Paragraph 1
-Subparagraph (SX 210.5-02(19)(b))
-Publisher FASB
-URI https://asc.fasb.org/1943274/2147480566/210-10-S99-1
| Name: |
us-gaap_LineOfCreditFacilityMaximumBorrowingCapacity |
| Namespace Prefix: |
us-gaap_ |
| Data Type: |
xbrli:monetaryItemType |
| Balance Type: |
credit |
| Period Type: |
instant |
|
| X |
- DefinitionIncluding the current and noncurrent portions, carrying value as of the balance sheet date of Notes with the highest claim on the assets of the issuer in case of bankruptcy or liquidation (with maturities initially due after one year or beyond the operating cycle if longer). Senior note holders are paid off in full before any payments are made to junior note holders. Reference 1: http://fasb.org/us-gaap/role/ref/legacyRef
-Topic 942
-SubTopic 210
-Name Accounting Standards Codification
-Section S99
-Paragraph 1
-Subparagraph (SX 210.9-03(16))
-Publisher FASB
-URI https://asc.fasb.org/1943274/2147478546/942-210-S99-1
Reference 2: http://www.xbrl.org/2009/role/commonPracticeRef
-Topic 944
-SubTopic 210
-Name Accounting Standards Codification
-Section S99
-Paragraph 1
-Subparagraph (SX 210.7-03(a)(16)(a)(2))
-Publisher FASB
-URI https://asc.fasb.org/1943274/2147478777/944-210-S99-1
| Name: |
us-gaap_SeniorNotes |
| Namespace Prefix: |
us-gaap_ |
| Data Type: |
xbrli:monetaryItemType |
| Balance Type: |
credit |
| Period Type: |
instant |
|
| X |
- Details
| Name: |
us-gaap_DebtInstrumentAxis=pega_CreditAgreementMember |
| Namespace Prefix: |
|
| Data Type: |
na |
| Balance Type: |
|
| Period Type: |
|
|
| X |
- Details
| Name: |
us-gaap_LineOfCreditFacilityAxis=pega_PNCBankNationalAssociationMember |
| Namespace Prefix: |
|
| Data Type: |
na |
| Balance Type: |
|
| Period Type: |
|
|
| X |
- Details
| Name: |
us-gaap_LongtermDebtTypeAxis=us-gaap_LineOfCreditMember |
| Namespace Prefix: |
|
| Data Type: |
na |
| Balance Type: |
|
| Period Type: |
|
|
| X |
- Details
| Name: |
us-gaap_CreditFacilityAxis=us-gaap_RevolvingCreditFacilityMember |
| Namespace Prefix: |
|
| Data Type: |
na |
| Balance Type: |
|
| Period Type: |
|
|
v3.24.2
RESTRUCTURING - Schedule of Restructuring Activities (Details) - USD ($)
$ in Thousands |
3 Months Ended |
6 Months Ended |
Jun. 30, 2024 |
Dec. 31, 2023 |
Sep. 30, 2023 |
Jun. 30, 2023 |
Mar. 31, 2023 |
Jun. 30, 2024 |
Jun. 30, 2023 |
| Restructuring Cost and Reserve [Line Items] |
|
|
|
|
|
|
|
| Restructuring |
$ 635
|
|
|
$ 2,167
|
|
$ 798
|
$ 3,628
|
| Office space reduction |
|
|
|
|
|
|
|
| Restructuring Cost and Reserve [Line Items] |
|
|
|
|
|
|
|
| Restructuring |
$ 1,257
|
$ 1,497
|
|
|
$ 1,241
|
|
|
| Employee Severance |
|
|
|
|
|
|
|
| Restructuring Cost and Reserve [Line Items] |
|
|
|
|
|
|
|
| Restructuring |
|
|
$ 17,236
|
$ 1,581
|
|
$ (238)
|
$ 2,387
|
| X |
- DefinitionAmount of expenses associated with exit or disposal activities pursuant to an authorized plan. Excludes expenses related to a discontinued operation or an asset retirement obligation. Reference 1: http://fasb.org/us-gaap/role/ref/legacyRef
-Name Accounting Standards Codification
-Section 45
-Paragraph 28
-Subparagraph (b)
-SubTopic 10
-Topic 230
-Publisher FASB
-URI https://asc.fasb.org/1943274/2147482740/230-10-45-28
Reference 2: http://www.xbrl.org/2003/role/disclosureRef
-Topic 420
-SubTopic 10
-Name Accounting Standards Codification
-Section S99
-Paragraph 2
-Subparagraph (SAB Topic 5.P.4.b.1)
-Publisher FASB
-URI https://asc.fasb.org/1943274/2147479823/420-10-S99-2
Reference 3: http://www.xbrl.org/2009/role/commonPracticeRef
-Topic 420
-SubTopic 10
-Name Accounting Standards Codification
-Section 45
-Paragraph 3
-Publisher FASB
-URI https://asc.fasb.org/1943274/2147482047/420-10-45-3
Reference 4: http://www.xbrl.org/2003/role/disclosureRef
-Topic 420
-SubTopic 10
-Name Accounting Standards Codification
-Section S99
-Paragraph 1
-Subparagraph (SAB Topic 5.P.3)
-Publisher FASB
-URI https://asc.fasb.org/1943274/2147479823/420-10-S99-1
| Name: |
us-gaap_RestructuringCharges |
| Namespace Prefix: |
us-gaap_ |
| Data Type: |
xbrli:monetaryItemType |
| Balance Type: |
debit |
| Period Type: |
duration |
|
| X |
- DefinitionLine items represent financial concepts included in a table. These concepts are used to disclose reportable information associated with domain members defined in one or many axes to the table. Reference 1: http://www.xbrl.org/2003/role/disclosureRef
-Topic 420
-SubTopic 10
-Name Accounting Standards Codification
-Section S99
-Paragraph 2
-Subparagraph (SAB Topic 5.P.4.d)
-Publisher FASB
-URI https://asc.fasb.org/1943274/2147479823/420-10-S99-2
Reference 2: http://www.xbrl.org/2003/role/disclosureRef
-Topic 420
-SubTopic 10
-Name Accounting Standards Codification
-Section S99
-Paragraph 2
-Subparagraph (SAB Topic 5.P.4.b.1)
-Publisher FASB
-URI https://asc.fasb.org/1943274/2147479823/420-10-S99-2
Reference 3: http://www.xbrl.org/2003/role/disclosureRef
-Topic 420
-SubTopic 10
-Name Accounting Standards Codification
-Section S99
-Paragraph 2
-Subparagraph (SAB Topic 5.P.4.b.2)
-Publisher FASB
-URI https://asc.fasb.org/1943274/2147479823/420-10-S99-2
Reference 4: http://www.xbrl.org/2003/role/disclosureRef
-Topic 420
-SubTopic 10
-Name Accounting Standards Codification
-Section 50
-Paragraph 1
-Subparagraph (c)
-Publisher FASB
-URI https://asc.fasb.org/1943274/2147482017/420-10-50-1
Reference 5: http://www.xbrl.org/2003/role/disclosureRef
-Topic 420
-SubTopic 10
-Name Accounting Standards Codification
-Section 50
-Paragraph 1
-Subparagraph (b)(2)
-Publisher FASB
-URI https://asc.fasb.org/1943274/2147482017/420-10-50-1
Reference 6: http://www.xbrl.org/2003/role/disclosureRef
-Topic 420
-SubTopic 10
-Name Accounting Standards Codification
-Section 50
-Paragraph 1
-Subparagraph (b)(1)
-Publisher FASB
-URI https://asc.fasb.org/1943274/2147482017/420-10-50-1
Reference 7: http://www.xbrl.org/2003/role/disclosureRef
-Topic 420
-SubTopic 10
-Name Accounting Standards Codification
-Section 50
-Paragraph 1
-Subparagraph (d)
-Publisher FASB
-URI https://asc.fasb.org/1943274/2147482017/420-10-50-1
| Name: |
us-gaap_RestructuringCostAndReserveLineItems |
| Namespace Prefix: |
us-gaap_ |
| Data Type: |
xbrli:stringItemType |
| Balance Type: |
na |
| Period Type: |
duration |
|
| X |
- Details
| Name: |
us-gaap_RestructuringCostAndReserveAxis=us-gaap_FacilityClosingMember |
| Namespace Prefix: |
|
| Data Type: |
na |
| Balance Type: |
|
| Period Type: |
|
|
| X |
- Details
| Name: |
us-gaap_RestructuringCostAndReserveAxis=us-gaap_EmployeeSeveranceMember |
| Namespace Prefix: |
|
| Data Type: |
na |
| Balance Type: |
|
| Period Type: |
|
|
v3.24.2
RESTRUCTURING - Schedule of Accrued Employee Severance and Related Benefit (Details) - USD ($)
$ in Thousands |
3 Months Ended |
6 Months Ended |
Jun. 30, 2024 |
Sep. 30, 2023 |
Jun. 30, 2023 |
Jun. 30, 2024 |
Jun. 30, 2023 |
| Restructuring Reserve [Roll Forward] |
|
|
|
|
|
| Costs incurred |
$ 635
|
|
$ 2,167
|
$ 798
|
$ 3,628
|
| Employee Severance |
|
|
|
|
|
| Restructuring Reserve [Roll Forward] |
|
|
|
|
|
| Restructuring Reserve, Beginning Balance |
|
$ 3,624
|
|
8,095
|
18,573
|
| Costs incurred |
|
$ 17,236
|
1,581
|
(238)
|
2,387
|
| Cash disbursements |
|
|
|
(3,852)
|
(17,521)
|
| Currency translation adjustments |
|
|
|
(169)
|
185
|
| Restructuring Reserve, Ending Balance |
$ 3,836
|
|
$ 3,624
|
$ 3,836
|
$ 3,624
|
| X |
- DefinitionAmount of cash payments made as the result of exit or disposal activities. Excludes payments associated with a discontinued operation or an asset retirement obligation. Reference 1: http://www.xbrl.org/2003/role/disclosureRef
-Topic 420
-SubTopic 10
-Name Accounting Standards Codification
-Section 50
-Paragraph 1
-Subparagraph (b)(2)
-Publisher FASB
-URI https://asc.fasb.org/1943274/2147482017/420-10-50-1
Reference 2: http://www.xbrl.org/2009/role/commonPracticeRef
-Topic 230
-SubTopic 10
-Name Accounting Standards Codification
-Section 45
-Paragraph 17
-Subparagraph (f)
-Publisher FASB
-URI https://asc.fasb.org/1943274/2147482740/230-10-45-17
| Name: |
us-gaap_PaymentsForRestructuring |
| Namespace Prefix: |
us-gaap_ |
| Data Type: |
xbrli:monetaryItemType |
| Balance Type: |
credit |
| Period Type: |
duration |
|
| X |
- DefinitionAmount of expenses associated with exit or disposal activities pursuant to an authorized plan. Excludes expenses related to a discontinued operation or an asset retirement obligation. Reference 1: http://fasb.org/us-gaap/role/ref/legacyRef
-Name Accounting Standards Codification
-Section 45
-Paragraph 28
-Subparagraph (b)
-SubTopic 10
-Topic 230
-Publisher FASB
-URI https://asc.fasb.org/1943274/2147482740/230-10-45-28
Reference 2: http://www.xbrl.org/2003/role/disclosureRef
-Topic 420
-SubTopic 10
-Name Accounting Standards Codification
-Section S99
-Paragraph 2
-Subparagraph (SAB Topic 5.P.4.b.1)
-Publisher FASB
-URI https://asc.fasb.org/1943274/2147479823/420-10-S99-2
Reference 3: http://www.xbrl.org/2009/role/commonPracticeRef
-Topic 420
-SubTopic 10
-Name Accounting Standards Codification
-Section 45
-Paragraph 3
-Publisher FASB
-URI https://asc.fasb.org/1943274/2147482047/420-10-45-3
Reference 4: http://www.xbrl.org/2003/role/disclosureRef
-Topic 420
-SubTopic 10
-Name Accounting Standards Codification
-Section S99
-Paragraph 1
-Subparagraph (SAB Topic 5.P.3)
-Publisher FASB
-URI https://asc.fasb.org/1943274/2147479823/420-10-S99-1
| Name: |
us-gaap_RestructuringCharges |
| Namespace Prefix: |
us-gaap_ |
| Data Type: |
xbrli:monetaryItemType |
| Balance Type: |
debit |
| Period Type: |
duration |
|
| X |
- DefinitionCarrying amount (including both current and noncurrent portions of the accrual) as of the balance sheet date pertaining to a specified type of cost associated with exit from or disposal of business activities or restructuring pursuant to a duly authorized plan. Reference 1: http://www.xbrl.org/2003/role/disclosureRef
-Topic 420
-SubTopic 10
-Name Accounting Standards Codification
-Section S99
-Paragraph 2
-Subparagraph (SAB Topic 5.P.4.b.2)
-Publisher FASB
-URI https://asc.fasb.org/1943274/2147479823/420-10-S99-2
Reference 2: http://www.xbrl.org/2003/role/disclosureRef
-Topic 420
-SubTopic 10
-Name Accounting Standards Codification
-Section 50
-Paragraph 1
-Subparagraph (b)(2)
-Publisher FASB
-URI https://asc.fasb.org/1943274/2147482017/420-10-50-1
| Name: |
us-gaap_RestructuringReserve |
| Namespace Prefix: |
us-gaap_ |
| Data Type: |
xbrli:monetaryItemType |
| Balance Type: |
credit |
| Period Type: |
instant |
|
| X |
- DefinitionA roll forward is a reconciliation of a concept from the beginning of a period to the end of a period.
| Name: |
us-gaap_RestructuringReserveRollForward |
| Namespace Prefix: |
us-gaap_ |
| Data Type: |
xbrli:stringItemType |
| Balance Type: |
na |
| Period Type: |
duration |
|
| X |
- DefinitionAmount of foreign currency translation gain (loss) which decreases (increases) the restructuring reserve. Reference 1: http://www.xbrl.org/2009/role/commonPracticeRef
-Topic 420
-SubTopic 10
-Name Accounting Standards Codification
-Section S99
-Paragraph 2
-Subparagraph (SAB Topic 5.P.4.b.2)
-Publisher FASB
-URI https://asc.fasb.org/1943274/2147479823/420-10-S99-2
Reference 2: http://www.xbrl.org/2009/role/commonPracticeRef
-Topic 420
-SubTopic 10
-Name Accounting Standards Codification
-Section 50
-Paragraph 1
-Subparagraph (b)(2)
-Publisher FASB
-URI https://asc.fasb.org/1943274/2147482017/420-10-50-1
| Name: |
us-gaap_RestructuringReserveTranslationAdjustment |
| Namespace Prefix: |
us-gaap_ |
| Data Type: |
xbrli:monetaryItemType |
| Balance Type: |
credit |
| Period Type: |
duration |
|
| X |
- Details
| Name: |
us-gaap_RestructuringCostAndReserveAxis=us-gaap_EmployeeSeveranceMember |
| Namespace Prefix: |
|
| Data Type: |
na |
| Balance Type: |
|
| Period Type: |
|
|
v3.24.2
FAIR VALUE MEASUREMENTS - Schedule of Assets and Liabilities Measured at Fair Value (Details) - USD ($)
$ in Thousands |
Jun. 30, 2024 |
Dec. 31, 2023 |
| Fair Value Assets |
|
|
| Marketable securities |
$ 406,819
|
$ 193,436
|
| Capped call transactions |
915
|
893
|
| Cash equivalents |
|
|
| Fair Value Assets |
|
|
| Cash equivalents |
18,345
|
54,357
|
| Venture investments |
|
|
| Fair Value Assets |
|
|
| Venture investments |
21,047
|
19,450
|
| Level 1 |
|
|
| Fair Value Assets |
|
|
| Marketable securities |
0
|
0
|
| Capped call transactions |
0
|
0
|
| Level 1 | Cash equivalents |
|
|
| Fair Value Assets |
|
|
| Cash equivalents |
18,345
|
54,357
|
| Level 1 | Venture investments |
|
|
| Fair Value Assets |
|
|
| Venture investments |
0
|
0
|
| Level 2 |
|
|
| Fair Value Assets |
|
|
| Marketable securities |
406,819
|
193,436
|
| Capped call transactions |
915
|
893
|
| Level 2 | Cash equivalents |
|
|
| Fair Value Assets |
|
|
| Cash equivalents |
0
|
0
|
| Level 2 | Venture investments |
|
|
| Fair Value Assets |
|
|
| Venture investments |
0
|
0
|
| Level 3 |
|
|
| Fair Value Assets |
|
|
| Marketable securities |
0
|
0
|
| Capped call transactions |
0
|
0
|
| Level 3 | Cash equivalents |
|
|
| Fair Value Assets |
|
|
| Cash equivalents |
0
|
0
|
| Level 3 | Venture investments |
|
|
| Fair Value Assets |
|
|
| Venture investments |
$ 21,047
|
$ 19,450
|
| X |
- References
+ Details
| Name: |
us-gaap_AssetsFairValueDisclosureAbstract |
| Namespace Prefix: |
us-gaap_ |
| Data Type: |
xbrli:stringItemType |
| Balance Type: |
na |
| Period Type: |
duration |
|
| X |
- DefinitionFair value portion of currency on hand as well as demand deposits with banks or financial institutions. Includes other kinds of accounts that have the general characteristics of demand deposits. Also includes short-term, highly liquid investments that are both readily convertible to known amounts of cash and so near their maturity that they present insignificant risk of changes in value because of changes in interest rates. Reference 1: http://www.xbrl.org/2009/role/commonPracticeRef
-Topic 820
-SubTopic 10
-Name Accounting Standards Codification
-Section 50
-Paragraph 2
-Subparagraph (b)
-Publisher FASB
-URI https://asc.fasb.org/1943274/2147482106/820-10-50-2
Reference 2: http://www.xbrl.org/2009/role/commonPracticeRef
-Topic 820
-SubTopic 10
-Name Accounting Standards Codification
-Section 50
-Paragraph 2
-Subparagraph (a)
-Publisher FASB
-URI https://asc.fasb.org/1943274/2147482106/820-10-50-2
| Name: |
us-gaap_CashAndCashEquivalentsFairValueDisclosure |
| Namespace Prefix: |
us-gaap_ |
| Data Type: |
xbrli:monetaryItemType |
| Balance Type: |
debit |
| Period Type: |
instant |
|
| X |
- DefinitionAmount excluding accrued interest, of investment in debt security measured at fair value with change in fair value recognized in other comprehensive income (available-for-sale). Reference 1: http://www.xbrl.org/2009/role/commonPracticeRef
-Topic 326
-SubTopic 30
-Name Accounting Standards Codification
-Section 45
-Paragraph 1
-Publisher FASB
-URI https://asc.fasb.org/1943274/2147479130/326-30-45-1
| Name: |
us-gaap_DebtSecuritiesAvailableForSaleExcludingAccruedInterest |
| Namespace Prefix: |
us-gaap_ |
| Data Type: |
xbrli:monetaryItemType |
| Balance Type: |
debit |
| Period Type: |
instant |
|
| X |
- DefinitionFair value, after the effects of master netting arrangements, of a financial asset or other contract with one or more underlyings, notional amount or payment provision or both, and the contract can be net settled by means outside the contract or delivery of an asset. Includes assets not subject to a master netting arrangement and not elected to be offset. Reference 1: http://www.xbrl.org/2003/role/exampleRef
-Topic 820
-SubTopic 10
-Name Accounting Standards Codification
-Section 55
-Paragraph 103
-Publisher FASB
-URI https://asc.fasb.org/1943274/2147482078/820-10-55-103
Reference 2: http://www.xbrl.org/2003/role/exampleRef
-Topic 820
-SubTopic 10
-Name Accounting Standards Codification
-Section 55
-Paragraph 100
-Publisher FASB
-URI https://asc.fasb.org/1943274/2147482078/820-10-55-100
Reference 3: http://www.xbrl.org/2009/role/commonPracticeRef
-Topic 820
-SubTopic 10
-Name Accounting Standards Codification
-Section 50
-Paragraph 2
-Subparagraph (bbb)(2)(i)
-Publisher FASB
-URI https://asc.fasb.org/1943274/2147482106/820-10-50-2
Reference 4: http://www.xbrl.org/2009/role/commonPracticeRef
-Topic 820
-SubTopic 10
-Name Accounting Standards Codification
-Section 50
-Paragraph 2
-Subparagraph (bbb)(2)
-Publisher FASB
-URI https://asc.fasb.org/1943274/2147482106/820-10-50-2
Reference 5: http://www.xbrl.org/2009/role/commonPracticeRef
-Topic 820
-SubTopic 10
-Name Accounting Standards Codification
-Section 50
-Paragraph 2
-Subparagraph (bbb)(1)
-Publisher FASB
-URI https://asc.fasb.org/1943274/2147482106/820-10-50-2
Reference 6: http://www.xbrl.org/2003/role/disclosureRef
-Topic 820
-SubTopic 10
-Name Accounting Standards Codification
-Section 50
-Paragraph 2
-Subparagraph (b)
-Publisher FASB
-URI https://asc.fasb.org/1943274/2147482106/820-10-50-2
Reference 7: http://www.xbrl.org/2003/role/disclosureRef
-Topic 820
-SubTopic 10
-Name Accounting Standards Codification
-Section 50
-Paragraph 2
-Subparagraph (a)
-Publisher FASB
-URI https://asc.fasb.org/1943274/2147482106/820-10-50-2
Reference 8: http://www.xbrl.org/2003/role/disclosureRef
-Topic 820
-SubTopic 10
-Name Accounting Standards Codification
-Section 50
-Paragraph 3
-Subparagraph (a)
-Publisher FASB
-URI https://asc.fasb.org/1943274/2147482106/820-10-50-3
Reference 9: http://www.xbrl.org/2003/role/disclosureRef
-Topic 946
-SubTopic 210
-Name Accounting Standards Codification
-Section 50
-Paragraph 12
-Publisher FASB
-URI https://asc.fasb.org/1943274/2147478795/946-210-50-12
Reference 10: http://www.xbrl.org/2003/role/disclosureRef
-Topic 946
-SubTopic 210
-Name Accounting Standards Codification
-Section 50
-Paragraph 6
-Subparagraph (e)
-Publisher FASB
-URI https://asc.fasb.org/1943274/2147478795/946-210-50-6
Reference 11: http://www.xbrl.org/2003/role/exampleRef
-Topic 946
-SubTopic 210
-Name Accounting Standards Codification
-Section 55
-Paragraph 1
-Publisher FASB
-URI https://asc.fasb.org/1943274/2147477439/946-210-55-1
Reference 12: http://www.xbrl.org/2003/role/disclosureRef
-Topic 946
-SubTopic 210
-Name Accounting Standards Codification
-Section 50
-Paragraph 6
-Subparagraph (a)(1)
-Publisher FASB
-URI https://asc.fasb.org/1943274/2147478795/946-210-50-6
Reference 13: http://www.xbrl.org/2003/role/disclosureRef
-Topic 946
-SubTopic 210
-Name Accounting Standards Codification
-Section 50
-Paragraph 6
-Subparagraph (a)(2)
-Publisher FASB
-URI https://asc.fasb.org/1943274/2147478795/946-210-50-6
Reference 14: http://www.xbrl.org/2003/role/disclosureRef
-Topic 946
-SubTopic 210
-Name Accounting Standards Codification
-Section 50
-Paragraph 6
-Subparagraph (a)(4)
-Publisher FASB
-URI https://asc.fasb.org/1943274/2147478795/946-210-50-6
Reference 15: http://www.xbrl.org/2003/role/disclosureRef
-Topic 946
-SubTopic 210
-Name Accounting Standards Codification
-Section 50
-Paragraph 1
-Subparagraph (a)(1)
-Publisher FASB
-URI https://asc.fasb.org/1943274/2147478795/946-210-50-1
Reference 16: http://www.xbrl.org/2003/role/disclosureRef
-Topic 946
-SubTopic 210
-Name Accounting Standards Codification
-Section 50
-Paragraph 1
-Subparagraph (b)(1)
-Publisher FASB
-URI https://asc.fasb.org/1943274/2147478795/946-210-50-1
Reference 17: http://www.xbrl.org/2003/role/disclosureRef
-Topic 946
-SubTopic 210
-Name Accounting Standards Codification
-Section 50
-Paragraph 1
-Subparagraph (b)(2)
-Publisher FASB
-URI https://asc.fasb.org/1943274/2147478795/946-210-50-1
Reference 18: http://www.xbrl.org/2003/role/disclosureRef
-Topic 946
-SubTopic 210
-Name Accounting Standards Codification
-Section 50
-Paragraph 1
-Subparagraph (c)(2)
-Publisher FASB
-URI https://asc.fasb.org/1943274/2147478795/946-210-50-1
Reference 19: http://www.xbrl.org/2003/role/disclosureRef
-Topic 946
-SubTopic 210
-Name Accounting Standards Codification
-Section 50
-Paragraph 6
-Subparagraph (f)
-Publisher FASB
-URI https://asc.fasb.org/1943274/2147478795/946-210-50-6
Reference 20: http://www.xbrl.org/2009/role/commonPracticeRef
-Topic 946
-SubTopic 210
-Name Accounting Standards Codification
-Section 50
-Paragraph 6
-Subparagraph (a)(3)
-Publisher FASB
-URI https://asc.fasb.org/1943274/2147478795/946-210-50-6
Reference 21: http://www.xbrl.org/2003/role/disclosureRef
-Topic 946
-SubTopic 210
-Name Accounting Standards Codification
-Section S99
-Paragraph 1
-Subparagraph (SX 210.6-04(3)(c))
-Publisher FASB
-URI https://asc.fasb.org/1943274/2147479170/946-210-S99-1
Reference 22: http://www.xbrl.org/2003/role/disclosureRef
-Topic 946
-SubTopic 320
-Name Accounting Standards Codification
-Section S99
-Paragraph 5C
-Subparagraph (SX 210.12-13C(Column H)(Footnote 7))
-Publisher FASB
-URI https://asc.fasb.org/1943274/2147477271/946-320-S99-5C
Reference 23: http://www.xbrl.org/2003/role/disclosureRef
-Topic 946
-SubTopic 210
-Name Accounting Standards Codification
-Section S99
-Paragraph 1
-Subparagraph (SX 210.6-04(3)(b))
-Publisher FASB
-URI https://asc.fasb.org/1943274/2147479170/946-210-S99-1
Reference 24: http://www.xbrl.org/2003/role/disclosureRef
-Topic 946
-SubTopic 320
-Name Accounting Standards Codification
-Section S99
-Paragraph 5
-Subparagraph (SX 210.12-13(Column A)(Footnote 3))
-Publisher FASB
-URI https://asc.fasb.org/1943274/2147477271/946-320-S99-5
Reference 25: http://www.xbrl.org/2003/role/disclosureRef
-Topic 946
-SubTopic 320
-Name Accounting Standards Codification
-Section S99
-Paragraph 5C
-Subparagraph (SX 210.12-13C(Column H))
-Publisher FASB
-URI https://asc.fasb.org/1943274/2147477271/946-320-S99-5C
Reference 26: http://www.xbrl.org/2003/role/disclosureRef
-Topic 946
-SubTopic 320
-Name Accounting Standards Codification
-Section S99
-Paragraph 5A
-Subparagraph (SX 210.12-13A(Column E))
-Publisher FASB
-URI https://asc.fasb.org/1943274/2147477271/946-320-S99-5A
Reference 27: http://www.xbrl.org/2003/role/disclosureRef
-Topic 946
-SubTopic 320
-Name Accounting Standards Codification
-Section S99
-Paragraph 5B
-Subparagraph (SX 210.12-13B(Column E))
-Publisher FASB
-URI https://asc.fasb.org/1943274/2147477271/946-320-S99-5B
Reference 28: http://www.xbrl.org/2003/role/disclosureRef
-Topic 946
-SubTopic 320
-Name Accounting Standards Codification
-Section S99
-Paragraph 5B
-Subparagraph (SX 210.12-13B(Column E)(Footnote 4))
-Publisher FASB
-URI https://asc.fasb.org/1943274/2147477271/946-320-S99-5B
Reference 29: http://www.xbrl.org/2003/role/disclosureRef
-Topic 210
-SubTopic 20
-Name Accounting Standards Codification
-Section 50
-Paragraph 3
-Subparagraph (c)
-Publisher FASB
-URI https://asc.fasb.org/1943274/2147483466/210-20-50-3
Reference 30: http://www.xbrl.org/2003/role/exampleRef
-Topic 210
-SubTopic 20
-Name Accounting Standards Codification
-Section 55
-Paragraph 22
-Publisher FASB
-URI https://asc.fasb.org/1943274/2147483444/210-20-55-22
Reference 31: http://www.xbrl.org/2003/role/disclosureRef
-Topic 210
-SubTopic 20
-Name Accounting Standards Codification
-Section 55
-Paragraph 10
-Publisher FASB
-URI https://asc.fasb.org/1943274/2147483444/210-20-55-10
Reference 32: http://www.xbrl.org/2003/role/disclosureRef
-Topic 825
-SubTopic 10
-Name Accounting Standards Codification
-Section 50
-Paragraph 10
-Publisher FASB
-URI https://asc.fasb.org/1943274/2147482907/825-10-50-10
| Name: |
us-gaap_DerivativeAssets |
| Namespace Prefix: |
us-gaap_ |
| Data Type: |
xbrli:monetaryItemType |
| Balance Type: |
debit |
| Period Type: |
instant |
|
| X |
- DefinitionFair value portion of investment securities, including, but not limited to, marketable securities, derivative financial instruments, and investments accounted for under the equity method. Reference 1: http://www.xbrl.org/2009/role/commonPracticeRef
-Topic 820
-SubTopic 10
-Name Accounting Standards Codification
-Section 50
-Paragraph 2E
-Publisher FASB
-URI https://asc.fasb.org/1943274/2147482106/820-10-50-2E
Reference 2: http://www.xbrl.org/2009/role/commonPracticeRef
-Topic 820
-SubTopic 10
-Name Accounting Standards Codification
-Section 50
-Paragraph 2
-Subparagraph (b)
-Publisher FASB
-URI https://asc.fasb.org/1943274/2147482106/820-10-50-2
Reference 3: http://www.xbrl.org/2009/role/commonPracticeRef
-Topic 820
-SubTopic 10
-Name Accounting Standards Codification
-Section 50
-Paragraph 2
-Subparagraph (a)
-Publisher FASB
-URI https://asc.fasb.org/1943274/2147482106/820-10-50-2
| Name: |
us-gaap_InvestmentsFairValueDisclosure |
| Namespace Prefix: |
us-gaap_ |
| Data Type: |
xbrli:monetaryItemType |
| Balance Type: |
debit |
| Period Type: |
instant |
|
| X |
- Details
| Name: |
us-gaap_FinancialInstrumentAxis=us-gaap_CashEquivalentsMember |
| Namespace Prefix: |
|
| Data Type: |
na |
| Balance Type: |
|
| Period Type: |
|
|
| X |
- Details
| Name: |
us-gaap_FinancialInstrumentAxis=pega_InvestmentsInPrivatelyHeldCompaniesMember |
| Namespace Prefix: |
|
| Data Type: |
na |
| Balance Type: |
|
| Period Type: |
|
|
v3.24.2
FAIR VALUE MEASUREMENTS - Schedule of Changes in Venture Investments (Details) - Privately Held Investment - USD ($)
$ in Thousands |
6 Months Ended |
Jun. 30, 2024 |
Jun. 30, 2023 |
| Fair Value, Assets Measured on Recurring Basis, Unobservable Input Reconciliation, Calculation [Roll Forward] |
|
|
| Beginning balance |
$ 19,450
|
$ 13,069
|
| New investments |
350
|
400
|
| Sales of investments |
0
|
(2,773)
|
| Changes in foreign exchange rates |
(19)
|
119
|
| Changes in fair value: |
|
|
| included in other income, net |
1,628
|
4,475
|
| included in other comprehensive income (loss) |
(362)
|
(1,908)
|
| Ending balance |
$ 21,047
|
$ 13,382
|
| X |
- Details
| Name: |
us-gaap_FairValueByAssetClassAxis=pega_PrivatelyHeldInvestmentMember |
| Namespace Prefix: |
|
| Data Type: |
na |
| Balance Type: |
|
| Period Type: |
|
|
v3.24.2
| X |
- DefinitionFair value portion of borrowing which can be exchanged for a specified number of another security at the option of the issuer or the holder, for example, but not limited to, the entity's common stock. Reference 1: http://www.xbrl.org/2009/role/commonPracticeRef
-Topic 820
-SubTopic 10
-Name Accounting Standards Codification
-Section 50
-Paragraph 2E
-Publisher FASB
-URI https://asc.fasb.org/1943274/2147482106/820-10-50-2E
Reference 2: http://www.xbrl.org/2009/role/commonPracticeRef
-Topic 820
-SubTopic 10
-Name Accounting Standards Codification
-Section 50
-Paragraph 2
-Subparagraph (b)
-Publisher FASB
-URI https://asc.fasb.org/1943274/2147482106/820-10-50-2
Reference 3: http://www.xbrl.org/2009/role/commonPracticeRef
-Topic 820
-SubTopic 10
-Name Accounting Standards Codification
-Section 50
-Paragraph 2
-Subparagraph (bbb)(2)(i)
-Publisher FASB
-URI https://asc.fasb.org/1943274/2147482106/820-10-50-2
Reference 4: http://www.xbrl.org/2009/role/commonPracticeRef
-Topic 820
-SubTopic 10
-Name Accounting Standards Codification
-Section 50
-Paragraph 2
-Subparagraph (bbb)(2)
-Publisher FASB
-URI https://asc.fasb.org/1943274/2147482106/820-10-50-2
Reference 5: http://www.xbrl.org/2009/role/commonPracticeRef
-Topic 820
-SubTopic 10
-Name Accounting Standards Codification
-Section 50
-Paragraph 2
-Subparagraph (bbb)(1)
-Publisher FASB
-URI https://asc.fasb.org/1943274/2147482106/820-10-50-2
| Name: |
us-gaap_ConvertibleDebtFairValueDisclosures |
| Namespace Prefix: |
us-gaap_ |
| Data Type: |
xbrli:monetaryItemType |
| Balance Type: |
credit |
| Period Type: |
instant |
|
| X |
- References
+ Details
| Name: |
us-gaap_FairValueDisclosuresAbstract |
| Namespace Prefix: |
us-gaap_ |
| Data Type: |
xbrli:stringItemType |
| Balance Type: |
na |
| Period Type: |
duration |
|
v3.24.2
REVENUE - Schedule of Geographic Revenue (Details) - USD ($)
$ in Thousands |
3 Months Ended |
6 Months Ended |
Jun. 30, 2024 |
Jun. 30, 2023 |
Jun. 30, 2024 |
Jun. 30, 2023 |
| Disaggregation of Revenue [Line Items] |
|
|
|
|
| Revenue |
$ 351,153
|
$ 298,268
|
$ 681,300
|
$ 623,740
|
| Percent of total revenue |
|
|
100.00%
|
100.00%
|
| U.S. |
|
|
|
|
| Disaggregation of Revenue [Line Items] |
|
|
|
|
| Revenue |
189,214
|
150,385
|
$ 370,197
|
$ 334,904
|
| Other Americas |
|
|
|
|
| Disaggregation of Revenue [Line Items] |
|
|
|
|
| Revenue |
21,314
|
19,505
|
43,100
|
34,516
|
| United Kingdom (“U.K.”) |
|
|
|
|
| Disaggregation of Revenue [Line Items] |
|
|
|
|
| Revenue |
38,628
|
28,892
|
70,745
|
71,129
|
| Europe (excluding U.K.), Middle East, and Africa |
|
|
|
|
| Disaggregation of Revenue [Line Items] |
|
|
|
|
| Revenue |
53,360
|
54,353
|
115,207
|
105,671
|
| Asia-Pacific |
|
|
|
|
| Disaggregation of Revenue [Line Items] |
|
|
|
|
| Revenue |
$ 48,637
|
$ 45,133
|
$ 82,051
|
$ 77,520
|
| Total Revenue | Geographic Concentration Risk |
|
|
|
|
| Disaggregation of Revenue [Line Items] |
|
|
|
|
| Percent of total revenue |
100.00%
|
100.00%
|
|
|
| Total Revenue | U.S. | Geographic Concentration Risk |
|
|
|
|
| Disaggregation of Revenue [Line Items] |
|
|
|
|
| Percent of total revenue |
54.00%
|
50.00%
|
55.00%
|
54.00%
|
| Total Revenue | Other Americas | Geographic Concentration Risk |
|
|
|
|
| Disaggregation of Revenue [Line Items] |
|
|
|
|
| Percent of total revenue |
6.00%
|
7.00%
|
6.00%
|
6.00%
|
| Total Revenue | United Kingdom (“U.K.”) | Geographic Concentration Risk |
|
|
|
|
| Disaggregation of Revenue [Line Items] |
|
|
|
|
| Percent of total revenue |
11.00%
|
10.00%
|
10.00%
|
11.00%
|
| Total Revenue | Europe (excluding U.K.), Middle East, and Africa | Geographic Concentration Risk |
|
|
|
|
| Disaggregation of Revenue [Line Items] |
|
|
|
|
| Percent of total revenue |
15.00%
|
18.00%
|
17.00%
|
17.00%
|
| Total Revenue | Asia-Pacific | Geographic Concentration Risk |
|
|
|
|
| Disaggregation of Revenue [Line Items] |
|
|
|
|
| Percent of total revenue |
14.00%
|
15.00%
|
12.00%
|
12.00%
|
| X |
- DefinitionFor an entity that discloses a concentration risk in relation to quantitative amount, which serves as the "benchmark" (or denominator) in the equation, this concept represents the concentration percentage derived from the division. Reference 1: http://www.xbrl.org/2003/role/disclosureRef
-Topic 280
-SubTopic 10
-Name Accounting Standards Codification
-Section 50
-Paragraph 42
-Publisher FASB
-URI https://asc.fasb.org/1943274/2147482810/280-10-50-42
Reference 2: http://fasb.org/us-gaap/role/ref/legacyRef
-Name Accounting Standards Codification
-Topic 825
-SubTopic 10
-Section 50
-Paragraph 21
-Subparagraph (a)
-Publisher FASB
-URI https://asc.fasb.org/1943274/2147482907/825-10-50-21
Reference 3: http://fasb.org/us-gaap/role/ref/legacyRef
-Name Accounting Standards Codification
-Topic 825
-SubTopic 10
-Section 50
-Paragraph 20
-Publisher FASB
-URI https://asc.fasb.org/1943274/2147482907/825-10-50-20
Reference 4: http://fasb.org/us-gaap/role/ref/legacyRef
-Name Accounting Standards Codification
-Topic 275
-SubTopic 10
-Section 50
-Paragraph 18
-Publisher FASB
-URI https://asc.fasb.org/1943274/2147482861/275-10-50-18
Reference 5: http://fasb.org/us-gaap/role/ref/legacyRef
-Name Accounting Standards Codification
-Topic 275
-SubTopic 10
-Section 50
-Paragraph 20
-Publisher FASB
-URI https://asc.fasb.org/1943274/2147482861/275-10-50-20
| Name: |
us-gaap_ConcentrationRiskPercentage1 |
| Namespace Prefix: |
us-gaap_ |
| Data Type: |
dtr-types:percentItemType |
| Balance Type: |
na |
| Period Type: |
duration |
|
| X |
- DefinitionLine items represent financial concepts included in a table. These concepts are used to disclose reportable information associated with domain members defined in one or many axes to the table. Reference 1: http://www.xbrl.org/2003/role/disclosureRef
-Topic 606
-SubTopic 10
-Name Accounting Standards Codification
-Section 50
-Paragraph 5
-Publisher FASB
-URI https://asc.fasb.org/1943274/2147479806/606-10-50-5
Reference 2: http://www.xbrl.org/2003/role/exampleRef
-Topic 606
-SubTopic 10
-Name Accounting Standards Codification
-Section 55
-Paragraph 91
-Subparagraph (a)
-Publisher FASB
-URI https://asc.fasb.org/1943274/2147479777/606-10-55-91
Reference 3: http://www.xbrl.org/2003/role/exampleRef
-Topic 606
-SubTopic 10
-Name Accounting Standards Codification
-Section 55
-Paragraph 91
-Subparagraph (b)
-Publisher FASB
-URI https://asc.fasb.org/1943274/2147479777/606-10-55-91
Reference 4: http://www.xbrl.org/2003/role/exampleRef
-Topic 606
-SubTopic 10
-Name Accounting Standards Codification
-Section 55
-Paragraph 91
-Subparagraph (c)
-Publisher FASB
-URI https://asc.fasb.org/1943274/2147479777/606-10-55-91
Reference 5: http://www.xbrl.org/2003/role/exampleRef
-Topic 606
-SubTopic 10
-Name Accounting Standards Codification
-Section 55
-Paragraph 91
-Subparagraph (d)
-Publisher FASB
-URI https://asc.fasb.org/1943274/2147479777/606-10-55-91
Reference 6: http://www.xbrl.org/2003/role/exampleRef
-Topic 606
-SubTopic 10
-Name Accounting Standards Codification
-Section 55
-Paragraph 91
-Subparagraph (e)
-Publisher FASB
-URI https://asc.fasb.org/1943274/2147479777/606-10-55-91
Reference 7: http://www.xbrl.org/2003/role/exampleRef
-Topic 606
-SubTopic 10
-Name Accounting Standards Codification
-Section 55
-Paragraph 91
-Subparagraph (f)
-Publisher FASB
-URI https://asc.fasb.org/1943274/2147479777/606-10-55-91
Reference 8: http://www.xbrl.org/2003/role/exampleRef
-Topic 606
-SubTopic 10
-Name Accounting Standards Codification
-Section 55
-Paragraph 91
-Subparagraph (g)
-Publisher FASB
-URI https://asc.fasb.org/1943274/2147479777/606-10-55-91
| Name: |
us-gaap_DisaggregationOfRevenueLineItems |
| Namespace Prefix: |
us-gaap_ |
| Data Type: |
xbrli:stringItemType |
| Balance Type: |
na |
| Period Type: |
duration |
|
| X |
- DefinitionAmount, excluding tax collected from customer, of revenue from satisfaction of performance obligation by transferring promised good or service to customer. Tax collected from customer is tax assessed by governmental authority that is both imposed on and concurrent with specific revenue-producing transaction, including, but not limited to, sales, use, value added and excise. Reference 1: http://www.xbrl.org/2003/role/disclosureRef
-Topic 280
-SubTopic 10
-Name Accounting Standards Codification
-Section 50
-Paragraph 41
-Subparagraph (a)
-Publisher FASB
-URI https://asc.fasb.org/1943274/2147482810/280-10-50-41
Reference 2: http://www.xbrl.org/2003/role/disclosureRef
-Topic 270
-SubTopic 10
-Name Accounting Standards Codification
-Section 50
-Paragraph 1
-Subparagraph (i)
-Publisher FASB
-URI https://asc.fasb.org/1943274/2147482964/270-10-50-1
Reference 3: http://www.xbrl.org/2003/role/disclosureRef
-Topic 280
-SubTopic 10
-Name Accounting Standards Codification
-Section 50
-Paragraph 32
-Subparagraph (ee)
-Publisher FASB
-URI https://asc.fasb.org/1943274/2147482810/280-10-50-32
Reference 4: http://fasb.org/us-gaap/role/ref/otherTransitionRef
-Topic 280
-SubTopic 10
-Name Accounting Standards Codification
-Section 50
-Paragraph 32
-Subparagraph (b)
-Publisher FASB
-URI https://asc.fasb.org/1943274/2147482810/280-10-50-32
Reference 5: http://fasb.org/us-gaap/role/ref/otherTransitionRef
-Topic 280
-SubTopic 10
-Name Accounting Standards Codification
-Section 50
-Paragraph 32
-Subparagraph (a)
-Publisher FASB
-URI https://asc.fasb.org/1943274/2147482810/280-10-50-32
Reference 6: http://www.xbrl.org/2003/role/disclosureRef
-Topic 924
-SubTopic 10
-Name Accounting Standards Codification
-Section S99
-Paragraph 1
-Subparagraph (SAB Topic 11.L)
-Publisher FASB
-URI https://asc.fasb.org/1943274/2147479941/924-10-S99-1
Reference 7: http://www.xbrl.org/2003/role/disclosureRef
-Topic 606
-SubTopic 10
-Name Accounting Standards Codification
-Section 50
-Paragraph 5
-Publisher FASB
-URI https://asc.fasb.org/1943274/2147479806/606-10-50-5
Reference 8: http://www.xbrl.org/2003/role/disclosureRef
-Topic 280
-SubTopic 10
-Name Accounting Standards Codification
-Section 50
-Paragraph 30
-Subparagraph (a)
-Publisher FASB
-URI https://asc.fasb.org/1943274/2147482810/280-10-50-30
Reference 9: http://www.xbrl.org/2003/role/disclosureRef
-Topic 280
-SubTopic 10
-Name Accounting Standards Codification
-Section 50
-Paragraph 42
-Publisher FASB
-URI https://asc.fasb.org/1943274/2147482810/280-10-50-42
Reference 10: http://www.xbrl.org/2003/role/disclosureRef
-Topic 280
-SubTopic 10
-Name Accounting Standards Codification
-Section 50
-Paragraph 22
-Subparagraph (b)
-Publisher FASB
-URI https://asc.fasb.org/1943274/2147482810/280-10-50-22
Reference 11: http://www.xbrl.org/2003/role/disclosureRef
-Topic 280
-SubTopic 10
-Name Accounting Standards Codification
-Section 50
-Paragraph 40
-Publisher FASB
-URI https://asc.fasb.org/1943274/2147482810/280-10-50-40
Reference 12: http://www.xbrl.org/2003/role/disclosureRef
-Topic 280
-SubTopic 10
-Name Accounting Standards Codification
-Section 50
-Paragraph 22
-Subparagraph (a)
-Publisher FASB
-URI https://asc.fasb.org/1943274/2147482810/280-10-50-22
Reference 13: http://www.xbrl.org/2003/role/disclosureRef
-Topic 606
-SubTopic 10
-Name Accounting Standards Codification
-Section 50
-Paragraph 4
-Subparagraph (a)
-Publisher FASB
-URI https://asc.fasb.org/1943274/2147479806/606-10-50-4
| Name: |
us-gaap_RevenueFromContractWithCustomerExcludingAssessedTax |
| Namespace Prefix: |
us-gaap_ |
| Data Type: |
xbrli:monetaryItemType |
| Balance Type: |
credit |
| Period Type: |
duration |
|
| X |
- Details
| Name: |
srt_StatementGeographicalAxis=country_US |
| Namespace Prefix: |
|
| Data Type: |
na |
| Balance Type: |
|
| Period Type: |
|
|
| X |
- Details
| Name: |
srt_StatementGeographicalAxis=pega_OtherAmericasMember |
| Namespace Prefix: |
|
| Data Type: |
na |
| Balance Type: |
|
| Period Type: |
|
|
| X |
- Details
| Name: |
srt_StatementGeographicalAxis=country_GB |
| Namespace Prefix: |
|
| Data Type: |
na |
| Balance Type: |
|
| Period Type: |
|
|
| X |
- Details
| Name: |
srt_StatementGeographicalAxis=us-gaap_EMEAMember |
| Namespace Prefix: |
|
| Data Type: |
na |
| Balance Type: |
|
| Period Type: |
|
|
| X |
- Details
| Name: |
srt_StatementGeographicalAxis=srt_AsiaPacificMember |
| Namespace Prefix: |
|
| Data Type: |
na |
| Balance Type: |
|
| Period Type: |
|
|
| X |
- Details
| Name: |
us-gaap_ConcentrationRiskByBenchmarkAxis=us-gaap_SalesRevenueNetMember |
| Namespace Prefix: |
|
| Data Type: |
na |
| Balance Type: |
|
| Period Type: |
|
|
| X |
- Details
| Name: |
us-gaap_ConcentrationRiskByTypeAxis=us-gaap_GeographicConcentrationRiskMember |
| Namespace Prefix: |
|
| Data Type: |
na |
| Balance Type: |
|
| Period Type: |
|
|
v3.24.2
REVENUE - Schedule of Revenue Streams (Details) - USD ($)
$ in Thousands |
3 Months Ended |
6 Months Ended |
Jun. 30, 2024 |
Jun. 30, 2023 |
Jun. 30, 2024 |
Jun. 30, 2023 |
| Disaggregation of Revenue [Line Items] |
|
|
|
|
| Revenue |
$ 351,153
|
$ 298,268
|
$ 681,300
|
$ 623,740
|
| Subscription license |
|
|
|
|
| Disaggregation of Revenue [Line Items] |
|
|
|
|
| Revenue |
84,647
|
41,197
|
147,985
|
125,724
|
| Perpetual license |
|
|
|
|
| Disaggregation of Revenue [Line Items] |
|
|
|
|
| Revenue |
36
|
1,579
|
895
|
1,982
|
| Maintenance |
|
|
|
|
| Disaggregation of Revenue [Line Items] |
|
|
|
|
| Revenue |
80,344
|
82,042
|
|
|
| Pega Cloud |
|
|
|
|
| Disaggregation of Revenue [Line Items] |
|
|
|
|
| Revenue |
134,086
|
115,063
|
|
|
| Consulting |
|
|
|
|
| Disaggregation of Revenue [Line Items] |
|
|
|
|
| Revenue |
52,040
|
58,387
|
106,087
|
111,420
|
| Subscription services |
|
|
|
|
| Disaggregation of Revenue [Line Items] |
|
|
|
|
| Revenue |
214,430
|
197,105
|
426,333
|
384,614
|
| Subscription |
|
|
|
|
| Disaggregation of Revenue [Line Items] |
|
|
|
|
| Revenue |
299,077
|
238,302
|
574,318
|
510,338
|
| Revenue recognized at a point in time |
|
|
|
|
| Disaggregation of Revenue [Line Items] |
|
|
|
|
| Revenue |
84,683
|
42,776
|
148,880
|
127,706
|
| Revenue recognized at a point in time | Subscription license |
|
|
|
|
| Disaggregation of Revenue [Line Items] |
|
|
|
|
| Revenue |
84,647
|
41,197
|
147,985
|
125,724
|
| Revenue recognized at a point in time | Perpetual license |
|
|
|
|
| Disaggregation of Revenue [Line Items] |
|
|
|
|
| Revenue |
36
|
1,579
|
895
|
1,982
|
| Revenue recognized at a point in time | Consulting |
|
|
|
|
| Disaggregation of Revenue [Line Items] |
|
|
|
|
| Revenue |
|
|
106,087
|
111,420
|
| Revenue recognized over time |
|
|
|
|
| Disaggregation of Revenue [Line Items] |
|
|
|
|
| Revenue |
266,470
|
255,492
|
532,420
|
496,034
|
| Revenue recognized over time | Perpetual license |
|
|
|
|
| Disaggregation of Revenue [Line Items] |
|
|
|
|
| Revenue |
|
|
895
|
1,982
|
| Revenue recognized over time | Maintenance |
|
|
|
|
| Disaggregation of Revenue [Line Items] |
|
|
|
|
| Revenue |
80,344
|
82,042
|
161,345
|
161,672
|
| Revenue recognized over time | Pega Cloud |
|
|
|
|
| Disaggregation of Revenue [Line Items] |
|
|
|
|
| Revenue |
134,086
|
115,063
|
264,988
|
222,942
|
| Revenue recognized over time | Consulting |
|
|
|
|
| Disaggregation of Revenue [Line Items] |
|
|
|
|
| Revenue |
$ 52,040
|
$ 58,387
|
$ 106,087
|
$ 111,420
|
| X |
- DefinitionLine items represent financial concepts included in a table. These concepts are used to disclose reportable information associated with domain members defined in one or many axes to the table. Reference 1: http://www.xbrl.org/2003/role/disclosureRef
-Topic 606
-SubTopic 10
-Name Accounting Standards Codification
-Section 50
-Paragraph 5
-Publisher FASB
-URI https://asc.fasb.org/1943274/2147479806/606-10-50-5
Reference 2: http://www.xbrl.org/2003/role/exampleRef
-Topic 606
-SubTopic 10
-Name Accounting Standards Codification
-Section 55
-Paragraph 91
-Subparagraph (a)
-Publisher FASB
-URI https://asc.fasb.org/1943274/2147479777/606-10-55-91
Reference 3: http://www.xbrl.org/2003/role/exampleRef
-Topic 606
-SubTopic 10
-Name Accounting Standards Codification
-Section 55
-Paragraph 91
-Subparagraph (b)
-Publisher FASB
-URI https://asc.fasb.org/1943274/2147479777/606-10-55-91
Reference 4: http://www.xbrl.org/2003/role/exampleRef
-Topic 606
-SubTopic 10
-Name Accounting Standards Codification
-Section 55
-Paragraph 91
-Subparagraph (c)
-Publisher FASB
-URI https://asc.fasb.org/1943274/2147479777/606-10-55-91
Reference 5: http://www.xbrl.org/2003/role/exampleRef
-Topic 606
-SubTopic 10
-Name Accounting Standards Codification
-Section 55
-Paragraph 91
-Subparagraph (d)
-Publisher FASB
-URI https://asc.fasb.org/1943274/2147479777/606-10-55-91
Reference 6: http://www.xbrl.org/2003/role/exampleRef
-Topic 606
-SubTopic 10
-Name Accounting Standards Codification
-Section 55
-Paragraph 91
-Subparagraph (e)
-Publisher FASB
-URI https://asc.fasb.org/1943274/2147479777/606-10-55-91
Reference 7: http://www.xbrl.org/2003/role/exampleRef
-Topic 606
-SubTopic 10
-Name Accounting Standards Codification
-Section 55
-Paragraph 91
-Subparagraph (f)
-Publisher FASB
-URI https://asc.fasb.org/1943274/2147479777/606-10-55-91
Reference 8: http://www.xbrl.org/2003/role/exampleRef
-Topic 606
-SubTopic 10
-Name Accounting Standards Codification
-Section 55
-Paragraph 91
-Subparagraph (g)
-Publisher FASB
-URI https://asc.fasb.org/1943274/2147479777/606-10-55-91
| Name: |
us-gaap_DisaggregationOfRevenueLineItems |
| Namespace Prefix: |
us-gaap_ |
| Data Type: |
xbrli:stringItemType |
| Balance Type: |
na |
| Period Type: |
duration |
|
| X |
- DefinitionAmount, excluding tax collected from customer, of revenue from satisfaction of performance obligation by transferring promised good or service to customer. Tax collected from customer is tax assessed by governmental authority that is both imposed on and concurrent with specific revenue-producing transaction, including, but not limited to, sales, use, value added and excise. Reference 1: http://www.xbrl.org/2003/role/disclosureRef
-Topic 280
-SubTopic 10
-Name Accounting Standards Codification
-Section 50
-Paragraph 41
-Subparagraph (a)
-Publisher FASB
-URI https://asc.fasb.org/1943274/2147482810/280-10-50-41
Reference 2: http://www.xbrl.org/2003/role/disclosureRef
-Topic 270
-SubTopic 10
-Name Accounting Standards Codification
-Section 50
-Paragraph 1
-Subparagraph (i)
-Publisher FASB
-URI https://asc.fasb.org/1943274/2147482964/270-10-50-1
Reference 3: http://www.xbrl.org/2003/role/disclosureRef
-Topic 280
-SubTopic 10
-Name Accounting Standards Codification
-Section 50
-Paragraph 32
-Subparagraph (ee)
-Publisher FASB
-URI https://asc.fasb.org/1943274/2147482810/280-10-50-32
Reference 4: http://fasb.org/us-gaap/role/ref/otherTransitionRef
-Topic 280
-SubTopic 10
-Name Accounting Standards Codification
-Section 50
-Paragraph 32
-Subparagraph (b)
-Publisher FASB
-URI https://asc.fasb.org/1943274/2147482810/280-10-50-32
Reference 5: http://fasb.org/us-gaap/role/ref/otherTransitionRef
-Topic 280
-SubTopic 10
-Name Accounting Standards Codification
-Section 50
-Paragraph 32
-Subparagraph (a)
-Publisher FASB
-URI https://asc.fasb.org/1943274/2147482810/280-10-50-32
Reference 6: http://www.xbrl.org/2003/role/disclosureRef
-Topic 924
-SubTopic 10
-Name Accounting Standards Codification
-Section S99
-Paragraph 1
-Subparagraph (SAB Topic 11.L)
-Publisher FASB
-URI https://asc.fasb.org/1943274/2147479941/924-10-S99-1
Reference 7: http://www.xbrl.org/2003/role/disclosureRef
-Topic 606
-SubTopic 10
-Name Accounting Standards Codification
-Section 50
-Paragraph 5
-Publisher FASB
-URI https://asc.fasb.org/1943274/2147479806/606-10-50-5
Reference 8: http://www.xbrl.org/2003/role/disclosureRef
-Topic 280
-SubTopic 10
-Name Accounting Standards Codification
-Section 50
-Paragraph 30
-Subparagraph (a)
-Publisher FASB
-URI https://asc.fasb.org/1943274/2147482810/280-10-50-30
Reference 9: http://www.xbrl.org/2003/role/disclosureRef
-Topic 280
-SubTopic 10
-Name Accounting Standards Codification
-Section 50
-Paragraph 42
-Publisher FASB
-URI https://asc.fasb.org/1943274/2147482810/280-10-50-42
Reference 10: http://www.xbrl.org/2003/role/disclosureRef
-Topic 280
-SubTopic 10
-Name Accounting Standards Codification
-Section 50
-Paragraph 22
-Subparagraph (b)
-Publisher FASB
-URI https://asc.fasb.org/1943274/2147482810/280-10-50-22
Reference 11: http://www.xbrl.org/2003/role/disclosureRef
-Topic 280
-SubTopic 10
-Name Accounting Standards Codification
-Section 50
-Paragraph 40
-Publisher FASB
-URI https://asc.fasb.org/1943274/2147482810/280-10-50-40
Reference 12: http://www.xbrl.org/2003/role/disclosureRef
-Topic 280
-SubTopic 10
-Name Accounting Standards Codification
-Section 50
-Paragraph 22
-Subparagraph (a)
-Publisher FASB
-URI https://asc.fasb.org/1943274/2147482810/280-10-50-22
Reference 13: http://www.xbrl.org/2003/role/disclosureRef
-Topic 606
-SubTopic 10
-Name Accounting Standards Codification
-Section 50
-Paragraph 4
-Subparagraph (a)
-Publisher FASB
-URI https://asc.fasb.org/1943274/2147479806/606-10-50-4
| Name: |
us-gaap_RevenueFromContractWithCustomerExcludingAssessedTax |
| Namespace Prefix: |
us-gaap_ |
| Data Type: |
xbrli:monetaryItemType |
| Balance Type: |
credit |
| Period Type: |
duration |
|
| X |
- Details
| Name: |
srt_ProductOrServiceAxis=pega_SubscriptionLicenseMember |
| Namespace Prefix: |
|
| Data Type: |
na |
| Balance Type: |
|
| Period Type: |
|
|
| X |
- Details
| Name: |
srt_ProductOrServiceAxis=pega_PerpetualLicenseMember |
| Namespace Prefix: |
|
| Data Type: |
na |
| Balance Type: |
|
| Period Type: |
|
|
| X |
- Details
| Name: |
srt_ProductOrServiceAxis=us-gaap_MaintenanceMember |
| Namespace Prefix: |
|
| Data Type: |
na |
| Balance Type: |
|
| Period Type: |
|
|
| X |
- Details
| Name: |
srt_ProductOrServiceAxis=pega_PegaCloudMember |
| Namespace Prefix: |
|
| Data Type: |
na |
| Balance Type: |
|
| Period Type: |
|
|
| X |
- Details
| Name: |
srt_ProductOrServiceAxis=pega_ConsultingMember |
| Namespace Prefix: |
|
| Data Type: |
na |
| Balance Type: |
|
| Period Type: |
|
|
| X |
- Details
| Name: |
srt_ProductOrServiceAxis=pega_SubscriptionServicesMember |
| Namespace Prefix: |
|
| Data Type: |
na |
| Balance Type: |
|
| Period Type: |
|
|
| X |
- Details
| Name: |
srt_ProductOrServiceAxis=pega_SubscriptionMember |
| Namespace Prefix: |
|
| Data Type: |
na |
| Balance Type: |
|
| Period Type: |
|
|
| X |
- Details
| Name: |
us-gaap_TimingOfTransferOfGoodOrServiceAxis=us-gaap_TransferredAtPointInTimeMember |
| Namespace Prefix: |
|
| Data Type: |
na |
| Balance Type: |
|
| Period Type: |
|
|
| X |
- Details
| Name: |
us-gaap_TimingOfTransferOfGoodOrServiceAxis=us-gaap_TransferredOverTimeMember |
| Namespace Prefix: |
|
| Data Type: |
na |
| Balance Type: |
|
| Period Type: |
|
|
v3.24.2
REVENUE - Schedule of Remaining Performance Obligations (Details) - USD ($)
$ in Thousands |
Jun. 30, 2024 |
Jun. 30, 2023 |
| Disaggregation of Revenue [Line Items] |
|
|
| Revenue remaining performance obligation |
$ 1,406,249
|
$ 1,266,096
|
| Revenue remaining performance obligation (in percent) |
100.00%
|
100.00%
|
| Revenue, Remaining Performance Obligation, Expected Timing of Satisfaction, Start Date [Axis]: 2023-07-01 |
|
|
| Disaggregation of Revenue [Line Items] |
|
|
| Revenue remaining performance obligation |
|
$ 689,712
|
| Revenue remaining performance obligation (in percent) |
|
55.00%
|
| Expected timing of satisfaction |
|
1 year
|
| Revenue, Remaining Performance Obligation, Expected Timing of Satisfaction, Start Date [Axis]: 2024-07-01 |
|
|
| Disaggregation of Revenue [Line Items] |
|
|
| Revenue remaining performance obligation |
$ 732,614
|
$ 309,292
|
| Revenue remaining performance obligation (in percent) |
52.00%
|
24.00%
|
| Expected timing of satisfaction |
1 year
|
1 year
|
| Revenue, Remaining Performance Obligation, Expected Timing of Satisfaction, Start Date [Axis]: 2025-07-01 |
|
|
| Disaggregation of Revenue [Line Items] |
|
|
| Revenue remaining performance obligation |
$ 376,883
|
$ 158,006
|
| Revenue remaining performance obligation (in percent) |
27.00%
|
12.00%
|
| Expected timing of satisfaction |
1 year
|
1 year
|
| Revenue, Remaining Performance Obligation, Expected Timing of Satisfaction, Start Date [Axis]: 2026-07-01 |
|
|
| Disaggregation of Revenue [Line Items] |
|
|
| Revenue remaining performance obligation |
$ 188,228
|
$ 109,086
|
| Revenue remaining performance obligation (in percent) |
13.00%
|
9.00%
|
| Expected timing of satisfaction |
1 year
|
|
| Revenue, Remaining Performance Obligation, Expected Timing of Satisfaction, Start Date [Axis]: 2027-07-01 |
|
|
| Disaggregation of Revenue [Line Items] |
|
|
| Revenue remaining performance obligation |
$ 108,524
|
|
| Revenue remaining performance obligation (in percent) |
8.00%
|
|
| Expected timing of satisfaction |
|
|
| Pega Cloud |
|
|
| Disaggregation of Revenue [Line Items] |
|
|
| Revenue remaining performance obligation |
$ 1,014,762
|
$ 861,984
|
| Pega Cloud | Revenue, Remaining Performance Obligation, Expected Timing of Satisfaction, Start Date [Axis]: 2023-07-01 |
|
|
| Disaggregation of Revenue [Line Items] |
|
|
| Revenue remaining performance obligation |
|
$ 397,183
|
| Expected timing of satisfaction |
|
1 year
|
| Pega Cloud | Revenue, Remaining Performance Obligation, Expected Timing of Satisfaction, Start Date [Axis]: 2024-07-01 |
|
|
| Disaggregation of Revenue [Line Items] |
|
|
| Revenue remaining performance obligation |
$ 470,379
|
$ 238,691
|
| Expected timing of satisfaction |
1 year
|
1 year
|
| Pega Cloud | Revenue, Remaining Performance Obligation, Expected Timing of Satisfaction, Start Date [Axis]: 2025-07-01 |
|
|
| Disaggregation of Revenue [Line Items] |
|
|
| Revenue remaining performance obligation |
$ 301,070
|
$ 124,616
|
| Expected timing of satisfaction |
1 year
|
1 year
|
| Pega Cloud | Revenue, Remaining Performance Obligation, Expected Timing of Satisfaction, Start Date [Axis]: 2026-07-01 |
|
|
| Disaggregation of Revenue [Line Items] |
|
|
| Revenue remaining performance obligation |
$ 152,839
|
$ 101,494
|
| Expected timing of satisfaction |
1 year
|
|
| Pega Cloud | Revenue, Remaining Performance Obligation, Expected Timing of Satisfaction, Start Date [Axis]: 2027-07-01 |
|
|
| Disaggregation of Revenue [Line Items] |
|
|
| Revenue remaining performance obligation |
$ 90,474
|
|
| Expected timing of satisfaction |
|
|
| Maintenance |
|
|
| Disaggregation of Revenue [Line Items] |
|
|
| Revenue remaining performance obligation |
$ 320,906
|
$ 305,825
|
| Maintenance | Revenue, Remaining Performance Obligation, Expected Timing of Satisfaction, Start Date [Axis]: 2023-07-01 |
|
|
| Disaggregation of Revenue [Line Items] |
|
|
| Revenue remaining performance obligation |
|
$ 214,579
|
| Expected timing of satisfaction |
|
1 year
|
| Maintenance | Revenue, Remaining Performance Obligation, Expected Timing of Satisfaction, Start Date [Axis]: 2024-07-01 |
|
|
| Disaggregation of Revenue [Line Items] |
|
|
| Revenue remaining performance obligation |
$ 209,655
|
$ 58,551
|
| Expected timing of satisfaction |
1 year
|
1 year
|
| Maintenance | Revenue, Remaining Performance Obligation, Expected Timing of Satisfaction, Start Date [Axis]: 2025-07-01 |
|
|
| Disaggregation of Revenue [Line Items] |
|
|
| Revenue remaining performance obligation |
$ 63,266
|
$ 25,103
|
| Expected timing of satisfaction |
1 year
|
1 year
|
| Maintenance | Revenue, Remaining Performance Obligation, Expected Timing of Satisfaction, Start Date [Axis]: 2026-07-01 |
|
|
| Disaggregation of Revenue [Line Items] |
|
|
| Revenue remaining performance obligation |
$ 30,032
|
$ 7,592
|
| Expected timing of satisfaction |
1 year
|
|
| Maintenance | Revenue, Remaining Performance Obligation, Expected Timing of Satisfaction, Start Date [Axis]: 2027-07-01 |
|
|
| Disaggregation of Revenue [Line Items] |
|
|
| Revenue remaining performance obligation |
$ 17,953
|
|
| Expected timing of satisfaction |
|
|
| Subscription license |
|
|
| Disaggregation of Revenue [Line Items] |
|
|
| Revenue remaining performance obligation |
$ 36,990
|
$ 45,406
|
| Subscription license | Revenue, Remaining Performance Obligation, Expected Timing of Satisfaction, Start Date [Axis]: 2023-07-01 |
|
|
| Disaggregation of Revenue [Line Items] |
|
|
| Revenue remaining performance obligation |
|
$ 35,616
|
| Expected timing of satisfaction |
|
1 year
|
| Subscription license | Revenue, Remaining Performance Obligation, Expected Timing of Satisfaction, Start Date [Axis]: 2024-07-01 |
|
|
| Disaggregation of Revenue [Line Items] |
|
|
| Revenue remaining performance obligation |
$ 23,931
|
$ 3,026
|
| Expected timing of satisfaction |
1 year
|
1 year
|
| Subscription license | Revenue, Remaining Performance Obligation, Expected Timing of Satisfaction, Start Date [Axis]: 2025-07-01 |
|
|
| Disaggregation of Revenue [Line Items] |
|
|
| Revenue remaining performance obligation |
$ 10,078
|
$ 6,764
|
| Expected timing of satisfaction |
1 year
|
1 year
|
| Subscription license | Revenue, Remaining Performance Obligation, Expected Timing of Satisfaction, Start Date [Axis]: 2026-07-01 |
|
|
| Disaggregation of Revenue [Line Items] |
|
|
| Revenue remaining performance obligation |
$ 2,884
|
$ 0
|
| Expected timing of satisfaction |
1 year
|
|
| Subscription license | Revenue, Remaining Performance Obligation, Expected Timing of Satisfaction, Start Date [Axis]: 2027-07-01 |
|
|
| Disaggregation of Revenue [Line Items] |
|
|
| Revenue remaining performance obligation |
$ 97
|
|
| Expected timing of satisfaction |
|
|
| Perpetual license |
|
|
| Disaggregation of Revenue [Line Items] |
|
|
| Revenue remaining performance obligation |
$ 2,696
|
$ 7,231
|
| Perpetual license | Revenue, Remaining Performance Obligation, Expected Timing of Satisfaction, Start Date [Axis]: 2023-07-01 |
|
|
| Disaggregation of Revenue [Line Items] |
|
|
| Revenue remaining performance obligation |
|
$ 4,979
|
| Expected timing of satisfaction |
|
1 year
|
| Perpetual license | Revenue, Remaining Performance Obligation, Expected Timing of Satisfaction, Start Date [Axis]: 2024-07-01 |
|
|
| Disaggregation of Revenue [Line Items] |
|
|
| Revenue remaining performance obligation |
$ 2,696
|
$ 2,252
|
| Expected timing of satisfaction |
1 year
|
1 year
|
| Perpetual license | Revenue, Remaining Performance Obligation, Expected Timing of Satisfaction, Start Date [Axis]: 2025-07-01 |
|
|
| Disaggregation of Revenue [Line Items] |
|
|
| Revenue remaining performance obligation |
$ 0
|
$ 0
|
| Expected timing of satisfaction |
1 year
|
1 year
|
| Perpetual license | Revenue, Remaining Performance Obligation, Expected Timing of Satisfaction, Start Date [Axis]: 2026-07-01 |
|
|
| Disaggregation of Revenue [Line Items] |
|
|
| Revenue remaining performance obligation |
$ 0
|
$ 0
|
| Expected timing of satisfaction |
1 year
|
|
| Perpetual license | Revenue, Remaining Performance Obligation, Expected Timing of Satisfaction, Start Date [Axis]: 2027-07-01 |
|
|
| Disaggregation of Revenue [Line Items] |
|
|
| Revenue remaining performance obligation |
$ 0
|
|
| Expected timing of satisfaction |
|
|
| Consulting |
|
|
| Disaggregation of Revenue [Line Items] |
|
|
| Revenue remaining performance obligation |
$ 30,895
|
$ 45,650
|
| Consulting | Revenue, Remaining Performance Obligation, Expected Timing of Satisfaction, Start Date [Axis]: 2023-07-01 |
|
|
| Disaggregation of Revenue [Line Items] |
|
|
| Revenue remaining performance obligation |
|
$ 37,355
|
| Expected timing of satisfaction |
|
1 year
|
| Consulting | Revenue, Remaining Performance Obligation, Expected Timing of Satisfaction, Start Date [Axis]: 2024-07-01 |
|
|
| Disaggregation of Revenue [Line Items] |
|
|
| Revenue remaining performance obligation |
$ 25,953
|
$ 6,772
|
| Expected timing of satisfaction |
1 year
|
1 year
|
| Consulting | Revenue, Remaining Performance Obligation, Expected Timing of Satisfaction, Start Date [Axis]: 2025-07-01 |
|
|
| Disaggregation of Revenue [Line Items] |
|
|
| Revenue remaining performance obligation |
$ 2,469
|
$ 1,523
|
| Expected timing of satisfaction |
1 year
|
1 year
|
| Consulting | Revenue, Remaining Performance Obligation, Expected Timing of Satisfaction, Start Date [Axis]: 2026-07-01 |
|
|
| Disaggregation of Revenue [Line Items] |
|
|
| Revenue remaining performance obligation |
$ 2,473
|
$ 0
|
| Expected timing of satisfaction |
1 year
|
|
| Consulting | Revenue, Remaining Performance Obligation, Expected Timing of Satisfaction, Start Date [Axis]: 2027-07-01 |
|
|
| Disaggregation of Revenue [Line Items] |
|
|
| Revenue remaining performance obligation |
$ 0
|
|
| Expected timing of satisfaction |
|
|
| X |
- DefinitionLine items represent financial concepts included in a table. These concepts are used to disclose reportable information associated with domain members defined in one or many axes to the table. Reference 1: http://www.xbrl.org/2003/role/disclosureRef
-Topic 606
-SubTopic 10
-Name Accounting Standards Codification
-Section 50
-Paragraph 5
-Publisher FASB
-URI https://asc.fasb.org/1943274/2147479806/606-10-50-5
Reference 2: http://www.xbrl.org/2003/role/exampleRef
-Topic 606
-SubTopic 10
-Name Accounting Standards Codification
-Section 55
-Paragraph 91
-Subparagraph (a)
-Publisher FASB
-URI https://asc.fasb.org/1943274/2147479777/606-10-55-91
Reference 3: http://www.xbrl.org/2003/role/exampleRef
-Topic 606
-SubTopic 10
-Name Accounting Standards Codification
-Section 55
-Paragraph 91
-Subparagraph (b)
-Publisher FASB
-URI https://asc.fasb.org/1943274/2147479777/606-10-55-91
Reference 4: http://www.xbrl.org/2003/role/exampleRef
-Topic 606
-SubTopic 10
-Name Accounting Standards Codification
-Section 55
-Paragraph 91
-Subparagraph (c)
-Publisher FASB
-URI https://asc.fasb.org/1943274/2147479777/606-10-55-91
Reference 5: http://www.xbrl.org/2003/role/exampleRef
-Topic 606
-SubTopic 10
-Name Accounting Standards Codification
-Section 55
-Paragraph 91
-Subparagraph (d)
-Publisher FASB
-URI https://asc.fasb.org/1943274/2147479777/606-10-55-91
Reference 6: http://www.xbrl.org/2003/role/exampleRef
-Topic 606
-SubTopic 10
-Name Accounting Standards Codification
-Section 55
-Paragraph 91
-Subparagraph (e)
-Publisher FASB
-URI https://asc.fasb.org/1943274/2147479777/606-10-55-91
Reference 7: http://www.xbrl.org/2003/role/exampleRef
-Topic 606
-SubTopic 10
-Name Accounting Standards Codification
-Section 55
-Paragraph 91
-Subparagraph (f)
-Publisher FASB
-URI https://asc.fasb.org/1943274/2147479777/606-10-55-91
Reference 8: http://www.xbrl.org/2003/role/exampleRef
-Topic 606
-SubTopic 10
-Name Accounting Standards Codification
-Section 55
-Paragraph 91
-Subparagraph (g)
-Publisher FASB
-URI https://asc.fasb.org/1943274/2147479777/606-10-55-91
| Name: |
us-gaap_DisaggregationOfRevenueLineItems |
| Namespace Prefix: |
us-gaap_ |
| Data Type: |
xbrli:stringItemType |
| Balance Type: |
na |
| Period Type: |
duration |
|
| X |
- DefinitionAmount of transaction price allocated to performance obligation that has not been recognized as revenue. Reference 1: http://www.xbrl.org/2003/role/disclosureRef
-Name Accounting Standards Codification
-Section 50
-Paragraph 13
-Subparagraph (a)
-SubTopic 10
-Topic 606
-Publisher FASB
-URI https://asc.fasb.org/1943274/2147479806/606-10-50-13
| Name: |
us-gaap_RevenueRemainingPerformanceObligation |
| Namespace Prefix: |
us-gaap_ |
| Data Type: |
xbrli:monetaryItemType |
| Balance Type: |
credit |
| Period Type: |
instant |
|
| X |
- DefinitionPeriod in which remaining performance obligation is expected to be recognized as revenue, in 'PnYnMnDTnHnMnS' format, for example, 'P1Y5M13D' represents reported fact of one year, five months, and thirteen days. Reference 1: http://www.xbrl.org/2003/role/disclosureRef
-Name Accounting Standards Codification
-Section 50
-Paragraph 13
-Subparagraph (b)(1)
-SubTopic 10
-Topic 606
-Publisher FASB
-URI https://asc.fasb.org/1943274/2147479806/606-10-50-13
| Name: |
us-gaap_RevenueRemainingPerformanceObligationExpectedTimingOfSatisfactionPeriod1 |
| Namespace Prefix: |
us-gaap_ |
| Data Type: |
xbrli:durationItemType |
| Balance Type: |
na |
| Period Type: |
instant |
|
| X |
- DefinitionPercentage of remaining performance obligation to total remaining performance obligation not recognized as revenue. Reference 1: http://www.xbrl.org/2009/role/commonPracticeRef
-Name Accounting Standards Codification
-Section 50
-Paragraph 13
-Subparagraph (b)(1)
-SubTopic 10
-Topic 606
-Publisher FASB
-URI https://asc.fasb.org/1943274/2147479806/606-10-50-13
| Name: |
us-gaap_RevenueRemainingPerformanceObligationPercentage |
| Namespace Prefix: |
us-gaap_ |
| Data Type: |
dtr-types:percentItemType |
| Balance Type: |
na |
| Period Type: |
instant |
|
| X |
- Details
| Name: |
us-gaap_RevenueRemainingPerformanceObligationExpectedTimingOfSatisfactionStartDateAxis=2023-07-01 |
| Namespace Prefix: |
|
| Data Type: |
na |
| Balance Type: |
|
| Period Type: |
|
|
| X |
- Details
| Name: |
us-gaap_RevenueRemainingPerformanceObligationExpectedTimingOfSatisfactionStartDateAxis=2024-07-01 |
| Namespace Prefix: |
|
| Data Type: |
na |
| Balance Type: |
|
| Period Type: |
|
|
| X |
- Details
| Name: |
us-gaap_RevenueRemainingPerformanceObligationExpectedTimingOfSatisfactionStartDateAxis=2025-07-01 |
| Namespace Prefix: |
|
| Data Type: |
na |
| Balance Type: |
|
| Period Type: |
|
|
| X |
- Details
| Name: |
us-gaap_RevenueRemainingPerformanceObligationExpectedTimingOfSatisfactionStartDateAxis=2026-07-01 |
| Namespace Prefix: |
|
| Data Type: |
na |
| Balance Type: |
|
| Period Type: |
|
|
| X |
- Details
| Name: |
us-gaap_RevenueRemainingPerformanceObligationExpectedTimingOfSatisfactionStartDateAxis=2027-07-01 |
| Namespace Prefix: |
|
| Data Type: |
na |
| Balance Type: |
|
| Period Type: |
|
|
| X |
- Details
| Name: |
srt_ProductOrServiceAxis=pega_PegaCloudMember |
| Namespace Prefix: |
|
| Data Type: |
na |
| Balance Type: |
|
| Period Type: |
|
|
| X |
- Details
| Name: |
srt_ProductOrServiceAxis=us-gaap_MaintenanceMember |
| Namespace Prefix: |
|
| Data Type: |
na |
| Balance Type: |
|
| Period Type: |
|
|
| X |
- Details
| Name: |
srt_ProductOrServiceAxis=pega_SubscriptionLicenseMember |
| Namespace Prefix: |
|
| Data Type: |
na |
| Balance Type: |
|
| Period Type: |
|
|
| X |
- Details
| Name: |
srt_ProductOrServiceAxis=pega_PerpetualLicenseMember |
| Namespace Prefix: |
|
| Data Type: |
na |
| Balance Type: |
|
| Period Type: |
|
|
| X |
- Details
| Name: |
srt_ProductOrServiceAxis=pega_ConsultingMember |
| Namespace Prefix: |
|
| Data Type: |
na |
| Balance Type: |
|
| Period Type: |
|
|
v3.24.2
STOCK-BASED COMPENSATION - Schedule of Stock Based Compensation Expense (Details) - USD ($)
$ in Thousands |
3 Months Ended |
6 Months Ended |
Jun. 30, 2024 |
Jun. 30, 2023 |
Jun. 30, 2024 |
Jun. 30, 2023 |
| Employee Service Share-based Compensation, Allocation of Recognized Period Costs [Line Items] |
|
|
|
|
| Total stock-based compensation before tax |
$ 36,224
|
$ 36,227
|
$ 71,005
|
$ 78,784
|
| Income tax benefit |
(554)
|
(581)
|
(865)
|
(1,253)
|
| Cost of revenue |
|
|
|
|
| Employee Service Share-based Compensation, Allocation of Recognized Period Costs [Line Items] |
|
|
|
|
| Total stock-based compensation before tax |
7,092
|
7,174
|
13,664
|
16,087
|
| Selling and marketing |
|
|
|
|
| Employee Service Share-based Compensation, Allocation of Recognized Period Costs [Line Items] |
|
|
|
|
| Total stock-based compensation before tax |
13,564
|
15,349
|
27,452
|
33,009
|
| Research and development |
|
|
|
|
| Employee Service Share-based Compensation, Allocation of Recognized Period Costs [Line Items] |
|
|
|
|
| Total stock-based compensation before tax |
7,825
|
7,851
|
15,471
|
16,911
|
| General and administrative |
|
|
|
|
| Employee Service Share-based Compensation, Allocation of Recognized Period Costs [Line Items] |
|
|
|
|
| Total stock-based compensation before tax |
$ 7,743
|
$ 5,853
|
$ 14,418
|
$ 12,777
|
| X |
- DefinitionLine items represent financial concepts included in a table. These concepts are used to disclose reportable information associated with domain members defined in one or many axes to the table.
| Name: |
us-gaap_EmployeeServiceShareBasedCompensationAllocationOfRecognizedPeriodCostsLineItems |
| Namespace Prefix: |
us-gaap_ |
| Data Type: |
xbrli:stringItemType |
| Balance Type: |
na |
| Period Type: |
duration |
|
| X |
- DefinitionAmount of tax benefit for recognition of expense of award under share-based payment arrangement. Reference 1: http://www.xbrl.org/2003/role/disclosureRef
-Topic 718
-SubTopic 10
-Name Accounting Standards Codification
-Section 50
-Paragraph 2
-Subparagraph (h)(1)(i)
-Publisher FASB
-URI https://asc.fasb.org/1943274/2147480429/718-10-50-2
| Name: |
us-gaap_EmployeeServiceShareBasedCompensationTaxBenefitFromCompensationExpense |
| Namespace Prefix: |
us-gaap_ |
| Data Type: |
xbrli:monetaryItemType |
| Balance Type: |
credit |
| Period Type: |
duration |
|
| X |
- DefinitionAmount of noncash expense for share-based payment arrangement. Reference 1: http://fasb.org/us-gaap/role/ref/legacyRef
-Name Accounting Standards Codification
-Section 45
-Paragraph 28
-Subparagraph (a)
-SubTopic 10
-Topic 230
-Publisher FASB
-URI https://asc.fasb.org/1943274/2147482740/230-10-45-28
| Name: |
us-gaap_ShareBasedCompensation |
| Namespace Prefix: |
us-gaap_ |
| Data Type: |
xbrli:monetaryItemType |
| Balance Type: |
debit |
| Period Type: |
duration |
|
| X |
- Details
| Name: |
us-gaap_IncomeStatementLocationAxis=pega_CostOfRevenueMember |
| Namespace Prefix: |
|
| Data Type: |
na |
| Balance Type: |
|
| Period Type: |
|
|
| X |
- Details
| Name: |
us-gaap_IncomeStatementLocationAxis=us-gaap_SellingAndMarketingExpenseMember |
| Namespace Prefix: |
|
| Data Type: |
na |
| Balance Type: |
|
| Period Type: |
|
|
| X |
- Details
| Name: |
us-gaap_IncomeStatementLocationAxis=us-gaap_ResearchAndDevelopmentExpenseMember |
| Namespace Prefix: |
|
| Data Type: |
na |
| Balance Type: |
|
| Period Type: |
|
|
| X |
- Details
| Name: |
us-gaap_IncomeStatementLocationAxis=us-gaap_GeneralAndAdministrativeExpenseMember |
| Namespace Prefix: |
|
| Data Type: |
na |
| Balance Type: |
|
| Period Type: |
|
|
v3.24.2
| X |
- DefinitionAmount of cost not yet recognized for nonvested award under share-based payment arrangement. Reference 1: http://www.xbrl.org/2003/role/disclosureRef
-Topic 718
-SubTopic 10
-Name Accounting Standards Codification
-Section 50
-Paragraph 2
-Subparagraph (i)
-Publisher FASB
-URI https://asc.fasb.org/1943274/2147480429/718-10-50-2
| Name: |
us-gaap_EmployeeServiceShareBasedCompensationNonvestedAwardsTotalCompensationCostNotYetRecognized |
| Namespace Prefix: |
us-gaap_ |
| Data Type: |
xbrli:monetaryItemType |
| Balance Type: |
debit |
| Period Type: |
instant |
|
| X |
- DefinitionWeighted-average period over which cost not yet recognized is expected to be recognized for award under share-based payment arrangement, in 'PnYnMnDTnHnMnS' format, for example, 'P1Y5M13D' represents reported fact of one year, five months, and thirteen days. Reference 1: http://www.xbrl.org/2003/role/disclosureRef
-Topic 718
-SubTopic 10
-Name Accounting Standards Codification
-Section 50
-Paragraph 2
-Subparagraph (i)
-Publisher FASB
-URI https://asc.fasb.org/1943274/2147480429/718-10-50-2
| Name: |
us-gaap_EmployeeServiceShareBasedCompensationNonvestedAwardsTotalCompensationCostNotYetRecognizedPeriodForRecognition1 |
| Namespace Prefix: |
us-gaap_ |
| Data Type: |
xbrli:durationItemType |
| Balance Type: |
na |
| Period Type: |
duration |
|
v3.24.2
STOCK-BASED COMPENSATION - Schedule of Stock Based Compensation Award Granted (Details)
shares in Thousands, $ in Thousands |
6 Months Ended |
|
Jun. 30, 2024
USD ($)
shares
|
|---|
| Restricted stock units |
|
| Employee Service Share-based Compensation, Allocation of Recognized Period Costs [Line Items] |
|
| Restricted stock units (in shares) | shares |
1,266
|
| Total Fair Value | $ |
$ 78,071
|
| Restricted stock units | Corporate Incentive Compensation Plan |
|
| Employee Service Share-based Compensation, Allocation of Recognized Period Costs [Line Items] |
|
| Employee’s target incentive compensation percentage |
50.00%
|
| Non-qualified stock options |
|
| Employee Service Share-based Compensation, Allocation of Recognized Period Costs [Line Items] |
|
| Non-qualified stock options (in shares) | shares |
1,738
|
| Total Fair Value | $ |
$ 44,874
|
| Performance stock options |
|
| Employee Service Share-based Compensation, Allocation of Recognized Period Costs [Line Items] |
|
| Restricted stock units (in shares) | shares |
566
|
| Total Fair Value | $ |
$ 13,921
|
| Expiration period |
10 years
|
| Performance stock options | First anniversary |
|
| Employee Service Share-based Compensation, Allocation of Recognized Period Costs [Line Items] |
|
| Maximum vesting percentage |
25.00%
|
| Performance stock options | Second anniversary |
|
| Employee Service Share-based Compensation, Allocation of Recognized Period Costs [Line Items] |
|
| Maximum vesting percentage |
75.00%
|
| X |
- DefinitionPercentage of an employee's annual target incentive compensation which is eligible to be elected and received in the form of RSUs in accordance with the Company's CICP.
| Name: |
pega_ShareBasedCompensationArrangementByShareBasedPaymentAwardCompensationPercentageOfTargetIncentiveCompensationEligibleToElectAndReceiveByEmployees |
| Namespace Prefix: |
pega_ |
| Data Type: |
dtr-types1:percentItemType |
| Balance Type: |
na |
| Period Type: |
duration |
|
| X |
- DefinitionThe total grant date fair value of awards made during the period.
| Name: |
pega_ShareBasedCompensationArrangementByShareBasedPaymentAwardGrantDateFairValueOfAwards |
| Namespace Prefix: |
pega_ |
| Data Type: |
xbrli:monetaryItemType |
| Balance Type: |
debit |
| Period Type: |
duration |
|
| X |
- DefinitionLine items represent financial concepts included in a table. These concepts are used to disclose reportable information associated with domain members defined in one or many axes to the table.
| Name: |
us-gaap_EmployeeServiceShareBasedCompensationAllocationOfRecognizedPeriodCostsLineItems |
| Namespace Prefix: |
us-gaap_ |
| Data Type: |
xbrli:stringItemType |
| Balance Type: |
na |
| Period Type: |
duration |
|
| X |
- DefinitionThe number of grants made during the period on other than stock (or unit) option plans (for example, phantom stock or unit plan, stock or unit appreciation rights plan, performance target plan). Reference 1: http://www.xbrl.org/2003/role/disclosureRef
-Topic 718
-SubTopic 10
-Name Accounting Standards Codification
-Section 50
-Paragraph 2
-Subparagraph (c)(2)(iii)(01)
-Publisher FASB
-URI https://asc.fasb.org/1943274/2147480429/718-10-50-2
| Name: |
us-gaap_ShareBasedCompensationArrangementByShareBasedPaymentAwardEquityInstrumentsOtherThanOptionsGrantsInPeriod |
| Namespace Prefix: |
us-gaap_ |
| Data Type: |
xbrli:sharesItemType |
| Balance Type: |
na |
| Period Type: |
duration |
|
| X |
- DefinitionGross number of share options (or share units) granted during the period. Reference 1: http://www.xbrl.org/2003/role/disclosureRef
-Topic 718
-SubTopic 10
-Name Accounting Standards Codification
-Section 50
-Paragraph 2
-Subparagraph (c)(1)(iv)(01)
-Publisher FASB
-URI https://asc.fasb.org/1943274/2147480429/718-10-50-2
| Name: |
us-gaap_ShareBasedCompensationArrangementByShareBasedPaymentAwardOptionsGrantsInPeriodGross |
| Namespace Prefix: |
us-gaap_ |
| Data Type: |
xbrli:sharesItemType |
| Balance Type: |
na |
| Period Type: |
duration |
|
| X |
- DefinitionPercentage of vesting of award under share-based payment arrangement. Reference 1: http://www.xbrl.org/2009/role/commonPracticeRef
-Topic 718
-SubTopic 10
-Name Accounting Standards Codification
-Section 50
-Paragraph 2
-Subparagraph (a)(1)
-Publisher FASB
-URI https://asc.fasb.org/1943274/2147480429/718-10-50-2
| Name: |
us-gaap_SharebasedCompensationArrangementBySharebasedPaymentAwardAwardVestingRightsPercentage |
| Namespace Prefix: |
us-gaap_ |
| Data Type: |
dtr-types:percentItemType |
| Balance Type: |
na |
| Period Type: |
duration |
|
| X |
- DefinitionPeriod from grant date that an equity-based award expires, in 'PnYnMnDTnHnMnS' format, for example, 'P1Y5M13D' represents the reported fact of one year, five months, and thirteen days. Reference 1: http://www.xbrl.org/2003/role/exampleRef
-Topic 718
-SubTopic 10
-Name Accounting Standards Codification
-Section 50
-Paragraph 2
-Subparagraph (a)(2)
-Publisher FASB
-URI https://asc.fasb.org/1943274/2147480429/718-10-50-2
| Name: |
us-gaap_SharebasedCompensationArrangementBySharebasedPaymentAwardExpirationPeriod |
| Namespace Prefix: |
us-gaap_ |
| Data Type: |
xbrli:durationItemType |
| Balance Type: |
na |
| Period Type: |
duration |
|
| X |
- Details
| Name: |
us-gaap_AwardTypeAxis=us-gaap_RestrictedStockUnitsRSUMember |
| Namespace Prefix: |
|
| Data Type: |
na |
| Balance Type: |
|
| Period Type: |
|
|
| X |
- Details
| Name: |
us-gaap_PlanNameAxis=pega_CorporateIncentiveCompensationPlanMember |
| Namespace Prefix: |
|
| Data Type: |
na |
| Balance Type: |
|
| Period Type: |
|
|
| X |
- Details
| Name: |
us-gaap_AwardTypeAxis=pega_NonqualifiedStockOptionsMember |
| Namespace Prefix: |
|
| Data Type: |
na |
| Balance Type: |
|
| Period Type: |
|
|
| X |
- Details
| Name: |
us-gaap_VestingAxis=us-gaap_ShareBasedCompensationAwardTrancheOneMember |
| Namespace Prefix: |
|
| Data Type: |
na |
| Balance Type: |
|
| Period Type: |
|
|
| X |
- Details
| Name: |
us-gaap_VestingAxis=us-gaap_ShareBasedCompensationAwardTrancheTwoMember |
| Namespace Prefix: |
|
| Data Type: |
na |
| Balance Type: |
|
| Period Type: |
|
|
v3.24.2
v3.24.2
EARNINGS (LOSS) PER SHARE (Details)
$ / shares in Units, shares in Thousands, $ in Thousands |
3 Months Ended |
6 Months Ended |
|
|
Jun. 30, 2024
USD ($)
$ / shares
$ / derivative
shares
|
Mar. 31, 2024
USD ($)
|
Jun. 30, 2023
USD ($)
$ / shares
shares
|
Mar. 31, 2023
USD ($)
|
Jun. 30, 2024
USD ($)
$ / shares
$ / derivative
shares
|
Jun. 30, 2023
USD ($)
$ / shares
shares
|
Feb. 29, 2020
$ / derivative
|
| Basic |
|
|
|
|
|
|
|
| Net income (loss) | $ |
$ 6,613
|
$ (12,124)
|
$ (46,804)
|
$ (20,774)
|
$ (5,511)
|
$ (67,578)
|
|
| Weighted-average common shares outstanding |
85,157
|
|
83,039
|
|
84,712
|
82,823
|
|
| Earnings (loss) per share, basic (in dollars per share) | $ / shares |
$ 0.08
|
|
$ (0.56)
|
|
$ (0.07)
|
$ (0.82)
|
|
| Diluted |
|
|
|
|
|
|
|
| Net income (loss) | $ |
$ 6,613
|
$ (12,124)
|
$ (46,804)
|
$ (20,774)
|
$ (5,511)
|
$ (67,578)
|
|
| Numerator for diluted EPS | $ |
$ 6,613
|
|
$ (46,804)
|
|
$ (5,511)
|
$ (67,578)
|
|
| Effect of dilutive securities (in shares) |
3,343
|
|
0
|
|
0
|
0
|
|
| Weighted-average common shares outstanding, assuming dilution (in shares) |
88,500
|
|
83,039
|
|
84,712
|
82,823
|
|
| Earnings (loss) per share, diluted (in dollars per share) | $ / shares |
$ 0.07
|
|
$ (0.56)
|
|
$ (0.07)
|
$ (0.82)
|
|
| Outstanding anti-dilutive stock options and RSUs (in shares) |
5
|
|
1,354
|
|
3,259
|
1,351
|
|
| Number of shares issuable upon conversion (in shares) |
3,700
|
|
|
|
3,700
|
|
|
| Number of shares issuable upon conversion (in shares) |
3,700
|
|
|
|
3,700
|
|
|
| Cap price (in dollars per share) | $ / derivative |
196.44
|
|
|
|
196.44
|
|
196.44
|
| Stock options |
|
|
|
|
|
|
|
| Diluted |
|
|
|
|
|
|
|
| Share-based payment arrangements (in shares) |
2,164
|
|
0
|
|
0
|
0
|
|
| Restricted stock units |
|
|
|
|
|
|
|
| Diluted |
|
|
|
|
|
|
|
| Share-based payment arrangements (in shares) |
1,179
|
|
0
|
|
0
|
0
|
|
| X |
- DefinitionDebt Conversion, Converted Instrument, Shares if fully Exercised
| Name: |
pega_DebtConversionConvertedInstrumentSharesIfFullyExercised |
| Namespace Prefix: |
pega_ |
| Data Type: |
xbrli:sharesItemType |
| Balance Type: |
na |
| Period Type: |
instant |
|
| X |
- DefinitionDebt Conversion, Converted Instrument, Shares Outstanding
| Name: |
pega_DebtConversionConvertedInstrumentSharesOutstanding |
| Namespace Prefix: |
pega_ |
| Data Type: |
xbrli:sharesItemType |
| Balance Type: |
na |
| Period Type: |
instant |
|
| X |
- DefinitionSecurities (including those issuable pursuant to contingent stock agreements) that could potentially dilute basic earnings per share (EPS) or earnings per unit (EPU) in the future that were not included in the computation of diluted EPS or EPU because to do so would increase EPS or EPU amounts or decrease loss per share or unit amounts for the period presented. Reference 1: http://www.xbrl.org/2003/role/disclosureRef
-Topic 260
-SubTopic 10
-Name Accounting Standards Codification
-Section 50
-Paragraph 1
-Subparagraph (c)
-Publisher FASB
-URI https://asc.fasb.org/1943274/2147482662/260-10-50-1
| Name: |
us-gaap_AntidilutiveSecuritiesExcludedFromComputationOfEarningsPerShareAmount |
| Namespace Prefix: |
us-gaap_ |
| Data Type: |
xbrli:sharesItemType |
| Balance Type: |
na |
| Period Type: |
duration |
|
| X |
- DefinitionThe cap rate on a price risk derivative such as a cap or collar. A payment or receipt is triggered if the market rate exceeds the cap rate on the contract.
| Name: |
us-gaap_DerivativeCapPrice |
| Namespace Prefix: |
us-gaap_ |
| Data Type: |
srt-types:perUnitItemType |
| Balance Type: |
na |
| Period Type: |
instant |
|
| X |
- DefinitionThe amount of net income (loss) for the period per each share of common stock or unit outstanding during the reporting period. Reference 1: http://www.xbrl.org/2003/role/disclosureRef
-Topic 250
-SubTopic 10
-Name Accounting Standards Codification
-Section 50
-Paragraph 6
-Publisher FASB
-URI https://asc.fasb.org/1943274/2147483443/250-10-50-6
Reference 2: http://www.xbrl.org/2003/role/exampleRef
-Topic 260
-SubTopic 10
-Name Accounting Standards Codification
-Section 55
-Paragraph 52
-Publisher FASB
-URI https://asc.fasb.org/1943274/2147482635/260-10-55-52
Reference 3: http://www.xbrl.org/2003/role/disclosureRef
-Topic 805
-SubTopic 60
-Name Accounting Standards Codification
-Section 65
-Paragraph 1
-Subparagraph (g)
-Publisher FASB
-URI https://asc.fasb.org/1943274/2147476176/805-60-65-1
Reference 4: http://www.xbrl.org/2003/role/disclosureRef
-Topic 740
-SubTopic 323
-Name Accounting Standards Codification
-Section 65
-Paragraph 2
-Subparagraph (g)(3)
-Publisher FASB
-URI https://asc.fasb.org/1943274/2147478666/740-323-65-2
Reference 5: http://www.xbrl.org/2003/role/disclosureRef
-Topic 250
-SubTopic 10
-Name Accounting Standards Codification
-Section 50
-Paragraph 3
-Publisher FASB
-URI https://asc.fasb.org/1943274/2147483443/250-10-50-3
Reference 6: http://www.xbrl.org/2003/role/disclosureRef
-Topic 260
-SubTopic 10
-Name Accounting Standards Codification
-Section 55
-Paragraph 15
-Publisher FASB
-URI https://asc.fasb.org/1943274/2147482635/260-10-55-15
Reference 7: http://www.xbrl.org/2003/role/disclosureRef
-Topic 815
-SubTopic 40
-Name Accounting Standards Codification
-Section 65
-Paragraph 1
-Subparagraph (e)(4)
-Publisher FASB
-URI https://asc.fasb.org/1943274/2147480175/815-40-65-1
Reference 8: http://www.xbrl.org/2003/role/disclosureRef
-Topic 815
-SubTopic 40
-Name Accounting Standards Codification
-Section 65
-Paragraph 1
-Subparagraph (f)
-Publisher FASB
-URI https://asc.fasb.org/1943274/2147480175/815-40-65-1
Reference 9: http://www.xbrl.org/2003/role/disclosureRef
-Topic 250
-SubTopic 10
-Name Accounting Standards Codification
-Section 50
-Paragraph 11
-Subparagraph (a)
-Publisher FASB
-URI https://asc.fasb.org/1943274/2147483443/250-10-50-11
Reference 10: http://www.xbrl.org/2003/role/disclosureRef
-Topic 250
-SubTopic 10
-Name Accounting Standards Codification
-Section 50
-Paragraph 11
-Subparagraph (b)
-Publisher FASB
-URI https://asc.fasb.org/1943274/2147483443/250-10-50-11
Reference 11: http://www.xbrl.org/2003/role/disclosureRef
-Topic 250
-SubTopic 10
-Name Accounting Standards Codification
-Section 50
-Paragraph 7
-Subparagraph (a)
-Publisher FASB
-URI https://asc.fasb.org/1943274/2147483443/250-10-50-7
Reference 12: http://www.xbrl.org/2003/role/disclosureRef
-Topic 260
-SubTopic 10
-Name Accounting Standards Codification
-Section 45
-Paragraph 2
-Publisher FASB
-URI https://asc.fasb.org/1943274/2147482689/260-10-45-2
Reference 13: http://www.xbrl.org/2003/role/disclosureRef
-Topic 260
-SubTopic 10
-Name Accounting Standards Codification
-Section 45
-Paragraph 60B
-Subparagraph (d)
-Publisher FASB
-URI https://asc.fasb.org/1943274/2147482689/260-10-45-60B
Reference 14: http://www.xbrl.org/2003/role/disclosureRef
-Topic 250
-SubTopic 10
-Name Accounting Standards Codification
-Section 50
-Paragraph 4
-Publisher FASB
-URI https://asc.fasb.org/1943274/2147483443/250-10-50-4
Reference 15: http://www.xbrl.org/2003/role/disclosureRef
-Topic 260
-SubTopic 10
-Name Accounting Standards Codification
-Section 50
-Paragraph 1
-Subparagraph (a)
-Publisher FASB
-URI https://asc.fasb.org/1943274/2147482662/260-10-50-1
Reference 16: http://www.xbrl.org/2003/role/disclosureRef
-Topic 260
-SubTopic 10
-Name Accounting Standards Codification
-Section 45
-Paragraph 10
-Publisher FASB
-URI https://asc.fasb.org/1943274/2147482689/260-10-45-10
Reference 17: http://www.xbrl.org/2003/role/disclosureRef
-Topic 220
-SubTopic 10
-Name Accounting Standards Codification
-Section S99
-Paragraph 2
-Subparagraph (SX 210.5-03(25))
-Publisher FASB
-URI https://asc.fasb.org/1943274/2147483621/220-10-S99-2
Reference 18: http://www.xbrl.org/2003/role/disclosureRef
-Topic 942
-SubTopic 220
-Name Accounting Standards Codification
-Section S99
-Paragraph 1
-Subparagraph (SX 210.9-04(27))
-Publisher FASB
-URI https://asc.fasb.org/1943274/2147478524/942-220-S99-1
Reference 19: http://www.xbrl.org/2003/role/disclosureRef
-Topic 944
-SubTopic 220
-Name Accounting Standards Codification
-Section S99
-Paragraph 1
-Subparagraph (SX 210.7-04(23))
-Publisher FASB
-URI https://asc.fasb.org/1943274/2147477250/944-220-S99-1
Reference 20: http://www.xbrl.org/2003/role/disclosureRef
-Topic 260
-SubTopic 10
-Name Accounting Standards Codification
-Section 45
-Paragraph 7
-Publisher FASB
-URI https://asc.fasb.org/1943274/2147482689/260-10-45-7
| Name: |
us-gaap_EarningsPerShareBasic |
| Namespace Prefix: |
us-gaap_ |
| Data Type: |
dtr-types:perShareItemType |
| Balance Type: |
na |
| Period Type: |
duration |
|
| X |
- References
+ Details
| Name: |
us-gaap_EarningsPerShareBasicAbstract |
| Namespace Prefix: |
us-gaap_ |
| Data Type: |
xbrli:stringItemType |
| Balance Type: |
na |
| Period Type: |
duration |
|
| X |
- DefinitionThe amount of net income (loss) for the period available to each share of common stock or common unit outstanding during the reporting period and to each share or unit that would have been outstanding assuming the issuance of common shares or units for all dilutive potential common shares or units outstanding during the reporting period. Reference 1: http://www.xbrl.org/2003/role/disclosureRef
-Topic 250
-SubTopic 10
-Name Accounting Standards Codification
-Section 50
-Paragraph 6
-Publisher FASB
-URI https://asc.fasb.org/1943274/2147483443/250-10-50-6
Reference 2: http://www.xbrl.org/2003/role/exampleRef
-Topic 260
-SubTopic 10
-Name Accounting Standards Codification
-Section 55
-Paragraph 52
-Publisher FASB
-URI https://asc.fasb.org/1943274/2147482635/260-10-55-52
Reference 3: http://www.xbrl.org/2003/role/disclosureRef
-Topic 805
-SubTopic 60
-Name Accounting Standards Codification
-Section 65
-Paragraph 1
-Subparagraph (g)
-Publisher FASB
-URI https://asc.fasb.org/1943274/2147476176/805-60-65-1
Reference 4: http://www.xbrl.org/2003/role/disclosureRef
-Topic 740
-SubTopic 323
-Name Accounting Standards Codification
-Section 65
-Paragraph 2
-Subparagraph (g)(3)
-Publisher FASB
-URI https://asc.fasb.org/1943274/2147478666/740-323-65-2
Reference 5: http://www.xbrl.org/2003/role/disclosureRef
-Topic 250
-SubTopic 10
-Name Accounting Standards Codification
-Section 50
-Paragraph 3
-Publisher FASB
-URI https://asc.fasb.org/1943274/2147483443/250-10-50-3
Reference 6: http://www.xbrl.org/2003/role/disclosureRef
-Topic 260
-SubTopic 10
-Name Accounting Standards Codification
-Section 55
-Paragraph 15
-Publisher FASB
-URI https://asc.fasb.org/1943274/2147482635/260-10-55-15
Reference 7: http://www.xbrl.org/2003/role/disclosureRef
-Topic 815
-SubTopic 40
-Name Accounting Standards Codification
-Section 65
-Paragraph 1
-Subparagraph (e)(4)
-Publisher FASB
-URI https://asc.fasb.org/1943274/2147480175/815-40-65-1
Reference 8: http://www.xbrl.org/2003/role/disclosureRef
-Topic 815
-SubTopic 40
-Name Accounting Standards Codification
-Section 65
-Paragraph 1
-Subparagraph (f)
-Publisher FASB
-URI https://asc.fasb.org/1943274/2147480175/815-40-65-1
Reference 9: http://www.xbrl.org/2003/role/disclosureRef
-Topic 250
-SubTopic 10
-Name Accounting Standards Codification
-Section 50
-Paragraph 11
-Subparagraph (a)
-Publisher FASB
-URI https://asc.fasb.org/1943274/2147483443/250-10-50-11
Reference 10: http://www.xbrl.org/2003/role/disclosureRef
-Topic 250
-SubTopic 10
-Name Accounting Standards Codification
-Section 50
-Paragraph 11
-Subparagraph (b)
-Publisher FASB
-URI https://asc.fasb.org/1943274/2147483443/250-10-50-11
Reference 11: http://www.xbrl.org/2003/role/disclosureRef
-Topic 250
-SubTopic 10
-Name Accounting Standards Codification
-Section 50
-Paragraph 7
-Subparagraph (a)
-Publisher FASB
-URI https://asc.fasb.org/1943274/2147483443/250-10-50-7
Reference 12: http://www.xbrl.org/2003/role/disclosureRef
-Topic 260
-SubTopic 10
-Name Accounting Standards Codification
-Section 45
-Paragraph 2
-Publisher FASB
-URI https://asc.fasb.org/1943274/2147482689/260-10-45-2
Reference 13: http://www.xbrl.org/2003/role/disclosureRef
-Topic 260
-SubTopic 10
-Name Accounting Standards Codification
-Section 45
-Paragraph 60B
-Subparagraph (d)
-Publisher FASB
-URI https://asc.fasb.org/1943274/2147482689/260-10-45-60B
Reference 14: http://www.xbrl.org/2003/role/disclosureRef
-Topic 250
-SubTopic 10
-Name Accounting Standards Codification
-Section 50
-Paragraph 4
-Publisher FASB
-URI https://asc.fasb.org/1943274/2147483443/250-10-50-4
Reference 15: http://www.xbrl.org/2003/role/disclosureRef
-Topic 260
-SubTopic 10
-Name Accounting Standards Codification
-Section 50
-Paragraph 1
-Subparagraph (a)
-Publisher FASB
-URI https://asc.fasb.org/1943274/2147482662/260-10-50-1
Reference 16: http://www.xbrl.org/2003/role/disclosureRef
-Topic 220
-SubTopic 10
-Name Accounting Standards Codification
-Section S99
-Paragraph 2
-Subparagraph (SX 210.5-03(25))
-Publisher FASB
-URI https://asc.fasb.org/1943274/2147483621/220-10-S99-2
Reference 17: http://www.xbrl.org/2003/role/disclosureRef
-Topic 942
-SubTopic 220
-Name Accounting Standards Codification
-Section S99
-Paragraph 1
-Subparagraph (SX 210.9-04(27))
-Publisher FASB
-URI https://asc.fasb.org/1943274/2147478524/942-220-S99-1
Reference 18: http://www.xbrl.org/2003/role/disclosureRef
-Topic 944
-SubTopic 220
-Name Accounting Standards Codification
-Section S99
-Paragraph 1
-Subparagraph (SX 210.7-04(23))
-Publisher FASB
-URI https://asc.fasb.org/1943274/2147477250/944-220-S99-1
Reference 19: http://www.xbrl.org/2003/role/disclosureRef
-Topic 260
-SubTopic 10
-Name Accounting Standards Codification
-Section 45
-Paragraph 7
-Publisher FASB
-URI https://asc.fasb.org/1943274/2147482689/260-10-45-7
| Name: |
us-gaap_EarningsPerShareDiluted |
| Namespace Prefix: |
us-gaap_ |
| Data Type: |
dtr-types:perShareItemType |
| Balance Type: |
na |
| Period Type: |
duration |
|
| X |
- References
+ Details
| Name: |
us-gaap_EarningsPerShareDilutedAbstract |
| Namespace Prefix: |
us-gaap_ |
| Data Type: |
xbrli:stringItemType |
| Balance Type: |
na |
| Period Type: |
duration |
|
| X |
- DefinitionAdditional shares included in the calculation of diluted EPS as a result of the potentially dilutive effect of share based payment arrangements using the treasury stock method. Reference 1: http://www.xbrl.org/2003/role/disclosureRef
-Topic 718
-SubTopic 10
-Name Accounting Standards Codification
-Section 45
-Paragraph 1
-Publisher FASB
-URI https://asc.fasb.org/1943274/2147480454/718-10-45-1
Reference 2: http://www.xbrl.org/2003/role/disclosureRef
-Topic 260
-SubTopic 10
-Name Accounting Standards Codification
-Section 50
-Paragraph 1
-Subparagraph (a)
-Publisher FASB
-URI https://asc.fasb.org/1943274/2147482662/260-10-50-1
Reference 3: http://www.xbrl.org/2003/role/disclosureRef
-Topic 260
-SubTopic 10
-Name Accounting Standards Codification
-Section 45
-Paragraph 22
-Publisher FASB
-URI https://asc.fasb.org/1943274/2147482689/260-10-45-22
Reference 4: http://www.xbrl.org/2003/role/disclosureRef
-Topic 260
-SubTopic 10
-Name Accounting Standards Codification
-Section 45
-Paragraph 23
-Subparagraph (c)
-Publisher FASB
-URI https://asc.fasb.org/1943274/2147482689/260-10-45-23
Reference 5: http://www.xbrl.org/2003/role/disclosureRef
-Topic 260
-SubTopic 10
-Name Accounting Standards Codification
-Section 45
-Paragraph 28A
-Publisher FASB
-URI https://asc.fasb.org/1943274/2147482689/260-10-45-28A
| Name: |
us-gaap_IncrementalCommonSharesAttributableToShareBasedPaymentArrangements |
| Namespace Prefix: |
us-gaap_ |
| Data Type: |
xbrli:sharesItemType |
| Balance Type: |
na |
| Period Type: |
duration |
|
| X |
- DefinitionThe portion of profit or loss for the period, net of income taxes, which is attributable to the parent. Reference 1: http://www.xbrl.org/2003/role/disclosureRef
-Topic 250
-SubTopic 10
-Name Accounting Standards Codification
-Section 50
-Paragraph 6
-Publisher FASB
-URI https://asc.fasb.org/1943274/2147483443/250-10-50-6
Reference 2: http://www.xbrl.org/2003/role/disclosureRef
-Topic 250
-SubTopic 10
-Name Accounting Standards Codification
-Section 50
-Paragraph 9
-Publisher FASB
-URI https://asc.fasb.org/1943274/2147483443/250-10-50-9
Reference 3: http://www.xbrl.org/2003/role/disclosureRef
-Topic 805
-SubTopic 60
-Name Accounting Standards Codification
-Section 65
-Paragraph 1
-Subparagraph (g)
-Publisher FASB
-URI https://asc.fasb.org/1943274/2147476176/805-60-65-1
Reference 4: http://www.xbrl.org/2003/role/disclosureRef
-Topic 740
-SubTopic 323
-Name Accounting Standards Codification
-Section 65
-Paragraph 2
-Subparagraph (g)(3)
-Publisher FASB
-URI https://asc.fasb.org/1943274/2147478666/740-323-65-2
Reference 5: http://fasb.org/us-gaap/role/ref/legacyRef
-Topic 220
-SubTopic 10
-Name Accounting Standards Codification
-Section S99
-Paragraph 2
-Subparagraph (SX 210.5-03(20))
-Publisher FASB
-URI https://asc.fasb.org/1943274/2147483621/220-10-S99-2
Reference 6: http://www.xbrl.org/2003/role/disclosureRef
-Topic 235
-SubTopic 10
-Name Accounting Standards Codification
-Section S99
-Paragraph 1
-Subparagraph (SX 210.4-08(g)(1)(ii))
-Publisher FASB
-URI https://asc.fasb.org/1943274/2147480678/235-10-S99-1
Reference 7: http://www.xbrl.org/2003/role/disclosureRef
-Topic 323
-SubTopic 10
-Name Accounting Standards Codification
-Section 50
-Paragraph 3
-Subparagraph (c)
-Publisher FASB
-URI https://asc.fasb.org/1943274/2147481687/323-10-50-3
Reference 8: http://www.xbrl.org/2003/role/disclosureRef
-Topic 825
-SubTopic 10
-Name Accounting Standards Codification
-Section 50
-Paragraph 28
-Subparagraph (f)
-Publisher FASB
-URI https://asc.fasb.org/1943274/2147482907/825-10-50-28
Reference 9: http://www.xbrl.org/2003/role/disclosureRef
-Topic 220
-SubTopic 10
-Name Accounting Standards Codification
-Section 50
-Paragraph 6
-Publisher FASB
-URI https://asc.fasb.org/1943274/2147482765/220-10-50-6
Reference 10: http://www.xbrl.org/2003/role/disclosureRef
-Topic 250
-SubTopic 10
-Name Accounting Standards Codification
-Section 50
-Paragraph 3
-Publisher FASB
-URI https://asc.fasb.org/1943274/2147483443/250-10-50-3
Reference 11: http://www.xbrl.org/2003/role/disclosureRef
-Topic 250
-SubTopic 10
-Name Accounting Standards Codification
-Section 50
-Paragraph 1
-Subparagraph (b)(2)
-Publisher FASB
-URI https://asc.fasb.org/1943274/2147483443/250-10-50-1
Reference 12: http://www.xbrl.org/2003/role/disclosureRef
-Topic 815
-SubTopic 40
-Name Accounting Standards Codification
-Section 65
-Paragraph 1
-Subparagraph (f)
-Publisher FASB
-URI https://asc.fasb.org/1943274/2147480175/815-40-65-1
Reference 13: http://www.xbrl.org/2003/role/disclosureRef
-Topic 250
-SubTopic 10
-Name Accounting Standards Codification
-Section 50
-Paragraph 8
-Publisher FASB
-URI https://asc.fasb.org/1943274/2147483443/250-10-50-8
Reference 14: http://www.xbrl.org/2003/role/disclosureRef
-Topic 250
-SubTopic 10
-Name Accounting Standards Codification
-Section 50
-Paragraph 11
-Subparagraph (a)
-Publisher FASB
-URI https://asc.fasb.org/1943274/2147483443/250-10-50-11
Reference 15: http://www.xbrl.org/2003/role/disclosureRef
-Topic 250
-SubTopic 10
-Name Accounting Standards Codification
-Section 50
-Paragraph 11
-Subparagraph (b)
-Publisher FASB
-URI https://asc.fasb.org/1943274/2147483443/250-10-50-11
Reference 16: http://www.xbrl.org/2003/role/disclosureRef
-Topic 250
-SubTopic 10
-Name Accounting Standards Codification
-Section 50
-Paragraph 4
-Publisher FASB
-URI https://asc.fasb.org/1943274/2147483443/250-10-50-4
Reference 17: http://www.xbrl.org/2003/role/exampleRef
-Topic 946
-SubTopic 830
-Name Accounting Standards Codification
-Section 55
-Paragraph 10
-Publisher FASB
-URI https://asc.fasb.org/1943274/2147479168/946-830-55-10
Reference 18: http://www.xbrl.org/2003/role/disclosureRef
-Topic 946
-SubTopic 220
-Name Accounting Standards Codification
-Section 45
-Paragraph 7
-Publisher FASB
-URI https://asc.fasb.org/1943274/2147479105/946-220-45-7
Reference 19: http://www.xbrl.org/2003/role/disclosureRef
-Topic 944
-SubTopic 220
-Name Accounting Standards Codification
-Section S99
-Paragraph 1
-Subparagraph (SX 210.7-04(18))
-Publisher FASB
-URI https://asc.fasb.org/1943274/2147477250/944-220-S99-1
Reference 20: http://www.xbrl.org/2003/role/disclosureRef
-Topic 946
-SubTopic 220
-Name Accounting Standards Codification
-Section S99
-Paragraph 1
-Subparagraph (SX 210.6-07(9))
-Publisher FASB
-URI https://asc.fasb.org/1943274/2147479134/946-220-S99-1
Reference 21: http://www.xbrl.org/2003/role/disclosureRef
-Topic 946
-SubTopic 220
-Name Accounting Standards Codification
-Section S99
-Paragraph 3
-Subparagraph (SX 210.6-09(1)(d))
-Publisher FASB
-URI https://asc.fasb.org/1943274/2147479134/946-220-S99-3
Reference 22: http://www.xbrl.org/2003/role/disclosureRef
-Topic 470
-SubTopic 10
-Name Accounting Standards Codification
-Section S99
-Paragraph 1A
-Subparagraph (SX 210.13-01(a)(4)(i))
-Publisher FASB
-URI https://asc.fasb.org/1943274/2147480097/470-10-S99-1A
Reference 23: http://www.xbrl.org/2009/role/commonPracticeRef
-Topic 470
-SubTopic 10
-Name Accounting Standards Codification
-Section S99
-Paragraph 1A
-Subparagraph (SX 210.13-01(a)(4)(ii))
-Publisher FASB
-URI https://asc.fasb.org/1943274/2147480097/470-10-S99-1A
Reference 24: http://www.xbrl.org/2003/role/disclosureRef
-Topic 470
-SubTopic 10
-Name Accounting Standards Codification
-Section S99
-Paragraph 1A
-Subparagraph (SX 210.13-01(a)(4)(iii)(A))
-Publisher FASB
-URI https://asc.fasb.org/1943274/2147480097/470-10-S99-1A
Reference 25: http://www.xbrl.org/2003/role/disclosureRef
-Topic 470
-SubTopic 10
-Name Accounting Standards Codification
-Section S99
-Paragraph 1A
-Subparagraph (SX 210.13-01(a)(4)(iv))
-Publisher FASB
-URI https://asc.fasb.org/1943274/2147480097/470-10-S99-1A
Reference 26: http://www.xbrl.org/2003/role/disclosureRef
-Topic 470
-SubTopic 10
-Name Accounting Standards Codification
-Section S99
-Paragraph 1A
-Subparagraph (SX 210.13-01(a)(5))
-Publisher FASB
-URI https://asc.fasb.org/1943274/2147480097/470-10-S99-1A
Reference 27: http://www.xbrl.org/2003/role/disclosureRef
-Topic 470
-SubTopic 10
-Name Accounting Standards Codification
-Section S99
-Paragraph 1B
-Subparagraph (SX 210.13-02(a)(4)(i))
-Publisher FASB
-URI https://asc.fasb.org/1943274/2147480097/470-10-S99-1B
Reference 28: http://www.xbrl.org/2003/role/disclosureRef
-Topic 470
-SubTopic 10
-Name Accounting Standards Codification
-Section S99
-Paragraph 1B
-Subparagraph (SX 210.13-02(a)(4)(iii)(A))
-Publisher FASB
-URI https://asc.fasb.org/1943274/2147480097/470-10-S99-1B
Reference 29: http://www.xbrl.org/2003/role/disclosureRef
-Topic 470
-SubTopic 10
-Name Accounting Standards Codification
-Section S99
-Paragraph 1B
-Subparagraph (SX 210.13-02(a)(4)(iii)(B))
-Publisher FASB
-URI https://asc.fasb.org/1943274/2147480097/470-10-S99-1B
Reference 30: http://www.xbrl.org/2003/role/disclosureRef
-Topic 470
-SubTopic 10
-Name Accounting Standards Codification
-Section S99
-Paragraph 1B
-Subparagraph (SX 210.13-02(a)(4)(iv))
-Publisher FASB
-URI https://asc.fasb.org/1943274/2147480097/470-10-S99-1B
Reference 31: http://www.xbrl.org/2003/role/disclosureRef
-Topic 470
-SubTopic 10
-Name Accounting Standards Codification
-Section S99
-Paragraph 1B
-Subparagraph (SX 210.13-02(a)(5))
-Publisher FASB
-URI https://asc.fasb.org/1943274/2147480097/470-10-S99-1B
Reference 32: http://www.xbrl.org/2003/role/disclosureRef
-Topic 260
-SubTopic 10
-Name Accounting Standards Codification
-Section 45
-Paragraph 60B
-Subparagraph (a)
-Publisher FASB
-URI https://asc.fasb.org/1943274/2147482689/260-10-45-60B
Reference 33: http://www.xbrl.org/2003/role/disclosureRef
-Topic 205
-SubTopic 20
-Name Accounting Standards Codification
-Section 50
-Paragraph 7
-Publisher FASB
-URI https://asc.fasb.org/1943274/2147483499/205-20-50-7
Reference 34: http://fasb.org/us-gaap/role/ref/legacyRef
-Topic 230
-SubTopic 10
-Name Accounting Standards Codification
-Section 45
-Paragraph 28
-Publisher FASB
-URI https://asc.fasb.org/1943274/2147482740/230-10-45-28
Reference 35: http://www.xbrl.org/2003/role/disclosureRef
-Topic 220
-SubTopic 10
-Name Accounting Standards Codification
-Section 45
-Paragraph 1A
-Subparagraph (a)
-Publisher FASB
-URI https://asc.fasb.org/1943274/2147482790/220-10-45-1A
Reference 36: http://www.xbrl.org/2003/role/disclosureRef
-Topic 220
-SubTopic 10
-Name Accounting Standards Codification
-Section 45
-Paragraph 1B
-Subparagraph (a)
-Publisher FASB
-URI https://asc.fasb.org/1943274/2147482790/220-10-45-1B
Reference 37: http://fasb.org/us-gaap/role/ref/legacyRef
-Topic 942
-SubTopic 220
-Name Accounting Standards Codification
-Section S99
-Paragraph 1
-Subparagraph (SX 210.9-04(22))
-Publisher FASB
-URI https://asc.fasb.org/1943274/2147478524/942-220-S99-1
| Name: |
us-gaap_NetIncomeLoss |
| Namespace Prefix: |
us-gaap_ |
| Data Type: |
xbrli:monetaryItemType |
| Balance Type: |
credit |
| Period Type: |
duration |
|
| X |
- DefinitionAmount, after deduction of tax, noncontrolling interests, dividends on preferred stock and participating securities, and addition from assumption of issuance of common shares for dilutive potential common shares; of income (loss) available to common shareholders. Reference 1: http://www.xbrl.org/2003/role/disclosureRef
-Topic 220
-SubTopic 10
-Name Accounting Standards Codification
-Section S99
-Paragraph 5
-Subparagraph (SAB Topic 6.B)
-Publisher FASB
-URI https://asc.fasb.org/1943274/2147483621/220-10-S99-5
Reference 2: http://www.xbrl.org/2003/role/disclosureRef
-Topic 260
-SubTopic 10
-Name Accounting Standards Codification
-Section 50
-Paragraph 1
-Subparagraph (a)
-Publisher FASB
-URI https://asc.fasb.org/1943274/2147482662/260-10-50-1
Reference 3: http://www.xbrl.org/2003/role/disclosureRef
-Topic 260
-SubTopic 10
-Name Accounting Standards Codification
-Section 45
-Paragraph 16
-Publisher FASB
-URI https://asc.fasb.org/1943274/2147482689/260-10-45-16
Reference 4: http://www.xbrl.org/2003/role/disclosureRef
-Topic 260
-SubTopic 10
-Name Accounting Standards Codification
-Section 45
-Paragraph 40
-Subparagraph (b)(1)
-Publisher FASB
-URI https://asc.fasb.org/1943274/2147482689/260-10-45-40
Reference 5: http://www.xbrl.org/2003/role/disclosureRef
-Topic 260
-SubTopic 10
-Name Accounting Standards Codification
-Section 45
-Paragraph 60B
-Subparagraph (c)
-Publisher FASB
-URI https://asc.fasb.org/1943274/2147482689/260-10-45-60B
Reference 6: http://www.xbrl.org/2003/role/disclosureRef
-Topic 260
-SubTopic 10
-Name Accounting Standards Codification
-Section 45
-Paragraph 40
-Subparagraph (a)
-Publisher FASB
-URI https://asc.fasb.org/1943274/2147482689/260-10-45-40
Reference 7: http://www.xbrl.org/2003/role/disclosureRef
-Topic 260
-SubTopic 10
-Name Accounting Standards Codification
-Section 45
-Paragraph 40
-Subparagraph (b)(2)
-Publisher FASB
-URI https://asc.fasb.org/1943274/2147482689/260-10-45-40
Reference 8: http://www.xbrl.org/2003/role/disclosureRef
-Topic 260
-SubTopic 10
-Name Accounting Standards Codification
-Section 45
-Paragraph 40
-Subparagraph (b)(3)
-Publisher FASB
-URI https://asc.fasb.org/1943274/2147482689/260-10-45-40
| Name: |
us-gaap_NetIncomeLossAvailableToCommonStockholdersDiluted |
| Namespace Prefix: |
us-gaap_ |
| Data Type: |
xbrli:monetaryItemType |
| Balance Type: |
credit |
| Period Type: |
duration |
|
| X |
- DefinitionThe sum of dilutive potential common shares or units used in the calculation of the diluted per-share or per-unit computation. Reference 1: http://www.xbrl.org/2009/role/commonPracticeRef
-Topic 260
-SubTopic 10
-Name Accounting Standards Codification
-Section 50
-Paragraph 1
-Subparagraph (a)
-Publisher FASB
-URI https://asc.fasb.org/1943274/2147482662/260-10-50-1
| Name: |
us-gaap_WeightedAverageNumberDilutedSharesOutstandingAdjustment |
| Namespace Prefix: |
us-gaap_ |
| Data Type: |
xbrli:sharesItemType |
| Balance Type: |
na |
| Period Type: |
duration |
|
| X |
- DefinitionThe average number of shares or units issued and outstanding that are used in calculating diluted EPS or earnings per unit (EPU), determined based on the timing of issuance of shares or units in the period. Reference 1: http://www.xbrl.org/2003/role/disclosureRef
-Topic 260
-SubTopic 10
-Name Accounting Standards Codification
-Section 50
-Paragraph 1
-Subparagraph (a)
-Publisher FASB
-URI https://asc.fasb.org/1943274/2147482662/260-10-50-1
Reference 2: http://www.xbrl.org/2003/role/disclosureRef
-Topic 260
-SubTopic 10
-Name Accounting Standards Codification
-Section 45
-Paragraph 16
-Publisher FASB
-URI https://asc.fasb.org/1943274/2147482689/260-10-45-16
| Name: |
us-gaap_WeightedAverageNumberOfDilutedSharesOutstanding |
| Namespace Prefix: |
us-gaap_ |
| Data Type: |
xbrli:sharesItemType |
| Balance Type: |
na |
| Period Type: |
duration |
|
| X |
- DefinitionNumber of [basic] shares or units, after adjustment for contingently issuable shares or units and other shares or units not deemed outstanding, determined by relating the portion of time within a reporting period that common shares or units have been outstanding to the total time in that period. Reference 1: http://www.xbrl.org/2003/role/disclosureRef
-Topic 260
-SubTopic 10
-Name Accounting Standards Codification
-Section 50
-Paragraph 1
-Subparagraph (a)
-Publisher FASB
-URI https://asc.fasb.org/1943274/2147482662/260-10-50-1
Reference 2: http://www.xbrl.org/2003/role/disclosureRef
-Topic 260
-SubTopic 10
-Name Accounting Standards Codification
-Section 45
-Paragraph 10
-Publisher FASB
-URI https://asc.fasb.org/1943274/2147482689/260-10-45-10
| Name: |
us-gaap_WeightedAverageNumberOfSharesOutstandingBasic |
| Namespace Prefix: |
us-gaap_ |
| Data Type: |
xbrli:sharesItemType |
| Balance Type: |
na |
| Period Type: |
duration |
|
| X |
- Details
| Name: |
us-gaap_AwardTypeAxis=us-gaap_EmployeeStockOptionMember |
| Namespace Prefix: |
|
| Data Type: |
na |
| Balance Type: |
|
| Period Type: |
|
|
| X |
- Details
| Name: |
us-gaap_AwardTypeAxis=us-gaap_RestrictedStockUnitsRSUMember |
| Namespace Prefix: |
|
| Data Type: |
na |
| Balance Type: |
|
| Period Type: |
|
|
v3.24.2
COMMITMENTS AND CONTINGENCIES (Details) - USD ($)
|
|
|
|
1 Months Ended |
3 Months Ended |
6 Months Ended |
|
|
Mar. 04, 2024 |
Sep. 15, 2022 |
May 09, 2022 |
May 31, 2024 |
Jun. 30, 2024 |
Jun. 30, 2023 |
Jun. 30, 2024 |
Jun. 30, 2023 |
Dec. 31, 2023 |
Sep. 29, 2022 |
| Loss Contingencies [Line Items] |
|
|
|
|
|
|
|
|
|
|
| Litigation liability |
|
|
|
|
|
|
|
|
$ 0
|
|
| Outstanding letters of credit |
|
|
|
|
$ 27,300,000
|
|
$ 27,300,000
|
|
$ 27,300,000
|
|
| Litigation aggregate |
$ 35,000,000
|
|
|
|
|
|
|
|
|
|
| Litigation settlement, net of recoveries |
|
|
|
$ 32,400,000
|
$ 0
|
$ 0
|
$ 32,403,000
|
$ 0
|
|
|
| Expected insurance coverage recovery |
|
|
|
$ 2,600,000
|
|
|
|
|
|
|
| Appian Corp. v. Pegasystems Inc. & Youyong Zou |
|
|
|
|
|
|
|
|
|
|
| Loss Contingencies [Line Items] |
|
|
|
|
|
|
|
|
|
|
| Outstanding letters of credit |
|
|
|
|
|
|
|
|
|
$ 25,000,000
|
| Appian Corp. v. Pegasystems Inc. & Youyong Zou | Judicial Ruling |
|
|
|
|
|
|
|
|
|
|
| Loss Contingencies [Line Items] |
|
|
|
|
|
|
|
|
|
|
| Loss contingency, damages awarded, value |
|
$ 2,060,479,287
|
|
|
|
|
|
|
|
|
| Trade Secret Misappropriation | Appian Corp. v. Pegasystems Inc. & Youyong Zou |
|
|
|
|
|
|
|
|
|
|
| Loss Contingencies [Line Items] |
|
|
|
|
|
|
|
|
|
|
| Legal fees, post-judgement interest rate, percentage |
|
6.00%
|
|
|
|
|
|
|
|
|
| Trade Secret Misappropriation | Appian Corp. v. Pegasystems Inc. & Youyong Zou | Judicial Ruling |
|
|
|
|
|
|
|
|
|
|
| Loss Contingencies [Line Items] |
|
|
|
|
|
|
|
|
|
|
| Loss contingency, damages awarded, value |
|
|
$ 2,036,860,045
|
|
|
|
|
|
|
|
| Violation of the Virginia Computer Crimes Act | Appian Corp. v. Pegasystems Inc. & Youyong Zou | Judicial Ruling |
|
|
|
|
|
|
|
|
|
|
| Loss Contingencies [Line Items] |
|
|
|
|
|
|
|
|
|
|
| Loss contingency, damages awarded, value |
|
|
$ 1.00
|
|
|
|
|
|
|
|
| X |
- DefinitionLegal Fees, Post-judgement Interest Rate, Percentage
| Name: |
pega_LegalFeesPostJudgementInterestRatePercentage |
| Namespace Prefix: |
pega_ |
| Data Type: |
dtr-types1:percentItemType |
| Balance Type: |
na |
| Period Type: |
instant |
|
| X |
- DefinitionCarrying amount as of the balance sheet date of amounts expected to be recovered under the terms of insurance contracts. Reference 1: http://www.xbrl.org/2009/role/commonPracticeRef
-Topic 210
-SubTopic 10
-Name Accounting Standards Codification
-Section S99
-Paragraph 1
-Subparagraph (SX 210.5-02(17))
-Publisher FASB
-URI https://asc.fasb.org/1943274/2147480566/210-10-S99-1
| Name: |
us-gaap_EstimatedInsuranceRecoveries |
| Namespace Prefix: |
us-gaap_ |
| Data Type: |
xbrli:monetaryItemType |
| Balance Type: |
debit |
| Period Type: |
instant |
|
| X |
- DefinitionThe total amount of the contingent obligation under letters of credit outstanding as of the reporting date.
| Name: |
us-gaap_LettersOfCreditOutstandingAmount |
| Namespace Prefix: |
us-gaap_ |
| Data Type: |
xbrli:monetaryItemType |
| Balance Type: |
credit |
| Period Type: |
instant |
|
| X |
- DefinitionCarrying amount of reserve for known or estimated probable loss from litigation, which may include attorneys' fees and other litigation costs, which is expected to be paid within one year of the date of the statement of financial position. Reference 1: http://www.xbrl.org/2009/role/commonPracticeRef
-Topic 450
-SubTopic 20
-Name Accounting Standards Codification
-Section 50
-Paragraph 1
-Publisher FASB
-URI https://asc.fasb.org/1943274/2147483076/450-20-50-1
Reference 2: http://fasb.org/us-gaap/role/ref/legacyRef
-Topic 210
-SubTopic 10
-Name Accounting Standards Codification
-Section S99
-Paragraph 1
-Subparagraph (SX 210.5-02(25))
-Publisher FASB
-URI https://asc.fasb.org/1943274/2147480566/210-10-S99-1
| Name: |
us-gaap_LitigationReserveCurrent |
| Namespace Prefix: |
us-gaap_ |
| Data Type: |
xbrli:monetaryItemType |
| Balance Type: |
credit |
| Period Type: |
instant |
|
| X |
- DefinitionAmount awarded to other party in judgment or settlement of litigation.
| Name: |
us-gaap_LitigationSettlementAmountAwardedToOtherParty |
| Namespace Prefix: |
us-gaap_ |
| Data Type: |
xbrli:monetaryItemType |
| Balance Type: |
credit |
| Period Type: |
duration |
|
| X |
- DefinitionAmount of litigation expense, including but not limited to legal, forensic, accounting, and investigative fees. Reference 1: http://www.xbrl.org/2009/role/commonPracticeRef
-Name Accounting Standards Codification
-Section S99
-Paragraph 2
-Subparagraph (SX 210.5-03(6))
-SubTopic 10
-Topic 220
-Publisher FASB
-URI https://asc.fasb.org/1943274/2147483621/220-10-S99-2
| Name: |
us-gaap_LitigationSettlementExpense |
| Namespace Prefix: |
us-gaap_ |
| Data Type: |
xbrli:monetaryItemType |
| Balance Type: |
debit |
| Period Type: |
duration |
|
| X |
- DefinitionLine items represent financial concepts included in a table. These concepts are used to disclose reportable information associated with domain members defined in one or many axes to the table. Reference 1: http://www.xbrl.org/2009/role/commonPracticeRef
-Topic 450
-SubTopic 20
-Name Accounting Standards Codification
-Section 50
-Paragraph 4
-Subparagraph (a)
-Publisher FASB
-URI https://asc.fasb.org/1943274/2147483076/450-20-50-4
Reference 2: http://www.xbrl.org/2009/role/commonPracticeRef
-Topic 450
-SubTopic 20
-Name Accounting Standards Codification
-Section 50
-Paragraph 9
-Subparagraph (a)
-Publisher FASB
-URI https://asc.fasb.org/1943274/2147483076/450-20-50-9
Reference 3: http://www.xbrl.org/2003/role/disclosureRef
-Topic 720
-SubTopic 20
-Name Accounting Standards Codification
-Section 50
-Paragraph 1
-Publisher FASB
-URI https://asc.fasb.org/1943274/2147483359/720-20-50-1
Reference 4: http://www.xbrl.org/2003/role/exampleRef
-Topic 460
-SubTopic 10
-Name Accounting Standards Codification
-Section 55
-Paragraph 27
-Publisher FASB
-URI https://asc.fasb.org/1943274/2147482395/460-10-55-27
Reference 5: http://www.xbrl.org/2003/role/disclosureRef
-Topic 450
-SubTopic 20
-Name Accounting Standards Codification
-Section 50
-Paragraph 9
-Subparagraph (b)
-Publisher FASB
-URI https://asc.fasb.org/1943274/2147483076/450-20-50-9
Reference 6: http://www.xbrl.org/2003/role/disclosureRef
-Topic 450
-SubTopic 20
-Name Accounting Standards Codification
-Section 50
-Paragraph 4
-Subparagraph (b)
-Publisher FASB
-URI https://asc.fasb.org/1943274/2147483076/450-20-50-4
Reference 7: http://www.xbrl.org/2003/role/disclosureRef
-Topic 460
-SubTopic 10
-Name Accounting Standards Codification
-Section 50
-Paragraph 3
-Publisher FASB
-URI https://asc.fasb.org/1943274/2147482425/460-10-50-3
Reference 8: http://www.xbrl.org/2003/role/disclosureRef
-Topic 450
-SubTopic 20
-Name Accounting Standards Codification
-Section 50
-Paragraph 1
-Publisher FASB
-URI https://asc.fasb.org/1943274/2147483076/450-20-50-1
| Name: |
us-gaap_LossContingenciesLineItems |
| Namespace Prefix: |
us-gaap_ |
| Data Type: |
xbrli:stringItemType |
| Balance Type: |
na |
| Period Type: |
duration |
|
| X |
- DefinitionAmount of damages awarded to the plaintiff in the legal matter. Reference 1: http://www.xbrl.org/2009/role/commonPracticeRef
-Topic 450
-SubTopic 20
-Name Accounting Standards Codification
-Section 50
-Paragraph 1
-Publisher FASB
-URI https://asc.fasb.org/1943274/2147483076/450-20-50-1
Reference 2: http://www.xbrl.org/2009/role/commonPracticeRef
-Topic 450
-SubTopic 20
-Name Accounting Standards Codification
-Section 50
-Paragraph 4
-Subparagraph (a)
-Publisher FASB
-URI https://asc.fasb.org/1943274/2147483076/450-20-50-4
Reference 3: http://www.xbrl.org/2009/role/commonPracticeRef
-Topic 450
-SubTopic 20
-Name Accounting Standards Codification
-Section 50
-Paragraph 9
-Subparagraph (a)
-Publisher FASB
-URI https://asc.fasb.org/1943274/2147483076/450-20-50-9
| Name: |
us-gaap_LossContingencyDamagesAwardedValue |
| Namespace Prefix: |
us-gaap_ |
| Data Type: |
xbrli:monetaryItemType |
| Balance Type: |
debit |
| Period Type: |
duration |
|
| X |
- Details
| Name: |
srt_LitigationCaseAxis=pega_AppianCorpVPegasystemsIncYouyongZouMember |
| Namespace Prefix: |
|
| Data Type: |
na |
| Balance Type: |
|
| Period Type: |
|
|
| X |
- Details
| Name: |
us-gaap_LitigationStatusAxis=us-gaap_JudicialRulingMember |
| Namespace Prefix: |
|
| Data Type: |
na |
| Balance Type: |
|
| Period Type: |
|
|
| X |
- Details
| Name: |
us-gaap_ContingentConsiderationByTypeAxis=pega_TradeSecretMisappropriationMember |
| Namespace Prefix: |
|
| Data Type: |
na |
| Balance Type: |
|
| Period Type: |
|
|
| X |
- Details
| Name: |
us-gaap_ContingentConsiderationByTypeAxis=pega_ViolationOfTheVirginiaComputerCrimesActMember |
| Namespace Prefix: |
|
| Data Type: |
na |
| Balance Type: |
|
| Period Type: |
|
|
Pegasystems (NASDAQ:PEGA)
過去 株価チャート
から 6 2024 まで 7 2024

Pegasystems (NASDAQ:PEGA)
過去 株価チャート
から 7 2023 まで 7 2024
