UNITED STATES
SECURITIES AND EXCHANGE COMMISSION
Washington, D.C. 20549
FORM 6-K
REPORT OF FOREIGN PRIVATE ISSUER PURSUANT TO RULE 13a-16 OR 15d-16
UNDER THE SECURITIES EXCHANGE ACT OF 1934
For the month of May 2024
Commission File Number: 001-33153
ENDEAVOUR SILVER CORP.
(Translation of registrant's name into English)
#1130-609 Granville Street
Vancouver, British Columbia, Canada V7Y 1G5
(Address of principal executive offices)
Indicate by check mark whether the registrant files or will file annual reports under cover Form 20-F or Form 40-F.
[ ] Form 20-F [ x ] Form 40-F
Indicate by check mark if the registrant is submitting the Form 6-K in paper as permitted by Regulation S-T Rule 101(b)(1): [ ]
Indicate by check mark if the registrant is submitting the Form 6-K in paper as permitted by Regulation S-T Rule 101(b)(7): [ ]
Incorporated by Reference
Exhibits 99.1 and 99.2 to this Form 6-K of Endeavour Silver Corp. (the “Company”) are hereby incorporated by reference as exhibits to the Registration Statement on Form F-10 (File No. 333-272755) of the Company, as amended or supplemented.
SUBMITTED HEREWITH
SIGNATURES
Pursuant to the requirements of the Securities Exchange Act of 1934, the registrant has duly caused this report to be signed on its behalf by the undersigned, thereunto duly authorized.
| |
Endeavour Silver Corp. |
| |
(Registrant) |
| |
|
|
| Date: May 9, 2024 |
By: |
/s/ Daniel Dickson |
| |
|
Daniel Dickson |
| |
Title: |
CEO |

Endeavour Silver Corp.
Condensed Consolidated Interim Financial Statements
Prepared by Management
Three Months Ended March 31, 2024 and 2023
ENDEAVOUR SILVER CORP.
CONDENSED CONSOLIDATED INTERIM STATEMENTS OF FINANCIAL POSITION
(unaudited - prepared by management)
(expressed in thousands of US dollars)
| |
|
|
|
|
|
|
|
| |
|
|
March 31, |
|
|
December 31, |
|
| |
Notes |
|
2024 |
|
|
2023 |
|
| |
|
|
|
|
|
|
|
| ASSETS |
|
|
|
|
|
|
|
| |
|
|
|
|
|
|
|
| Current assets |
|
|
|
|
|
|
|
| Cash and cash equivalents |
|
$ |
34,876 |
|
$ |
35,286 |
|
| Other investments |
4 |
|
1,631 |
|
|
5,135 |
|
| Accounts and other receivables |
5 |
|
44,251 |
|
|
22,276 |
|
| Income tax receivable |
|
|
2,893 |
|
|
3,268 |
|
| Inventories |
6 |
|
21,322 |
|
|
27,258 |
|
| Prepaids and other assets |
|
|
6,796 |
|
|
7,550 |
|
| Total current assets |
|
|
111,769 |
|
|
100,773 |
|
| |
|
|
|
|
|
|
|
| Non-current income tax receivable |
|
|
4,341 |
|
|
4,262 |
|
| Non-current IVA receivable |
5 |
|
10,769 |
|
|
23,320 |
|
| Non-current loans receivable |
5 |
|
1,449 |
|
|
1,874 |
|
| Deferred financing fees |
9 |
|
8,241 |
|
|
7,545 |
|
| Other non-current assets |
8 |
|
31,210 |
|
|
22,376 |
|
| Mineral properties, plant and equipment |
8, 9 |
|
342,409 |
|
|
314,657 |
|
| |
|
|
|
|
|
|
|
| Total assets |
|
$ |
510,188 |
|
$ |
474,807 |
|
| |
|
|
|
|
|
|
|
| LIABILITIES AND SHAREHOLDERS' EQUITY |
|
|
|
|
|
|
|
| |
|
|
|
|
|
|
|
| Current liabilities |
|
|
|
|
|
|
|
| Accounts payable, accrued liabilities and other current liabilities |
|
$ |
43,913 |
|
$ |
46,582 |
|
| Income taxes payable |
|
|
7,930 |
|
|
7,801 |
|
| Loans payable |
9 |
|
3,514 |
|
|
3,861 |
|
| Total current liabilities |
|
|
55,357 |
|
|
58,244 |
|
| |
|
|
|
|
|
|
|
| Loans payable |
9 |
|
3,817 |
|
|
4,658 |
|
| Provision for reclamation and rehabilitation |
|
|
9,191 |
|
|
8,745 |
|
| Deferred income tax liability |
|
|
13,599 |
|
|
13,730 |
|
| Other non-current liabilities |
|
|
2,997 |
|
|
3,089 |
|
| Total liabilities |
|
|
84,961 |
|
|
88,466 |
|
| |
|
|
|
|
|
|
|
| Shareholders' equity |
|
|
|
|
|
|
|
| Common shares, unlimited shares authorized |
|
|
761,605 |
|
|
722,695 |
|
| Contributed surplus |
|
|
5,726 |
|
|
4,556 |
|
| Retained deficit |
|
|
(342,104 |
) |
|
(340,910 |
) |
| Total shareholders' equity |
|
|
425,227 |
|
|
386,341 |
|
| Total liabilities and shareholders' equity |
|
$ |
510,188 |
|
$ |
474,807 |
|
The accompanying notes are an integral part of these consolidated financial statements.
Approved on behalf of the Board:
| /s/ Margaret Beck |
|
/s/ Daniel Dickson |
| Director |
|
Director |
ENDEAVOUR SILVER CORP.
CONDENSED CONSOLIDATED INTERIM STATEMENTS OF COMPREHENSIVE EARNINGS (LOSS)
(unaudited - prepared by management)
(expressed in thousands of US dollars, except for shares and per share amounts)
| |
|
|
|
|
| |
|
|
Three months ended |
|
| |
|
|
March 31, |
|
|
March 31, |
|
| |
Notes |
|
2024 |
|
|
2023 |
|
| |
|
|
|
|
|
|
|
| Revenue |
11 |
$ |
63,725 |
|
$ |
55,461 |
|
| |
|
|
|
|
|
|
|
| Cost of sales: |
|
|
|
|
|
|
|
| Direct production costs |
|
|
36,705 |
|
|
26,516 |
|
| Royalties |
|
|
6,408 |
|
|
6,535 |
|
| Share-based compensation |
10 (b)(c) |
|
79 |
|
|
132 |
|
| Depreciation |
|
|
8,877 |
|
|
6,253 |
|
| |
|
|
52,069 |
|
|
39,436 |
|
| |
|
|
|
|
|
|
|
| Mine operating earnings |
|
|
11,656 |
|
|
16,025 |
|
| |
|
|
|
|
|
|
|
| Expenses: |
|
|
|
|
|
|
|
| Exploration, evaluation and development |
12 |
|
4,270 |
|
|
4,164 |
|
| General and administrative |
13 |
|
4,044 |
|
|
4,917 |
|
| |
|
|
|
|
|
|
|
| |
|
|
8,314 |
|
|
9,081 |
|
| |
|
|
|
|
|
|
|
| Operating earnings |
|
|
3,342 |
|
|
6,944 |
|
| |
|
|
|
|
|
|
|
| Finance costs |
|
|
314 |
|
|
400 |
|
| |
|
|
|
|
|
|
|
| Other income (expense): |
|
|
|
|
|
|
|
| Foreign exchange gain |
|
|
1,179 |
|
|
1,889 |
|
| Investment and other |
|
|
33 |
|
|
4,144 |
|
| |
|
|
1,212 |
|
|
6,033 |
|
| |
|
|
|
|
|
|
|
| Earnings before income taxes |
|
|
4,240 |
|
|
12,577 |
|
| |
|
|
|
|
|
|
|
| Income tax expense: |
|
|
|
|
|
|
|
| Current income tax expense |
|
|
5,667 |
|
|
4,445 |
|
| Deferred income tax expense (recovery) |
|
|
(233 |
) |
|
1,676 |
|
| |
|
|
5,434 |
|
|
6,121 |
|
| |
|
|
|
|
|
|
|
| Net earnings (loss) and comprehensive earnings (loss) for the period |
|
$ |
(1,194 |
) |
$ |
6,456 |
|
| |
|
|
|
|
|
|
|
| Basic earnings (loss) per share |
|
$ |
(0.01 |
) |
$ |
0.03 |
|
| Diluted earnings (loss) per share |
10(f) |
$ |
(0.01 |
) |
$ |
0.03 |
|
| |
|
|
|
|
|
|
|
| Basic weighted average number of shares outstanding |
|
|
227,503,581 |
|
|
190,274,768 |
|
| Diluted weighted average number of shares outstanding |
10(f) |
|
227,503,581 |
|
|
192,295,971 |
|
The accompanying notes are an integral part of these consolidated financial statements.
ENDEAVOUR SILVER CORP.
CONSOLIDATED STATEMENTS OF CHANGES IN SHAREHOLDERS' EQUITY
(unaudited - prepared by management)
(expressed in thousands of US dollars, except for shares and per share amounts)
| |
|
|
|
|
|
|
|
|
|
|
|
|
|
|
|
|
| |
|
|
|
|
|
|
|
|
|
|
|
|
|
|
Total |
|
| |
|
|
Number of |
|
|
Share |
|
|
Contributed |
|
|
Retained |
|
|
Shareholders' |
|
| |
Notes |
|
shares |
|
|
Capital |
|
|
Surplus |
|
|
Deficit |
|
|
Equity |
|
| |
|
|
|
|
|
|
|
|
|
|
|
|
|
|
|
|
| Balance at December 31, 2022 |
|
|
189,995,563 |
|
$ |
657,866 |
|
$ |
6,115 |
|
$ |
(348,087 |
) |
$ |
315,894 |
|
| |
|
|
|
|
|
|
|
|
|
|
|
|
|
|
|
|
| Exercise of options |
10 (b) |
|
869,000 |
|
|
2,758 |
|
|
(946 |
) |
|
- |
|
|
1,812 |
|
| Settlement of performance and deferred share units |
10 (c) |
|
411,836 |
|
|
405 |
|
|
(2,817 |
) |
|
- |
|
|
(2,412 |
) |
| Share-based compensation |
10 (b)(c) |
|
- |
|
|
- |
|
|
1,625 |
|
|
- |
|
|
1,625 |
|
| Canceled options |
10 (b) |
|
- |
|
|
- |
|
|
(4 |
) |
|
4 |
|
|
- |
|
| Earnings for the period |
|
|
- |
|
|
- |
|
|
- |
|
|
6,456 |
|
|
6,456 |
|
| |
|
|
|
|
|
|
|
|
|
|
|
|
|
|
|
|
| Balance at March 31, 2023 |
|
|
191,276,399 |
|
$ |
661,029 |
|
$ |
3,973 |
|
$ |
(341,627 |
) |
$ |
323,375 |
|
| |
|
|
|
|
|
|
|
|
|
|
|
|
|
|
|
|
| Public equity offerings, net of issuance costs |
10 (a) |
|
25,740,193 |
|
|
60,666 |
|
|
- |
|
|
- |
|
|
60,666 |
|
| Exercise of options |
10 (b) |
|
228,900 |
|
|
1,000 |
|
|
(359 |
) |
|
- |
|
|
641 |
|
| Share-based compensation |
10 (b)(c) |
|
- |
|
|
- |
|
|
1,992 |
|
|
- |
|
|
1,992 |
|
| Canceled options |
10 (b) |
|
- |
|
|
- |
|
|
(1,050 |
) |
|
1,050 |
|
|
- |
|
| Loss for the period |
|
|
- |
|
|
- |
|
|
- |
|
|
(333 |
) |
|
(333 |
) |
| |
|
|
|
|
|
|
|
|
|
|
|
|
|
|
|
|
| Balance at December 31, 2023 |
|
|
217,245,492 |
|
$ |
722,695 |
|
$ |
4,556 |
|
$ |
(340,910 |
) |
$ |
386,341 |
|
| |
|
|
|
|
|
|
|
|
|
|
|
|
|
|
|
|
| Public equity offerings, net of issuance costs |
10 (a) |
|
23,091,986 |
|
|
38,910 |
|
|
- |
|
|
- |
|
|
38,910 |
|
| Share-based compensation |
10 (b)(c) |
|
- |
|
|
- |
|
|
1,170 |
|
|
- |
|
|
1,170 |
|
| Loss for the period |
|
|
- |
|
|
- |
|
|
- |
|
|
(1,194 |
) |
|
(1,194 |
) |
| Balance at March 31, 2024 |
|
|
240,337,478 |
|
$ |
761,605 |
|
$ |
5,726 |
|
$ |
(342,104 |
) |
$ |
425,227 |
|
The accompanying notes are an integral part of these consolidated financial statements.
ENDEAVOUR SILVER CORP.
CONDENSED CONSOLIDATED INTERIM STATEMENTS OF CASH FLOWS
(unaudited - prepared by management)
(expressed in thousands of US dollars)
| |
|
|
|
|
| |
|
|
Three months ended |
|
| |
|
|
March 31, |
|
|
March 31, |
|
| |
Notes |
|
2024 |
|
|
2023 |
|
| |
|
|
|
|
|
|
|
| Operating activities |
|
|
|
|
|
|
|
| Net earnings (loss) for the period |
|
$ |
(1,194 |
) |
$ |
6,456 |
|
| |
|
|
|
|
|
|
|
| Items not affecting cash: |
|
|
|
|
|
|
|
| Share-based compensation |
10 (b)(c) |
|
1,170 |
|
|
1,625 |
|
| Depreciation |
8 |
|
9,135 |
|
|
6,619 |
|
| Deferred income tax expense (recovery) |
|
|
(131 |
) |
|
1,676 |
|
| Unrealized foreign exchange loss |
|
|
136 |
|
|
1,095 |
|
| Finance costs |
|
|
314 |
|
|
400 |
|
| Accretion of loans receivable |
|
|
(75 |
) |
|
(93 |
) |
| Gain (loss) on asset disposal |
|
|
18 |
|
|
(62 |
) |
| Gain (loss) on other investments |
4 |
|
861 |
|
|
(3,097 |
) |
| Performance and deferred share units settled in cash |
|
|
- |
|
|
(2,118 |
) |
| Net changes in non-cash working capital |
14 |
|
(5,651 |
) |
|
(12,902 |
) |
| Cash from (used in) operating activities |
|
|
4,583 |
|
|
(401 |
) |
| |
|
|
|
|
|
|
|
| Investing activities |
|
|
|
|
|
|
|
| Proceeds from disposal of property, plant and equipment |
|
|
18 |
|
|
- |
|
| Payment for mineral properties, plant and equipment |
8 |
|
(44,887 |
) |
|
(20,717 |
) |
| Proceeds from disposal of other investments |
4 |
|
2,643 |
|
|
- |
|
| Redemption of non-current deposits |
|
|
- |
|
|
68 |
|
| Cash used in investing activities |
|
|
(42,226 |
) |
|
(20,649 |
) |
| |
|
|
|
|
|
|
|
| Financing activities |
|
|
|
|
|
|
|
| Repayment of loans payable |
9 |
|
(1,188 |
) |
|
(1,574 |
) |
| Repayment of lease liabilities |
|
|
(97 |
) |
|
(63 |
) |
| Interest paid |
|
|
(135 |
) |
|
(239 |
) |
| Proceeds from public equity offerings |
10 (a) |
|
38,910 |
|
|
- |
|
| Proceeds from exercise of options |
10 (b) |
|
- |
|
|
1,812 |
|
| Proceeds from loans receivable |
|
|
450 |
|
|
100 |
|
| Payment of deferred financing fees |
|
|
(696 |
) |
|
- |
|
| Performance and deferred share units withholding tax settlement |
|
|
- |
|
|
(294 |
) |
| Cash from (used in) financing activities |
|
|
37,244 |
|
|
(258 |
) |
| |
|
|
|
|
|
|
|
| Effect of exchange rate change on cash and cash equivalents |
|
|
(11 |
) |
|
(433 |
) |
| |
|
|
|
|
|
|
|
| Decrease in cash and cash equivalents |
|
|
(410 |
) |
|
(21,741 |
) |
| Cash and cash equivalents, beginning of the period |
|
|
35,286 |
|
|
83,391 |
|
| Cash and cash equivalents, end of the period |
|
$ |
34,876 |
|
$ |
61,650 |
|
Supplemental cash flow information (Note 14)
The accompanying notes are an integral part of these consolidated financial statements.
1. CORPORATE INFORMATION
Endeavour Silver Corp. (the "Company" or "Endeavour Silver") is a corporation governed by the Business Corporations Act (British Columbia, Canada). The Company is engaged in silver mining in Mexico and related activities including acquisition, exploration, development, extraction, processing, refining and reclamation. The Company is also engaged in exploration activities in Chile and United States. The address of the registered office is #1130 - 609 Granville Street, Vancouver, B.C., V7Y 1G5.
2. BASIS OF PRESENTATION
These condensed consolidated interim financial statements have been prepared in accordance with IAS 34 Interim Financial Reporting and do not include all of the information required for full annual financial statements and should be read in conjunction with the Company's consolidated financial statements as at and for the year ended December 31, 2023.
The Board of Directors approved the consolidated financial statements for issue on May 8, 2024.
The preparation of consolidated financial statements requires management to make judgments, estimates and assumptions that affect the application of accounting policies and the reported amounts of assets, liabilities, income and expenses. Actual results may differ from these estimates.
These consolidated financial statements are presented in the Company's functional currency of US dollars and include the accounts of the Company and its wholly owned subsidiaries. All intercompany transactions and balances have been eliminated upon consolidation of these subsidiaries.
3. MATERIAL ACCOUNTING POLICIES
The accounting policies applied in these condensed consolidated interim financial statements are the same as those applied in the Company's annual audited consolidated financial statements as at and for the year ended December 31, 2023, except as described below.
In preparing these condensed consolidated interim financial statements, the significant judgements made by management in applying the Company's accounting policies and the key sources of estimation uncertainty were the same as those that were applied to the annual audited consolidated financial statements for the year ended December 31, 2023 and should be read in conjunction with the Company's annual audited consolidated financial statements for the year ended December 31, 2023.
The accounting policies below have been applied consistently to all years presented and by all subsidiaries in the group except for new accounting standards adopted during the year, which were adopted either on a prospective basis or on a modified retrospective basis, without restatement of comparative periods as described below.
Derivative financial instruments
The Company may hold derivative financial instruments to hedge its risk exposure to fluctuations in commodity prices and other currencies against the US Dollar. Derivative financial instruments are measured at fair value at each reporting period. All derivative instruments not designated in a hedge relationship that qualify for hedge accounting are classified as financial instruments at fair value through profit or loss. Changes in fair value of non-hedging derivative financial instruments are included in net earnings or loss as non-hedging derivative gains or losses.
Accounting standards adopted during the year
The Company applied Classification of Liabilities as Current or Non-current and Non-current Liabilities with Covenants - Amendments to IAS 1, issued in 2020 and 2022, for the first time in its 2024 condensed consolidated interim financial statements. The amendments clarify certain requirements for determining whether a liability is classified as current or non-current and require new disclosures in the annual financial statements for non-current liabilities that are subject to covenants within 12 months after the end of the reporting period. The adoption of the amendments did not result in any material classification adjustment to the condensed consolidated interim financial statements.
4. OTHER INVESTMENTS
| |
|
March 31, |
|
|
December 31, |
|
| |
|
2024 |
|
|
2023 |
|
| Balance, beginning of period |
$ |
5,135 |
|
$ |
10,035 |
|
| Investment additions, at cost |
|
- |
|
|
73 |
|
| Proceeds from disposals |
|
(2,643 |
) |
|
(2,451 |
) |
| Gain (loss) on investments |
|
(861 |
) |
|
(2,522 |
) |
| Balance, end of period |
$ |
1,631 |
|
$ |
5,135 |
|
The Company holds $1,568 in marketable securities that are classified as Level 1 and $63 in marketable securities that are classified as Level 3 in the fair value hierarchy (Note 17) and are classified as financial assets measured at FVTPL. Marketable securities classified as Level 3 in the fair value hierarchy are share purchase warrants and the fair value of the warrants at each period end has been estimated using the Black-Scholes Option Pricing Model.
5. ACCOUNTS AND OTHER RECEIVABLES
| |
|
March 31, |
|
|
December 31, |
|
| |
|
2024 |
|
|
2023 |
|
| |
|
|
|
|
|
|
| Trade receivables |
$ |
8,960 |
|
$ |
6,608 |
|
| IVA receivable |
|
29,110 |
|
|
12,564 |
|
| Other receivables |
|
4,681 |
|
|
1,654 |
|
| Current portion of loan receivable |
|
1,500 |
|
|
1,450 |
|
| |
$ |
44,251 |
|
$ |
22,276 |
|
The trade receivables consist of receivables from provisional silver and gold sales from the Bolañitos mine. The fair value of receivables arising from concentrate sales contracts that contain provisional pricing mechanisms is determined using the appropriate period end closing prices on the measurement date from the exchange that is the principal active market for the particular metal. As such, these receivables, which meet the definition of an embedded derivative, are classified within Level 2 of the fair value hierarchy (Note 17).
At March 31, 2024, Guanaceví holds $11,349 in IVA receivables which the Company and its advisors have determined to be recoverable from tax authorities (December 31, 2023 - $11,122). The Company is in regular contact with the tax authorities in respect of its IVA filings and believes the full amount of its IVA receivables will ultimately be received. However, the timing of recovery of these amounts and the nature and extent of any adjustments to the Company's IVA receivables remains uncertain.
As at March 31, 2024, the total IVA receivable of $39,879 (December 31, 2023 - $35,884) has been allocated between the current portion of $29,110, which is included in accounts and other receivables, and a non-current portion of $10,769 (December 31, 2023 - $12,564 and $23,320 respectively). The non-current portion includes $1,760 receivable in Guanacevi, which is currently under appeal and is unlikely to be received in the next 12 months, and $8,358 IVA receivable for Terronera which has not been submitted for refund.
The Company has a loan receivable in the amount of $5,000 due in cash payments over a five year period of which $3,500 remains unpaid as of March 31, 2024. As of March 31, 2024, the carrying value of the loan receivable is $2,949, consisting of the current portion of $1,500 and non-current portion of $1,449.
6. INVENTORIES
| |
|
March 31, |
|
|
December 31, |
|
| |
|
2024 |
|
|
2023 |
|
| |
|
|
|
|
|
|
| Warehouse inventory |
$ |
13,259 |
|
$ |
12,885 |
|
| Stockpile inventory |
|
2,495 |
|
|
3,279 |
|
| Finished goods inventory |
|
3,956 |
|
|
9,491 |
|
| Work in process inventory |
|
1,612 |
|
|
1,603 |
|
| |
$ |
21,322 |
|
$ |
27,258 |
|
The warehouse inventory balance at March 31, 2024 includes a provision created in the prior year ended December 31, 2023 of $1,179 at the Guanacevi mine and $1,038 at the Bolañitos mine.
7. RELATED PARTY TRANSACTIONS
The Company was charged $113 for legal services for the three months ended March 31, 2024, by a legal firm in which the Company's corporate secretary is a partner (March 31, 2023 - $67). The Company has $75 payable to the legal firm as at March 31, 2024 (December 31, 2023 - $86).
8. MINERAL PROPERTIES, PLANT AND EQUIPMENT
| |
|
Mineral |
|
|
|
|
|
Machinery & |
|
|
|
|
|
Transport & |
|
|
|
|
| |
|
properties |
|
|
Plant |
|
|
equipment |
|
|
Building |
|
|
office equipment |
|
|
Total |
|
| Cost |
|
|
|
|
|
|
|
|
|
|
|
|
|
|
|
|
|
|
| |
|
|
|
|
|
|
|
|
|
|
|
|
|
|
|
|
|
|
| Balance at December 31, 2022 |
$ |
600,068 |
|
$ |
96,860 |
|
$ |
106,260 |
|
$ |
20,356 |
|
$ |
13,277 |
|
$ |
836,821 |
|
| |
|
|
|
|
|
|
|
|
|
|
|
|
|
|
|
|
|
|
| Additions |
|
56,753 |
|
|
36,754 |
|
|
12,134 |
|
|
5,194 |
|
|
2,382 |
|
|
113,217 |
|
| Disposals |
|
(674 |
) |
|
- |
|
|
(417 |
) |
|
- |
|
|
(623 |
) |
|
(1,714 |
) |
| |
|
|
|
|
|
|
|
|
|
|
|
|
|
|
|
|
|
|
| Balance at December 31, 2023 |
$ |
656,147 |
|
$ |
133,614 |
|
$ |
117,977 |
|
$ |
25,550 |
|
$ |
15,036 |
|
$ |
948,324 |
|
| |
|
|
|
|
|
|
|
|
|
|
|
|
|
|
|
|
|
|
| Additions |
|
21,227 |
|
|
8,767 |
|
|
5,983 |
|
|
587 |
|
|
270 |
|
|
36,834 |
|
| Disposals |
|
- |
|
|
- |
|
|
(217 |
) |
|
- |
|
|
- |
|
|
(217 |
) |
| |
|
|
|
|
|
|
|
|
|
|
|
|
|
|
|
|
|
|
| Balance at March 31, 2024 |
$ |
677,374 |
|
$ |
142,381 |
|
$ |
123,743 |
|
$ |
26,137 |
|
$ |
15,306 |
|
$ |
984,941 |
|
| |
|
|
|
|
|
|
|
|
|
|
|
|
|
|
|
|
|
|
| Accumulated depreciation |
|
|
|
|
|
|
|
|
|
|
|
|
|
|
|
|
|
|
| |
|
|
|
|
|
|
|
|
|
|
|
|
|
|
|
|
|
|
| Balance at December 31, 2022 |
$ |
445,981 |
|
$ |
84,034 |
|
$ |
54,420 |
|
$ |
9,381 |
|
$ |
9,113 |
|
$ |
602,929 |
|
| |
|
|
|
|
|
|
|
|
|
|
|
|
|
|
|
|
|
|
| Depreciation |
|
20,723 |
|
|
1,598 |
|
|
7,241 |
|
|
365 |
|
|
1,581 |
|
|
31,508 |
|
| Disposals |
|
- |
|
|
- |
|
|
(177 |
) |
|
- |
|
|
(593 |
) |
|
(770 |
) |
| |
|
|
|
|
|
|
|
|
|
|
|
|
|
|
|
|
|
|
| Balance at December 31, 2023 |
$ |
466,704 |
|
$ |
85,632 |
|
$ |
61,484 |
|
$ |
9,746 |
|
$ |
10,101 |
|
$ |
633,667 |
|
| |
|
|
|
|
|
|
|
|
|
|
|
|
|
|
|
|
|
|
| Depreciation |
|
6,172 |
|
|
488 |
|
|
1,963 |
|
|
95 |
|
|
363 |
|
|
9,081 |
|
| Disposals |
|
- |
|
|
- |
|
|
(216 |
) |
|
- |
|
|
- |
|
|
(216 |
) |
| |
|
|
|
|
|
|
|
|
|
|
|
|
|
|
|
|
|
|
| Balance at March 31, 2024 |
$ |
472,876 |
|
$ |
86,120 |
|
$ |
63,231 |
|
$ |
9,841 |
|
$ |
10,464 |
|
$ |
642,532 |
|
| |
|
|
|
|
|
|
|
|
|
|
|
|
|
|
|
|
|
|
| Net book value |
|
|
|
|
|
|
|
|
|
|
|
|
|
|
|
|
|
|
| At December 31, 2023 |
$ |
189,443 |
|
$ |
47,982 |
|
$ |
56,493 |
|
$ |
15,804 |
|
$ |
4,935 |
|
$ |
314,657 |
|
| At March 31, 2024 |
$ |
204,498 |
|
$ |
56,261 |
|
$ |
60,512 |
|
$ |
16,296 |
|
$ |
4,842 |
|
$ |
342,409 |
|
Included in mineral properties is $80,307 in acquisition costs for exploration properties and $73,859 for acquisition and development costs of development properties (December 31, 2023 - $80,231 and $59,682 respectively).
Other non-current assets include $29,875 of deposits related to items of property, plant and equipment at Terronera (December 31, 2023 - $20,952).
9. LOANS PAYABLE
Equipment financing
| |
|
March 31, |
|
|
December 31, |
|
| |
|
2024 |
|
|
2023 |
|
| |
|
|
|
|
|
|
| Balance, beginning of period |
$ |
8,519 |
|
$ |
14,510 |
|
| Net proceeds from software and equipment financing |
|
- |
|
|
- |
|
| Finance cost |
|
116 |
|
|
728 |
|
| Repayments of principal |
|
(1,188 |
) |
|
(5,991 |
) |
| Repayments of finance costs |
|
(116 |
) |
|
(728 |
) |
| Balance, end of period |
$ |
7,331 |
|
$ |
8,519 |
|
| |
|
|
|
|
|
|
| Less: Current loans payable |
$ |
3,514 |
|
$ |
3,861 |
|
| Balance: Non-current loans payable |
$ |
3,817 |
|
$ |
4,658 |
|
The equipment financing is secured by the underlying equipment purchased and is subject to various non-financial covenants and as at March 31, 2024 the Company was in compliance with these covenants. As at March 31, 2024, the net book value of equipment includes $14,546 (December 31, 2023 - $17,720) of equipment pledged as security for the equipment financing.
Debt Facility
The Debt Facility is subject to certain customary conditions precedent and debt servicing covenants, including the requirement for the Company to enter into gold and foreign exchange hedging programs prior to initial drawdown. On March 28, 2024, the Company entered into gold swap agreements to hedge against the fluctuation in gold prices. The Company has committed to the swap contracts which settle between January 2025 and March 2027, for 68,000 ounces of gold at $2,325 per ounce.
The Company is also required to hedge 75% of the estimated remaining capital expenditures incurred in Mexican Pesos.
Subsequent to the end of the reporting period the Company entered into Mexican Peso forward purchase contracts for a total of $45,000 over the construction period from April 2024 to December 2024 at 16.56 pesos per US dollar. On April 9, 2024, the Company completed the first drawdown of $60,000 of the debt facility.
10. SHARE CAPITAL
(a) Common Shares
As of March 31, 2024, the Company had 240,337,478 common shares issued issuable and outstanding, with no par value (December 31, 2024 - 217,245,492). During the three months period ended March 31, 2024, the Company issued 23,091,986 common shares under the "At-The-Market" ("ATM") distributions equity facility (the "December 2023 ATM Facility") at an average price of $1.72 per share for gross proceeds of $39,811, less commission of $796 and recognized $105 of other transaction costs related to the ATM financing as share issuance costs, which have been presented net within share capital.
(b) Stock Options
| Expressed in Canadian dollars |
|
Three months ended |
|
|
Year ended |
|
| |
|
March 31, |
|
|
December 31, |
|
| |
|
2024 |
|
|
2023 |
|
|
|
|
| |
|
|
|
|
Weighted |
|
|
|
|
|
Weighted |
|
| |
|
Number of |
|
|
average |
|
|
Number of |
|
|
average |
|
| |
|
options |
|
|
exercise price |
|
|
options |
|
|
exercise price |
|
| |
|
|
|
|
|
|
|
|
|
|
|
|
| Outstanding, beginning of period |
|
3,488,291 |
|
$ |
4.24 |
|
|
3,899,630 |
|
$ |
4.09 |
|
| Granted |
|
1,945,000 |
|
$ |
2.89 |
|
|
1,079,000 |
|
$ |
4.12 |
|
| Exercised |
|
- |
|
|
- |
|
|
(1,097,900 |
) |
$ |
3.05 |
|
| Expired and forfeited |
|
(432,400 |
) |
$ |
3.23 |
|
|
(392,439 |
) |
$ |
5.76 |
|
| Outstanding, end of period |
|
5,000,891 |
|
$ |
3.80 |
|
|
3,488,291 |
|
$ |
4.24 |
|
| |
|
|
|
|
|
|
|
|
|
|
|
|
| Options exercisable at the end of the period |
|
3,097,691 |
|
$ |
4.20 |
|
|
2,798,934 |
|
$ |
4.18 |
|
Subsequent to March 31, 2024, an additional 4,000 common shares were issued on the exercise of 4,000 options, with a weighted average exercise price of CAN$2.89.
| Expressed in Canadian dollars |
|
|
|
|
|
|
|
|
|
|
|
|
|
| |
|
Options Outstanding |
|
|
|
|
|
Options Exercisable |
|
| |
|
Number |
|
|
Weighted Average |
|
|
Weighted |
|
|
Number |
|
|
Weighted |
|
| Exercise |
|
Outstanding |
|
|
Remaining |
|
|
Average |
|
|
Exercisable |
|
|
Average |
|
| Price |
|
as at |
|
|
Contractual Life |
|
|
Exercise |
|
|
as at |
|
|
Exercise |
|
| Intervals |
|
March 31, 2024 |
|
|
(Number of Years) |
|
|
Price |
|
|
March 31, 2024 |
|
|
Price |
|
| |
|
|
|
|
|
|
|
|
|
|
|
|
|
|
|
| $2.00 - $2.99 |
|
2,905,600 |
|
|
3.6 |
|
|
$2.64 |
|
|
1,401,600 |
|
|
$2.38 |
|
| $4.00 - $4.99 |
|
954,000 |
|
|
4.0 |
|
|
$4.12 |
|
|
554,800 |
|
|
$4.12 |
|
| $5.00 - $5.99 |
|
60,000 |
|
|
1.5 |
|
|
$5.60 |
|
|
60,000 |
|
|
$5.60 |
|
| $6.00 - $6.99 |
|
1,081,291 |
|
|
2.5 |
|
|
$6.54 |
|
|
1,081,291 |
|
|
$6.54 |
|
| |
|
5,000,891 |
|
|
3.4 |
|
|
$3.80 |
|
|
3,097,691 |
|
|
$4.21 |
|
During the three months ended March 31, 2024, the Company recognized share-based compensation expense of $711 (March 31, 2023 - $615) based on the fair value of the vested portion of options.
The weighted-average fair values of stock options granted have been estimated using the Black-Scholes Option Pricing Model with the following assumptions:
| |
Three months ended |
| |
March 31, |
March 31, |
| |
2024 |
2023 |
| Weighted-average fair value of options in CAN$ |
$1.38 |
$2.21 |
| Risk-free interest rate |
3.75% |
3.83% |
| Expected dividend yield |
0% |
0% |
| Expected stock price volatility |
62% |
70% |
| Expected options life in years |
3.52 |
3.77 |
(c) Share Units Plan
Performance Share Units
The Performance Share Units ("PSU"s) granted are subject to a performance payout multiplier between 0% and 200% based on the Company's total shareholder return at the end of a three-year period, relative to the total shareholder return of the Company's peer group.
| |
|
Three months ended |
|
|
Year ended |
|
| |
|
March 31, |
|
|
December 31, |
|
| |
|
2024 |
|
|
2023 |
|
| |
|
Number of units |
|
|
Number of units |
|
| |
|
|
|
|
|
|
| Outstanding, beginning of period |
|
878,000 |
|
|
1,158,000 |
|
| Granted |
|
635,000 |
|
|
471,000 |
|
| Cancelled |
|
(194,000 |
) |
|
(140,000 |
) |
| Settled for shares |
|
- |
|
|
(611,000 |
) |
| Outstanding, end of period |
|
1,319,000 |
|
|
878,000 |
|
Performance criteria are based on the Company's share price performance relative to a representative group of other mining companies. 215,000 PSUs vest on March 24, 2025, 409,000 PSUs vest on March 7, 2026, 635,000 PSUs vest on March 13, 2027 and 60,000 will vest once certain performance criteria are met.
During the three months ended March 31, 2024, the Company recognized share-based compensation expense of $441 related to the PSUs (March 31, 2023 - $394).
(d) Deferred share units
Deferred Share Units - Equity Settled
The DSUs granted are vested immediately and are redeemable for shares at the time of a director's retirement.
| |
|
Three months ended |
|
|
Year ended |
|
| |
|
March 31, |
|
|
December 31, |
|
| |
|
2024 |
|
|
2023 |
|
| |
|
Number of units |
|
|
Number of units |
|
| |
|
|
|
|
|
|
| Outstanding, beginning of period |
|
330,078 |
|
|
104,596 |
|
| Granted |
|
7,858 |
|
|
225,482 |
|
| Outstanding, end of period |
|
337,936 |
|
|
330,078 |
|
There were 7,858 DSUs granted during the three months ended March 31, 2024 (March 31, 2023 - 203,421) under the SUP. During the three months ended March 31, 2024, the Company recognized share-based compensation expense of $18 related to the DSUs (March 31, 2023 - $616).
Deferred Share Units - Cash Settled (No further grants to be made)
The Company previously had a Deferred Share Unit ("DSU") plan whereby deferred share units were granted to independent directors of the Company in lieu of compensation in cash or share purchase options. These DSUs vested immediately and are redeemable for cash, based on the market value of the units at the time of a director's retirement. Upon adoption of the SUP plan in March 2021, no new DSUs will be granted under this cash settled plan.
| Expressed in Canadian dollars |
|
Three months ended |
|
|
Year ended |
|
| |
|
March 31, |
|
|
December 31, |
|
| |
|
2024 |
|
|
2023 |
|
| |
|
Number |
|
|
Weighted Average |
|
|
Number |
|
|
Weighted Average |
|
| |
|
of Units |
|
|
Grant Price |
|
|
of Units |
|
|
Grant Price |
|
| |
|
|
|
|
|
|
|
|
|
|
|
|
| Outstanding, beginning of period |
|
1,044,204 |
|
|
$3.19 |
|
|
1,044,204 |
|
|
$3.19 |
|
| Redeemed |
|
- |
|
|
$0.00 |
|
|
- |
|
|
$0.00 |
|
| Outstanding, end of period |
|
1,044,204 |
|
|
$3.19 |
|
|
1,044,204 |
|
|
$3.19 |
|
| |
|
|
|
|
|
|
|
|
|
|
|
|
| Fair value at period end |
|
1,044,204 |
|
|
$3.26 |
|
|
1,044,204 |
|
|
$2.60 |
|
During the three months ended March 31, 2024, the Company recognized a mark to market expense on director's compensation related to these DSUs, which is included in general and administrative salaries, wages and benefits, of $465 (March 31, 2023 - a mark to market expense of $653) based on the change in the fair value of the DSUs granted in prior years. As of March 31, 2024, deferred share units outstanding have a fair market liability value of $2,513 (December 31, 2023 - $2,048) recognized in accounts payable and accrued liabilities.
(e) Share Appreciation Rights
As part of the Company's bonus program, the Company may grant share appreciation rights ("SARs") to its employees in Mexico and Chile. The SARs are subject to vesting conditions and, when exercised, constitute a cash bonus based on the value of the appreciation of the Company's common shares between the SARs grant date and the exercise date.
| |
|
Three months ended |
|
|
Year ended |
|
| |
|
March 31, |
|
|
December 31, |
|
| |
|
2024 |
|
|
2023 |
|
| |
|
Number |
|
|
Weighted Average |
|
|
Number |
|
|
Weighted Average |
|
| |
|
of Units |
|
|
Grant Price |
|
|
of Units |
|
|
Grant Price |
|
| |
|
|
|
|
|
|
|
|
|
|
|
|
| Outstanding, beginning of period |
|
51,349 |
|
$ |
5.07 |
|
|
181,739 |
|
$ |
5.12 |
|
| Cancelled |
|
- |
|
|
- |
|
|
(130,390 |
) |
$ |
5.13 |
|
| Outstanding, end of period |
|
51,349 |
|
$ |
5.07 |
|
|
51,349 |
|
$ |
5.07 |
|
| |
|
|
|
|
|
|
|
|
|
|
|
|
| Exercisable at the end of the period |
|
43,870 |
|
$ |
5.09 |
|
|
43,870 |
|
$ |
5.09 |
|
During the three months ended March 31, 2024, the Company recognized an expense related to SARs, which is included in operation and exploration salaries, wages and benefits, of $1 (March 31, 2023 - an expense of $4) based on the change in the fair value of the SARs granted in prior years. As of March 31, 2024, SARs outstanding have a fair market liability value of $45 (December 31, 2023 - $43) recognized in accounts payable and accrued liabilities.
(f) Diluted Earnings per Share
| |
|
Three months ended |
|
| |
|
March 31, |
|
|
March 31, |
|
| |
|
2024 |
|
|
2023 |
|
| |
|
|
|
|
|
|
| Net earnings (loss) |
$ |
(1,194 |
) |
$ |
6,456 |
|
| Basic weighted average number of shares outstanding |
|
227,503,581 |
|
|
190,274,768 |
|
| Effect of dilutive securities: |
|
|
|
|
|
|
| Stock options |
|
- |
|
|
743,186 |
|
| Equity settled deferred share units |
|
- |
|
|
308,017 |
|
| Performance share units |
|
- |
|
|
970,000 |
|
| Diluted weighted average number of share outstanding |
|
227,503,581 |
|
|
192,295,971 |
|
| |
|
|
|
|
|
|
| Diluted earnings per share |
$ |
(0.01 |
) |
$ |
0.03 |
|
As of March 31, 2024, there are 4,895,734 anti-dilutive stock options (March 31, 2023 - 3,276,844).
11. REVENUE
| |
|
Three months ended |
|
| |
|
March 31, |
|
|
March 31, |
|
| |
|
2024 |
|
|
2023 |
|
| |
|
|
|
|
|
|
| Silver sales |
$ |
41,222 |
|
$ |
38,620 |
|
| Gold sales |
|
22,996 |
|
|
17,497 |
|
| Less: smelting and refining costs |
|
(493 |
) |
|
(656 |
) |
| Revenue |
$ |
63,725 |
|
$ |
55,461 |
|
Changes in fair value from provisional pricing in the period are included in silver and gold sales.
| |
|
Three months ended |
|
| |
|
March 31, |
|
|
March 31, |
|
| |
|
2024 |
|
|
2023 |
|
| Revenue by product |
|
|
|
|
|
|
| Concentrate sales |
$ |
15,355 |
|
$ |
11,785 |
|
| Provisional pricing adjustments |
|
(711 |
) |
|
(247 |
) |
| Total revenue from concentrate sales |
|
14,644 |
|
|
11,538 |
|
| Refined metal sales |
|
49,081 |
|
|
43,923 |
|
| Total revenue |
$ |
63,725 |
|
$ |
55,461 |
|
Provisional pricing adjustments on sales of concentrate consist of provisional and final pricing adjustments made on the finalization of the sales contract. The Company's sales contracts are provisionally priced with provisional pricing periods lasting typically one to three months with provisional pricing adjustments recorded to revenue as market prices vary.
12. EXPLORATION, EVALUATION AND DEVELOPMENT
| |
|
Three months ended |
|
| |
|
March 31, |
|
|
March 31, |
|
| |
|
2024 |
|
|
2023 |
|
| |
|
|
|
|
|
|
| Depreciation |
$ |
159 |
|
$ |
278 |
|
| Share-based compensation |
|
151 |
|
|
131 |
|
| Exploration salaries, wages and benefits |
|
660 |
|
|
429 |
|
| Direct exploration expenditures |
|
1,630 |
|
|
1,546 |
|
| Evaluation and development salaries, wages and benefits |
|
754 |
|
|
445 |
|
| Direct evaluation and development expenditures |
|
916 |
|
|
1,335 |
|
| |
$ |
4,270 |
|
$ |
4,164 |
|
13 GENERAL AND ADMINISTRATIVE
| |
|
Three months ended |
|
|
|
|
| |
|
March 31, |
|
|
March 31, |
|
| |
|
2024 |
|
|
2023 |
|
| |
|
|
|
|
|
|
| Depreciation |
$ |
99 |
|
$ |
62 |
|
| Share-based compensation |
|
940 |
|
|
1,361 |
|
| Salaries, wages and benefits |
|
1,182 |
|
|
1,167 |
|
| Directors' DSU expense (recovery) |
|
465 |
|
|
653 |
|
| Direct general and administrative |
|
1,358 |
|
|
1,674 |
|
| |
$ |
4,044 |
|
$ |
4,917 |
|
14. SUPPLEMENTAL DISCLOSURE WITH RESPECT TO CASH FLOWS
| |
|
Three months ended |
|
| |
|
March 31, |
|
|
March 31, |
|
| |
|
2024 |
|
|
2023 |
|
| |
|
|
|
|
|
|
| Net changes in non-cash working capital: |
|
|
|
|
|
|
| Accounts and other receivables |
$ |
(9,374 |
) |
$ |
(4,375 |
) |
| Income tax receivable |
|
296 |
|
|
2,163 |
|
| Inventories |
|
5,407 |
|
|
(3,093 |
) |
| Prepaids |
|
754 |
|
|
(1,382 |
) |
| Accounts payable and accrued liabilities |
|
(2,863 |
) |
|
(4,276 |
) |
| Income taxes payable |
|
129 |
|
|
(1,939 |
) |
| |
$ |
(5,651 |
) |
$ |
(12,902 |
) |
| |
|
|
|
|
|
|
| Non-cash financing and investing activities: |
|
|
|
|
|
|
| Reclamation included in mineral properties, plant and equipment |
$ |
(102 |
) |
$ |
(436 |
) |
| Fair value of exercised options allocated to share capital |
$ |
- |
|
$ |
(946 |
) |
| Fair value of performance share units allocated to share capital |
$ |
- |
|
$ |
(405 |
) |
| |
|
|
|
|
|
|
| Other cash disbursements: |
|
|
|
|
|
|
| Income taxes paid |
$ |
2,534 |
|
$ |
1,859 |
|
| Special mining duty paid |
$ |
2,574 |
|
$ |
2,515 |
|
15. SEGMENT DISCLOSURES
The Company's operating segments are based on internal management reports that are reviewed by the Company's executives (the chief operating decision makers) in assessing performance. The Company has two operating mining segments which are located in Mexico, Guanaceví and Bolañitos. The Company has one development project in Mexico, Terronera, as well as Exploration and Corporate segments. The Exploration segment consists of projects in the exploration and evaluation phases in Mexico, Chile and the USA. Exploration projects that are in the local district surrounding a mine are included in the mine's segments.
| |
|
|
|
|
|
Cost of sales |
|
|
|
|
|
|
|
|
Net earnings and |
|
| |
|
|
|
|
|
excluding |
|
|
|
|
|
Mine operating |
|
|
comprehensive |
|
| Three months ended March 31 |
|
|
Revenue |
|
|
depreciation |
|
|
Depreciation |
|
|
earnings |
|
|
earnings |
|
| |
|
|
|
|
|
|
|
|
|
|
|
|
|
|
|
|
| Guanaceví |
2024 |
$ |
49,082 |
|
$ |
33,280 |
|
$ |
5,815 |
|
$ |
9,987 |
|
$ |
4,283 |
|
| |
2023 |
|
43,924 |
|
|
24,682 |
|
|
3,473 |
|
|
15,769 |
|
|
9,754 |
|
| Bolañitos |
2024 |
|
14,643 |
|
|
9,912 |
|
|
3,062 |
|
|
1,669 |
|
|
1,327 |
|
| |
2023 |
|
11,537 |
|
|
8,501 |
|
|
2,780 |
|
|
256 |
|
|
150 |
|
| Terronera |
2024 |
|
- |
|
|
- |
|
|
- |
|
|
- |
|
|
(1,670 |
) |
| |
2023 |
|
- |
|
|
- |
|
|
- |
|
|
- |
|
|
(1,780 |
) |
| Exploration |
2024 |
|
- |
|
|
- |
|
|
- |
|
|
- |
|
|
(2,600 |
) |
| |
2023 |
|
- |
|
|
- |
|
|
- |
|
|
- |
|
|
(2,384 |
) |
| Corporate |
2024 |
|
- |
|
|
- |
|
|
- |
|
|
- |
|
|
(2,534 |
) |
| |
2023 |
|
- |
|
|
- |
|
|
- |
|
|
- |
|
|
716 |
|
| Consolidated |
2024 |
$ |
63,725 |
|
$ |
43,192 |
|
$ |
8,877 |
|
$ |
11,656 |
|
$ |
(1,194 |
) |
| |
2023 |
|
55,461 |
|
|
33,183 |
|
|
6,253 |
|
|
16,025 |
|
|
6,456 |
|
| |
|
|
Total Assets |
|
|
Total Liabilities |
|
|
Capital expenditures |
|
| |
|
|
|
|
|
|
|
|
|
|
| Guanaceví |
March 31, 2024 |
$ |
115,777 |
|
$ |
44,212 |
|
$ |
4,752 |
|
| |
Dec 31, 2023 |
|
125,456 |
|
|
44,916 |
|
|
24,631 |
|
| Bolañitos |
March 31, 2024 |
|
44,222 |
|
|
9,304 |
|
|
2,267 |
|
| |
Dec 31, 2023 |
|
44,205 |
|
|
11,200 |
|
|
10,709 |
|
| Terronera |
March 31, 2024 |
|
228,751 |
|
|
24,172 |
|
|
29,021 |
|
| |
Dec 31, 2023 |
|
186,860 |
|
|
23,604 |
|
|
62,495 |
|
| Exploration |
March 31, 2024 |
|
83,949 |
|
|
527 |
|
|
121 |
|
| |
Dec 31, 2023 |
|
83,312 |
|
|
1,319 |
|
|
1,297 |
|
| Corporate |
March 31, 2024 |
|
37,489 |
|
|
6,746 |
|
|
- |
|
| |
Dec 31, 2023 |
|
34,974 |
|
|
7,427 |
|
|
276 |
|
| Consolidated |
March 31, 2024 |
$ |
510,188 |
|
$ |
84,961 |
|
$ |
36,161 |
|
| |
Dec 31, 2023 |
|
474,807 |
|
|
88,466 |
|
|
99,408 |
|
The Exploration segment included $428 of costs incurred in Chile for the three months ended March 31, 2024 (March 31, 2023 - $305) and $5 of costs incurred in USA (March 31, 2023 - $16).
16. COMMITMENTS & CONTINGENCIES
Commitments
As of March 31, 2024, the Company has $38,299 committed for capital equipment purchases.
Contingencies
Due to the nature of the Company's activities, various legal and tax matters are outstanding from time to time. The Company is routinely subject to audit by tax authorities in the countries in which it operates and has received a number of tax assessments in various locations, which are currently at various stages of progress with the relevant authorities. The outcomes of these audits and assessments are uncertain however, the Company is confident of its position on the various matters under review.
17. FINANCIAL INSTRUMENTS AND FAIR VALUE MEASUREMENTS
(a) Financial assets and liabilities
As at March 31, 2024, the carrying and fair values of the Company's financial instruments by category are as follows:
| |
|
Fair value |
|
|
|
|
|
|
|
|
|
|
| |
|
through profit or |
|
|
Amortized |
|
|
Carrying |
|
|
|
|
| |
|
loss |
|
|
cost |
|
|
value |
|
|
Fair value |
|
| |
|
$ |
|
|
$ |
|
|
$ |
|
|
$ |
|
| |
|
|
|
|
|
|
|
|
|
|
|
|
| Financial assets: |
|
|
|
|
|
|
|
|
|
|
|
|
| Cash and cash equivalents |
|
- |
|
|
34,876 |
|
|
34,876 |
|
|
34,876 |
|
| Other investments |
|
1,631 |
|
|
- |
|
|
1,631 |
|
|
1,631 |
|
| Accounts and other receivables |
|
8,960 |
|
|
4,681 |
|
|
13,641 |
|
|
13,641 |
|
| Loans receivable |
|
- |
|
|
2,949 |
|
|
2,949 |
|
|
2,949 |
|
| Total financial assets |
|
10,591 |
|
|
42,506 |
|
|
53,097 |
|
|
53,097 |
|
| |
|
|
|
|
|
|
|
|
|
|
|
|
| Financial liabilities: |
|
|
|
|
|
|
|
|
|
|
|
|
| Accounts payable and accrued liabilities |
|
2,558 |
|
|
40,964 |
|
|
43,522 |
|
|
43,522 |
|
| Loans payable |
|
- |
|
|
7,331 |
|
|
7,331 |
|
|
7,331 |
|
| Total financial liabilities |
|
2,558 |
|
|
48,295 |
|
|
50,853 |
|
|
50,853 |
|
(b) Fair value hierarchy
Assets and liabilities as at March 31, 2024 measured at fair value on a recurring basis include:
| |
|
Level 1 |
|
|
Level 2 |
|
|
Level 3 |
|
|
Total |
|
| |
|
$ |
|
|
$ |
|
|
$ |
|
|
$ |
|
| |
|
|
|
|
|
|
|
|
|
|
|
|
| Financial assets: |
|
|
|
|
|
|
|
|
|
|
|
|
| Accounts and other receivables |
|
- |
|
|
8,960 |
|
|
- |
|
|
8,960 |
|
| Other investments |
|
1,568 |
|
|
- |
|
|
63 |
|
|
1,631 |
|
| Total financial assets |
|
1,568 |
|
|
8,960 |
|
|
63 |
|
|
10,591 |
|
| |
|
|
|
|
|
|
|
|
|
|
|
|
| Financial liabilities: |
|
|
|
|
|
|
|
|
|
|
|
|
| Deferred share units |
|
2,513 |
|
|
- |
|
|
- |
|
|
2,513 |
|
| Share appreciation rights |
|
- |
|
|
45 |
|
|
- |
|
|
45 |
|
| Total financial liabilities |
|
2,513 |
|
|
45 |
|
|
- |
|
|
2,558 |
|
| HEAD OFFICE |
Suite #1130, 609 Granville Street |
| |
Vancouver, BC, Canada V7Y 1G5 |
| |
Telephone: (604) 685-9775
1-877-685-9775 |
| |
Website: www.edrsilver.com |
| |
|
| DIRECTORS |
Margaret Beck
Ricardo Campoy
Daniel Dickson
Amy Jacobsen
Rex McLennan
Kenneth Pickering
Mario Szotlender
Christine West |
| |
|
| OFFICERS |
Daniel Dickson - Chief Executive Officer
Donald Gray - Chief Operating Officer
Elizabeth Senez - Chief Financial Officer
Gregory Blaylock - Vice President, Operations
Luis Castro - Senior Vice-President, Exploration
Dale Mah - Vice-President, Corporate Development
Galina Meleger - Vice-President, Investor Relations
Bernard Poznanski - Corporate Secretary |
| |
|
REGISTRAR AND
TRANSFER AGENT
|
Computershare Trust Company of Canada
3rd Floor - 510 Burrard Street
Vancouver, BC, V6C 3B9 |
| |
|
| AUDITORS |
KPMG LLP
777 Dunsmuir Street
Vancouver, BC, V7Y 1K3 |
| |
|
| SOLICITORS |
Koffman Kalef LLP
19th Floor - 885 West Georgia Street
Vancouver, BC, V6C 3H4 |
| |
|
| SHARES LISTED |
Toronto Stock Exchange
Trading Symbol - EDR
New York Stock Exchange
Trading Symbol - EXK |

Endeavour Silver Corp.
MANAGEMENT'S DISCUSSION AND ANALYSIS
FOR THE PERIOD ENDED MARCH 31, 2024
This Management Discussion and Analysis ("MD&A") should be read in conjunction with the condensed consolidated interim financial statements of Endeavour Silver Corp. ("Endeavour" or "the Company") for the three months ended March 31, 2024, and the related notes contained therein, which were prepared in accordance with IAS34 - Interim financial reporting of the International Financial Reporting Standards ("IFRS") as issued by the International Accounting Standards Board ("IASB"). The Company uses certain non-IFRS financial measures in this MD&A as described under "Non-IFRS Measures". Additional information relating to the Company, including the most recent Annual Information Form (the "Annual Information Form"), is available on SEDAR+ at www.sedarplus.ca, and the Company's most recent annual report on Form 40-F has been filed with the U.S. Securities and Exchange Commission (the "SEC") on EDGAR at www.sec.gov. This MD&A contains "forward-looking statements" that are subject to risk factors set out in a cautionary note contained herein. All dollar ($) amounts are expressed in United States ("$") dollars and tabular amounts are expressed in thousands of U.S. dollars, unless Canadian dollars (CAN$) or Mexican Pesos (MXN) are otherwise indicated. This MD&A is dated as of May 8, 2024, and all information contained is current as of May 8, 2024, unless otherwise stated.
Cautionary Note to U.S. Investors Regarding Mineral Reserves and Resources
This MD&A has been prepared in accordance with the requirements of Canadian provincial securities laws, which differ from the requirements of U.S. securities laws. As a result, the Company reports the mineral reserves and resources of the projects it has an interest in according to Canadian standards. Canadian reporting requirements for disclosure of mineral properties are governed by National Instrument 43-101 - Standards of Disclosure for Mineral Projects ("NI-43 101"). NI-43 101 is a rule developed by the Canadian Securities Administrators that establishes standards for all public disclosure an issuer makes of scientific and technical information concerning mineral projects. These standards differ from the requirements of the SEC that are applicable to domestic United States reporting companies under subpart 1300 of Regulation S-K ("S-K 1300") under the Exchange Act. As an issuer that prepares and files its reports with the SEC pursuant to the MJDS, the Company is not subject to the requirements of S-K 1300. Any mineral reserves and mineral resources reported by the Company in accordance with NI 43-101 may not qualify as such under or differ from those prepared in accordance with S-K 1300. Accordingly, information included or incorporated by reference in this MD&A concerning descriptions of mineralization and estimates of mineral reserves and resources under Canadian standards may not be comparable to similar information made public by United States companies subject to the reporting and disclosure requirements of S-K 1300.
Forward-Looking Statements
This MD&A contains "forward-looking statements" within the meaning of the U.S. Securities Litigation Reform Act of 1995, as amended and "forward-looking information" within the meaning of applicable Canadian securities legislation. Such forward-looking statements and information include, but are not limited to, statements regarding: the development and financing of the Terronera project: anticipated timing of the Terronera project; anticipated timing of further drawdown under the Debt Facility; estimated Terronera project economics; Terronera project's forecasted operations, costs and expenditures, and the timing and results of various related activities; estimation of mineral resources at Pitarrilla; prospects for Terronera, Pitarrilla and Parral; Endeavour's anticipated performance in 2024, including silver and gold production and financial results; silver and gold grades and recoveries, cash costs per ounce (oz), capital expenditures and sustaining capital; and the timing and results of various activities. Forward-looking statements are frequently characterized by words such as "plan", "expect", "forecast", "project", "intend", "believe", "anticipate", "outlook" and other similar words, or statements that certain events or conditions "may" or "will" occur. Forward-looking statements are based on the opinions and estimates of management at the dates the statements are made, and are subject to a variety of risks and uncertainties and other factors that could cause actual events or results to differ materially from those projected in the forward-looking statements.
The Company does not intend to, and does not assume any obligation to, update such forward-looking statements or information, other than as required by applicable law. Forward-looking statements or information involve known and unknown risks, uncertainties and other factors and are based on assumptions that may cause the actual results, level of activity, performance or achievements of the Company and its operations to be materially different from those expressed or implied by such statements. Such factors and assumptions include, among others: the Company's ability to satisfy conditions precedent to further drawdown under the Debt Facility; the ongoing effects of inflation and supply chain issues on the Terronera project economics; fluctuations in the prices of silver and gold; fluctuations in the currency markets (particularly the Mexican peso, Chilean peso, Canadian dollar and U.S. dollar); changes in national and local governments, legislation, taxation, controls, regulations and political or economic developments in Canada and Mexico; operating or technical difficulties in mineral exploration, development and mining activities; risks and hazards of mineral exploration, development and mining (including, but not limited to environmental hazards, industrial accidents, unusual or unexpected geological conditions, pressures, cave-ins and flooding); inadequate insurance, or inability to obtain insurance; availability of and costs associated with mining inputs and labour; the speculative nature of mineral exploration and development; diminishing quantities or grades of mineral reserves as properties are mined; the ability to successfully integrate acquisitions; risks in obtaining necessary licenses and permits; challenges to the Company's title to properties; as well as those factors described under "Risk Factors" in the Company's Annual Information Form. Although the Company has attempted to identify important factors that could cause actual results to differ materially from those contained in forward-looking statements or information, there may be other factors that cause results to be materially different from those anticipated, described, estimated, assessed or intended. There can be no assurance that any forward-looking statements or information will prove to be accurate as actual results and future events could differ materially from those anticipated in such statements or information. Accordingly, readers should not place undue reliance on forward-looking statements or information.
Qualified Person
The scientific and technical information contained in this MD&A relating to the Company's mines and mineral projects has been reviewed and approved by Dale Mah, B.Sc., P.Geo., Vice President Corporate Development of Endeavour, a Qualified Person within the meaning of NI 43-101.
Table of Contents
OVERVIEW OF THE BUSINESS
The Company is engaged in silver mining in Mexico and related activities including property acquisition, exploration, development, mineral extraction, processing, refining and reclamation. The Company is also engaged in exploration activities in Chile and Nevada, USA. The Company's business strategy is focused on acquiring advanced-stage silver mining properties in Mexico. Company's operations are comprised of Guanaceví and Bolañitos mines located in Durango, Mexico and Guanajuato, Mexico respectively. The Company is developing the Terronera project located in Jalisco State, Mexico. The Company is advancing several other exploration projects in order to achieve its goal to become a premier senior producer in the silver mining sector.
The Company's common shares are listed on the Toronto Stock Exchange (TSX: EDR) and the New York Stock Exchange (NYSE: EXK).
HIGHLIGHTS
Operating and financial
| Q1 2024 Highlights |
Three Months Ended March 31 |
| 2024 |
2023 |
% Change |
| Production |
|
|
|
| Silver ounces produced |
1,460,006 |
1,623,545 |
(10%) |
| Gold ounces produced |
10,133 |
9,342 |
8% |
| Payable silver ounces produced |
1,450,308 |
1,608,212 |
(10%) |
| Payable gold ounces produced |
9,948 |
9,184 |
8% |
| Silver equivalent ounces produced(1) |
2,270,677 |
2,370,905 |
(4%) |
| Cash costs per silver ounce(2) |
13.19 |
11.12 |
19% |
| Total production costs per ounce(2) |
18.90 |
15.43 |
23% |
| All-in sustaining costs per ounce (2) |
21.44 |
20.16 |
6% |
| Processed tonnes |
221,794 |
211,073 |
5% |
| Direct operating costs per tonne(2) |
145.75 |
132.11 |
10% |
| Direct costs per tonne(2) |
181.77 |
169.49 |
7% |
| Financial |
|
|
|
| Revenue ($ millions) |
63.7 |
55.5 |
15% |
| Silver ounces sold |
1,756,094 |
1,667,408 |
5% |
| Gold ounces sold |
10,880 |
9,126 |
19% |
| Realized silver price per ounce |
23.47 |
23.16 |
1% |
| Realized gold price per ounce |
2,114 |
1,917 |
10% |
| Net earnings (loss) ($ millions) |
(1.2) |
6.5 |
(118%) |
| Adjusted net earnings (loss) ($ millions)(2) |
(0.2) |
4.5 |
(104%) |
| Mine operating earnings ($ millions) |
11.7 |
16.0 |
(27%) |
| Mine operating cash flow before taxes ($ millions)(2) |
20.6 |
22.4 |
(8%) |
| Operating cash flow before working capital changes(2) |
10.2 |
12.5 |
(18%) |
| EBITDA ($ millions)(2) |
13.5 |
19.4 |
(30%) |
| Working capital ($ millions) (2) |
56.4 |
92.8 |
(39%) |
| Shareholders |
|
|
|
| Earnings (loss) per share - basic ($) |
(0.01) |
0.03 |
(133%) |
| Adjusted earnings (loss) per share - basic ($)(2) |
(0.00) |
0.02 |
(100%) |
| Operating cash flow before working capital changes per share(2) |
0.04 |
0.07 |
(43%) |
| Weighted average shares outstanding |
227,503,581 |
190,274,768 |
20% |
(1) Silver equivalents are calculated using an 80:1 (Ag:Au) ratio.
(2) Non-IFRS measure. For a description of how these measures are calculated and a reconciliation of these measures to the most directly comparable measures specified, defined or determined under IFRS and presented in the Company's financial statements, refer to "Non-IFRS Measures".
The above highlights are key measures used by management, however they should not be the sole measures used in determining the performance of the Company's operations.
-
During Q1 2024, the Terronera project made significant progress, notably in areas of concrete work erection of structural steel and mechanical installation of major equipment. Overall project progress reached 53% completion, with more than $158 million of the project's budget spent to date. Project commitments total $225 million which is 83% of the $271 million capital budget. Project remains on track for commissioning in Q4 2024.
-
On March 28, 2024, the Company entered into forward swap agreements for 68,000 ounces of gold over the three-year period from January 2025, as required by the Teronerra Debt Facility, de-risking the project economics.
-
On April 3, 2024, the Company entered into Mexican Peso forward purchase contracts for a total of $45 million over the construction period from April 2024 to December 2024 at 16.56 pesos per US dollar, as required by the Teronerra Debt Facility, de-risking the project economics.
-
Effective January 1, 2024, the Company appointed Elizabeth Senez as Chief Financial Officer following the retirement of the previous CFO, Christine West.
REVIEW OF OPERATING RESULTS
Consolidated Production Results for the Three Months Ended March 31, 2024 and 2023
| CONSOLIDATED |
Three Months Ended March 31 |
| |
2024 |
2023 |
% Change |
| Ore tonnes processed |
221,794 |
211,073 |
5% |
| Average silver grade (gpt) |
229 |
279 |
(18%) |
| Silver recovery (%) |
89.5 |
85.7 |
4% |
| Total silver ounces produced |
1,460,006 |
1,623,545 |
(10%) |
| Payable silver ounces produced |
1,450,308 |
1,608,212 |
(10%) |
| Average gold grade (gpt) |
1.58 |
1.56 |
1% |
| Gold recovery (%) |
89.8 |
88.0 |
2% |
| Total gold ounces produced |
10,133 |
9,342 |
8% |
| Payable gold ounces produced |
9,948 |
9,184 |
8% |
| Silver equivalent ounces produced(1) |
2,270,677 |
2,370,905 |
(4%) |
| Cash costs per silver ounce(2) |
13.19 |
11.12 |
19% |
| Total production costs per ounce(2) |
18.90 |
15.43 |
23% |
| All in sustaining costs per ounce (2) |
21.44 |
20.16 |
6% |
| Direct operating costs per tonne(2) |
145.75 |
132.11 |
10% |
| Direct costs per tonne(2) |
181.77 |
169.49 |
7% |
(1) Silver equivalents are calculated using an 80:1 (Ag:Au) ratio.
(2) Non-IFRS measure. For a description of how these measures are calculated and a reconciliation of these measures to the most directly comparable measures specified, defined or determined under IFRS and presented in the Company's financial statements, refer to "Non-IFRS Measures".
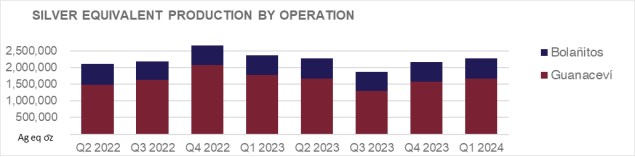
(1) Silver equivalents are calculated using an 80:1 (Ag:Au) ratio.
Consolidated Production
Three months ended March 31, 2024 (compared to the three months ended March 31, 2023)
Consolidated silver production decreased by 10% to 1,460,006 ounces in Q1 2024 compared to Q1 2023, driven by 7% lower silver production at the Guanaceví mine and 32% lower silver production at the Bolañitos mine. Consolidated gold production increased by 8% to 10,133 ounces in Q1 2024 compared to Q1 2023 due to 17% higher gold production at the Bolañitos mine, offset by 2% lower gold production at the Guanaceví mine.
Consolidated Operating Costs
Three months ended March 31, 2024 (compared to the three months ended March 31, 2023)
Direct operating costs per tonne in Q1 2024 increased to $145.75, a 10% increase compared with $132.11 in Q1 2023 due to both a strengthening of the Mexican peso and higher operating costs at both Guanaceví and Bolanitos from increased inflationary pressure during the period. As the Mexican peso strengthens, the Company's Mexican peso denominated costs are increased in US dollar terms. Guanaceví and Bolañitos have seen increased labour, and direct costs compared to Q1 2023.
Consolidated cash costs per oz, net of by-product credits, in Q1 2024 increased to $13.19 per ounce, a 19% increase compared with $11.12 per ounce in Q1 2023, driven by a 10% decrease in silver ounces produced, and a 13% increase in direct operating costs offset by 19% increase in by-product gold sales.
All-In-Sustaining Costs ("AISC") in Q1 2024 increased to $21.44 per ounce, a 6% increase compared with $20.16 per ounce in Q1 2023 primarily due to the decreased silver production partially offset by slightly lower sustaining capital expenditures.
GUANACEVÍ OPERATIONS
Production Results for the Three Months Ended March 31, 2024 and 2023
| GUANACEVÍ |
Three Months Ended March 31 |
| |
2024 |
2023 |
% Change |
| Ore tonnes processed |
115,004 |
102,375 |
12% |
| Average silver grade (g/t) |
402 |
511 |
(21%) |
| Silver recovery (%) |
89.9 |
85.6 |
5% |
| Total silver ounces produced |
1,335,742 |
1,439,924 |
(7%) |
| Payable silver ounces produced |
1,331,735 |
1,435,604 |
(7%) |
| Average gold grade (g/t) |
1.25 |
1.42 |
(12%) |
| Gold recovery (%) |
89.2 |
89.6 |
(0%) |
| Total gold ounces produced |
4,124 |
4,188 |
(2%) |
| Payable gold ounces produced |
4,111 |
4,175 |
(2%) |
| Silver equivalent ounces produced(1) |
1,665,648 |
1,774,964 |
(6%) |
| Cash costs per silver ounce(2) |
15.94 |
12.25 |
30% |
| Total production costs per ounce(2) |
19.83 |
14.89 |
33% |
| All in sustaining costs per ounce (2) |
21.96 |
19.28 |
14% |
| Direct operating costs per tonne(2) |
191.85 |
176.21 |
9% |
| Direct costs per tonne(2) |
260.13 |
251.83 |
3% |
(1) Silver equivalents are calculated using an 80:1 (Ag:Au) ratio.
(2) Non-IFRS measure. For a description of how these measures are calculated and a reconciliation of these measures to the most directly comparable measures specified, defined or determined under IFRS and presented in the Company's financial statements, refer to "Non-IFRS Measures".
Guanaceví Production Results
Three months ended March 31, 2024 (compared to the three months ended March 31, 2023)
Silver production at the Guanaceví mine during Q1 2024 was 1,335,742 oz, 7% lower than the 1,439,924 oz produced in Q1 2023, and gold production was 4,124 oz, 2% lower than the 4,188 oz produced in Q1 2023. Despite plant throughput being 12% higher in Q1 2024, compared to the same period in 2023, metal production decreased due to lower average grades of 402 gpt silver and 1.25 gpt gold were realized, compared to 511 gpt silver and 1.42 gpt gold in Q1 2023. Silver recovery slightly increased in Q1 2024 compared to Q1 2023 at 89.9% compared to 85.6% partially offsetting lower grades. Gold recoveries were consistent at 89.2% in the current period compared to 89.6% in the comparative period. The lower ore grades are consistent with the mine plan and lower than the comparative period due to normal variations within an ore body.
Guanaceví Operating Costs
Three months ended March 31, 2024 (compared to the three months ended March 31, 2023)
Direct operating costs per tonne for the three months ended March 31, 2024, increased 9% to $191.85 compared with $176.21 in the same period in 2023, resulting from a strengthening in the Mexican peso and increased labour, power and consumables costs. The local third-party ore contributed $20.80 per tonne during Q1 2024 compared to $24.32 per tonne in Q1 2023, and the volume of ore used was 12,728 tonnes compared to 11,540 tonnes in the same period in 2023. Including royalty and special mining duty costs, direct cost per tonne increased 3% to $260.13 compared with $251.83 in the same period in 2023, due to an 16% increase in direct costs offset by a 12% increase in plant throughput. Royalty expenses decreased 3% from $6.5 million in Q1 2023 to $6.3 million in Q1 2024, royalty expense being included in cost per tonne and cost per oz metrics.
Cash costs per oz, net of by-product credits, for the three months ended March 31, 2024, increased to $15.94 compared to $12.25 for the same period in 2023, driven by the higher direct costs per tonne and decreased silver production. AISC per oz increased 14% to $21.96 per oz for the three months ended March 31, 2024, due to the increased direct costs and decreased silver production, offset by a slightly lower sustaining capital expenditures being allocated to silver ounces produced.
BOLAÑITOS OPERATIONS
Production Results for the Three Months Ended March 31, 2024 and 2023
| BOLAÑITOS |
Three Months Ended March 31 |
| |
2024 |
2023 |
% Change |
| Ore tonnes processed |
106,790 |
108,698 |
(2%) |
| Average silver grade (g/t) |
42 |
61 |
(31%) |
| Silver recovery (%) |
86.2 |
86.1 |
0% |
| Total silver ounces produced |
124,263 |
183,621 |
(32%) |
| Payable silver ounces produced |
118,573 |
172,608 |
(31%) |
| Average gold grade (g/t) |
1.94 |
1.70 |
14% |
| Gold recovery (%) |
90.2 |
86.8 |
4% |
| Total gold ounces produced |
6,010 |
5,154 |
17% |
| Payable gold ounces produced |
5,837 |
5,009 |
17% |
| Silver equivalent ounces produced(1) |
605,028 |
595,941 |
2% |
| Cash costs per silver ounce(2) |
(17.69) |
1.67 |
(1,156%) |
| Total production costs per ounce(2) |
8.47 |
19.87 |
(57%) |
| All in sustaining costs per ounce (2) |
15.59 |
27.45 |
(43%) |
| Direct operating costs per tonne(2) |
96.11 |
90.57 |
6% |
| Direct costs per tonne(2) |
97.39 |
91.94 |
6% |
(1) Silver equivalents are calculated using an 80:1 (Ag:Au) ratio.
(2) Non-IFRS measure. For a description of how these measures are calculated and a reconciliation of these measures to the most directly comparable measures specified, defined or determined under IFRS and presented in the Company's financial statements, refer to "Non-IFRS Measures".
Bolañitos Production Results
Three months ended March 31, 2024 (compared to the three months ended March 31, 2023)
Silver production at the Bolañitos mine was 124,263 oz in Q1 2024, a decrease of 32% compared to 183,621 oz in Q1 2023, and gold production was 6,010 oz in Q1 2024, an increase of 17% compared to 5,154 oz in Q1 2023. Plant throughput in Q1, 2024 was 106,790 tonnes at average grades of 42 gpt silver and 1.94 gpt gold, compared to 108,698 tonnes at average grades of 61 gpt silver and 1.70 gpt gold in Q1 2023. The 32% decrease in silver production and 17% increase in gold production compared to Q1 2023 is primarily due to typical variations in the resource model.
Bolañitos Operating Costs
Three months ended March 31, 2024 (compared to the three months ended March 31, 2023)
Direct costs per tonne in Q1 2024 increased 6% to $97.39 per tonne, primarily due to inflationary pressures and strengthening of the Mexican peso Cash recoveries, net of by-product credits, were $17.69 per oz of payable silver in Q1 2024 compared to cost of $1.67 per oz in Q1 2023 due to higher by-product gold sales in the period. AISC decreased 43% in Q1, 2024 to $15.59 per oz primarily due to the 61% decrease in cash costs net of by-product caused by a by-product gold sales in the period, offset by a 31% decrease in oz produced.
TERRONERA DEVELOPMENT
Construction and Development Highlights
Overall construction progress is 53% complete with more than $158 million spent on the project. Project commitments total $225 million and are tracking in-line with our optimized plan and the workforce has increased to 150 employees and 400 contractor workers. The project remains on track for commissioning in Q4 2024.
As at March 31, 2024, site works and activities to date have included, but are not limited to:
- The company continues to maintain a strong focus on safety at site. In Q1 2024, the Project had once lost-time accident, and as of March 31, 2024 there have been 45 days totaling over 192,000 manhours since the lost-time accidents. Ongoing initiatives such as mandatory certification for working-at-heights, frequent field audits and inspections, rescue-team training, and regular emergency drills continue.
- Substantive progress in structural steel installation and equipment placement maintained good project performance with upper platform concrete work approximately 95% complete.
- Continued engineering progress for the temporary power generation platform grading, equipment arrangement, access and connection point in the power line. Power pole delivery is scheduled for early Q3 2024.
- Slurry pipeline engineering and design between the Upper and Lower Platforms continued.
- Over 3,200 metres of underground development were completed by the end of Q1 2024. The mining team has successfully transitioned from using contracted to direct-hire labor with greater development efficiencies. Development was focused on Portal 1, 2 and 4 declines with excavations well advanced for the explosives magazines and the main pump-station sump system.
- Engineering - Efforts have been transitioning over to construction support. Detail design was completed for the Tailing Storage Facility ("TSF"), Portal 2 waste dump, and Lower Platform excavation focused on procuring bulk materials, including structural steel, piping, and electrical cable following a comprehensive scheduling for delivery that tracks construction requirements. Engineering continued for temporary power generation platform grading, equipment arrangement, access connection point.
- Upper Platform Plant Site - Surface mill and infrastructure construction is 56% complete and progressing on schedule. Concrete work is 83% complete, and structural steel erection is 80% complete.
- Lower Facilities Platform and TSF - Excavation for the TSF embankment key trench was nearly 60% complete, and the lower platform area was nearly 45% complete, with the excavated material suitable to use in the TSF key trench and as embankment fill. Concrete work on the lower platform is anticipated to start in Q2.
- Bulk materials procurement purchase orders have been released and lead times are aligned with the current schedule. The procurement team has focused on critical path purchases, such as electrical components and transfer chutes, and reducing bulk material lead times to increase schedule float.
- Supporting the local municipality has continued to be a major focus with sponsoring cultural and community activities in the area and hiring local contractors, workforce and businesses. The Community Relations Annual Operating Plan was presented to Terronera Project General Management. Environmental and social assessment initiatives continue according to schedule as outlined under the Equator Principal requirements for project loan financing.
- Scope of work is in progress to implement the Livelihood Restoration Plans, the Local Content Plan, and the Tourism Sector Relationship Plan
2024 Outlook and Planning
Endeavour remains focused on advancing the Terronera Project for initial production in Q4 2024, with a comprehensive schedule and plan under the 2024 Updated Scenario.
For Q2 2024, surface construction will continue focusing on mechanical installations and initial electrical work for the crushing, coarse-ore stockpile, grinding, flotation and tailing thickener areas. Excavation of the Lower Platform is anticipated to be complete in the coming months. Concrete work is expected to be initiated for the LNG power generation and concentrate and tailing filtration. Concentrate and tailing filtration structural, mechanical, and electrical installations will commence in early Q3.
Mine development in Portal 1, 2 and 4 declines will continue with first ore development anticipated in Q2.
Initial long-hole mining is planned for Q3 followed by cut-and-fill mining; ore will be stockpiled for mill ramp up. Development activities at La Luz are anticipated to begin in Q2 with portal construction and ramp advance to ore access anticipated in Q4. The critical path remains the TSF and lower platform construction and advancing underground mine, where development is meeting expectations.
EXPLORATION
At Terronera, the site remains focused on development with exploration regional activities completed including geological mapping conducted in Los Espinos NW area and commenced in the Quiteria West zone. Topographical surveying in the El Padre West and Maria Jose area. Management plans to resume exploration drilling activities once the Terronera project is in operation. During Q1 2024 the Company incurred total development expense of $1.7 million at Terronera, which includes costs that are ineligible for capitalization as a cost of building the mine, including social, environmental and management oversight costs.
At Pitarrilla, the Company continued development of the exploration ramp and developed 121 meters of crosscuts to be used for underground drilling. The Company continued geological mapping and surface projections of the Casas Blanca and Danna feeders During Q1 2024 the Company incurred total exploration expense of $0.8 million at Pitarilla.
At Guanaceví, the Company conducted geological mapping of the El Escalon claim and concluded the mapping of the El Tule property and geological surveying of two old workings. No drilling was performed in Q1 2024, focus was instead on the development of level 2179 in preparation for the 2024 drilling campaign.
At Bolañitos, the Company drilled 2,509 metres in 12 holes with an expense of $0.3 million testing the La Loba vein, located southeast of Los Reyes vein. The Company is currently awaiting assays of the drill results The Company conducted geological mapping in the Tajo de Adjuntas area, within the Puertecito claim.
CONSOLIDATED FINANCIAL RESULTS
Three months ended March 31, 2024 (compared to the three months ended March 31, 2023)
In Q1, 2024, the Company's mine operating earnings were $11.7 million (Q1, 2023 - $16.0 million) on revenue of $63.7 million (Q1, 2023 - $55.5 million) with cost of sales of $52.1 million (Q1, 2023 - $39.5 million). Higher revenue was offset by higher cost of sales for the period, as a result of cost pressures on direct costs and higher depreciation due to diminished reserves driving higher depletion costs.
In Q1, 2024, the Company had operating earnings of $3.3 million (Q1, 2023 - $6.9 million) after exploration, evaluation and development costs of $4.3 million (Q1, 2023 - $4.2 million) and general and administrative expense of $4.0 million (Q1, 2023 -$4.9 million).
The earnings before taxes for Q1, 2024 were $4.2 million (Q1, 2023 - $12.5 million) after finance costs of $0.3 million (Q1, 2023 - $0.4 million), a foreign exchange gain of $1.2 million (Q1, 2023 - $1.9 million) and investment and other income of $nil (Q1, 2023 - investments and other income of $4.1 million). The Company realized net loss for the period of $1.2 million (Q1, 2023 - net earnings of $6.5 million) after an income tax expense of $5.4 million (Q4, 2023 -$6.1 million). In Q1, 2024 earnings were impacted by a $0.9 million mark-to-market adjustment resulting in an unrealized loss on investments included in investment and other expenses (Q1, 2023 - unrealized gain of $3.1 million).
Revenue of $63.7 million in Q1, 2024, net of $0.5 million of smelting and refining costs, increased by 15% compared to $55.5 million, net of $0.6 million of smelting and refining costs, in Q1, 2023. Gross sales of $64.2 million in Q1, 2024 represented a 14% increase over the $56.1 million for the same period in 2023. Silver oz sold increased 5% compared to the sales in Q1, 2023. The 5% increase in ounces sold during the period, combined with a 1% increase in the realized silver price resulted in an 7% increase to gross silver revenue. Gold oz sold increased 19% with a 10% increase in realized gold prices resulting in a 31% increase in gross gold revenue. During the period, the Company sold 1,756,094 oz silver and 10,880 oz gold, for realized prices of $23.47 and $2,114 per oz, respectively, compared to sales of 1,667,408 oz silver and 9,126 oz gold, for realized prices of $23.16 and $1,917 per oz, respectively, in the same period of 2023. For the three months ended March 31, 2024, the realized prices of silver and gold were within 2% of the London spot prices. Silver and gold London spot prices averaged $23.36 and $2,072, respectively, during the three months ended March 31, 2024.
The Company decreased its finished goods silver and gold to 182,128 oz silver and 779 oz gold, at March 31, 2024 compared to 487,884 oz silver and 1,711 oz gold at December 31, 2023. The cost allocated to these finished goods was $4.0 million at March 31, 2024, compared to $9.5 million at December 31, 2023. At March 31, 2024, the finished goods inventory fair market value was $6.2 million, compared to $15.1 million at December 31, 2023.
Cost of sales for Q1, 2024 was $52.1 million, an increase of 32% over the cost of sales of $39.5 million for Q1, 2023. The increase in cost of sales in Q1, 2024 was predominantly caused by increased direct costs and increased depreciation costs. Direct costs were impacted by a strengthened Mexican peso, higher labour, power and consumables costs as the Company, as well as the industry, has experienced significant inflationary pressures. Additionally direct costs were impacted by lower grades in Guanaceví compared to Q1 2023. Depreciation costs were impacted by declining estimated remaining life of mines, as reduced grade and increased cost cutoff caused lower reserves and resources at Guanaceví and as a result remaining life of mine was not extended as it was the case in prior years.
Exploration and evaluation expenses were $4.3 million, consistent with $4.2 million incurred in the same period of 2023. General and administrative expenses of $4.0 million in Q1 2024 were 18% lower compared to the $4.9 million incurred for the same period of 2023, primarily due to investment in a new ERP system during 2023.
The Company incurred a foreign exchange gain of $1.2 million in Q1, 2024 compared to a foreign exchange gain of $1.9 million in Q1, 2023 due to a strengthening of the Mexican peso during the quarter which increases the US dollar value of Mexican peso denominated working capital surplus. The Company incurred $0.3 million in finance charges primarily from interest on loans related to mobile equipment and accretion of reclamation and rehabilitation liabilities, compared to $0.4 million for the same period in 2023. The Company recognized $nil million in investment and other income compared to $4.0 million in investment and other income in Q1, 2023, resulting from recognizing an unrealized loss on marketable securities and warrants of $0.9 million (Q1, 2023 - gain of $3.1 million), $0.9 million in interest income (Q1, 2023 - $0.5 million). In Q1, 2023, the Company also recognized 0.3 million of royalty income and $0.1 million of other income
Income tax expense was $5.4 million in Q1, 2024 compared to $6.1 million in Q1, 2023. The $5.4 million tax expense is comprised of $5.6 million in current income tax expense (Q1, 2023 - $4.4 million) and $0.2 million in deferred income tax recovery (Q1, 2023 - deferred tax expense$1.7 million). The current income tax expense consists of $1.6 million in special mining duty taxes and $4.0 million of income taxes. The deferred income tax recovery of $0.2 million is derived from changes in temporary timing differences between deductions for accounting versus deductions for tax.
KEY ECONOMIC TRENDS
Precious Metal Price Trends
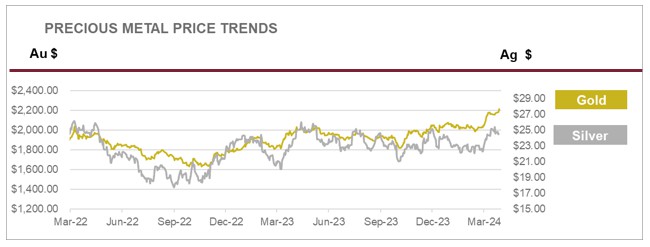
The prices of silver and gold are the largest single factor in determining profitability and cash flow from operations. The financial performance of the Company has been, and is expected to continue to be, closely linked to the prices of silver and gold.
During Q1 2024, the average price of silver was $23.36 per ounce, with silver trading between $22.09 and $25.43 per oz based on the London Fix silver price. This compares to an average of $22.55 per oz for the three months ended March 31, 2023, with a low of $20.09 and a high of $24.44 per oz. For the three months ended March 31, 2024, the Company realized an average price of $23.47 per silver oz compared with $23.16 for the three months ended March 31, 2023.
During Q1 2024, the average price of gold was $2,072 per oz, with gold trading between $1,985 and $2,214 per oz based on the London Fix PM gold price. This compares to an average of $1,890 per oz for the three months ended March 31, 2023, with a low of $1,811 and a high of $1,994 per oz. For the three months ended March 31, 2024, the Company realized an average price of $2,114 per oz compared with $1,917 for the three months ended March 31, 2024.
The silver and gold markets have been impacted by changes in investment demand and the silver market is impacted due to the monetary aspects of silver, rising demand as a "green" metal and rising geopolitical tension. Central banks' increase of interest rates utilized as a tool in an attempt to offset inflation concerns, has impacted the price of silver and gold in 2023 and 2024.
Currency Fluctuations
Foreign exchange risk arises from transactions denominated in currencies other than the U.S. dollar. The Company's operations are located in Mexico and therefore a significant portion of operating costs and capital expenditures are denominated in Mexican pesos.
During Q1 2024, the Mexican peso continued to strengthen against the U.S. dollar. The average foreign exchange rate was $16.97 Mexican pesos per U.S. dollar, with the peso trading within a range of $16.56 to $17.32. This compares to an average of $18.66, with a range of $17.95 to $19.48 Mexican pesos per U.S. dollar in Q1, 2023.
During the year ended December 31, 2023, the Mexican peso strengthened against the U.S. dollar. The average foreign exchange rate was $17.73 Mexican pesos per U.S. dollar, with the peso trading within a range of $16.67 to $19.48. This compares to an average of $20.25, with a range of $19.52 to $21.35 Mexican pesos per U.S. dollar during the year ended December 31, 2022.
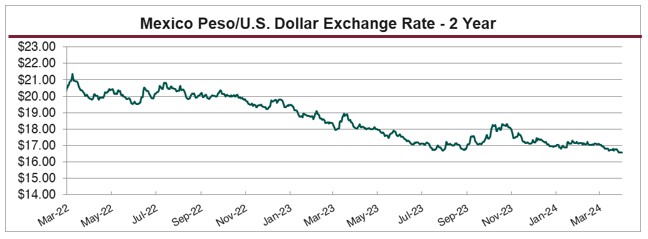
Cost Trends
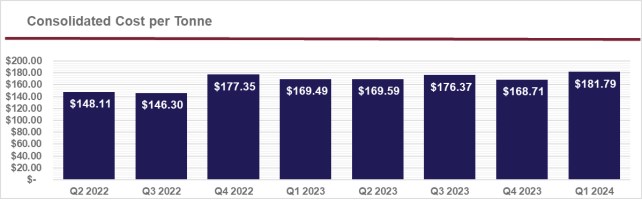
The Company's profitability is subject to industry wide cost pressures on development and operating costs with respect to labour, energy, consumables and capital expenditures. Underground mining is labour intensive and approximately 33% of the Company's production costs are directly tied to labour. In order to mitigate the impact of higher labour and consumable costs, the Company focuses on continuous improvement by promoting more efficient use of materials and supplies and by pursuing more advantageous pricing while increasing performance and without compromising operational integrity. During 2022, mining, processing and indirect costs all increased due to inflationary and industry cost pressures. During Q4, 2022 the cost per tonne was impacted by royalty costs recognized upon sale of higher than usual finished goods inventory that had been held during Q2 and Q3 of 2022. During the year ended December 31, 2023, costs have continued to be impacted by inflationary and industry costs pressures as well as being impacted by a strengthened Mexican Peso. From December 31, 2022 to December 31, 2023, the Mexico Peso has appreciated by approximately 15%. During Q1 2024, the cost pressures continued due to the maintained strength of the Mexican Person and ongoing ventilation challenges affecting productivity, and higher depreciation costs due to lower proven and probable reserves available for the depletion of the capitalized mine costs.
ANNUAL OUTLOOK
2024 Production and Cost Guidance
| |
|
Guanaceví |
Bolañitos |
Consolidated |
| Tonnes per day |
TPD |
1,150 - 1,250 |
1,150 - 1,250 |
2,300 - 2,500 |
| Silver Production |
M oz |
4.9 - 5.2 |
0.5 - 0.6 |
5.3 - 5.8 |
| Gold Production |
K oz |
13.0 - 15.0 |
21.0 - 23.0 |
34.0 - 38.0 |
| Silver Eq Production(1) |
US$/oz |
5.9 - 6.4 |
2.2 - 2.4 |
8.1 - 8.8 |
| Cash Costs, net of gold by-product credits(2) |
US$/oz |
|
|
$14.00 - $15.00 |
| AISC, net of gold by-product credits(2) |
US$/oz |
|
|
$22.00 - $23.00 |
| Sustaining Capital Budget |
US$M |
|
|
$30.0 |
| Exploration Budget |
US$M |
|
|
$8.7 |
(1) 2024 silver equivalent production is calculated using an 80:1 (Ag:Au) ratio
(2) Non-GAAP measures - See "Non-IFRS measures" below.
Operating mines
In 2024, silver production is expected to range from 5.3 to 5.8 million oz and gold production is expected to range from 34,000 to 38,000 oz. Silver equivalent production is forecasted to range from 8.1 to 8.8 million oz using an 80:1 Ag:Au ratio.
| Mine |
Ag (M oz) |
Au (K oz) |
Ag Eq (M oz) |
Tonnes/Day (tpd) |
| Guanaceví |
4.9 - 5.2 |
13.0 - 15.0 |
5.9 - 6.4 |
1,150 - 1,250 |
| Bolañitos |
0.5 - 0.6 |
21.0 - 23.0 |
2.2 - 2.4 |
1,150 - 1,250 |
| Total |
5.3 - 5.8 |
34.0 - 38.0 |
8.1 - 8.8 |
2,300 - 2,500 |
At Guanaceví, production will range between 1,150 tpd to 1,250 tpd and average 1,200 tpd from the Milache and El Curso orebodies. A significant portion of production will be mined from the Porvenir Cuatro extension on the El Curso concessions. The El Curso concessions are leased from a third party with no up-front costs but with significant royalty payments on sale. Compared to 2023, mine grades are expected to be slightly lower and recoveries are anticipated to be similar in 2024. Cash costs per ounce, AISC per ounce and direct costs on a per tonne basis are expected to be similar to 2023.
In 2024, plant throughput at Bolañitos is expected to range from 1,150 tpd to 1,250 tpd and average 1,200 tpd from the Plateros-La Luz, Lucero-Karina and Bolañitos-San Miguel vein systems. Mine grades are expected to be higher for silver and lower for gold and recoveries are expected to be similar to 2023. Cash costs per ounce are expected to increase due to lower gold production and lower estimated gold prices. AISC per ounce are expected to decrease due to lower sustaining capital and direct costs on a per tonne basis are expected to be similar to 2023.
Consolidated Operating Costs
In 2024, cash costs, net of gold by-product credits, are expected to be $14.00-$15.00 per oz of silver produced. AISC, net of gold by-product credits, in accordance with the World Gold Council standard, are estimated to be $22.00-$23.00 per oz of silver produced.
Direct operating costs per tonne were estimated to be $140-$145 and Direct costs, which include royalties and special mining duties are estimated to be in the range of $165-$170 per tonne.
Management made the following assumptions in calculating its 2024 cost forecasts: $23 per oz silver price, $1,840 per oz gold price and 17:1 Mexican peso to U.S. dollar exchange rate.
2024 Capital Budget
| |
Sustaining Mine
Development |
Sustaining Other
Development |
Total Sustaining
Capital |
Growth Capital |
Total Capital |
| Guanaceví |
$14.1 million |
$7.1 million |
$21.2 million |
- |
$21.2 million |
| Bolañitos |
$7.3 million |
$1.5 million |
$8.8 million |
- |
$8.8 million |
| Corporate and Exploration |
- |
- |
- |
$2.6 million |
$2.6 million |
| Total |
$21.4 million |
$8.6 million |
$30.0 million |
$2.6 million |
$32.6 million |
Sustaining Capital Investments
In 2024, Endeavour plans to invest $30.0 million in sustaining capital at its two operating mines. At estimated metal prices, the sustaining capital investments are expected to be paid out of operating cash flow.
At Guanaceví, $21.2 million will be invested in capital projects, the largest of which is 4.4 kilometres of mine development at El Curso and Milache for an estimated $14.1 million. An additional $5.4 million will be invested in mine infrastructure and mine equipment. A further $1.5 million will be invested in the plant and tailings storage facility, including engineering for a tailings facility expansion. The remaining $0.2 million will be spent on various surface infrastructure or equipment.
At Bolañitos, $8.8 million will be invested in capital projects, including $7.3 million for 5.1 kilometres of mine development to access resources in the Plateros-La Luz, Lucero-Karina, and Bolañitos -San Miguel areas. The additional $1.5 million will go to upgrade the mining fleet, plant improvements and to support site infrastructure.
The Company also plans to spend $2.6 million to maintain exploration concessions, acquire mobile equipment for exploration and cover corporate infrastructure.
Exploration Budget
| Project |
2024 Activity |
Drill Metres |
Expenditures |
Discretionary |
| Guanaceví |
Drilling |
6,000 |
$1.2 million |
|
| Bolañitos |
Drilling |
6,000 |
$1.0 million |
|
| Pitarrilla |
Drilling/Development |
6,000 |
$5.1 million |
|
| Parral |
Economic Studies |
- |
$0.5 million |
$0.2 million |
| Chile |
Targeting |
- |
$0.4 million |
$1.6 million |
| Bruner |
Targeting |
- |
$0.4 million |
$0.4 million |
| Other |
Evaluation |
- |
$0.1 million |
|
| Total |
|
18,000 |
$8.7 million |
$2.2 million |
In 2024, the Company plans to spend $8.7 million drilling 18,000 metres across its properties, with the majority of the budget allocated towards advancing Pitarrilla. The discretionary component is subject to Board approval later in the year, as the Company completes the build of Terronera.
At the Guanaceví and Bolañitos mines, 12,000 metres of drilling are planned at a cost of$2.2 million to replace reserves and expand resources.
At the Pitarrilla project, management plans to invest $5.1 million on several initiatives. The largest portion of the expenditures at Pitarrilla in 2024 relates to ramp fortification costs to continue advancement of an underground drive that will be used as a drilling platform. During 2023, the drive was re-directed due to ground conditions, which increased the development estimate. The Company plans to drill 6,000 metres to test the high-grade zone and its feeder structures at various angles from the newly extended and improved ramp. Additional plans include continued maintenance of the office and camp, scoping studies and additional underground infrastructure.
At the Parral project in Chihuahua state, the Company has paused exploratory drilling and has allocated $0.5 million towards economic studies.
In Chile, management has taken the approach to pause exploration and intends to invest $0.4 million on targeting programs. Subject to Board approval, the Company has allocated a discretionary investment of $1.6 million towards drilling the Aida target and programs related to mapping, sampling, geophysics and surface exploration on several other exploration projects.
At the Bruner project in Nevada, USA management plans to invest $0.4 million to map and sample new targets with a discretionary component of $0.4 million related to engineering work.
LIQUIDITY AND CAPITAL RESOURCES
Cash and cash equivalents decreased slightly from $35.3 million at December 31, 2023 to $34.9 million at March 31, 2024.
| Expressed in thousands US dollars |
|
As at March 31, 2024 |
|
|
As at December 31, 2023 |
|
| Current assets |
$ |
111,769 |
|
$ |
100,773 |
|
| Current liabilities |
|
55,357 |
|
|
58,244 |
|
| Working capital |
$ |
56,412 |
|
$ |
42,529 |
|
The Company had working capital of $56.4 million as at March 31, 2024 (December 31, 2023 - $42.5 million). The $13.9 million increase in working capital is caused primarily by a $22.0 million increase in accounts and other receivables from IVA receivable build up at the Terronera Project; refunds are expected to commence later in 2024. Other notable changes in working capital include: $2.7 million decrease in accounts payable, accrued liabilities and other current liabilities due to timing changes; offset by $6.1 million decrease in inventory as finished goods were sold down at quarter end, and a $3.5 million decrease in other investments as these were disposed of for cash during the period.
Operating activities provided $4.6 million during the three months period ended March 31, 2024, compared to using $0.4 million in the same period of 2023, driven largely by the higher silver and gold realized prices as well as higher gold ounces sold. In addition to the change in the working capital, Q1 2023 was also impacted by a cash settlement of $2.1 million of the deferred and performance shares which did not occur in Q1 2024.
Investing activities used net cash $42.2 million during the three months ended March 31, 2024, compared to using net cash of $20.6 million in the same period in 2023, due to the development of Terronera. Capital asset investments totaled $44.9 million in property, plant and equipment during Q1, 2024, compared to capital investments totaling $20.7 million in the same period in 2023.
At Guanaceví, the Company invested $4.7 million, with $3.9 million spent on 1.2 km of mine development and underground infrastructure and $0.3 million on mobile equipment. The Company continued to invest in upgrades for the plant and surrounding infrastructure, including $0.5 million on plant upgrades, mine site improvements and the tailings facility.
At Bolañitos, the Company invested $2.3 million, with $1.8 million spent on 1.0 km of mine development and $0.4 million on mobile equipment. The Company continued to invest in upgrades for the plant and surrounding infrastructure, including $0.1 million on plant upgrades.
At Terronera, the Company invested $29.0 million, with $14.6 million spent on land payments, surface and mine development and infrastructure, $8.2 million was invested in plant, $0.7 million spent on buildings, $5.2 million was invested in mine equipment and $0.3 million on light vehicles, office and IT infrastructure. An additional $8.7 million was invested in changes in working capital items and deposits used for purchases of equipment not yet delivered and accounts payable for equipment delivered.
Exploration and general and administrative investments were $0.1 million spent on holding costs, mobile equipment, office, building infrastructure and light vehicles.
Financing activities for the three months period ended March 31, 2024 provided $37.2 million, compared to using $0.3 million in the same period of 2023. During the Q1, 2024 the Company received $39.8 million from public equity offerings of shares, paid $0.9 million in share issuance costs, paid $1.4 million in interest and principal repayments on loans and leases, received $0.5 million in loan payments and paid $0.7 million in deferred financing fees. By comparison, in Q1 2023 the Company received $1.8 million on the exercise of employee stock options, paid $1.9 million in interest and principal repayments on loans and leases and paid $0.3 million in withholding taxes on equity settled performance share units.
On December 18, 2023, the Company entered into an "At-The-Market" ("ATM") equity facility (the "December 2023 ATM Facility"). Under the terms of this ATM facility, the Company can, from time to time, sell common stock having an aggregate offering value of up to $60.0 million on the New York Stock Exchange. The Company determines, at its sole discretion, the timing and number of shares to be sold under the ATM facility. During the three months ended March 31, 2024, the Company issued 23,091,986 common shares under the December 2023 ATM Facility, at an average price of $1.72 per share for gross proceeds of $39.8 million, less commission of $0.8 million and recognized $0.1 million of other transaction costs related to the ATM financing as share issuance costs.
For the December 2023 ATM facility, the net proceeds as at March 31, 2024 have been used as follows:
| Use of proceeds (thousands) |
|
|
|
| Net proceeds received |
$ |
43,565 |
|
| Terronera Construction |
|
(39,886 |
) |
| Pitarrilla exploration |
|
(497 |
) |
| Allocated to working capital |
$ |
3,182 |
|
Terronera's Debt Facility Agreement ("Debt Facility") includes certain restrictive covenants with respect to the use of the loan proceeds, including restrictions on transferring funds out of Terronera entity. These restrictions are not expected to have any impact on the Company's ability to meet its obligations.
The Company has historically funded its acquisition, exploration and development activities through equity financings, debt facilities and convertible debentures. In recent years, the Company has financed most of its acquisition, exploration, development and operating activities from production cash flows, treasury and equity financings. The Company may choose to undertake equity, debt, convertible debt or other financings, on an as-needed basis, in order to facilitate its growth.
Management of the Company believes that operating cash flow, existing working capital and the committed Debt Facility will be sufficient to cover 2024 capital requirements and meet its short-term obligations. The Company continues to assess financing alternatives, including equity or debt or a combination of both, to fund future growth, including the development of the Terronera project.
Contingencies
The Company has a number of disputes with the Mexican tax authorities as disclosed in the MD&A for the year ended December 31, 2023, which are currently being addressed in the Mexican court process, and judgment is employed to assess the likelihood of outcomes in favour of the Company and recognition of any liabilities. The Company is also required to use judgement to determine certain tax treatments in calculating income tax expense and IVA recoverable. A number of these judgements are subject to various uncertainties. From time to time, Mexican authorities may apply, re-interpret legislation or disregard precedents and it is possible that these uncertainties may be resolved unfavorably for the Company.
Capital Requirements
As of March 31, 2024, the Company held $34.9 million in cash and $56.4 million in working capital. The Company also had $120 million available under the committed Debt Facility for use in respect of the Terronera project. On April 9, 2024, subsequent to the end of the reporting period, the Company drew down $60 million of the Debt Facility, leaving $60 million undrawn and available. Further draw downs under the Debt Facility are subject to successful completion of specific customary conditions precedent.
The Company may be required to raise additional funds through future debt or equity financings in order to finance the development of the Terronera Project and may need to raise additional funds to carry out other business plans. As at March 31, 2024, of the total $271 million required to build Terronera, the remaining amount including any cost overrun funding will be funded during 2024 using existing cash on hand, the initial $60 million drawn and the remaining $60 million Debt Facility. The Company will continue to monitor capital markets, economic conditions and assess its short term and long-term capital needs.
Contractual Obligations
The Company had the following undiscounted contractual obligations at March 31, 2024:
Payments due by period (in thousands of dollars)
Contractual Obligations |
|
Total |
|
|
Less than 1
year |
|
|
1 - 3 years |
|
|
3 - 5 years |
|
|
More than 5
years |
|
| Capital asset purchases |
$ |
38,299 |
|
$ |
38,299 |
|
$ |
- |
|
$ |
- |
|
$ |
- |
|
| Loans payable |
|
7,790 |
|
|
3,823 |
|
|
3,967 |
|
|
- |
|
|
- |
|
| Lease liabilities |
|
979 |
|
|
424 |
|
|
334 |
|
|
221 |
|
|
- |
|
| Other contracts |
|
578 |
|
|
163 |
|
|
249 |
|
|
166 |
|
|
- |
|
| Other Long-Term Liabilities |
|
11,972 |
|
|
- |
|
|
- |
|
|
4,409 |
|
|
7,563 |
|
| Total |
$ |
59,618 |
|
$ |
42,709 |
|
$ |
4,550 |
|
$ |
4,796 |
|
$ |
7,563 |
|
Other contracts consist of office premises operating costs and short-term leases.
The $11,972 of other long-term liabilities is the undiscounted cost estimate to settle the Company's reclamation costs of the Guanaceví and Bolañitos mines, the Terronera development project and the Pitarrilla exploration project in Mexico. These costs include land rehabilitation, decommissioning of buildings and mine facilities, ongoing care and maintenance and other costs.
TRANSACTIONS WITH RELATED PARTIES
The Company was charged $113,000 for legal services for the three months ended March 31, 2024 by a law firm in which the Company's corporate secretary is a partner (March 31, 2023 - $67,000). The Company has $75,000 payable to the legal firm as at March 31, 2024 (December 31, 2023 - $86,000).
FINANCIAL INSTRUMENTS AND FAIR VALUE MEASUREMENTS
As at March 31, 2024, the carrying and fair values of Endeavour's financial instruments by category were as follows:
| Expressed in thousands US dollars |
|
Fair value
through profit
or loss |
|
|
Amortized
cost |
|
|
Carrying value |
|
|
Estimated
Fair value |
|
| Financial assets: |
|
|
|
|
|
|
|
|
|
|
|
|
| Cash and cash equivalents |
$ |
- |
|
$ |
34,876 |
|
$ |
34,876 |
|
$ |
34,876 |
|
| Other investments |
|
1,631 |
|
|
- |
|
|
1,631 |
|
|
1,631 |
|
| Accounts and other receivables |
|
8,960 |
|
|
4,681 |
|
|
13,641 |
|
|
13,641 |
|
| Loan receivable |
|
- |
|
|
2,949 |
|
|
2,949 |
|
|
2,949 |
|
| Total financial assets |
$ |
10,591 |
|
$ |
42,506 |
|
$ |
53,097 |
|
$ |
53,097 |
|
| |
|
|
|
|
|
|
|
|
|
|
|
|
| Financial liabilities: |
|
|
|
|
|
|
|
|
|
|
|
|
| Accounts payable and accrued liabilities |
$ |
2,558 |
|
$ |
40,964 |
|
$ |
43,522 |
|
$ |
43,522 |
|
| Loans payable |
|
- |
|
|
7,331 |
|
|
7,331 |
|
|
7,331 |
|
| Total financial liabilities |
$ |
2,558 |
|
$ |
48,295 |
|
$ |
50,853 |
|
$ |
50,853 |
|
Fair value hierarchy
Fair value is the price that would be received to sell an asset or paid to transfer a liability in an orderly transaction between market participants at the measurement date. The fair value hierarchy establishes three levels to classify the inputs to valuation techniques used to measure fair value. Level 1 inputs are quoted prices (unadjusted) in active markets for identical assets or liabilities. Level 2 inputs are quoted prices in markets that are not active, quoted prices for similar assets or liabilities in active markets, inputs other than quoted prices that are observable for the asset or liability (for example, interest rate and yield curves observable at commonly quoted intervals, forward pricing curves used to value currency and commodity contracts and volatility measurements used to value option contracts), or inputs that are derived principally from or corroborated by observable market data or other means. Level 3 inputs are unobservable (supported by no or little market activity). The fair value hierarchy gives the highest priority to Level 1 inputs and the lowest priority to Level 3 inputs.
Assets and liabilities as at March 31, 2024 that measured at fair value on a recurring basis include:
| As at March 31, 2024 |
|
|
|
|
|
|
|
|
|
|
|
|
| Expressed in thousands US dollars |
|
Total |
|
|
Level 1 |
|
|
Level 2 |
|
|
Level 3 |
|
| Assets: |
|
|
|
|
|
|
|
|
|
|
|
|
| Other investments |
$ |
1,631 |
|
$ |
1,568 |
|
$ |
- |
|
$ |
63 |
|
| Trade receivables |
|
8,960 |
|
|
- |
|
|
8,960 |
|
|
- |
|
| Total financial assets |
$ |
10,591 |
|
$ |
1,568 |
|
$ |
8,960 |
|
$ |
63 |
|
| |
|
|
|
|
|
|
|
|
|
|
|
|
| Liabilities: |
|
|
|
|
|
|
|
|
|
|
|
|
| Deferred share units |
$ |
2,513 |
|
$ |
2,513 |
|
$ |
- |
|
$ |
- |
|
| Share appreciation rights |
$ |
45 |
|
$ |
- |
|
$ |
45 |
|
$ |
- |
|
| Total financial liabilities |
$ |
2,558 |
|
$ |
2,513 |
|
$ |
45 |
|
$ |
- |
|
Other investments
The Company holds marketable securities classified as Level 1 and Level 3 in the fair value hierarchy. The fair values of Level 1 investments are determined based on a market approach reflecting the closing price of each particular security at the reporting date. The closing price is a quoted market price obtained from the stock exchange that is the principal active market for the particular security, being the market with the greatest volume and level of activity for the assets. For Level 3 investments, which consist of share purchase warrants where inputs are not observable, they have an estimated value determined by using an option pricing model. Changes in fair value on available for sale marketable securities are recognized in earnings or loss.
Trade receivables
The trade receivables consist of receivables from provisional silver and gold sales from the Bolañitos mine. The fair value of receivables arising from concentrate sales contracts that contain provisional pricing mechanisms is determined using the appropriate quoted closing price on the measurement date from the exchange that is the principal active market for the particular metal. As such, these receivables, which meet the definition of an embedded derivative, are classified within Level 2 of the fair value hierarchy.
Deferred share units
The Company has a cash settled Deferred Share Unit ("DSU") plan whereby deferred share units may be granted to independent directors of the Company in lieu of compensation in cash or stock options. The DSUs vest immediately and are redeemable for cash based on the market value of the units at the time of a director's retirement. The DSUs are classified as Level 1 in the fair value hierarchy. The liability is determined based on a market approach reflecting the closing price of the Company's common shares at the reporting date. Changes in fair value are recognized in general and administrative expenses.
Share appreciation rights
As part of the Company's bonus program, the Company grants share appreciation rights ("SARs") to its employees in Mexico and Chile. The SARs are subject to vesting conditions and, when exercised, constitute a cash bonus based on the value of the appreciation of the Company's common shares between the SARs grant date and the exercise date.
The SARs are classified as Level 2 in the fair value hierarchy. The liability is valued using a Black-Scholes option pricing model. Changes in fair value are recognized in salaries, wages and benefits.
Financial Instrument Risk Exposure and Risk Management
The Company is exposed in varying degrees to a variety of financial instrument related risks. The Board approves and monitors the risk management process. The types of risk exposure and the way in which such exposure is managed is provided as follows:
Credit Risk
The Company is exposed to credit risk on its bank accounts, accounts receivable and loan receivable. Credit risk exposure on bank accounts is limited through maintaining the Company's balances with high-credit quality financial institutions, maintaining investment policies, assessing institutional exposure and continual discussion with external advisors. Value-added tax receivables are generated on the purchase of supplies and services to produce silver, which are refundable from the Mexican government. Trade receivables are generated on the sale of concentrate inventory to reputable metal traders. The loan receivable is related to the remaining proceeds for the sale of the El Compas mine to Grupo ROSGO. There has been no indication of a change in the creditworthiness of the counterparty to the loan receivable since the initial recognition.
Liquidity Risk
Liquidity risk is the risk that the Company will not be able to meet its financial obligations as they come due. The Company manages its liquidity risk by continually monitoring forecasted and actual cash flows. The Company has in place a planning and budgeting process to help determine the funds required to support its normal operating requirement and development plans. The Company aims to maintain sufficient liquidity to meet its short-term business requirements, taking into account its anticipated cash flows from operations, its holdings of cash and cash equivalents, and its committed and anticipated liabilities.
The Company's Mexican subsidiaries pay IVA on the purchase and sale of goods and services. The net amount paid is recoverable but is subject to review and assessment by the tax authorities. The Company regularly files the required IVA returns and all supporting documentation with the tax authorities, however, the Company has been advised that certain IVA amounts receivable from the tax authorities are being withheld pending completion of the authorities' audit of certain of the Company's third-party suppliers. Under Mexican law, the Company has legal rights to those IVA refunds and the results of the third-party audits should have no impact on refunds. A smaller portion of IVA refund requests are from time to time denied based on the alleged lack of compliance of certain formal requirements and information returns by the Company's third-party suppliers. The Company takes necessary legal action on the delayed refunds as well as any denied refunds. The Company is in regular contact with the tax authorities in respect of its IVA filings and believes that the full amount of its IVA receivables will ultimately be received; however, the timing of recovery of these amounts and the nature and extent of any adjustments to the Company's IVA receivables remains uncertain.
Market Risk
The significant market risk exposures to which the Company is exposed are foreign currency risk, interest rate risk, and commodity price risk.
Foreign Currency Risk - The Company's operations in jurisdictions where the U.S. dollar is not the operating currency make it subject to foreign currency fluctuations. A majority of the Company's operating expenses are incurred in Mexican pesos and therefore the fluctuation of the U.S. dollar in relation to the Mexican peso impacts the profitability of the Company and may also affect the value of the Company's assets and the amount of shareholders' equity. As of March 31, 2024, the Company had not entered into any agreements or purchased any instruments to hedge currency risks. Subsequent to the quarter end, the Company entered into a $45 million of forward purchase agreements for Mexican peso over the remaining construction period of the Terronera project, as required by the Debt Facility agreement in order to reduce the financial risks to the construction cost.
Interest Rate Risk - In respect of financial assets, the Company's policy is to invest cash at floating rates of interest and cash reserves are to be maintained in cash equivalents in order to maintain liquidity. Fluctuations in interest rates impact the value of cash equivalents. Subsequent to the quarter end, the Company drew down on the Debt Facility and the interest on this loan is SOFR plus 4.5% until completion of the project where it changes to 3.75%.
Commodity Price Risk - Gold and silver prices have historically fluctuated significantly and are affected by numerous factors outside of the Company's control, including, but not limited to, industrial and retail demand, central bank lending, forward sales by producers and speculators, levels of worldwide production, short-term changes in supply and demand because of speculative hedging activities and certain other factors. On March 28, 2024 the Company entered into forward swap agreements for 68,000 oz of gold expected to be produced by Terronera over the three-year period starting December 2024, as required by the Debt Facility agreement. This represents 55% of planned gold production during that period. On April 9, 2024 the Company entered into Mexican Peso forward purchase contracts for a total of $45,000 over the construction period from April 2024 to December 2024 at 16.56 pesos per US dollar.
At March 31, 2024, there are 38,878 oz of silver and 2,184 oz of gold, which do not have a final settlement price and the estimated revenues have been recognized at current market prices. As at March 31, 2024, with other variables unchanged, a 10% decrease in the market value of silver and gold would result in a reduction of revenue and the associated receivable of $0.6 million.
OUTSTANDING SHARE DATA
As of May 8, 2024, the Company had the following securities issued, issuable and outstanding:
- 240,341,478 common shares;
- 4,996,891 stock options;
- 1,319,000 performance share units; and
- 337,936 equity settled deferred share units.
As at March 31, 2024, the Company's issued share capital was $761.6 million (December 31, 2023 - $722.7 million), representing 240,337,478 common shares (December 31, 2023 - 217,245,492), and the Company had options outstanding to purchase 5,000,891 common shares (December 31, 2023 - 3,488,291) with a weighted average exercise price of CAD$3.80 (December 31, 2023 - CAD$4.24).
The Company considers the items included in the consolidated statement of shareholders' equity as capital. The Company's objective when managing capital is to safeguard its ability to continue as a going concern so that it can continue to provide returns for shareholders and benefits for other stakeholders. The Company manages the capital structure and makes adjustments to it in light of changes in economic conditions and the risk characteristics of the underlying assets. In order to maintain or adjust the capital structure, the Company may issue new shares through private placements, prospectus offerings, convertible debentures, asset acquisitions or return capital to shareholders. The Company is not subject to externally imposed capital requirements.
CHANGES IN ACCOUNTING POLICIES AND CRITICAL ACCOUNTING ESTIMATES
Accounting standards adopted during the period:
The material accounting policies applied in the Company's condensed consolidated interim financial statements for the three months ended March 31, 2024 are the same as those applied in the Company's annual audited consolidated financial statements as at and for the year ended December 31, 2023, except as described below.
The Company applied Classification of Liabilities as Current or Non-current and Non-current Liabilities with Covenants - Amendments to IAS 1, issued in 2020 and 2022, for the first time in its 2024 condensed consolidated interim financial statements. The amendments clarify certain requirements for determining whether a liability is classified as current or non-current and require new disclosures in the annual financial statements for non-current liabilities that are subject to covenants within 12 months after the end of the reporting period. The adoption of the amendments did not result in any material classification adjustment to the condensed consolidated interim financial statements.
Derivative financial instruments
The Company may hold derivative financial instruments to hedge its risk exposure to fluctuations in commodity prices and other currencies against the US Dollars. Derivative financial instruments are measured at fair value at each reporting period. All derivative instruments not designated in a hedge relationship that qualify for hedge accounting are classified as financial instruments at fair value through profit or loss. Changes in fair value of non-hedging derivative financial instruments are included in net earnings or loss as non-hedging derivative gains or losses.
Critical Accounting Estimates
The preparation of financial statements requires the Company to make estimates that affect the reported amounts of assets and liabilities and disclosure of contingent assets and liabilities at the date of the financial statements and the reported amounts of revenues and expenses during the reporting period. Significant areas requiring the use of management's judgment relate to the determination of mineralized reserves and resources, plant and equipment lives, estimating the fair values of financial instruments and derivatives, impairment of non-current assets, reclamation and rehabilitation provisions, recognition of deferred tax assets, and assumptions used in determining the fair value of share-based compensation.
See "Critical Accounting Estimates" in the Company's annual MD&A for the year ended December 31, 2023, for a detailed discussion on the areas in which critical accounting estimates are made.
CONTROLS AND PROCEDURES
Disclosure Controls and Procedures
The Company's management, with the participation of its Chief Executive Officer ("CEO") and Chief Financial Officer ("CFO"), has evaluated the design of the Company's disclosure controls and procedures. Based on the results of that evaluation, the Company's CEO and CFO have concluded that, as of March 31, 2024, the Company's disclosure controls and procedures were effective to provide reasonable assurance that the information required to be disclosed by the Company in reports it files is recorded, processed, summarized and reported, within the appropriate time periods and is accumulated and communicated to management, including the CEO and CFO, as appropriate to allow timely decisions regarding required disclosure.
Changes in Internal Control over Financial Reporting
Management, including the CEO and CFO, has evaluated the Company's internal controls over financial reporting to determine whether any changes occurred during the period that have materially affected, or are reasonably likely to materially affect, the Company's internal controls over financial reporting.
During the three months ended March 31, 2024, there have been no significant changes in internal control over financial reporting that have materially affected, or are reasonably likely to materially affect, the Company's internal control over financial reporting.
QUARTERLY RESULTS AND TRENDS
The following table presents selected financial information for each of the most recent eight quarters:
| Table in thousands of U.S. dollars except for |
2024 |
2023 |
2022 |
| share numbers and per share amounts |
Q1 |
Q4 |
Q3 |
Q2 |
Q1 |
Q4 |
Q3 |
Q2 |
| Gross Sales |
$64,218 |
$51,005 |
$49,926 |
$50,866 |
$56,117 |
$82,683 |
$40,393 |
$31,719 |
| Smelting and refining costs included in revenue |
493 |
506 |
494 |
795 |
656 |
694 |
744 |
937 |
| Total Revenue |
63,725 |
50,499 |
49,432 |
50,071 |
55,461 |
81,989 |
39,649 |
30,782 |
| Direct production costs |
36,705 |
32,817 |
34,020 |
25,478 |
26,516 |
42,821 |
24,510 |
19,828 |
| Royalties |
6,408 |
5,105 |
4,821 |
5,749 |
6,535 |
8,479 |
2,821 |
2,194 |
| Mine operating cash flow before taxes |
20,612 |
12,577 |
10,591 |
18,844 |
22,410 |
30,689 |
12,318 |
8,760 |
| Share-based compensation |
79 |
44 |
44 |
(294) |
132 |
89 |
113 |
113 |
| Depreciation |
8,877 |
7,181 |
7,855 |
6,596 |
6,253 |
8,945 |
5,753 |
4,175 |
| Write down on inventory |
|
|
- |
- |
- |
- |
1,323 |
- |
| Mine operating earnings (loss) |
$11,656 |
$5,352 |
$2,692 |
$12,542 |
$16,025 |
$21,655 |
$5,129 |
$4,472 |
| |
|
|
|
|
|
|
|
|
| Basic earnings (loss) per share |
($0.01) |
$0.01 |
($0.01) |
($0.01) |
$0.03 |
$0.04 |
($0.01) |
($0.07) |
| Diluted earnings (loss) per share |
($0.01) |
$0.01 |
($0.01) |
($0.01) |
$0.03 |
$0.04 |
($0.01) |
($0.07) |
| Weighted shares outstanding |
227,503,581 |
207,932,318 |
194,249,283 |
191,446,597 |
190,274,768 |
189,993,085 |
189,241,367 |
180,974,609 |
Net earnings (loss) |
($1,194) |
$3,049 |
($2,328) |
($1,054) |
$6,456 |
$7,961 |
($1,499) |
($11,923) |
| Depreciation |
9,135 |
7,458 |
7,771 |
6,967 |
6,593 |
9,279 |
5,963 |
4,354 |
| Finance costs |
135 |
164 |
170 |
229 |
259 |
233 |
194 |
212 |
| Current income tax |
5,667 |
207 |
2,250 |
4,442 |
4,445 |
2,850 |
1,186 |
1,325 |
| Deferred income tax (recovery) |
(233) |
(2,544) |
888 |
766 |
1,676 |
2,345 |
2,053 |
1,752 |
| EBITDA |
$13,510 |
$8,334 |
$8,751 |
$11,350 |
$19,429 |
$22,668 |
$7,897 |
($4,280) |
The following table presents selected production information for each of the most recent eight quarters:
| Highlights |
2024 |
|
2023 |
|
|
2022 |
|
| |
Q1 |
Q4 |
Q3 |
Q2 |
Q1 |
Q4 |
Q3 |
Q2 |
| Processed tonnes |
221,794 |
220,464 |
214,270 |
228,575 |
211,073 |
224,289 |
202,745 |
201,361 |
| Guanaceví |
115,004 |
110,781 |
103,345 |
116,908 |
102,375 |
119,305 |
97,728 |
94,017 |
| Bolañitos |
106,790 |
109,683 |
110,925 |
111,667 |
108,698 |
104,984 |
105,017 |
107,344 |
| Silver ounces |
1,460,006 |
1,406,423 |
1,148,735 |
1,494,000 |
1,623,545 |
1,830,835 |
1,458,448 |
1,359,207 |
| Guanaceví |
1,335,742 |
1,271,679 |
1,041,211 |
1,352,423 |
1,439,924 |
1,680,363 |
1,332,190 |
1,194,150 |
| Bolañitos |
124,263 |
134,744 |
107,524 |
141,577 |
183,621 |
150,472 |
126,258 |
165,057 |
| Silver grade |
229 |
233 |
183 |
226 |
279 |
296 |
248 |
246 |
| Guanaceví |
402 |
419 |
341 |
398 |
511 |
512 |
468 |
465 |
| Bolañitos |
42 |
45 |
37 |
45 |
61 |
50 |
43 |
54 |
| Silver recovery |
89.5 |
85.1 |
90.9 |
90.1 |
85.7 |
85.8 |
90.3 |
85.4 |
| Guanaceví |
89.9 |
85.2 |
91.9 |
90.4 |
85.6 |
85.6 |
90.6 |
85.0 |
| Bolañitos |
86.2 |
84.8 |
82.6 |
87.6 |
86.1 |
89.2 |
87.0 |
88.6 |
| Gold ounces |
10,133 |
9,608 |
9,089 |
9,819 |
9,342 |
10,370 |
9,194 |
9,289 |
| Guanaceví |
4,124 |
3,721 |
3,161 |
3,885 |
4,188 |
4,936 |
3,642 |
3,680 |
| Bolañitos |
6,010 |
5,887 |
5,928 |
5,934 |
5,154 |
5,434 |
5,552 |
5,609 |
| Gold grade |
1.58 |
1.53 |
1.48 |
1.47 |
1.56 |
1.57 |
1.60 |
1.58 |
| Guanaceví |
1.25 |
1.20 |
1.03 |
1.10 |
1.42 |
1.44 |
1.29 |
1.37 |
| Bolañitos |
1.94 |
1.86 |
1.89 |
1.85 |
1.70 |
1.72 |
1.88 |
1.77 |
| Gold recovery |
89.8 |
88.7 |
89.4 |
91.1 |
88.0 |
91.5 |
88.4 |
90.6 |
| Guanaceví |
89.2 |
87.0 |
92.4 |
94.0 |
89.6 |
89.4 |
89.9 |
88.9 |
| Bolañitos |
90.2 |
89.8 |
87.9 |
89.3 |
86.8 |
93.6 |
87.5 |
91.8 |
| Cash costs per oz (1) |
$13.19 |
$12.54 |
$17.94 |
$13.52 |
$11.12 |
$11.65 |
$10.32 |
$10.08 |
| Guanaceví |
$15.94 |
$14.95 |
$20.47 |
$14.53 |
$12.25 |
$12.40 |
$10.64 |
$10.35 |
| Bolañitos |
($17.69) |
($11.23) |
($7.68) |
$3.34 |
$1.67 |
$2.85 |
$6.73 |
$8.01 |
| AISC per oz (1) |
$21.44 |
$21.48 |
$29.64 |
$22.15 |
$20.16 |
$19.38 |
$20.27 |
$19.56 |
| Guanaceví |
$21.96 |
$21.50 |
$29.06 |
$20.81 |
$19.28 |
$18.05 |
$17.79 |
$17.66 |
| Bolañitos |
$15.59 |
$21.27 |
$35.54 |
$35.64 |
$27.45 |
$35.06 |
$48.21 |
$34.10 |
| Direct costs per tonne (1) |
$181.77 |
$168.71 |
$176.37 |
$169.59 |
$169.49 |
$177.35 |
$146.30 |
$148.11 |
| Guanaceví |
$260.13 |
$239.76 |
$264.10 |
$232.58 |
$251.83 |
$249.23 |
$205.42 |
$201.84 |
| Bolañitos |
$97.39 |
$96.94 |
$94.63 |
$103.64 |
$91.84 |
$95.67 |
$91.28 |
$101.05 |
(1) Cash cost per oz, AISC per oz and direct costs per tonne are non-IFRS measures.
NON-IFRS MEASURES
Non-IFRS and Other Financial Measures and Ratios
We have included certain non-IFRS financial measures and ratios in this MD&A, as discussed below. We believe that these measures, in addition to conventional measures prepared in accordance with IFRS, provide investors an improved ability to evaluate the underlying performance of the Company. The non-IFRS measures and ratios are intended to provide additional information and should not be considered in isolation or as a substitute for measures of performance prepared in accordance with IFRS. These financial measures and ratios do not have any standardized meaning prescribed under IFRS, and therefore may not be comparable to other issuers.
Non-IFRS financial measures are defined in National Instrument 52-112 - Non-GAAP and Other Financial Measures Disclosure ("NI 52-112") as a financial measure disclosed that (a) depicts the historical or expected future financial performance, financial position or cash flow of an entity, (b) with respect to its composition, excludes an amount that is included in, or includes an amount that is excluded from, the composition of the most directly comparable financial measure disclosed in the primary financial statements of the entity, (c) is not disclosed in the financial statements of the entity, and (d) is not a ratio, fraction, percentage or similar representation.
A non-IFRS ration is defined by 52-112 as a financial measure disclosed that (a) is in the form of a ratio, fraction, percentage or similar representation, (b) has a non-IFRS financial measure as one or more of its components, and (c) is not disclosed in the financial statements.
Working capital is a non-IFRS measure that is a common measure of liquidity but does not have any standardized meaning. The most directly comparable measure prepared in accordance with IFRS is current assets and current liabilities. Working capital is calculated by deducting current liabilities from current assets. Working capital should not be considered in isolation or as a substitute from measures prepared in accordance with IFRS. The measure is intended to assist readers in evaluating our liquidity.
| Expressed in thousands US dollars |
|
As at March 31, 2024 |
|
|
As at December 31, 2023 |
|
| Current assets |
$ |
111,769 |
|
$ |
100,773 |
|
| Current liabilities |
|
55,357 |
|
|
58,244 |
|
| Working capital |
$ |
56,412 |
|
$ |
42,529 |
|
Adjusted earnings and adjusted earnings per share ("EPS") are non-IFRS measures that supplement information to the Company's consolidated financial statements. The Company believes that, in addition to the conventional measures prepared in accordance with IFRS, the Company and certain investors and analysts use this information to evaluate the Company's underlying core operating performance. The presentation of adjusted earnings and adjusted earnings per share is not meant to be a substitute of net income and net income per share presented in accordance with IFRS, but rather should be evaluated in conjunction with such IFRS measures.
The Company defines the adjusted earnings as net income adjusted to include certain non-cash and unusual item, and items that in the Company's judgement are subject to volatility as a result of factors which are unrelated to the Company's operation in the period. Certain items that become applicable in a period may be adjusted for, with the Company retroactively presenting comparable periods with an adjustment for such items and, conversely, items no longer applicable may be removed from the calculation. During the current period, the Company has included unrealized foreign exchange gain (loss) as well as changes in the fair value of its investments in marketable securities and made retroactive adjustments to prior periods for the same. The following table provides a detailed reconciliation of net income as reported in the Company's financial statement to adjusted earnings and adjusted earnings per share.
| Expressed in thousands US dollars |
Three Months Ended March 31 |
| (except for share numbers and per share amounts) |
2024 |
2023 |
| Net earnings (loss) for the period per financial statements |
($1,194) |
$6,456 |
| Unrealized foreign exchange (loss) |
136 |
1,095 |
| Change in fair value of investments |
861 |
(3,097) |
| Adjusted net earnings (loss) |
($197) |
$4,454 |
| Basic weighted average share outstanding |
227,503,581 |
190,274,768 |
| Adjusted net earnings (loss) per share |
($0.00) |
$0.02 |
Mine operating cash flow before taxes is a non-IFRS measure that does not have a standardized meaning prescribed by IFRS and therefore may not be comparable to similar measures presented by other issuers. Mine operating cash flow is calculated as revenue minus direct production costs and royalties. Mine operating cash flow is used by management to assess the performance of the mine operations, excluding corporate and exploration activities and is provided to investors as a measure of the Company's operating performance.
| Expressed in thousands US dollars |
Three Months Ended March 31 |
| |
2024 |
2023 |
| Mine operating earnings per financial statements |
$11,656 |
$16,025 |
| Share-based compensation |
79 |
132 |
| Depreciation |
8,877 |
6,253 |
| Mine operating cash flow before taxes |
$20,612 |
$22,410 |
Operating cash flow before working capital changes per share is a non-IFRS measure that does not have a standardized meaning prescribed by IFRS and therefore may not be comparable to similar measures presented by other issuers. Operating cash flow per share is calculated by dividing cash from operating activities by the weighted average shares outstanding. Operating cash flow per share is used by management to assess operating performance on a per share basis, irrespective of working capital changes and is provided to investors as a measure of the Company's operating performance.
|
Expressed in thousands US dollars
|
Three Months Ended March 31
|
|
(except for per share amounts)
|
2024
|
2023
|
|
Cash from (used in) operating activities per financial statements
|
$4,583
|
($401)
|
|
Net changes in non-cash working capital per financial statements
|
(5,651)
|
(12,902)
|
|
Operating cash flow before working capital changes
|
$10,234
|
$12,501
|
|
Basic weighted average shares outstanding
|
227,503,581
|
190,274,768
|
|
Operating cash flow before working capital changes per share
|
$0.04
|
$0.07
|
EBITDA is a non-IFRS financial measure, which excludes the following from net earnings:
- Income tax expense;
- Finance costs;
- Amortization and depletion.
Adjusted EBITDA excludes the following additional items from EBITDA:
- Share based compensation;
- Non-recurring impairments (reversals);
- Unrealized foreign exchange gain (loss);
- Change in fair value of investments;
- Significant non-routine items.
Adjusted EBITDA per share is calculated by dividing Adjusted EBITDA by the basic weighted average number of shares outstanding for the period.
Management believes EBITDA is a valuable indicator of the Company's ability to generate liquidity by producing operating cash flow to fund working capital needs, service debt obligations, and fund capital expenditures. Management uses EBITDA for this purpose. EBITDA is also frequently used by investors and analysts for valuation purposes whereby EBITDA is multiplied by a factor or "EBITDA multiple" based on an observed or inferred relationship between EBITDA and market values to determine the approximate total enterprise value of a Company.
EBITDA is intended to provide additional information to investors and analysts. It does not have any standardized definition under IFRS and should not be considered in isolation or as a substitute for measures of operating performance prepared in accordance with IFRS. EBITDA excludes the impact of cash costs of financing activities and taxes, and the effects of changes in operating working capital balances, and therefore is not necessarily indicative of operating profit or cash flow from operations as determined by IFRS. Other companies may calculate EBITDA and Adjusted EBITDA differently.
Certain items that become applicable in a period may be adjusted for, with the Company retroactively presenting comparable periods with an adjustment for such items and, conversely, items no longer applicable may be removed from the calculation.
| Expressed in thousands US dollars |
Three Months Ended March 31 |
| |
2024 |
2023 |
| Net earnings (loss) for the period per financial statements |
($1,194) |
$6,456 |
| Depreciation - cost of sales |
8,877 |
6,253 |
| Depreciation - exploration, evaluation and development |
159 |
278 |
| Depreciation - general & administration |
99 |
62 |
| Finance costs |
135 |
259 |
| Current income tax expense |
5,667 |
4,445 |
| Deferred income tax expense (recovery) |
(233) |
1,676 |
| EBITDA |
$13,510 |
$19,429 |
| Share based compensation |
1,170 |
1,625 |
| Unrealized foreign exchange (loss) |
136 |
1,095 |
| Change in fair value of investments |
861 |
(3,097) |
| Adjusted EBITDA |
$15,677 |
$19,052 |
| Basic weighted average shares outstanding |
227,503,581 |
190,274,768 |
| Adjusted EBITDA per share |
$0.07 |
$0.10 |
Cash costs per silver oz, total production costs per oz, direct operating costs per tonne and direct costs per tonne are measures developed by precious metals companies in an effort to provide a comparable standard; however, there can be no assurance that the Company's reporting of these non-IFRS measures and ratios are similar to those reported by other mining companies. Cash costs per oz, total production costs per oz and direct costs per tonne are measures used by the Company to manage and evaluate operating performance at each of the Company's operating mining units. They are widely reported in the silver mining industry as a benchmark for performance, but do not have a standardized meaning and are disclosed in addition to IFRS measures. Direct operating costs include mining, processing (including smelting, refining, transportation and selling costs) and direct overhead at the operation sites. Direct costs include all direct operating costs plus royalties and special mining duty. Cash costs include all direct costs less by-product gold sales and changes in finished gold inventories. Total production costs include all cash costs plus amortization and depletion, changes in amortization and depletion in finished goods inventory and site share-based compensation. Cash costs per silver ounce and total production costs per ounce are calculated by dividing cash costs and total production costs by the payable silver ounces produced. Direct operating cost per tonne and direct costs per tonne are calculated by dividing direct operating costs and direct costs by the number of processed tonnes. The following tables provide a detailed reconciliation of these measures to the Company's direct production costs, as reported in its consolidated financial statements.
| Expressed in thousands US dollars |
Three Months Ended March 31, 2024 |
Three Months Ended March 31, 2023 |
| |
Guanaceví |
Bolañitos |
Total |
Guanaceví |
Bolañitos |
Total |
| Direct production costs per financial statements |
$26,886 |
$9,819 |
$36,705 |
$18,145 |
$8,371 |
$26,516 |
| Smelting and refining costs included in revenue |
- |
493 |
493 |
- |
656 |
656 |
| Opening finished goods |
(7,137) |
(699) |
(7,836) |
(4,953) |
(245) |
(5,198) |
| Closing finished goods |
2,314 |
651 |
2,965 |
4,848 |
1,063 |
5,911 |
| Direct operating costs |
22,063 |
10,264 |
32,327 |
18,040 |
9,845 |
27,885 |
| Royalties |
6,332 |
76 |
6,408 |
6,471 |
64 |
6,535 |
| Special mining duty (1) |
1,521 |
60 |
1,581 |
1,270 |
85 |
1,355 |
| Direct costs |
29,916 |
10,400 |
40,316 |
25,781 |
9,994 |
35,775 |
| By-product gold sales |
(10,731) |
(12,265) |
(22,996) |
(8,433) |
(9,064) |
(17,497) |
| Opening gold inventory fair market value |
2,909 |
619 |
3,528 |
2,740 |
354 |
3,094 |
| Closing gold inventory fair market value |
(871) |
(851) |
(1,722) |
(2,500) |
(995) |
(3,495) |
| Cash costs net of by-product |
21,223 |
(2,097) |
19,126 |
17,588 |
289 |
17,877 |
| Depreciation |
5,815 |
3,062 |
8,877 |
3,474 |
2,779 |
6,253 |
| Share-based compensation |
62 |
17 |
79 |
66 |
66 |
132 |
| Opening finished goods depreciation |
(1,459) |
(197) |
(1,656) |
(862) |
(60) |
(922) |
| Closing finished goods depreciation |
770 |
219 |
989 |
1,115 |
355 |
1,470 |
| Total production costs |
$26,411 |
$1,004 |
$27,415 |
$21,381 |
$3,429 |
$24,810 |
| |
Three Months Ended March 31, 2024 |
Three Months Ended March 31, 2023 |
| |
Guanaceví |
Bolañitos |
Total |
Guanaceví |
Bolañitos |
Total |
| Throughput tonnes |
115,004 |
106,790 |
221,794 |
102,375 |
108,698 |
211,073 |
| Payable silver ounces |
1,331,735 |
118,573 |
1,450,308 |
1,435,604 |
172,608 |
1,608,212 |
| |
|
|
|
|
|
|
| Cash costs per silver ounce |
$15.94 |
($17.69) |
$13.19 |
$12.25 |
$1.67 |
$11.12 |
| Total production costs per ounce |
$19.83 |
$8.47 |
$18.90 |
$14.89 |
$19.87 |
$15.43 |
| Direct operating costs per tonne |
$191.85 |
$96.11 |
$145.75 |
$176.21 |
$90.57 |
$132.11 |
| Direct costs per tonne |
$260.13 |
$97.39 |
$181.77 |
$251.83 |
$91.94 |
$169.49 |
(1) Special mining duty is an EBITDA royalty tax presented as a current income tax in accordance with IFRS.
| |
Expressed in thousands US dollars |
|
March 31, 2024 |
|
|
March 31, 2023 |
|
| |
Guanaceví |
Bolañitos |
Total |
Guanaceví |
Bolañitos |
Total |
| |
Closing finished goods |
2,314 |
651 |
2,965 |
4,848 |
1,063 |
5,911 |
| |
Closing finished goods depreciation |
770 |
219 |
989 |
1,115 |
355 |
1,470 |
| |
Finished goods inventory |
$3,084 |
$870 |
$3,954 |
$5,963 |
$1,418 |
$7,381 |
AISC per oz and all-in costs per oz are measures developed by the World Gold Council (and used as a standard of the Silver Institute) in an effort to provide a comparable standard within the precious metal industry; however, there can be no assurance that the Company's reporting of these non-IFRS measures are similar to those reported by other mining companies. These measures are used by the Company to manage and evaluate operating performance at each of the Company's operating mining units and consolidated group, and are widely reported in the silver mining industry as a benchmark for performance, but do not have a standardized meaning and are disclosed in addition to IFRS measures. The following tables provide a detailed reconciliation of these measures to the Company's cost of sales, as reported in the Company's consolidated financial statements.
| Expressed in thousands US dollars |
Three Months Ended March 31, 2024 |
Three Months Ended March 31, 2023 |
| |
Guanaceví |
Bolañitos |
Total |
Guanaceví |
Bolañitos |
Total |
| Cash costs net of by-product |
$21,223 |
($2,097) |
$19,126 |
$17,588 |
$289 |
$17,877 |
| Operations share-based compensation |
62 |
17 |
79 |
66 |
66 |
132 |
| Corporate general and administrative |
2,204 |
801 |
3,005 |
2,616 |
878 |
3,494 |
| Corporate share-based compensation |
690 |
250 |
940 |
1,019 |
342 |
1,361 |
| Reclamation - amortization/accretion |
102 |
77 |
179 |
79 |
62 |
141 |
| Mine site expensed exploration |
122 |
314 |
436 |
379 |
313 |
692 |
| Equipment loan payments |
128 |
220 |
348 |
245 |
487 |
732 |
| Capital expenditures sustaining |
4,716 |
2,266 |
6,982 |
5,690 |
2,301 |
7,991 |
| All-In-Sustaining Costs |
$29,247 |
$1,848 |
$31,095 |
$27,682 |
$4,738 |
$32,420 |
| Growth exploration, evaluation and development |
|
|
3,524 |
|
|
3,063 |
| Growth capital expenditures |
|
|
37,905 |
|
|
12,726 |
| All-In-Costs |
|
|
$72,524 |
|
|
$48,209 |
| |
Three Months Ended March 31, 2024 |
Three Months Ended March 31, 2023 |
| |
Guanaceví |
Bolañitos |
Total |
Guanaceví |
Bolañitos |
Total |
| Throughput tonnes |
115,004 |
106,790 |
221,794 |
102,375 |
108,698 |
211,073 |
| Payable silver ounces |
1,331,735 |
118,573 |
1,450,308 |
1,435,604 |
172,608 |
1,608,212 |
| Silver equivalent production (ounces) |
1,665,648 |
605,028 |
2,270,677 |
1,774,964 |
595,941 |
2,370,905 |
| |
|
|
|
|
|
|
| Sustaining cost per ounce |
$21.96 |
$15.59 |
$21.44 |
$19.28 |
$27.45 |
$20.16 |
| Expressed in thousands US dollars |
Three Months Ended March 31 |
| |
2024 |
2023 |
| Capital expenditures sustaining |
$6,982 |
$7,991 |
| Growth capital expenditures |
37,905 |
12,726 |
| Property, plant and equipment expenditures per Consolidated Statement of Cash Flows |
$44,887 |
$20,717 |
| Expressed in thousands US dollars |
Three Months Ended March 31 |
| |
2024 |
2023 |
| Mine site expensed exploration |
$436 |
$692 |
| Growth exploration, evaluation and development |
3,524 |
3,063 |
| Total exploration, evaluation and development |
3,960 |
3,755 |
| Exploration, evaluation and development depreciation |
159 |
278 |
| Exploration, evaluation and development share-based compensation |
151 |
131 |
| Exploration, evaluation and development expense |
$4,270 |
$4,164 |
Form 52-109F2
Certification of Interim Filings
Full Certificate
I, Daniel Dickson, Chief Executive Officer of Endeavour Silver Corp., certify the following:
1. Review: I have reviewed the interim financial report and interim MD&A (together, the "interim filings") of Endeavour Silver Corp. (the "issuer") for the interim period ended March 31, 2024.
2. No misrepresentations: Based on my knowledge, having exercised reasonable diligence, the interim filings do not contain any untrue statement of a material fact or omit to state a material fact required to be stated or that is necessary to make a statement not misleading in light of the circumstances under which it was made, with respect to the period covered by the interim filings.
3. Fair presentation: Based on my knowledge, having exercised reasonable diligence, the interim financial report together with the other financial information included in the interim filings fairly present in all material respects the financial condition, financial performance and cash flows of the issuer, as of the date of and for the periods presented in the interim filings.
4. Responsibility: The issuer's other certifying officer(s) and I are responsible for establishing and maintaining disclosure controls and procedures (DC&P) and internal control over financial reporting (ICFR), as those terms are defined in National Instrument 52-109 Certification of Disclosure in Issuers' Annual and Interim Filings, for the issuer.
5. Design: Subject to the limitations, if any, described in paragraphs 5.2 and 5.3, the issuer's other certifying officer(s) and I have, as at the end of the period covered by the interim filings
(a) designed DC&P, or caused it to be designed under our supervision, to provide reasonable assurance that
(i) material information relating to the issuer is made known to us by others, particularly during the period in which the interim filings are being prepared; and
(ii) information required to be disclosed by the issuer in its annual filings, interim filings or other reports filed or submitted by it under securities legislation is recorded, processed, summarized and reported within the time periods specified in securities legislation; and
(b) designed ICFR, or caused it to be designed under our supervision, to provide reasonable assurance regarding the reliability of financial reporting and the preparation of financial statements for external purposes in accordance with the issuer's GAAP.
5.1 Control framework: The control framework the issuer's other certifying officer(s) and I used to design the issuer's ICFR is the Internal Control - Integrated Framework (2013) (COSO Framework) published by The Committee of Sponsoring Organizations of the Treadway Commission (COSO).
5.2 ICFR - material weakness relating to design: N/A
5.3 Limitation on scope of design: N/A
6. Reporting changes in ICFR: The issuer has disclosed in its interim MD&A any change in the issuer's ICFR that occurred during the period beginning on January 1, 2024 and ended on March 31, 2024 that has materially affected, or is reasonably likely to materially affect, the issuer's ICFR.
Date: May 9, 2024
| "Daniel Dickson" |
|
|
| |
|
|
| Daniel Dickson |
|
|
| Chief Executive Officer |
|
|
Form 52-109F2
Certification of Interim Filings
Full Certificate
I, Elizabeth Senez, Chief Financial Officer of Endeavour Silver Corp., certify the following:
1. Review: I have reviewed the interim financial report and interim MD&A (together, the "interim filings") of Endeavour Silver Corp. (the "issuer") for the interim period ended March 31, 2024.
2. No misrepresentations: Based on my knowledge, having exercised reasonable diligence, the interim filings do not contain any untrue statement of a material fact or omit to state a material fact required to be stated or that is necessary to make a statement not misleading in light of the circumstances under which it was made, with respect to the period covered by the interim filings.
3. Fair presentation: Based on my knowledge, having exercised reasonable diligence, the interim financial report together with the other financial information included in the interim filings fairly present in all material respects the financial condition, financial performance and cash flows of the issuer, as of the date of and for the periods presented in the interim filings.
4. Responsibility: The issuer's other certifying officer(s) and I are responsible for establishing and maintaining disclosure controls and procedures (DC&P) and internal control over financial reporting (ICFR), as those terms are defined in National Instrument 52-109 Certification of Disclosure in Issuers' Annual and Interim Filings, for the issuer.
5. Design: Subject to the limitations, if any, described in paragraphs 5.2 and 5.3, the issuer's other certifying officer(s) and I have, as at the end of the period covered by the interim filings
(a) designed DC&P, or caused it to be designed under our supervision, to provide reasonable assurance that
(i) material information relating to the issuer is made known to us by others, particularly during the period in which the interim filings are being prepared; and
(ii) information required to be disclosed by the issuer in its annual filings, interim filings or other reports filed or submitted by it under securities legislation is recorded, processed, summarized and reported within the time periods specified in securities legislation; and
(b) designed ICFR, or caused it to be designed under our supervision, to provide reasonable assurance regarding the reliability of financial reporting and the preparation of financial statements for external purposes in accordance with the issuer's GAAP.
5.1 Control framework: The control framework the issuer's other certifying officer(s) and I used to design the issuer's ICFR is the Internal Control - Integrated Framework (2013) (COSO Framework) published by The Committee of Sponsoring Organizations of the Treadway Commission (COSO).
5.2 ICFR - material weakness relating to design: N/A
5.3 Limitation on scope of design: N/A
6. Reporting changes in ICFR: The issuer has disclosed in its interim MD&A any change in the issuer's ICFR that occurred during the period beginning on January 1, 2024 and ended on March 31, 2024 that has materially affected, or is reasonably likely to materially affect, the issuer's ICFR.
Date: May 09, 2024
| "Elizabeth Senez" |
|
|
| |
|
|
| Elizabeth Senez |
|
|
| Chief Financial Officer |
|
|
Endeavour Silver (NYSE:EXK)
過去 株価チャート
から 4 2024 まで 5 2024

Endeavour Silver (NYSE:EXK)
過去 株価チャート
から 5 2023 まで 5 2024
