UNITED STATES
SECURITIES AND EXCHANGE COMMISSION
Washington, D.C. 20549
FORM 6-K
REPORT OF FOREIGN PRIVATE ISSUER
PURSUANT TO RULE 13a-16 OR 15d-16 OF
THE SECURITIES EXCHANGE ACT OF 1934
For the month of: August, 2024
Commission File No. 001-40381
NEW PACIFIC METALS CORP.
(Translation of registrant’s name into English)
Suite 1750 - 1066 W. Hastings Street
Vancouver BC, Canada V6E 3X1
(Address of principal executive office)
[Indicate by check mark whether the registrant files or will file annual reports under cover of Form 20-F or Form 40-F]
Form 20-F [ ] Form 40-F
[X]
SIGNATURES
Pursuant to the requirements of the Securities
Exchange Act of 1934, the registrant has duly caused this report to be signed on its behalf by the undersigned, thereunto duly authorized.
| Dated: August 14, 2024 |
NEW PACIFIC METALS CORP. |
|
| |
|
|
| |
/s/ Jonathan Hoyles |
|
| |
Jonathan Hoyles |
|
| |
General Counsel & Corporate Secretary |
|
EXHIBIT INDEX
Exhibit 99.1
| AMC Mining Consultants
(Canada) Ltd. |
|
| BC0767129 |
|
|
|
 |
200 Granville Street,
Suite 202
Vancouver BC V6C 1S4
Canada |
|
| T |
+1 604 669 0044 |
|
| E |
vancouver@amcconsultants.com |
|
| W |
amcconsultants.com |
|
Technical Report
Silver Sand Project Pre-Feasibility Study
New Pacific Metals Corp.
Potosí, Bolivia
In accordance with the requirements of National Instrument
43-101 “Standards of Disclosure for Mineral Projects” (effective 09 June 2023) of the Canadian Securities Administrators
Qualified Persons:
E. Tucker, P.Eng.
D. Nussipakynova, P.Geo.
A. Holloway, P.Eng.
W. Rogers, P.Eng.
M. Molavi, P.Eng.
L. Botham, P.Eng.
AMC Project 0723071
Effective date 19 June 2024
EGBC Permit to Practice #: 1002350
Unearth
a smarter way
| Silver Sand Project Pre-Feasibility Study |
| | New Pacific Metals Corp. | 0723071 |
This 2024 Technical Report reports
a Mineral Reserve estimate and provides the results of a Preliminary Feasibility Study (PFS) for the Silver Sand Property (the Property
or Silver Sand), Potosí Department, Bolivia. The report has been prepared by AMC Mining Consultants (Canada) Ltd. (AMC Consultants)
of Vancouver, Canada on behalf of New Pacific Metals Corp. (New Pacific or the Company) and has an effective date of 19 June 2024. The
previous Technical Report on the Property titled “Silver Sand Deposit Preliminary Economic Assessment,” has an effective date
of 30 November 2022.
New Pacific, through its
wholly owned subsidiaries, acquired exploration and mining rights over an aggregate area of approximately 60 square kilometres (km2)
covering the Silver Sand deposit and its surrounding areas. The Silver Sand area has been intermittently mined for silver from narrow
high-grade mineralized veins in the Cretaceous sandstone since the early to mid-1500s.
The 2024 Technical Report has been
prepared in accordance with the requirements of National Instrument 43-101 (NI 43-101), “Standards of Disclosure for Mineral Projects”
(effective 09 June 2023) of the Canadian Securities Administrators (CSA) for lodgement on CSA’s “System for Electronic Document
Analysis and Retrieval” (SEDAR+).
| 1.2 | Property description and ownership |
The Property is situated in the
Colavi District of Potosí Department in southwestern Bolivia, 33 kilometres (km) north-east of Potosí city, the department
capital. The approximate geographic centre of the Property is 19°22’ 4.97” S latitude and 65°31’ 22.93”
W longitude at an elevation of 4,072 metres above sea level (masl).
The Property consists of
multiple types of tenure under a consolidated Administrative Mining Contract (AMC) covering an area of 3.1656 km2
and is held through New Pacific’s 100% owned subsidiary Minera Alcira Sociedad Anónima Alcira S.A. (Alcira).
The AMC is valid for 30 years and can be extended for an additional 30 years. In addition, New Pacific has acquired a 100% interest in
three continuous mineral concessions called Jisas, Jardan and El Bronce originally owned by third party private entities. These three
concessions were converted to two AMCs covering an area of 2.25 km2. The total area
under full control of the Company is 5.42 km2.
In addition, through Alcira,
New Pacific entered into a Mining Production Contract (MPC) with Corporación Minera de Bolivia (COMIBOL) on 11 January 2019 and
an updated MPC was entered with COMIBOL on 19 January 2022 which covers 12 ATEs (Temporary Special Authorization) and 196 cuadriculas
for an area of approximately 55 km2 that surround and overlap the Silver Sand core area.
The Company continues to engage with COMIBOL, to obtain the ratification and approval of the signed MPC at the Silver Sand project by
the Plurinational Legislative Assembly of Bolivia. The Company and COMIBOL have refined the MPC workplan to concentrate exclusively on
claims immediately adjacent to the Silver Sand project boundary. This streamlined landholding, while maintaining the core value of the
MPC to the Silver Sand project, is anticipated to facilitate progress towards ratification and approval of the MPC. For COMIBOL to obtain
mining rights over such areas, AJAM (Jurisdictional Mining Administrative Authority) will have to grant them by way of AMCs or Exploration
Licenses in accordance with Bolivian mining laws. In addition, the MPC must be ratified by the Congress of Bolivia (Congress) to be valid
and enforceable.
Once the MPC has been ratified by
Congress, the MPC with COMIBOL will be valid for 15 years which may be automatically renewed for an additional 15-year term and potentially,
subject to submission of an acceptable work plan, for an additional 15-year term for a total of 45 years.
| Silver Sand Project Pre-Feasibility Study |
| | New Pacific Metals Corp. | 0723071 |
| 1.3 | Accessibility, climate, local resources, infrastructure and physiography |
The Property is located approximately
36 km north-east of the Cerro Rico de Potosí silver and base metal mine, 46 km south-west of the city of Sucre, and 33 km north-east
of the city of Potosí.
The Property is accessed from Sucre
and Potosí by travelling along a paved highway to the community of Don Diego, and then north from Don Diego along a 27 km, maintained
all-weather gravel road. Don Diego is accessed by driving 129 km to south-west from Sucre, or 29 km to the north-east from Potosí
along paved Highway 5.
The Property is situated approximately
within the central section of the Cordillera Oriental of Bolivia and consists of rolling hills with elevations ranging from 3,900 to 4,100
masl (metres above sea level). Due to the high elevation, the Property area has a cold, semi-arid desert climate despite the region’s
location approximately 19 degrees south of the equator.
The region experiences a rainy season
in the warmer summer months from December to mid-April which contributes approximately 80% of the average annual precipitation of 393
millimetres (mm). The driest period is from May to August with very little precipitation. Overall, the climate is mild and is amendable
to year-round mining.
Vegetation on the Property is poorly
developed and mainly consists of sparsely scattered low grasses and shrubs. In valleys below 4,000 m elevation, some eucalyptus trees
are grown. Animals such as alpacas, llamas, vicunas, and guanacos are common in the Cordillera Oriental.
| 1.4 | Geological setting and mineralization |
The Silver Sand Property is located
in the south section of the polymetallic silver-tin belt in the Eastern Cordillera of the Central Andes, Bolivia. The oldest rocks observed
within the Property comprise Ordovician to Silurian marine, clastic sediments which have been intensely folded and faulted.
Bedrock in the Property area mainly
consists of weakly deformed Cretaceous continental sandstone, siltstone, and mudstone and the strongly deformed Paleozoic marine sedimentary
rocks. The Cretaceous sedimentary sequence forms an open syncline which plunges gently NNW and is bounded to the SW and NE by NW trending
faults.
The Cretaceous sedimentary sequence
within the Property is divided into the lower La Puerta Formation and the upper Tarapaya Formation. The La Puerta Formation consists of
sandstones and unconformably overlies the highly folded Paleozoic marine sedimentary rocks. The Tarapaya Formation conformably overlies
the La Puerta sandstones in the central part of the Property and comprises siltstones and mudstones intercalated with minor sandstone.
Both the Cretaceous and Paleozoic
sedimentary sequences are intruded by numerous small Miocene subvolcanic dacitic porphyry intrusions.
| Silver Sand Project Pre-Feasibility Study |
| | New Pacific Metals Corp. | 0723071 |
The Property exhibits a variety
of geometries and morphology of the mineralized bodies which are controlled and hosted by local structures of tectonic transfer nature.
Some are evident in outcrops, but the best examples are observed in drill cores and in underground workings. Mineralized structures usually
appear as steps-overs developed between two neighbouring fault / vein segments that exhibit an echelon arrangement and may or may not
be connected by lower-ranking faults / vein. These types of structures are of fractal type, which implies that they repeat their geometry,
regardless of the observation scale, in arrangements of sigmoid (jogs), echelon, subparallel stepped, relay, horsetails, and extensional
nets (swarms).
11 mineralized prospects have been
identified across the Property to date. These include the Silver Sand deposit and the El Fuerte, San Antonio, Aullagas, Snake Hole, Mascota,
Esperanza, North Plain, Jisas, Jardan, El Bronce, occurrences. Silver Sand, Snake Hole, Jisas, El Bronce, Aullagas, Mascota and Esperanza
have been tested by drilling. Another nine prospects were defined by rock chip and grab sampling of ancient and recent artisanal mine
workings and dumps and remain to be drill tested. Exploration results from surface outcrops and underground workings defined a silver
mineralized belt 7.5 km long and 2 km wide.
At the Silver Sand deposit mineralization
has been traced for more than 2,000 m along strike, to a maximum width of about 680 m and a dip extension of more than 250 m.
Four mineralization
styles have been recognized in the Property, and these in order of importance are: (1) sandstone-hosted silver mineralization, (2)
porphyritic dacitic-hosted silver mineralization, (3) diatream breccia-hosted silver mineralization, and (4) manto-type tin and base
metal mineralization.
The mineralization in the Silver
Sand project comprises silver-containing sulphosalts and sulphides occurring within sheeted veins, stockworks, veinlets, breccia infill
and disseminated within host rocks. The most common silver-bearing minerals include freibergite [(Ag,Cu,Fe)12(Sb,As)4S13],
miargyrite [AgSbS2], polybasite [(Ag,Cu)6(Sb,As)2S7]
[Ag9CuS4], bournonite [PbCuSbS3]
(some lattices of copper may be replaced by silver), andorite [PbAgSb3S6], and boulangerite [Pb5Sb4S11]
(some lattices of lead may be replaced by silver). Most silver mineralization is hosted in La Puerta sandstone units with minor amounts
in porphyritic dacite and diatreme breccia.
Silver mineralization is hosted
by faults, fractures, fissures, and crackle breccia zones in the Cretaceous La Puerta (brittle) sandstone and porphyritic dacitic dikes,
laccolith, and stocks. In the mineralized sandstone, open spaces are filled with silver-containing sulphosalts and sulphides in forms
of sheeted veins, stockworks, and veinlets, as well as breccia fillings and minor disseminations. Most silver mineralization in the Property
is structurally controlled with secondary rheological controls. The intensity of mineralization is dependent on the frequency of various
mineralized vein structures developed in the brittle host rocks.
Silver and base metal mineralization
in the Silver Sand Property was formed during the regional uplifting and erosion process associated with the Tertiary orogenic events
in the Eastern Cordillera. The genetic model of silver and tin mineralization in the Property is a magmatic-hydrothermal system related
to a deep-seated magmatic centre.
Since October 2017, New Pacific
has carried out an extensive property-scale reconnaissance investigation program by surface and underground sampling of the mineralization
outcrops and the accessible ancient underground mine workings across the Property.
| Silver Sand Project Pre-Feasibility Study |
| | New Pacific Metals Corp. | 0723071 |
1,046 rock chip samples were collected
from 35 separate outcrops by New Pacific. Continuous chip samples were collected at 1.5 m intervals along lines roughly perpendicular
to the strike direction of the mineralization zones. Sample lines covered a total length of 2,863 m. Most of the sampled outcrops are
located above or near old mine workings.
New Pacific has also mapped and
sampled 65 historical mine workings comprising 5,780 m of underground tunnels. A total of 1,171 continuous chip samples has been collected
at 1 - 2 m intervals along walls of available tunnels that cut across the mineralized zones.
Mine dumps from historical mining
activities are scattered across a significant portion of the Property. New Pacific has collected a total of 1,408 grab samples from historical
mine dumps. The majority of samples collected were remnants of high-grade narrow veins extracted from underground mining activity. Of
the 1,408 samples collected from historical mine dumps to date, 439 samples (31%) returned assay results between 30 and 3,290 grams per
tonne (g/t) Ag with an average grade of 194 g/t Ag.
Assay results of underground chip
samples and surface mine dump grab samples show that silver mineralization widely occurs in the wall rocks of the previously mined-out
high-grade veins in the abandoned ancient underground mining works.
From October 2017 to July 2022,
New Pacific conducted intensive diamond drilling programs on the Property totalling 139,920 m in 564 drillholes. A total of 523 HQ diamond
holes for a total metreage of 128,074 m was drilled over the Silver Sand core area to define the mineralization. After drilling specific
exploration targets, holes were drilled on a 50 m x 50 m grid to delineate the spatial extensions of the major mineralized zones. This
was followed up by drilling on a nominal 25 x 25 m grid, infilling defined areas of mineralization. Drilling was halted during 2020 and
part 2021 due to COVID-19 protocols and recommenced later in 2021.
All holes were drilled from the surface.
Drillholes were drilled up to 545 m deep at inclinations between -45° and -80° towards azimuths of 060° (~NE) and 220°
(~SW) to intercept the principal trend of mineralized vein structures perpendicularly.
The drilling programs have covered
an area of approximately 1,600 m long in the north-south direction and 800 m wide in the east-west direction and have defined silver mineralization
at the Silver Sand deposit over an oblique strike length of 2 km, a collective width of 650 m and to a depth of 250 m below surface.
Drill coring was completed using
conventional HQ (64 millimetre (mm) diameter) equipment and 3 m drill rods. Drill collars are surveyed using a Real-Time Kinematic differential
global positioning system (GPS), and downhole deviation surveys are completed by the drilling contractor using a REFLEX EZ-SHOT and SPT
GyroMaster downhole survey tools. Drillholes are surveyed at a depth of approximately 20 m, and on approximately 30 m intervals as drilling
progresses. Upon completion of each drillhole a concrete monument is constructed with the hole details inscribed.
Core is collected by New Pacific
personnel and drill core containing visible mineralization is wrapped in paper to minimize disturbance during transport. Logging is both
carried out at the rig where a quick log is completed, and after transportation to the company’s Betanzos core processing facility,
which is located approximately 1.5 hours drive from the Property. Currently data is directly collected or loaded into MX Deposit a database
software from Sequent.
In addition to drilling in the Silver
Sand core area, drilling was carried out at Snake Hole (32 drillholes for 7,457 m) and at the northern prospects, (nine drillholes for
4,298 m). These holes
| Silver Sand Project Pre-Feasibility Study |
| | New Pacific Metals Corp. | 0723071 |
were more exploratory in nature
but the same procedures as the grid drilling in the core area were employed.
Core recovery from the drill programs
varies between 0% (voids and overburden) and 100%, averaging 97%. More than 92% of core intervals have a core recovery of greater than
95%.
| 1.7 | Sample preparation, assay, and QA/QC |
New Pacific has developed and implemented
good standard procedures for sample preparation, analytical, and security protocols.
New Pacific manages all aspects
of sampling from the collection of samples, to sample delivery to the laboratory. All samples are stored and processed at the Betanzos
facility. This facility is surrounded by a brick wall, has a locked gate, and is monitored by video surveillance and security guard 24
hours a day, seven days a week. Within the facility, there are separate and locked areas for core logging, sampling, and storage.
Samples are transported on a weekly
basis by New Pacific personnel from the Betanzos facility to the ALS laboratories (ALS) in Oruro, Bolivia for sample preparation, and
then shipped to ALS in Lima, Peru for geochemical analysis. ALS Oruro and ALS Lima are part of ALS Global – an independent commercial
laboratory specializing in analytical geochemistry services, all of which are accredited in accordance with ISO/IES 17025:2017, and are
independent of New Pacific.
All core, chip, and grab samples
are prepared using the following procedures: (1) crush to 70% less than 2 mm; (2) riffle split off 250 g; and (3) pulverize split to better
than 85% passing a 75-micron sieve.
Sample analysis in 2017 and 2018
comprised an aqua regia digest followed by Inductively Coupled Plasma (ICP) Atomic Emission Spectroscopy (AES) analysis of Ag, Pb, and
Zn (ALS code OG46). Assay results greater than 1,500 g/t Ag were sent for fire assay and gravimetric finish analysis. In 2019 New Pacific
changed its analysis protocol to include systematic multielement analysis for an initial 51 element ICP mass spectroscopy (MS) analysis.
Over-limit samples were handled differently for different elements and protocols were further amended for the 2021-2022 drilling.
Drill programs have included Quality
Assurance / Quality Control (QA/QC) monitoring programs which have incorporated the insertion of certified reference materials (CRMs),
blanks, and duplicates into the sample streams, and umpire (check) assays at a separate laboratory at different times.
Four different CRMs have been used
throughout the project history. A total of 4,495 CRMs was submitted between October 2017 and July 2022 representing an average overall
insertion rate of 5%. Insertion rates for CRMs have been consistently above 5% on a yearly basis with the exception of 2019.
Blank material from two different
quarry sites has been used over time and coarse blanks have been inserted consistently at an acceptable insertion rate. While there have
been some changes in failure criteria, there has been no evidence of systemic contamination and failures are dealt with by a re-assay
protocol. Pulp blank samples have been inserted since 2021, but at a low insertion rate of less than 2.5%. Duplicates are also inserted,
comprising field duplicates, coarse duplicates and pulp duplicates. In 2021 and 2022 they have been consistently included but at a rate
of between 3.65% and 4.07%. Coarse rejects were also submitted to Actlabs Skyline as umpire samples in the 2017 to 2019 period. Actlabs
Skyline is an independent geochemical laboratory certified according to ISO 9001:2015.
| Silver Sand Project Pre-Feasibility Study |
| | New Pacific Metals Corp. | 0723071 |
The Qualified Person (QP) has reviewed
the QA/QC procedures used by New Pacific including certified reference materials, blank, duplicate and umpire data and has made some recommendations.
The QP does not consider these to have a material impact on the Mineral Resource estimate and considers the assay database to be adequate
for Mineral Resource estimation. The QP considers sample preparation, security, and analytical procedures employed by New Pacific to be
adequate.
The Mineral Resource estimate
was completed using 556 drillholes on the Property comprising 136,220 m of diamond core and 92,164 assays. Grade interpolation was completed
for silver, lead, zinc, copper, arsenic, and sulphur. Only silver is reported as it is the only economic metal. All estimation utilized
ordinary kriging (OK) except for 127 small domains which were estimated using the inverse distance squared (ID2)
method.
The mineralization domains were
built by New Pacific using Leapfrog Geo 4.0 software. The mineralization domains were reviewed and accepted by the QP with some changes,
including separating the main domain into two areas based on vein orientation.
The QP estimated into these domains
and also estimated a background block model that was combined with the domain mineralization to form the final block model.
New Pacific performed 6,297
bulk density measurements on the core drilled on the Property. As the mineralization is hosted in one rock type, after reviewing the
density data, the QP assigned a single bulk density measurement to the block model of 2.54 t/m3.
The pit-constrained Mineral Resources
are reported for blocks above a conceptual pit shell based on a US$22.50/ounce silver price. There is not a reporting restriction to within
the AMC claim boundary as in the 2020 Technical Report as an agreement has been reached with COMIBOL in regard to the surrounding MPC.
The cut-off applied for reporting
the pit-constrained Mineral Resources is 30 g/t silver. Assumptions made to derive a cut-off grade (COG) included mining costs, processing
costs and recoveries and were obtained from comparable industry situations. The model is depleted for historical mining activities. The
assumptions are shown in Table 1.1.
| Table 1.1 |
Assumptions for pit optimization |
| Input |
Units |
Value |
| Silver price |
$/oz Ag |
22.5 |
| Silver process recovery |
% |
91 |
| Payable silver |
% |
99 |
| Mining recovery factor |
% |
100 |
| Mining cost |
$/t mined |
2.6 |
| Process cost |
$/t minable material > COG |
16 |
| G&A cost |
$/t minable material > COG |
2 |
| Slope angle |
degrees |
44 - 47 |
Notes:
| · | Sustaining capital cost has not
been included. |
| · | Measured, Indicated and Inferred
Mineral Resources included. |
Source: AMC Mining Consultants (Canada) Ltd., 2022.
| Silver Sand Project Pre-Feasibility Study |
| | New Pacific Metals Corp. | 0723071 |
The Mineral Resource for the Silver
Sand deposit has been estimated by Ms Dinara Nussipakynova, P.Geo. Principal Geologist of BBA, formerly employed with AMC Consultants,
who takes responsibility for the estimate.
Mineral Resources that are not Mineral Reserves do not have demonstrated economic viability.
| Table 1.2 |
Mineral Resource as of 31 October 2022 |
| Resource category |
Tonnes (Mt) |
Ag (g/t) |
Ag (Moz) |
| Measured |
14.88 |
131 |
62.60 |
| Indicated |
39.38 |
110 |
139.17 |
| Measured & Indicated |
54.26 |
116 |
201.77 |
| Inferred |
4.56 |
88 |
12.95 |
Notes:
CIM Definition Standards (2014) were used for
reporting the Mineral Resources.
| · | The QP is Dinara Nussipakynova, P.Geo. of BBA, formerly employed with AMC Consultants. |
| · | Mineral Resources are constrained by optimized pit shells at a metal price
of US$22.50/oz Ag, recovery of 91% Ag, and COG of 30 g/t Ag. |
| · | Drilling results up to 25 July 2022. |
| · | The numbers may not compute exactly due to rounding. |
| · | Mineral Resources that are not
Mineral Reserves do not have demonstrated economic viability. |
| Source: AMC Mining Consultants (Canada) Ltd., 2022. |
Open pit life-of-mine (LOM) plans
and resulting open pit Mineral Reserves are determined based on a silver price of US$23.00/oz. Reserves stated in this report are dated
effective as of 19 June 2024. The mine design and Mineral Reserve estimate have been completed to a level appropriate for pre- feasibility
studies.
Ore is converted from Mineral Resource
to Mineral Reserve based primarily on positive cash flow pit optimization results, pit design, and geological classification of Measured
and Indicated resources. The in-situ value is derived from the estimated grade and certain modifying factors.
In the process of estimating the
Mineral Reserves, dilution and mining recovery factors were applied to the Mineral Resource using a block model regularization process.
AMC Consultants regularized the resource model to a uniform size of 5 m x 5 m x 5 m to better reflect the minimum parcel size that can
selectively be mined.
The Silver Sand project will be
mined using a conventional open pit mining method, utilizing 115 t hydraulic backhoe excavators and haulage by off-highway 72 t capacity
rear dump haul trucks. Mining is anticipated to be completed by a contract mining company. The majority of the excavated material will
require drilling and blasting. Drilling and blasting will be performed on 10 m benches. Flitch height is variable depending on the material
being mined. Overburden and waste will be mined in 5 m flitches and ore is to be mined in 3.3 m flitches. Ore will be hauled to a crusher
or to run-of-mine (ROM) stockpiles. Waste will be hauled to external and in-pit waste rock dumps.
The pseudoflow pit optimization
algorithm, as implemented in GEOVIA Whittle software, was used to determine the ultimate pit shell for Silver Sand. The selected pit shells
were then used to produce pit designs and the mining schedule.
The open pit Mineral Reserves are
reported within a pit design based on open pit optimization results. The Mineral Reserves represent the economically mineable part of
Measured and Indicated Mineral Resources and are presented in Table 1.3.
| Silver Sand Project Pre-Feasibility Study |
| | New Pacific Metals Corp. | 0723071 |
| Table 1.3 |
Mineral Reserve estimate as of 19 June 2024 |
| |
Tonnes (Mt) |
Ag (g/t) |
Ag (Moz) |
| Proven |
15.09 |
121 |
58.84 |
| Probable |
36.92 |
98 |
116.58 |
| Proven & Probable |
52.01 |
105 |
175.42 |
Notes:
| · | CIM Definition Standards (2014) were used for reporting the Mineral Reserves. |
| · | The Qualified Person is Wayne Rogers, P.Eng. of AMC Consultants. |
| · | Cut-off
grade of 27 g/t Ag for material inside the AMC, and 29 g/t Ag outside the AMC limit based
on operating costs of 16.71 US$/t of ore, 91% Ag metallurgical recovery, 0.50 US$/oz Ag treatment
and selling costs, 6% royalty within AMC, 12% royalty outside AMC, and 99.00% payable silver. |
| · | Ag price assumed is US$23.00 per troy ounce. |
| · | Base mine unit cost of 2.00 $/t mined plus an incremental mining cost of 0.04 $/t mined per 10 m bench. |
| · | Ore mining costs including a process unit cost of 14.20 $/t milled, TSF 0.65 $/t milled, and G&A
1.86 $/t milled. |
| · | Mineral Reserves include dilution and mining recovery. |
| · | Reserves are converted from Resources through the process of pit optimization,
pit design, production schedule, and supported by a positive cash flow model. |
| · | The totals may not sum due to rounding. |
| · | Probable Mineral Reserves are based on Indicated Mineral Resources only. |
| · | Proven Mineral Reserves are based on Measured Mineral Resources only. |
| · | Ag metal (Moz) represents contained
metal. |
Source: AMC Mining Consultants (Canada) Ltd., 2024.
The Silver Sand open pit is comprised
of one main pit that is split into eight sub-phases (MP1-8). It will be mined using a conventional open pit approach of drilling and blasting
ore and waste rock, with material mined by hydraulic excavators loading into off-highway rear dump haul trucks.
The open pit will be dewatered using
horizontally drilled drain holes and pumping from sumps. Where possible, diversion ditches will be built upslope of the pit to divert
non-contact water. The dewatering plan is staged to incorporate additional dewatering measures as the mine plan expands over the life-of-mine
(LOM). Additional work is recommended as part of future studies to improve the understanding of the shallow groundwater system, dewatering
conditions required for major and local fault structures, and the overall hydrogeological system.
For the PFS study, the geological
model, structural models, hydrogeological model, and rock mass characterization have been developed with variable levels of confidence.
The 3D geotechnical model has allowed the geotechnical slope design parameters to be developed. The pit design criteria are appropriate
and comply with industry norms. Methodologies used for the slope design are sound and to international standards. The extent of the weathered
horizon and slope stability under seismic conditions have not been considered in the geotechnical slope design and should be explored
in future studies.
The pit was designed with 20 m high
benches (10 m double benches). Pit ramps were designed with a maximum gradient of 10%, at 21 m wide for double-lane traffic and 12 m wide
for single-lane traffic. The bottom three benches of the pit were designed with single-lane access, with one final sub-excavation bench
(also known as a “goodbye cut”) in the final pit floor. The pit is approximately 2,300 m in length, 350 m to 700 m in width,
and 280 m at its deepest point.
The open pit contains approximately
52.0 Mt of ore with a grade of 105 g/t Ag and 181.9 Mt of waste material, with an overall waste to mineralized material strip ratio of
3.50 to 1.
| Silver Sand Project Pre-Feasibility Study |
| | New Pacific Metals Corp. | 0723071 |
The open pit operation includes
a two-year pre-production period (Years -2 & -1) and 13 years of production.
During the pre-production period,
the schedule is driven predominately by waste stripping to achieve tailings storage facility (TSF) embankment construction requirements.
Other activities during the pre-production period include haul road construction, mine development, and some ore stockpiling.
ROM stockpiles will be constructed
near the plant for low-grade, medium-grade, and high-grade ore. The ore stockpiles will be used to allow for blending of the different
grades of ore to provide a constant feed grade to the plant for sustained periods which will assist in maximizing metallurgical recovery.
A maximum long-term stockpile capacity of 4.40 Mt is required.
Six dumping areas for waste material
are planned; these include two in-pit dumps and four external dumps. Upstream of the open pit, a water dam will be constructed in the
Machacamarca Creek valley using waste rock from initial waste stripping. The Valley dump, located north of the water dam, will also be
constructed to establish access to the mining phases north of the creek. Waste material will also be used to construct the embankment
for the TSF. Later in the mine life, waste will be dumped into depleted pits to take advantage of shorter haul distances.
An ex-pit production rate of 18.0
Mtpa is adequate to achieve the plant feed target of 4.0 Mtpa. MP1, MP5, and MP7 are mined first in Year -2 and waste material from these
phases is used to construct the water dam and TSF embankment. Two years of pre-production mining are required to achieve the TSF embankment
and water dam construction requirements. Once the water dam is constructed, higher-value phases MP2, MP3, and MP4 are mined as the mining
schedule targets high-grade and low strip-ratio ore. Mining in MP7 is expedited to take advantage of short-hauling waste from MP8, towards
the end of mining.
| 1.11 | Processing and metallurgy |
The results of PFS metallurgical
testwork (described in Section 13) have been used together with previous (PEA) testwork to progressively de-risk a straightforward mineral
processing flowsheet for the Silver Sand project. Interpretation of this testwork has been used as the basis for PFS level process design
criteria (PDC), mass / water / metal balances, process flowsheet and equipment specification. The PFS process plant flowsheet is described
in detail in Section 17.
The 2022 PEA conclusions regarding
the process flowsheet and equipment type have been validated by the work completed as part of the PFS. In addition, more comprehensive
sample collection and characterization of these samples have enhanced the metallurgical body of knowledge for the project and allowed
further optimization of input parameters such as grinding size, leaching time, cyanide dosage, and oxygen levels.
Agitated tank cyanidation, followed
by counter current decantation (CCD) and zinc precipitation is still considered the optimum processing route when factors such as updated
metallurgical performance, capital costs, and mine production schedules are considered. Various parameters affecting the performance of
this flowsheet have been adjusted and updated, and the PFS base case represents a further de-risking of the processing aspects of the
project.
The selected flowsheet represents a very conventional, proven
approach to silver extraction that is similar to other operations in Bolivia. The flowsheet consists of the following unit operations:
| · | ROM receiving, single stage (primary) crushing, and crushed rock storage. |
| · | Stockpile discharge, grinding via SAG milling and ball milling. |
| Silver Sand Project Pre-Feasibility Study |
| | New Pacific Metals Corp. | 0723071 |
| · | SAG mill pebble crushing via SAG mill pebble ports, scalping screen, recycle
conveyors, and cone crusher. |
| · | Pre-leach thickening of the classified mill circuit product, and cyanide
leaching of the thickener underflow using agitated, oxygen sparged tanks. |
| · | Liquid / solid separation using a four-stage CCD circuit. |
| · | Recovery of silver from pregnant leach solution using a zinc precipitation
process followed by drying and smelting with fluxes to produce silver doré bars. |
| · | Thickening and filtration of leach residues. |
| · | Conveying of filter cake and long-term storage at the tailings storage area. |
As copper will be recovered into
solution along with silver, and some dissolved copper is expected to be cemented together with silver, a small copper removal leach circuit
will be required within the refinery to maintain good doré quality and/or reduce circulating copper concentrations.
The PFS flowsheet is projected
to recover an average of 90% silver into a doré product for export to established international markets.
As a greenfield project, the Silver
Sand project will require the development of supporting infrastructure. The Property is accessible from Potosí via a 54 km long
road made up of a 27 km stretch of the paved Bolivia National Highway 5 and an all-season gravel road built for mining in the Colavi District.
The gravel road is currently being widened and upgraded to a paved road by the government.
The Silver Sand
project is estimated to require a power supply of approximately 25 megawatts (MW) of electricity, which will be provided by
Bolivia’s national power supply company, ENDE Transmission S.A (ENDE). A preliminary power supply plan between ENDE and New
Pacific has been agreed upon and the Company has submitted a power supply application to the Bolivia Ministry of Energy.
The new 55 km 115 kV transmission
line will connect the existing ENDE Potosí substation and a new substation that will be constructed at the Silver Sand site. ENDE
has provided a quotation to the Company for the construction of the power line and the substation. Additionally, ENDE will be responsible
for permitting and constructing the transmission line and the substation, which is estimated to take up to two years.
A rockfill water dam with an upstream
geomembrane liner will be built upstream from the mine. The reservoir developed behind the dam will have a maximum capacity of approximately
3.0 million cubic metres and will provide water for the project.
The filtered tailings storage facility
will be integrated within the waste rock storage area and located to the south of the mine and process plant. The TSF will be fully lined
to protect the local surface and groundwater systems. A leachate collection system will be installed below the liner system to collect
any seepage and direct it to the run-off collection ponds.
An initial berm of mine waste rock
will be constructed on the south and east sides of the TSF to provide structural support for the tailings and liner system.
A starter TSF cell will be developed
along the western perimeter of the waste rock storage facility, with sufficient capacity to store tailings from the first year of operations.
The perimeter of the TSF will be raised as waste rock becomes available from mining operations and the liner system is extended over the
operating life of the mine.
| Silver Sand Project Pre-Feasibility Study |
| | New Pacific Metals Corp. | 0723071 |
It is expected that most project
employees will commute from Potosí or other nearby communities. However, a camp with capacity for 100 people has been projected
for workers not residing in the local area.
Other infrastructure such as offices,
mobile equipment maintenance shop, fuel storage, warehouse, and laboratory are envisaged to be built close to the processing plant.
Figure 1.1 shows the proposed site
layout with open pits, waste dumps, process plant, filtered TSF, ore stockpile area, crusher, site access road, and haul roads.
| Figure 1.1 |
Preliminary site infrastructure layout |

Source: AMC
Mining Consultants (Canada) Ltd., 2024.
| Silver Sand Project Pre-Feasibility Study |
| | New Pacific Metals Corp. | 0723071 |
| 1.13 | Environmental studies, permitting and social or community impact |
To obtain the environmental license
for the Arena de Plata (Silver Sand) mining project in the department of Potosí, New Pacific is preparing studies and activities
that will allow it to provide a comprehensive Analytical Environmental Impact Assessment Study (EEIA-AI) in accordance with the current
environmental legislation in force in the Plurinational State of Bolivia.
Following the completion of the
EEIA-AI, New Pacific will commence the mandatory public consultation process, which occurs late in the Bolivian mine permitting process.
A notarized act is formed as part of the consultation process. It is a legal document that will contain the points and aspects of conformity
and observations of the community on the mining operation in public ponsultation and the socio-environmental impact that it could generate.
The mining law in Bolivia establishes
that a mining operator must establish an accounting provision to cover the cost of closing operations, however, it does not establish
other environmental guarantees as is the case in other countries in the Andean region.
| 1.14 | Capital and operating costs |
All currency is in US dollars (US$)
and cost estimates are based on prices obtained during the second quarter of 2024. Costs for the project have been estimated based on
a hybrid owner- contractor project delivery model.
The responsibility of providing
various capital and operating cost inputs for the project financial model are as follows:
| · | Mining – Costs related to the development
and operation of the open pit mine, surface haul roads, and stockpiles were developed by AMC Consultants. QP Mr W Rogers has relied on
HydroTechnica Ltd. to develop mine dewatering cost but accepts them as reasonable and takes responsibility for them. |
| · | Processing – Costs related to the construction
and operation of mineral processing infrastructure were developed by Halyard Inc. QP Mr A. Holloway takes responsibility for those costs. |
| · | Tailings storage & the water dam –
Costs related to the transportation and storage of tailings and the water dam were developed by NewFields Canada Mining & Environment
ULC. QP Mr L. Botham takes responsibility for those costs. |
| · | Site infrastructure – Costs related to
the deployment of site infrastructure and earthworks to support the on-site camp, mobile maintenance workshop, explosives storage, fuel
storage infrastructure, transmission infrastructure, communications, and network infrastructure were developed by AMC Consultants. QP
Mr M. Molavi takes responsibility for those costs. |
| · | General & Admin – Costs related
to permitting, community compensation and projects, logistics, administration, and labour were developed by New Pacific. QP Mr W Rogers
takes responsibility for those costs. |
The operating cost estimate allows
for all labour, equipment, supplies, power, consumables, supervision, technical services, as well as general and administrative (G&A)
costs. The total operating cost was estimated at 1,281 US$ million, excluding capitalized operating costs. The estimared average operating
cost over the LOM can be expressed as 8.16 US$/troy oz. of silver produced and as 24.63 US$/tonne milled. An overview of average LOM costs
by activity is presented in Table 1.4.
| Silver Sand Project Pre-Feasibility Study |
| | New Pacific Metals Corp. | 0723071 |
| Table 1.4 |
Average LOM unit operating cost summary |
| Operating cost category |
Total costs |
Cost per payable oz produced |
Cost per tonne |
| US$M |
US$/troy oz |
US$/tonne milled |
| Mining |
482 |
3.07 |
9.28 |
| Processing & tailings |
713 |
4.54 |
13.71 |
| G&A |
86 |
0.54 |
1.65 |
| Total operating cost |
1,281 |
8.16 |
24.63 |
Note: Totals may not add up exactly due
to rounding.
Source: AMC Mining Consultants (Canada) Ltd., 2024.
Initial project development capital
costs for the Silver Sand project are estimated to be $358.3 M and sustaining capital costs are estimated to be $84.7 M, for a total of
$443.0 M. See Table 1.5 for capital costs by category.
| Table 1.5 |
Capital cost summary |
| Capital cost item (US$M) |
Total cost |
Initial capital costs |
Sustaining capital costs |
| Infrastructure |
50.7 |
47.0 |
3.7 |
| Mine development |
76.6 |
76.1 |
0.5 |
| Processing plant |
209.4 |
207.3 |
2.0 |
| Tailings Storage Facility |
70.3 |
6.7 |
63.6 |
| Owner’s capital costs |
21.2 |
21.2 |
|
| Closure costs |
14.9 |
|
14.9 |
| Total |
443.0 |
358.3 |
84.7 |
Note: Includes direct, indirect, and contingency
costs. Totals may not add up exactly due to rounding.
Source: AMC Mining Consultants (Canada) Ltd., 2024.
All currency is in US$ unless otherwise
stated. The cost estimate was prepared with a base date of the second half of Year -2 (starting 1 July) and does not include any escalation
beyond this date. For net present value (NPV) estimation, all costs and revenues are discounted at 5% per year from the base date. The
economic model shows the Project under construction for two years (Year -2 and Year -1), which is considered the pre-production development
period, and then in production for the balance of the projected cash flows, which is considered the operating period (Years 1 to 14).
Project revenue is derived from
the sale of silver doré. A metal price of $24.00/troy oz. was selected after discussion with New Pacific and referencing current
markets and forecasts in the public domain. Refer to Section 19 for additional information on the silver price.
Within the AMC area, a royalty of
6.0% of gross revenue is paid to the government. Most of the Mineral Reserves lie within the AMC area. Outside of the AMC area, an additional
6.0% royalty is to be paid to COMIBOL. No other royalties or levies apply to the Project. The selling costs and payability rate, for which
the QP takes responsibiltyn are based on information provided by New Pacific and Halyard. The selling costs for silver doré are
summarized in Table 1.6.
| Silver Sand Project Pre-Feasibility Study |
| | New Pacific Metals Corp. | 0723071 |
| Table 1.6 |
Selling costs and royalties |
| Selling cost item |
Value |
Units |
| Payable silver |
99.50% |
of Ag produced |
| Transportation & insurance costs |
0.25 |
US$/oz |
| Refining charges |
0.20 |
US$/oz |
| Royalty to COMIBOL (outside the AMC limit) |
6.00% |
of gross revenue |
| Royalty to the Bolivian Government |
6.00% |
of gross revenue |
Source: New Pacific Metals
Corp. and Halyard Inc., 2024.
A regular Bolivian corporate income
tax rate of 25% was applied. As a mining property, the Project is subject to an additional tax of 12.5%, with a 5% reduction for companies
that produce pure metal products (as is the case with the Silver Sand project producing silver doré onsite). Corporate income tax
was calculated on taxable income, which also considers operating costs and depreciation.
A high-level economic assessment
of the proposed open pit operation of the Silver Sand deposit was conducted. The project is projected to generate a post-tax NPV of $740M
at a discount rate of 5% per year, with post-tax IRR of 37%.
Initial project capital is estimated
at $358M with a payback period of 1.9 years (measured on a post-tax basis from the beginning of production, after construction is completed).
Key assumptions and results of the economics assessments are provided in Table 1.7.
A sensitivity analysis is provided
in Section 22. The results of the sensitivity analysis show that the post-tax NPV is robust and remains positive for the range of sensitivities
evaluated.
| Silver Sand Project Pre-Feasibility Study |
| | New Pacific Metals Corp. | 0723071 |
| Table 1.7 |
Silver Sand deposit – Key economic input assumptions and cost summary |
| Item |
Unit |
Value |
| Total process feed material |
kt |
52,014 |
| Total waste mined |
kt |
181,878 |
| Pre-production waste mined |
kt |
24,261 |
| Production waste mined |
kt |
157,617 |
| Silver feed grade |
g/t |
105 |
| Silver processing recovery rate |
% |
90% |
| Silver selling price |
$/oz |
24.00 |
| Discount rate |
% |
5% |
| Silver payability rate |
% |
99.50% |
| Payable silver metal |
Moz |
157 |
| Gross revenue |
$M |
3,770 |
| Product selling costs & royalties |
$M |
313 |
| Total net revenue |
$M |
3,457 |
| Total capital costs |
$M |
443 |
| Initial capital costs |
$M |
358 |
| Sustaining capital costs |
$M |
85 |
| Total operating costs1 |
$M |
1,281 |
| Mine operating costs1 |
$M |
482 |
| Process and tailings storage operating costs1 |
$M |
713 |
| General and administrative operating costs1 |
$M |
86 |
| Operating cash cost1 (excl. selling costs) |
$/oz Ag |
8.16 |
| Pre-tax all in sustaining cost2 |
$/oz Ag |
10.69 |
| Post-tax payback period3 |
Yrs |
1.9 |
| Post-tax NPV5% |
$M |
740 |
| Post-tax IRR |
% |
37% |
Notes: Values may not sum due to rounding.
| 1. | Does not include capitalized operating costs |
| 2. | Does not include site development (initial) capital costs. |
| 3. | The payback period is measured
from the beginning of production, after construction is completed. |
Source: AMC Mining Consultants (Canada) Ltd., 2024.
| 1.16 | Interpretation and conclusions |
The deposit, as currently defined,
remains open for expansion. Additionally, there has been no modern, district-scale exploration. While it is understood that engineering
work for the feasibility study will be based on the current block model, there are some recommendations for future exploration. Some grade
control drilling may also be required pre-production but has not been quantified at this stage.
The proposed mine plan
has a two-year pre-production period, followed by 13 years of production, at a processing plant throughput rate of 4 Mtpa of ore.
The mine plan includes a stockpiling strategy with low-grade, mid-grade, and high-grade ore stockpiles that will be used to maximize
silver production in the early years of the project. The total annual ex-pit material mined peaks at 18.0 Mtpa, before dropping to
8.0 Mtpa at the end of the open pit mine life. The open pit is planned to be a contractor-run operation with a contractor-provided
mining fleet. A total of 52.0 Mt of ore is anticipated to be mined from open pit operations over the LOM.
| Silver Sand Project Pre-Feasibility Study |
| | New Pacific Metals Corp. | 0723071 |
The selected PFS flowsheet consists
of comminution by crushing, followed by semi-autogenous and ball milling, agitated tank leaching with cyanidation over 72 hours, CCD,
and zinc precipitation (Merrill Crowe). The silver precipitate from Merrill Crowe will be treated for copper removal, and then smelted
to produce silver doré.
Thickened tailings from the CCD
circuit will be filtered with pressure filters before being conveyed to the nearby TSF, deposited using a radial stacker and then spread
using tracked dozers. The tailings will be stored behind a fully lined rock-fill embankment. The embankment will be constructed using
waste rock provided from the open pit. Seepage and run-off from the TSF will be collected in a pond which will be located downstream of
the facility. Upon mine closure, it is anticipated that the TSF will be capped with rock and reclaimed topsoil to provide a secure facility.
Process water is expected to be
sourced from the water reservoir adjacent to the process plant and from recycled water from the TSF, supplemented by site runoff as required.
A site-wide water balance model has been developed to maximize water recycling over the LOM.
There is currently no infrastructure
on site apart from access roads. New Pacific has undertaken discussions with the power authorities in Bolivia to arrange for access to
grid power. A water supply can be secured with the construction of a small dam across the Machacamarca Creek to create a reservoir to
supply the process plant and local community.
There is a 54 km long road made
up of a 27 km stretch of the paved Bolivia National Highway 5 and an all-season gravel road built for mining in the Colavi District. The
gravel road is currently being widened and upgraded to paved road by the government.
The main recommendation is to advance
the Silver Sand project to a feasibility study (FS) level. This will require advancing the definition and engineering level of all of
the mining, processing, and infrastructural aspects. While the current block model will form the basis for that study work there is further
geology and exploration work that is recommended.
There are a number of recommendations on all facets
of QA/QC summarized below. These are expanded on in Section 11.
| · | Purchase an additional CRM (Certified Reference Material) at the average
grade of the deposit which has been certified using similar digestion methodology. |
| · | Investigate performance issues with CRMs CDN-ME-1603 and CDN-ME-1605 if
these are to be used in future programs. |
| · | If continue to use ME-MS41 analytical method it is recommended that the
OG46 over-limit threshold be dropped from 100 g/t Ag to a level below the anticipated COG. |
| · | Continue to include blanks in every batch of samples
submitted at a rate of at least one in every 20 samples (5%) and consistently monitor them in real time on a batch-by-batch basis and
ensure that remedial action is taken as issues arise. |
| · | Ensure that all blank sample follow up is recorded. |
| · | Implement investigative work to understand geological variance. |
| · | Ensure that all future programs include 4 - 5% duplicate
samples including field duplicates, coarse (crush) duplicates, and pulp duplicates to enable the various stages of sub-sampling to be
monitored. |
| · | In future programs, submit umpire duplicates, as
was done for the October 2017 – 2019 programs. |
| Silver Sand Project Pre-Feasibility Study |
| | New Pacific Metals Corp. | 0723071 |
| · | Submit pulp samples (rather than coarse reject) so that umpire samples
only monitor analytical accuracy and variance. |
| · | Include CRMs at the average grade and higher grades in umpire sample submissions. |
For future Mineral Resource modelling, the following should
be considered:
| · | Incorporate geometallurgical attributes into the block model. |
| · | Verify mined-out volumes by surveying historical waste dumps. Conduct structural
analysis of available data and complete initial structural / geotechnical drilling as required. |
| · | Update the 3D geological model to include detailed geology – deposit
oxidation domaining and structures. |
The Silver Sand deposit, as currently
defined, remains open for expansion at depth. While it is understood that engineering work for the PFS will be based on the current block
model, it is recommended that future drilling on the deposit should consider the following:
| · | Infill drilling to upgrade areas of high-grade mineralization
within the current Inferred resource area. |
| · | Additional drilling around the current Mineral Resources,
where the deposit remains open at depth. |
The QP also notes that there has been no modern district-scale
exploration outside of Silver Sand deposit.
| 1.17.2 | Metallurgy & mineral processing |
The PFS metallurgical program included
cyanide leach testing of 18 mineralized samples and demonstrated that cyanide leaching is a technically viable option to recover silver
for the project. The work has incrementally de-risked metallurgical aspects of the project, although opportunities for improvement are
believed to remain. Further metallurgical investigations are warranted to study opportunities to increase silver recovery and to reduce
cyanide consumption. A summary of metallurgical and mineral processing recommendations is as follows. See Section 26.4 for detailed recommendations.
| · | Sample selection and characterization –
The completion of more extensive metallurgical sampling, characterization testing, and performance modelling is recommended as infill
drilling programs continue. |
| · | Gravity concentration – Further testing
is recommended to refine the gravity concentration process and optimize silver recovery. |
| · | Cyanidation – Further cyanidation test
work should continue to focus on leach conditions that include high dissolved oxygen (DO2) levels. The DO2 vs silver recovery relationship
should be defined further to allow for the optimized design of oxygenation equipment in the flowsheet. |
| · | Process water effects – Due to copper
dissolution in process water during the cyanide leach, more detailed metallurgical testing is needed to study the impact of recycled process
solutions. |
| · | Pre-leach thickening – Comparative thickening
testing is needed for the cyanide-leached tailing without prior cyanide destruction. |
| · | Optimization of Merril Crowe – Testing
should be conducted to reduce silver with zinc dust, without the addition of lead nitrate. |
| · | Cyanidation
methods – Cyanide leaching with a mechanically-agitated tank should be tested as
the use of LifterbottleTM rolls
has been demonstrated to improve silver recovery and cyanide consumption. |
| Silver Sand Project Pre-Feasibility Study |
| | New Pacific Metals Corp. | 0723071 |
| · | Oxygen intake during cyanide leach –
Additional testing for oxygen intake during the cyanide leach should be conducted so that final design parameters for an oxygen sparging
system can be defined. |
| · | Copper removal from Merril Crowe precipitates
– Testing is needed to selectively dissolve copper in the presence of metallic silver while hydrogen peroxide and sulfuric acid
are used. |
| · | Preg-robbing, preg-borrowing, and instability
of silver cyanide complex – A detailed investigation into the preg-robbing or preg-borrowing phenomenon, possible instability
of the silver cyanide complex, possible equipment contamination, and possible unreliable assay procedures is warranted. |
It is recommended that the following aspects are examined
in the next study stage:
| · | Review of drillhole records and geological data for improved conceptual
understanding of the shallow groundwater system. |
| · | Sampling of the springs and wetland to the north and west of the Main Pit. |
| · | Shallow drilling (auger or diamond drilling) to install
shallow piezometers and prove the depth of the colluvial system, and whether it supports a water table upstream of the springs and within
the wetland area. |
| · | Permeability testing of the existing standpipe piezometers. |
| · | Construction of a trial dewatering borehole in the
alluvial deposits of the main river channel to investigate its hydrogeological properties and allow for a targeted dewatering strategy,
if required. |
| · | Construction of at least one trial dewatering borehole
into a major fault structure and surrounding piezometer array to investigate fault properties and surrounding fracture connectivity. |
| · | The installation of multi-level vibrating wire piezometers
is recommended to improve the understanding of the hydrogeological system. The following targets are recommended: |
| ¾ | At least one major and one local fault structure. |
| ¾ | The shallow aquifer system in hill-slope colluvium (further to positive
results from exploratory drilling). |
| ¾ | The Tarapaya Formation (where saturated). |
| ¾ | UH3 orthogonal to the existing standpipe piezometers for triangulation
of groundwater pressure. |
| ¾ | UH3 north and south of the river. |
| · | It is recommended to develop a weathering horizon
model and collect additional geotechnical data as per Section 16.3.4 to increase the geotechnical model reliability. Geotechnical slope
design criteria should be updated when further information is available and pit slope stability should be assessed under static and seismic
conditions. |
| · | The ongoing geotechnical program should be continued
to collect additional data for pit wall angle stability analysis. |
| · | Soil and weathered core samples should be collected for lab testing. |
| · | It is recommended to undertake a detailed bench height
and dilution study. The study should consider lateral block extents, flitch / bench heights, equipment specifications, drill and blast,
mining rates, dilution and grade control strategies, and geotechnical implications. |
Grade control strategies, such
as grade control drilling and blast movement monitoring should also be further evaluated.
| Silver Sand Project Pre-Feasibility Study |
| | New Pacific Metals Corp. | 0723071 |
| · | It is recommended that quotes from multiple Bolivian
mining contractors are collected to firm up the mining costs estimates for the open pit operations. New Pacific is recommended to acquire
binding (or “firm”) quotes for the primary mining contractor to achieve a higher level of accuracy for the FS. |
| · | Further work should be conducted to identify alternative
dump locations, i.e., in the creek gully, to reduce haul distance. |
| · | The amount of time required for site development and
construction will significantly influence the value of the project. As part of the FS, New Pacific is recommended to prepare an operational
readiness assessment and create a detailed development schedule to ensure the project is fully prepared for operation. |
| · | Location and placement of accommodation camp, waste
dump, crusher, and process plant to be confirmed following civil geotechnical and condemnation drilling. |
| · | Continue to negotiate with power authorities to confirm
the cost estimate, and that sufficient grid capacity can be provided. |
| · | The site requires significant earthworks to construct
the supporting infrastructure. New Pacific to investigate the potential for engaging contractors who are familiar with this type of work
to obtain an accurate and dependable estimate of costs. |
| · | The early years of the mine production schedule are
driven by silver grades and the requirement to produce waste material to be used as rock fill for the tailings storage embankment. As
part of the FS, it is recommended to investigate alternative configurations for tailings storage, to reduce the volume (and cost) of waste
production in the early years of the project. |
| · | Initiate a geotechnical, geological, and hydrogeological
investigations to fully characterize the site conditions in the location of the proposed waste storage facility. |
| · | Initiate detailed geochemical characterization program,
including static and kinetic testing to fully characterize the tailings and waste rock materials to be produced from the mining and processing
operations. |
| · | Potential for formation of Acid Rock Drainage is
not well understood. It is recommended to undertake testing to evaluate the time to acidification and the extent of Acid Rock Drainage
of the waste rock. |
| · | Complete the environmental baseline study, impact analysis, and mitigation
plans. Permitting is required to be advanced. |
| · | New Pacific is recommended to conduct a detailed closure and reclamation
plan as part of the FS. |
| · | Environmental programs have commenced with a reasonable
set of samples characterized. As the project continues to progress towards permitting and construction, a larger set of variability samples
should be submitted to develop the dataset of geochemical behaviour (acid-generation and metals leaching) in plant tailing streams and
waste rock piles. FS level environmental test work should include static tests and kinetic (humidity cell) tests on filtered slurry samples
generated by the most recent test work. These tests would not include cyanide detoxification as this process is no longer included in
the process flowsheet. |
| Silver Sand Project Pre-Feasibility Study |
| | New Pacific Metals Corp. | 0723071 |
It is recommended that New Pacific retain a tax specialist
for the FS to investigate the possibility of including tax credits and income tax planning measures, to further improve project value.
The estimated cost of the program to complete a study to
feasibility level is estimated to be $5.53M.
| Silver Sand Project Pre-Feasibility Study |
| | New Pacific Metals Corp. | 0723071 |
Contents
| 1 |
Summary |
ii |
| |
1.1 |
Introduction |
ii |
| |
1.2 |
Property description and ownership |
ii |
| |
1.3 |
Accessibility, climate, local resources, infrastructure and physiography |
iii |
| |
1.4 |
Geological setting and mineralization |
iii |
| |
1.5 |
Exploration |
iv |
| |
1.6 |
Drilling |
v |
| |
1.7 |
Sample preparation, assay, and QA/QC |
vi |
| |
1.8 |
Mineral Resources |
vii |
| |
1.9 |
Mineral Reserves |
viii |
| |
1.10 |
Mining methods |
ix |
| |
1.11 |
Processing and metallurgy |
x |
| |
1.12 |
Infrastructure |
xi |
| |
1.13 |
Environmental studies, permitting and social or community impact |
xiii |
| |
1.14 |
Capital and operating costs |
xiii |
| |
1.15 |
Economic analysis |
xiv |
| |
1.16 |
Interpretation and conclusions |
xvi |
| |
1.17 |
Recommendations |
xvii |
| |
|
1.17.1 |
Geology |
xvii |
| |
|
1.17.2 |
Metallurgy & mineral processing |
xviii |
| |
|
1.17.3 |
Open pit mining |
xix |
| |
|
1.17.4 |
Infrastructure |
xx |
| |
|
1.17.5 |
Tailings storage |
xx |
| |
|
1.17.6 |
Environmental |
xx |
| |
|
1.17.7 |
Financial inputs |
xxi |
| |
|
1.17.8 |
Costs |
xxi |
| |
|
|
|
|
| 2 |
Introduction |
41 |
| |
2.1 |
General and terms of reference |
41 |
| |
2.2 |
The Issuer |
41 |
| |
2.3 |
Report authors |
41 |
| |
2.4 |
Sources of information |
43 |
| |
2.5 |
Other |
43 |
| |
|
|
|
| 3 |
Reliance on other experts |
44 |
| |
|
|
| 4 |
Property description and location |
45 |
| |
4.1 |
Property location |
45 |
| |
4.2 |
Bolivian Regulatory framework |
45 |
| |
|
4.2.1 |
Overview |
45 |
| |
|
4.2.2 |
Exploration and mining rights |
46 |
| |
|
4.2.3 |
Environment protection |
46 |
| |
4.3 |
Mineral tenure |
46 |
| |
|
4.3.1 |
Introduction |
46 |
| |
|
4.3.2 |
100% owned New Pacific tenure |
48 |
| |
|
4.3.3 |
Mining production contract |
48 |
| |
4.4 |
Environmental permits |
49 |
| |
4.5 |
Land holding costs |
49 |
| |
4.6 |
Surface rights |
50 |
| |
4.7 |
Royalties and encumbrances |
50 |
| |
|
|
|
| 5 |
Accessibility, climate, local resources, infrastructure, and physiography |
52 |
| |
5.1 |
Accessibility |
52 |
| Silver Sand Project Pre-Feasibility Study |
| | New Pacific Metals Corp. | 0723071 |
| Silver Sand Project Pre-Feasibility Study |
| | New Pacific Metals Corp. | 0723071 |
| Silver Sand Project Pre-Feasibility Study |
| | New Pacific Metals Corp. | 0723071 |
| Silver Sand Project Pre-Feasibility Study |
| | New Pacific Metals Corp. | 0723071 |
| Silver Sand Project Pre-Feasibility Study |
| | New Pacific Metals Corp. | 0723071 |
| Silver Sand Project Pre-Feasibility Study |
| | New Pacific Metals Corp. | 0723071 |
| Silver Sand Project Pre-Feasibility Study |
| | New Pacific Metals Corp. | 0723071 |
Tables
| Silver Sand Project Pre-Feasibility Study |
| | New Pacific Metals Corp. | 0723071 |
| Silver Sand Project Pre-Feasibility Study |
| | New Pacific Metals Corp. | 0723071 |
| Silver Sand Project Pre-Feasibility Study |
| | New Pacific Metals Corp. | 0723071 |
Figures
| Silver Sand Project Pre-Feasibility Study |
| | New Pacific Metals Corp. | 0723071 |
| Silver Sand Project Pre-Feasibility Study |
| | New Pacific Metals Corp. | 0723071 |
| Figure 13.1 |
Silver deportment in Met Sample 9 (15% oxide + 85% transitional), Met Sample 13 (high-grade sulphide sample), and Met Sample 15 (2020 high-grade sulphide sample) |
139 |
| Figure 13.2 |
Copper deportment in Met Sample 9 (15% oxide + 85% transitional), Met Sample 13 (high-grade sulphide sample), and Met Sample 15 (2020 high-grade sulphide sample) |
139 |
| Figure 13.3 |
Sulphur deportment in Met Sample 9 (15% oxide + 85% transitional), Met Sample 13 (high-grade sulphide sample), and Met Sample 15 (2020 high-grade sulphide sample) |
140 |
| Figure 13.4 |
Cyanide consumption as a function of sulphur content in the feed |
147 |
| Figure 13.5 |
Relationship between copper dissolution and cyanide consumption |
149 |
| Figure 13.6 |
Silver precipitation as a function of the ratio of zinc dust to the combined amount of dissolved silver and copper for Test 2 (JR7712) |
169 |
| Figure 13.7 |
Silver precipitation kinetics of Test 3 (JR7726) with single dosage of zinc dust 170 |
170 |
| Figure 13.8 |
Silver loading on the activated carbon |
171 |
| Figure 13.9 |
Copper loading on activated carbon |
172 |
| Figure 13.10 |
pH reading during humidity cell testing for Met Sample 1 |
182 |
| Figure 13.11 |
LOM annual ore blends |
183 |
| Figure 14.1 |
Silver Sand drillhole location plan |
187 |
| Figure 14.2 |
3D view of mineralization domains looking north-east |
188 |
| Figure 14.3 |
Pie-chart of the percentage volume by domains |
189 |
| Figure 14.4 |
Probability plot for Ag |
190 |
| Figure 14.5 |
3D view of the resource classification |
194 |
| Figure 14.6 |
Plan view of the block model and drillholes |
195 |
| Figure 14.7 |
Block model versus drillhole grade on Section 5200 |
196 |
| Figure 14.8 |
All domains swath plot for silver |
197 |
| Figure 15.1 |
Pit optimization results |
207 |
| Figure 15.2 |
Final pit geometry |
208 |
| Figure 16.1 |
Surface water catchments for MP2, MP3, MP4, and MP5 |
210 |
| Figure 16.2 |
Surface water catchments for MP6 and MP7 |
210 |
| Figure 16.3 |
Surface water catchments for MP7 and MP8 |
211 |
| Figure 16.4 |
Spatial distribution of the geotechnical domains (left: isotropic view, right: plan view) |
214 |
| Figure 16.5 |
Structural model (blue: regional; red: local; green: minor) |
214 |
| Figure 16.6 |
Spatial distribution of the structural domains (left: isotropic view, right: plan view) |
215 |
| Figure 16.7 |
Test results and the Hoek-Brown failure envelope for each geotechnical domain |
217 |
| Figure 16.8 |
Boxplot of GSI or each geotechnical domain |
218 |
| Figure 16.9 |
Recommended IRAk for each structural domain |
219 |
| Figure 16.10 |
Ultimate pit design with long sections |
224 |
| Figure 16.11 |
Section view A1 - A2 with Ag grade (g/t) |
225 |
| Figure 16.12 |
Section view B1 - B2 with Ag grade (g/t) |
225 |
| Figure 16.13 |
Main Pit phase designs |
226 |
| Figure 16.14 |
General site layout |
229 |
| Figure 16.15 |
Indicative value by mining area |
233 |
| Silver Sand Project Pre-Feasibility Study |
| | New Pacific Metals Corp. | 0723071 |
Distribution
list
1
e-copy to New Pacific Metals Corp.
1
e-copy to AMC Vancouver office
| Silver Sand Project Pre-Feasibility Study |
| | New Pacific Metals Corp. | 0723071 |
Abbreviations
& acronyms
| Abbreviations & acronyms |
Description |
| $ |
United States dollar |
| % |
Percentage |
| ° |
Degree |
| °C |
Degrees Celsius |
| µm |
Micron |
| 3D |
Three-dimensional |
| AACN |
National Competent Environmental Authority (Autoridad Ambiental Competente Nacional) |
| AAS |
Atomic absorption spectroscopy |
| AES |
Atomic Emission Spectroscopy |
| Ag |
Silver |
| AJAM |
Jurisdictional Mining Administrative Authority (Autoridad Jurisdiccional Administrativa Minera) |
| Alcira |
Minera Alcira Sociedad Anónima Alcira S.A. |
| ALS |
ALS laboratories |
| AMC |
Administrative Mining Contract |
| AMC Consultants |
AMC Mining Consultants (Canada) Ltd. |
| ARD |
Acid Rock Drainage |
| As |
Arsenic |
| ATE |
Temporary Special Authorization |
| Au |
Gold |
| BFA |
Bench face angle |
| BOB |
Bolivian Boliviano |
| CaCO3 |
Calcium carbonate |
| CaO |
Calcium oxide |
| Capex |
Capital expenditure |
| CCD |
Counter current decantation |
| CCR |
Crusher Control Room |
| CIM |
Canadian Institute of Mining, Metallurgy and Petroleum |
| cm |
Centimetre |
| CN |
Cyanide |
| COG |
Cut-off grade |
| COMIBOL |
Corporación Minera de Bolivia |
| Congress |
Congress of Bolivia |
| CPE |
Political Constitution of the State (Constitución Política del Estado) |
| CR |
Critically Endangered |
| CRM |
Certified reference material |
| CSA |
Canadian Securities Administrators |
| Cu |
Copper |
| CV |
Coefficient of Variation |
| d |
Day |
| DDH |
Diamond drillhole |
| DIA |
Environmental License |
| DMS |
Dense Media Separation |
| dmtpa |
Dry metric tonnes per annum |
| Silver Sand Project Pre-Feasibility Study |
| | New Pacific Metals Corp. | 0723071 |
| Abbreviations & acronyms |
Description |
| dmtph |
Dry metric tonnes per hour |
| DO2 |
Dissolved oxygen |
| DTM |
Digital Terrain Model |
| DWi |
Drop Weight Index |
| E |
East |
| EEIA-AI |
Analytical Environmental Impact Assessment Study |
| EIA |
Environmental Impact Assessment |
| EN |
Endangered |
| ENE |
East-northeast |
| EP |
Eastern pit |
| EPCM |
Engineering, Procurement and Construction Management |
| Excel |
Microsoft Excel |
| FAO |
Food and Agriculture Organisation |
| FNCA |
Environmental Categorization Form (Formulario de Categorización Ambiental) |
| FOS |
Factor of Safety |
| g |
Gram |
| G&A |
General and Administration |
| g/L |
Grams per litre |
| g/t |
Grams per tonne |
| GEOBOL |
Servicio Geologico de Bolivia |
| GPS |
Global positioning system |
| GU |
Geotechnical Unit |
| h |
Hour |
| Haulage |
Hexagon Mining’s Mineplan Haulage |
| HG |
High grade |
| HLS |
Heavy Liquids Separation |
| HMI |
Human-Machine Interface |
| hr |
Hours |
| ICP |
Inductively Coupled Plasma |
| ID2 |
Inverse distance squared |
| ID3 |
Inverse distance cubed |
| IES |
International Electrotechnical Commission |
| IRA |
Inter-Ramp Angle |
| IRAK |
Kinematic Inter-Ramp Angle |
| IRR |
Internal rate of return |
| ISO |
International Organization for Standardization |
| ITASCA |
ITASCA Chile SpA |
| kg |
Kilogram |
| kg/L |
Kilogram per litre |
| kg/t |
Kilogram per tonne |
| km |
Kilometre |
| km2 |
Square kilometre |
| kPa |
Kilopascal |
| kt |
Thousand tonnes |
| kV |
Kilovolt |
| kW |
Kilowatt |
| Silver Sand Project Pre-Feasibility Study |
| | New Pacific Metals Corp. | 0723071 |
| Abbreviations
& acronyms |
Description |
| kWh/t |
Kilowatt-hour
per tonne |
| kWh/m3 |
Kilowatt-hour
per cubic metre |
| L |
Litre |
| L/h |
Litre
per hour |
| lab |
Laboratory |
| LCT |
Locked
cycle test |
| Leapfrog |
Leapfrog
Geo 4.0 |
| LG |
Low
grade |
| LOM |
Life-of-mine |
| M |
Million |
| m |
Metre |
| m2 |
Square
metre |
| m3 |
Cubic
metre |
| m3/h |
Cubic
metre per hour |
| M
m3 |
Million
metres cubed |
| masl |
Metres
above sea level |
| Mbcm |
Million
bulk cubic metres |
| MC |
Master
composites |
| MCC |
Motor
Control Center |
| MCR |
Main
Control Room |
| mg |
Milligram |
| mg/L |
Milligram
per litre |
| MIBC |
Methyl
isobutyl carbinol |
| Minemax |
Minemax
Scheduler 7 |
| mm |
Millimetre |
| MMAYA |
Ministry
of Environment and Water protection (Ministerio de Medio Ambiente y Agua) |
| MMM |
Ministry
of Mining and Metallurgy |
| Moz |
Million
ounces |
| MP |
Main
pit |
| MPC |
Mining
Production Contract |
| MS |
Mass
spectroscopy |
| Mt |
Million
tonnes |
| Mtpa |
Million
tonnes per annum |
| mV |
millivolt |
| MW |
Megawatt |
| MWh |
Megawatt
per hour |
| N |
North |
| NaCN |
Sodium
cyanide |
| NaOH |
Sodium
hydroxide |
| NE |
North-east |
| New
Pacific |
New
Pacific Metals Corp. |
| NI
43-101 |
National
Instrument 43-101 |
| NJ
Mining |
Ningde
Jungie Mining Industry Co. Ltd. |
| NN |
Nearest
neighbour |
| NNE |
North-northeast |
| NNW |
North-northwest |
| amcconsultants.com | xxxviii |
| Silver Sand Project Pre-Feasibility Study |
| | New Pacific Metals Corp. | 0723071 |
| Abbreviations
& acronyms |
Description |
| NP |
Northern pit |
| NPV |
Net Present Value |
| NW |
North-west |
| OK |
Ordinary kriging |
| Opex |
Operating expenditure |
| OSC |
Competent sectoral
agency (organismo sectorial competente) |
| oz |
Troy ounce |
| p.a. |
Per annum |
| P80 |
80% Passing |
| Pb |
Lead |
| PCS |
Process Control System |
| PDC |
Process Design Criteria |
| PEA |
Preliminary Economic
Assessment |
| PFS |
Pre-feasibility Study |
| pH |
pH is a measure of
hydrogen ion concentration; a measure of the acidity or alkalinity of a solution |
| PID |
Proportional-integral-derivative |
| PLC |
Programmable Logic
Controller |
| PLS |
Pregnant leach solution |
| PoF |
Probability of Failure |
| ppm |
Parts per million |
| Property |
Silver Sand Property |
| QA/QC |
Quality assurance
and quality control |
| QP |
Qualified Person
as defined by NI 43-101 |
| RAAM |
Environmental Regulations
for Mining Activities, (Reglamento Ambiental para Actividades Mineras) |
| RC |
Reverse circulation
drilling |
| 2022
Technical Report |
Technical Report |
| RF |
Revenue Factor |
| RGGA |
General Environmental
Management Regulation (Reglamento General de Gestión Ambiental) |
| RGRS |
Regulation for Solid
Waste Management (Reglamento de Gestión de Residuos Sólidos) |
| RMCA |
Regulation on Atmospheric
Contamination (Reglamento en materia de Contaminación Atmosférica) |
| RMCH |
Water Pollution Regulation
(Reglamento en materia de Contaminación Hídrica) |
| RMSP |
Regulation for Handling
of Hazardous Substances (Reglamento para Manejo de Sustancias Peligrosas) |
| ROM |
Run-of-Mine |
| RPCA |
Environmental Prevention
and Control Regulation (Reglamento de Prevención y Control Ambiental) |
| RPD |
Relative paired difference |
| RQD |
Rock quality designation |
| RSD |
Relative standard
deviation |
| S |
South; Sulphur |
| SAG |
Semi-autogenous grinding |
| SCADA |
Supervisory Control
and Data Acquisition |
| SCSE |
Sag circuit specific
energy |
| SD |
Standard
deviation |
| Silver Sand Project Pre-Feasibility Study |
| | New Pacific Metals Corp. | 0723071 |
| Abbreviations & acronyms |
Description |
| SEDAR |
System for Electronic Document Analysis and Retrieval |
| SERNAP |
National Protected Areas Service (Servicio Nacional de Areas Protegidas) |
| SI units |
SI (Système International d’Unités) is a globally agreed system of units |
| Silver Sand |
Silver Sand Property |
| SIPX |
Sodium Isopropyl Xanthate |
| SMC |
SAG Mill Comminution |
| Sn |
Tin |
| SO2 |
Sulfur dioxide |
| SSE |
South-southeast |
| STU |
Special tax unit |
| SW |
South-west |
| t |
Tonne |
| t/m3 |
Tonne per cubic metre |
| t/op hr |
Tonnes per operating hour |
| TCLP |
Toxicity Characteristic Leaching Procedure |
| tpd |
Tonnes per day |
| tph |
Tonnes per hour |
| Trans. |
Transitional |
| TSF |
Tailings storage facility |
| UG |
Underground |
| UNDP |
United Nations Development Program |
| UPS |
Uninterruptible Power Supply |
| US |
United States |
| US$ |
United States dollar |
| US$/oz |
United States dollar per ounce |
| US$/t |
United States dollar per tonne |
| UTO |
Oruro Technical University |
| VAT |
Value-added tax |
| VGF |
Vibrating grizzly feeder |
| VRA |
Vertical rate of advance |
| VU |
Vulnerable |
| W |
West |
| W |
Tungsten |
| w/w |
Ratio of weight expressed as a percentage |
| Yr |
Year |
| Zn |
Zinc |
| Silver Sand Project Pre-Feasibility Study |
| | New Pacific Metals Corp. | 0723071 |
| 2.1 | General and terms of reference |
AMC Mining Consultants (Canada)
Ltd. (AMC Consultants) was commissioned by New Pacific Metals Corp. (New Pacific or the Company)
to prepare an independent Technical Report (2024 Technical Report) on the Silver Sand project (Property or Silver Sand) in the Potosí
Department, in the Plurinational State of Bolivia (Bolivia). In preparation of this report AMC Consultants collaborated with Halyard Inc.
and NewFields Canada Mining & Environment ULC. The 2024 Technical Report report provides the results of a Pre-Feasibility Study (PFS)
for the Property. The previous Technical Report on the Property titled “Silver Sand Deposit Preliminary Economic Assessment for
New Pacific Metals Corp. Potosí, Bolivia” (2022 Technical Report), has an effective date of 30 November 2022.
The 2024 Technical Report has been
prepared to a standard which is in accordance with the requirements of National Instrument 43-101, Standards of Disclosure for Mineral
Projects (NI 43-101), of the Canadian Securities Administrators (CSA) for lodgment on CSA’s System for Electronic Document Analysis
and Retrieval (SEDAR).
New Pacific is a corporation
incorporated under the laws of the province of British Columbia, Canada and is in the business of exploring and developing precious metal
mining properties in South America and Canada. Through its three wholly owned subsidiaries Minera Alcira Sociedad Anónima Alcira
S.A. (Alcira), Empresa Jisas – Jardan SRL, and Empresa El Cateador SRL, New Pacific collectively holds exploration and mining agreements
over an approximate 60 square kilometres (km2) contiguous area. The Silver Sand project
is located in Potosí Department, Bolivia.
New Pacific is listed on the TSX Exchange
(symbol NUAG) and the NYSE American (symbol NEWP).
The names and details of persons
who prepared, or who have assisted the Qualified Persons (QPs) in the preparation of this report, are listed in Table 2.1.
| Silver Sand Project Pre-Feasibility Study |
| | New Pacific Metals Corp. | 0723071 |
| Table 2.1 | Persons who prepared or contributed to this Technical
Report |
| Qualified
Persons responsible for the preparation of this Technical Report |
| Qualified
Person |
Position |
Employer |
Independent
of New Pacific |
Date
of last
site visit |
Professional
designation |
Sections
of
Report |
| Mr
E. Tucker |
Regional
Manager – Canada / Principal Mining Engineer |
AMC
Mining Consultants (Canada) Ltd. |
Yes |
No
visit |
P.Eng.
(BC) |
2-6,
20, 23, 24, Part of 1, 25, 26 |
| Ms
D. Nussipakynova |
Principal
Geologist |
BBA,
formerly with AMC Mining Consultants (Canada) Ltd. |
Yes |
28-29
May 2022 |
P.Geo.
(BC) |
7-12,
14, Part of 1, 25, 26, 27 |
| Mr
A. Holloway |
Process
Director |
Halyard
Inc. |
Yes |
14-16
Jan 2020 |
P.Eng.(ON) |
13,
17, 19, Part of 1, 21, 25, 26, 27 |
| Mr
W. Rogers |
Principal
Mining Engineer / Open Pit Manager |
AMC
Mining Consultants (Canada) Ltd. |
Yes |
4-5
May 2023 |
P.Eng.
(BC) |
15,
16, 22, Part of 1, 21, 25, 26, 27 |
| Mr
M. Molavi |
Principal
Mining Engineer |
AMC
Mining Consultants (Canada) Ltd. |
Yes |
No
visit |
P.Eng.
(BC) |
Part
of 1, 18, 25, 26 |
| Mr
L. Botham |
Principal
Engineer |
NewFields
Canada Mining & Environment ULC |
Yes |
No
visit |
P.Eng.
(SK) |
Part
of 1, 18, 21, 25, 26 |
| Other
Experts who assisted the Qualified Persons in the preparation of this Technical Report |
| Expert |
Position |
Employer |
Independent
of
New Pacific |
Visited
site |
Sections
of
Report |
| Mr
Y. (Alex) Zhang |
Vice
President, Exploration |
New
Pacific Metals Corp. |
No |
Yes,
multiple times |
1-11
and 23 |
| Mr
J. Zhang |
Manager,
Projects |
New
Pacific Metals Corp. |
No |
Yes |
All |
Mr
D. VanDoorselaere |
Vice
President, Operations |
New
Pacific Metals Corp. |
No |
Yes |
All |
| Mr
L. Kaufmann |
Senior
Mining Engineer |
AMC
Mining Consultants (Canada) Ltd. |
Yes |
No |
Part
of 1, 3, 15, 16, 18, 21, 22, 25, 26 |
| Mr
H. Orrego |
Senior
Mechanical Engineer |
AMC
Mining Consultants (Canada) Ltd. |
Yes |
Yes
(4-5 May 2023) |
18 |
| Ms
K. Zunica |
Senior
Geologist |
AMC
Consultants Pty Ltd |
Yes |
No |
11 |
Source: AMC
Mining Consultants (Canada) Ltd., 2024.
AMC Consultants acknowledges the
numerous contributions from New Pacific in the preparation of this report and is particularly appreciative of prompt and willing assistance
of Mr Alex Zhang and Mr Jason Zhang.
Ms Dinara Nussipakynova visited
the Property on 28-29 May 2022, while employed by AMC Mining Consultants Ltd. At the publication time of this report, she is employed
by BBA. All aspects of the project were examined, specifically drill core, drilling and core processing procedures, initial Quality Assurance
/ Quality Control (QA/QC) procedures, and database management. Mr Andrew Holloway of Halyard visited the Property in January 2020. All
aspects relating to surface infrastructure, plant location, drill core, and geometallurgical considerations were inspected at that time.
Mr Wayne Rogers and Mr Hector Orrego visited the Property on 4-5 May 2023, all aspects relating to mining and infrastructure were inspected
at that time.
| Silver Sand Project Pre-Feasibility Study |
| | New Pacific Metals Corp. | 0723071 |
| 2.4 | Sources of information |
In preparing this Report, the QPs
have relied on various geological maps, reports, and other technical information provided by New Pacific. AMC Consultants has reviewed
and analyzed the data provided and drawn its own conclusions augmented by its direct field observations. The key information used in this
report is listed in Section 27 References, at the end of this report.
New Pacific’s internal technical
information reviewed by the QPs was adequately documented, comprehensive and of good technical quality. It was gathered, prepared, and
compiled by competent technical persons. The QPs used their professional judgement and made recommendations in this report where it deems
further work is warranted.
This report includes the tabulation
of numerical data which involves a degree of rounding for the purpose of resource and reserve estimation. The QPs do not consider any
rounding of the numerical data to be material to the project.
All currency amounts and commodity
prices are stated in US dollars and any costs provided by New Pacific were in US dollars ($). Quantities are stated in metric (SI) units.
Commodity weights of measure are in grams (g) or percent (%) unless otherwise stated.
A draft of the report was provided
to New Pacific for checking for factual accuracy. The effective date of the report is 19 June 2024.
| Silver Sand Project Pre-Feasibility Study |
| | New Pacific Metals Corp. | 0723071 |
| 3 | Reliance
on other experts |
The QP has relied, in respect to
certain information concerning legal matters relevant to the Technical Report, upon the work of the Experts listed below. To the extent
permitted under NI 43-101, the QPs disclaim responsibility for the relevant section of the Report listed below:
| · | Experts: Mattias Garrón (Partner), PPO Law Offices, La Paz, Bolivia,
as advised in letters to New Pacific Metals Corp both with an effective date of 10 October 2022. |
| · | Report, opinion, or statement relied upon: Legal Opinion regarding the
Silver Sand project and re: Mining Productive Contract with Corporacion Minera de Bolivia (COMIBOL). |
| · | Extent of reliance: full reliance following a review by the QP. |
| · | Report, opinion, or statement relied upon: Bolivian regulatory framework
from Aguirre (2019) and Bufete Aguirre Soc. Civ. (2017). |
| · | Portion of Technical Report to which disclaimer applies: Section 4.2. |
| · | Portion of Technical Report to which disclaimer applies: Section 4.3. |
The QP has relied, in respect to
certain information concerning environmental and social aspects relevant to the Technical Report, upon the work of the Experts listed
below. This work has been summarized and provided by New Pacific. To the extent permitted under NI 43-101, the QPs disclaim responsibility
for the relevant sections of the Report listed below:
| · | Experts: Independent firm, Tierralta S.R.L. La Paz, Bolivia. |
| · | Report, opinion, or statement relied upon: Environmental
baseline information for the project from the Analytical Environmental Impact Assessment Study (EEIA-AI), 30 November 2022 (updated June
2024). |
| · | Extent of reliance: full reliance following a review by the QP. |
| · | Portion of Technical Report to which disclaimer applies: Sections 20.1 - 20.3.5. |
| · | Experts: Independent firm, Cumbre del Sajama S.A. |
| · | Report, opinion, or statement relied upon: Final Report
titled Socioeconomic Baseline, Risk Analysis and Community Relationship Recommendations for New Pacific Metals Corp - Silver Sands Project
in the Department of Potosi-Bolivia, May 2018 (updated June 2024). |
| · | Extent of reliance: full reliance following a review by the QP. |
| · | Portion of Technical Report to which disclaimer applies: Section 20.3.6. |
| · | Experts: Independent firm, CPM Investigación & Desarrollo, based
in La Paz, Bolivia. |
| · | Report,
opinion, or statement relied upon: Archaeological studies, report date 29 November 2022 (updated June
2024). |
| · | Extent of reliance: full reliance following a review by the QP. |
| · | Portion of Technical Report to which disclaimer applies: Section 20.3.7. |
The QP has relied, in respect to
certain information concerning tax matters relevant to the Technical Report, upon the work of the Experts listed below. To the extent
permitted under NI 43-101, the QPs disclaim responsibility for the relevant section of the Report listed below.
| · | Experts: PPO Legal & Tax Offices, Santa Cruz, Bolivia. |
| · | Report, opinion, or statement relied upon: Analysis of the Bolivian Mining
Surtax effective application, 8 August 2023. |
| · | Extent of reliance: full reliance following a review by the QP. |
| · | Portion of Technical Report to which disclaimer applies: Section 22.1. |
| Silver Sand Project Pre-Feasibility Study |
| | New Pacific Metals Corp. | 0723071 |
| 4 | Property
description and location |
The Property is situated in the
Colavi District of Potosí Department in south-western Bolivia, 33 kilometres (km) north-east of Potosí city, the department
capital. The approximate geographic centre of the Property is 19°22’ 4.97” S latitude and 65°31’ 22.93”
W longitude at an elevation of 4,072 metres above sea level (masl). The location of the Property is shown in Figure 4.1.
| Figure 4.1 | Location of Silver Sand Property |
Source: New Pacific Metals
Corp., 2022.
| 4.2 | Bolivian Regulatory framework |
The following section on the Bolivian
Regulatory framework borrows from Aguirre (2019) and Bufete Aguirre Soc. Civ. (2017).
Bolivia began opening the mining
industry to private investment in the 1980s. In 1997, a completely new Mining Code (the 1997 Code) governing most matters relating to
mining activities was enacted. The 1997 Code followed the concession system considering mining concessions as real estate property which
as such could be transferred, contributed to the capital of companies, mortgaged, bartered, sold, and subject to inheritance laws under
the Civil Code.
A new and complete Mining and Metallurgy
Law No 535 was introduced on 28 May 2014 (the 2014 Mining Law), to replace the 1997 Code. The 2014 Mining Law was modified by Law No.
845 of 24 October 2016 (the 2016 Mining Law) by the Bolivian Congress.
The 2014 and 2016 Mining Laws set out
rules in relation to:
| · | The procedures for the granting of new mining rights. |
| · | The procedures for a change from the old mining concession
system to the new system of Administrative Mining Contract (AMC) mandated by the new legislation based on the Constitution. |
| Silver Sand Project Pre-Feasibility Study |
| | New Pacific Metals Corp. | 0723071 |
| 4.2.2 | Exploration and mining rights |
Exploration and mining rights in
Bolivia are granted by the Ministry of Mines and Metallurgy through the Jurisdictional Mining Administrative Authority (Autoridad Jurisdiccional
Administrativa Minera; AJAM). Under the new Mining Laws, tenure is granted as either an AMC or an exploration license. Tenure held under
previous legislation was converted to Temporary Special Authorizations (ATEs), formerly known as “mining concessions”, under
the new Mining Laws. These ATEs are required to be consolidated to new 25-hectare sized cuadriculas (mining areas) and converted to AMCs,
under a process that is called “Adequation”. AMCs created by conversion recognize existing rights of exploration and / or exploitation
and development, including treatment, refining, and / or trading.
AMCs have a fixed term of 30 years
and can be extended for a further 30 years if certain conditions are met. Each contract requires ongoing work and the submission of work
and investment plans to AJAM.
Exploration licenses are valid for
a maximum of five years and provide the holder with the first right of refusal for an AMC.
In specific areas, mineral tenure
is owned by the Bolivian state mining corporation, COMIBOL. In these areas development and production agreements can be obtained by entering
into a Mining Production Contract (MPC) with COMIBOL.
| 4.2.3 | Environment protection |
Depending on the nature and scope
of the activities to be conducted, the operator may need specific licenses or dispensations from the environmental authorities under the
Ministry of Environment and Water or the Departmental Governorships. This applies to projects that may require consultation with a population
that could be affected by the project.
The main law governing environmental
protection, in general, is Law 1333 of 27 April 1992, which is regulated by various Supreme Decrees of the Executive Branch. The special
Decree containing the mining rules is of primary importance. Strict parameters must be followed for the protection of the environment.
Breach of environmental obligations may even trigger criminal liabilities under the Constitution.
Licenses must be updated depending
on the changes triggered by the ongoing activities and operations. An Environmental Impact Assessment (EEIA) is normally required to obtain
the appropriate license. Specialized environmental authorities follow up and control compliance. As required under the licenses, any impact
on the environment must be notified to the authorities. Remediation measures and rehabilitation projects are compulsory. For mine closure,
the operator must create a financial reserve that is maintained on an annual basis. A final closure study on the effect on the environment
would be required in due time. Under a special law known as the “Mother Earth Law”, a certain requirement of restitution must
be met.
New Pacific’s Silver
Sand Property encompasses a combination of 100% owned mining areas (AMCs by conversion) and an MPC with COMIBOL which gives the Company
access to approximately 60 km2, in this emerging silver district.
| Silver Sand Project Pre-Feasibility Study |
| | New Pacific Metals Corp. | 0723071 |
| Figure 4.2 | Mining areas and MPC |
Notes:
MPC Area = Mining Production Contract with the Bolivian Mining Corporation, New Pacific
Property has 100% mineral tenure ownership.
Source: New Pacific Metals Corp., 2024.
| Silver Sand Project Pre-Feasibility Study |
| | New Pacific Metals Corp. | 0723071 |
| 4.3.2 | 100% owned New Pacific tenure |
The Property originally
comprised 17 ATEs, now converted to a consolidated AMC covering an area of 3.1656 km2.
These ATEs were acquired by New Pacific in its original purchase of the interests of Alcira, now New Pacific’s wholly-owned subsidiary.
They are valid for 30 years from the date of registration of the AMC (February 2020) and can be extended for an additional 30 years.
In accordance with the 2014 and
2016 Mining Laws, New Pacific (through Alcira) submitted to AJAM, all required documents for the consolidation and conversion of the original
17 ATEs, which comprise the core of the Silver Sand project, to cuadriculas and AMCs. The conversion was initially approved by AJAM in
February 2018. On 6 January 2020, Alcira signed an AMC with AJAM pursuant to which the 17 ATEs were consolidated into one mining area
named as Arena De Plata (Silver Sand) with an area of 3.1656 km2. This AMC was registered with the
mining register on 14 February 2020, mining registration number 1-05-1500055-0001-21, the notary process was completed, and registration
was published in the mining gazette on 15 July 2021.
In addition, New Pacific acquired
100% interest in three continuous concessions consisting of ATEs called Jisas, Jardan, and El Bronce originally owned by third-party private
entities. These three ATE’s, were converted to AMCs, totalling 2.25 km2. The Jisas and Jardan concessions
were acquired in July 2018 and are held through 100% owned subsidiary Jisasjardan SRL. The Bronce concession was acquired in late 2019
and is held through 100% owned subsidiary Empresa Minera Cateador SRL.
The total area of AMCs under full
control of the Company is 5.42 km2. This conversion process has already been completed for all areas.
Table 4.1 summarizes New Pacific’s
Silver Sand Mineral Tenure held on a 100% basis. All mining areas are valid for 30 years of the signing of an Administrative
Resolution.
| Table 4.1 | Mineral tenure controlled
by New Pacific |
| Mining
Area ID |
Mining
registry |
Name |
Concession
type |
Size
in
hectares |
Title
holder |
Expiry
date |
| 1500055 |
1-05-1500055-
0001-21 |
Arena
De Plata |
AMC |
316.56 |
Minera
Alcira SA |
14
February 2050 |
| 1500410 |
1-05-1500410-
0094-22 |
Jisasjardan |
AMC |
175 |
Jisasjardan
SRL |
04
December 2050 |
| 1501194 |
1-05-1501194-
0093-22 |
Bronce |
AMC |
50 |
Empresa
Minera Cateador SRL |
15
January 2051 |
| |
Total |
541.56 |
|
|
Source: New Pacific Metals Corp., 2024.
| 4.3.3 | Mining production contract |
New Pacific, through Alcira, entered
into a Mining Production Contract (MPC) with COMIBOL on 11 January 2019 and an updated MPC was entered with COMIBOL on 19 January 2022
which covers 12 ATEs and 196 cuadriculas for an area of approximately 55 km2 that surround and overlap
the Silver Sand core area. The Company continues to engage with COMIBOL, to obtain the ratification and approval of the signed MPC at
the Silver Sand project by the Plurinational Legislative Assembly of Bolivia. The Company and COMIBOL have refined the MPC workplan to
concentrate exclusively on claims immediately adjacent to the Silver Sand project boundary. This streamlined landholding, while maintaining
the core value of the MPC to the Silver Sand project, is anticipated to facilitate progress towards ratification and approval of the MPC.
For COMIBOL to obtain mining rights over such areas, AJAM will have to grant them by way of AMCs or Exploration Licenses in accordance
| Silver Sand Project Pre-Feasibility Study |
| | New Pacific Metals Corp. | 0723071 |
with Bolivian mining laws. In addition,
the MPC must be ratified by the Congress of Bolivia (Congress) to be valid and enforceable.
Once the MPC has been ratified
by Congress, the MPC with COMIBOL will be valid for 15 years which may be automatically renewed for an additional 15-year term and potentially,
subject to submission of an acceptable work plan, for an additional 15-year term for a total of 45 years. According to the terms of the
MPC, the Company has a minimum investment commitment of $6 million (M) during the first four years of exploration. The Company will pay
COMIBOL a 6% gross sales value of the ore processed from the mining areas covered by the MPC when they are commercially exploited at a
future date.
As of the date of this Technical
Report, the MPC has not been ratified nor approved by the Plurinational Legislative Assembly of Bolivia. The Company cautions that there
is no assurance that the Company will be successful in obtaining ratification of the MPC in a timely manner or at all, or that the ratification
of the MPC will be obtained on reasonable terms.
New Pacific has successfully obtained
environment permits from local authorities to conduct mineral exploration and drilling activities in the mineral concessions fully owned
by the Company.
The Company is progressing with
community engagement and securing surface rights for its project in Bolivia, but faces disruptions from illegal artisanal and small-scale
miners (“ASMs”) whose activities conflict with project development. Legal proceedings and government support are underway to
resolve the issue, with the Company optimistic about a favorable outcome that aligns with community and governmental interests. Regarding
the extent of the impact of the illegal ASM activities on the Project’s Mineral Resources, the Company believes the mineralized
material extracted is not significant.
In order to obtain the environmental
license to start the development and operation of the Project, on 25 May 2023, the Ministry of Environment and Water categorized the Project
as Category 1, meaning the Company must present a Comprehensive Analytical Environmental Impact Assessment Study (EEIA-AI) in a period
of 12 months from the date of Categorization, which includes a Public Consultation with local communities. On 7 June 2024, the company
received a six-month extension, for the presentation of the EEIA-IA, valid until the 25 November 2024. The Company is working on environmental
and social baseline studies to prepare for the public consultation. If the company does not submit the EEIA-IA by 25 November 2024, then
it must reapply for a new Categorization.
AJAM employs a special tax unit
(STU), that is indexed to the “Unidad de Fomento a la Vivienda”, to calculate the annual fee (“patente”) which
holders of mining areas must pay to the government. In 2024, each STU was equivalent to 2.51 Bolivianos and depending on the type and
size of mineral concessions, the number of STUs varies between 404 and 746 STUs per Cuadricula. Note that the STU increases slightly each
year.
Table 4.2 below provides details
of fees paid to the government in 2024. For the mining areas covered by the MPC with COMIBOL, the Company does not have to pay any fees
to the government as they are nationalized concessions. According to the terms of MPC, the Company will have to pay the annual fees to
the government when COMIBOL is granted mineral concessions by AJAM. In addition, the Company will pay COMIBOL a management fee of $10,000
per month for all the concessions covered by the MPC upon ratification during the exploration phase, for a total amount of $240,000.
| Silver Sand Project Pre-Feasibility Study |
| | New Pacific Metals Corp. | 0723071 |
| Table 4.2 | Fees paid to government in 2024 |
| Concessions |
Title holder |
Fees (BOB) |
| Arena de plata |
Minera Alcira Sociedad Anonima “Alcira” S.A. |
12,586 |
| Bronce |
Empresa El Cateador SRL |
1,988 |
| Jisasjardan |
Empresa Jisas – Jardan SRL |
6,958 |
| Total BOB |
|
21,532 |
| Equivalent to US$ |
|
3,093 |
Notes: The fees are
in local currency, Bolivian Boliviano (BOB).
Source: New Pacific Metals Corp., 2024.
As per the 2014 Mining Law, holders
of mining rights may obtain surface rights (i) through administrative agreements entered into with AJAM. In addition, surface rights may
be obtained on third-party contract areas and by neighbouring properties by the following means:
| i. | Agreement between parties; |
| ii. | Payment of compensation; and |
| iii. | Compliance with the regulations and procedures for authorization. |
Once surface rights are obtained,
holders of mining rights may build treatment plants, dams and tailings, infrastructure, and other infrastructure necessary to carry out
mining activities. New Pacific has not yet obtained surface land rights.
| 4.7 | Royalties and encumbrances |
For the MPC, if commercial production
commences, “COMIBOL will receive six percent (6%) of the gross sales value of the minerals obtained from the mining activities”.
AMCs are subject to the following royalties
and duties:
| · | Mining royalty: The royalty is applicable to all mining
actors and applies to the exploitation, concentration and / or commercialization of mineral and metals non-renewable resources at the
time of their internal sale or export pursuant to the 2014 Mining Law. The royalty is established according to the status of the mineral
(raw, refined, etc.), on whether the mineral will be exported, and international mineral prices. The royalty applicable to silver pre-
concentrates, concentrates, complexes, precipitates, bullion or molten bar and refined ingot is as shown in Table 4.3. |
| Table 4.3 | Royalty applicable to silver in the AMC |
| Official silver price per troy ounce ($) |
% |
| Greater than $8.00 |
6 |
| From $4.00 to $8.00 |
0.75 * official silver price |
| Less than $4.00 |
3 |
Source: New Pacific Metals
Corp., 2024.
| · | Mining Patent: This is a requirement for the mining
operator to continue holding mining rights over the mining area. Patents are calculated according to the size of the area under the exploration
license or contract, as set out in the 2014 Mining Law. Failure to pay for the patents will trigger the loss of the underlying exploration
or mining rights. |
| Silver Sand Project Pre-Feasibility Study |
| | New Pacific Metals Corp. | 0723071 |
With the exception of political
risk discussed in Section 14.1 and the need for final execution of some land agreements, AMC Consultants is not aware of other significant
factors and risks that may affect access, title, or right to perform work on the Property.
| Silver Sand Project Pre-Feasibility Study |
| | New Pacific Metals Corp. | 0723071 |
| 5 | Accessibility, climate, local resources,
infrastructure, and physiography |
The Property is located approximately
36 km north-east of the Cerro Rico de Potosí silver and base metal mine, 46 km south-west of the city of Sucre, and 33 km north-west
of city of Potosí. The Property is accessed from Sucre and Potosí by travelling along a paved highway to the community of
Don Diego, and then north from Don Diego along a 27 km, maintained, all-weather gravel road. The gravel road is being upgraded to paved
road by Bolivian Government. Don Diego is accessed by driving 129 km to south-west from Sucre, or 29 km to the north-east from Potosí
along paved Highway 5. Key roads and locations are shown in Table 4.1.
Sucre has a population of 296,305
(worldpopulationreview.com) and is the constitutional capital of Bolivia and the capital city of Chuquisaca department (a department is
the largest administrative division in Bolivia). Potosí has a population of 236,070 (worldpopulationreview.com) and is the capital
city of Potosí department. Sucre is connected to major Bolivian cities and beyond by highways and commercial air flights. From
Potosí, the Pan American highway provides access to La Paz, the capital city of Bolivia. Chilean port cities of Arica and Iquique
can be accessed from Potosí via all-weather roads.
Figure
5.1 shows the administrative location of and transportation access to the Property.
| Figure 5.1 | Administrative location and
transportation access of Silver Sand Property |
Source: Provided by New Pacific 2019 adapted from Geology.com.
| Silver Sand Project Pre-Feasibility Study |
| | New Pacific Metals Corp. | 0723071 |
Bolivia is divided into five north-west-trending
physiographic zones as shown in Figure 5.2. These include, from west to east; the Western Cordillera (or Cordillera Occidental), the Altiplano,
the Eastern Cordillera (or Cordillera Oriental), the Sub-Andean, and the Amazon Basin to the east.
| Figure 5.2 | Physiographic
zones of Bolivia |
Notes: Amazon Basin = green, Sub-Andean
= red, Eastern Cordillera = white, Altiplano = gray, Western Cordillera = white. Red outlines represent country borders.
Source: New Pacific, 2019 - Adapted from Wikipedia:
Geography of Bolivia.
The Property is situated approximately
within the central section of the Eastern Cordillera zone and consists of rolling hills with elevation ranging from 3,900 to 4,100 masl.
| Silver Sand Project Pre-Feasibility Study |
| | New Pacific Metals Corp. | 0723071 |
| 5.3 | Climate and vegetation |
Due to the high elevation, the Property
area has a cold, semi-arid desert climate despite the region’s location approximately 19 degrees south of the equator. Vegetation
on the Property is poorly developed and mainly consists of sparsely scattered low grasses and shrubs. In valleys below 4,000 m elevation,
some eucalyptus trees are grown. Animals such as alpacas, llamas, vicunas, and guanacos are common in the Cordillera Oriental and the
local peoples herd llamas and alpacas for food and wool.
Figure
5.3 shows a climate map of Bolivia and Figure 5.4 shows a vegetation map of Bolivia.
| Figure 5.3 | Climate map of Bolivia |
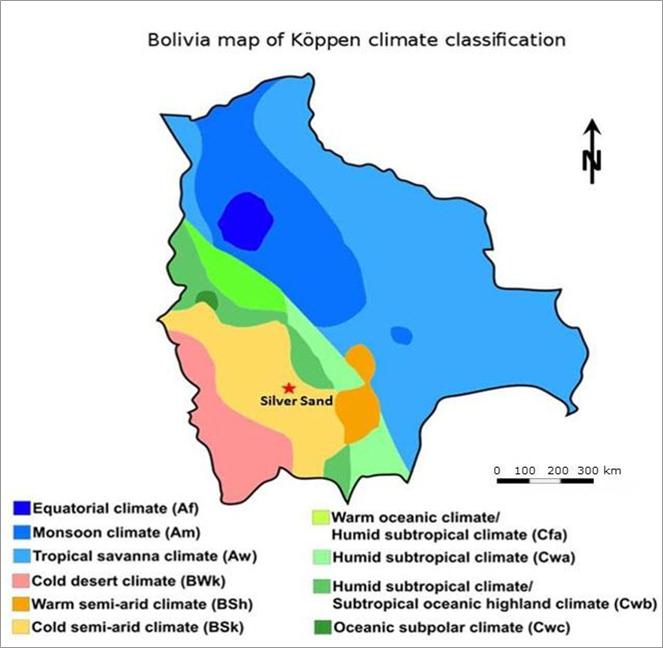
Source: World Köppen Classification. Enhanced,
modified, and vectorized by Ali Zifan, 20 February 2016.
| Silver Sand Project Pre-Feasibility Study |
| | New Pacific Metals Corp. | 0723071 |
| Figure 5.4 | Vegetation map of Bolivia |
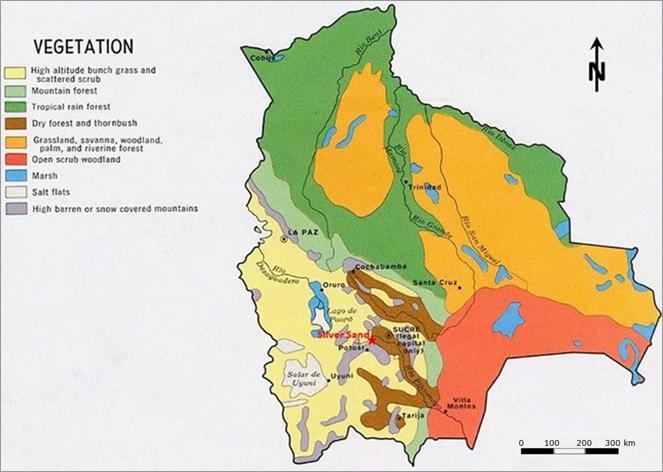
Source: U.S. Central Intelligence
Agency, 1971.
Temperatures on the Property are
relatively constant year-round with daily maximums between 14.8°Celsius (C) and 20.5°C. Minimum temperatures range between -5.6°C
and 5.1°C. Minimum temperatures are typically below freezing between May and September.
The region experiences a rainy
season in the warmer summer months from December to ~mid-April which contributes approximately 80% of the average annual precipitation
of 393 millimetres (mm). The driest period is from May to August with very little precipitation.
None of these climate factors preclude
operations from being conducted on a year-round basis.
Table 5.1 shows the annual weather averages in the Potosí area.
| Table 5.1 | Annual weather averages in Potosí
area |
| |
Jan |
Feb |
Mar |
Apr |
May |
Jun |
Jul |
Aug |
Sep |
Oct |
Nov |
Dec |
| Avg. temperature (°C) |
10.6 |
10.9 |
10.6 |
8.4 |
8 |
4.6 |
5.4 |
6.6 |
8.5 |
11 |
12.4 |
11.9 |
| Min. temperature (°C) |
4.1 |
4.6 |
4.1 |
0.3 |
-1.2 |
-5.6 |
-4.6 |
-3.1 |
-0.6 |
2 |
4.3 |
5.1 |
| Max. temperature (°C) |
17.2 |
17.2 |
17.2 |
16.5 |
17.2 |
14.8 |
15.5 |
16.4 |
17.6 |
20.1 |
20.5 |
18.7 |
| Precipitation (mm) |
102 |
79 |
50 |
13 |
3 |
2 |
0 |
3 |
9 |
21 |
34 |
77 |
Source: Data adapted from
www.climate-data.org.
| Silver Sand Project Pre-Feasibility Study |
| | New Pacific Metals Corp. | 0723071 |
| 5.4 | Local resources and infrastructure |
Intensive mining for silver, tin,
lead, and zinc has occurred in various locations around the city of Potosí ever since the discovery of the large silver deposit
Cerro Rico de Potosí (the Rich Hill) in 1545. As a result, many residents of Potosí are employed in mines or mining-related
businesses, providing a potential source of workers and services that may be needed at the Property.
A high voltage power line services
the adjacent Canutillos mine to the west, and the Colavi mine north-west of the Property. Both Canutillos and Colavi mines are adjacent
to the Silver Sand Property boundary and are discussed in Section 18.
Water has not been a
concern at the Property, though the greater Potosí area has experienced a drought in recent years. Water for domestic use can
be obtained from a small lake, approximately 3.5 km north-west of the Property. Water for drilling can be sourced from nearby
drainages. The previous owner, Ningde Jungie Mining Industry Co. Ltd. (NJ Mining) recorded groundwater at the Property. New Pacific
have carried out some hydrological and hydrogeological work conceptual nature in 2022, and three piezometers were installed in
October 2022. Desktop hydrological and hydrogeological work has been conducted in 2023 and 2024 to support the PFS. Additional work
is required to determine whether there is sufficient water present to supply future production scenarios.
There is currently no infrastructure
on site. The core processing facility is located at Betanzos, a town situated at a lower elevation where the project office is also located.
Betanzos is approximately a 1.5-hour drive to the south of the Property.
Potential tailings storage and waste
disposal areas, and potential processing plant sites are discussed in Section 18.
| Silver Sand Project Pre-Feasibility Study |
| | New Pacific Metals Corp. | 0723071 |
Modern exploration on the Property
commenced in 2009. The project history has been compiled from Birak (2017), Redwood (2018), Sugaki et al. (1983), and New Pacific (2017).
In 2009, NJ Mining purchased Alcira,
owner of the Silver Sand project, from Empresa Minera Tirex Ltda, a private Bolivia mining company. New Pacific entered into an agreement
to acquire Alcira from NJ Mining, pursuant to the terms announced on 10 April 2017. The acquisition was finalized on the 20 July 2017.
New Pacific subsequently acquired
100% of the interests of a local private company who owns the mineral rights of two additional concessions (Jisas and Jardan) in July
2018. No exploration work was completed on the two concessions.
In December 2019, New Pacific acquired
100% of the interests of Empresa El Cateador SRL, a local private company which owns the mineral rights to a single ATE (El Bronce) located
to the north of the Property. No exploration work was ever completed on this concession.
In January 2022, an updated MPC
was signed between New Pacific’s subsidiary Alcira and COMIBOL securing access to an additional 55 km2
of prospective property surrounding the original Silver Sand concessions.
Mining activity has been
carried out on the Silver Sand Property and adjacent areas by various operators intermittently since the early 16th
century. There are widespread small mine workings and numerous abandoned miners’ villages on the Property. Machacamarca,
a historic silver mine on the Property, was mined from colonial times until the price declined in about 1890. Since then, local mining
activities have focused on tin mineralization at the adjacent Colavi and Canutillos mines.
Historical mining activities on
the Property mainly targeted high-grade vein structures.
Records of historical mine production are not available.
Despite the long history of mining
on the Silver Sand Property and its adjacent areas, there has been little modern systematic exploration work recorded prior to 2009. The
only documented exploration campaign was completed by NJ Mining between 2009 and 2015.
NJ Mining carried out a comprehensive
exploration program across the Property. Exploration work comprised geological mapping, surface and underground sampling, trenching, and
drilling as shown in Table 6.1. All exploration samples were analyzed at NJ Mining’s laboratory facilities near Potosí, Bolivia
for silver and, in some cases, tin.
| Silver Sand Project Pre-Feasibility Study |
| | New Pacific Metals Corp. | 0723071 |
| Table 6.1 | Exploration work completed by NJ Mining from 2009 to
2015 |
| Type of exploration |
Work completed |
| 1:5,000 geological mapping |
3.15 km2 |
| 1:1,000 geological traverse surveying |
7,272 m in 15 NE-SW exploration lines |
| Topographic survey |
Eight survey points |
| Mapping historic workings |
208 m |
| Diamond core drilling and logging |
2,334 m in 8 holes |
| Trenching |
40 m |
| Reconnaissance mapping |
292 points |
| Reconnaissance sampling |
1,202 samples |
| Mineralogy and lithology identification |
19 thin sections |
| Petrography study |
Nine thin sections |
| Channel sampling |
1,628 m with 546 samples |
| Core sampling |
504 samples |
| Specific gravity measurement |
31 samples |
| QA/QC |
215 samples |
Source: New Pacific Metals
Corp, 2022.
Six silicified mineralization zones
(Zones I, II, III, IV, IX, and X) were defined from results of the exploration program. This mineralization was defined over an area 1,500
m in length and up to 125 m in width as shown in Figure 6.1.
| Silver Sand Project Pre-Feasibility Study |
| | New Pacific Metals Corp. | 0723071 |
| Figure 6.1 | Mineralization zones defined in previous exploration
programs |
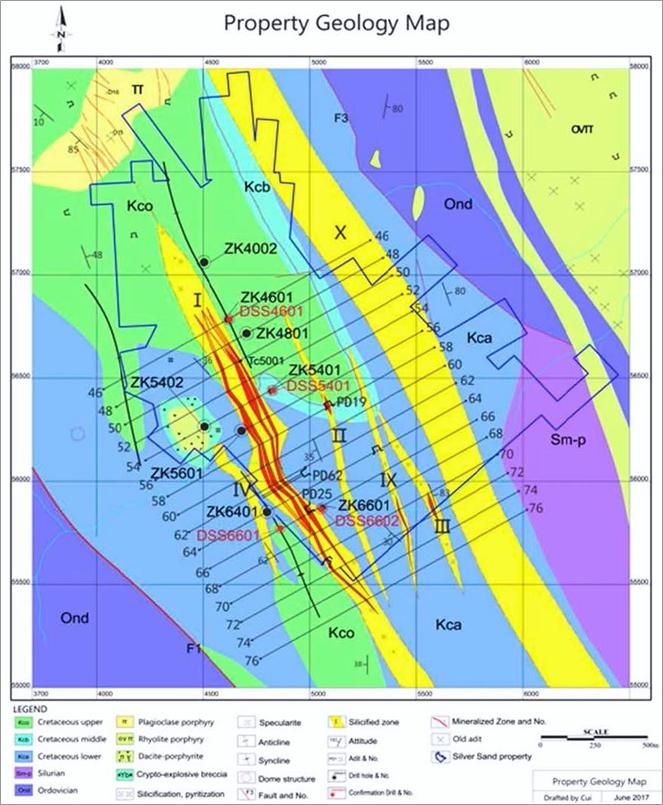
Source: New Pacific, 2019 adapted from Birak,
2017.
| Silver Sand Project Pre-Feasibility Study |
| | New Pacific Metals Corp. | 0723071 |
| 6.3.1 | Surface and underground channel sampling |
NJ Mining collected channel samples
from both surface outcrop and abandoned underground workings. Surface channel samples were completed along 100 m spaced, south-west trending
exploration lines (sections). They were designed to target north-west trending mineralization zones. Surface and underground samples were
collected between Lines 76 and 50 over a strike length of 1,300 m Section lines are shown in Figure 6.1.
Both surface and underground channel
samples were taken from a 10 centimetre (cm) wide, 2 - 3 cm deep channel cut horizontally into rock with a diamond saw. Individual samples
represented 1 to 2.5 m along the channel. An example of sampling channels from Zone 1 is shown in Figure 6.2.
| Figure 6.2 | Historical channel sampling from Zone I, Silver Sand
Property |
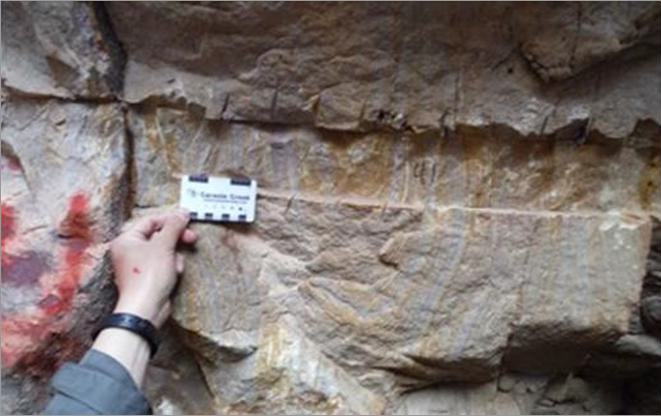
Source: New Pacific Metals
Corp, 2019.
Significant results from channel sampling
are presented in Table 6.2.
| Silver Sand Project Pre-Feasibility Study |
| | New Pacific Metals Corp. | 0723071 |
| Table 6.2 | Selected result of historical surface channel sampling program |
Section
number* |
Sample
location |
Zone
intersected |
Interval
(m) |
Average silver
grade (g/t) |
Number of
samples |
| 50 |
Surface |
Zone I |
62.7 |
174 |
31 |
| 54 |
Surface |
Zone I |
112 |
127 |
59 |
| 58 |
Surface |
Zone I |
83 |
93 |
44 |
| Underground |
Zone II |
21.4 |
263 |
10 |
| 62 |
Surface |
Zone I |
90.7 |
233 |
48 |
| Underground |
Zone I |
72.1 |
207 |
36 |
| 66 |
Surface |
Zone I |
71.9 |
145 |
38 |
| 70 |
Surface |
Zone I |
33.8 |
131 |
18 |
| Surface |
Zone II |
6.7 |
141 |
4 |
| 72 |
Surface |
Zone III |
16.9 |
198 |
9 |
Note: *Locations of
exploration lines (sections) are shown in Table 6.2.
Source: New Pacific Metals Corp, 2022.
NJ Mining conducted two test drill
programs consisting of a total of eight diamond holes to evaluate the spatial extensions of the mineralization zones defined at the surface.
Table 6.3 shows a summary of the 2012 and 2015 drilling programs completed by NJ Mining.
| Table 6.3 | Summary of
previous drilling programs |
Year |
Drillhole
ID |
Collar
location (UTM) |
Collar
elevation
(m) |
Length
(m) |
Azimuth
(degree) |
Dip
angle
(degree) |
| Easting |
Northing |
|
2012 |
ZK5601 |
234,681.33 |
7,856,244.63 |
3,962.40 |
242 |
61 |
-76 |
| ZK6401 |
234,808.24 |
7,855,854.01 |
4,005.90 |
314.5 |
64 |
-73 |
| ZK4002 |
234,504.00 |
7,857,063.00 |
4,092.00 |
155.3 |
0 |
-90 |
| ZK4801 |
234,708.00 |
7,856,719.00 |
4,052.00 |
64.8 |
0 |
-90 |
| Subtotal = 776.6 m |
|
2015 |
ZK4601 |
234,617.28 |
7,856,785.18 |
4,094.90 |
313.1 |
241 |
-76 |
| ZK5401 |
234,824.67 |
7,856,443.33 |
4,063.80 |
413.7 |
243 |
-75 |
| ZK5402 |
234,510.12 |
7,856,267.07 |
3,991.10 |
546.6 |
0 |
-90 |
| ZK6601 |
235,057.10 |
7,855,869.01 |
3,926.00 |
284.3 |
258 |
-76 |
| Subtotal = 1,557.7 m |
| Total = 2,334.3 m |
Source: New Pacific Metals
Corp, 2022.
In 2012, two short, vertical diamond
drillholes ZK4002 and ZK4801, targeting the shallow dipping tin mineralization were drilled from the hanging wall of Zone I but did not
intersect silver mineralization. Two angled holes ZK5601 and ZK6401 drilled in the same period but in the footwall of Zone I also did
not intercept silver mineralization.
Four holes were drilled in 2015.
Three angled holes ZK4601, ZK5401, and ZK6601 drilled from the hanging wall of Zone I mineralization intersected significant silver mineralization.
One vertical hole ZK5402 collared in the footwall missed the silver mineralization zones. The mineralization intersections from the three
historical drillholes are listed in Table 6.4.
| Silver Sand Project Pre-Feasibility Study |
| | New Pacific Metals Corp. | 0723071 |
| Table 6.4 | Results of historical drill
intersections |
Hole
number |
Section
number |
Average
sample
length
(m) |
Mineralized
interval |
| From (m) |
To (m) |
Length (m) |
Ag (g/t) |
|
ZK4601 |
46 |
1.28 |
83.3 |
85.6 |
2.3 |
60 |
| |
122 |
277.2 |
155.2 |
179 |
| Incl. |
122 |
145.4 |
23.4 |
261 |
| Incl. |
170.9 |
231.3 |
60.4 |
266 |
| Incl. |
258.6 |
277.2 |
18.6 |
290 |
|
ZK5401 |
54 |
1.27 |
151.1 |
346.4 |
195.3 |
168 |
| Incl. |
151.1 |
177.9 |
26.8 |
302 |
| Incl. |
195.2 |
249.5 |
54.3 |
303 |
| Incl. |
304 |
321.7 |
17.7 |
284 |
| Incl. |
336.4 |
346.4 |
10 |
321 |
|
ZK6601 |
66 |
1.33 |
51.9 |
243.2 |
191.3 |
246 |
| Incl. |
51.9 |
108.1 |
56.2 |
329 |
| Incl. |
132.1 |
182.6 |
50.5 |
316 |
| Incl. |
200.3 |
243.2 |
42.9 |
283 |
Source: New Pacific Metals Corp, 2022.
| 6.4 | Historical Resource and Reserve estimate |
There are no known historical estimates of Mineral Resources
or Mineral Reserves at the Property.
There has been no documented production from the Property.
| Silver Sand Project Pre-Feasibility Study |
| | New Pacific Metals Corp. | 0723071 |
| 7 | Geological setting and mineralization |
| 7.1 | Regional geology and metallogeny |
| 7.1.1 | Geotectonic framework of Bolivia |
The regional geological and tectonic
framework of Bolivia can be divided into six geotectonic belts. From east to west these comprise: the Precambrian Shield, the Chaco-Beni
Plains, the Subandean Zone, the Eastern Cordillera, the Altiplano, and the Western Cordillera. These are shown in Figure
7.1.
Four of these geotectonic belts
form part of the Central Andes and are discussed in more detail below.
| Figure 7.1 | Bolivian
geotectonic framework |
Source: New Pacific Metals Corp., 2019.
Adapted from Arce-Burgoa and Goldfarb, 2009.
| Silver Sand Project Pre-Feasibility Study |
| | New Pacific Metals Corp. | 0723071 |
| 7.1.2 | Geology of Central Andes |
The Bolivian Central Andes comprise
the four western geotectonic belts (Arce-Burgoa and Goldfarb, 2009). These belts were configured by the Mesozoic-Cenozoic orogeny as a
result of persistent compressive deformation from the subduction of the oceanic Nazca plate beneath the South American plate since the
Cretaceous period. The geology of these major belts is described herein from east to west.
The Subandean Belt is a series of
north- and north-west-trending mountain ranges with elevations ranging from 500 to 2,000 masl. The bedrock of the Subandean belt consists
of Paleozoic marine siliciclastic sedimentary rocks and Mesozoic and Tertiary continental sedimentary rocks.
| 7.1.2.2 | Eastern Cordillera Belt |
The Eastern Cordillera (Cordillera
Oriental) comprises a series of mountain chains that attain elevations over 4,000 masl. The bedrock of the Eastern Cordillera is comprised
of up to 10 km thick, intensively deformed sequences of Paleozoic marine clastic sedimentary rocks and thinner (<3 km), less-deformed
Cretaceous and Cenozoic continental sedimentary rock sequences. Granodiorite and adamellite (quartz monzonite) plutonic rocks occur as
batholiths and laccoliths in the northern part of the Eastern Cordillera. Permian to Triassic igneous rocks found in the middle and southern
parts of the cordillera are mainly hypabyssal and volcanic rocks occurring as stocks and volcanic necks that intruded the Paleozoic sedimentary
sequences. Tertiary andesitic volcanic rocks and related hypabyssal rocks associated with the Andean orogenic movement are seen along
the western portion of the Eastern Cordillera.
The Altiplano Belt is a 130 km
wide series of intermontane, continental basins forming a high plateau at elevations between 3,600 and 4,100 masl (Arce-Burgoa and Goldfarb,
2009). The Altiplano Belt comprises a Proterozoic to Paleozoic basement which is covered by vast volcanic rocks and continental sediments.
Miocene-aged andesitic volcanic rocks occur in the southern portion of the belt. Miocene to Pliocene rhyolitic pyroclastic rocks occur
in the northern part of the belt. Continental sediments have been deposited from Cretaceous to recent times.
| 7.1.2.4 | Western Cordillera Belt |
The Western Cordillera (Cordillera
Occidental) is an active volcanic mountain chain consisting of spaced Miocene and Quaternary andesitic volcanoes and small volcanic centers
that have erupted through a sequence of Cenozoic and Cretaceous rocks. Volcanic cones rise over 2,000 m above the general land surface,
reaching elevations above 6,000 masl (Lamb et al., 1997).
The Western Cordillera is extensively
covered by Miocene to recent volcanic rocks erupted along the uplifting axis in the north-south direction. Continental sediments lie between
the volcanic bodies.
| 7.1.3 | Regional metallogeny of Central Andes |
The Bolivian Central Andes is characterized
by a diverse series of deposits and metallogenic belts as shown in Figure 7.2. These include the Miocene
to Pliocene red-bed copper deposits, epithermal Ag-Au-Pb-Zn-Cu deposits in the Altiplano and Western Cordillera, the Mesozoic and Cenozoic
Tin Belt, the Paleozoic gold antimony belt, and the lead-zinc belt in the Eastern Cordillera (Arce-Burgoa and Goldfarb, 2009).
| Silver Sand Project Pre-Feasibility Study |
| | New Pacific Metals Corp. | 0723071 |
| Figure 7.2 | Bolivian
metallogenic belts |
Source: New Pacific Metals
Corp., 2022. Adapted from Arce-Burgoa and Goldfarb, 2009.
The Bolivian Silver-Tin Belt is
a 900 km long, north-west to north-south trending belt containing significant deposits of tin, silver, and tungsten related to orogenic
and magmatic processes which occurred between the late Paleozoic and late Tertiary. Pluton related Sb-W mineralization occurs within Triassic-Jurassic
and Miocene aged rocks in the northern portion of the belt. Pluton related Sn-W and volcanic rock associated Sn-Ag-Pb-Zn mineralization
occur within Miocene to Pliocene aged rocks in the central and southern portion of the belt (Rivas, 1979).
Deposits of the tin belt can be divided into four groups
(Arce-Burgoa and Goldfarb, 2009):
| 1 | Porphyry-associated tin deposits. |
| 2 | Volcanic rock-associated Sn-Ag-Pb-Zn deposits which include bonanza-type Ag and Sn. |
| 3 | Sedimentary rock-hosted Sn-Ag-Pb-Zn deposits. |
| 4 | Distinct pluton-related Sn-Au-W-Zn deposits. |
Groups 2 and 3 are collectively defined as Bolivian polymetallic
vein deposits which are mainly located in the southern half of the Bolivian Tin Belt (Arce-Burgoa and Goldfarb, 2009).
Bolivian polymetallic vein-type
ore deposits are genetically related to Miocene and Pliocene subvolcanic intrusions. Mineralization occurs as veins, veinlet, stockwork,
and disseminated ores hosted in Paleozoic and Mesozoic sedimentary rocks, Cenozoic volcanic rocks, and Paleozoic to Mesozoic plutons.
The shallower erosion levels in the southern part of the belt results in the partial preservation of the upper silver-rich parts of deposits.
| Silver Sand Project Pre-Feasibility Study |
| | New Pacific Metals Corp. | 0723071 |
Two world-class silver and tin deposits,
the Cerro Rico de Potosí deposit, considered to be the largest silver deposit in the world, and the Llallagua deposit, considered
to be the largest vein-type tin deposit discovered to date, both belong to the Bolivian polymetallic vein type. The Silver Sand Property
is located about 35 km north-east of the Cerro Rico de Potosí deposit and 150 km south-east of the Llallagua deposit within the
same tin metallogenic belt. Figure 7.3 shows the major deposits in the Bolivian Tin Belt.
| Figure 7.3 | Major deposits
in the Bolivian Tin Belt |
Source: New Pacific Metals
Corp., 2022. Adapted from Dietrich et al., 2000.
| 7.2 | Geological setting and mineralization |
The Property is located in the
polymetallic tin belt in the Eastern Cordillera. Evidence of historical mining activities such as abandoned mining adits and mining villages
can be seen across the Property. The oldest rocks observed within the Property comprise Ordovician to Silurian marine, clastic sediments
which have been intensely folded and faulted.
| Silver Sand Project Pre-Feasibility Study |
| | New Pacific Metals Corp. | 0723071 |
The Paleozoic basement is unconformably
overlain by weakly deformed, lower Cretaceous continental sandstone, siltstone, and mudstone. These Mesozoic rocks form an open syncline
that plunges gently to NNW and is bound to the SW and NE by NW trending faults. The unconformity between Mesozoic rocks and deformed Paleozoic
basement is observed in the south-east part of the Property as shown in Figure 7.4. This is a panoramic view looking to the SW showing
the unconformity contact between Paleozoic and Cretaceous Sedimentary Sequences at El Fuerte.
| Figure 7.4 | Unconformity
and thrust fault contact |
Source: New Pacific Metals Corp., 2019.
There is a thrust fault observed
on the east side of the Property, north of the Snake Hole prospect (shown on Figure 7.5), which faults
Palaeozoic rocks over the Cretaceous sandstone.
| Silver Sand Project Pre-Feasibility Study |
| | New Pacific Metals Corp. | 0723071 |
| Figure 7.5 | Thrust Fault
north of Snake Hole |
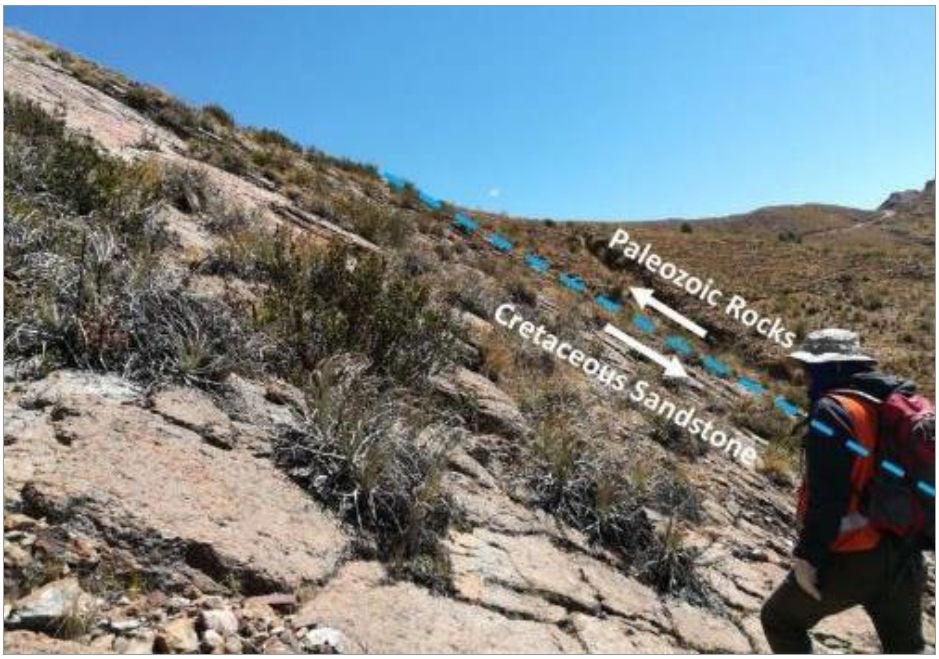
Source: New Pacific Metals Corp., 2019.
The Cretaceous sedimentary sequence
within the Property is divided into the lower La Puerta Formation and the upper Tarapaya Formation.
The La Puerta Formation consists
of a sequence of mixed aeolian and fluvial sandstones exhibiting distinct massive, bedded, cross-bedded, and bioturbated “streaky”
units which unconformably overlies the Paleozoic basement. The Tarapaya Formation conformably overlies the La Puerta sandstones in the
central part of the Property and comprises red siltstones and mudstones intercalated with minor sandstone.
Several Miocene aged subvolcanic
porphyritic dacite intrusions occur within Cretaceous and Paleozoic sequences. A porphyritic dacite laccolith is exposed overlying the
Cretaceous Tarapaya siltstones at the landmark San Cristobal Hill at Mascota located in the approximate centre of the Property. This laccolith
is similar to that hosting polymetallic systems in the southern tin belt. Porphyritic dacite dikes are also exposed in mine workings along
the eastern Cretaceous Paleozoic thrust contact. Elongate stocks up to 5 km in length are recorded to the east of the Cretaceous sequence
within Paleozoic basement.
A number of andesitic breccias
with phreatic, crackle, and other breccia textures are recorded at the Property. A large, oval body of andesitic diatreme breccia cross
cutting La Puerta Formation sandstone is seen in outcrop close to the west side of the major Silver Sand mineralization zone in the southern
portion of the Property. Geological mapping has defined this zone over an area of approximately 300 m in length and 200 m in width along
an NNE orientation. A separate ENE-striking sub-vertical diatreme breccia dike of about 13 m in width is seen in outcrop at Aullagas,
central to the Property and about 500 m west of the diatreme outcrop. This unit has welded tuff and sandstone clasts and is cemented by
abundant limonite.
The general geology of the Property
is presented in Figure 7.6.
| Silver Sand Project Pre-Feasibility Study |
| | New Pacific Metals Corp. | 0723071 |
| Figure 7.6 | General geology
of Silver Sand Property |
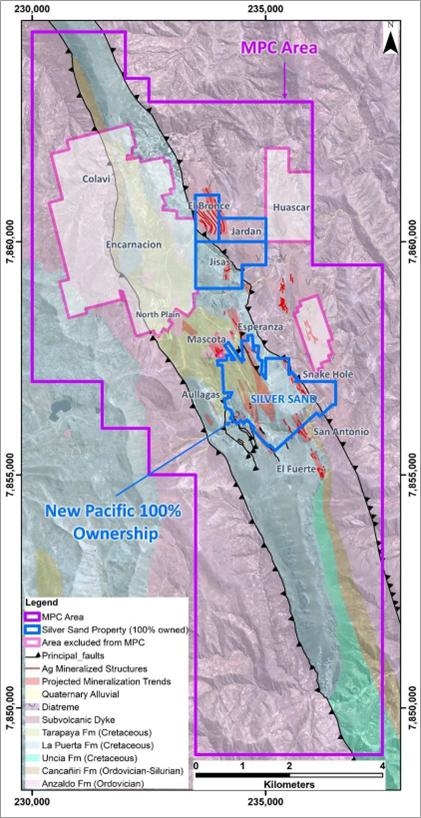
Source: New Pacific Metals Corp., 2022.
| Silver Sand Project Pre-Feasibility Study |
| | New Pacific Metals Corp. | 0723071 |
The
stratigraphic column for the Silver Sand Property is presented in Figure 7.7.
| Figure 7.7 | Stratigraphic column for the Property |
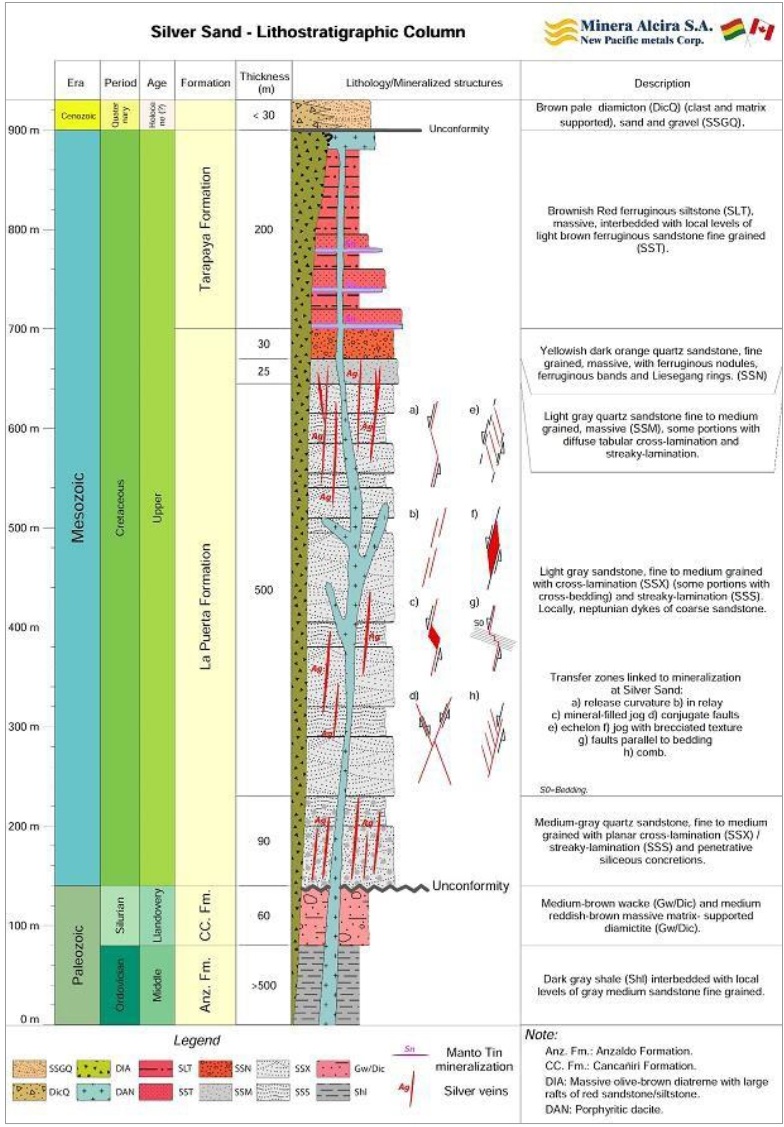
Source: New Pacific Metals Corp., 2022.
| Silver Sand Project Pre-Feasibility Study |
| | New Pacific Metals Corp. | 0723071 |
The Property exhibits a variety
of geometries and morphology of the mineralized bodies which are controlled and hosted by local transfer faults. Some are evident in outcrops,
but the best examples are observed in drill cores (Warren & Francis-Smith, 2018) and in underground workings. Mineralized structures
usually appear as steps-overs developed between two neighboring fault / vein segments that exhibit an echelon arrangement and may or may
not be connected by lower-ranking faults / vein. These types of structures are of fractal type, which implies that they repeat their geometry,
regardless of the observation scale, in arrangements of sigmoid (jogs), echelon, subparallel stepped, relay, horsetails, and extensional
nets (swarms). Line drawings of these features are shown in Figure 7.8.
| Figure 7.8 | Transfer
zones linked to mineralization at Silver Sand |
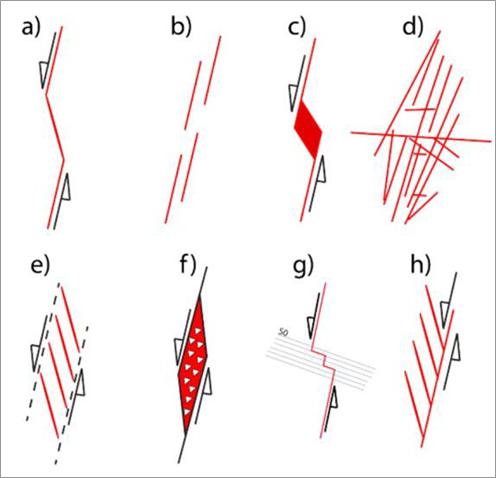
Notes: a) release curvature, b) in relay, c)
mineral filled jog, d) swarm, e) echelon,
f) jog with brecciated texture, g) faults
parallel to bedding, h) comb style.
Source: New Pacific Metals Corp., 2022.
Detailed geological and structural
mapping of surface and accessible underground mining workings has been carried out in the Silver Sand deposit. by the project geology
team of Silver Sand from 2018 to 2022. A total of 545 structural measurements including main foliations and tectonic lineations were collected.
In addition, other structural data including strike and dip measurements were collected from oriented drillholes. Based on structural
style (thrust assemblages) and geometric characteristics (listric faults and conjugate steeply dipping faults), the area has been divided
into two blocks, North and South Block, as shown in the location map in Figure 7.9.
| Silver Sand Project Pre-Feasibility Study |
| | New Pacific Metals Corp. | 0723071 |
| Figure 7.9 | Location
of North and South Block |
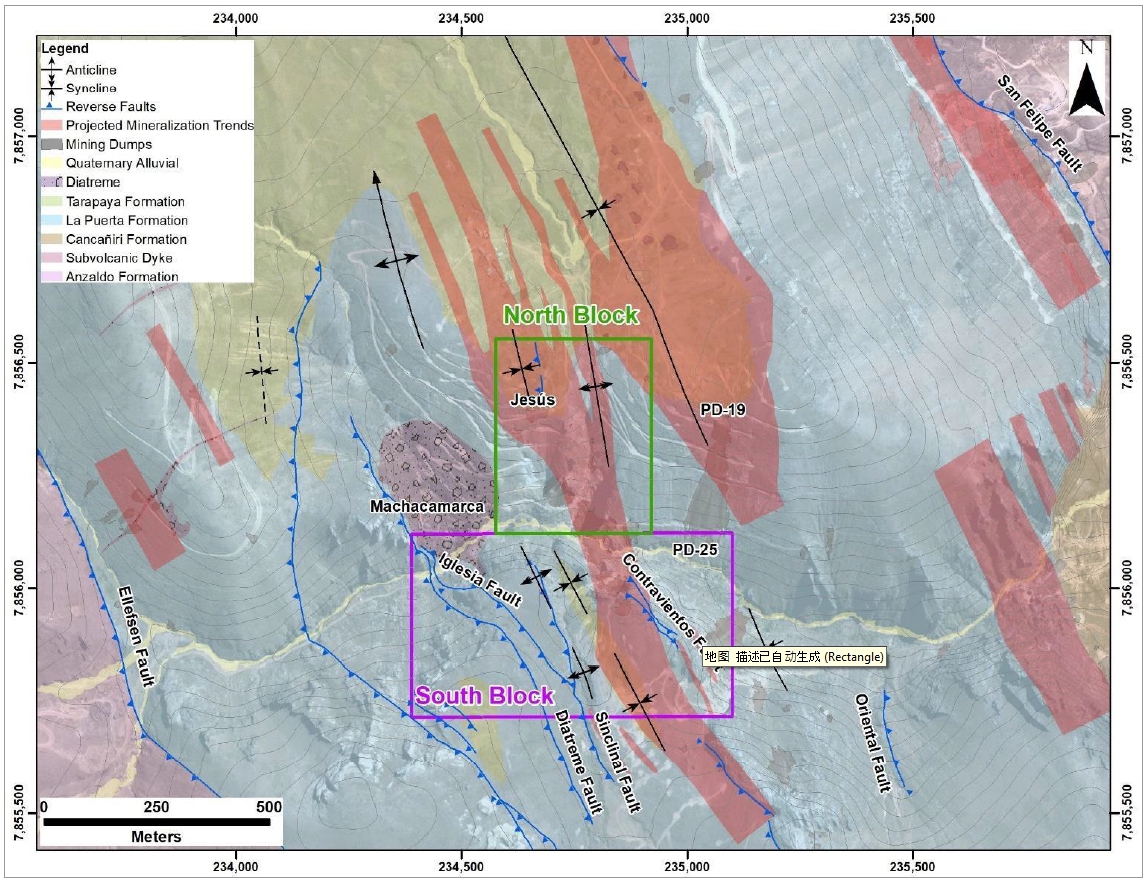
Notes: Machacamarca is a silver mine.
Source:
New Pacific Metals Corp., 2022.
This block covers an area
of approximately 0.6 km2 (0.69 x 0.86 km), characterized by thrust-type pre-mineralization structures and listric faults.
Penetrative conjugate fault systems in X (crossing) and Y (abutting) are superimposed on these structures and are the main hosts of mineralization,
with preferential attitudes of mineralized structures N12°W/77°SW (major) and N12°W/80°NE (minor).
This block covers an area
of approximately 0.15 km2 (0.30 x 0.5 km), where the first order structure is constituted by the Machacamarca syncline, a
cap of the Tarapaya formation (up to 30 m) and a system of penetrative conjugate fault system in X and Y being the main host of mineralization,
with preferential attitudes of N20°W/74°SW (major) and N20°W/74°NE (minor).
| Silver Sand Project Pre-Feasibility Study |
| | New Pacific Metals Corp. | 0723071 |
A total of eleven mineralized prospects
have been identified across the Property to date. These include the Silver Sand deposit and the El Fuerte, San Antonio, Aullagas, Snake
Hole, Mascota, Esperanza, North Plain, Jisas, Jardan, El Bronce, occurrences. Silver Sand, Snake Hole, Jisas, and El Bronce have been
tested by drilling. The other nine prospects were defined by rock chip and grab sampling of ancient and recent artisanal mine workings
and dumps. Exploration results from surface outcrops and underground workings defined a silver mineralized belt 7.5 km long and 2 km wide.
Table
7.1 summarizes the style of mineralization for each mineral occurrence. Each style is described in more detail in the sections
below.
| Table 7.1 | Mineral occurrences
and styles of mineralization |
| Style
of mineralization |
Mineral
occurrence |
| Sandstone-hosted
silver |
Silver
Sand, El Fuerte, San Antonio, Snake Hole, Esperanza, North Plain, and Jisas |
| Porphyritic
dacite-hosted silver |
Mascota,
El Bronce |
| Diatreme
breccia- hosted silver |
Aullagas |
| Manto-type
tin mineralization |
Tarapaya
siltstone and mudstone covered areas, such as Canutillos and North Plain |
Source: New Pacific Metals
Corp, 2022.
| 7.2.3.1 | Sandstone-hosted silver mineralization |
The mineralization in the Silver
Sand project comprises silver-containing sulphosalts and sulphides occurring within sheeted veins, stockworks, veinlets, breccia infill,
and disseminated within host rocks. The most common silver-bearing minerals include freibergite [(Ag,Cu,Fe)12(Sb,As)4S13],
miargyrite [AgSbS2], polybasite [(Ag,Cu)6(Sb,As)2S7]
[Ag9CuS4], bournonite [PbCuSbS3]
(some lattices of copper may be replaced by silver), andorite [PbAgSb3S6], and boulangerite [Pb5Sb4S11]
(some lattices of lead may be replaced by silver). Most silver mineralization is hosted in La Puerta sandstone units with minor amounts
in porphyritic dacite diatreme breccia.
The silver mineralization is the
majority of mineralization occurring almost exclusively within the Cretaceous-aged red quartz sandstones of La Puerta formation, which
demonstrate extensive sericitic alteration (bleaching). This style of mineralization is usually structurally controlled. The intensity
of mineralization is dependent on the density of various mineralized vein structures developed in the brittle host rocks.
Sandstone-hosted silver
mineralization is recognized at the core area of Silver Sand deposit and in all regional prospects. Figure
7.10 shows examples of silver mineralization associated to Cretaceous sandstone from drill core.
| Silver Sand Project Pre-Feasibility Study |
| | New Pacific Metals Corp. | 0723071 |
| Figure 7.10 | Silver mineralization in drill
cores |
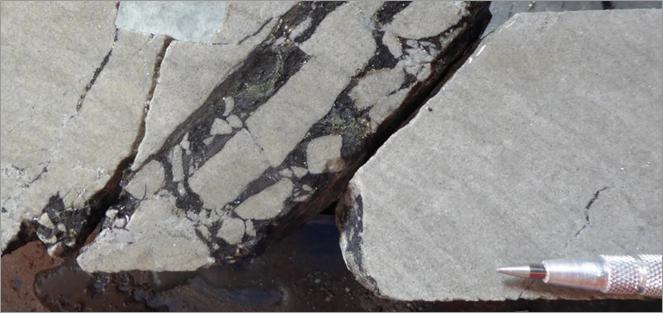
Note: DSS565001 Sulphides and sulfosalts
crackle breccia @ 141 m (265 g/t Ag, 0.28% Pb, 1.51% Zn).
Source: New Pacific Metals Corp., 2019.
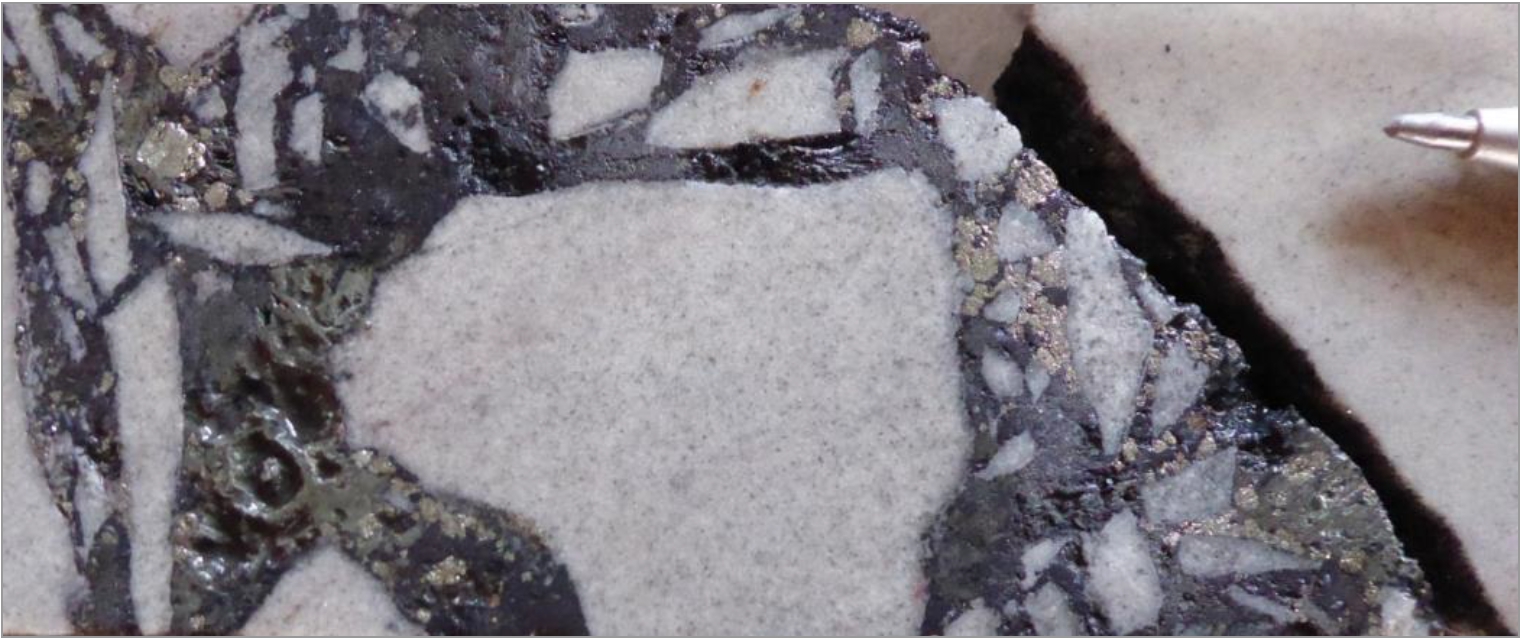
Note: DSS665001 Sulphides and sulfosalts crackle
breccia @ 125.81 m (1,290 g/t Ag, 0.92% Pb, 4.05% Zn).
Source: New Pacific Metals Corp., 2019.
| Silver Sand Project Pre-Feasibility Study |
| | New Pacific Metals Corp. | 0723071 |
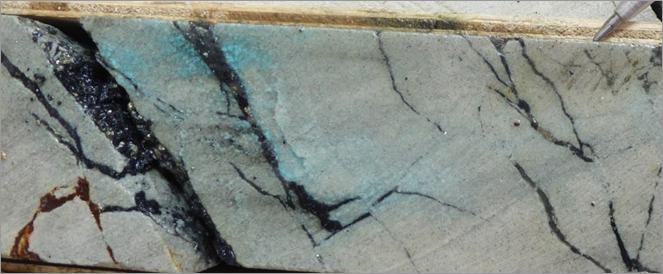
Note: DSS5803 Sulphides and sulfosalts
veinlets @ 188.20 m (205 g/t Ag).
Source: New Pacific Metals Corp., 2019.
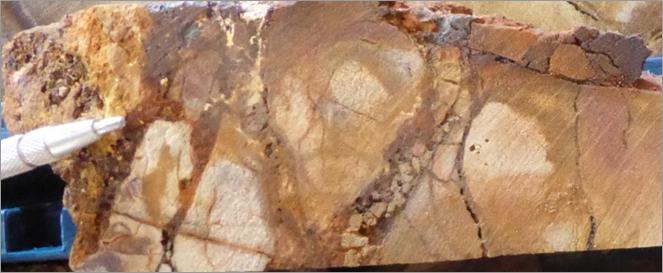
Note: DSS525001 Oxidized crackle breccia
@ 65.30 m (892 g/t Ag).
Source: New Pacific Metals Corp., 2019.
The exploration drill program confirmed
the characteristics of the Silver Sand deposit. The mineralization has been traced for more than 2,000 m along strike, to a maximum width
of about 680 m and a dip extension of more than 250 m. Figure 7.11 is a cross section through the
central portion of the deposit illustrating the extension of mineralization across strike and downdip.
Other regional mineralization occurrences
hosted in sandstone units have been defined by chip sampling of mineralized outcrops and grab sampling of mining dumps. The Snake Hole,
El Fuerte, and Jisas mineralization have been traced along a strike length of more than 1,000 m. This strike length is defined by the
distribution of old mine working and sampling results of surface outcrops and underground workings.
| Silver Sand Project Pre-Feasibility Study |
| | New Pacific Metals Corp. | 0723071 |
| Figure 7.11 | Cross Section
5250, Silver Sand Zone |
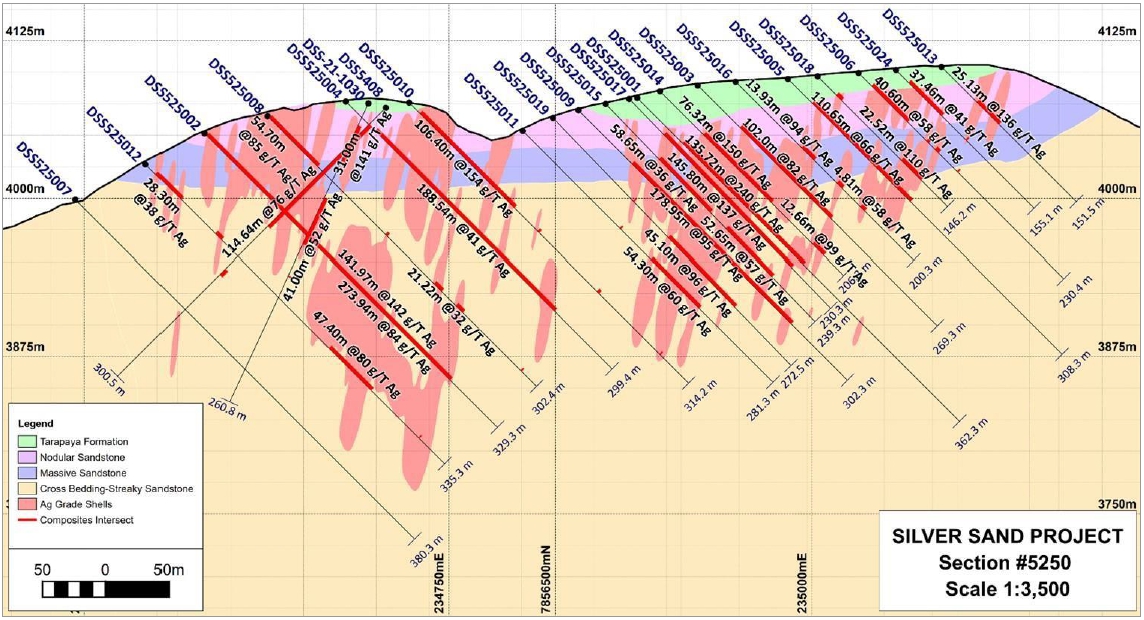
Source: New Pacific Metals
Corp., 2022.
| 7.2.3.2 | Porphyritic dacite-hosted silver mineralization |
Silver mineralization within porphyritic
dacite is observed at the Mascota and El Bronce prospects. These occurrences experienced extensive artisanal mining activities.
Moderate to strong alteration and
well-developed stockwork are seen at the outcrops and in cores. Systematic grab sampling on mining dumps has returned silver grade from
50 to 500 grams per tonne (g/t) Ag. The El Bronce zone has been traced with grab sampling results for more than 1,000 m along strike.
The zone is defined by silver assays > 50 parts per million (ppm). In the Jardan area north of Jisas, tin mining is also conducted
along north-east-trending veins in porphyritic intrusions at Chiaraque.
Drilling at El Bronce prospect
intersected porphyritic dacite intervals with moderate oxidation (limonite-jarosite), weak to moderate sericitic alteration, and argillization
patches. Moderate to strong pyrite dissemination with stringers of pyrite, unknown fine sulphides, and minor amount of chalcopyrite, sphalerite,
boulangerite, and brecciated intervals of limonite and jarosite in oxidized zones also occur.
| Silver Sand Project Pre-Feasibility Study |
| | New Pacific Metals Corp. | 0723071 |
| Figure 7.12 | Crackle
breccia intervals in altered porphyritic dacite |
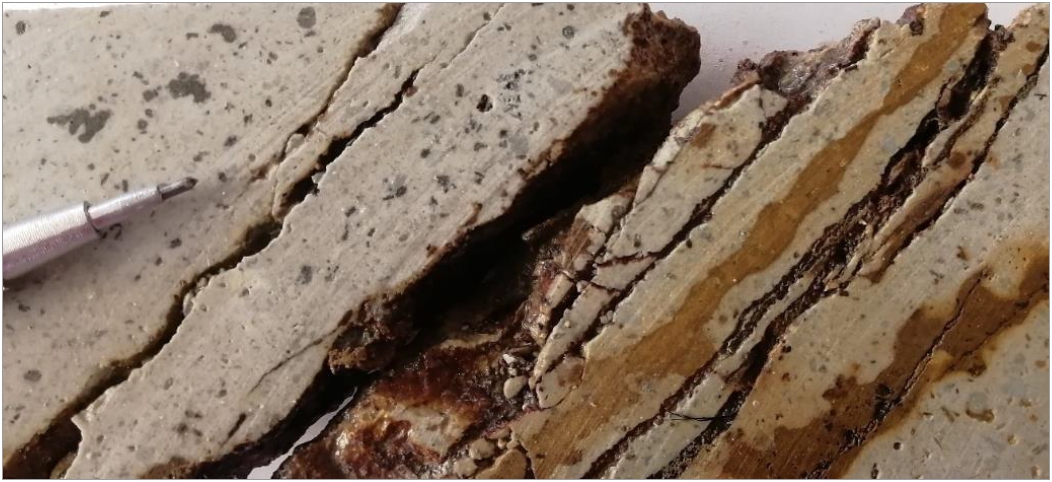
Note: DSSJS1701 Porphyritic Dacite with
oxidized crackle breccia @ 11.10 m (XRF 889 g/t Ag, Assay pending).
Source: New Pacific Metals Corp., 2022.
| 7.2.3.3 | Diatreme breccia-hosted silver mineralization |
Diatreme breccia hosted silver mineralization
is observed in the Aullagas zone. Based on surface mapping, the Aullagas zone occurs within a north-east-trending dike-like breccia body
of about 40 m in length and 13 m width, hosted by bleached sandstone. Breccia fragments consist of ignimbrite and sandstone clasts cemented
with highly ferruginous material. Surface grab samples have returned silver grades from 50 to 298 g/t Ag. Further investigation is needed
to define the size and potential of the diatreme breccia.
| Figure 7.13 | Diatreme
breccia outcrop in Aullagas zone |
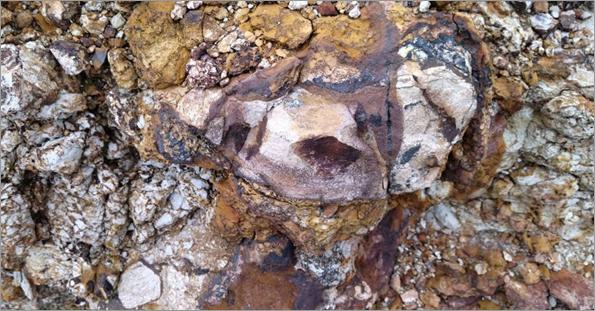
Note: Aullagas prospect diatreme breccia
strongly oxidated. Grab Sample 293 g/t Ag.
Source: New Pacific Metals Corp., 2022.
| Silver Sand Project Pre-Feasibility Study |
| | New Pacific Metals Corp. | 0723071 |
| 7.2.3.4 | Manto-type tin mineralization |
Manto-type tin mineralization on
the Property occurs as metasomatic replacement of the calcareous horizons in the siltstone and mudstone at the base of the Tarapaya Formation.
Very fine-grained cassiterite is accompanied by abundant pyrite and lesser ankerite, siderite, and barite in the stratiform manto.
Historically, and as early as 1890,
artisanal mining of the manto-type tin mineralization occurred at the contact between the La Puerta sandstone and the Tarapaya siltstone
and mudstone on the Property. Some drillholes in the current exploration drilling program intersected the tin manto-type mineralization
horizon in the contact of Tarapaya siltstone with La Puerta Formation nodular sandstone unit.
| Figure 7.14 | Example
of tin mineralization associated contact Tarapaya with Cretaceous sandstone |
Note: Hole DSS5803 Showing mantle type tin mineralization
in contact Tarapaya formation with La Puerta Formation Sandstone.
Source: New Pacific Metals Corp., 2022.
| 7.2.4 | Relative timing of hydrothermal alteration and mineralization |
At the Silver Sand deposit magmatic
and hydrothermal processes are proposed to have occurred as two separate events within a single metallogenic epoch associated with the
most recent orogenic event within the Eastern Cordillera. The initial event comprised an early stage of alteration and mineralization
associated with a deep heat and fluid source (intrusion) within a mesothermal environment. This was followed by uplift and erosion of
the Eastern Cordillera during Cenozoic orogenic events, and epithermal style mineralization.
The initial phase of metasomatic
activity resulted in manto-type tin mineralization of selected calcareous horizons within the Tarapaya siltstone and mudstone package.
The manto-type mineralization comprised high-temperature minerals indicative of a mesothermal environment including cassiterite, pyrite,
magnetite, ankerite, siderite, and barite.
The underlying La Puerta sandstone
was also intensely altered during this event. Metasomatic fluids resulted in the leaching of ferruginous cement from the sandstone, pervasive
sericitization and silicification and introduction of pyrite veinlets and disseminated pyrite and sphalerite. Collectively, this alteration
changed the rheological properties of the La Puerta sandstone units providing structural preparation for subsequent metasomatic events.
Progressive uplifting and erosion
of the Eastern Cordillera during the Cenozoic orogenic events resulted in a transition to an epithermal environment. Hydrothermal activities
during this time led to extensive fracturing, hydrothermal brecciation, and reactivation of earlier structures in the brittle
| Silver Sand Project Pre-Feasibility Study |
| | New Pacific Metals Corp. | 0723071 |
sandstone and porphyritic intrusions
and deposition of silver sulphides and sulphosalts. North-west trending fractures and faults with moderate to high-angle dips are thought
to have acted as conduits for mineralizing fluids. This mineralization was superimposed on rocks altered during the initial hydrothermal
event.
This hypothesis is supported by
Rivas (1979) who noted the porphyritic dacite dikes displace manto-style mineralization at the Colavi mine. At the Silver Sand deposit,
veins of silver sulphides and sulphosalts crosscut earlier pyrite veinlets, and pyrite in druses are coated with later silver minerals.
Silver mineralization zones are spatially associated with porphyritic dacite intrusions but are formed at a later stage than the intrusion.
The abundance of low-temperature silver sulphosalts in silver veins and the widespread mineralized hydrothermal and structural breccia
suggest an epithermal environment.
Mineralized zones on the Property
have been oxidized to a vertical depth of more than 250 m in places. The base of oxidation is commonly irregular resulting in significant
mixed oxide and sulphide zones (transition zones) due to the strong local influence of fractures.
Oxide minerals are dominated by
limonite, jarosite, goethite, and minor hematite resulting pervasive staining within sandstones, and pseudomorphic of sulphide minerals
within fractures, breccias, veinlets and veins.
Figure 7.15 shows an example
of oxidized mineralization grading into transition Material.
| Figure 7.15 | Oxidation
material in core |
Note: Hole DSS525001 Oxidation interval
(Limonite, jarosite), showing silver grades.
Source: New Pacific Metals Corp., 2022.
| Silver Sand Project Pre-Feasibility Study |
| | New Pacific Metals Corp. | 0723071 |
Figure 7.16
shows an example of transition mineralization intervals where oxidation is developed along fractures.
| Figure 7.16 | Transition
material in core |
Note: DSS529001 Transition interval
(oxide and sulphides), showing silver grades.
Source: New Pacific Metals Corp., 2022.
| Silver Sand Project Pre-Feasibility Study |
| | New Pacific Metals Corp. | 0723071 |
Silver and base metal mineralization
in the Silver Sand Property was formed during the regional uplifting and erosion process associated with the Tertiary orogenic events
in the Eastern Cordillera. The genetic model of silver and tin mineralization in the Property is a magmatic-hydrothermal system related
to a deep-seated magmatic center. The ore-forming processes in the Property are outlined as follows:
| 1 | Tin-bearing hydrothermal solutions
derived from the magmatic center moved upwards through major faults cutting through the Paleozoic and Mesozoic sedimentary sequences
in a mesothermal environment at the early stage of orogeny. |
| 2 | The ductile and impermeable
red siltstone and mudstone of the Tarapaya Formation overlying the porous and permeable La Puerta sandstone acted as a barrier to the
upward movement of the high-temperature tin-bearing hydrothermal solutions. This early hydrothermal activity resulted in the extensive
sericitic alteration (bleaching) the La Puerta sandstone and the formation of the stratiform metasomatic replacement (manto-type) tin
and base metal mineralization at the base of the Tarapaya siltstone and mudstone. |
| 3 | With persistent uplifting and
erosion, the hydrothermal system evolved into an epithermal environment and subvolcanic activities developed in the Property area. Porphyritic
dacite rocks intruded Paleozoic and Mesozoic sedimentary sequences and displaced the manto-type mineralization in the Tarapaya siltstone
and mudstone. The subvolcanic activities likely caused intensive fracturing, faulting, and brecciation of the previously bleached brittle
La Puerta sandstone. |
| 4 | Following the dacitic porphyry
intrusions, silver-rich, and tin-bearing hydrothermal fluid migrated though faults, fractures, and breccia structures in the La Puerta
sandstone and porphyritic dacite intrusions both beneath and above the Tarapaya Formation. This later-stage hydrothermal activity is
characterized by typical epithermal features such as hydrothermal brecciation and a low-temperature mineral assemblage. |
| 5 | The continuous uplifting and
erosion of the region has exposed the mineralization and resulted in oxidation of the mineralized zones along deep-seated fractures. |
The stratiform metasomatic replacement
tin mineralization formed in the earlier hydrothermal event is manto-type tin and base metal mineralization which is unique in the Bolivia
Tin Belt. The silver and tin mineralization formed in the later hydrothermal event is typical of the Bolivian polymetallic vein-type deposits
represented by the giant Cerro Rico de Potosí silver mine. The Bolivian polymetallic vein-type mineralization in the Property includes
three subtypes, the sandstone-hosted, the subvolcanic-hosted, and the diatreme breccia-hosted mineralization.
A conceptual model of mineralization
controls in the Property is established from the above discussion and is shown in a schematic format in Figure 8.1.
| Silver Sand Project Pre-Feasibility Study |
| | New Pacific Metals Corp. | 0723071 |
| Figure 8.1 | Conceptual model of mineralization controls at Silver
Sand Property |
Source: New Pacific Metals Corp., 2020.
| Silver Sand Project Pre-Feasibility Study |
| | New Pacific Metals Corp. | 0723071 |
Since the acquisition of the Property
by New Pacific in October 2017, exploration work has focused on geological mapping and sampling of surface outcrops, historical mine dumps,
and accessible historical underground workings. After an overview of the programs, the results are discussed in Sections 9.2 to 9.4.These
samples are not truly representative and are not used in any estimates.
Samples collected from outcrop and
underground workings were between 1 to 1.5 m long and were taken along sample lines. Representative grab samples were taken from historical
mine dumps. A total of 3,625 rock samples were collected at Silver Sand between October 2017 to July 2022 as shown in Table 9.1.
| Table 9.1 |
Summary of
underground and surface sampling programs |
| Sample
type |
Total
samples |
Comments |
| Surface
samples |
1,046 |
Rock
chips from channels, including the Silver Sand project and regional prospects. |
| Mine
dump samples |
1,408 |
Grab
samples from historic mine dumps. |
| Underground
samples |
1,171 |
Rock
chip samples from channels in 5,780 m of underground development in 65 locations. |
| Total |
3,625 |
|
Source: New Pacific Metals
Corp., 2022.
Figure 9.1 shows the distribution
of the abandoned artisanal adits and mine dumps across the Property. New Pacific has sampled all mine dumps and accessible adits with
silver mineralization showings. Areas mined for tin mineralization over the Tarapaya formation rocks have not been systematically sampled.
| Silver Sand Project Pre-Feasibility Study |
| | New Pacific Metals Corp. | 0723071 |
| Figure 9.1 |
Location of historic adits
and mine dumps |
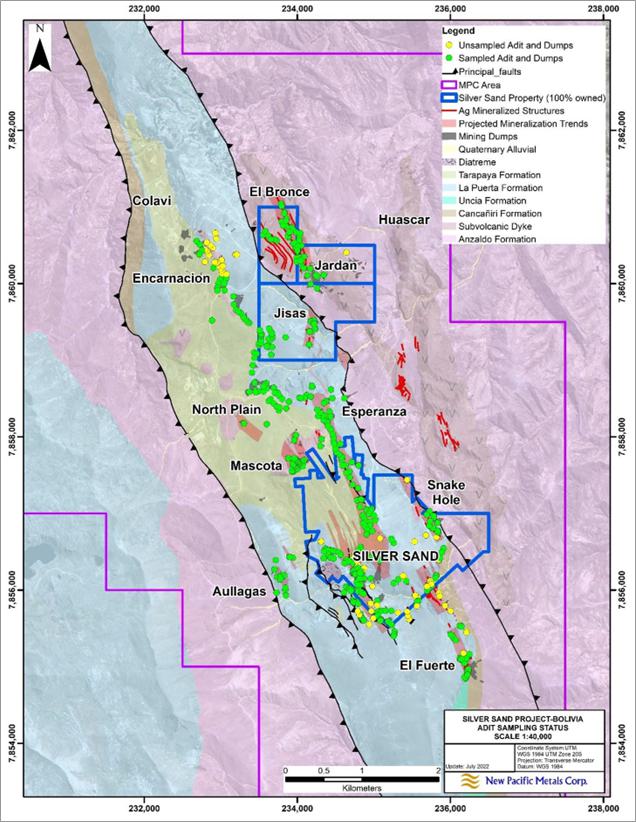
Source: New Pacific Metals Corp., 2022.
| Silver Sand Project Pre-Feasibility Study |
| | New Pacific Metals Corp. | 0723071 |
A total of 1,046 rock chip samples
were collected from 35 separate outcrops by New Pacific since 2017. Most of the outcrops sampled were located above or proximal to historical
workings. Samples were collected at 1.5 m intervals along sample lines oriented approximately perpendicular to the strike direction of
mineralization, for a total length of 2,863 m. An example of surface chip sample locations is shown in Figure 9.2. A panoramic photo of
chip sampling being carried out in the Jardan prospect is shown in Figure 9.3.
For each sample, the sample type,
location, and a description of the lithology, alteration, and mineralization were recorded by New Pacific personnel using Microsoft Excel
(Excel) worksheet. Geological and structural mapping was also completed at the same time. Assay data is compiled and stored in the MX
Deposit central database as point data. Geological and assay data are then compiled onto a geological plan map.
Of the 1,046 samples collected to
date, 101 samples (9.6%) returned a grade between 30 and 840 g/t Ag with an average grade of 150 g/t Ag.
| Figure 9.2 |
Results from
the Jesus adit trench |
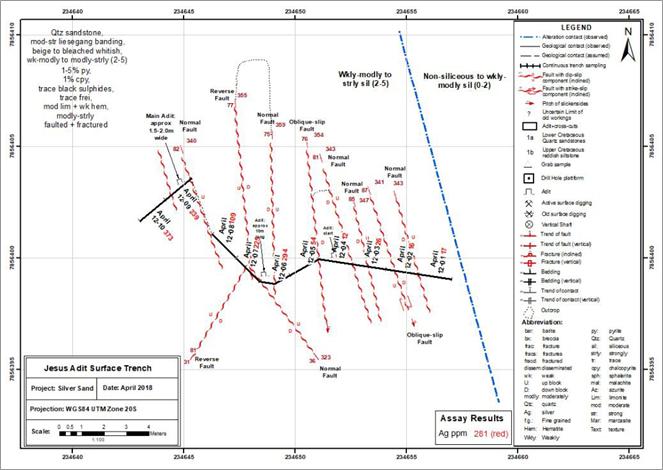
Source: New Pacific Metals
Corp., 2022.
| Silver Sand Project Pre-Feasibility Study |
| | New Pacific Metals Corp. | 0723071 |
| Figure 9.3 |
Channel sampling
at the Jardan Prospect |

Note: Photo looking west showing channel sampling process March
2020 at the Jardan prospect.
Source: New Pacific Metals Corp., 2022.
Mine dumps from historical mining
activities are scattered across a significant portion of the Property. These provide valuable insight into subsurface mineralization and
geology.
New Pacific collected a total of
1,408 grab samples from historical mine dumps. Most samples collected were remnants of high-grade narrow veins extracted from underground
mining activity.
Of the 1,408 samples collected
to date, 439 samples (31%) returned assay results between 30 and 3,290 g/t Ag with an average grade of 194 g/t Ag.
| 9.4 | Underground chip sampling |
The Property encompasses
significant historical underground mine workings which date back to the 16th century.
A number of adits and tunnels provide access to underground workings from the surface. New Pacific has surveyed all safe and readily
accessible tunnels within a 2 km wide and 6 km long area encompassing the mineralized La Puerta sandstone, and porphyritic dacite dykes
and intrusions. Mine workings have typically focused on high-grade veins.
New Pacific has mapped and sampled
65 historical mine workings comprising 5,780 m of underground tunnels. A total of 1,171 continuous chip samples have been collected at
1 - 2 m intervals along walls of available tunnels that cut across the mineralized zones.
Of the 1,171 samples collected
to date, 404 samples (34.5%) returned assay results between 30 and 2,710 g/t Ag with an average grade of 205 g/t Ag.
| Silver Sand Project Pre-Feasibility Study |
| | New Pacific Metals Corp. | 0723071 |
New Pacific geological personnel
record geological features on both a map and in an Excel worksheet. Assay results are compiled in the MX Deposit central database. A compilation
map comprising the surveyed mine workings, geology, and assay data is subsequently collated. An example of underground mapping and sampling
is presented in Figure 9.4.
| Figure
9.4 |
Underground
mapping and sampling at Mascota prospect |
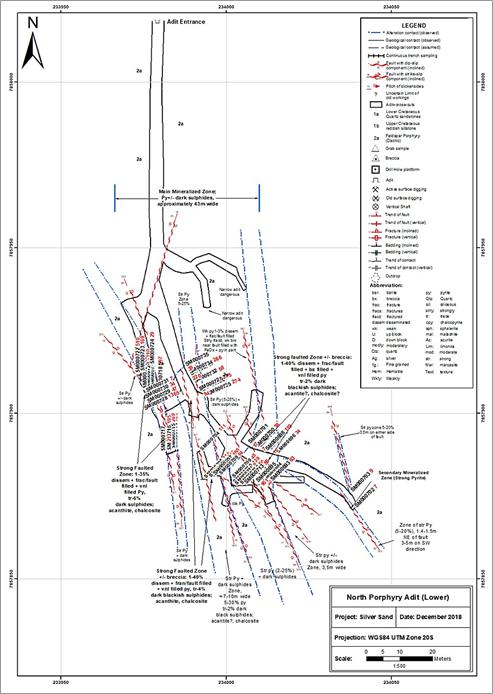
Source: New Pacific Metals
Corp., 2022.
Table 9.2 provides a summary of the
results of underground sampling.
| Silver Sand Project Pre-Feasibility Study |
| | New Pacific Metals Corp. | 0723071 |
| Table
9.2 |
Selected
underground sampling results |
| Name of adit |
Length (m) |
Sample type |
Number
of
samples |
Mineralized
samples |
Host
rock |
| Number |
Grade
range Ag
(g/t) |
Average
grade Ag
(g/t) |
| Jesus
Adit Lower |
145 |
Chips |
31 |
14 |
31-2,710 |
371 |
Sandstone |
| Jisas
Jardan Adit 1 |
275 |
Chips |
44 |
19 |
31-281 |
109 |
Sandstone,
Porphyry |
| North
Porphyry Adit Lower |
385 |
Chips |
45 |
36 |
30-1,365 |
220 |
Porphyry |
| North
Porphyry Adit Upper |
290 |
Chips |
18 |
15 |
31-812 |
244 |
Porphyry |
| Silver
Sand PD_25 |
250 |
Chips |
98 |
26 |
33-666 |
114 |
Sandstone |
| Silver
Sand PD_62 |
177 |
Chips |
77 |
24 |
34-750 |
179 |
Sandstone |
| Snake
Hole Principal Adit 1 |
188 |
Chips |
8 |
6 |
85-433 |
251 |
Sandstone |
| Snake
Hole Zone Adit 3 |
82 |
Chips |
4 |
4 |
34-495 |
164 |
Sandstone |
| Snake
Hole Zone Middle Adit 2 |
76 |
Chips |
38 |
22 |
31-1,460 |
157 |
Sandstone |
| South
Adit 1 |
300 |
Chips |
47 |
10 |
34-767 |
240 |
Sandstone |
| South
Adit 4 Level 1-4 |
113 |
Chips |
23 |
23 |
38-1,500 |
583 |
Sandstone |
| Esperanza
Adit 1 |
55 |
Chips |
13 |
8 |
75-830 |
337 |
Sandstone |
| Esperanza
Adit 2 |
153 |
Chips |
41 |
19 |
39-568 |
150 |
Sandstone |
| Esperanza
Adit 3 |
195 |
Chips |
24 |
10 |
32-536 |
234 |
Sandstone |
| Esperanza
Adit 4 |
26 |
Chips |
13 |
6 |
35-176 |
103 |
Sandstone |
| Esperanza
Adit 5 |
6 |
Chips |
3 |
3 |
189-1,300 |
624 |
Sandstone |
| Esperanza
Adit 6 |
34 |
Chips |
17 |
5 |
40-148 |
95 |
Sandstone |
| Esperanza
Adit 7 |
14 |
Chips |
7 |
1 |
118 |
118 |
Sandstone |
| Esperanza
Adit 8 |
36 |
Chips |
18 |
5 |
33-110 |
61 |
Sandstone
and Porphyry |
| Esperanza
Adit 9 |
52 |
Chips |
26 |
0 |
- |
- |
Sandstone |
| El
Bronce Main Adit 1 Upper and Lower |
120 |
Chips |
11 |
7 |
37-785 |
331 |
Porphyry |
| El
Bronce Adit 2 |
30 |
Chips |
9 |
7 |
49-318 |
108 |
Porphyry |
| El
Fuerte Adit 2 |
73 |
Chips |
7 |
5 |
86-589 |
261 |
Sandstone |
| El
Fuerte Adit 1 |
100 |
Chips |
12 |
8 |
34-214 |
100 |
Sandstone |
Source: New Pacific Metals
Corp., 2022.
| 9.5 | Discussion of exploration results |
Assay results of underground chip
samples and surface mine dump grab samples suggest historical mining focused on high-grade veins within the core of the mineralized system
and that in-situ mineralized material exists outside of the principal or main veins. This material forms continuous mineralized zones
from several metres to several tens of metres in width in bleached sandstone and porphyritic dacite.
Results of samples collected to
date show comparable average grades between the underground chip samples and the grab samples from historical waste dumps. Surface rock
chip sample grades are consistently lower. The significant difference in silver grades between underground and surface chip samples may
be the result of oxidation and leaching of silver sulphides and sulphosalts from the host rocks on surface.
A summary of results from surface
rock chip samples, waste dump samples, and underground chip samples is presented in Table 9.3. Mineralized samples listed in the table
below are samples with > 30 g/t silver.
| Silver Sand Project Pre-Feasibility Study |
| | New Pacific Metals Corp. | 0723071 |
| Table
9.3 |
Summary
of underground and surface sampling results |
Sample
type |
Total
samples |
Average
Ag
grade of all
samples (g/t) |
Number
of
mineralized
samples |
Grade
Ag
range (g/t) |
Average
Ag grade
of mineralized
samples (g/t) |
| Surface
samples |
1,046 |
18 |
101 |
30
- 840 |
150 |
| Mine
dump samples |
1,408 |
94 |
439 |
30
– 3,290 |
194 |
| Underground
samples |
1,171 |
76 |
404 |
30
– 2,710 |
205 |
Note: Mineralized samples are samples
with > 30 g/t silver.
Source: New Pacific Metals Corp., 2022.
The main regional prospects where mapping
has been carried out are described below:
Snake Hole: This prospect
is located approximately 600 m east of the Silver Sand deposit and consists of artisanal underground workings on structures that trend
NNW-SSE. The workings and associated surface mine dumps were started in the Spanish colonial era and have continued sporadically to recent
times, creating a “glory hole”. Developed in altered (bleaching) quartz sandstones, the workings are traceable over more than
1,000 m strike length with widths varying from a few metres up to 100 m. Geochemical sampling of the workings and mine dumps returned
encouraging results, typically ranging from 100 g/t Ag to 300 g/t Ag.
Surface mapping suggests that the
mineralized fracture zone remains open to the north, where it potentially trends undercover towards the Jisas prospect located approximately
two kilometres to the north.
| Figure
9.5 |
Mineralized
structures and fractures in historically mined Snake zone glory hole |

Notes: Historical mined structures and fractures.
Left: Intersection of principal NS. Right: conjugate EW.
Source: New Pacific Metals Corp., 2022.
| Silver Sand Project Pre-Feasibility Study |
| | New Pacific Metals Corp. | 0723071 |
El Fuerte: This
prospect is located south-east of the Silver Sand deposit and covers an area of 0.46 km2.
The host rock is the Cretaceous La Puerta Formation with clear signs of alteration seen as bleaching. Multiple old mining works were
observed in the area, showing a fracture zone with brecciated intervals and vein stocks with moderate to strong oxidation.
The mineralized structures and breccias
consist of hematite, limonite, goethite, quartz, jarosite, and pyrolusite. A total of 170 rock samples were taken in the area. Chip sampling
includes 114 samples with grades up to 589 g/t Ag. Grab / selected sampling includes 56 samples with grades up to 983 g/t.
| Figure
9.6 |
El
Fuerte prospect main structure |
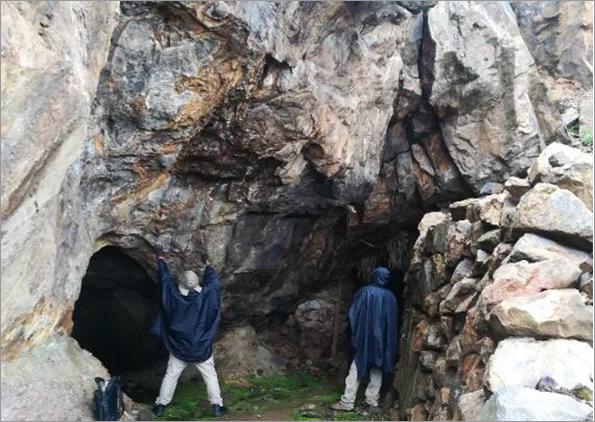
Notes: Picture looking to NE. Showing brecciated
structure of 1.35 m wide (320°/85°SW).
Source: New Pacific Metals Corp., 2022.
Aullagas: This prospect
is located west of the Silver Sand deposit, covering an area of 0.54 km2. The host rock is also
the Cretaceous La Puerta Formation with clear signs of alteration seen as bleaching.
The prospect contains two diatreme
breccias with a northeast-southwest orientation. Both breccia bodies are subvertical or dipping south at high angles. The northern one
has a reddish fine-grained matrix with polymictic subrounded clast from 0.5 to 10 cm. The southern breccia is in the center of the prospect.
It has polymictic subrounded to angular clast from 0.2 to 15 cm and some up to size blocks of Anzaldo formation. The limonite and hematite
content of the breccia is high.
The diatreme breccia bodies present
a mineralogical association established by the presence of pyrite-limonite-hematite. Grab and channel sampling results have silver grades
from 20 to 293 Ag g/t.
| Silver Sand Project Pre-Feasibility Study |
| | New Pacific Metals Corp. | 0723071 |
| Figure
9.7 |
Aullagas
prospect outcrop |
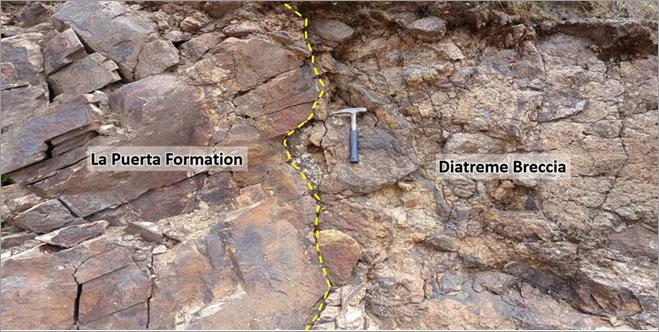
Notes: Looking to West. Showing contact
between Cretaceous La Puerta Formation and diatreme breccia.
Source: New Pacific Metals Corp., 2022.
El Bronce: This prospect
is located NW of the Silver Sand deposit, covering an area of 0.5 km2. The area has outcrops with
porphyritic rhyolitic-dacitic intrusive rocks, and hosts several mineralized zones scattered with widespread historical mine workings
and dumps. The mining probably dates back to colonial times. Silver minerals (acanthite-freibergite), zinc (sphalerite), copper (malachite)
and some tin minerals were observed.
Detailed geological mapping indicates
the intrusive host rock is pervasively flooded by moderate to intense alteration. This reflects the passage of silver-rich hydrothermal
fluids (phylic alteration (sericite) with local argillic (kaolinite) and propylitic (chlorite-epidote) zones). Surface mapping has also
identified good to moderate micro-veining and stockwork development between the principal historically exploited structures thereby forming
an attractive bulk tonnage target.
| Figure
9.8 |
El
Bronce prospect |
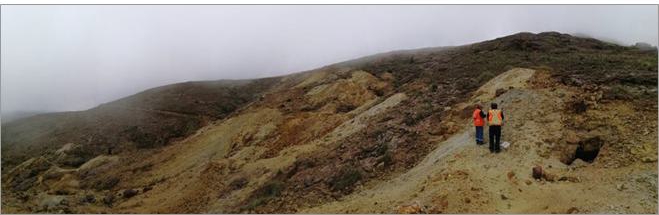
Notes: Mine dump sampling at El Bronce,
looking south.
Source: New Pacific Metals Corp., 2022.
| Silver Sand Project Pre-Feasibility Study |
| | New Pacific Metals Corp. | 0723071 |
Jisas: The prospect is located
north of the Silver Sand deposit, covering an area of 1.25 km2. The host rock is whitish bleached
Cretaceous La Puerta Formation sandstone bounded to the east by a regional low angle thrust overlain by strongly folded and faulted Paleozoic
clastic sediments of the Anzaldo Formation. The thrust is striking NW, dipping east at a dip of around 30 degrees. Locally, dacitic intrusions
are emplaced along the thrust and intrude both Cretaceous sandstone and Paleozoic sediments.
Three sets of mineralized fractures
were identified from surface outcrops and underground workings. The major set is striking roughly NW direction and dips west at high angles.
The other two minor sets strike NW and NE respectively. The mineralized structures are oxidized to various extent near surface, with mineralization
characterized by quartz, cassiterite, pyrrhotite, pyrite, siderite, and barite freibergite, andorite, bournonite, blende, chalcopyrite,
argentite, and malachite.
| Figure
9.9 |
Jisas
prospect outcrop photo |
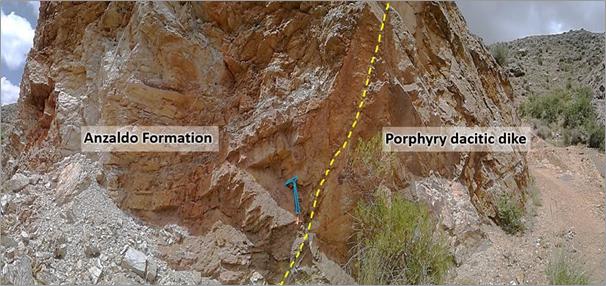
Notes: Contact between the Anzaldo formation
and porphyry dacitic dike. The contact yellow line with direction N65°W/75°NE.
Source: New Pacific Metals Corp., 2022.
| Silver Sand Project Pre-Feasibility Study |
| | New Pacific Metals Corp. | 0723071 |
This section describes diamond drill
programs completed by New Pacific at the Property between October 2017 to July 2022. Drilling completed by previous operators is discussed
in Section 6.
In total, New Pacific has completed
564 diamond core drillholes for a total of 139,920 m. Drilling programs were completed in four drill campaigns (Phases). The initial Phase
consisted of drilling of the main Silver Sand target area between October 2017 and December 2018. This program was designed to test areas
with anomalous surface and underground rock chip results and resulted in the discovery of the main Silver Sand deposit. Ongoing drilling
resulted in a nominal 50 x 50 m spaced drill grid over an area of 1,600 m x 800 m at Silver Sand.
The second Phase of drilling was
completed between April 2019 and December 2019 comprised infill drilling of key portions of the Silver Sand deposit to a nominal 25 x
25 m grid, as well as exploration drilling at the Snake Hole prospect, discussed in Section 10.5.2. In 2020 and 2021 the scheduled drilling
programs were interrupted by country wide pandemic lockdown and this Phase spans both years. In 2022 the drilling continued at the Silver
Sand deposit and commenced in the North Block prospects (El Bronce and Jisas).
Drill statistics by year are presented in Table
10.1.
| Table 10.1 | New Pacific
drilling by year |
| Year |
Phase |
Silver Sand |
Snake Hole |
North prospects |
Total |
| Holes |
Metres |
Holes |
Metres |
Holes |
Metres |
Holes |
Metres |
| 2017 |
Phase 1 drilling |
18 |
5,020 |
- |
- |
- |
- |
18 |
5,020 |
| 2018 |
177 |
49,991 |
- |
- |
- |
- |
177 |
49,991 |
| 2019 |
Phase 2 drilling |
182 |
39,917 |
24 |
5,957 |
- |
- |
206 |
45,874 |
| 2020 |
Phase 3 drilling |
5 |
899 |
8 |
1,590 |
|
|
13 |
2,489 |
| 2021 |
Phase 3 drilling |
54 |
12,814 |
- |
- |
- |
- |
54 |
12,814 |
| 2022 |
Phase 4 drilling |
87 |
19,433 |
- |
- |
9 |
4,298 |
96 |
23,731 |
| Total |
523 |
128,074 |
32 |
7,547 |
9 |
4,298 |
564 |
139,920 |
Notes:
| · | Table predominantly refers to drilling inside the 100% owned New
Pacific mineral tenure as shown in Figure 10.1. |
| · | Numbers may not compute exactly due to rounding. |
Source: AMC Mining Consultants (Canada) Ltd.,
2020, based on data provided by New Pacific Metals Corp.
A local drill grid has been developed
across the Property, comprising 100 m spaced drill sections orientated 060°-240° and numbered from 32 in the north-west, to 80
in the south-east shown in Figure 10.1. Drillhole IDs comprise a prefix which reflects the drillhole section, followed by a drillhole
number. Drillholes have been drilled up to 545 m deep at inclinations between -45° and -80° towards azimuths of 060° (~NE)
and 240° (~SW) to intercept the principal trend of mineralized vein structures perpendicularly.
Figure 10.1 shows the location of New
Pacific drillholes completed at the Silver Sand Property.
| Silver Sand Project Pre-Feasibility Study |
| | New Pacific Metals Corp. | 0723071 |
| Figure
10.1 |
Location
map of drillholes in Silver Sand area |
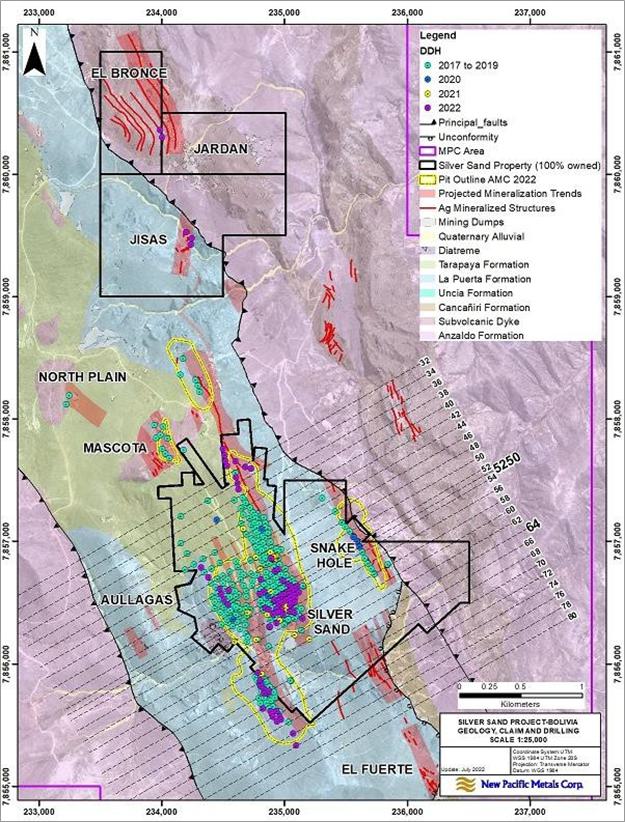
Source: New Pacific Metals Corp., 2022.
| Silver Sand Project Pre-Feasibility Study |
| | New Pacific Metals Corp. | 0723071 |
Diamond drill programs completed
at the Property were designed and managed by New Pacific personnel. Drilling was completed by contract drilling companies Maldonado Exploraciones
and Leduc Drilling SRL both out of La Paz, Bolivia.
Drillhole collars are located by
New Pacific geologists using a Real-Time Kinematic differential global positioning system (GPS) and marked with a wooden stake. The site
is then cleared, and sumps constructed to manage drill water and cuttings. The drill is then positioned by the drilling contractor and
the drill alignment (inclination and azimuth) is confirmed by New Pacific geologists. The coordinate system used is WGS 84 UTM Zone 20S.2.
Drilling operations are carried out as two separate shifts, 24 hours per day, seven days per week.
Core drilling is completed using
conventional HQ (64 mm diameter) equipment and 3 m drill rods. The core is placed in plastic core boxes by the drilling contractor. Core
blocks are placed at the end of each drill run with the driller marking the core recovery and drillhole depth by the drilling contractor.
Each core box is marked with the drillhole ID and the corresponding from and to depths.
At the completion of each drillhole,
PVC casing is placed by the drilling contractor in the drillhole. New Pacific personnel subsequently construct a concrete monument and
mark the collar with the drillhole ID, depth, dip, azimuth. Such a monument and Leduc Rig #2-hole drilling DSS565013a, are shown in Figure
10.2.
| Figure
10.2 |
Silver
Sand drilling |
Source: New Pacific Metals
Corp., 2022.
| 10.2.1 | Drillhole deviation surveys |
Drillhole deviation surveys are
completed by the drilling contractor using a REFLEX EZ-SHOT and SPT GyroMaster downhole survey tools. Drillholes are surveyed at a depth
of approximately 20 m, and on approximately 30 m intervals as drilling progresses. A second confirmation survey is carried out once the
hole is complete. This is done on 30 m intervals as the drill rods are pulled out of the hole (multi-shot).
| Silver Sand Project Pre-Feasibility Study |
| | New Pacific Metals Corp. | 0723071 |
| 10.2.2 | Core processing and logging |
New Pacific’s drill site
supervising geologists visit each drill at least once daily to monitor drillhole progress. Core boxes are sorted and placed in order to
enable core blocks and depths to be checked. Preliminary logging is then completed. This consists of completing a “quick log”
of major geological features, marking of natural breaks, and analyzing veins with a portable XRF to determine silver concentrations, markings
readings of XRF gun on drill cores and taking core photos on drill site. The drill-site core photos are uploaded to the Company’s
Dropbox account for the Company’s management to review on daily basis so that drill plan can be adjusted instantly based on actual
drill progress and mineralization.
| Figure
10.3 |
Jisas
North prospect drilling, showing “quicklog” process |
Source: New Pacific Metals Corp., 2020.
Prior to transportation, individual
segments of core are sequentially numbered, and the core box is photographed as part of the chain of custody. Core containing visible
mineralization is also wrapped in paper to minimize core damage during transport. Lids are placed on core boxes prior to transport.
Core boxes are
transported by New Pacific personnel to the Company’s secure Betanzos core processing facility (Betanzos), daily following
preliminary processing at site.
On arrival at Betanzos, the core
boxes are checked and recorded in a core handover form that is signed by the receiver. Core boxes are then moved to the logging shack
where detailed logging, processing, and sampling are completed. From 2017 to 2020 logging data was collected on paper
| Silver Sand Project Pre-Feasibility Study |
| | New Pacific Metals Corp. | 0723071 |
templates which were later transferred
to an Excel file before being exported to an Access database. Since September 2020, as part of data management improvements the data entry
and database compilation has been migrated to MX Deposit software, a Sequent product.
In general, New Pacific’s core logging process carried
out at Betanzos comprises the following:
| · | Core is cleaned and drill core segments are pieced together. |
| · | The length of core for each drill run is measured and recovery is calculated. |
| · | Drillhole depths are marked on the core. |
| · | Rock quality designation (RQD) is measured and basic
geotechnical features are noted (fracture frequency). |
| · | Geological logging is completed entering the data
into MX Deposit software in computer tablets. The geological data collected includes oxidation style and intensity, lithology, alteration,
structure, and mineralization information using codes established by New Pacific. |
| · | Once the logging is complete, a geologist determines
the core to be sampled based on alteration and mineralization, marks sample intervals and determines what QA/QC samples to be included. |
| · | Samples for bulk density determinations are collected
approximately every 20 m or every main alteration-mineralization interval. The samples are measured at a dedicated measuring station using
water immersion and the Archimedes principle. |
| · | Prior to core cutting, photographs of wet core are
taken using a high-definition camera for the entire hole. |
| · | After photography a cutting line is marked on the
core based on the observed mineralization and structures. |
| · | Core is cut in half using a diamond core saw and sampling is completed. |
| · | Core boxes are then stored at Betanzos. |
| · | Samples are dispatched to the laboratory on a weekly basis. |
Sampling, shipment, and security protocols are described
in Section 11 of this report.
Core recovery from New Pacific
drill programs varies between 0% (voids and overburden) and 100%, averaging 96.85%. More than 94.55% of core intervals have a core recovery
equal or greater than 95%.
| 10.4.1 | Exploration drilling – 2017 - 2018 |
The 2017 – 2018 phase one
drill program was designed to test the depth and continuity of mineralization delineated by surface mapping and sampling in the Silver
Sand area. Positive drill results led to ongoing drilling and the definition of numerous north-northwest striking and moderate to steeply
west dipping zones of silver mineralization. The completed program was at a nominal drill spacing of 50 x 50 m and over a 1,600 x 800
m area. Ninety seven percent of drillholes (190 out of 195) encountered silver mineralization.
| 10.4.2 | Definition and exploration drilling - 2019 |
A phase two drill program commenced
in April 2019. This program was designed to infill existing drilling within the Silver Sand deposit, and to assess the potential strike
extensions of major mineralized zones beneath the Tarapaya Formation north of Section 44. The phase two 2019 drill program comprised the
drilling of 182 drillholes for a total of 39,917 m. Drillholes ranged from 86 to 365 m in depth, averaging 225 m.
| Silver Sand Project Pre-Feasibility Study |
| | New Pacific Metals Corp. | 0723071 |
The assay results confirmed the
continuity of mineralization delineated in previous drilling campaigns and were used in the initial Mineral Resource estimation in early
2020 and as reported in the 2020 Technical Report.
| 10.4.3 | Definition, exploration, and metallurgical drilling - 2020 |
A phase three drill program
was carried out from February to March 2020, prior to interruption. The program included collecting samples for metallurgy testwork,
infill the existing drilling grid within the Silver Sand deposit, assess the potential strike extensions of major mineralized zones beneath
the Tarapaya Formation and to test the mineralized zone at Snake Hole. Due to the pandemic lockdown, the drilling programs were paused
from April 2020 to July 2021. A total of 13 drillholes for 2,489 m were completed in the attenuated program with hole lengths ranging
from 100 m to 292.8 m and averaging 191 m.
| 10.4.3.1 | Definition and geotechnical drilling - 2021 |
The phase three drill program
was continued in July 2021 and completed in September 2021. 54 drillholes for a total of 12,814 were completed during this stage. Drillholes
ranged from 2.1 (abandoned) to 715.95 m in depth, averaging 237 m.
| 10.4.4 | Definition, exploration North prospects, and geotechnical drilling - 2022 |
The phase four drill program was
completed from January 2022 to July 2022. The programs were designed to infill the high-grade core area of mineralization at the Silver
Sand deposit, step-out test the known mineralization zones, and drill for the geotechnical study of the initially proposed pit wall. A
further facet of the program was to explore and test the North Block prospects of EL Bronce and Jisas. A total of 96 drillholes for a
total of 23,731 m were completed in this period. Drillholes ranged from 54.85 to 721.5 m in depth, averaging 247 m.
| 10.5 | Discussion of drilling results |
Drill programs completed between
October 2017 and July 2022 have defined silver mineralization at the Silver Sand deposit over a strike length of 2.5 km, and a width of
650 m and to a depth of more than 250 m below surface.
Silver mineralization occurs predominantly
associated with dissemination, brecciated intervals, fractures, veinlets, and veins within the bleached and altered La Puerta sandstone.
Within the core of the system, where vein density is greatest, mineralized zones are relatively continuous along strike and to depth,
reaching thicknesses of up to 300 m. The core portion of the system shows good continuity. Mineralization outside of the core occurs as
discontinuous pods and lenses often only multiple metres thick.
North of Section 60 mineralized
zones generally dip west to the west at high angles. Drilling in this area typically intersects up to 50 m of red Cretaceous Tarapaya
Formation before intersecting massive, white, altered and mineralized La Puerta sandstone. The contact between the Tarapaya and La Puerta
Formation commonly contains massive pyrite which is up to 2 m thick. Historical mining activity does not appear to be widespread in this
area.
South of Section 60, massive, altered,
and fractured La Puerta sandstone is exposed at surface. Zones of silver mineralization typically dip to the west at high angles, and
historical mining activity appears to be extensive. Figure 10.4 and Figure 10.5 show a plan view and three-dimensional (3D) perspective
of the mineralization on the Property, respectively.
| Silver Sand Project Pre-Feasibility Study |
| | New Pacific Metals Corp. | 0723071 |
| Figure
10.4 |
Silver
Sand mineralization – plan view |
Source: New Pacific Metals Corp., 2022.
| Silver Sand Project Pre-Feasibility Study |
| | New Pacific Metals Corp. | 0723071 |
| Figure
10.5 |
Silver
Sand mineralization – 3D perspective |
Source: New Pacific Metals Corp., 2022.
Figure 10.6 and Figure 10.7 present
cross section views through the center and south portions of deposit, showing the intersection angles of the zones by the drilling. The
grade shells shown are built at a > 20 g/t Ag threshold and the mineralized intersections shown are calculated at a 30 g/t Ag cut-off.
| Figure
10.6 |
Cross
Section 5250, Silver Sand center area |
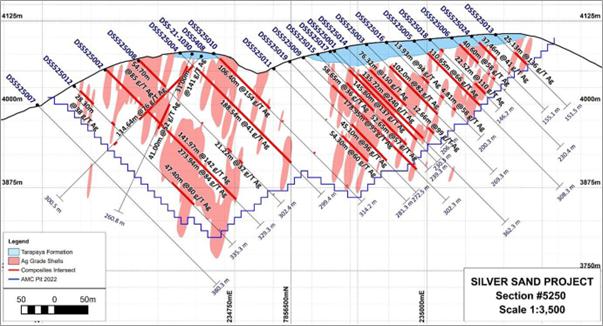
Source: New Pacific Metals Corp., 2022.
| Silver Sand Project Pre-Feasibility Study |
| | New Pacific Metals Corp. | 0723071 |
| Figure 10.7 | Cross Section 6400, Silver Sand south area |
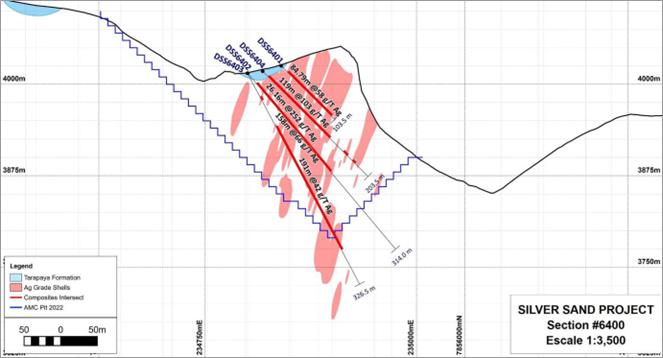
Source:
New Pacific Metals Corp., 2022.
New Pacific’s Snake Hole prospect
is located approximately 600 m east of the Silver Sand deposit. This prospect comprises a 1 km long NNW-SSE trend comprising extensive
historical artisanal mining activities and mine dumps. Historical workings are developed in bleached sandstone and suggest mineralization
is between a few metres and up to 100 m wide. Previous sampling of workings and dumps in this Snake Hole area by New Pacific returned
numerous assay results between 100 g/t Ag and 300 g/t Ag. Geological mapping also suggested that mineralized structures extend north-west
towards the Company’s Jisas-El Fuerte prospects.
A total of 32 HQ diamond drillholes
totalling 7,547 m were completed to assess sub-surface mineralization within the Snake Hole prospect area between August 2019 to March
2020 Drillholes were completed on a drilling grid at a 50 m spacing along the steeply dipping structure striking NNW-SSE. Each section
was drilled with at least one drillhole at an inclination between 40° and 80°. The majority of drillholes were drilled towards
an azimuth of 060°, four holes were drilled towards 240° and two drillholes were drilled towards 285° and 195° respectively
as part of a drill fan. Drillhole locations are presented in Figure 10.8.
| Silver Sand Project Pre-Feasibility Study |
| | New Pacific Metals Corp. | 0723071 |
| Figure 10.8 | Location of drillholes, Snake Hole prospect |
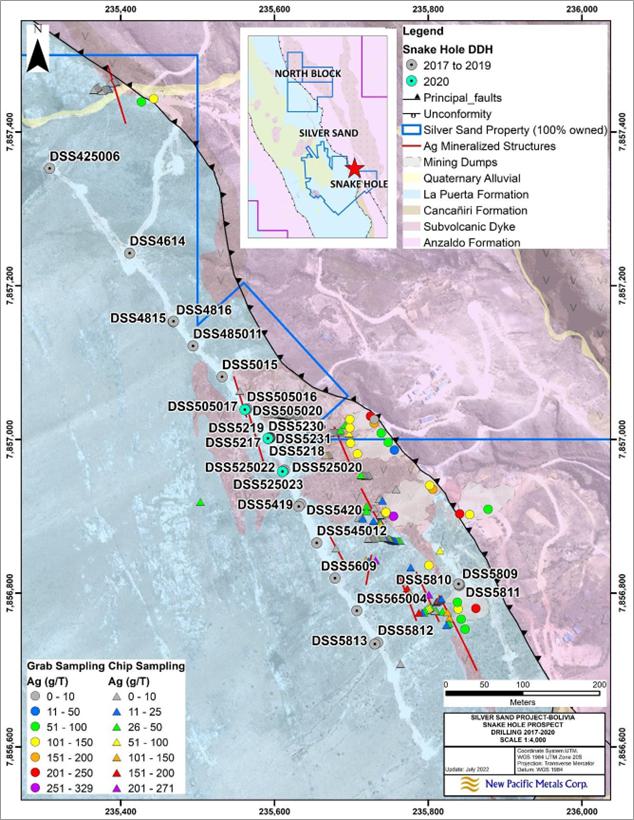
Source: New Pacific Metals Corp., 2022.
| Silver Sand Project Pre-Feasibility Study |
| | New Pacific Metals Corp. | 0723071 |
| 10.5.3 | Drilling of North prospect |
The North prospect consists of
El Bronce and Jisas, which are located approximately 3.5 km to NNW from the center of Silver Sand deposit. This prospect comprises a 2
km long NNW-SSE trend comprising extensive historical artisanal mining activities and mine dumps. Historical workings are developed in
bleached sandstone and strongly altered dacitic intrusive rocks, and suggest mineralization is between a few metres and up to 100 m wide.
A total of nine HQ diamond drillholes
totaling 4,297.9 m were completed between May to July 2022. Drillholes were completed on a drilling grid at a 50 m spacing along the East-West
section lines at Jisas and along a N20E grid at El Bronce. All holes were drilled at an angle of -45°. The majority of drillholes
were drilled on the grids. Only one hole (DSSJS1703) was drilled off grid. Hole DSSJS1702 was abandoned due to downhole issues. Drillhole
locations are presented in Figure 10.9. Drillhole collar information is presented in Table 10.2.
| Table 10.2 | Summary of North Prospects drillholes |
| Hole ID |
East (m) |
North (m) |
Elevation (m) |
Depth (m) |
Azimuth (°) |
Dip (°) |
| DSSJS1901 |
234,197.57 |
7,859,527.14 |
3,869.13 |
541.5 |
90 |
-45 |
| DSSJS1701 |
234,237.50 |
7,859,423.20 |
3,856.11 |
433.5 |
270 |
-45 |
| DSSJS1702 |
234,238.25 |
7,859,423.60 |
3,856.16 |
223.5 |
90 |
-45 |
| DSSJS1702B |
234,237.97 |
7,859,424.53 |
3,856.19 |
565.5 |
90 |
-45 |
| DSSJS1703 |
234,236.98 |
7,859,423.94 |
3,856.20 |
505.5 |
218 |
-45 |
| DSSBR195001 |
234,002.18 |
7,860,300.51 |
4,102.29 |
301.9 |
60 |
-45 |
| DSSJS1801 |
234,246.02 |
7,859,476.75 |
3,862.35 |
496.5 |
90 |
-45 |
| DSSBR2101 |
233,986.24 |
7,860,359.37 |
4,079.55 |
721.5 |
60 |
-47 |
| DSSJS1802 |
234,245.60 |
7,859,476.84 |
3,862.27 |
508.5 |
270 |
-45 |
Note: Coordinate system:
WGS 84, UTM20 S.
Source: AMC Mining Consultants
(Canada) Ltd., based on information provided by New Pacific Minerals Corp.
Drill results of North Block are pending
as of the effective date of this report.
| Silver Sand Project Pre-Feasibility Study |
| | New Pacific Metals Corp. | 0723071 |
| Figure 10.9 | Drillholes of North Block |
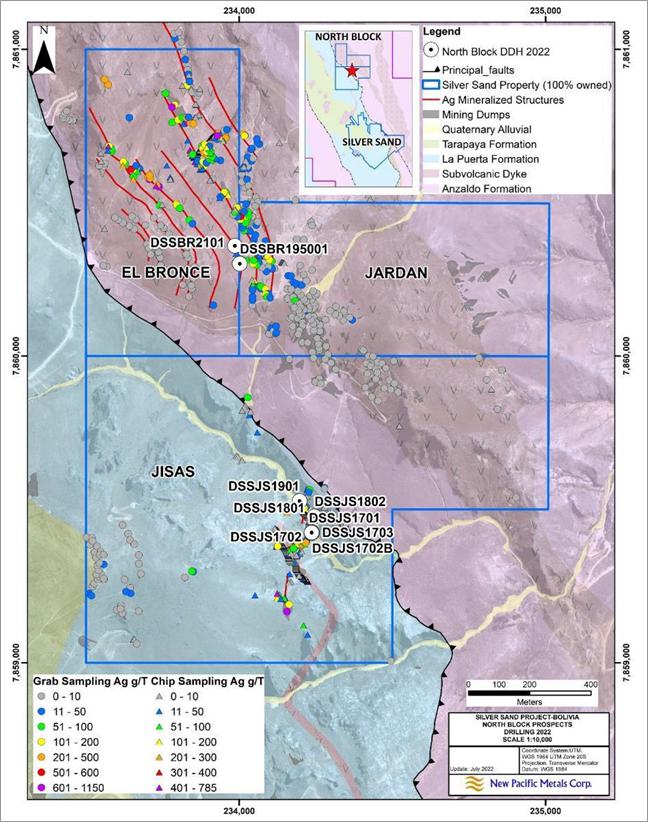
Source: New Pacific Metals Corp., 2022.
| Silver Sand Project Pre-Feasibility Study |
| | New Pacific Metals Corp. | 0723071 |
| 10.6 | Review of drilling results |
To the end of July of 2022, a total
of 139,920 m in 564 drillholes have been completed on the Property. Most holes intersected silver mineralization hosted in altered sandstones
and dacitic intrusions. Drill results confirmed the extent and continuity of mineralization at the Silver Sand deposit which remains open
on strike and at depth.
Up to July 2022, assay results for
544 of 564 drillholes have been received. Highlights of drillhole intersections are presented in Table 10.3. The grades are length-weighted
average, based on intersected widths and composited at a nominal 20 g/t Ag cut-off. As to a large degree the intersections are not far
off normal to the trend of the mineralization the intersected and true widths are similar. This is demonstrated in Figure 10.6 and Figure
10.7.
| Table 10.3 | Drill intercepts for the Silver Sand deposit |
| Hole_ID |
|
From (m) |
To (m) |
Interval (m) |
Ag (g/t) |
Pb (%) |
Zn (%) |
| DSS4402 |
Incl. |
69.85 |
214.7 |
144.85 |
86 |
0.03 |
0.05 |
| 129.50 |
178.0 |
48.50 |
211 |
0.03 |
0.03 |
|
DSS4609 |
|
63.38 |
147.3 |
83.92 |
116 |
0.07 |
0.10 |
| Incl. |
84.30 |
94.70 |
10.40 |
398 |
0.28 |
0.04 |
| Incl. |
138.40 |
147.30 |
8.90 |
414 |
0.15 |
0.02 |
| DSS505003 |
Incl. |
59.85 |
285.67 |
225.82 |
116 |
0.05 |
0.01 |
| 185.76 |
285.67 |
99.91 |
244 |
0.09 |
0.01 |
|
DSS505004 |
|
73.50 |
168.70 |
95.20 |
162 |
0.06 |
0.13 |
| Incl. |
117.70 |
134.40 |
16.70 |
703 |
0.10 |
0.00 |
| Incl. |
161.40 |
168.70 |
7.30 |
291 |
0.09 |
0.00 |
|
DSS5604 |
Incl. |
39.92 |
119.40 |
79.48 |
135 |
0.06 |
0.01 |
| 39.92 |
62.65 |
22.73 |
330 |
0.05 |
0.01 |
| 220.66 |
226.60 |
5.94 |
96 |
0.03 |
0.00 |
| DSS525009 |
Incl. |
59.90 |
238.89 |
178.99 |
96 |
0.03 |
0.02 |
| 126.49 |
144.52 |
18.03 |
362 |
0.03 |
0.00 |
|
DSS525010 |
|
12.00 |
118.40 |
106.40 |
154 |
0.04 |
0.03 |
| Incl. |
12.00 |
50.75 |
38.75 |
165 |
0.04 |
0.04 |
| Incl. |
92.43 |
96.46 |
4.03 |
2,366 |
0.42 |
0.00 |
| DSS5407 |
Incl. |
64.07 |
140.10 |
76.03 |
205 |
0.09 |
0.01 |
| 64.07 |
124.96 |
60.89 |
251 |
0.10 |
0.01 |
|
DSS645001 |
|
27.46 |
113.00 |
85.54 |
119 |
0.06 |
0.01 |
| Incl. |
27.46 |
53.50 |
26.04 |
189 |
0.05 |
0.00 |
| Incl. |
81.84 |
113.00 |
31.16 |
156 |
0.09 |
0.02 |
| DSS6603A |
Incl. |
7.90 |
73.15 |
65.25 |
181 |
0.08 |
0.10 |
| 7.90 |
39.90 |
32.00 |
304 |
0.08 |
0.15 |
|
DSS665001 |
|
44.23 |
134.00 |
89.77 |
115 |
0.12 |
0.31 |
| Incl. |
44.23 |
48.68 |
4.45 |
394 |
0.06 |
0.01 |
| Incl. |
58.00 |
95.15 |
37.15 |
149 |
0.17 |
0.34 |
|
DSS642501 |
|
23.15 |
137.38 |
114.23 |
117 |
0.06 |
0.02 |
| Incl. |
23.15 |
31.43 |
8.28 |
265 |
0.01 |
0.00 |
| Incl. |
46.20 |
53.09 |
6.89 |
313 |
0.13 |
0.01 |
| Incl. |
103.83 |
107 |
3.17 |
1,105 |
0.21 |
0.06 |
| Silver Sand Project Pre-Feasibility Study |
| | New Pacific Metals Corp. | 0723071 |
| Hole_ID |
|
From (m) |
To (m) |
Interval (m) |
Ag (g/t) |
Pb (%) |
Zn (%) |
| DSS422501 |
Incl. |
41.70 |
146.20 |
104.50 |
183 |
0.05 |
0.11 |
| 80.25 |
146.20 |
65.95 |
282 |
0.05 |
0.00 |
|
DSS507502 |
|
82.10 |
165.52 |
83.42 |
116 |
0.03 |
0.04 |
| Incl. |
82.10 |
108.65 |
26.55 |
242 |
0.06 |
0.05 |
| Incl. |
145.38 |
165.52 |
20.14 |
155 |
0.02 |
0.00 |
|
DSS507503 |
|
98.50 |
155.86 |
57.36 |
354 |
0.11 |
0.02 |
| Incl. |
98.50 |
116.94 |
18.44 |
403 |
0.16 |
0.01 |
| Incl. |
142.70 |
146.30 |
3.60 |
3,378 |
0.72 |
0.05 |
|
DSS522503 |
|
62.95 |
244.22 |
181.27 |
100 |
0.04 |
0.01 |
| Incl. |
128.05 |
222.23 |
94.18 |
177 |
0.06 |
0.01 |
| Incl. |
205.55 |
222.23 |
16.68 |
754 |
0.20 |
0.01 |
|
DSS5213 |
|
61.90 |
241.80 |
179.90 |
88 |
0.09 |
0.02 |
| Incl. |
114.90 |
132.00 |
17.10 |
265 |
0.59 |
0.01 |
| Incl. |
173.98 |
187.15 |
13.17 |
339 |
0.04 |
0.00 |
|
DSS5214 |
|
51.60 |
161.35 |
109.75 |
96 |
0.07 |
0.03 |
| Incl. |
54.35 |
68.50 |
14.15 |
250 |
0.06 |
0.01 |
| Incl. |
87.30 |
103.80 |
16.50 |
228 |
0.11 |
0.02 |
|
DSS522506 |
|
73.80 |
239.30 |
165.50 |
204 |
0.06 |
0.01 |
| Incl. |
73.80 |
167.30 |
93.50 |
336 |
0.10 |
0.00 |
| Incl. |
116.30 |
161.30 |
45.00 |
641 |
0.19 |
0.01 |
| DSS422503 |
Incl. |
65.86 |
209.30 |
143.44 |
110 |
0.04 |
0.03 |
| 173.30 |
183.47 |
10.17 |
860 |
0.18 |
0.00 |
| DSS522510 |
|
5.30 |
53.39 |
48.09 |
176 |
0.02 |
0.00 |
| 213.5 |
216.07 |
2.57 |
748 |
0.35 |
0.00 |
| DSS565006 |
Incl. |
19.91 |
84.37 |
64.46 |
250 |
0.09 |
0.01 |
| 40.00 |
60.70 |
20.70 |
613 |
0.16 |
0.01 |
|
DSS645005 |
|
27.10 |
235.17 |
208.07 |
73 |
0.11 |
0.28 |
| Incl. |
86.57 |
90.28 |
3.71 |
513 |
0.33 |
0.46 |
| Incl. |
180.74 |
205.00 |
24.26 |
270 |
0.13 |
0.07 |
| DSS407502 |
Incl. |
90.12 |
158.00 |
67.88 |
218 |
0.04 |
0.00 |
| 137.00 |
149.34 |
12.34 |
496 |
0.11 |
0.00 |
| DSS522513 |
Incl. |
40.32 |
149.3 |
108.98 |
228 |
0.13 |
0.01 |
| 43.84 |
98.30 |
54.46 |
414 |
0.20 |
0.01 |
| DSS525021 |
Incl. |
4.90 |
284.15 |
279.25 |
91 |
0.09 |
0.00 |
| 217.55 |
232.95 |
15.40 |
657 |
0.24 |
0.00 |
|
DSS527505 |
|
40.10 |
118.30 |
78.20 |
245 |
0.17 |
0.16 |
| Incl. |
43.30 |
71.74 |
28.44 |
335 |
0.20 |
0.07 |
| Incl. |
83.10 |
96.30 |
13.20 |
541 |
0.19 |
0.47 |
|
DSS644001 |
|
23.00 |
156.63 |
133.63 |
91 |
0.05 |
0.04 |
| Incl. |
56.92 |
65.75 |
8.83 |
296 |
0.11 |
0.00 |
| Incl. |
90.00 |
112.56 |
22.56 |
246 |
0.06 |
0.02 |
| DSS325001 |
|
147.66 |
155.30 |
7.64 |
448 |
0.09 |
0.00 |
| 163.00 |
182.76 |
19.76 |
150 |
0.06 |
0.10 |
| DSS702501 |
|
84.90 |
139.09 |
54.19 |
132 |
0.38 |
0.54 |
| 178.80 |
184.00 |
5.20 |
46 |
0.04 |
0.00 |
| Silver Sand Project Pre-Feasibility Study |
| | New Pacific Metals Corp. | 0723071 |
| Hole_ID |
|
From (m) |
To (m) |
Interval (m) |
Ag (g/t) |
Pb (%) |
Zn (%) |
|
DSS685002 |
Incl.
|
11.66 |
42.96 |
31.30 |
171 |
0.02 |
0.00 |
| 26.75 |
41.46 |
14.71 |
298 |
0.03 |
0.00 |
| 120.2 |
148.53 |
28.33 |
48 |
0.09 |
0.02 |
|
DSS7002 |
|
25.28 |
40.54 |
15.26 |
285 |
0.02 |
0.00 |
| 131.59 |
144.7 |
13.11 |
62 |
0.11 |
0.14 |
| 180.47 |
183.15 |
2.68 |
215 |
0.19 |
0.14 |
|
DSS487505
|
Incl.
|
32.45 |
51.93 |
19.48 |
337 |
0.00 |
0.00 |
| 38.53 |
47.16 |
8.63 |
715 |
0.00 |
0.00 |
| 91.83 |
103.88 |
12.05 |
160 |
0.03 |
0.00 |
| 162.96 |
180.87 |
17.91 |
78 |
0.48 |
0.01 |
|
DSS582501
|
|
30.57 |
75.34 |
44.77 |
214 |
0.10 |
0.00 |
| |
151.46 |
176.50 |
25.04 |
143 |
0.07 |
0.11 |
| Incl. |
151.46 |
154.00 |
2.54 |
823 |
0.07 |
0.00 |
| Incl. |
169.00 |
171.12 |
2.12 |
536 |
0.31 |
0.17 |
| DSS5218 |
Incl. |
60.50 |
132.94 |
72.44 |
279 |
0.06 |
0.04 |
| 84.95 |
117.91 |
32.96 |
517 |
0.10 |
0.06 |
Source: AMC Mining Consultants
(Canada) Ltd., based on information provided by New Pacific Minerals Corp.
At this time there are no known
drilling, sampling, or recovery factors that could impact the accuracy and reliability of the results. Due to fine-grained mineralization
occurring on fractures, there is the possibility of loss of mineralization during the drilling, transportation, and core handling processes,
which may lead to underestimation of the grade.
| Silver Sand Project Pre-Feasibility Study |
| | New Pacific Metals Corp. | 0723071 |
| 11 | Sample
preparation, analyses, and security |
This section describes the sampling
methods, analytical techniques and assay QA/QC protocols employed at the Silver Sand Property between October 2017 and July 2022, with
a focus on the 2020 – July 2022 period. All exploration programs were managed by New Pacific, and all work was carried out in accordance
with New Pacific’s internal procedures.
Rock chip samples were collected
by New Pacific personnel from surface outcrop and existing underground workings. In both cases, continuous samples were collected from
sample lines across mineralization using a hammer and chisel. Surface outcrop sample lines were orientated approximately perpendicular
to the strike of mineralization and samples were collected at 1.5 m intervals. Underground samples were collected at 1.0 m intervals from
the walls of accessible tunnels that cross-cut mineralization.
In both instances, samples were
collected in plastic bags. Sample information was recorded in a sample tag book pre-numbered with a unique sample identifier and multiple
tear-off tags. One sample tag is included in the plastic bag with the sample, before the bag is sealed. The sample number is also written
on each bag with a permanent indelible marker.
Grab samples were collected by New
Pacific personnel from waste rock dumps generated by historical mining operations. Samples were collected randomly from the waste dumps.
The number of samples collected was dependent on the size of the dump.
All drilling completed at the Property
between September 2021 and July 2022 was completed by contract diamond drillers using HQ (64 mm) sized equipment. Drilling, logging, and
core processing procedures are described in detail in Section 10 of this report. This process is in line with the procedures which were
implemented for the earlier programs which were described in the 2020 Technical Report.
Core sampling was completed by New
Pacific personnel at Betanzos as part of the core processing workflow. After samples are logged, sample intervals are identified by the
geologists based on visual parameters. Individual sample intervals are physically marked out on the core using an indelible marker or
crayon at intervals between 1.0 and 1.5 m lengths and respecting geological, structural and alteration contacts and poor sample recovery
(voids, sample loss) as appropriate. Sampling intervals typically extend above and below the visually mineralized zone by 2 m. Core intervals
with no recovery due to core loss or intersection of historical mine workings are identified and recorded.
During this sampling process the
geologist records the hole ID and relevant from and to interval of the sample in a sample tag book pre-numbered with a unique sample identifier
and two tear-off tags. A cut line is also marked along the core axis with a marker of crayon by geologists at this time.
After the core has been photographed,
core to be sampled is cut in half along the cut line using a diamond saw. Half of the core is then collected consistently from one side
of the cutting line and placed into sample bags pre-labelled with a corresponding unique sample number. Samples intervals are cross checked
with the sample tag book and the prelabelled sample bag. The outer
| Silver Sand Project Pre-Feasibility Study |
| | New Pacific Metals Corp. | 0723071 |
portion of the tear off sample
tag is affixed to the core box at the start of the sample interval and the inner tear-off tag is placed into the sample bag.
Once sampling is complete the geologist
checks the samples and seals the plastic sample bags with staples and tape. QA/QC samples are inserted into the sample sequence and sample
bags are then placed into large poly-weave sample bags for transportation to the laboratory. Individual sample batches comprise up to
100 samples.
| Figure 11.1 | New Pacific Betanoz core logging and sampling facility |
Notes: Left: core logging area, Right:
diamond core saws.
Source: AMC Mining Consultants (Canada) Ltd., 2022.
| 11.2 | Sample shipment and security |
New Pacific manages all aspects of
sampling from the collection of samples to sample delivery to the laboratory. All samples are stored and processed at Betanzos. This facility
is surrounded by a brick wall, has a locked gate, and is monitored by video surveillance and security guard 24 hours a day, seven days
a week. Within the facility, there are separate and locked areas for core logging, sampling, and storage.
Drilling samples are collected
from the drill site at the Property at least every 24 hours as part of routine site inspections and drill management completed by site
geologists. Geological “quick logs”, portable XRF analyses and photographs of each core box are completed during the site
inspection and before core boxes are transported.
Samples are transported from the
Betanzos facility to the laboratory in Oruro, Bolivia for sample preparation. This is done on a weekly basis by New Pacific personnel.
Sample shipments typically comprise up to 800 samples.
| Silver Sand Project Pre-Feasibility Study |
| | New Pacific Metals Corp. | 0723071 |
| Figure 11.2 | New Pacific Betanoz core processing facility |
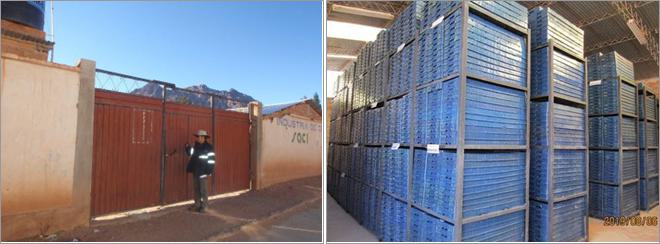
Notes: Left: core processing facility security,
Right: core storage.
Source: AMC Mining Consultants (Canada) Ltd., 2022.
| 11.3 | Sample preparation and analysis |
All drill core, chip and grab samples
collected by New Pacific between September 2021 and July 2022 were dispatched to ALS laboratories (ALS) in Oruro, Bolivia for sample preparation,
and then to ALS in Lima, Peru for geochemical analysis. ALS Oruro and ALS Lima are part of ALS Global – an independent commercial
laboratory specializing in analytical geochemistry services. Both labs are certified in accordance with the International Organization
for Standardization (ISO) and International Electrotechnical Commission (IES) “General requirements for the competence of testing
and calibration laboratories” (ISO/IES 17025:2017).
All samples are prepared in accordance
with ALS preparation code PREP-31 which involves crushing samples to 70% less than 2 mm, riffle splitting off 250 g and then pulverizing
the split sample to better than 85% passing a 75 µm (micron) sieve.
All pulp samples were then transferred
to ALS Lima for sample analysis. A summary of analytical methods used is presented in Table 11.2.
Sample analysis completed in 2017
and 2018 comprised an aqua regia digest followed by Inductively Coupled Plasma (ICP) Atomic Emission Spectroscopy (AES) analysis of Ag,
Pb, and Zn (ALS code OG46). Samples returning assay results greater than 1,500 g/t Ag (over-limit samples) were analyzed by fire assay
and gravimetric finish (ALS code Ag-GRA21). New Pacific subsequently requested all pulp samples with Ag values greater than 5 ppm be analyzed
using an ICP-AES 35 element analysis (ALS code ME-ICP41). This approach was taken primarily to understand the impact of potential credit
elements gallium and indium.
New Pacific changed its analysis
protocol in 2019 to include systematic multielement analysis. All samples were sent for an initial 51 element ICP mass spectroscopy (MS)
analysis (ALS code ME-MS41). Over-limit samples (>100 ppm Ag, or >10,000 ppm Pb or >10,000 ppm Zn) were then analyzed by ALS
code OG46. For the third pass, for over-limit Samples with Ag results which exceeded the upper limit of detection of the OG46 analysis
(>1,500 ppm) were then subsequently analyzed by fire assay and gravimetric analysis (Ag-GRA21).
| Silver Sand Project Pre-Feasibility Study |
| | New Pacific Metals Corp. | 0723071 |
| Table 11.1 | New Pacific sample analysis |
Drill
campaign |
ALS analysis
code* |
Elements |
Detection range |
Description |
Protocol notes |
|
2017 – 2018 |
Ag-OG46
Pb-OG46
Zn-OG46 |
Ag
Pb
Zn |
1-1,500 ppm
0.001-20%
0.01-10% |
0.4 g sample
Aqua-regia digest
ICP-AES analysis |
Initial analysis
Ag samples > 1,500 ppm analyzed by AG-GRA21 |
|
Ag-GRA21 |
Ag |
5-10,000 ppm |
30 g sample
Fire assay
gravimetric analysis |
Over limit analysis |
|
VH-ME-ICP4
(Actlabs) |
Ag
Pb, Zn
35 other elements |
0.2-100 ppm
2-10,000 ppm
variable |
0.5 g sample
Aqua-regia digest
ICP-OES analysis |
Subsequent analysis completed on pulps with Ag >=5 ppm |
|
2019
2020 - 2022 |
ME-MS41 |
Ag
Pb
Zn
48 other elements |
0.01-100 ppm
0.2-10,000 ppm
2-10,000 ppm
variable |
0.5 g sample
Aqua-regia digest
ICP-MS analysis |
Initial analysis
Over limit samples analyzed by OG-46 |
|
Ag-OG46
Pb-OG46
Zn-OG46 |
Ag
Pb
Zn |
1-1,500 ppm
0.001-20 %
0.01-10 % |
0.4 g sample
Aqua-regia digest
ICP-AES analysis |
(Over limit analysis #1)
Ag samples > 1,500 ppm analyzed by Ag-GRA21 |
|
Ag-GRA21 |
Ag |
5-10,000 ppm |
30 g sample
Fire assay, gravimetric
analysis |
(Over limit analysis #2) |
Notes: *Unless otherwise
stated.
Overlimit protocols shown for 2019 but were
refined for later programs as described in the text below.
Source: Compiled by AMC Mining Consultants (Canada) Ltd., 2022.
For the 2020 –
2022 analysis protocol, there was a slight variation in how over-limit samples were defined after the ICP mass spectrometry
analysis. First pass over-limit samples (Ag > 30 ppm, or > 10,000 ppm Pb or Zn) were analyzed using aqua regia digestion with
Inductively Coupled Plasma- Atomic Emission Spectroscopy (ICP-AES) or Atomic Absorption Spectroscopy (AAS) finish (ALS Code
OG46).
Samples with gold mineralization
went to a second pass of analysis by fire assay and AAS finish (ALS Code Au-AA25). If these samples > 100 ppm, they were analysed by
fire assay with gravimetric finish (ALS Code Au-GRA21) which has an upper detection limit of 1,000 ppm. Au samples > 1,000 ppm underwent
analysis by fire assay with gravimetric finish (ALS Code Au-CON01).
Samples with > 1,500 ppm Ag were
analysed by fire assay with gravimetric finish (ALS Code Ag-GAR21) with an upper detection limit of 10,000 ppm. Ag samples > 10,000
ppm underwent analysis by fire assay with gravimetric finish (ALS Code Ag-CON01).
Samples with > 20% Pb, 30% Zn,
and 40% Cu underwent analysis by classic titration methods (ALS Code Pb-VOL70, Zn-VOL50, and Cu-VOL61).
Density measurements are completed
by New Pacific personnel as part of routine core processing procedures. Samples are selected in both mineralized and non-mineralized areas
at a rate of 1 in every 15 samples. Measurements are completed at a dedicated density weigh station using the Archimedes principle, whereby
water displacement is used to approximate volume. Density is calculated by dividing the dry weight by the calculated volume. This method
is considered to be
| Silver Sand Project Pre-Feasibility Study |
| | New Pacific Metals Corp. | 0723071 |
appropriate for competent, non-porous
core samples. Weigh scale calibration is completed regularly as part of the density sampling program.
The QP recommends New Pacific improve
density QA/QC procedures by:
| · | Incorporating the regular use of a density standard. |
| · | Weigh samples following immersion to ensure that the sample is not absorbing water. |
| · | Sending a portion of samples to a third-party laboratory for a density measurement check. |
| 11.5 | Quality Assurance / Quality Control |
New Pacific has established QA/QC
procedures which cover sample collection and processing at the Silver Sand Property. All drilling programs completed on the property incorporate
the insertion of certified reference materials (CRMs), blanks, and duplicates into the sample stream on a batch-by-batch basis. The QP
completed a detailed review of QA/QC protocols during a site visit in 2019 and again in May 2022. The following discussion is based on
the QP’s findings from the site visit and an independent review of drilling and QA/QC databases associated with the 556 drillholes
for which assays have been received at the date of closure of the database for the Mineral Resource.
New Pacific monitors Ag, Au, Pb,
Zn, and Cu assay values in CRMs, blanks, and duplicates however only the results of silver are discussed in this report as silver constitutes
the majority of the value in the Mineral Resource.
A summary of QA/QC samples from
the October 2017 – July 2022 program is presented in Table 11.2.
| Table 11.2 |
Silver Sand QA/QC samples by year1 (October 2017 – July 2022) |
Year2 |
Drill
Samples |
CRMs3 |
Coarse
Blanks |
Pulp
Blanks |
Field
duplicates
(¼ core) |
Pulp
duplicates |
Coarse
reject
duplicates |
Coarse
reject
umpire
duplicates |
| 2017 |
3,213 |
172 |
31 |
0 |
16 |
0 |
0 |
173 |
| 2018 |
34,638 |
1,747 |
1,684 |
0 |
208 |
0 |
0 |
1,615 |
| 2019 |
30,629 |
1,106 |
1,159 |
0 |
243 |
0 |
0 |
1,063 |
| 2020 |
1,735 |
359 |
422 |
0 |
0 |
0 |
0 |
0 |
| 2021 |
7,688 |
433 |
327 |
141 |
309 |
288 |
312 |
0 |
| 2022 |
12,292 |
678 |
435 |
305 |
496 |
449 |
484 |
0 |
| Total |
90,175 |
4,495 |
4,058 |
446 |
1,272 |
737 |
796 |
2,851 |
Notes:
| 1 | Based on 556 drillholes with assay results. |
| 2 | Drillhole year based on the date of the Ag assay. |
| 3 | CRM statistics excludes CRMs
submitted with umpire duplicate samples. |
Source: Compiled by AMC Mining
Consultants (Canada) Ltd., 2022.
Table 11.3 summarizes the
insertion rate of these QA/QC samples. New Pacific’s QA/QC submission rate protocols are:
| · | Field duplicates – 2 - 3% |
| · | Coarse reject duplicates – 2 – 3% |
| · | Pulp duplicates – 2 – 3% |
| Silver Sand Project Pre-Feasibility Study |
| | New Pacific Metals Corp. | 0723071 |
The QP recommends that insertion
rates should be approximately 5% for CRMs and blanks and 6% for duplicates (2% each for field, coarse reject, and pulps duplicates) and
5% for umpires.
| Table 11.3 | Silver Sand QA/QC submission rates1
(October 2017 – July 2022) |
Year2 |
CRMs3 |
Coarse
Blanks |
Pulp
Blanks |
Field
duplicates
(¼ core) |
Pulp
duplicates |
Coarse
reject
duplicates |
Coarse
reject
umpire
duplicates |
Total
QA/QC |
| 2017 |
5.4% |
1.0% |
0.0% |
0.5% |
0.0% |
0.0% |
5.4% |
12.2% |
| 2018 |
5.0% |
4.9% |
0.0% |
0.6% |
0.0% |
0.0% |
4.7% |
15.2% |
| 2019 |
3.6% |
3.8% |
0.0% |
0.8% |
0.0% |
0.0% |
3.5% |
11.7% |
| 2020 |
20.7% |
24.3% |
0.0% |
0.0% |
0.0% |
0.0% |
0.0% |
45.0% |
| 2021 |
5.7% |
4.3% |
1.8% |
4.0% |
3.8% |
4.1% |
0.0% |
23.6% |
| 2022 |
5.5% |
3.5% |
2.5% |
4.0% |
3.7% |
4.0% |
0.0% |
23.2% |
| Overall |
5.0% |
4.5% |
0.5% |
1.4% |
0.8% |
0.9% |
3.2% |
16.3% |
Notes:
1 Based on 550 drillholes with assay
results.
2 Drillhole year based on the date
of the Ag assay.
3 CRM statistics excludes CRMs
submitted with umpire duplicate samples.
Source: Compiled by AMC Mining Consultants (Canada) Ltd., 2022.
| 11.5.1 | Certified Reference Materials |
Four different CRMs were used by
New Pacific in the 2017 – July 2022 drill programs, one of which, CDN-ME-1605 was discontinued in 2018. All CRMs were supplied by
CDN Resource Laboratories of Langley, British Columbia, Canada and are certified for Ag, Au, Pb, Cu, and Zn analysis by four acid digest
and ICP. All CRMs have a relative standard deviation (RSD) of less than 5%.
Details of CRMs
used at Silver Sand are presented in Table 11.4.
| Table
11.4 | Silver Sand CRMs (October 2017 – July 2022) |
CRM |
Ag
(g/t) |
Number
of CRMs inserted by year |
| Expected
value |
Certified
SD |
2017 |
2018 |
2019 |
2020 |
2021 |
2022 |
| CDN-ME-1501 |
34.6 |
1.15 |
0 |
0 |
370 |
133 |
189 |
231 |
| CDN-ME-1603 |
86 |
1.5 |
0 |
999 |
496 |
144 |
155 |
285 |
| CDN-ME-1810 |
154 |
4.5 |
0 |
0 |
240 |
82 |
89 |
162 |
| CDN-ME-1605 |
274 |
4.5 |
172 |
748 |
0 |
0 |
0 |
0 |
Notes: All CRM values shown are certified
for four-acid digest and ICP analysis, SD=standard deviation.
Source: Compiled by AMC Mining Consultants (Canada) Ltd., 2022.
CRMs are supplied as both 100 g
individual sealed packages and in bulk 1 kg containers. New Pacific personnel package bulk material into 100 g ‘zip-lock’
bags for insertion into the sample stream. Disposable gloves and spoons are used to ensure contamination does not occur during this process.
New Pacific’s internal procedures
require that one CRM is inserted for every 20 samples. CRM performance is monitored on a batch-by-batch basis. New Pacific considers CRMs
with laboratory assay results outside of three standard deviations as stipulated on the CRM certificate to have failed. Failed samples
are investigated by New Pacific and sample batches are re-analyzed as required. For ME-MS41 analysis, New Pacific accepts assay results
within 10% plus 2 times the detection limit of the expected value of the CRM, based on internal discussions with ALS. New Pacific has
re-assayed
| Silver Sand Project Pre-Feasibility Study |
| | New Pacific Metals Corp. | 0723071 |
two sample batches. Batches that
failed but did not contain mineralized material were not re-assayed.
CRMs contain standard, predetermined
concentrations of material (Ag) which are inserted to into the sample stream to check the analytical accuracy of the laboratory. The QP
recommends an insertion rate of at least 5% of the total samples assayed. CRMs should be monitored on a batch-by-batch basis and remedial
action taken immediately if required. For each economic mineral, the QP recommends the use of at least three CRMs with values:
| · | At the approximate cut-off grade (COG) of the deposit. |
| · | At the approximate expected grade of the deposit. |
A total of 4,495 CRMs was submitted
between October 2017 and July 2022 representing an average overall insertion rate of 5.0%. Insertion rates for CRMs have been consistently
above 5% on a yearly basis except for 2019.
The average grade of the Silver
Sand open pit Mineral Resource is approximately 116 g/t Ag at a 30 g/t Ag COG. The QP considers CDN-ME-1501 (34.6 g/t Ag) to be appropriate
to monitor the analytical accuracy at the COG of the deposit. CDN-ME-1603 (86 g/t Ag) and CDN-ME-1810 (154 g/t Ag) monitor analytical
accuracy below and above the average grade. CDN-ME-1605 (274 g/t Ag) monitors analytical accuracy at higher grades, however this CRM was
not used beyond the 2018 program. The QP notes that there was no CRM used in 2017 or 2018 to monitor laboratory accuracy at the cut-off
and average grades. While there is presently no individual CRM monitoring the average grade of the deposit, the QP considers CDN-ME-1603
and CDN-ME-1810 to adequately cover the anticipated grade ranges and provide confidence in analytical results.
The QP typically recommends re-assaying
batches where two consecutive CRMs in a batch occur outside two standard deviations (warning), or one CRM occurs outside of three standard
deviations (fail) of the expected value described on the assay certificate.
Control charts are commonly used
to monitor the analytical performance of an individual CRM over time. CRM assay results are plotted in order of analysis. Control lines
are also plotted on the chart for the expected value of the CRM, two standard deviations above and below the expected value, and three
standard deviations above and below the expected value. These charts show analytical drift, bias, trends, and irregularities occurring
at the laboratory over time. Table 11.5 presents detail on CRM performance for the entire period October 2017 – July 2022.
| Table 11.5 | Silver Sand CRM warnings and fails (October 2017 –
July 2022) |
CRM
ID |
Expected
value (Ag) |
Certified
SD |
Number
of assays |
#
Low
warnings
(-2SD) |
#
High
warnings
(+2SD) |
#
Low fail
(-3SD) |
High
fail
(+3SD) |
Fail
%
(>3SD) |
| CDN-ME-1501 |
34.6 g/t |
1.15 |
923 |
25 |
21 |
4 |
4 |
0.87 |
| CDN-ME-1603 |
86
g/t |
1.5 |
2,079 |
182 |
38 |
86 |
54 |
6.73 |
| CDN-ME-1810 |
154
g/t |
4.5 |
573 |
7 |
6 |
0 |
0 |
0.00 |
| CDN-ME-1605 |
274
g/t |
4.5 |
920 |
73 |
13 |
24 |
3 |
2.9 |
Notes: SD=standard deviation.
Source: Compiled by AMC
Mining Consultants (Canada) Ltd., 2022.
Figure 11.3 to Figure 11.5 presents
CRM control charts for silver. Control charts include control lines for two and three standard deviations and show the warnings and fails.
The control charts cover the
| Silver Sand Project Pre-Feasibility Study |
| | New Pacific Metals Corp. | 0723071 |
period from 2020 to July 2022, (2019 to July 2022 in the
case of CDN-ME- 1501). Example control charts from the period of 2017 to 2019 were presented in the 2020 Technical Report.
| Figure 11.3 | Control chart for CDN-ME-1501 (Ag) (2019 –
July 2022) |
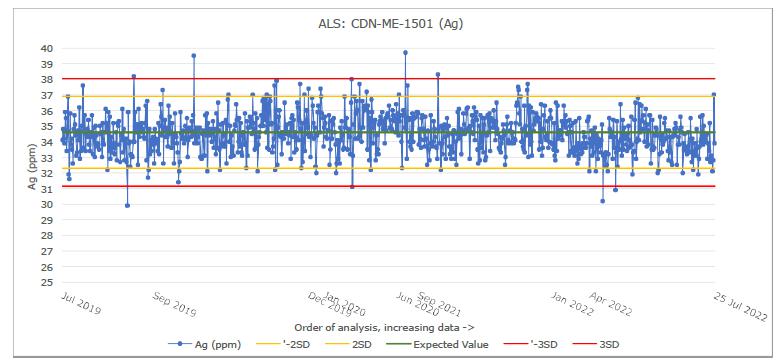
Note: CDN-ME-1501 contains all samples from
2019, not all 2019 samples were reported in the previous Technical Report.
Source: Compiled by AMC Mining Consultants (Canada) Ltd., 2022.
| Figure 11.4 | Control chart for CDN-ME-1603 (Ag) (2020 – July
2022) |
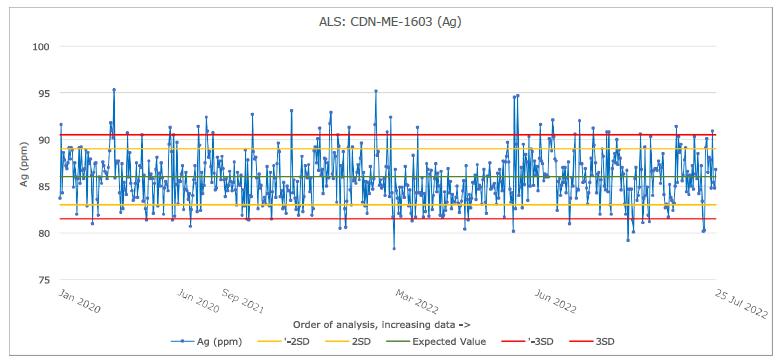
Source: Compiled by AMC Mining Consultants (Canada)
Ltd., 2022.
| Silver Sand Project Pre-Feasibility Study |
| | New Pacific Metals Corp. | 0723071 |
| Figure 11.5 | Control chart for CDN-ME-1810 (Ag) (2020 – July
2022) |
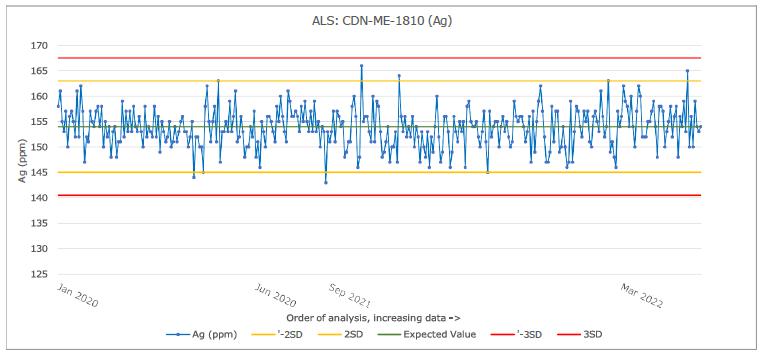
Source: Compiled by AMC
Mining Consultants (Canada) Ltd., 2022.
Table 11.6 shows the comparison
between the CRM and analytical results for the period 2020 – July 2022. There has been a slight improvement for CDN-ME-1603 since
the end of 2019 onwards, the means are very similar and there is a slight reduction in the difference between the standard deviations.
The other two CRMs performed similarly, with acceptable comparisons.
| Table 11.6 | Comparison between CRM values and analytical results
(2020 – July 2022) |
CRM |
CRM |
Analytical
results |
Comparison |
Expected
Ag
value (ppm) |
SD |
Number
of assays |
Mean |
SD |
Mean
vs
expected |
SD
of results
vs expected |
| CDN-ME-1501 |
34.6 |
1.2 |
923 |
34.5 |
1.2 |
99.71% |
100% |
| CDN-ME-1603 |
86 |
1.5 |
584 |
85.8 |
2.7 |
99.77% |
144.44% |
| CDN-ME-1810 |
154 |
4.5 |
333 |
153.8 |
3.9 |
99.87% |
85% |
Source: Compiled by AMC
Mining Consultants (Canada) Ltd., 2022.
The QP noted the following in the
previous Technical Report for the property regarding CRM performance, which covered the period October 2017 – 2019:
| · | CRMs used at Silver Sand generally show overall acceptable analytical accuracy. |
| · | The mean and standard deviation of analytical results
approximate the certified performance criteria and provide confidence in analytical results at the deposit COG and at higher grades (150
g/t Ag). |
| · | From 2017 – 2019 CDN-ME-1603 showed poor analytical
precision with a significant number of analytical results occurring outside of two standard deviations, and 5.4% of samples occurring
outside of three standard deviations (failure limits). |
| · | CRM CDN-ME-1605 also showed sub-optimal analytical
precision with a significant number of analytical results occurring outside of two standard deviations and 2.9% of samples occurring outside
three standard deviations (failure limits). While the average analytical results of CDN-ME-1605 are only ~1% lower than the certified
mean, the majority of samples outside control limits are biased low. The standard deviation of analytical results is ~1.5 times greater
than the certified value. |
| Silver Sand Project Pre-Feasibility Study |
| | New Pacific Metals Corp. | 0723071 |
| · | The excessive number of warnings and failures occurring
in CDN-ME-1603 and CDN-ME-1605 is concerning and should be further investigated prior to continued use. Standard deviations of analytical
results from these CRMs are 1.5 times greater than the between laboratory standard deviation provided by the CRM supplier. The QP notes
that CRMs were certified using a four-acid digest but that methods OG46 and ME-MS41 comprise an aqua-regia digest. This difference in
sample digestion may explain poor CRM performance. |
The QP notes that similar results
are observed in CRM performance post 2019 and reiterates the following with respect to CRM performance for the 2020 – July 2022
period:
| · | CRMs used at Silver Sand generally show overall acceptable analytical accuracy. |
| · | CRMs CDN-ME-1501 and CDN-ME-1810 still show acceptable
analytical precision, exhibiting low failure rates and with the majority of results falling within the control limits (3 standard deviations). |
| · | The number of warnings and failures occurring in
CDN-ME-1603 should be further investigated prior to continued use. The QP notes that CRMs were certified using a four-acid digest but
that methods OG46 and ME-MS41 comprise an aqua-regia digest. This difference in sample digestion may explain poor CRM performance. |
The QP makes the following recommendations
regarding CRMs at the Silver Sand project:
| · | Purchase an additional CRM around the average grade
(116 g/t Ag) of the deposit which has been certified using a similar digestion method. |
| · | Investigate performance issues with CRM CDN-ME-1603
if this CRM is to be used in future programs. This could be done by preparing several separate sample batches comprising 20-30 CRMs each
and comprising at least two different CRMs in random order. Each batch should then be sent to both the primary laboratory and at least
one other check laboratory. If results occur outside of certified performance criteria, expected values and standard deviation can be
calculated from laboratory results and used as performance criteria. |
| · | Re-evaluate the use of ME-MS41 analytical method.
If this method is to be used going forward it is recommended that the OG46 over-limit threshold be dropped from 100 g/t Ag to a level
below the anticipated COG. This is because of the poor precision of this method for Ag. |
New Pacific uses material collected
from quarry sites, local to the deposit as the source of coarse blank material. Cobble to boulder sized material is collected from a quarry
site and broken with hammers into cm sized pieces by New Pacific personnel for insertion into the sample stream.
Two different sources have been
used as blank material over time. Limestone from a quarry site near Betanzos was used as the initial source of blank material, however
this was changed in July 2018 after receiving numerous results with elevated base metals. A new blank quarry site was subsequently sourced
approximately 30 km west of Silver Sand. Blank material collected from this quarry comprises red quartz sandstone of similar age and composition
to that hosting mineralization at the Silver Sand deposit. Five grab samples from this quarry site were sent for analysis at ALS using
ME-MS41. Results ranged between 0.01 and 0.04 g/t Ag, averaging 0.02 g/t Ag.
New Pacific’s internal
procedures require that one coarse blank is inserted for every 20 samples. For the period October 2017 – 2019, New Pacific considered
blank samples with assay results above 1.3 g/t Ag as a warning and samples above 2.4 g/t Ag a fail. These control limits were developed
by New Pacific after reviewing analytical data, removing outliers, and calculating the average
| Silver Sand Project Pre-Feasibility Study |
| | New Pacific Metals Corp. | 0723071 |
background grade and standard deviation
of the blank material. The warning and fail limits are set at three times the standard deviation, and six times the standard deviation
of background samples respectively. Commencing in August 2019 New Pacific implemented a procedure for laboratory follow up. Assays from
blank samples that exceed the warning limit are investigated by New Pacific personnel and followed up as necessary. Assays from blank
samples that exceed the fail limit are discussed with the laboratory and re-analyzed as required.
For the programs post 2019, the
New Pacific protocols for the assessment of the performance of blanks has been adjusted slightly, a warning is considered above 1 Ag ppm
and a failure is considered above 2 Ag ppm. The change in protocol means that the threshold for failure is lower than for the 2017 –
2019 coarse blank samples. The QP considers this adjustment reasonable.
Pulp blanks were submitted in 2021
and 2022. The blank material is CRM CDN-GEO-1901. The source of the CRM is from a copper-gold porphyry deposit in British Columbia. The
CRM has a provisional mean for Ag of 1 ppm with a standard deviation of 0.15. The analytical method was four acid digestion with instrumental
finish.
Coarse blanks
Coarse blanks test for contamination
during both sample preparation and assaying. Blanks should be inserted in each batch sent to the laboratory. In the QP’s opinion,
when using typical feed grade analytical methods, 80% of coarse blanks should be less than three times the detection limit.
A total of 4,058 coarse blank samples
have been inserted since 2017, 1,184 of which were submitted between 2020 – July 2022, representing an overall insertion rate of
4.5%. The QP considers this an acceptable insertion rate.
For the October 2017 – 2019
period blank performance, New Pacific used a failure criteria for samples analyzed by ALS method OG46 as 2.4 times the Ag detection limit.
The QP acknowledged that applying a failure limit of three times this detection limit (0.01 g/t Ag) may not be practical for ore grade
level analysis but recommended the failure criteria level be reduced from 2.4 g/t Ag if ME-MS41 was to be used on an ongoing basis. This
has been implemented. In the QP’s opinion the blank monitoring procedures implemented by New Pacific over the 2017 – 2019
period were adequate to identify significant sample contamination during sample preparation and analysis. Blank samples showed no significant
systematic levels of contamination.
Table 11.7 summarizes the coarse
blank performance based on the New Pacific failure criteria for the period 2020 – July 2022. There has been an improvement in performance
since 2019. Coarse blank samples show no significant systematic levels of contamination.
| Table 11.7 | Silver Sand coarse blank performance (2020 – July
2022) |
| Year |
Total |
<1
Ag ppm
(Pass) |
1
- 2 Ag ppm
(Warning) |
>
2 ppm
(Fail) |
| 2020 |
422 |
419 |
1 |
2 |
| 2021 |
327 |
326 |
0 |
1 |
| 2022 |
435 |
430 |
2 |
1 |
| Total |
1,184 |
1,175 |
3 |
4 |
Source: Compiled by AMC
Mining Consultants (Canada) Ltd., 2022.
| Silver Sand Project Pre-Feasibility Study |
| | New Pacific Metals Corp. | 0723071 |
| Figure
11.6 |
Coarse blank control chart (2020 – July 2022) |
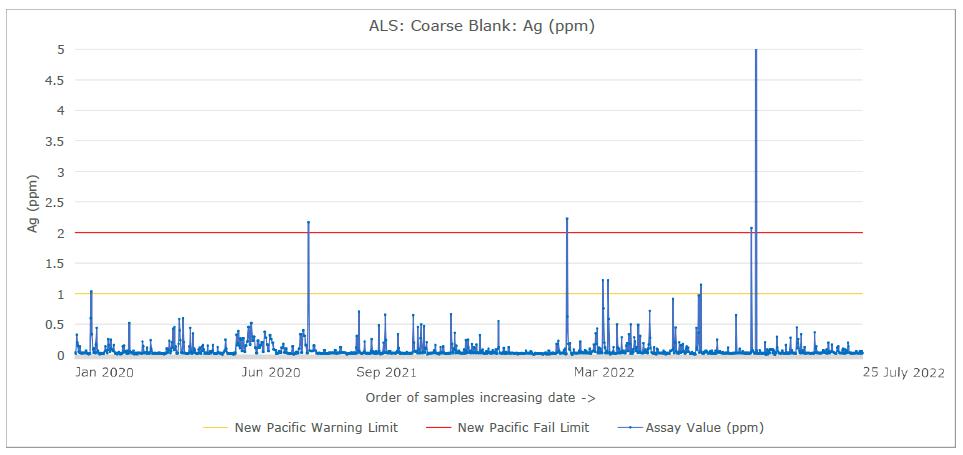
Note: The extreme
value recorded in 2022 is 20.5 Ag ppm.
Source: Compiled by AMC Mining Consultants (Canada) Ltd., 2022.
The QP notes that consistent monitoring
and follow up of coarse blank samples has only been completed and clearly documented since mid-2019, in that same year two sample investigations
were completed. In both cases, samples before and after the failed blank were re-analyzed. Contamination was found to have occurred during
sample preparation, from a preceding high-grade Ag interval. For 2020 onwards, only three failures have been recorded in 2022. Investigation
determined that this was due to elevated values in the blank sample which can happen due to the source of the material. These samples
also returned slightly elevated values for base metals.
In the QP’s opinion, the
coarse blank monitoring procedures implemented by New Pacific are adequate to identify significant sample contamination during sample
preparation and analysis. Blank samples show no significant systematic levels of contamination.
Pulp blanks
Pulp blanks test for contamination
occurring during the analytical process. Blanks should be inserted in each batch sent to the laboratory. In the QP’s opinion, when
using typical ore grade analytical methods is that 90% of pulp blanks should be within two times of the detection limit.
A total of 446 pulp blank samples
have been inserted since 2021, representing an overall insertion rate of 0.5%. The QP has applied the following protocols for assessing
the pulp blank samples. The value of 1.3 Ag ppm is equivalent to the provisional mean of the CRM plus two times the standard deviation.
This would equate to a warning value for a CRM, and a failure value of 1.45 Ag ppm (provisional mean plus three standard deviations).
Table 11.8 and Figure 11.7 show the pulp blank performance. There are two samples which show contamination.
| Silver Sand Project Pre-Feasibility Study |
| | New Pacific Metals Corp. | 0723071 |
| Table 11.8 | Silver Sand pulp blank performance (2021 – July 2022) |
| Year |
Total |
<1.3 ppm Ag
(Pass) |
1.3 to 1.45 ppm Ag
(Warning) |
> 1.45 ppm Ag
(Fail) |
| 2021 |
141 |
139 |
1 |
1 |
| 2022 |
305 |
301 |
3 |
1 |
| Total |
446 |
440 |
4 |
2 |
Source: Compiled by AMC Mining Consultants (Canada)
Ltd., 2022.
| Figure 11.7 | Pulp blank control chart (2021 – July 2022) |
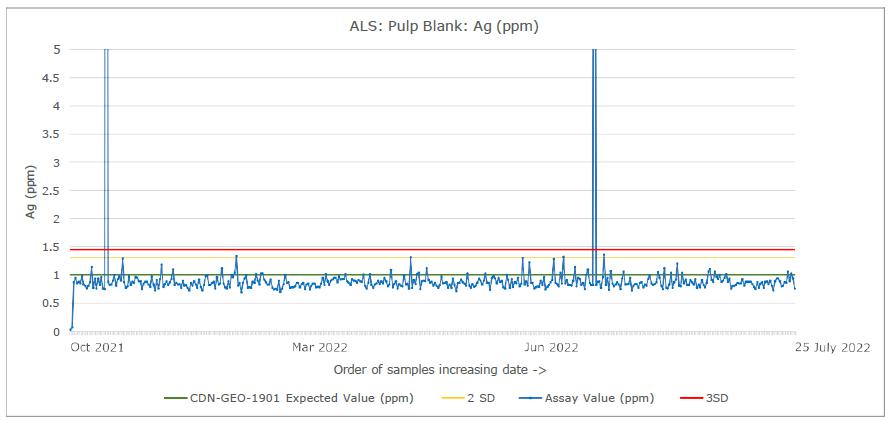
Note:
The two extreme values are 35.5 and 18.6 Ag ppm, respectively.
Source: Compiled by AMC Mining Consultants (Canada) Ltd., 2022.
In the QP’s opinion, the
pulp blank monitoring procedures implemented by New Pacific are adequate to identify significant sample contamination during sample analysis.
Blank samples show no significant systematic levels of contamination.
The QP makes the following recommendations regarding blank
samples:
| · | Continue to include coarse and pulp blanks in every batch of samples submitted
at a rate of at least 1 in every 20 samples (5%). |
| · | Continue to ensure that blanks are consistently monitored in real time
on a batch-by-batch basis and that remedial action is taken as issues arise. |
| · | Ensure that all blank sample follow up is recorded. |
New Pacific has submitted a total
of 1,272 quarter core field duplicate samples during the period October 2017 – July 2022, of which 805 were submitted from 2021
– July 2022. Field duplicate samples are selected once assay results have been received to ensure that duplicate samples encompass
the entire grade range. Duplicate samples are collected by cutting the remaining half core in half. One portion of the quarter core is
submitted for duplicate analysis, and the remaining portion of quarter core is returned to the core tray.
| Silver Sand Project Pre-Feasibility Study |
| | New Pacific Metals Corp. | 0723071 |
New Pacific did not submit pulp
duplicates prior to 2019, however, submitted 737 pulp duplicate samples between 2021 and July 2022.
New Pacific did not submit coarse
reject duplicates prior to 2019, however, submitted 796 coarse reject duplicate samples between 2021 and July 2022.
Field duplicates monitor sampling
variance, sample preparation and analytical variance, and geological variance. Coarse reject samples monitor sub-sampling variance, analytical
variance, and geological variance. Pulp duplicates monitor analytical and geological variance.
The QP recommends that field, coarse
and pulp duplicate samples be selected over the entire range of grades seen at the Project to ensure that the geological heterogeneity
is understood. However, the majority of duplicate samples should be selected from zones of mineralization. Unmineralized or very low-grade
samples should not form a significant portion of duplicate sample programs as analytical results approaching the stated limit of lower
detection are commonly inaccurate, and do not provide a meaningful assessment of variance.
Duplicate data can be assessed using
a variety of approaches. The QP typically assesses duplicate data using scatterplots and relative paired difference (RPD) plots. These
plots measure the absolute difference between a sample and its duplicate. For field duplicates it is desirable to achieve 80% to 85% of
the pairs having less than 20% RPD between the original assay and check assay. For coarse reject duplicates it is desirable to achieve
80% to 85% of the pairs having less than 15% RPD between the original assay and check assay. For pulp duplicates it is desirable to achieve
80% to 85% of the pairs having less than 10% RPD between the original assay and check assay. In these analyses, pairs with a mean of less
than 15 times the lower limit of analytical detection are excluded. Removing these low values ensures that there is no undue influence
on the RPD plots due to the higher variance of grades expected near the lower detection limit, where precision becomes poorer (Long et
al., 1997). For the assessment of the 2021 – July 2022 field duplicates, a lower detection limit of 0.01 Ag ppm was used and is
based on the ME-MS41 analytical method. Prior to this, a lower detection limit of 1 Ag ppm was used based on the Ag-OG46 analytical method.
Field duplicates
Submission rates for the field
duplicates has varied from year to year, with < 1% submission rates prior to 2021. For 2021 and 2022, the submission rates are 4%.
The overall submission rate of field duplicates for the period October 2017 – July 2022 is 1.4%.
Field duplicate performance for
the period October 2017 – 2019 showed a relatively poor correlation between duplicate sample pairs with only 34% of samples occurring
within 20% RPD. Based on these results the QP formed the opinion that that mineralization is heterogenous, that sample errors are occurring
during the sampling process, or a combination of both factors. The QP recommended further work to confirm whether the friable nature of
silver sulphosalts might have resulted in loss of portions of the mineralized veins during the core cutting and sampling process, resulting
in progressive decrease in sample grade with each stage of processing, and an overall net underestimation of metal.
The results of the field duplicate
performance for the period 2021 – July 2022 is presented using RPD and scatter plots shown in Figure 11.8 and a statistical comparison
is presented in Table 11.9. The duplicate data ranges from 0.01 ppm – 1,540 Ag ppm, with a mean of 14.27 Ag ppm. There are 643 samples
greater than 15 times the detection limit, which provides a reasonable sample size from which to make an assessment. The duplicates cover
the appropriate grade range.
| Silver Sand Project Pre-Feasibility Study |
| | New Pacific Metals Corp. | 0723071 |
| Figure 11.8 |
Silver Sand field duplicate RPD and scatter plot (2021 – July 2022) |
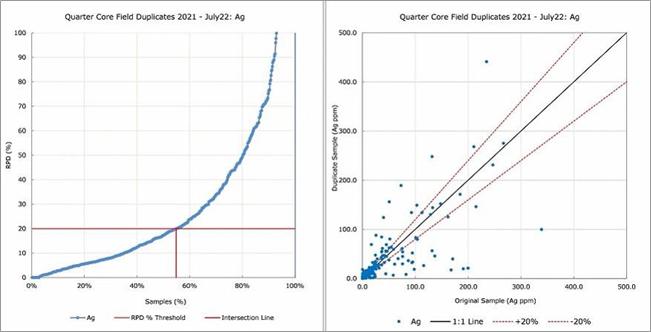
Note: the scatterplot is limited to 500
Ag ppm, only 2 samples in the dataset are above 500 Ag ppm.
Source: Compiled by AMC Mining Consultants (Canada) Ltd., 2022.
| Table 11.9 |
Silver sand field duplicate statistical summary (2021 – July 2022) |
| Ag (ppm) |
Original |
Duplicate |
| Number of samples |
805 |
805 |
| Number of samples > 15 times detection limit |
643 |
643 |
| Mean |
14.27 |
13.69 |
| Maximum |
1,525.00 |
1,540.00 |
| Minimum |
0.01 |
0.01 |
| Pop Std Dev. |
70.58 |
72.46 |
| CV |
4.95 |
5.29 |
| Cor Coeff |
0.94 |
- |
| Bias (all data) |
4.05% |
- |
| Percent Samples <20% RPD |
54.90 |
- |
Source: Compiled by AMC Mining Consultants (Canada)
Ltd., 2022.
The QP notes that the performance of the field duplicates
has improved significantly since 2019, although still showing poor precision. There is a slight bias towards the original sample.
Coarse reject duplicates
Submission rates for the coarse reject duplicates is approximately
4%, noting that these were only submitted between 2021 and July 2022. The QP considers the insertion rate to be reasonable.
The results of the
coarse reject duplicate performance for the period 2021 – July 2022 is presented using RPD and scatter plots shown in Figure
11.9 and a statistical comparison is presented in Table 11.10. The duplicate data ranges from 0.01 ppm – 2,090 Ag ppm, with a
mean of 19.42 Ag ppm. There are 634 samples greater than 15 times the detection limit, which provides a reasonable sample size from
which to make an assessment. The duplicates cover the appropriate grade range.
| Silver Sand Project Pre-Feasibility Study |
| | New Pacific Metals Corp. | 0723071 |
| Figure 11.9 |
Silver Sand coarse reject duplicate RPD and scatter plot (2021 – July 2022) |
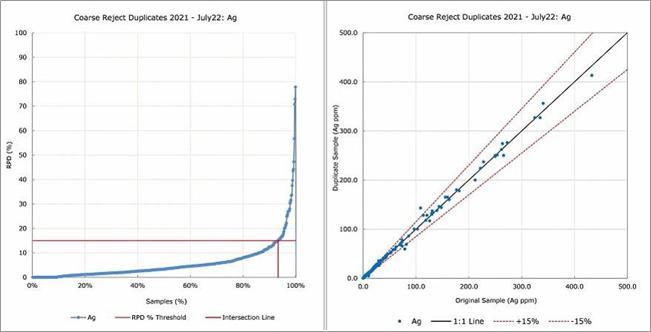
Note: the scatterplot is limited to 500
Ag ppm, only 3 samples in the dataset are above 500 Ag ppm.
Source: Compiled by AMC Mining Consultants (Canada) Ltd., 2022.
| Table 11.10 |
Silver sand coarse reject duplicate statistical summary (2021 – July 2022) |
| Ag
(ppm) |
Original |
Duplicate |
| Number
of samples |
794 |
796 |
| Number
of samples > 15 times detection limit |
634 |
634 |
| Mean |
19.42 |
19.81 |
| Maximum |
1,970.00 |
2,090.00 |
| Minimum |
0.01 |
0.01 |
| Pop
Std Dev. |
99.36 |
102.78 |
| CV |
5.12 |
5.19 |
| Cor
Coeff |
1.00 |
|
| Bias
(all data) |
-1.98% |
|
| Percent
Samples <15% RPD |
93.38 |
|
Source: Compiled by AMC Mining Consultants (Canada)
Ltd., 2022.
The QP notes that the coarse reject performance is acceptable,
with > 90% within 15% RPD. There is a slight negative bias towards the original sample.
Pulp duplicates
Submission rates for the pulp duplicates is just below 4%,
noting that these were only submitted between 2021 and July 2022.
The results of the pulp duplicate performance
for the period 2021 – July 2022 is presented using RPD and scatter plots shown in Figure 11.10 and a statistical comparison is
presented in Table 11.11. The duplicate data ranges from 0.01 ppm – 2,060 Ag ppm, with a mean of 25.23 Ag ppm.
| Silver Sand Project Pre-Feasibility Study |
| | New Pacific Metals Corp. | 0723071 |
There are 595 samples greater than
15 times the detection limit, which provides a reasonable sample size from which to make an assessment. The duplicates cover the appropriate
grade range.
| Figure 11.10 |
Silver Sand pulp duplicate RPD and scatter
plot (2021 – July 2022) |
Source: Compiled by AMC Mining Consultants (Canada)
Ltd., 2022.
| Table 11.11 |
Silver Sand pulp duplicate statistical summary (2021 – July 2022) |
| Ag (ppm) |
Original |
Duplicate |
| Number of samples |
735 |
737 |
| Number of samples > 15 times detection limit |
595 |
595 |
| Mean |
25.23 |
22.86 |
| Maximum |
2,060.00 |
2,060.00 |
| Minimum |
0.01 |
0.01 |
| Pop Std Dev. |
145.60 |
127.79 |
| CV |
5.77 |
5.59 |
| Cor Coeff |
0.89 |
|
| Bias (all data) |
9.39% |
|
| Percent Samples < 10% RPD |
86.22 |
|
Source: Compiled by AMC
Mining Consultants (Canada) Ltd., 2022.
The QP notes that 86% of samples
fall within 10% RPD. This shows good precision. There is a bias towards the original samples of approximately 9%. There is an outlying
sample, where the original value is 1,875 Ag ppm and the duplicate value is 64.7 Ag ppm. Removing this sample reduces the bias to -0.47%
and the mean of the original samples to 22.71 Ag ppm. As such, the QP does not consider there to be any bias between the original and
duplicate samples.
The QP notes that the field duplicates,
which monitor the variance of original field sampling (core cutting), coarse reject sub-sampling, and pulp sub-sampling, show sub-optimal
precision. The coarse and pulp duplicates show good analytical precision. This suggests that the majority of
| Silver Sand Project Pre-Feasibility Study |
| | New Pacific Metals Corp. | 0723071 |
sampling variance is occurring during
the initial sampling process. This may indicate that the quarter core sample is insufficient because of geological heterogeneity at this
scale.
| · | Implement investigative work to understand the geological variance. This
should include: |
| ¾ | In future programs consider submitting field duplicates
as half core rather than quarter core to assess sub-sampling error. |
| | ¾ | Consider
drilling twin holes using triple tube diamond core or RC drilling to evaluate the deposit variance on a local scale and whether loss
of vein material is occurring during drilling and sampling processes. |
| · | Ensure that all future programs include between 4
- 5% duplicate samples including field duplicates, coarse reject duplicates and pulp duplicates to enable the various stages of sub-sampling
to be monitored. |
New Pacific submitted a total of
2,851 coarse reject samples to Actlabs Skyline in Lima, Peru for check assay analysis during October 2017 - 2019. Actlabs Skyline is an
independent geochemical laboratory certified according to ISO 9001:2015.
The QP compared the original and
umpire duplicate assays for 2,064 sample pairs where the original and duplicate assay were 15 times the detection limit of 1 g/t Ag. These
showed no sample bias and sub-optimal precision with only 62% of umpire duplicates being within 10% RPD. The sub-optimal performance may
be due to additional sub-sampling variance incurred during sampling of the reject or issues with the laboratory.
No umpire samples were submitted from
2020 – July 2022.
The QP makes the following recommendations regarding umpire
samples:
| · | In future programs, submit umpire duplicates, as was done for the October
2017 - 2019 programs. |
| · | Submit pulp samples (rather than coarse reject) so that umpire samples
only monitor analytical accuracy and variance. |
| · | Include CRMs at the average grade and higher grades in umpire sample submissions. |
New Pacific has developed and implemented sound procedures
which manage sample preparation, analytical and security procedures.
Drilling programs completed on
the Property between 2017 and July 2022 have included QA/QC monitoring programs which have incorporated the insertion of CRMs, blanks,
and duplicates into the sample streams, and umpire (check) assays at a separate laboratory. The QP has compiled and reviewed the available
QA/QC data for 556 drillholes where assays have been received.
New Pacific has included CRMs, blank,
coarse reject, and pulp duplicate assays as part of routine analysis at slightly less than the preferred rates of 5% for the CRMs and
blanks. Duplicate insertion rates are acceptable at 3%.
New Pacific has used four different
CRMs throughout the project history. CRMs generally show reasonable analytical accuracy; however, one of the three CRMs did not perform
within certified control limits, with an excessive number of failures. The QP postulates that poor CRM performance might be due to the
CRMs being certified using a four-acid digest but analyzed using aqua-regia. The QP recommends that follow up work be completed prior
to further use of these CRMs.
| Silver Sand Project Pre-Feasibility Study |
| | New Pacific Metals Corp. | 0723071 |
Blank sample results are considered
acceptable and show that no significant contamination has occurred during sample preparation and analysis.
Quarter core field duplicate samples
show improved, yet sub-optimal performance which suggest that mineralization is heterogenous, that sample errors are occurring during
the sampling process, or a combination of both factors. The good performance of the coarse and pulp duplicates submitted in 2021 –
July 2022 indicates that the majority of variance is occurring at the initial sampling stage. This should be investigated.
The QP recommends that umpire samples
be submitted as pulps in future QA/QC programs.
The QP has reviewed the QA/QC procedures
used by New Pacific including certified reference materials, blank, duplicate and umpire data and has made some recommendations. The QP
does not consider these to have a material impact on the Mineral Resource estimate and considers the assay database to be adequate for
Mineral Resource estimation. The QP considers sample preparation, security, and analytical procedures employed by New Pacific to be adequate.
| Silver Sand Project Pre-Feasibility Study |
| | New Pacific Metals Corp. | 0723071 |
Dinara Nussipakynova, P.Geo. of
BBA, formerly employed with AMC Consultants, completed a site visit to the Project between 28 – 29 May 2022, and during the inspection
the following activities were carried out:
| · | Review of field site of Silver Sand project. |
| · | Review of drilling and core processing procedures. |
| · | Review of New Pacific QA/QC procedures. |
| · | Review of randomly selected core from seven drillholes: |
| · | Inspected the core processing facility and core storage in Betanzos. |
| · | Held discussions with several staff on site, in regard to data collection and quality. |
| · | Held discussions on database management procedures. |
| · | Observed the marked and identified collars of the recent drillholes in the field. |
| · | Reviewed the drill management process adopted by New Pacific. |
As reported in the 2020 Technical
Report, the QP undertook random cross-checks of assay results in the database with original assay results on the assay certificates returned
from ALS (Bolivia) and Actlabs (Peru) up to 31 December 2019. This verification consisted of comparing 3,616 of the 58,420 assay results
in the database to those in the certificates. This is approximately 6.2% of the total samples at that time. One typing error was detected.
The QP also undertook a random cross check of the original collar and survey measurements for 18 drillholes and compared them to the database.
This represented 5.5% of the total drillholes. No errors were detected.
After the 2022 site visit, the QP
undertook random cross-checks of assay results of the 2020 - 2022 drillholes with original assay results on the assay certificates returned
from ALS (Bolivia) and Actlabs (Peru). This verification consisted of comparing 270 of the 5,198 assay results in the database to those
in the certificates. This is approximately 5.2% of the total samples. One typing error was detected. No errors were detected.
As shown in Table 12.1 a total of 6.1% of the assays have been checked.
| Table
12.1 | Assay
verification results |
| Report |
Total samples |
# Samples selected for
verification |
Errors noted |
% Samples
verified |
| 2020 Technical Report |
58,420 |
3,616 |
1 |
6.2 |
| 2022 Technical Report |
5,198 |
270 |
1 |
5.2 |
| Total |
63,618 |
3,886 |
2 |
6.1 |
Source: AMC Mining Consultants
(Canada) Ltd., 2022.
| Silver Sand Project Pre-Feasibility Study |
| | New Pacific Metals Corp. | 0723071 |
The drillhole file has undergone the following checks:
| · | Inconsistent FROM and TO values. |
| · | Incorrect treatment of absent assay values. |
| · | Duplicate records and duplicate holes. |
| · | Drillhole collar elevation not matching topography wireframe. |
| · | 556 drillholes were reviewed in 3D space and these had a total of 91,164 records. |
No inconsistencies were identified
during checking the drillholes in 3D. Checking the collar locations against the Digital Terrain Model (DTM) of the topography surface
showed no differences in elevation.
The QP considers the database fit-for-purpose
and in the QP’s opinion, the geological data provided by New Pacific for the purposes of Mineral Resource estimation were collected
in line with industry best practice as defined in the CIM Exploration Best Practice Guidelines and the CIM Mineral Resource, Mineral Reserve
Best Practice Guidelines. As such, the data are adequate for use in the estimation of Mineral Resources.
| Silver Sand Project Pre-Feasibility Study |
| | New Pacific Metals Corp. | 0723071 |
| 13 | Mineral
processing and metallurgical testing |
A number of metallurgical testwork
programs were carried out previously by SGS Lima and SGS Lakefield involving mineralogy, comminution, whole ore cyanide leaching, flotation
concentrate cyanide leaching, bulk flotation, column cyanide leaching, dense medium separation, and ore sorting. The results of these
early metallurgical testwork programs have been reviewed and summarized in the reports listed below. During the studies conducted to support
the Preliminary Economic Assessment (PEA) in 2022, whole ore cyanide leaching with silver doré as a final product was chosen as
a preferred processing option to further advance Silver Sand project.
| · | AMC Consultants, NI 43-101 Technical Report, Silver Sand Deposit Preliminary
Economic Assessment, New Pacific Metals Corp, 30 November 2022. |
| · | AMC Consultants, NI 43-101 Technical Report, Silver Sand Deposit Mineral
Resource Report, New Pacific Metals Corp, 16 January 2020. |
| · | Andy Holloway, Metallurgical Program, Silver Sand Project, Q4 2020 –
Q2 2021, SGS Lima, Peru, July 2021. |
| · | Ruijin Jiang, Andy Holloway and Alex Zhang, NI 43-101 Technical Report, Silver
Sand Project, Potosi, Bolivia, 31 August 2019. |
| · | SGS Lakefield, An Investigation into Mineralogical Characterization of
Three Silver Feed Samples from Bolivia, Project 18131-01, 27 August 2020. |
| · | SGS Lima, Metallurgical Tests Service by Cyanide Leaching for the Assessment
of Silver Minerals, Project Silver Sand – Phase I, Project# Cz. MET 0285-2018 MIN, May 2019. |
| · | SGS Lima, Metallurgical Report for New Pacific Metals Corp, August 2019. |
| · | SGS Lima, Metallurgical Tests Services of Comminution, Floating and Leaching
for the Evaluation of Silver Ores, Silver Sand Project, Project# Cz. MET 0169-2020 MIN, July 2021. |
To support the current Pre-feasibility
Study (PFS), 16 new composite samples from the oxidized domain, transitional domain, and sulphide domain were identified, collected, composited,
and tested for the whole ore cyanide leaching process. Furthermore, two PEA program high-grade samples from the transitional domain and
sulphide domain, which previously resulted in lower silver recovery from the whole ore cyanide leaching flowsheet, were re-investigated
to improve silver recovery. From the set of 18 composite samples, some were selected for other metallurgical characterization testwork,
including comminution, mineralogy, cyanide destruction, slurry thickening, slurry rheology, slurry filtration, and transportable moisture
limit determination. The impact of activated carbon and gravity concentration on silver recovery were also investigated. Silver loading
on activated carbon and reduction of dissolved silver using zinc dust (the Merrill Crowe process) were completed as well. Eight additional
reports have been issued to document these metallurgical testwork programs:
| · | ALS Metallurgy Kamloops, Comminution Testwork on Composites from the Silver
Sand Project, New Pacific Metals Corp, KM 6875, 8 February 2023. |
| · | ALS Metallurgy Kamloops, Pre-Feasibility Study Metallurgical Testing for
the Silver Sand Project, Bolivia, New Pacific Metals Corp, KM6855, 13 July 2023. |
| · | ALS Metallurgy Perth, Merrill Crowe Testing, Report No. A24428, July 2023. |
| · | Bureau Veritas Minerals / Metallurgical, Metallurgical Testing for Silver
Recovery, New Pacific Metals – Silver Sand Project, Project No. 2201508, 28 October 2022. |
| · | JKTech, SMC Test Report Silver Sand, JKTech Job No 23017/P1, January 2023. |
| · | Kemetco Research, Cyanide Detoxification Study, Project R0703, 31 May 2023. |
| · | Pocock Industrial, Flocculant Screening, Gravity Sedimentation, Slurry
Rheology and Pressure Filtration, PI2404, May 2023. |
| Silver Sand Project Pre-Feasibility Study |
| | New Pacific Metals Corp. | 0723071 |
| · | SGS Burnaby, TML Report Analysis, report reference 0000025992, 31 May 2023. |
| 13.2 | Historical testwork (2019-2021) |
The report of
“SGS Lakefield, An Investigation into Mineralogical Characterization of Three Silver Feed Samples from Bolivia, Project
18131-01, 27 August 2020” involved three samples (106~121 g/t silver) from the oxidized, transitional and sulphide domains for
determination of bulk mineralogy with focus on silver minerals. The contents of bulk minerals were 84.8~89.1% quartz, 3.1~4.9% mica
/ chlorite / clay, 0.7~6.4% iron oxide, 0.1~7.2% pyrite, and 0.1~0.29% Pb-Bi-Sb-Cu sulfosalts. Silver minerals from these three
samples are summarized as follows:
| · | For the sample from the oxidized domain, chlorargyrite
(AgCl) and argentite (Ag2S) were the main silver minerals.
The combined amount of AgCl and Ag2S accounted for 97% silver.
Silver was also identified in minor amounts in various oxidized sulfosalts. |
| · | For the sample from the transitional domain, the
combined amount of AgCl and Ag2S accounted for 94% silver.
A small amount of silver was present as tetrahedrite and argentojarosite AgFe3(SO4)2(OH)6.
A minor amount of silver was present in various oxidized sulfosalts. |
| · | For the sample from the sulphide domain, the amount
of Ag2S accounted for 52% silver, followed by 35% silver associated
with tetrahedrite and 13% silver associated with various Pb-Bi-Sb-Cu sulfosalts. |
The report of “SGS Lima,
Metallurgical Tests Service by Cyanide Leaching for the Assessment of Silver Minerals, Project Silver Sand – Phase I, Project# Cz.
MET 0285-2018 MIN, May 2019” involved four samples, of which, two samples (28 g/t silver and 0.15% sulphur for one sample, and 122
g/t silver and 0.21% sulphur for another sample) from the oxidized domain, one sample (157 g/t silver and 1.45% sulphur) from the transitional
domain and one sample (122 g/t silver and 2.12% sulphur) from the sulphide domain. Bottle roll cyanide leaching tests were carried out
under the conditions of grind size (80% passing) 50~105 µm, cyanide concentration of 0.5~4.0 g/L NaCN, air or oxygen sparging, ambient
or elevated temperature (60°C), pH 10.5~11.0 and 72-hour retention time. Finer grind size, higher cyanide concentration, oxygen sparging
and elevated temperature all improved silver dissolution; however, copper dissolution and cyanide consumption also increased under these
conditions.
The report of “SGS
Lima, Metallurgical Report for New Pacific Metals Corp, August 2019” included the following scope of work:
| · | Ore characterization (size-by-size silver
assays, mineralogical analysis, mineral liberation and association by QEMSCAN), bulk mineralogy, silver deportment, dense medium
separation for 12 samples, of which, four samples
from the oxidized domain, four samples from the transitional domain, and four samples from the sulphide domain. |
| · | Comminution testing (crusher work index, Ball Mill
Work Index, Abrasion Index) for seven samples, of which, three samples from the oxidized domain, two samples from the transitional domain,
and two samples from the sulphide domain. |
| · | Bulk flotation under the conditions of grind size
(80% passing) 74~105 µm, natural pH to pH 9.0, collectors (PAX, SIPX, OX100, DANA468) for three samples, of which, one sample (201
g/t silver + 0.15% sulphur) from the oxidized domain, one sample (123 g/t silver + 1.16% sulphur) from the transitional domain, and one
sample (123 g/t silver + 1.88% sulphur) from the sulphide domain. |
| Silver Sand Project Pre-Feasibility Study |
| | New Pacific Metals Corp. | 0723071 |
| · | Bottle roll cyanide leaching under the conditions
of grind size (80% passing) 50~105 µm, cyanide concentration of 1.0~4.0 g/L NaCN, air or oxygen, ambient or elevated temperature
(57°C) and 72-hour retention time for four samples, of which, two samples (29 g/t silver + 0.15% sulphur for one sample, 132 g/t silver
+ 0.21% sulphur for another sample) from the oxidized domain, one sample (157 g/t silver + 1.45% sulphur) from the transitional domain
and one sample (124 g/t silver + 2.13% sulphur) from the sulphide domain. |
| · | Column cyanide leaching under the conditions of crush
size 100% passing 12.7 mm, cyanide concentration of 4.0 g/L NaCN and 75-day irrigation for two samples (29 g/t silver + 0.15% sulphur
for one sample and 132 g/t silver + 0.21% sulphur for another sample) from the oxidized domain. |
The report of “SGS Lima, Metallurgical
Tests Services of Comminution, Floating and Leaching for the Evaluation of Silver Ores, Silver Sand Project, Project# Cz. MET 0169-2020
MIN, July 2021”, involved a total of nine samples which were composited using core intervals of four metallurgical drillholes. The
concentration of silver and sulphur in the samples is presented in Table 13.1.
| Table 13.1 |
Chemical analysis results of silver ore samples |
| Sample |
Silver (ppm) |
Sulphur (%) |
Copper (ppm) |
| LG individual oxide composite |
28 |
0.09 |
86 |
| HG individual oxide composite |
157 |
0.12 |
104 |
| LG individual fresh composite |
19 |
2.58 |
345 |
| HG individual fresh composite |
385 |
2.62 |
1,418 |
| LG individual transitional composite |
33 |
0.92 |
265 |
| HG individual transitional composite |
306 |
1.73 |
202 |
| Master oxide composite |
91 |
0.10 |
89 |
| Master fresh composite |
119 |
2.60 |
595 |
| Master transitional composite |
113 |
1.16 |
236 |
Source: SGS Mineral Services
(2021).
The scope of work for this program included:
| · | Size-by-size silver assays for three master samples from the oxidized,
transitional, and sulphide domains. |
| · | Dense medium separation at medium
densities of 2.55, 2.60, 2.65, and 2.75 t/m3
for three master samples from the oxidized, transitional, and
sulphide domains. |
| · | Comminution testing (SMC Test®, Ball Mill Work Index, and Abrasion
Index) for three master samples from the oxidized, transitional, and sulphide domains. |
| · | Bulk flotation under the conditions of grind size
(80% passing) 53~100 µm, collectors (PAX, SIPX, Aero407, AR7498) and natural pH ~ pH 8.5 for three samples from the oxidized domain,
three samples from the transitional domain, and three samples from the sulphide domain. |
| · | Bottle roll cyanide leaching under the conditions
of grind size (80% passing) 53~100 µm, cyanide concentration of 1.0~3.0 g/L NaCN, pulp density of 45% solids, retention time of
48~72 hours, pH 10.5~11.0, lead nitrate addition of 0~0.30 kg/t, and air or oxygen sparging (7~15 ppm dissolved oxygen) for three samples
from the oxidized domain, three samples from the transitional domain, and three samples from the sulphide domain. |
| · | Cyanide leaching of three flotation concentrates
from the oxidized, transitional, and sulphide domains. |
| Silver Sand Project Pre-Feasibility Study |
| | New Pacific Metals Corp. | 0723071 |
| · | Column cyanide leaching under the conditions of crush
size (100% passing) 12.7 mm, cyanide concentration of 0.60 g/L NaCN, pH 10.5 and 152-day irrigation for the master sample from the transitional
domain. |
| · | Cyanide destruction for three cyanide leach tailing
samples from the oxidized, transitional, and sulphide domains. |
| 13.3 | Recent metallurgical testwork (2022-2023) |
During the study of PEA in 2022,
the whole ore cyanide leaching process with a silver doré final product was chosen as a preferred processing option. As such, the
scope of the metallurgical testwork in support of PFS was focused on the cyanide leaching process.
16 new composite samples from the
oxidized, transitional, and sulphide domains and two previous high-grade samples from the transitional and sulphide domains were investigated
for cyanide leaching to determine silver recovery. One significant discovery out of the recent metallurgical testwork was related to the
impact of cyanide leaching reactor on silver recovery and cyanide consumption. The impact of activated carbon on silver recovery was inconclusive.
All of these 18
composite samples were tested for cyanide leaching. Of these 18 composite samples, 15 samples were used for specific gravity
measurement and a few samples were used for mineralogy, cyanide destruction, slurry thickening, slurry rheology, slurry filtration,
transportable moisture limit, and tailing environmental testing. The impacts of activated carbon and gravity concentration on silver
recovery were also investigated. Silver loading on activated carbon and reduction of dissolved silver using zinc dust (Merrill Crowe
process) were completed as well.
| 13.3.2 | Sample selection and head assay |
A significant number of mineralized
intervals were selected across multiple drillholes in the major mineralization zones of the deposit to prepare 18 individual samples.
These individual samples were grouped on the basis of oxidation extent and head grade (Table 13.1). From these 18 individual samples,
16 composite samples were prepared for use in the cyanide leaching tests (see Table 13.2).
| Silver Sand Project Pre-Feasibility Study |
| | New Pacific Metals Corp. | 0723071 |
| Table 13.2 |
18 individual samples prepared using the
coarse assay rejects |
Sample
ID |
Type
of
material |
Location
in the
deposit |
Head
grade |
Number
of
drillholes |
Total
length of
intervals
(metre) |
| Sample
3 |
Oxidized
material |
Upper
half deposit
(<100
m) |
149
g/t Ag |
22 |
77.1 |
| Sample
3A |
1,101
g/t Ag |
4 |
5.7 |
| Sample
3B |
26
g/t Ag |
7 |
17.8 |
| Sample
4 |
Lower
half deposit
(>100
m) |
115
g/t Ag |
18 |
86.2 |
| Sample
4A |
381
g/t Ag |
5 |
5.6 |
| Sample
4B |
29
g/t Ag |
8 |
17.8 |
| Sample
6 |
Transitional
material |
Entire
deposit |
38
g/t Ag |
24 |
34.5 |
| Sample
7 |
Upper
half deposit
(<100
m) |
146
g/t |
40 |
142.8 |
| Sample
7A |
1,145
g/t |
5 |
5.8 |
| Sample
7B |
28
g/t Ag |
19 |
35.3 |
| Sample
8 |
Lower
half deposit
(>100
m) |
145
g/t Ag |
26 |
142.3 |
| Sample
8A |
1,187
g/t Ag |
5 |
5.8 |
| Sample
8B |
27
g/t Ag |
15 |
37.9 |
| Sample
11 |
Sulphide
material |
Entire
deposit |
146
g/t Ag |
26 |
110.9 |
| Sample
11A |
1,048
g/t Ag |
4 |
5.7 |
| Sample
11B |
27
g/t Ag |
16 |
26.6 |
| Sample
12 |
Lower
half deposit
(>150
m) |
33
g/t Ag |
11 |
27.9 |
| Sample
13 |
682
g/t Ag |
11 |
24.8 |
Two life-of-mine (LOM) composite samples
were prepared:
| · | The first LOM composite sample, which is labelled
as “Met Sample 1”, consisted of 10% material from the oxidized domain, 80% material from the transitional domain, and 10%
material from the sulphide domain with a targeted head grade of 130 g/t silver. |
| · | The second LOM composite sample, which is labelled
as “Met Sample 1 NEW”, consisted of 10% material from the oxidized domain, 65% material from the transitional domain, and
25% material from the sulphide domain with a targeted head grade of 113 g/t silver. |
In the oxidized domain, four composite
samples were prepared:
| · | The first sample, which is labelled as “Met Sample 2”, was composited
with the mineralized intervals from the entire deposit
to target a head grade of 130 g/t silver. |
| · | The second sample, which is labelled as “Met
Sample 3”, was composited with the mineralized intervals from the upper half deposit in depths up to 100 metres to target a head
grade of 130 g/t silver. |
| · | The third sample, which is labelled as “Met
Sample 4”, was composited with the mineralized intervals from the lower half deposit in depths greater than 100 metres to target
a head grade of 130 g/t silver. |
| · | The fourth sample, which is labelled as “Met Sample 3B:4B”,
was composited with the mineralized intervals from the entire
deposit to target a head grade of 35 g/t silver. |
| Silver Sand Project Pre-Feasibility Study |
| | New Pacific Metals Corp. | 0723071 |
| Table 13.3 |
16 composite samples prepared for cyanide leaching tests |
| Sample ID |
Type
of material |
Location in the
deposit |
Head grade |
Met
Sample
1 |
Met
Sample
1 NEW |
Met
Sample
2 |
Met
Sample
3 |
Met
Sample
3B:4B |
Met
Sample
4 |
Met
Sample
5 |
Met
Sample
6 |
Met
Sample
7 |
Met
Sample
8 |
Met
Sample
9 |
Met
Sample
10 |
Met
Sample
11 |
Met
Sample
11B |
Met
Sample
12 |
Met
Sample
13 |
| % |
% |
% |
% |
% |
% |
% |
% |
% |
% |
% |
% |
% |
% |
% |
% |
| Sample 3 |
Oxidized material |
Upper half deposit
(<100
m) |
149 g/t Ag |
4.3 |
3.9 |
49.0 |
84.5 |
50.0 |
|
|
|
|
|
12.6 |
|
|
|
|
|
| Sample 3A |
1,101 g/t Ag |
|
|
|
|
|
| Sample 3B |
26 g/t Ag |
0.7 |
1.1 |
1.0 |
15.5 |
2.4 |
| Sample 4 |
Lower half deposit
(>100
m) |
115 g/t Ag |
4.3 |
3.9 |
49.0 |
|
50.0 |
94.5 |
|
|
|
|
|
13.6 |
|
|
|
|
| Sample 4A |
381 g/t Ag |
|
|
|
5.5 |
|
| Sample 4B |
29 g/t Ag |
0.7 |
1.1 |
1.0 |
|
1.4 |
| Sample 6 |
Transitional material |
Entire
deposit |
38 g/t Ag |
|
18.0 |
|
|
|
|
|
100 |
|
|
|
|
|
|
|
|
| Sample 7 |
Upper half deposit
(<100
m) |
146 g/t |
34.5 |
20.4 |
|
|
|
|
43.5 |
|
86.5 |
|
73.5 |
|
|
|
|
|
| Sample 7A |
1,145 g/t |
|
|
|
|
|
| Sample 7B |
28 g/t Ag |
5.5 |
3.1 |
6.5 |
13.5 |
11.5 |
| Sample 8 |
Lower half deposit
(>100
m) |
145 g/t Ag |
34.5 |
20.4 |
|
|
|
|
43.5 |
|
|
87.0 |
|
77.1 |
|
|
|
|
| Sample 8A |
1,187 g/t Ag |
|
|
|
|
|
| Sample 8B |
27 g/t Ag |
5.5 |
3.1 |
6.5 |
13.0 |
7.9 |
| Sample 11 |
Sulphide material |
Entire
deposit |
146 g/t Ag |
10.0 |
13.8 |
|
|
|
|
|
|
|
|
|
|
86.0 |
100 |
|
|
| Sample 11A |
1,048 g/t Ag |
|
|
| Sample 11B |
27 g/t Ag |
6.7 |
14.0 |
| Sample 12 |
Lower half deposit
(>150
m) |
33 g/t Ag |
|
4.5 |
|
|
|
|
|
|
|
|
|
|
|
|
100 |
100 |
| Sample 13 |
682 g/t Ag |
Source: New Pacific Metals Corp, 2024.
| Silver Sand Project Pre-Feasibility Study |
| | New Pacific Metals Corp. | 0723071 |
In the transitional domain, five composite
samples were prepared:
| · | The first sample, which is labelled as “Met Sample 5”, was composited
with the mineralized intervals from the entire deposit
to target a head grade of 130 g/t silver. |
| · | The second sample, which is labelled as “Met
Sample 7”, was composited with the mineralized intervals from the upper half deposit in depths up to 100 metres to target a head
grade of 130 g/t silver. |
| · | The third sample, which is labelled as “Met
Sample 8”, was composited with the mineralized intervals from the lower half deposit in depths greater than 100 metres to target
a head grade of 130 g/t silver. |
| · | The fourth sample, which is labelled as “Met Sample 6”, was
composited with the mineralized intervals from the entire deposit
to target a head grade of 35 g/t silver. |
| · | The fifth sample, which is labelled as “Met
Sample 14”, was a previous high-grade sample, which resulted in less than 80% silver recovery from cyanide leaching tests in 2020.
This composite sample was prepared with the 114.5 metres intervals from the four metallurgical drillholes of DSS422501T, DSS522501T, DSS525021T,
and DSS642501T. |
Between the oxidized domain and transitional
domain, two composite samples were prepared:
| · | The first sample, which is labelled as “Met
Sample 9”, was made up of 15% material from the oxidized domain and 85% material from the transitional domain with the mineralized
intervals selected in the upper half deposit at depths up to 100 metres to target a head grade of 130 g/t silver. |
| · | The second sample, which is labelled as “Met
Sample 10”, was made up of 15% material from the oxidized domain and 85% material from the transitional domain with the mineralized
intervals selected in the lower half deposit at depths greater than 100 metres to target a head grade of 130 g/t silver. |
In the sulphide domain, five composite
samples were prepared:
| · | The first sample, which is labelled as “Met Sample 11”, was
composited with the mineralized intervals from the entire deposit
to target a head grade of 130 g/t silver. |
| · | The second sample, which is labelled as “Met
Sample 12”, was composited with the mineralized intervals from the deposit in depths greater than 150 metres to target a head grade
of 35 g/t silver. |
| · | The third sample, which is labelled as “Met
Sample 13”, was composited with the mineralized intervals from the deposit in depths greater than 150 metres to target a head grade
of 682 g/t silver. |
| · | The fourth sample, which is labelled as “Met Sample 11B”, was
composited with the mineralized intervals from the entire
deposit to target a head grade of 35 g/t silver. |
| · | The fifth sample, which is labelled as “Met
Sample 15”, was a previous high-grade sample, which resulted in less than 80% silver recovery from the cyanide leaching tests in
2020. This composite sample was prepared with the 23.3 metres intervals from the four metallurgical drillholes of DSS422501T, DSS522501T,
DSS525021T, and DSS642501T. |
Table 13.3 shows the compositions
of these 18 composite samples. In general, the samples from the oxidized domain contained a lower level of sulphur, while the samples
from the sulphide domain contained a higher level of sulphur. The content of mercury was below 0.08 ppm in all cases. The content of gold
was less than 0.06 ppm. However, the content of copper was elevated. Some of the copper is expected to dissolve during cyanide leaching.
| Silver Sand Project Pre-Feasibility Study |
| | New Pacific Metals Corp. | 0723071 |
Cyanide leaching testwork data
showed that average copper dissolution during cyanide leaching was approximately 40% on average for the materials from the oxidized domain,
60% on average for the materials from the transitional domain, and 70% on average for the materials from the sulphide domain. For those
two LOM composite samples, copper dissolution during cyanide leaching was 57% on average.
| Silver Sand Project Pre-Feasibility Study |
| | New Pacific Metals Corp. | 0723071 |
| Table 13.4 |
Compositions of key elements for the 18 composite samples used in the cyanide leaching tests |
| Type
of sample |
Sample
ID |
Description |
Ag
(ppm) |
Au
(ppm) |
S
(%) |
Cu
(ppm) |
Pb
% |
Zn
% |
Hg
(ppm) |
As
(ppm) |
| LOM
composite sample |
Met
Sample 1 |
10%
oxide + 80% transitional + 10% sulphide |
138 |
0.02 |
1.64 |
303 |
0.10 |
0.03 |
0.05 |
413 |
| Met
Sample 1 NEW |
10%
oxide + 65% transitional + 25% sulphide |
114 |
<0.01 |
1.56 |
279 |
0.08 |
0.05 |
0.05 |
330 |
Oxidized
sample |
Met
Sample 2 |
Entire
deposit |
138 |
0.02 |
0.31 |
187 |
0.10 |
0.01 |
0.04 |
294 |
| Met
Sample 3 |
Upper
half deposit (<100 m) |
149 |
0.02 |
0.37 |
105 |
0.11 |
0.00 |
0.05 |
242 |
| Met
Sample 3B:4B |
Low-grade |
36 |
0.01 |
0.22 |
83 |
0.12 |
0.01 |
0.03 |
250 |
| Met
Sample 4 |
Lower
half deposit (>100 m) |
140 |
0.02 |
0.22 |
278 |
0.17 |
0.02 |
0.03 |
420 |
|
Transitional
sample |
Met
Sample 5 |
Entire
deposit |
142 |
0.02 |
1.59 |
271 |
0.10 |
0.04 |
0.04 |
425 |
| Met
Sample 6 |
Low-grade |
43 |
0.01 |
1.55 |
163 |
0.05 |
0.04 |
0.03 |
234 |
| Met
Sample 7 |
Upper
half deposit (<100 m) |
139 |
0.02 |
1.70 |
317 |
0.07 |
0.02 |
0.07 |
316 |
| Met
Sample 8 |
Lower
half deposit (>100 m) |
154 |
0.02 |
1.52 |
230 |
0.12 |
0.03 |
0.02 |
513 |
| Met
Sample 14 |
High-grade
from year 2020 |
400 |
0.03 |
1.84 |
226 |
0.13 |
0.01 |
0.06 |
546 |
| Oxidized
/ transitional composite sample |
Met
Sample 9 |
15%
oxide + 85% transitional (<100 m) |
140 |
0.02 |
1.64 |
277 |
0.07 |
0.02 |
0.07 |
328 |
| Met
Sample 10 |
15%
oxide + 85% transitional (>100 m) |
153 |
0.02 |
1.28 |
203 |
0.12 |
0.04 |
0.02 |
484 |
|
Sulphide
sample |
Met
Sample 11 |
Entire
deposit |
152 |
0.02 |
2.44 |
643 |
0.09 |
0.12 |
0.03 |
377 |
| Met
Sample 11B |
Low-grade |
31 |
0.01 |
1.55 |
232 |
0.01 |
0.03 |
0.01 |
165 |
| Met
Sample 12 |
Low-grade
(>150 m) |
53 |
0.01 |
1.72 |
131 |
0.10 |
0.22 |
0.02 |
182 |
| Met
Sample 13 |
High-grade
(>150 m) |
714 |
0.05 |
3.08 |
1,438 |
0.16 |
0.36 |
0.06 |
657 |
| Met
Sample 15 |
High-grade
from year 2020 |
418 |
0.04 |
3.10 |
1,359 |
0.11 |
0.04 |
0.04 |
567 |
Source: New Pacific Metals Corp, 2024.
| Silver Sand Project Pre-Feasibility Study |
| | New Pacific Metals Corp. | 0723071 |
| 13.3.3 | Mineralogical measurement |
X-ray diffraction (XRD) was conducted
on five samples using a quantitative method while QEMSCAN particle mineral analysis (PMA) was conducted on another three samples. XRD
uses mineral structures to identify minerals, while QEMSCAN uses element peak intensities to distinguish minerals. Mineral identification
by XRD is superior for some minerals; however, mineral contents measured by QEMSCAN PMA have a significantly better accuracy. The mineral
content data are summarized in Table 13.4, Figure 13.1, Figure 13.2, and Figure 13.3.
Pyrite was a dominant sulphide mineral
in all samples between 0.5% and 6.2%. Met Sample 2 (the sample from the oxidized domain) had significantly less pyrite than other samples.
Copper sulphide, silver mineral, sphalerite and galena were also measured. Non-sulphide gangue minerals were mainly quartz or mica mineral
(primarily muscovite). These non-sulphide minerals are not expected to interfere with silver extraction during cyanide leaching.
For two samples from the sulphide
domain, namely, Met Sample 13 and Met Sample 15, silver was mostly contained in the silver copper sulphide minerals, such as tetrahedrite
and freibergite. The remaining silver for these two samples was almost entirely acanthite (Ag2S).
Ag2S
was a dominant silver mineral in Met Sample 9 (15% oxide + 85% transitional), accounting for about 74% silver. Only about 14% silver in
this sample was in silver copper sulphide (including tetrahedrite, freibergite, and CuSbAgFeS) and the remainder was in silver halide.
These silver minerals are not expected to cause problems with silver recovery during cyanide leaching.
Copper was associated with a number
of copper sulphide minerals. On average, about 35% copper was associated with chalcopyrite. The copper minerals other than chalcopyrite
are expected to be partially soluble in cyanide solution. The buildup of dissolved copper in the process water is therefore to be expected.
| Table 13.5 |
Contents of minerals in the six mineralized samples |
|
Mineral |
Met Sample
2 |
Met Sample
5 |
Met Sample
9 |
Met Sample
11 |
Met Sample
13 |
Met Sample
15 |
|
Oxidized
sample |
Transitional
sample |
15%
oxidized +
85%
transitional |
Sulphide
sample |
High-grade
sulphide
sample |
2020 High-
grade sulphide
sample |
| XRD |
XRD |
PMA |
XRD |
PMA |
XRD |
PMA |
XRD |
| Ag/Cu/Pb
sulphide mineral |
|
|
0.3 |
|
1.0 |
|
1.3 |
|
| Sphalerite |
|
|
<0.1 |
|
0.5 |
|
<0.1 |
|
| Pyrite |
0.5 |
3.0 |
2.5 |
4.7 |
4.8 |
6.2 |
5.4 |
6.2 |
| Quartz |
89.7 |
88.7 |
90.3 |
85.8 |
85.1 |
81.7 |
85.4 |
84.7 |
| Mica (muscovite) |
8.8 |
7.4 |
2.7 |
8.7 |
6.0 |
11.5 |
5.6 |
8.2 |
| Iron oxide |
1.0 |
0.8 |
2.8 |
0.8 |
0.8 |
0.6 |
0.5 |
0.9 |
| Feldspar |
|
|
0.3 |
|
0.3 |
|
0.4 |
|
| Titanium mineral |
|
|
0.2 |
|
0.3 |
|
0.3 |
|
| Kandite group |
|
|
0.1 |
|
0.2 |
|
0.1 |
|
| Others |
|
|
0.8 |
|
1.0 |
|
0.9 |
|
Source: New Pacific Metals
Corp, 2024.
| Silver Sand Project Pre-Feasibility Study |
| | New Pacific Metals Corp. | 0723071 |
| Figure 13.1 |
Silver deportment in Met Sample 9 (15% oxide + 85% transitional), Met Sample 13 (high-grade sulphide sample), and Met Sample 15 (2020 high-grade sulphide sample) |
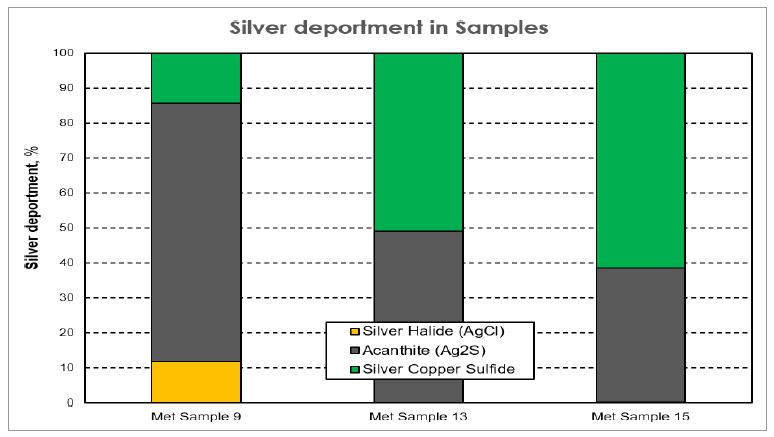
Source: New Pacific Metals Corp, 2024.
| Figure 13.2 |
Copper deportment in Met Sample 9 (15% oxide + 85% transitional), Met Sample 13 (high-grade sulphide sample), and Met Sample 15 (2020 high-grade sulphide sample) |
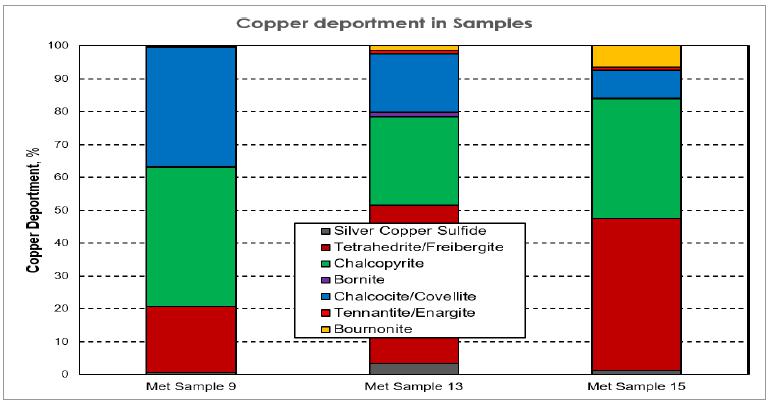
Note: Chalcopyrite includes stannite.
Source:
New Pacific Metals Corp, 2024.
| Silver Sand Project Pre-Feasibility Study |
| | New Pacific Metals Corp. | 0723071 |
| Figure 13.3 |
Sulphur deportment in Met Sample 9 (15% oxide + 85% transitional), Met Sample 13 (high-grade sulphide sample), and Met Sample 15 (2020 high-grade sulphide sample) |
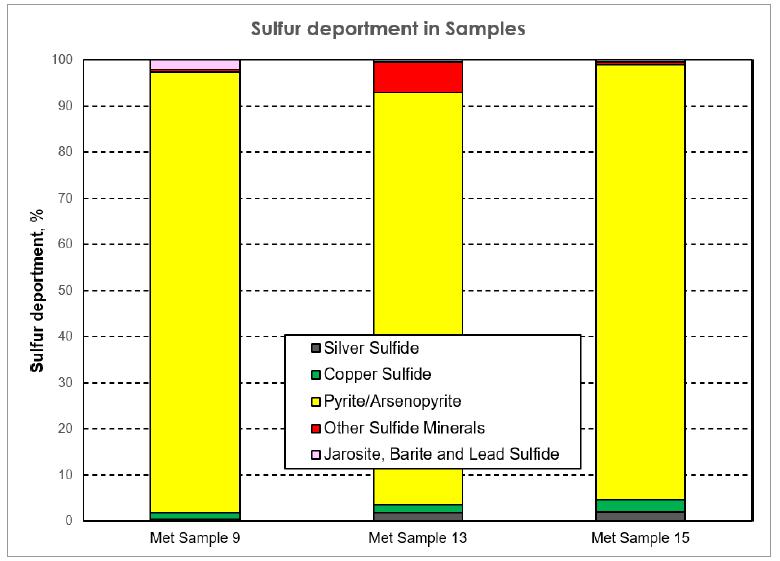
Source: New Pacific Metals
Corp, 2024.
One LOM composite sample,
two blended samples between the oxidized domain and transitional domain, three samples from the oxidized domain, five samples from the
transitional domain, and four samples from the sulphide domain were subjected to the measurement of specific gravity. The measured specific
gravity values are summarized in Table 13.6 varying between 2.64 t/m3 and 2.73 t/m3
with average 2.69 t/m3.
| Silver Sand Project Pre-Feasibility Study |
| | New Pacific Metals Corp. | 0723071 |
| Table 13.6 | Specific
gravity values of the 15 samples used in cyanide leaching tests |
| Type
of sample |
Sample
ID |
Sample
description |
Specific
gravity
(t/m3) |
| LOM
composite sample |
Met
Sample 1 |
10%
oxide + 80% transitional + 10%
sulphide |
2.66 |
Oxidized
sample |
Met
Sample 2 |
Entire
deposit |
2.72 |
| Met
Sample 3 |
Upper
half deposit (<100 m) |
2.71 |
| Met
Sample 4 |
Lower
half deposit (>100 m) |
2.73 |
| Average |
2.72 |
Transitional
sample |
Met
Sample 5 |
Entire
deposit |
2.72 |
| Met
Sample 6 |
Low-grade |
2.69 |
| Met
Sample 7 |
Upper
half deposit (<100 m) |
2.72 |
| Met
Sample 8 |
Lower
half deposit (>100 m) |
2.69 |
| Met
Sample 14 |
High-grade
from year 2020 |
2.68 |
| Average |
2.70 |
Oxidized
/ transitional composite sample |
Met
Sample 9 |
15%
oxide + 85% transitional (<100 m) |
2.69 |
| Met
Sample 10 |
15%
oxide + 85% transitional (>100 m) |
2.64 |
| Average |
2.67 |
Sulphide
sample |
Met
Sample 11 |
Entire
deposit |
2.66 |
| Met
Sample 12 |
Low-grade
(>150 m) |
2.65 |
| Met
Sample 13 |
High-grade
(>150 m) |
2.68 |
| Met
Sample 15 |
High-grade
from year 2020 |
2.70 |
| Average |
2.67 |
| Global
average |
2.69 |
Source: New Pacific Metals
Corp, 2024.
| 13.3.5 | Comminution testing |
Three composite samples were prepared
using the quarter core intervals from the drillholes in the oxidized domain, transitional domain, and sulphide domain in Table 13.7. The
composite sample from the oxidized domain consisted of 28 intervals from 18 drillholes. The composite sample from the transitional domain
consisted of 27 intervals from 20 drillholes. The composite sample from the sulphide domain was made up of 27 intervals from 19 drillholes.
| Table 13.7 | Number
of drillholes, intervals and sample weights for the composite samples used for the comminution testing |
| |
|
Oxide
sample |
Transitional
sample |
Sulphide sample |
| Number of drillholes selected |
|
18 |
20 |
19 |
| Number of intervals selected |
|
28 |
27 |
27 |
| Combined length of intervals |
m |
33.9 |
32.8 |
31.3 |
| Combined weight of selected 1/4 core intervals |
kg |
57.2 |
54.0 |
56.3 |
| Expected silver content |
g/t |
130 |
133 |
131 |
Source: New Pacific Metals
Corp, 2024.
The comminution testing included
SMC Test®, rod mill work index, ball mill work index, and abrasion index. The results of comminution testing are summarized in Table
13.8. The SAG circuit specific energy (SCSE) value was derived from the simulations of a standard circuit comprising a SAG mill in a closed
circuit with a pebble crusher. The value of Axb is a measure of resistance to
| Silver Sand Project Pre-Feasibility Study |
| | New Pacific Metals Corp. | 0723071 |
impact breakage. A high value of
Axb means a soft material, whilst a low value means a hard material.
| Table 13.8 | Comminution
testing results |
| |
Oxide
sample |
Transitional
sample |
Sulphide
sample |
| |
Specific gravity |
|
t/m3 |
2.48 |
2.57 |
2.57 |
| Parameters derived |
A |
|
|
83.1 |
76.6 |
72.6 |
| b |
|
0.62 |
0.56 |
0.67 |
| from SMC Test® |
|
|
| results |
ta |
|
|
0.54 |
0.43 |
0.49 |
| (26.5~31.5 mm) |
|
|
| A x b |
|
51.5 |
42.9 |
48.6 |
| |
SCSE |
|
kWh/t |
8.7 |
9.4 |
8.9 |
|
Measurement of Rod Mill Work Index |
Feed size |
100% passing |
µm |
12,500 |
12,500 |
12,500 |
| 80% passing |
8,613 |
8,284 |
8,858 |
| Product size |
100% passing |
µm |
1,180 |
1,180 |
1,180 |
| 80% passing |
751 |
764 |
752 |
| Rod Mill Work Index |
kWh/t |
6.6 |
7.8 |
6.9 |
|
Measurement of Ball Mill Work Index |
Feed size |
100% passing |
µm |
1,866 |
2,172 |
2,010 |
| 80% passing |
3,350 |
3,350 |
3,350 |
| Product size |
100% passing |
µm |
106 |
106 |
106 |
| 80% passing |
88 |
86 |
90 |
| Ball Mill Work Index |
kWh/t |
16.4 |
14.5 |
14.9 |
| Abrasion Index (12.7~19.0 mm) |
g |
0.245 |
0.278 |
0.294 |
Source: New Pacific Metals
Corp, 2024.
The SMC tests were
conducted on the particles sized between 26.5 and 31.5 mm. The Axb value derived from the SMC tests ranged from 42.9 to 51.5. On
this basis, these samples are classified as average or medium hardness in terms of the SAG milling. The SCSE values were between 8.7
and 9.4 kWh/t.
The rod mill work index values were
between 6.6 and 7.8 kWh/t. Based on these values, these samples are categorized as very soft with regards to the rod milling.
The results from the Bond ball
mill work index tests were between 14.5 and 16.4 kWh/t. Based on these values, these samples are characterized as average hardness with
regards to the ball milling.
The abrasion index values ranged
between 0.245 to 0.294 g. These samples are classified as moderately abrasive.
| 13.3.6 | Bottle roll cyanide leaching tests by Bureau Veritas Mineral / Metallurgy |
Fifteen bottle roll cyanide
leaching tests were completed by Bureau Veritas Minerals / Metallurgy in Richmond, British Columbia, Canada. The grinding was carried
out in a stainless-steel mill with stainless steel rods at natural pH using 1.0 kg sample charges. The targeted grind size was 80% passing
75 µm. After grinding, the slurry pulp density was adjusted to 40% solids, and then 0.30 kg/t lead nitrate was added.
After the slurry pH was adjusted
to 10.5~11.0 using lime, a 4 hour pre-aeration process was carried out under continuous oxygen sparging to target over 15 ppm dissolved
oxygen in the solution. Then, sodium cyanide was added to the aerated slurry to reach 3.0 g/L NaCN
| Silver Sand Project Pre-Feasibility Study |
| | New Pacific Metals Corp. | 0723071 |
concentration, followed by 54-hour
cyanide leaching in the absence of activated carbon under continuous oxygen sparging to maintain over 15 ppm dissolved oxygen.
After completion of the
54-hour cyanide leaching, activated carbon was added to the slurry to reach 30 g/L concentration and cyanide leaching, carbon in pulp
(CIP) was continued for another 18 hours while oxygen sparging was maintained. The data on silver recovery, cyanide consumption, and
lime consumption are presented in Table 13.9 and Table 13.10.
| Silver Sand Project Pre-Feasibility Study |
| | New Pacific Metals Corp. | 0723071 |
| Table 13.9 | Silver recovery, cyanide consumption,
and lime consumption from the bottle roll cyanide leaching tests carried out by Bureau Veritas Mineral / Metallurgy |
|
Type of sample |
Sample ID |
Sample description |
Back calcd.
head grade (g/t) |
Silver recovery |
Cyanide consumption |
Lime consumption |
|
DCN
after 54 h |
CIP
+18 h |
DCN
after 54 h |
CIP
+18 h |
|
| % |
kg/t NaCN |
kg/t Ca(OH)2 |
| LOM composite |
Met Sample 1 |
10% oxide + 80% transitional + 10% sulphide |
137 |
92.6 |
94.4 |
3.39 |
6.24 |
1.6 |
|
Oxidized sample |
Met Sample 2 |
Entire deposit |
132 |
91.1 |
93.4 |
2.72 |
5.55 |
1.5 |
| Met Sample 3 |
Upper half deposit (<100 m) |
148 |
91.1 |
90.9 |
2.95 |
5.85 |
1.4 |
| Met Sample 4 |
Lower half deposit (>100 m) |
137 |
93.6 |
95.7 |
2.24 |
4.99 |
1.6 |
| Average |
91.9 |
93.3 |
2.64 |
5.46 |
1.5 |
|
Transitional sample |
Met Sample 5 |
Entire deposit |
141 |
93.5 |
95.2 |
3.24 |
6.16 |
1.6 |
| Met Sample 6 |
Low-grade |
41 |
88.7 |
90.5 |
2.98 |
5.99 |
1.6 |
| Met Sample 7 |
Upper half deposit (<100 m) |
135 |
93.4 |
95.0 |
3.62 |
6.45 |
1.4 |
| Met Sample 8 |
Lower half deposit (>100 m) |
142 |
94.3 |
95.2 |
3.05 |
5.90 |
1.6 |
| Met Sample 14 |
High-grade from year 2020 |
399 |
94.1 |
96.1 |
3.39 |
6.07 |
1.7 |
| Average |
92.8 |
94.4 |
3.26 |
6.11 |
1.6 |
|
Oxidized / Transitional sample |
Met Sample 9 |
15% oxidized + 85% transitional (<100 m) |
133 |
91.9 |
94.2 |
2.87 |
5.77 |
1.6 |
| Met Sample 10 |
15% oxidized + 85% transitional (>100 m) |
159 |
92.2 |
95.1 |
2.78 |
5.33 |
1.7 |
| Average |
92.1 |
94.7 |
2.82 |
5.55 |
1.7 |
|
Sulphide sample |
Met Sample 11 |
Entire deposit |
159 |
70.1 |
82.2 |
3.59 |
6.31 |
1.4 |
| Met Sample 12 |
Low-grade (>150 m) |
59 |
47.4 |
93.3 |
3.16 |
5.93 |
1.5 |
| Met Sample 13 |
High-grade (>150 m) |
703 |
66.5 |
73.1 |
4.99 |
7.46 |
1.5 |
| Met Sample 15 |
High-grade from year 2020 |
440 |
63.7 |
80.4 |
4.72 |
7.52 |
1.6 |
| Average |
61.9 |
82.3 |
4.12 |
6.81 |
1.5 |
Source: New Pacific Metals Corp, 2024.
| Silver Sand Project Pre-Feasibility Study |
| | New Pacific Metals Corp. | 0723071 |
The LOM composite sample
(Met Sample 1) achieved 94.4% silver recovery. As a group average, final silver recovery was 93.3% for the samples from the oxidized
domain (Met Samples 2, 3, and 4), 94.4% for the samples from the transitional domain (Met Samples 5~8 and 14) and 82.3% for the samples
from the sulphide domain (Met Samples 11~13 and 15). The blended samples between the oxidized domain and transitional domain (Met Samples
9 and 10) achieved 94.7% silver recovery. The final tail residues from each of these fifteen cyanide-leaching tests were subsequently
re-assayed by ALS Metallurgy in Kamloops, and the accuracy of silver assays by Bureau Veritas for these tail solids have been verified.
| Silver Sand Project Pre-Feasibility Study |
| | New Pacific Metals Corp. | 0723071 |
| Table 13.10 | Group average silver recovery
and impact of activated carbon on silver recovery |
|
Type of sample |
Sample ID |
Sample description |
Head grade |
Silver recovery |
CIP recovery
minus
DCN recovery |
| 54-h DCN |
54-h DCN + 18-h CIP |
| Individual |
Average |
Individual |
Average |
| g/t |
% |
% |
% |
| LOM composite |
Met Sample 1 |
10% oxide + 80% transitional + 10% sulphide |
137 |
92.6 |
|
94.4 |
|
1.8 |
|
Oxidized sample |
Met Sample 2 |
Entire deposit |
132 |
91.1 |
91.9 |
93.4 |
93.3 |
2.3 |
| Met Sample 3 |
Upper half deposit (<100 m) |
148 |
91.1 |
90.9 |
-0.2
2.1 |
| Met Sample 4 |
Lower half deposit (>100 m) |
137 |
93.6 |
95.7 |
|
Transitional sample |
Met Sample 5 |
Entire deposit |
141 |
93.5 |
92.8 |
95.2 |
94.4 |
1.7 |
| Met Sample 6 |
Low-grade |
41 |
88.7 |
90.5 |
1.8 |
| Met Sample 7 |
Upper half deposit (<100 m) |
135 |
93.4 |
95.0 |
1.6 |
| Met Sample 8 |
Lower half deposit (>100 m) |
142 |
94.3 |
95.2 |
0.9 |
| Met Sample 14 |
High-grade from year 2020 |
399 |
94.1 |
96.1 |
2.0 |
Oxidized / transitional
composite sample |
Met Sample 9 |
15% oxidized + 85% transitional (<100 m) |
133 |
91.9 |
92.1 |
94.2 |
94.7 |
2.3 |
| Met Sample 10 |
15% oxidized + 85% transitional (>100 m) |
159 |
92.2 |
95.1 |
2.9 |
|
Sulphide sample |
Met Sample 11 |
Entire deposit |
159 |
70.1 |
61.9 |
82.2 |
82.3 |
12.1 |
| Met Sample 12 |
Low-grade (>150 m) |
59 |
47.4 |
93.3 |
45.9 |
| Met Sample 13 |
High-grade (>150 m) |
703 |
66.5 |
73.1 |
6.6 |
| Met Sample 15 |
High-grade from year 2020 |
440 |
63.7 |
80.4 |
16.7 |
Source: New Pacific Metals Corp (2024).
| Silver Sand Project Pre-Feasibility Study |
| | New Pacific Metals Corp. | 0723071 |
An important observation of these
fifteen cyanide leaching tests was the increase of silver recovery after the addition of activated carbon. The silver recovery increase
was relatively modest for the samples from the oxidized domain and transitional domain; however, this increase was significant for the
samples from the sulphide domain. Probably, the high-level sulphide minerals in these samples might be able to adsorb the dissolved silver,
a phenomenon known as preg-robbing or preg borrowing. However, this phenomenon was not observed in subsequent testwork by ALS Metallurgy
in Kamloops.
Cyanide consumptions from these
fifteen cyanide leaching tests were relatively high, especially after the addition of activated carbon. It is suspected that a portion
of cyanide in the solution was lost to the atmosphere due to excessive oxygen gas sparging. Also, the activated carbon might have adsorbed
a significant amount of cyanide. Some cyanide was also lost to the solution samples taken for assays, and this loss was estimated to be
around 0.20 kg/t NaCN. Figure 13.4 shows cyanide consumption as a function of sulphur content in the feed before activated carbon was
added (at the end of the 54-hour cyanide leaching in the absence of activated carbon) and after activated carbon was added (at the end
of the 54-hour DCN plus 18-hour CIP). It can be seen that the higher level of sulphide minerals in the feed consumed more cyanide.
| Figure 13.4 | Cyanide
consumption as a function of sulphur content in the feed |
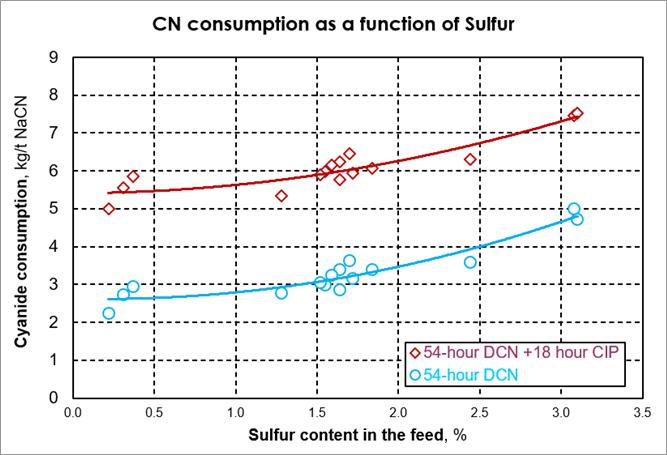
Source: New Pacific Metals
Corp, 2024.
| Silver Sand Project Pre-Feasibility Study |
| | New Pacific Metals Corp. | 0723071 |
| Table 13.11 | Copper dissolution
during 72-hour cyanide leaching |
|
Type of Sample |
Sample ID |
Sample description |
Head
grade
(g/t) |
Copper
dissolution
(%) |
| LOM composite |
Met Sample 1 |
10% oxide + 80% transitional + 10% sulphide |
303 |
90 |
|
Oxidized sample |
Met Sample 2 |
Entire deposit |
187 |
51 |
| Met Sample 3 |
Upper half deposit (<100 m) |
105 |
31 |
| Met Sample 4 |
Lower half deposit (>100 m) |
278 |
59 |
| Average |
47 |
|
Transitional sample |
Met Sample 5 |
Entire deposit |
271 |
88 |
| Met Sample 6 |
Low-grade |
163 |
56 |
| Met Sample 7 |
Upper half deposit (<100 m) |
317 |
95 |
| Met Sample 8 |
Lower half deposit (>100 m) |
230 |
61 |
| Met Sample 14 |
High-grade from year 2020 |
226 |
65 |
| Average |
73 |
|
Oxidized / transitional composite sample |
Met Sample 9 |
15% oxidized + 85% transitional (<100 m) |
277 |
87 |
| Met Sample 10 |
15% oxidized + 85% transitional (>100 m) |
203 |
74 |
| Average |
80 |
|
Sulphide sample |
Met Sample 11 |
Entire deposit |
643 |
71 |
| Met Sample 12 |
Low-grade (>150 m) |
131 |
83 |
| Met Sample 13 |
High-grade (>150 m) |
1,438 |
87 |
| Met Sample 15 |
High-grade from year 2020 |
1,359 |
83 |
| Average |
81 |
| Global average |
72 |
Source: New Pacific Metals
Corp, 2024.
A significant amount of copper was
dissolved during cyanide leaching. There was a positive correlation between copper dissolution and cyanide consumption Figure 13.5. For
the LOM composite sample (Met Sample 1), copper dissolution reached 90%. As a group average, copper dissolution was 47% for the samples
from the oxidized domain, 73% for the samples from the transitional domain, and 81% for the samples from the sulphide domain. For the
blended samples between the oxidized domain and transitional domain, copper dissolution reached 80%. Such elevated copper dissolution
is expected to be problematic for the future commercial operations because it results in an accumulation of dissolved copper in the process
water. The high-level dissolved copper may interfere with silver reduction using zinc dust in the Merrill Crowe circuit.
| Silver Sand Project Pre-Feasibility Study |
| | New Pacific Metals Corp. | 0723071 |
| Figure 13.5 | Relationship
between copper dissolution and cyanide consumption |
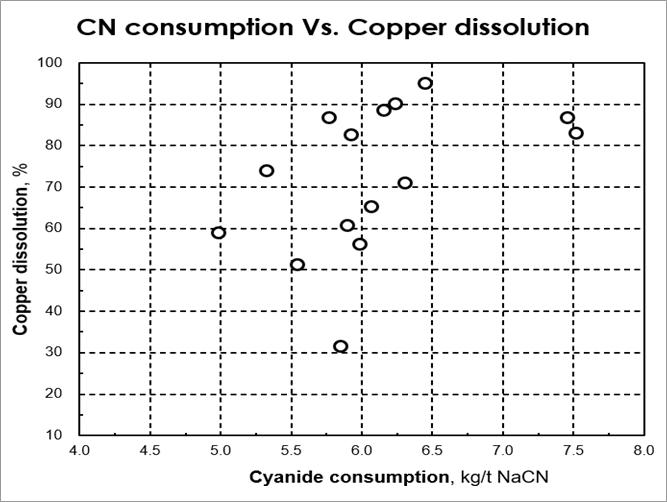
Source: New Pacific Metals
Corp, 2024.
| 13.3.7 | Cyanide leaching tests by ALS in Metallurgy Kamloops |
After Bureau Veritas Mineral /
Metallurgy laboratory was closed permanently in September 2002, all remaining cyanide leaching tests were moved to ALS Metallurgy in Kamloops,
British Columbia, Canada. Three types of leaching reactor, namely smooth bottle, mechanically agitated tank, and lifterbottle, were used
and their performances were compared. Oxygen sparging was intermittent for the initial cyanide leaching tests. For all subsequent cyanide
leaching tests, oxygen sparging was continuous with a controlled flowrate. Most cyanide leaching tests were carried out for the following
four samples (a limited number of cyanide leaching tests were conducted for other samples):
| · | The
first sample was Met Sample 1, which consisted of 10% oxide, 80% transitional, and 10% sulphide
with a head grade of 138 g/t silver. |
| · | The
second sample was Met Sample 1 NEW, which consisted of 10% oxide, 65% transitional, and 25%
sulphide with a head grade of 114 g/t silver. |
| · | The
third sample was Met Sample 9, which was made up of 15% oxide and 85% transitional with a
head grade of 140 g/t silver. |
| · | The
fourth sample was Met Sample 15 with a head grade of 418 g/t silver. This sample was a high-grade
sample from the sulphide domain and resulted in less than 80% silver recovery when subjected
to cyanide leaching tests in 2020. |
| Silver Sand Project Pre-Feasibility Study |
| | New Pacific Metals Corp. | 0723071 |
Grinding was carried out in a mild
steel mill with stainless steel rods. Lime was added to the grinding mill. The investigated parameters included lead nitrate addition,
cyanide concentration, leaching retention time, pulp density, grind size, pre-aeration, mild steel mill vs rubber-lined steel mill, air
sparging vs oxygen sparging, intermittent oxygen sparging vs continuous oxygen sparging, oxygen sparging flowrate, bottle roller speed,
small bottle vs large bottle, activated carbon addition and gravity concentration.
As noted during the earlier Bureau
Veritas Mineral / Metallurgy work, ALS Metallurgy Kamloops also observed a significant increase of cyanide consumption after addition
of activated carbon. Among the three types of reactors, silver recovery in the mechanically agitated tank was increased due to improved
mixing, but cyanide consumption was higher. It is suspected that a considerable amount of air was entrained from the surface into the
slurry in the mechanically agitated tank due to strong vortex on the surface. When the entrained air escaped, some cyanide was lost. If
the strong vortex on the surface is prevented, cyanide consumption in a mechanically agitated tank is expected to come down significantly.
This hypothesis has been verified by ALS Metallurgy Perth who achieved less than 1.0 kg/t NaCN cyanide consumption on Met Sample 1 in
a mechanically agitated tank. When cyanide leaching was carried out in a smooth bottle, cyanide consumption was lower, but silver recovery
was reduced due to lower levels of agitation. In comparison, the lifterbottle produced the best overall results with respect to silver
recovery and cyanide consumption.
Met Sample 1 NEW consisted of 10%
material from the oxidized domain, 65% material from the transitional domain, and 25% material from the sulphide domain with a head grade
of 114 g/t. This sample represents an average mill feed for the LOM production. Six cyanide leaching tests were completed and the results
are presented in Table 13.12. For each cyanide leach test, a number of solution samples were taken for silver assays. Each removed solution
sample was then supplemented by adding the tap water at a same volume to the leaching reactor. The amount of cyanide in these solution
samples was included in the cyanide consumption reported by the laboratory. For the cyanide consumption numbers in Table 13.12, the amount
of cyanide in these solution samples has been credited.
| Table 13.12 | Cyanide
leaching results for Met Sample 1 NEW in a lifterbottle |
|
Test ID |
Sparged gas |
Cyanide
concentration
(g/L NaCN) |
Lead
nitrate
(kg/t) |
Back calcd.
head grade
(g/t) |
Silver recovery
(%) |
Cyanide
consumption
(kg/t NaCN) |
Lime
consumption
(kg/t CaO) |
| Type |
Flowrate (mL/min) |
| 72CN |
Oxygen |
19 |
2.00 |
/ |
111 |
89.2 |
1.16 |
1.3 |
| 73CN |
Oxygen |
9 |
113 |
89.4 |
0.99 |
1.0 |
| 74CN |
Air |
19 |
121 |
89.6 |
0.94 |
1.6 |
| 75CN |
Oxygen |
38 |
114 |
90.6 |
0.96 |
1.3 |
| 78CN |
Oxygen |
19 |
3.00 |
/ |
111 |
91.0 |
1.37 |
2.2 |
| 79CN |
Oxygen |
19 |
2.00 |
0.20 |
116 |
88.0 |
1.18 |
1.3 |
| Average |
114 |
89.6 |
1.10 |
1.4 |
Note: 72 hour, without activated carbon, 1.0
kg solid, pulp density of 45% solids, grind size 80% passing ~75 µm, pH ~11.0.
Source: New Pacific Metals Corp, 2024.
| Silver Sand Project Pre-Feasibility Study |
| | New Pacific Metals Corp. | 0723071 |
The results in Table
13.12 indicate that oxygen sparging flowrate and lead nitrate did not affect the final silver recovery. Also, the final silver
recovery with air sparing was as good as silver recovery with oxygen sparging, although initial silver leaching rates were superior
with oxygen. Nevertheless, oxygen sparging is still considered in the process plant design due to the high elevation (and low
partial pressure) at the mine site and also the faster silver dissolution rate. On average, silver recovery was 89.6%, cyanide
consumption was 1.10 kg/t NaCN, and lime consumption was 1.4 kg/t CaO. The copper content of Met Sample 1 NEW was 300 ppm and on
average, copper dissolution from these six cyanide leaching tests was 56%.
As a comparison, two cyanide leaching
tests were carried out in a mechanically agitated tank, and the results are presented in Table 13.13. Silver recovery was 89.6% at pulp
density of 41% solids. This silver recovery is comparable to what was achieved in a lifterbottle. However, when pulp density was increased
to 45% solids, silver recovery dropped slightly to 87.7%. Based on cyanide consumption figures (3.13 kg/t NaCN at pulp density of 41%
solids and 1.12 kg/t NaCN at pulp density of 45% solids), slurry mixing at the higher density was probably not as vigorous and the lower
silver recovery was likely a result of poor mixing.
| Table 13.13 | Cyanide leaching results for Met Sample 1 NEW in a mechanically agitated tank |
|
Test ID |
Sparged gas |
Pulp
density
(% solid) |
Cyanide
concentration
(g/L NaCN) |
Back calcd.
head grade
(g/t) |
Silver
recovery
(%) |
Cyanide
consumption
(kg/t NaCN) |
Lime
consumption
(kg/t CaO) |
| Type |
Flowrate (mL/min) |
| 77CN |
Oxygen |
19 |
41 |
2.00 |
105 |
89.6 |
3.13 |
2.2 |
| 81CN |
45 |
118 |
87.7 |
1.12 |
2.0 |
Note: 72 hours, without
activated carbon, 1.0 kg solid, pulp density of 45% solids, grind size 80% passing ~75 µm, pH ~11.0, continuous oxygen
sparging at 19 mL/min.
Source: New Pacific Metals Corp, 2024.
Met Sample 1 consisted
of 10% material from the oxidized domain, 80% material from the transitional domain, and 10% material from the sulphide domain at a
head grade of 145 g/t. This sample represented an average mill feed for the LOM production before the open pit was optimized. Four
cyanide leaching tests were carried out in a lifterbottle, and the results are presented in Table 13.14. On average, silver recovery
was 92.7%, cyanide consumption was 1.40 kg/t NaCN, and lime consumption was 1.6 kg/t CaO. The loss of cyanide to the solution
samples taken for assays has been credited for the cyanide consumption numbers in Table 13.14. Copper content of Met Sample 1 was
303 ppm. Average copper dissolution from these four cyanide leaching tests was 60%.
| Table 13.14 | Cyanide leaching results for Met Sample 1 in a lifterbottle |
|
Test ID |
Pulp
density
(% solid) |
Cyanide
concentration
(g/L NaCN) |
Lead
nitrate
(kg/t) |
Retention
time
(h) |
Back calcd.
head grade
(g/t) |
Silver
recovery
(%) |
Cyanide
consumption
(kg/t NaCN) |
Lime
consumption
(kg/t CaO) |
| 28CN |
40 |
3.00 |
0.30 |
72 |
133 |
92.3 |
1.62 |
1.8 |
| 38CN |
40 |
3.00 |
0.30 |
48 |
138 |
92.0 |
1.23 |
1.5 |
| 48CN |
40 |
3.00 |
0.30 |
48 |
153 |
92.7 |
1.67 |
1.7 |
| 66CN |
45 |
2.00 |
/ |
72 |
157 |
93.8 |
1.08 |
1.4 |
| Average |
|
145 |
92.7 |
1.40 |
1.6 |
Note: 1.0 kg solid, grind size 80%
passing ~75 µm, pH ~11.0, oxygen sparging at 19 mL/min.
Source: New Pacific Metals Corp, 2024.
Comparing the results for tests
with higher cyanide concentration and a shorter retention time and those with lower cyanide concentration and a longer retention time,
the latter is thought to have
| Silver Sand Project Pre-Feasibility Study |
| | New Pacific Metals Corp. | 0723071 |
superior economic because cyanide
is one of the most significant contributors to the operating cost. The results in Table 13.14 once again confirmed that lead nitrate did
not appear to improve silver recovery and thus it was dropped from further testing.
A number of cyanide leaching
tests were carried out in a mechanically agitated tank. Three types of cyanide leaching tests were carried out, namely:
| · | DCN
stands for direct cyanide leach, which means that cyanide leaching was carried out in the
absence of activated carbon. |
| · | CIP
stands for carbon in pulp, which means that cyanide leaching was started in the absence of
activated carbon, and after 54 hours of leaching, activated carbon was added to reach 30
g/L concentration in the slurry and then cyanide leaching was continued for another 18 hours. |
| · | CIL
stands for carbon in leach, which means that cyanide
leaching was started in the presence of activated carbon. |
Nine cyanide leaching
tests were conducted by ALS Metallurgy in Kamloops and one cyanide leaching test was completed by ALS Metallurgy in Perth. The
results from these ten cyanide leaching tests are presented in Table 13.15. Under the conditions of 40% solids pulp density,
1.50~3.0 g/L NaCN cyanide concentration and 72 hours retention time (54-hour DCN + 18-hour CIP), average silver recovery was 92.4%,
average cyanide consumption was 2.67 kg/t NaCN where the loss of cyanide to the solution samples has been credited, and average lime
consumption was 1.7 kg/t CaO. This average silver recovery (92.4%) was similar to 92.2% silver recovery (Test 15CN) obtained in the
absence of activated carbon. When cyanide concentration was reduced to 1.0 g/L NaCN (Test 19CN), silver recovery decreased to 87.1%.
When cyanide concentration was increased to 2.0 g/L NaCN (Test 23CN), silver recovery was 90.4%. It is suspected that slurry mixing
was probably somewhat compromised when pulp density was increased to 45% solids.
| Silver Sand Project Pre-Feasibility Study |
| | New Pacific Metals Corp. | 0723071 |
| Table 13.15 | Cyanide leaching results for
Met Sample 1 in a mechanically agitated tank |
|
Laboratory |
Type of
leach |
Test
ID |
Pulp
density |
Oxygen
flowrate |
Cyanide concentration |
Lead
nitrate |
Retention
time |
Back calcd.
head
grade |
Silver
recovery |
Cyanide
consumption |
Lime
consumption |
| % solid |
mL/min |
g/L NaCN |
kg/t |
h |
g/t |
% |
kg/t NaCN |
kg/t CaO |
|
ALS Kamloops |
DCN |
15CN |
40 |
19 |
3.00 |
0.30 |
72 |
129 |
92.2 |
3.15 |
1.3 |
| 34CN |
2.00 |
/ |
48 |
148 |
89.6 |
1.99 |
1.7 |
|
CIP |
04CN |
40 |
19 |
3.00 |
0.30 |
72 |
145 |
93.7 |
3.49 |
1.5 |
| 21CN |
2.00 |
0.20 |
129 |
92.0 |
2.51 |
1.8 |
| 25CN |
2.00 |
/ |
147 |
92.5 |
2.72 |
1.6 |
| 30CN |
1.50 |
/ |
154 |
91.6 |
1.95 |
2.0 |
| Average |
144 |
92.4 |
2.67 |
1.7 |
| Global average |
91.9 |
2.64 |
1.6 |
| CIP |
19CN |
45 |
19 |
1.00 |
/ |
72 |
123 |
87.1 |
1.68 |
2.2 |
| 23CN |
2.00 |
138 |
90.4 |
2.84 |
1.5 |
| CIL |
35CN |
40 |
19 |
2.00 |
/ |
72 |
152 |
92.5 |
3.37 |
1.6 |
| ALS Perth |
DCN |
JR7660 |
40 |
no |
2.00 |
/ |
48 |
133 |
91.2 |
0.83 |
1.9 |
Note: 1.0 kg solid, grind size 80%
passing ~75 µm, continuous oxygen sparging, pH ~11.0.
| Silver Sand Project Pre-Feasibility Study |
| | New Pacific Metals Corp. | 0723071 |
ALS Metallurgy in Perth completed
one cyanide leaching test in a mechanically agitated tank to generate the pregnant leach solution for Merrill Crowe testing. Silver recovery
was 91.2%, which is similar to what was achieved by ALS Metallurgy in Kamloops. However, cyanide consumption from ALS Metallurgy in Perth
was much lower. ALS Metallurgy in Perth used a baffled tank and a Rushton agitator. Probably, the slurry vortex on the surface in the
tank was modest and thus a minimal amount of air was entrained into the slurry.
Copper content in Met Sample
1 was 303 ppm. Copper dissolution was 58% on average based on nine cyanide leaching tests by ALS Metallurgy in Kamloops, and 62% based
on one cyanide leaching test by ALS Metallurgy in Perth.
| Silver Sand Project Pre-Feasibility Study |
| | New Pacific Metals Corp. | 0723071 |
| Table 13.16 | Cyanide leaching results for
Met Sample 1 in a smooth bottle |
|
Oxygen
sparging |
Bottle
size |
Type of
leach |
Test
ID |
Grind size
(80%) |
Cyanide
concentration |
Lead
nitrate |
Back calcd.
head grade |
Silver
recovery |
Cyanide
consumption |
Lime
consumption |
| µm |
g/L NaCN |
kg/t |
g/t |
% |
kg/t NaCN |
kg/t CaO |
|
19 mL/min continuous |
Small bottle |
CIP |
01CN |
74 |
3.00 |
0.30 |
143 |
90.0 |
0.22 |
1.0 |
| 03CN |
74 |
143 |
91.9 |
1.92 |
1.6 |
| 05CN |
74 |
138 |
89.8 |
1.53 |
1.1 |
| 12CN |
74 |
134 |
90.8 |
1.62 |
2.2 |
| 13CN |
48 |
135 |
90.5 |
1.77 |
2.5 |
| 14CN |
75 |
136 |
91.0 |
2.01 |
1.5 |
| Average |
138 |
90.7 |
1.51 |
1.7 |
| CIL |
36CN |
74 |
2.00 |
/ |
139 |
92.6 |
2.34 |
1.3 |
| Large bottle |
DCN |
29CN |
74 |
3.00 |
0.30 |
146 |
89.4 |
4.27 |
2.3 |
| Average |
139 |
90.7 |
1.96 |
1.7 |
|
Intermittent oxygen sparging |
Small bottle |
CIP |
07CN |
74 |
3.00 |
0.30 |
137 |
90.2 |
1.41 |
1.4 |
| 08CN |
74 |
142 |
88.8 |
1.58 |
1.3 |
| 09CN |
50 |
143 |
91.5 |
1.51 |
1.4 |
| 10CN |
75 |
144 |
89.5 |
1.60 |
1.4 |
| 11CN |
75 |
143 |
90.0 |
1.56 |
1.0 |
| Average |
142 |
90.0 |
1.53 |
1.3 |
|
DCN |
06CN |
74 |
3.00 |
0.30 |
131 |
89.3 |
0.78 |
1.1 |
| 17CN |
6.00 |
132 |
89.8 |
1.12 |
1.0 |
| 18CN |
3.00 |
134 |
90.1 |
0.68 |
0.3 |
| Average |
89.8 |
1.13 |
0.9 |
| Average |
138 |
89.9 |
1.28 |
1.1 |
| Global average |
90.3 |
1.62 |
1.4 |
Note: 1.0 kg solid, pulp density 40% solids,
oxygen sparging, ~ pH 11.0, 72-hour retention time.
Source: New Pacific Metals Corp, 2024.
| Silver Sand Project Pre-Feasibility Study |
| | New Pacific Metals Corp. | 0723071 |
A number of cyanide leaching tests
were carried out in a smooth bottle under different conditions. The conditions and results are presented in Table 13.16. With continuous
oxygen sparging at 19 mL/min, six cyanide leaching tests were conducted for a 72-hour retention time, in which activated carbon was added
after 54 hours of leaching. Average silver recovery was 90.7% along with average 1.51 kg/t NaCN cyanide consumption and average 1.7 kg/t
CaO lime consumption. Grind size finer than 74 µm did not increase silver recovery. When a large bottle was used (Test 29CN), silver
recovery was not increased. However, cyanide consumption in a large bottle increased significantly to 4.27 kg/t. Due to the larger slurry
surface area in the larger bottle, it is thought that the amount of cyanide lost to the atmosphere was increased. When activated carbon
was added in the very beginning, i.e., the CIL, silver recovery increased to 92.6%. However, cyanide consumption also increased to 2.34
kg/t NaCN. The loss of cyanide to the solution samples taken for assays has been credited for this cyanide consumption value.
With intermittent oxygen sparging
to the headspace inside the bottle, five cyanide leaching tests were conducted for a 72-hour retention time, in which activated carbon
was added after 54 hours of leaching. Average silver recovery was 90.0% along with average 1.53 kg/t NaCN cyanide consumption and average
1.3 kg/t CaO lime consumption. These numbers are similar to those with continuous oxygen sparging (90.7% silver recovery, 1.51 kg/t NaCN
cyanide consumption, and 1.7 kg/t CaO lime consumption). In the absence of activated carbon, three cyanide leaching tests were completed,
average silver recovery was 89.8% along with 1.13 kg/t NaCN cyanide consumption, and 0.9 kg/t CaO lime consumption.
As global averages from these 16
cyanide tests in a smooth bottle, silver recovery was 90.3%, cyanide consumption was 1.62 kg/t NaCN and lime consumption was 1.4 kg/t
CaO. Compared with global averages (91.9% silver recovery, 2.64 kg/t NaCN cyanide consumption, 1.6 kg/t CaO lime consumption) in a mechanically
agitated tank, silver recovery was 1.6% lower; however, cyanide consumption was lower by 1.02 kg/t NaCN.
Copper content in Met Sample 1 was
303 ppm. Average copper dissolution was 57% under continuous oxygen sparging and 54% under intermittent oxygen sparging.
| 13.3.7.3 | Blended samples between the oxidized domain and the transitional domain |
Two blended samples were composited
between the oxidized domain and the transitional domain at a ratio of 15% oxidized material and 85% transitional material. Met Sample
9 consisted of the intervals from the upper half deposit at depths up to 100 metres, while Met Sample 10 consisted of the intervals from
the lower half deposit at depths greater than 100 metres.
| Silver Sand Project Pre-Feasibility Study |
| | New Pacific Metals Corp. | 0723071 |
| Table 13.17 | Cyanide leaching results for Met Sample 9 |
|
Reactor |
Type
of test |
Cyanide
concentration |
Test
ID |
Pulp
density |
Lead nitrate |
Back calcd. head grade |
Silver
recovery |
Cyanide
consumption |
Lime
consumption |
| g/L NaCN |
%
solid |
kg/t |
g/t |
% |
kg/t NaCN |
kg/t CaO |
|
Lifterbottle |
CIP |
2.00 |
57CN |
40 |
/ |
146 |
92.1 |
1.16 |
1.7 |
| DCN |
64CN |
45 |
/ |
164 |
92.1 |
1.32 |
2.5 |
| Average |
155 |
92.1 |
1.24 |
2.1 |
| Smooth bottle |
CIP |
3.00 |
02CN |
40 |
0.30 |
146 |
91.7 |
0.45 |
1.0 |
|
Mechanically agitated tank |
CIP |
1.00 |
20CN |
45 |
/ |
137 |
88.8 |
1.84 |
2.0 |
| 1.50 |
31CN |
40 |
/ |
144 |
92.0 |
2.11 |
1.6 |
| |
22CN |
40 |
0.20 |
142 |
93.1 |
2.86 |
1.8 |
| 2.00 |
24CN |
45 |
/ |
156 |
92.4 |
2.70 |
1.7 |
| 26CN |
40 |
/ |
145 |
92.6 |
2.69 |
1.2 |
| |
Average |
148 |
92.7 |
2.75 |
1.6 |
| DCN |
3.00 |
16CN |
40 |
0.30 |
133 |
93.4 |
2.51 |
1.4 |
Note: 1.0 kg solid,
grind size P80 ~75 µm, continuous oxygen sparging at 19 mL/min, pH ~11.0, 72-hour retention time
Source: New Pacific Metals Corp,
2024.
Table 13.17 shows the
conditions and results for Met Sample 9. When cyanide leaching was carried out in a lifterbottle, average silver recovery was 92.1%
and average cyanide consumption was 1.24 kg/t NaCN. The presence of activated carbon did not improve silver recovery under these
conditions. When cyanide leaching was carried out in a smooth bottle (Test 02CN), silver recovery was 91.7%. In a mechanically
agitated tank at 2.0 g/L NaCN cyanide concentration, average silver recovery was 92.7% and average cyanide consumption was 2.75 kg/t
NaCN. The increase of silver recovery in a mechanically agitated tank was negligible, but cyanide consumption increased
significantly, again likely due to the loss of cyanide to the atmosphere. Copper content in Met Sample 9 was 277 ppm and on average,
copper dissolution was 65%.
For Met Sample 10, two cyanide
leaching tests were carried out in a lifterbottle and three cyanide leaching tests were conducted in a mechanically agitated tank. The
conditions and results are summarized in Table 13.18. With the lifterbottle, average silver recovery was 94.7% and average cyanide consumption
was 1.02 kg/t NaCN. The presence of activated carbon did not increase silver recovery.
With the mechanically agitated tank, average
silver recovery was 94.6% and average cyanide consumption was 2.62 kg/t NaCN. Cyanide consumption in a mechanically agitated tank increased
more than 100% compared with the lifterbottle. Copper content in Met Sample 10 was 203 ppm and average copper dissolution was 64%.
| Silver Sand Project Pre-Feasibility Study |
| | New Pacific Metals Corp. | 0723071 |
| Table 13.18 | Cyanide
leaching results for Met Sample 10 |
|
Reactor |
Type of
leach |
Test
ID |
Pulp
density |
Cyanide
concentration |
Back calcd.
head grade |
Silver
recovery |
Cyanide
consumption |
Lime
consumption |
|
%
solid |
g/L NaCN |
g/t |
% |
kg/t NaCN |
kg/t CaO |
|
Lifterbottle |
CIP |
58CN |
40 |
2.00 |
143 |
95.1 |
0.89 |
1.3 |
| DCN |
65CN |
45 |
164 |
94.3 |
1.15 |
1.6 |
| Average |
153 |
94.7 |
1.02 |
1.4 |
|
Mechanically
agitated tank |
CIP |
51CN |
40 |
2.00 |
148 |
95.8 |
2.42 |
1.9 |
| 59CN |
45 |
2.00 |
145 |
95.3 |
2.99 |
1.5 |
| 60CN |
40 |
1.50 |
150 |
92.6 |
2.45 |
1.6 |
| Average |
148 |
94.6 |
2.62 |
1.6 |
Note: 1.0 kg solid,
grind size P80 ~75 µm, continuous oxygen sparging at 19 mL/min, pH ~11.0, 72-hour retention time.
Source: New Pacific Metals Corp,
2024.
Four samples were composited with
the intervals selected from the oxidized domain. The first sample, labelled as Met Sample 2, was composited with the intervals across
the entire deposit. The second sample, labelled as Met Sample 3, was made up with the intervals from the upper half of the deposit at
depths less than 100 metres. The third sample, labelled as Met Sample 4, consisted of the intervals from the lower half of the deposit
at depths greater than 100 metres. The fourth sample, labelled as Met Sample 3B:4B, contained the low-grade intervals.
Table 13.19 shows the cyanide leaching
conditions and results. One cyanide leaching test was carried out in a lifterbottle for Met Sample 3. Silver recovery was 89.5% and cyanide
consumption was 0.68 kg/t NaCN.
Three cyanide leaching
tests were conducted in a mechanically agitated tank. For Met Sample 3, silver recovery was 89.9% and cyanide consumption was 2.22 kg/t
NaCN. Compared with the lifterbottle test, silver recovery was similar, but cyanide consumption was more than doubled. For Met Sample
2, silver recovery was 91.2% and cyanide consumption was 2.00 kg/t NaCN. For Met Sample 4, silver recovery was 91.5% and cyanide consumption
was 2.95 kg/t NaCN. The loss of cyanide to the solution samples taken for assays has been credited for these cyanide consumption numbers.
| Silver Sand Project Pre-Feasibility Study |
| | New Pacific Metals Corp. | 0723071 |
| Table 13.19 | Cyanide leaching results for
the oxidized samples |
Reactor |
Sample
ID |
Sample
description |
Test
ID |
Type of
leach |
Pulp
density |
Back calc.
head grade |
Silver
recovery |
Cyanide
consumption |
Lime
consumption |
| %
solid |
g/t |
% |
kg/t
NaCN |
kg/t
CaO |
| Lifterbottle |
Met Sample 3 |
Upper half deposit (<100 m) |
53CN |
CIP |
40 |
162 |
89.5 |
0.68 |
1.6 |
Mechanically
agitated tank |
Met
Sample 2 |
Entire
deposit |
39CN |
CIP |
40 |
141 |
91.2 |
2.00 |
1.6 |
| Met
Sample 3 |
Upper
half deposit (<100 m) |
40CN |
142 |
89.9 |
2.22 |
1.3 |
| Met
Sample 4 |
Lower
half deposit (>100 m) |
41CN |
139 |
91.5 |
2.95 |
1.3 |
| Average |
141 |
90.9 |
2.39 |
1.4 |
| Lifterbottle |
Met Sample 3B:4B |
Low-grade |
71CN |
DCN |
45 |
29 |
78.3 |
0.39 |
1.4 |
Note: 1.0 kg solid, grind size P80
~75 µm, continuous oxygen sparging at 19 mL/min, pH ~11.0, 72-hour retention time, 2.0 g/L NaCN.
Source: New Pacific Metals Corp,
2024.
| Silver Sand Project Pre-Feasibility Study |
| | New Pacific Metals Corp. | 0723071 |
The low-grade sample (Met Sample
3B:4B) resulted in lower silver recovery at 78.3%. Considering cyanide consumption was only 0.39 kg/t NaCN, it would be beneficial to
apply a higher cyanide concentration for this low-grade sample, because silver recovery at higher cyanide concentration may increase.
| 13.3.7.5 | Transitional samples |
Five samples were composited with
the intervals from the transitional domain. The first sample, labelled as Met Sample 5, consisted of the suitable intervals selected from
the entire deposit. The second sample, labelled as Met Sample 6, was made up of the low-grade intervals. The third sample, labelled as
Met Sample 7, contained the intervals from the upper half of the deposit at depths up to 100 metres. The fourth sample, labelled as Met
Sample 8, consisted of the intervals from the lower half of the deposit at depths greater than 100 metres. The fifth sample, labelled
as Met Sample 14, was a high-grade composite sample which resulted in less than 80% silver recovery in cyanide leaching during previous
testing in 2020.
Table 13.20 shows the cyanide leaching
conditions and results. When cyanide leaching was carried out in a mechanically agitated tank, average silver recovery for Met Samples
5, 7, and 8 was 92.8% along with average cyanide consumption of 2.62 kg/t NaCN. Despite less than 80% silver recovery from previous cyanide
leaching tests, silver recovery of Met Sample 14 was 94.1%. Even for the low-grade sample (Met Sample 6), silver recovery was 94.1~94.6%.
Therefore, all samples from the transitional domain worked well with respect to silver recovery during cyanide leaching.
| Silver Sand Project Pre-Feasibility Study |
| | New Pacific Metals Corp. | 0723071 |
| Table 13.20 | Cyanide leaching results for the transitional samples |
| Reactor |
Sample
ID |
Sample
description |
Test
ID |
Type of
leach |
Pulp
density |
Back calcd.
head grade |
Silver
recovery |
Cyanide
consumption |
Lime
consumption |
| % solid |
g/t |
% |
kg/t NaCN |
kg/t CaO |
Mechanically
agitated tank |
Met Sample 5 |
Entire deposit |
44CN |
CIP |
40 |
146 |
92.5 |
2.17 |
1.8 |
| Met Sample 7 |
Upper half deposit (<100 m) |
46CN |
142 |
92.2 |
3.41 |
1.4 |
| Met Sample 8 |
Lower half deposit (>100 m) |
50CN |
168 |
93.8 |
2.29 |
1.8 |
| Average |
152 |
92.8 |
2.62 |
1.6 |
Mechanically
agitated tank |
Met Sample 14 |
2020 high-grade |
52CN |
CIP |
40 |
393 |
94.1 |
3.48 |
1.4 |
| Lifterbottle |
Met
Sample 6 |
Low-grade |
67CN |
DCN |
45 |
42 |
94.6 |
0.62 |
1.7 |
Mechanically
agitated tank |
45CN |
CIP |
40 |
40 |
94.1 |
2.43 |
1.6 |
Note: 1.0 kg solid, grind size P80 ~75
µm, continuous oxygen sparging at 19 mL/min, pH ~11.0, 72-hour retention time, 2.0 g/L NaCN.
Source: New Pacific Metals Corp, 2024.
| Silver Sand Project Pre-Feasibility Study |
| | New Pacific Metals Corp. | 0723071 |
Five composite samples were created
using the intervals from the sulphide domain. The first sample, labelled as Met Sample 11, consisted of the intervals selected across
the entire deposit. The second sample, labelled as Met Sample 12, contained the low-grade intervals from the deposit at depths greater
than 150 metres. The third sample, labelled as Met Sample 13, contained the high-grade intervals from the deposit at depths greater than
150 metres. The fourth sample, labelled as Met Sample 11B, consisted of the low-grade intervals. The fifth sample, labelled as Met Sample
15, was the high-grade composite sample from 2020 which resulted in less than 80% silver recovery in cyanide leaching tests from the previous
metallurgical program.
| Silver Sand Project Pre-Feasibility Study |
| | New Pacific Metals Corp. | 0723071 |
| Table 13.21 | Cyanide leaching results for the sulphide samples |
Sample
ID |
Sample
description |
Reactor |
Test
ID |
Type of
leach |
Grind size
(80%) |
Pulp
density |
Cyanide
concentration |
Lead
nitrate |
Back calcd.
head grade |
Silver
recovery |
Cyanide
consumption |
Lime
consumption |
| µm |
% solid |
g/L NaCN |
kg/t |
g/t |
% |
kg/t NaCN |
kg/t CaO |
| Met Sample 11 |
Entire deposit |
Mechanically agitated tank |
55CN |
CIP |
30 |
40 |
6.00 |
0.60 |
146 |
80.8 |
5.22 |
1.3 |
| Met Sample 13 |
High-grade (>150 m) |
56CN |
CIP |
30 |
40 |
6.00 |
0.60 |
717 |
77.1 |
9.10 |
1.4 |
|
Met Sample 15 |
2020 high-grade |
Lifterbottle |
49CN |
CIP |
50 |
40 |
6.00 |
0.60 |
384 |
77.6 |
4.82 |
1.8 |
| Mechanically agitated tank |
37CN |
CIP |
50 |
425 |
88.8 |
10.26 |
1.6 |
| 54CN |
30 |
417 |
87.6 |
7.37 |
1.6 |
| Average |
82.4 |
7.35 |
1.5 |
| Met Sample 12 |
Low-grade (>150 m) |
Lifterbottle |
68CN |
DCN |
75 |
45 |
2.00 |
/ |
42 |
86.4 |
0.78 |
1.8 |
| Met Sample 11B |
Low-grade |
Lifterbottle |
69CN |
DCN |
75 |
45 |
2.00 |
/ |
31 |
84.4 |
1.07 |
1.8 |
| 70CN |
33 |
86.0 |
0.83 |
1.0 |
Note: 1.0 kg solid, continuous oxygen
sparging at 19 mL/min, ~pH 11.0, 72-hour retention time.
Source: New Pacific Metals Corp, 2024.
| Silver Sand Project Pre-Feasibility Study |
| | New Pacific Metals Corp. | 0723071 |
Table 13.21 shows the cyanide leaching
conditions and results. For Met Sample 11, 13, and 15, average silver recovery was 82.4% and average cyanide consumption was 7.37 kg/t
NaCN. Fine grinding up to 30 µm did not increase silver recovery (Test 54CN vs Test 37CN).
For the previous high-grade sample from 2020
(Met Sample 15), mixing intensity seemed important to silver recovery because silver recovery in a lifterbottle (Test 49CN) was about
10% lower compared with the mechanically agitated tank. It is worth noting that two low-grade samples (Met Sample 12 and 11B) achieved
84.4~86.0% silver recovery in a lifterbottle and cyanide consumption was 0.83~1.07 kg/t NaCN at grind size of 80% passing 75 µm
and cyanide concentration of 2.0 g/L NaCN.
| 13.3.8 | Gravity concentration testing |
The cyanide leaching results indicated
that some silver minerals were refractory and might need ultra fine grinding to increase silver recovery during cyanide leach. Several
preliminary gravity concentration tests were completed to recover silver-bearing heavy minerals. The recovered gravity concentrate was
then reground and then leached in cyanide solution either on its own or together with the gravity tail.
| 13.3.8.1 | Gravity concentration testing for Met Sample 1 NEW |
Only one gravity concentration
test was completed for Met Sample 1 NEW, which consisted of 10% oxide, 65% transitional and 25% sulphide. Primary grind size was 80% passing
75 µm. The ground slurry was passed through a lab-scale Knelson centrifugal concentrator at a concentrate mass pull of 12.3%. The
gravity concentrate was reground to 80% passing 16 µm. The reground gravity concentrate was then combined with the gravity tail,
followed by cyanide leaching in a lifterbottle under the conditions of 45% solids pulp density, 2.0~3.0 g/L NaCN cyanide concentration,
continuous oxygen sparging at 19 mL/min, pH ~11.0 and 72-hour retention time. Overall silver recovery was 93.9% and cyanide consumption
was 1.58 kg/t NaCN. Compared with the results achieved without gravity concentration (89.6% silver recovery and 1.10 kg/t NaCN cyanide
consumption), silver recovery increased by 3.9%, but cyanide consumption was also increased by 0.48 kg/t NaCN. Further investigation is
warranted to increase silver recovery while reducing cyanide consumption.
| 13.3.8.2 | Gravity concentration testing for Met Sample 15 |
Met Sample 15, the previous high-grade
sulphide sample from 2020 which resulted in less than 80% silver recovery, was subjected to three gravity concentration tests. The results
are summarized in Table 13.22. Silver recovery varied from 19.8% to 42.6% and silver content in the gravity concentrate ranged from 1,218
g/t to 2,480 g/t.
| Table 13.22 |
Gravity
concentration results for Met Sample 15 |
| Gravity concentration test no. |
Stream |
Mass (%) |
Silver content (g/t) |
Recovery (%) |
|
27 |
Gravity concentrate |
4.4 |
1,726 |
21.0 |
| Gravity tail |
95.6 |
296 |
79.0 |
| Feed |
100.0 |
358 |
100.0 |
|
42 |
Gravity concentrate |
3.4 |
2,480 |
19.8 |
| Gravity Tail |
96.6 |
353 |
80.2 |
| Feed |
100.0 |
426 |
100.0 |
|
61 |
Gravity concentrate |
16.1 |
1,218 |
42.6 |
| Gravity tail |
83.9 |
315 |
57.4 |
| Feed |
100.0 |
460 |
100.0 |
Source: New Pacific Metals
Corp, 2024.
| Silver Sand Project Pre-Feasibility Study |
| | New Pacific Metals Corp. | 0723071 |
One gravity
concentrate was subjected to cyanide leaching in a solution containing 10.0 g/L sodium cyanide without regrinding and silver
recovery was only 52.2% (Table 13.24) The second gravity concentrate was reground to 80% passing 8 µm and then subjected to
cyanide leaching in a solution containing 20.0 g/L sodium cyanide, and silver recovery was 99.5%. The third gravity concentrate was
reground to 80% passing 16 µm, and then subjected to cyanide leaching in a solution containing 6.0 g/L sodium cyanide, and
silver recovery was 99.0%. These results indicated clearly that fine grinding was necessary to enhance silver recovery when the
gravity concentrate was subjected to cyanide leaching. It may be possible that the finely reground gravity concentrate may leach
well even when cyanide concentration is reduced to 3.0 g/L NaCN. These results are presented in Table 13.23 and Table 13.24.
| Silver Sand Project Pre-Feasibility Study |
| | New Pacific Metals Corp. | 0723071 |
| Table 13.23 | Cyanide leaching conditions for gravity concentrate
and gravity tail for Met Sample 15 |
| Gravity concentration test no. |
Stream |
Cyanide leach test no. |
Type of leach |
Reactor |
Particle size (P80) |
pH |
Cyanide concentration |
Lead nitrate |
Pulp density |
| µm |
g/L NaCN |
kg/t |
% |
|
27 |
Gravity conc |
33CN |
24-h DCN |
Smooth bottle |
74 |
12.0 |
10.0 |
0.30 |
18 |
| Gravity tail |
32CN |
72-h DCN |
Mechanically agitated tank |
74 |
11.2 |
3.0 |
0.30 |
40 |
|
42 |
Gravity conc |
47CN |
24-h DCN |
Mechanically agitated tank |
8 |
12.0 |
20.0 |
0.50 |
10 |
| Gravity tail |
43CN |
54-h DCN + 18-h CIP |
Lifterbottle |
69 |
11.1 |
3.0 |
0.30 |
40 |
| 61 |
Gravity conc |
62CN |
72-h DCN |
Mechanically agitated tank |
15 |
11.3 |
6.0 |
0.60 |
10 |
| Gravity tail |
63CN |
54-h DCN + 18-h CIP |
72 |
11.1 |
3.0 |
0.30 |
40 |
Note: Continuous oxygen sparging at 19
mL/min.
Source: New Pacific Metals Corp, 2024.
| Silver Sand Project Pre-Feasibility Study |
| | New Pacific Metals Corp. | 0723071 |
| Table 13.24 | Cyanide leaching results for gravity concentrate and
gravity tail for Met Sample 15 |
| Gravity concentration |
Cyanide leaching |
Test
No. |
Stream |
Mass |
Silver
content |
Recovery |
Test
No. |
Silver
recovery |
Cyanide
consumption |
Lime consumption |
Caustic soda
consumption |
| % |
g/t |
% |
% |
kg/t NaCN |
kg/t CaO |
kg/t NaOH |
|
27 |
Gravity conc |
4.4 |
1,726 |
21.0 |
33CN |
52.2 |
15.6 |
/ |
3.6 |
| Gravity tail |
95.6 |
296 |
79.0 |
32CN |
79.8 |
6.2 |
1.1 |
/ |
| Feed |
|
358 |
|
Average |
74.0 |
6.6 |
1.0 |
0.2 |
|
42 |
Gravity conc |
3.4 |
2,480 |
19.8 |
47CN |
99.5 |
61.5 |
/ |
54.4 |
| Gravity tail |
96.6 |
353 |
80.2 |
43CN |
79.4 |
3.8 |
1.5 |
/ |
| Feed |
|
426 |
|
Average |
83.4 |
5.8 |
1.4 |
1.9 |
|
61 |
Gravity conc |
16.1 |
1,218 |
42.6 |
62CN |
99.0 |
49.1 |
3.7 |
/ |
| Gravity tail |
83.9 |
315 |
57.4 |
63CN |
92.5 |
4.7 |
1.0 |
/ |
| Feed |
|
460 |
|
Average |
95.3 |
11.8 |
1.4 |
/ |
Source: New Pacific Metals Corp, 2024.
| Silver Sand Project Pre-Feasibility Study |
| | New Pacific Metals Corp. | 0723071 |
In comparing silver recoveries from
cyanide leaching of the gravity tails, i.e., 79.8% for Test 32CN, 79.4% for Test 43CN, and 92.5% for Test 63CN, it is clear that adequate
amounts of silver-bearing heavy minerals must be removed so that gravity tail at particle size of 80% passing 75 µm can achieve
over 90% silver recovery from cyanide leaching.
Gravity concentration Test 61,
cyanide leaching Test 62CN at 6.0 g/L NaCN cyanide concentration for the gravity concentrate, and cyanide leaching Test 63CN at 3.0 g/L
NaCN cyanide concentration for the gravity tail have established a guideline to improve silver recovery for the materials from the sulphide
domain. From 73.7% silver recovery obtained from cyanide leaching in 2020 to 95.3% silver recovery after gravity concentration and cyanide
leaching were carried out together, this represents a significant performance improvement. Further optimization is warranted to reduce
cyanide consumption while silver recovery is improved.
| 13.3.9 | Reduction of dissolved silver using zinc dust (Merrill Crowe) |
Four preliminary tests were conducted
by ALS Metallurgy in Perth, Australia to reduce the dissolved silver using zinc dust, i.e., the Merrill Crowe process. The Merrill Crowe
zinc cementation process consisted of four steps:
| · | Clarify the pregnant leach solution to remove any fine suspended solids. |
| · | Deaerate the clarified pregnant leach solution to reduce the dissolved oxygen
to less than 1.0 ppm. |
| · | Add the required amounts of lead nitrate and zinc dust. |
| · | Collect the silver precipitate by filtration. |
| Table 13.25 | Operating conditions and results of Merrill Crowe zinc
cementation tests |
| |
Test 1 |
Test 2 |
Test 3 |
Test 4 |
| JR7670 |
JR7712 |
JR7726 |
JR7765 |
|
Feed solution |
Volume |
mL |
150 |
197 |
150 |
150 |
| Silver |
ppm |
71.7 |
71.7 |
71.7 |
71.7 |
| Copper |
ppm |
110 |
110 |
110 |
110 |
| Sodium Cyanide |
g/L |
~1.03 |
~1.03 |
~1.03 |
1.03 |
| pH |
|
11.0 |
11.0 |
11.0 |
10.6 |
| Zinc dust |
Weight |
g |
0.0822 |
0.1191 |
0.0480 |
0.0480 |
| Mass ratio Zn / (Ag+Cu) |
3.02 |
4.32 |
1.76 |
1.76 |
| De-aeration time |
min |
240 |
240 |
240 |
240 |
| Dissolved oxygen after de-aeration |
ppm |
<1.0 |
<1.0 |
<1.0 |
<1.0 |
| Temperature |
|
°C |
60 |
18 |
20 |
20 |
| Lead nitrate |
Weight |
g |
0.0131 |
0.0247 |
0.0767 |
0.0077 |
| Pb(NO3)2 / Zn mass ratio |
0.16 |
0.21 |
1.60 |
0.16 |
| Retention time for Merrill Crowe |
min |
20 |
50 |
15 |
15 |
|
Tail solution |
Silver |
ppm |
1.72 |
0.06 |
0.16 |
1.14 |
| Copper |
ppm |
23 |
111 |
109 |
112 |
| pH |
|
11.2 |
10.9 |
10.4 |
10.0 |
| Sodium cyanide |
g/L |
0.980 |
1.180 |
0.950 |
0.980 |
| Recovery |
Silver |
% |
97.6 |
99.9 |
99.8 |
98.4 |
| Copper |
% |
79.0 |
0.0 |
0.9 |
0.0 |
| Cyanide consumption |
kg/m3 NaCN |
N/A |
N/A |
N/A |
0.050 |
Source: New Pacific Metals
Corp, 2024.
| Silver Sand Project Pre-Feasibility Study |
| | New Pacific Metals Corp. | 0723071 |
The pregnant leach solution was
generated by cyanide leaching Met Sample 1 (133 g/t silver and 303 g/t copper) in a mechanically agitated tank under the conditions of
grind size 80% passing 75 µm, 40% solids, pH ~11.0 (adjusted with lime), 19 mL/min oxygen sparging, 2.0 g/L NaCN cyanide concentration
and 48-hour retention time.
Silver recovery was
91.2% and copper dissolution was 57.8%. Reagent consumptions were 0.83 kg/t NaCN for sodium cyanide and 1.85 kg/t CaO for lime. The
pregnant leach solution contained 71.7 ppm silver, 110 ppm copper, 15 ppm zinc, 16 ppm iron, 30 ppm potassium, and 1,266 ppm
sodium.
| Figure 13.6 | Silver precipitation as a function of the ratio of zinc
dust to the combined amount of dissolved silver and copper for Test 2 (JR7712) |
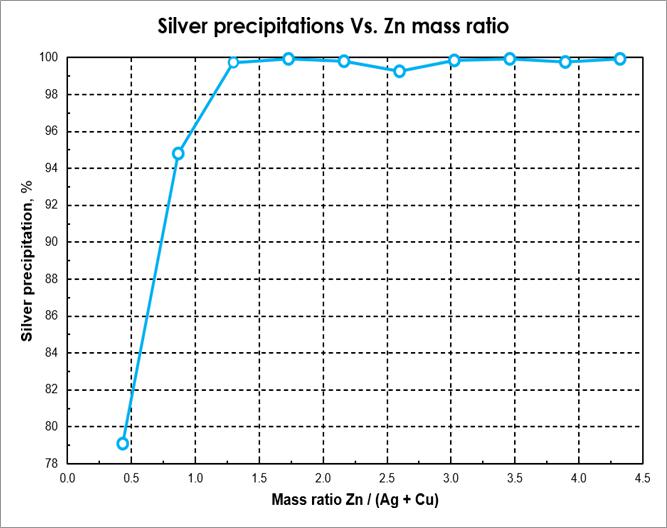
Source: New Pacific Metals
Corp, 2024.
| Silver Sand Project Pre-Feasibility Study |
| | New Pacific Metals Corp. | 0723071 |
| Figure 13.7 |
Silver precipitation
kinetics of Test 3 (JR7726) with single dosage of zinc dust |
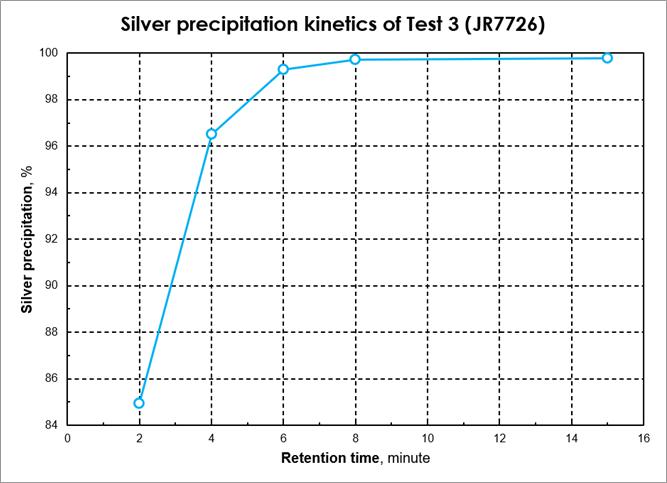
Source: New Pacific Metals
Corp, 2024.
The Merrill Crowe zinc cementation
operating conditions and results are presented in Table 13.25. Selective precipitation of silver was
successful through the staged addition of zinc dust at ambient temperature. This indicates that preferential reduction of silver by zinc
dust occurred at a lower dosage and at ambient temperature. The optimum mass ratio of zinc dust to the combined amount of silver plus
copper was 1.76:1 (Figure 13.6). The requisite time to achieve maximum silver precipitation efficiency was around 6 minutes (Figure 13.7).
Silver reduction efficiency was between 98.4% and 99.9%. At elevated temperature, copper co-precipitation occurred in Test 1 (JR7670).
Cyanide consumption was
a focus of Test 4 (JR7765), because it was found that the starting cyanide concentration of 1.03 g/L NaCN was significantly lower than
the assumed 1.93 g/L NaCN at the end of cyanide leaching. Cyanide consumption for Test 4 (JR7765) was 0.050 kg/m3
NaCN.
| 13.3.10 | Silver loading on the activated carbon |
The pregnant leach solution from
cyanide leaching test 34CN contained 82.2 ppm silver, 108 ppm copper, and 1.56 g/L sodium cyanide at pH 10.8. This pregnant leach solution
was used to determine silver loading on the activated carbon. Six carbon concentrations were chosen.
| Silver Sand Project Pre-Feasibility Study |
| | New Pacific Metals Corp. | 0723071 |
For each carbon
concentration, fresh activated carbon was contacted with the pregnant leach solution for 48 hours, and then the solution was assayed
for silver and copper concentrations to determine the quantities of silver and copper that have been adsorbed onto the activated
carbon. The carbon loading values were calculated from the solution silver and copper assays. Silver loading on carbon is shown in
Figure 13.8 and copper loading on carbon is shown in Figure 13.9. Silver loading on carbon was
relatively high and reached 15,627 g/t when the solution contained 14.5 ppm silver. When silver concentration in solution decreased
to 1.03 ppm, silver loading on carbon was 2,811 g/t. Copper loading on carbon was relatively weak. The loaded copper on carbon is
expected to be displaced by silver when high-level dissolved silver is present in solution.
| Figure 13.8 |
Silver loading
on the activated carbon |
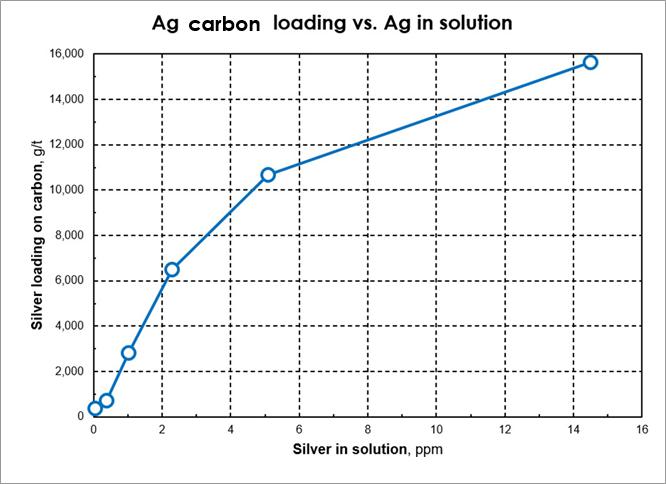
Source: New Pacific Metals
Corp, 2024.
| Silver Sand Project Pre-Feasibility Study |
| | New Pacific Metals Corp. | 0723071 |
| Figure 13.9 |
Copper loading
on activated carbon |

Source: New Pacific Metals
Corp, 2024.
| 13.3.11 | Cyanide destruction |
Preliminary cyanide destruction
was tested in a continuous mode by Kemetco Research in Richmond, British Columbia, Canada. Four samples were tested individually, namely,
Met Sample 1 (10% oxide + 80% transitional + 10% sulphide), Met Sample 2 (100% oxide), Met Sample 5 (100% transitional) and Met Sample
11 (100% sulphide). The feed slurries were prepared by ALS Metallurgy in Kamloops with grind size 80% passing around 75 µm. Upon
receipt, cyanide leaching was carried out by Kemetco Research under the conditions of 40% solids, pH ~11.0 (adjusted with lime), 2.0 g/L
NaCN cyanide concentration, continuous air sparging, and 54-hour DCN plus 18-hour CIP in a mechanically agitated tank. Results are presented
in Table 13.26.
| Silver Sand Project Pre-Feasibility Study |
| | New Pacific Metals Corp. | 0723071 |
| Table 13.26 | Results of cyanide leaching tests by Kemetco Research |
| |
Met
Sample 1 |
Met
Sample 2 |
Met
Sample 5 |
Met
Sample 11 |
|
10% oxide +
80% transitional +
10% sulphide |
100%
oxide |
100%
transitional |
100%
sulphide |
|
Head grade |
Assayed |
Silver |
g/t |
127 |
123 |
130 |
125 |
| Copper |
g/t |
303 |
198 |
262 |
716 |
| Back calculated |
Silver |
g/t |
133 |
133 |
124 |
135 |
| Copper |
g/t |
304 |
213 |
246 |
679 |
| Assayed tail grade |
Silver |
g/t |
13.6 |
11.6 |
9.8 |
22.1 |
| Copper |
g/t |
134 |
133 |
103 |
288 |
| Recovery |
Silver |
|
% |
89.8 |
95.8 |
92.1 |
83.3 |
| Copper |
|
% |
56 |
38 |
58 |
58 |
| Reagent consumption |
Sodium cyanide, NaCN |
kg/t |
5.3 |
4.7 |
4.7 |
5.3 |
| Lime, CaO |
|
kg/t |
0.51 |
0.38 |
0.26 |
0.63 |
Note: 20 kg solid,
40% solids, 2.0 g/L NaCN, pH ~11.0, 54-hour DCN plus 18-hour CIP, air sparging.
Source: New Pacific Metals Corp, 2024.
The cyanide destruction experimental
set-up comprised one reaction vessel with a working volume of 1.59 litres and equipped with a Rushton impeller, baffles, a dissolved oxygen
probe, a pH probe and a sparger tube to introduce oxygen gas. In addition, chemical reagent tanks were required for sodium metabisulfite
(Na2S2O5), copper sulfate
(CuSO4·5H2O), and hydrated lime (Ca(OH)2).
The chemical reagent solutions were added using peristaltic pumps. The oxygen flow was controlled with a pressure regulator, a needle
valve and a rotameter.
The agitator speed was
600 rpm to ensure adequate mixing. Oxygen gas was added at a flowrate of 250 mL/min to maintain the dissolved oxygen in a desired
range. For Met Sample 1, the retention time was initially 2.0 hours, and later on, was reduced to 1.5 hours. The retention time was
1.5 hours for Met Sample 2, Met Sample 5, and Met Sample 11. For all cyanide destruction tests, 3~4 displacements of the reactor
volume were realized before representative samples were collected for chemical analysis.
| Silver Sand Project Pre-Feasibility Study |
| | New Pacific Metals Corp. | 0723071 |
| Table 13.27 | Cyanide destruction operating conditions and results
for Met Sample 1 |
| Test |
1 |
2 |
3 |
4 |
5 |
| Retention time |
h |
2.0 |
2.0 |
2.0 |
1.5 |
1.5 |
| Stream |
Before
detox |
After
detox |
Before
detox |
After
detox |
Before
detox |
After
detox |
Before
detox |
After
detox |
Before
detox |
After
detox |
| pH |
11.2 |
9.0 |
11.2 |
9.0 |
11.2 |
9.0 |
11.2 |
9.0 |
11.2 |
9.0 |
| WAD cyanide |
CNWAD |
ppm |
1,342 |
1.3 |
1,342 |
<1.0 |
1,342 |
<1.0 |
1,342 |
1.0 |
1,342 |
1.3 |
| Total cyanide |
CNT |
ppm |
|
|
|
|
|
|
|
1.4 |
|
1.8 |
| Thiocyanate |
SCN |
ppm |
|
|
|
|
|
|
118 |
89 |
|
|
| Silver |
Ag |
ppm |
2.8 |
<0.1 |
2.8 |
<0.1 |
2.8 |
<0.1 |
2.8 |
<0.1 |
2.8 |
<0.1 |
| Copper |
Cu |
ppm |
106 |
0.5 |
106 |
0.4 |
106 |
0.3 |
106 |
0.3 |
106 |
0.7 |
| Iron |
Fe |
ppm |
34 |
0.1 |
34 |
0.2 |
34 |
0.5 |
34 |
0.7 |
34 |
0.7 |
| Zinc |
Zn |
ppm |
13 |
0.2 |
13 |
0.5 |
13 |
0.2 |
13 |
0.2 |
13 |
0.2 |
|
Chemical addition |
Lime |
g/g Na2S2O5 |
0.38 |
0.38 |
0.40 |
0.32 |
0.34 |
| Sulphur dioxide |
g/g CNWAD |
5.9 |
4.0 |
4.3 |
4.0 |
3.1 |
| Copper (Cu2+) |
ppm |
20 |
20 |
/ |
/ |
/ |
Note: 1.59 litres of working volume, 250
mL/min oxygen flowrate, pH 9.0.
Source: New Pacific Metals Corp, 2024.
| Silver Sand Project Pre-Feasibility Study |
| | New Pacific Metals Corp. | 0723071 |
| Table 13.28 | Cyanide destruction operating conditions and results
for Met Samples 2, 5, and 11 |
| Test |
Met Sample 2 |
Met Sample 5 |
Met Sample 11 |
| Sample description |
100% oxide |
100% transitional |
100% sulphide |
| Stream |
Before
detox |
After
detox |
Before
detox |
After
detox |
Before
detox |
After
detox |
| WAD cyanide |
CNWAD |
ppm |
931 |
1.95 |
1,015 |
1.15 |
1,142 |
<1.0 |
| Total cyanide |
CNT |
ppm |
|
6.9 |
|
8.0 |
|
4.6 |
| Thiocyanate |
SCN |
ppm |
53 |
46 |
96 |
80 |
411 |
276 |
| Silver |
Ag |
ppm |
1.4 |
<0.1 |
1.4 |
<0.1 |
2.4 |
<0.1 |
| Copper |
Cu |
ppm |
50 |
0.2 |
100 |
0.1 |
289 |
0.8 |
| Iron |
Fe |
ppm |
15 |
3.9 |
38 |
2.1 |
48 |
1.6 |
| Zinc |
Zn |
ppm |
5 |
<0.1 |
8 |
<0.1 |
90 |
0.4 |
|
Chemical addition |
Lime |
g/g Na2S2O5 |
0.36 |
0.31 |
0.40 |
Sulphur
Dioxide |
g/g CNWAD |
3.73 |
4.00 |
4.00 |
Note: 1.59 litre working volume, 250 mL/min
oxygen flowrate, pH 9.0, no copper sulfate addition,
Source: New Pacific Metals Corp, 2024.
Five cyanide
destruction tests were completed for Met Sample 1. The operating conditions and results are presented in Table 13.27. With the 20
ppm copper addition, the WAD cyanide concentration was reduced to 1.3 ppm when the SO2/CNWAD ratio
was 5.9:1 and to less than 1.0 ppm when the SO2/CNWAD ratio
was 4.0:1. Without the addition of copper sulfate, cyanide destruction remained successful with the residual WAD cyanide being less
than 1.0 ppm at the SO2/CNWAD ratio of 4.3:1, 1.0 ppm
WAD cyanide at the SO2/CNWAD ratio of 4.0:1, and 1.3 ppm
WAD cyanide at the SO2/CNWAD ratio of 3.1:1.
For Met Samples 2, Met Sample 5,
and Met Sample 11, the cyanide destruction operating conditions and results are presented in Table 13.28. After cyanide destruction was
completed under the conditions of SO2/CNWAD ratio of 3.7:1~4.0:1
and 1.5-hour retention time, the residual WAD cyanide concentration was reduced to 1.95 ppm for Met Sample 2, 1.15 ppm for Met Sample
5, and less than 1.0 ppm for Met Sample 11.
| 13.3.12 | Solid-liquid separation and slurry rheology |
Solid-liquid separation and slurry
rheology were conducted by Pocock Industrial in Salt Lake City, Utah, USA. Four detoxed cyanide tailing samples were used, namely, Met
Sample 1 (10% oxide + 80% transitional + 10% sulphide), Met Sample 2 (100% oxide), Met Sample 5 (100% transitional), and Met Sample 11
(100% sulphide). Each tailing sample received a comprehensive testing suite that included sample characterization, flocculant screening,
static thickening, dynamic thickening, thickener underflow viscosity, and thickener underflow pressure filtration.
Testing began with flocculant screening
procedures intended to select a product which is able to provide the best overall performance with respect to overflow clarity, solid
settling rate, and underflow viscosity characteristics. After a correct flocculant was selected, both static and dynamic thickening tests
were performed. These tests developed a general set of data for thickener design and evaluation that included optimum flocculant dose
requirements as well as the underflow and overflow characteristics that impact downstream operations. Rheology tests were then performed
on the underflow samples which were generated during thickening tests. These procedures helped predict underflow density and provide the
required profiles for pump, pipeline, and agitated tank design. Finally, pressure filtration tests performed on thickener
| Silver Sand Project Pre-Feasibility Study |
| | New Pacific Metals Corp. | 0723071 |
underflow developed a general set
of data to aid in the design and operation of various types of pressure filters.
| Table 13.29 | Thickener design criteria and operating parameters |
|
Sample ID |
Description |
Solid
SG |
Feed pulp
density |
Flocculant
dosage |
Volumetric
loading |
Solid
loading |
Solid in
overflow |
Solid in
underflow |
| t/m3 |
% solid |
g/t |
(m3/h)/m2 |
(t/h)/m2 |
ppm |
% |
|
Met Sample 1 |
10% oxide +
80% oxide +
10% sulphide |
2.76 |
25.5 |
45~50 |
2.52 |
0.77 |
<250 |
67 |
| Met Sample 2 |
100% oxide |
2.77 |
25.2 |
50~55 |
2.55 |
0.77 |
<250 |
66 |
| Met Sample 5 |
100%
transitional |
2.68 |
25.3 |
60~65 |
2.52 |
0.76 |
<250 |
67 |
| Met Sample 11 |
100%
sulphide |
2.78 |
25.0 |
45~50 |
2.45 |
0.73 |
<250 |
65 |
Note: Temperature 20°C, pH 9.1~9.2,
flocculant SNF 905SH.
Source: New Pacific Metals Corp, 2024.
Based on the dynamic thickening
testing data, the thickener design criteria and operating parameters were developed and are shown in Table 13.29. These design conditions
represent a moderately aggressive design philosophy and correspond to the feed pulp density, overflow solid concentration, and flocculant
dosage.
The design hydraulic loading
rate ranged from 2.45 to 2.55 (m3/h)/m2
and the corresponding solid loading rate was between 0.73 and 0.77 (t/h)/m2. The thickener
underflow pulp density was expected to be 65~67% solid.
Rheology tests were carried out
to determine apparent viscosity as a function of shear rates at given pulp density and temperature. Based on the observed relationship
between shear stress and shear rate, the yield stress value was determined for the slurry in each case. Table 13.30 shows the measured
apparent viscosity and yield stress values. The data show that these four thickened underflow samples displayed similar rheological behaviours.
Met Sample 11 tended to display slightly higher viscosity and yield stress compared to other three samples at equivalent solid concentration.
For all samples, the decreasing apparent viscosity with increasing shear rate or “shear thinning” behaviour, is characteristic
of the pseudoplastic class of non-Newtonian fluids. It demonstrates the need to achieve and maintain a specific velocity gradient or shear
rate in order to initiate and maintain the flow.
| Silver Sand Project Pre-Feasibility Study |
| | New Pacific Metals Corp. | 0723071 |
| Table 13.30 |
Apparent viscosity and yield
stress |
| Sample ID |
Description |
Pulp density |
Coefficient of rigidity |
Yield stress |
Apparent
viscosity @ the following shear rates |
| 25 |
50 |
75 |
100 |
200 |
400 |
600 |
800 |
1,000 |
| Secˉ¹ |
Secˉ¹ |
Secˉ¹ |
Secˉ¹ |
Secˉ¹ |
Secˉ¹ |
Secˉ¹ |
Secˉ¹ |
Secˉ¹ |
| %
solid |
Pa |
Pa |
Pa·Sec |
| Met
Sample 1 |
10%
oxide + 80% oxide + 10% sulphide |
68.1 |
0.116 |
41 |
5.47 |
1.92 |
1.22 |
0.78 |
0.50 |
0.32 |
0.24 |
0.20 |
0.17 |
| 66.6 |
0.084 |
27 |
3.83 |
1.33 |
0.84 |
0.53 |
0.34 |
0.21 |
0.16 |
0.14 |
0.12 |
| 65.0 |
0.051 |
18 |
2.67 |
0.87 |
0.54 |
0.33 |
0.21 |
0.13 |
0.10 |
0.08 |
0.07 |
| 62.6 |
0.032 |
11 |
1.65 |
0.55 |
0.34 |
0.21 |
0.13 |
0.08 |
0.06 |
0.05 |
0.04 |
| 59.4 |
0.024 |
5 |
0.98 |
0.31 |
0.19 |
0.12 |
0.07 |
0.04 |
0.03 |
0.03 |
0.02 |
| Met
Sample 2 |
100%
oxide |
69.9 |
0.132 |
88 |
7.96 |
3.07 |
2.03 |
1.35 |
0.89 |
0.59 |
0.47 |
0.39 |
0.34 |
| 68.2 |
0.088 |
57 |
5.59 |
2.04 |
1.32 |
0.86 |
0.56 |
0.36 |
0.28 |
0.23 |
0.20 |
| 66.7 |
0.062 |
31 |
3.57 |
1.26 |
0.80 |
0.51 |
0.33 |
0.21 |
0.16 |
0.13 |
0.12 |
| 64.6 |
0.038 |
18 |
2.45 |
0.78 |
0.47 |
0.29 |
0.18 |
0.11 |
0.08 |
0.07 |
0.06 |
| 62.0 |
0.020 |
10 |
1.40 |
0.43 |
0.26 |
0.15 |
0.09 |
0.05 |
0.04 |
0.03 |
0.03 |
| Met
Sample 5 |
100%
transitional |
69.6 |
0.134 |
73 |
7.53 |
2.77 |
1.80 |
1.17 |
0.76 |
0.50 |
0.39 |
0.32 |
0.28 |
| 68.1 |
0.094 |
44 |
5.17 |
1.84 |
1.18 |
0.76 |
0.49 |
0.31 |
0.24 |
0.20 |
0.17 |
| 66.2 |
0.057 |
24 |
3.35 |
1.10 |
0.68 |
0.42 |
0.26 |
0.16 |
0.12 |
0.10 |
0.09 |
| 63.4 |
0.034 |
13 |
2.01 |
0.61 |
0.37 |
0.22 |
0.13 |
0.08 |
0.06 |
0.05 |
0.04 |
| 59.9 |
0.022 |
5 |
1.01 |
0.31 |
0.19 |
0.11 |
0.07 |
0.04 |
0.03 |
0.02 |
0.02 |
| Met
Sample 11 |
100%
sulphide |
67.9 |
0.115 |
61 |
6.23 |
2.36 |
1.55 |
1.02 |
0.67 |
0.44 |
0.35 |
0.29 |
0.25 |
| 66.9 |
0.092 |
45 |
4.61 |
1.81 |
1.21 |
0.81 |
0.54 |
0.36 |
0.29 |
0.24 |
0.21 |
| 65.4 |
0.056 |
33 |
3.48 |
1.25 |
0.81 |
0.52 |
0.34 |
0.22 |
0.17 |
0.14 |
0.12 |
| 62.7 |
0.036 |
22 |
2.69 |
0.88 |
0.54 |
0.33 |
0.21 |
0.13 |
0.10 |
0.08 |
0.07 |
| 60.6 |
0.028 |
17 |
2.19 |
0.66 |
0.40 |
0.24 |
0.14 |
0.08 |
0.06 |
0.05 |
0.04 |
Source: New Pacific Metals Corp, 2024.
| Silver Sand Project Pre-Feasibility Study |
| | New Pacific Metals Corp. | 0723071 |
Underflow slurry exhibiting a yield
stress value greater than 30 Pascal (measured on fully sheared slurry) is normally beyond the capability of standard thickening and pumping
systems. Specialized equipment and design engineering are generally required when operating at underflow pulp density which exhibits yield
stress value greater than 30 Pascal. In addition to the 30 Pascal limitation, the shape of the curve for the yield stress versus pulp
density should also be considered when selecting a proper range for thickener and/or pump / transport pipeline design.
Design underflow pulp density should
be selected based on the shape of the curve to avoid the exponential region, as the slurry could quickly become solidified beyond pumping
capability with only a slight increase of pulp density.
Pressure filtration tests were carried
out to generate a general set of filtration data to design and size the pressure filters. The tests examined the effect of cake thickness
and dry time on the production rate and filter cake moisture. For each sample, two operational scenarios were tested, namely standard
pressure form and air blow without squeeze, and standard pressure form with membrane squeeze during air blow followed by a high-pressure
membrane squeeze. The standard pressure procedure (form and air blow) was performed at 5.5 bar (80 psi) and the high-pressure form procedure
was completed at 16 bar (232 psi). For the scenario that utilized the membrane squeeze during air blow, 6.9 bar (100 psi) was applied
until the last 30 seconds of air blow when the squeeze pressure was increased to 16 bar (232 psi) to complete the cycle. Pressure filtration
tests examined the effect of form pressure, squeeze pressure, cake thickness, and air-dry duration on the production rate and filter cake
moisture.
| Silver Sand Project Pre-Feasibility Study |
| | New Pacific Metals Corp. | 0723071 |
| Table 13.31 |
Recommended pressure filter
operating parameters |
| Sample ID |
Description |
Feed density |
Design condition |
Dry bulk
density |
Chamber & final
thickness |
Sizing basis |
Cake formation
time |
Filter
cake
moisture |
Total
cycle
time |
Production |
| %
solid |
kg/m3 |
mm |
m3/t |
min |
% |
min |
(kg/h)/m2 |
| Met
Sample 1 |
10% oxide +
80% oxide +
10% sulphide |
55 |
5.5
bar form and air blow,
no squeeze |
1,554 |
60
/ 60 |
0.80 |
2.79 |
13.9 |
12.0 |
146 |
16
bar final membrane
squeeze |
1,653 |
60
/ 56.4 |
0.76 |
2.69 |
12.6 |
12.5 |
140 |
| Met
Sample 2 |
100%
oxide |
60 |
5.5
bar form and air blow,
no squeeze |
1,548 |
60
/ 60 |
0.81 |
1.28 |
13.6 |
12.0 |
145 |
16
bar final membrane
squeeze |
1,612 |
60
/ 57.6 |
0.78 |
1.24 |
12.7 |
12.5 |
139 |
| Met
Sample 5 |
100%
transitional |
55 |
16
bar final membrane
squeeze |
1,574 |
60
/ 60 |
0.79 |
1.07 |
13.5 |
12.0 |
148 |
5.5
bar form and air blow,
no squeeze |
1,685 |
60
/ 56.0 |
0.74 |
1.06 |
12.9 |
12.5 |
142 |
| Met
Sample 11 |
100%
sulphide |
55 |
16
bar final membrane
squeeze |
1,526 |
60
/ 60 |
0.82 |
1.79 |
14.4 |
12.0 |
143 |
5.5
bar form and air blow,
no squeeze |
1,620 |
60
/ 56.5 |
0.77 |
1.72 |
13.2 |
12.5 |
137 |
Source: New Pacific Metals Corp, 2024.
| Silver Sand Project Pre-Feasibility Study |
| | New Pacific Metals Corp. | 0723071 |
Table 13.31 shows the
recommended pressure filter operating parameters, which were derived from the testwork data. For sizing of the recessed plate
pressure filter, minimum cake formation time is 3.0 minutes, air dry time is 3.0 minutes, and 20 hours of operating time per day.
For sizing of the membrane-type recessed pressure filter, minimum cake formation time is 3.5 minutes, air dry time is 3.0 minutes,
and 20 hours of operating time per day. The air blow-only option yielded design cake moistures of approximately 13.5~13.9% within
reasonable dry times for Met Samples 1, 2, and 5. Met Sample 11 yielded a slightly higher moisture of 14.4%, although it was still
considered dry and acceptable. The membrane squeeze option was able to reduce design cake moisture by approximately 0.9~1.3% at
comparable dry times.
Squeezing also produced
cakes with very good discharge and stacking properties. For all samples, the area-based production rates at comparable dry times ranged
between 143~148 (kg/h)/m2 for the air blow-only option and 137 – 141 (kg/h)/m2
for the light membrane squeeze during air blow followed by a full pressure membrane squeeze option. If cake washing is applied,
the cycle time will be a little longer and the production rate will decrease.
| 13.3.13 | Transportable moisture limit |
Transportable moisture limit (TML)
is the maximum moisture content of a cargo that is considered safe for transportation in ship. If the cargo is assessed as having higher
actual moisture content than its TML, IMSBC Code (International Maritime Solid Bulk Cargo) does not allow the cargo to be loaded and transported
by sea unless the vessel is specially built or fitted for confining the cargo shift.
The TML was measured for four detoxed
cyanide leach tailing samples by SGS in Burnaby, British Columbia, Canada. Its values are presented in Table 13.32. These TML values serve
as a guideline to the cake moisture of pressure filtration for the future commercial operation.
| Table 13.32 |
Flow moisture
point (FMP) and TML |
| Sample ID |
Sample description |
FMP |
TML |
| % |
% |
| Met Sample 1 |
10% oxide + 80% transitional + 10% sulphide |
14.0 |
12.6 |
| Met Sample 2 |
100% oxide |
15.4 |
13.9 |
| Met Sample 5 |
100% transitional |
14.9 |
13.4 |
| Met Sample 11 |
100% sulphide |
15.5 |
14.0 |
| Average |
15.0 |
13.5 |
Source: New Pacific Metals
Corp, 2024.
Environmental
testing of the detoxed cyanide leach tailings
The modified acid-base accounting
(ABA) tests provided quantification of total sulphur, sulphide sulphur, sulfate contents, and maximum potential acid generation (MPA)
related to the oxidation of sulphide sulphur. The procedure determined the neutralization potential (NP) of the sample by initiating a
reaction with the addition of excess hydrochloric acid and then identified the quantity of acid neutralized by the sample’s NP by
back-titrating to pH 8.3 with sodium hydroxide. The balance between the MPA and NP defined the potential to generate acid drainage upon
exposure to oxygen (air) and water.
The net acid generation (NAG) testing
was conducted to determine the balance between the acid consuming and acid producing components. The NAG test initiated a reaction between
the sample and concentrated hydrogen peroxide (H2O2) in order
to force complete oxidation and reaction of the acidity produced with the neutralizing minerals present within the sample. After the reaction
ceased,
| Silver Sand Project Pre-Feasibility Study |
| | New Pacific Metals Corp. | 0723071 |
the pH of the solution was measured
(NAG pH). The acid remaining after the reaction was titrated with sodium hydroxide to pH 4.5 and the net acid generated by the reaction
was calculated and expressed in unit of kg H2SO4 equivalent
per tonne of solid. The NAG4.5 value indicates the contribution from free acid, aluminum, and iron. Titration from pH 4.5 to pH 7.0 can
provide additional information, because the NAG7.0 is indicative of the presence of metallic ions that consume alkalinity over this pH
range, such as copper and zinc.
Table 13.33 shows the ABA results
and NAG results for four detoxed cyanide leach tailing samples. Met Sample 2 (100% oxide) is expected to be nearly neutral. Met Sample
1, 5, and 11 are expected to produce acid upon complete oxidation of sulphide minerals. Nevertheless, oxidation of sulphide minerals was
slow (Figure 13.10). Over a period of 27 weeks, the pH decreased only slightly.
| Table 13.33 |
Results
of ABA and NAG tests for the detoxed cyanide leach tailing solids |
| |
Met
Sample 1 |
Met
Sample 2 |
Met
Sample 5 |
Met
Sample 11 |
10%
oxide +
80% transitional
+ 10% sulphide |
100%
oxide |
100%
transitional |
100%
sulphide |
ABA
testing |
STOTAL |
% |
1.08 |
0.27 |
0.93 |
2.05 |
| SSO4 |
% |
0.11 |
0.05 |
0.07 |
0.11 |
| S2- |
% |
0.93 |
0.20 |
0.75 |
1.80 |
| CTOTAL |
% |
<0.05 |
<0.05 |
<0.05 |
<0.05 |
| CO2 |
% |
<0.2 |
<0.2 |
<0.2 |
<0.2 |
| MPA |
kg
CaCO3/t |
33.8 |
8.4 |
29.1 |
64.1 |
| NP |
kg
CaCO3/t |
3.0 |
3.0 |
3.0 |
4.0 |
| NNP |
kg
CaCO3/t |
-30.8 |
-5.4 |
-26.1 |
-60.1 |
| NP/MPA
Ratio |
|
0.09 |
0.36 |
0.1 |
0.06 |
NAG
testing |
pH |
|
2.6 |
4.9 |
2.8 |
2.4 |
| NAG
pH 4.5 |
kg
H2SO4/t |
18.3 |
<0.01 |
13.0 |
26.8 |
| NAG
pH 7.0 |
kg
H2SO4/t |
22.0 |
0.58 |
18.2 |
34.3 |
Source: New Pacific Metals
Corp, 2024.
| Silver Sand Project Pre-Feasibility Study |
| | New Pacific Metals Corp. | 0723071 |
| Figure 13.10 |
pH reading
during humidity cell testing for Met Sample 1 |
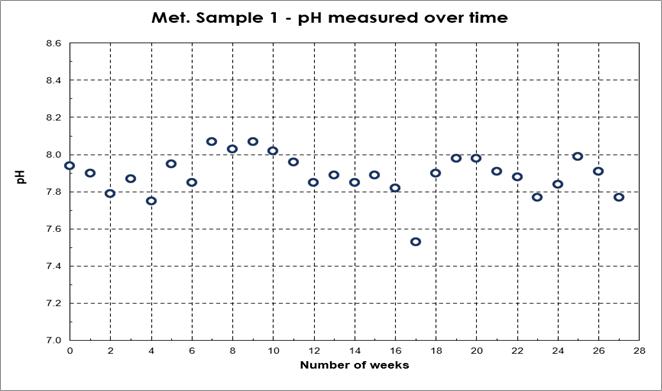
Source: New Pacific Metals
Corp, 2024.
| 13.4 | Metallurgical predictions |
Silver is the only pay metal envisaged
by the PFS. Copper is noted in test results, but the concentrations of copper in solution are generally insufficient to warrant a specific
copper recovery circuit for by-product credits.
A significant number of composite
samples have been tested over the last 3 years, representing a wide variety of composition and grade. Results vary significantly depending
on test conditions. Silver recovery appears to be dependent on a variety of factors including the geometallurgical type (oxide, transitional
or sulphide), the cyanide and dissolved oxygen concentrations in the leach, slurry mixing intensity, the residence time and to a lesser
extent the head grade. Generally speaking, one sees superior performance from oxide and transitional material compared to sulphide material.
Grinds finer than ~80 µm are considered necessary for good recovery.
Aggressive leaching conditions,
whilst good for silver, also tend to leach more copper into solution, and this can be a significant consumer of cyanide. If cyanide availability
decreases due to excessive consumption, then this tends to have a detrimental impact on silver recovery.
The PFS flowsheet has been developed
after a thorough analysis of the metallurgical test results (as reported in Section 13). The PFS mine plan has also been considered, and
the mixture of geometallurgical ore types during early production periods has been assessed. Figure 13.11 shows the blend of types by
year for the life of mine.
| Silver Sand Project Pre-Feasibility Study |
| | New Pacific Metals Corp. | 0723071 |
| Figure 13.11 |
LOM annual
ore blends |
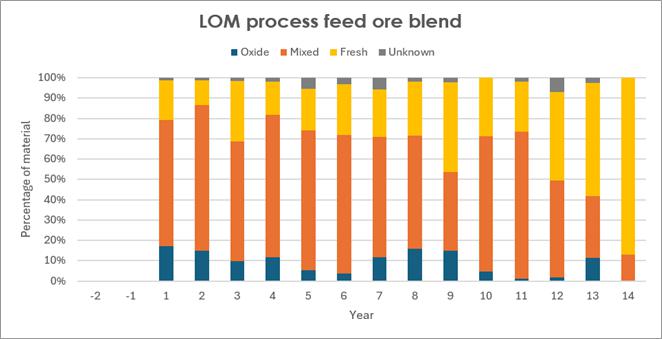
Source: AMC Mining Consultants
(Canada) Ltd., 2024.
The blend of
geometallurgical ore types for the first seven years of production is 11% oxide, 66% transitional, 21% sulphide, and 3% unknown (no
ID). The weighted average grade over this period is 117 g/t Ag. These metrics correlate well with those of the “Met Sample 1
NEW” composite as tested at ALS in 2023. The results of work on this particular composite are summarized in Table 13.34 below.
These tests were conducted over a 72-hour leach period without activated carbon, lifterbottle leach, a pulp density of 45% solids
and a grind size of 80% passing ~75 µm.
| Table 13.34 |
Met Sample
1 NEW results summary |
|
Test ID |
Sparged gas |
Cyanide
concentration |
Lead
nitrate |
Back calcd.
head grade |
Silver
recovery |
Cyanide
consumption |
Lime
consumption |
| Type |
Flowrate |
| mL/min |
g/L NaCN |
kg/t |
g/t |
% |
kg/t NaCN |
kg/t CaO |
| 72CN |
Oxygen |
19 |
2.00 |
/ |
111 |
89.2 |
1.16 |
1.3 |
| 73CN |
Oxygen |
9 |
113 |
89.4 |
0.99 |
1.0 |
| 74CN |
Air |
19 |
121 |
89.6 |
0.94 |
1.6 |
| 75CN |
Oxygen |
38 |
114 |
90.6 |
0.96 |
1.3 |
| 78CN |
Oxygen |
19 |
3.00 |
/ |
111 |
91.0 |
1.37 |
2.2 |
| 79CN |
Oxygen |
19 |
2.00 |
0.20 |
116 |
88.0 |
1.18 |
1.3 |
| Average |
114 |
89.6 |
1.10 |
1.4 |
Source: New Pacific Metals
Corp, 2024.
The results indicate an average
silver recovery of 89.6% with a 1% relative standard deviation. Average cyanide consumption is 1.1 kg/t.
After Year 7, the percentage of
sulphide material increases so that the LOM average composition is 9% oxide, 59% transitional, 29% sulphide, and 3% unknown (no ID). The
weighted average grade over the LOM is 105 g/t Ag.
| Silver Sand Project Pre-Feasibility Study |
| | New Pacific Metals Corp. | 0723071 |
Similar testing was
conducted on another production composite, “Met Sample 1” (as shown in Table 13.35 which had a different composition,
namely 10% oxide, 80% transitional, 10% sulphide. The additional transitional material in this composite resulted in superior
results with an average silver recovery of 92.7%. These results are presented in Table 13.35.
| Table 13.35 |
Met Sample
1 results summary |
|
Test ID |
Pulp
density |
Cyanide
concentration |
Lead
nitrate |
Retention
time |
Back calcd.
head grade |
Silver
recovery |
Cyanide
consumption |
Lime
consumption |
| % solid |
g/L NaCN |
kg/t |
h |
g/t |
% |
kg/t NaCN |
kg/t CaO |
| 28CN |
40 |
3.00 |
0.30 |
72 |
133 |
92.3 |
1.62 |
1.8 |
| 38CN |
40 |
3.00 |
0.30 |
48 |
138 |
92.0 |
1.23 |
1.5 |
| 48CN |
40 |
3.00 |
0.30 |
48 |
153 |
92.7 |
1.67 |
1.7 |
| 66CN |
45 |
2.00 |
/ |
72 |
157 |
93.8 |
1.08 |
1.4 |
| Average |
|
145 |
92.7 |
1.40 |
1.6 |
Source: New Pacific Metals
Corp, 2024.
This suggests that production periods
with higher proportions of transitional material will see slightly higher silver recoveries, whilst those periods with higher proportions
of sulphide material (e.g., Year 14) will see slightly lower silver recoveries.
| Silver Sand Project Pre-Feasibility Study |
| | New Pacific Metals Corp. | 0723071 |
| 14 | Mineral Resource estimates |
The Mineral Resource for the Silver
Sand deposit has been estimated by Ms Dinara Nussipakynova, P.Geo., of BBA, formerly employed with AMC Consultants, who takes responsibility
for the estimate.
The estimate is dated 31 October
2022 and is an update to the initial Mineral Resource estimate on the deposit, which was discussed in the 2020 Technical Report. The data
used in this estimate includes results of all drilling carried out on the Property up to 25 July 2022.
The estimation was carried
out in Datamine™ software. Interpolation of Ag, As and S grades were carried out using ordinary kriging (OK) for the four main
mineralized domains, and the background model. The remaining 127 small domains were estimated using the inverse distance squared (ID2)
method. The grades for Pb, Zn, and Cu were estimated separately using the indicator method to define the higher grade zones and utilized
OK for the estimation, ignoring the domains used for the estimation of the other metals. The indicator method was also used to define
the location of the oxidation type.
The result of the current estimate
is summarized in Table 14.1. The following metals were estimated: silver, lead, zinc, copper, arsenic, and sulphur. Only silver is reported
as it is the only economic metal. The additional elements were estimated to enable geometallurgical modelling to be carried out. The model
is depleted for historical mining activities. The Mineral Resources are reported within a conceptional pit shell and at a 30 g/t Ag COG.
Mineral Resources that are not Mineral Reserves do not have demonstrated economic viability.
| Table 14.1 | Silver Sand Mineral Resource
as of 31 October 2022 |
| Resource
category |
Tonnes
(Mt) |
Ag
(g/t) |
Ag
(Moz) |
| Measured |
14.88 |
131 |
62.60 |
| Indicated |
39.38 |
110 |
139.17 |
| Measured
& Indicated |
54.26 |
116 |
201.77 |
| Inferred |
4.56 |
88 |
12.95 |
Notes:
| · | CIM Definition Standards (2014) were used for reporting the Mineral Resources. |
| · | The Qualified Person is Dinara Nussipakynova, P.Geo. of BBA, formerly employed with AMC Consultants. |
| · | Mineral Resources are constrained by optimized pit shells at a metal price
of US$22.50/oz Ag, recovery of 91% Ag and COG of 30 g/t Ag. |
| · | Drilling results up to 25 July 2022. |
| · | The numbers may not compute exactly due to rounding. |
| · | Mineral Resources that are not
Mineral Reserves do not have demonstrated economic viability. |
| Source: AMC Mining Consultants (Canada) Ltd., 2022. |
The Company is progressing with
community engagement and securing surface rights for its project in Bolivia, but faces disruptions from illegal artisanal and small-scale
miners (“ASMs”) whose activities conflict with project development. Legal proceedings and government support are underway to
resolve the issue, with the Company optimistic about a favorable outcome that aligns with community and governmental interests. Regarding
the extent of the impact of the illegal ASM activities on the Project’s Mineral Resources, the Company believes the mineralized
material extracted is not significant.
The Qualified Person has relied,
in respect to certain information concerning environmental, permitting and social aspects relevant to the Technical Report, upon the guidance
of the Company and experts outlined in Section 3. The Qualified Person is not aware of any mining, metallurgical,
| Silver Sand Project Pre-Feasibility Study |
| | New Pacific Metals Corp. | 0723071 |
infrastructure, permitting, environmental,
political or other factors that may materially affect the current Mineral Resources.In the last five years, Bolivia experienced a transition
from social turmoil to stability. The government of the current President, elected at the end of 2020 supports and encourages private
and foreign investments in the economic sectors of the country. New laws were approved by congress to encourage private investments in
mining sector, for example, Law 1391 (Decree 4579) waives value added tax for import of equipment and vehicles.
Although the country is now generally
friendly to private and foreign investments in the mining sector, risks associated with instability of government caused by political
polarization and visible divisions in the governing party remains. In addition, local protests and blockages by various social groups
may pose unforeseen instability from time to time. Overall, political and social risks are currently manageable in Bolivia. The country
has become relatively more attractive for foreign investments, and this trend is evidenced by the fact that more western exploration and
mining companies started business in the country in recent years.
The data used in the estimate consists
of surface diamond drillholes only. New Pacific maintains the resource database in a Microsoft Access database and provided data to AMC
Consultants as Microsoft Excel files. The number of holes and number of assays used in the AMC Consultants estimate, by year of drilling,
is shown in Table 14.2.
| Table 14.2 |
Drillhole
data used in the estimate |
| Year drilled |
No. of drillholes |
No. of assays |
Metres drilled (m) |
| 2017 |
18 |
3,337 |
5,020 |
| 2018 |
177 |
34,728 |
49,991 |
| 2019 |
206 |
30,662 |
45,874 |
| 2020 |
13 |
1,762 |
2,489 |
| 2021 |
54 |
7,835 |
12,815 |
| 2022 |
88 |
13,840 |
20,031 |
| Total |
556 |
92,164 |
136,220 |
Notes:
| · | Drillholes are surface DDHs. |
| · | Drill data to 25 July 2022. |
| · | Numbers may not add due to rounding. |
| · | Number of drillholes on the
Property is 566 but only 556 are in the Mineral Resource area. |
Source:
AMC Mining Consultants (Canada) Ltd., 2022.
| Silver Sand Project Pre-Feasibility Study |
| | New Pacific Metals Corp. | 0723071 |
Figure
14.1 is a plan showing the location of the drillholes used in the estimate.
| Figure 14.1 |
Silver Sand drillhole location plan |
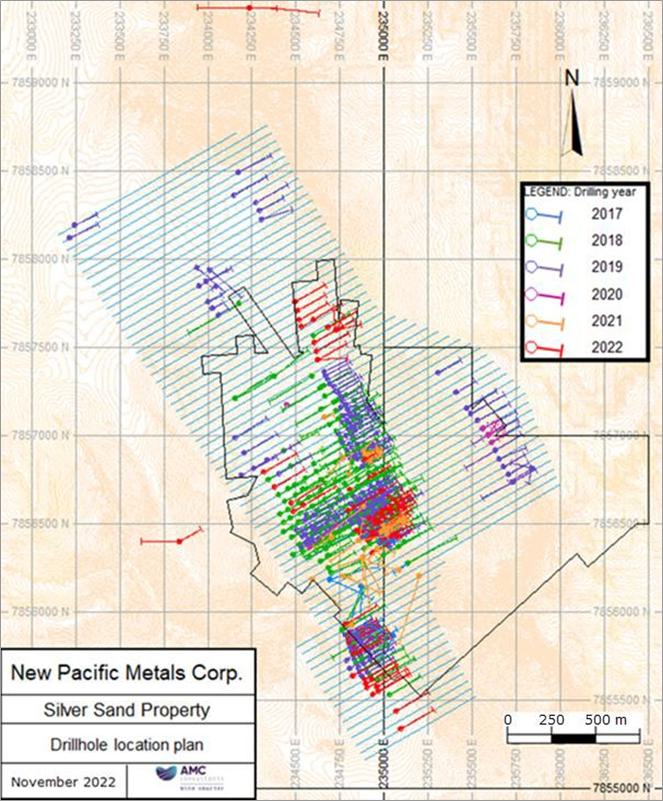
| Silver Sand Project Pre-Feasibility Study |
| | New Pacific Metals Corp. | 0723071 |
New Pacific performed 6,297
density measurements on the core drilled on the Property. The collection of bulk density measurements is described in Section 11. As
the mineralization is hosted in one rock type, after reviewing the density data, the QP assigned one density measurement to the block
model of 2.54 t/m3.
| 14.2.3 | Lithological domains |
The Silver Sand deposit is hosted
in La Puerta Formation sandstones and is capped by the red siltstone of the Tarapaya Formation as discussed in Section 7. New Pacific
provided the contact between these two formations. The contact was modelled in Leapfrog Geo 4.0 (Leapfrog). The contact was reviewed and
accepted by the QP.
| 14.2.4 | Mineralization domains |
Mineralization domains were constructed
by New Pacific. The mineralization wireframes were built by the grade shell method in Leapfrog.
The mineralization domains were
reviewed and accepted by the QP with minor changes including a change of the naming convention. Domains 1-4 are the main domains which
contain 80% of the volume of mineralization are shown in Figure 14.2 as a red solid. In Figure 14.3 the relative percentage volumes of
the domains or group of domains are shown.
Visual checks were carried out by
the QP to ensure that the constraining wireframes respected the raw data.
| Figure 14.2 |
3D view
of mineralization domains looking north-east |
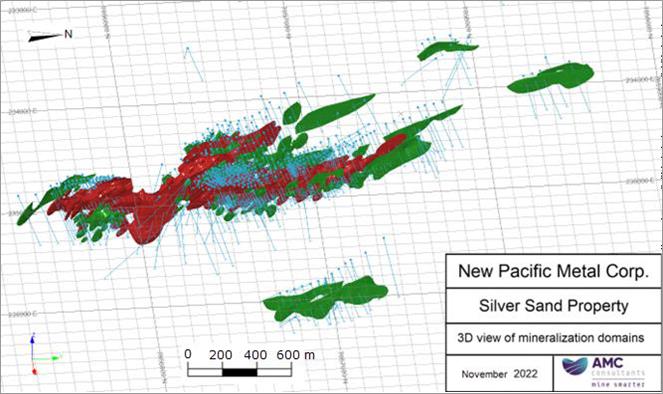
| Silver Sand Project Pre-Feasibility Study |
| | New Pacific Metals Corp. | 0723071 |
| Figure 14.3 |
Pie-chart
of the percentage volume by domains |
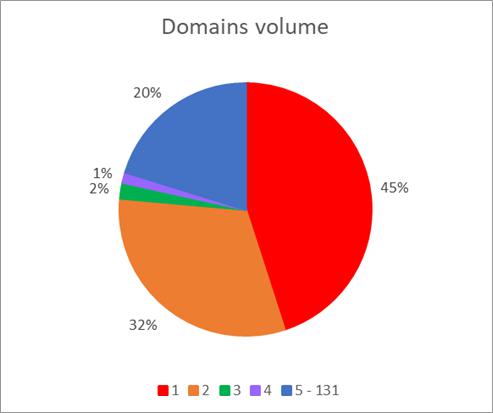
Source: AMC Mining Consultants (Canada) Ltd.,
2022.
New Pacific provided AMC Consultants
with void solids that are interpreted to represent historical mining. The void solids were built by extrapolating voids in Leapfrog tools.
Surveying of the historical mining voids could not be undertaken due to safety issues.
The QP compared the provided solids
with the drillhole database and found them to be acceptable.
Grade estimation was completed using two different approaches.
| 1 | Ag, As, and S estimation carried out within mineralization domains as
described in Section 14.2.4, (the background model was unconstrained). |
| 2 | Cu, Pb, and Zn estimation was constrained into high and low grade volumes
using an Indicator method. |
An oxidation model consisting of oxide, transition and sulphide
was also constrained using an Indicator method.
| 14.4 | Statistics and compositing |
Sample lengths range
from 0.01 m to 9.2 m within the resource area. The mean sample length is 1.19 m. Given this mean and considering the width of the
mineralization, the QP chose to composite to 1.2 m lengths within the domains. Outside the domains for the background model a
composite length of 2.5 m was used. Samples were composited by domain using Datamine’s dynamic
| Silver Sand Project Pre-Feasibility Study |
| | New Pacific Metals Corp. | 0723071 |
composting tool. This tool
adjusts each composite length as necessary to achieve equal sample support and eliminate residuals (very short samples).
The composite data for Ag, As, and
S for all mineralization domains were viewed on log probability plots, and also evaluated using the decile method, to assist with determining
the capping level for higher values. The probability plot for Ag is shown in Figure 14.4.
| Figure
14.4 |
Probability plot for Ag |
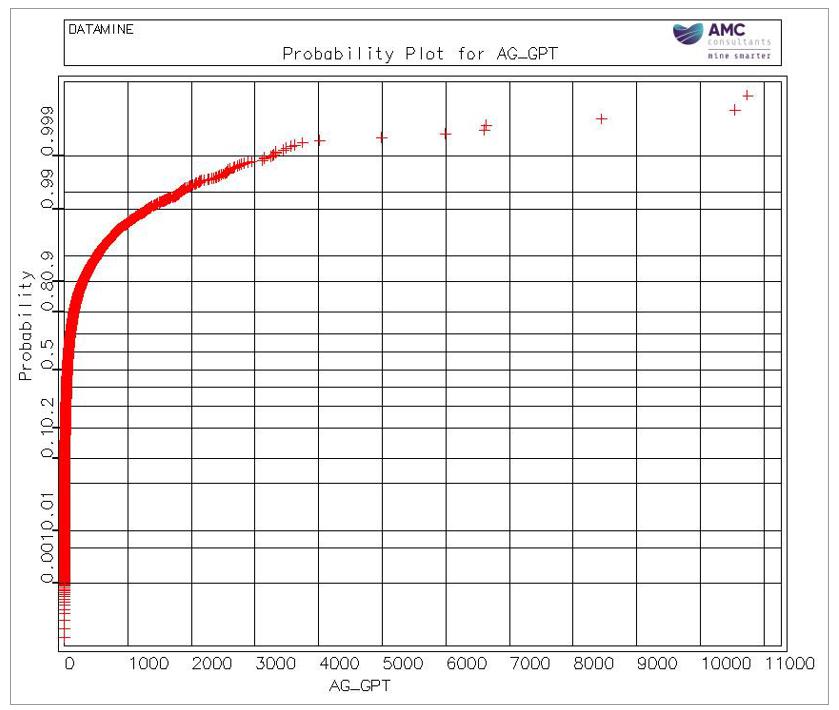
Source: AMC Mining Consultants (Canada) Ltd.,
2022.
Capping was applied for Ag and As
after compositing with the results as shown in Table 14.3. No capping was applied for S.
| Table 14.3 | Grade capping for silver and arsenic |
| Element |
Top cap |
Original mean |
New mean |
Number of
samples top cut |
New mean grade as
% of original |
| Ag (g/t) |
2,000 |
125 |
120 |
65 |
96.3% |
| As (ppm) |
2,000 |
236 |
234 |
76 |
97.9% |
Source: AMC Mining Consultants
(Canada) Ltd., 2022.
| Silver Sand Project Pre-Feasibility Study |
| | New Pacific Metals Corp. | 0723071 |
The raw, composited, and capped
assay data for silver for all the mineralized domains are shown in Table 14.4.
| Table 14.4 |
Ag statistics
of raw, composited, and capped assay data |
| Domain |
Data |
Number of
samples |
Minimum |
Maximum |
Mean |
Standard
deviation |
Coefficient of
variation |
|
1 |
Raw selected |
5,469 |
0.0 |
16,194 |
113 |
349.59 |
3.08 |
| Composited |
5,366 |
0.0 |
10,532 |
113 |
293.03 |
2.59 |
| Capped |
5,366 |
0.0 |
2,000 |
108 |
217.45 |
2.00 |
|
2 |
Raw selected |
8,888 |
0.0 |
12,791 |
138 |
371.97 |
2.69 |
| Composited |
8,726 |
0.0 |
10,740 |
138 |
322.44 |
2.33 |
| Capped |
8,726 |
0.0 |
2,000 |
133 |
255.55 |
1.92 |
|
3 |
Raw selected |
214 |
0.2 |
3,410 |
116 |
330.36 |
2.83 |
| Composited |
210 |
0.2 |
3,137 |
116 |
302.59 |
2.59 |
| Capped |
210 |
0.2 |
2,000 |
111 |
254.01 |
2.29 |
|
4 |
Raw selected |
213 |
0.5 |
1,130 |
74 |
120.28 |
1.64 |
| Composited |
204 |
0.5 |
1,120 |
74 |
110.61 |
1.50 |
| Capped |
204 |
0.5 |
1,120 |
74 |
110.61 |
1.50 |
|
5 -131 |
Raw selected |
2,294 |
0.0 |
7,830 |
108 |
299.12 |
2.78 |
| Composited |
2,238 |
0.0 |
4,009 |
108 |
257.77 |
2.39 |
| Capped |
2,238 |
0.0 |
2,000 |
104 |
219.31 |
2.11 |
Source: AMC Mining Consultants (Canada) Ltd.,
2022.
| 14.5 | Block model parameters |
The block size selected for estimating
Ag, As and S within the mineralization domains was 2.5 mE x 5 mN x 2.5 mRL with sub-blocking employed. Sub-blocking resulted in minimum
cell dimensions of 1.25 mE x 0.5 mN x 1.25 mRL. The background mineralization, being that outside the mineralization domains, was estimated
with a parent block dimension of 10 mE x 10 mN x 10 mRL.
Cu, Pb and Zn and the oxidation
attributes were estimated into 2.5 mE x 5 mN x 2.5 mRL blocks for the high grade and 5 mE x 10 mN x 5 mRL for the low grade. These elements
and As an S were estimated for geometallurgical purposes only.
All models were then merged to
form one model. The block model dimensions and rotation for the merged model are shown in Table 14.5. The model was rotated counter-clockwise
around the Z-axis.
| Table 14.5 |
Block model
parameters |
| Parameter |
X |
Y |
Z |
| Origin (m) |
234,500 |
7,854,750 |
3,400 |
| Maximum block size (m)* |
5 |
10 |
5 |
| Minimum block size (m) |
0.625 |
0.250 |
0.250 |
| Rotation angle (deg) |
0 |
0 |
-30 |
| No. of blocks |
500 |
280 |
200 |
Note: *Parent block size of merged model.
Source: AMC Mining Consultants (Canada) Ltd.,
2022.
| Silver Sand Project Pre-Feasibility Study |
| | New Pacific Metals Corp. | 0723071 |
| 14.6 | Variography and grade estimation |
Variography was carried out on domains
1-4 and for the low-grade background model, for Ag, As, and S. The search distances for the grade estimation were based on the variogram
ranges. Search parameters for domains 5-131 were based on vein orientation and visual continuity. Dynamic anisotropy was used in the estimation
process for domains 60-68, where the internal orientation was variable.
Three passes were employed, each
using different search distances and passes. Table 14.6 shows the search parameters for Ag.
| Table 14.6 |
Ag grade
interpolation search parameters |
|
Domain |
Pass |
X (m) |
Y (m) |
Z (m) |
Rotation angle axis Z |
Rotation angle axis X |
Rotation angle axis Y |
Minimum no. of samples |
Maximum no.
of samples |
Minimum no. of drillholes |
|
1 |
1 |
80 |
80 |
12 |
240 |
70 |
0 |
6 |
12 |
2 |
| 2 |
160 |
160 |
24 |
240 |
70 |
0 |
4 |
12 |
2 |
| 3 |
240 |
240 |
36 |
240 |
70 |
0 |
2 |
12 |
2 |
|
2 |
1 |
86 |
102 |
12 |
240 |
70 |
0 |
6 |
12 |
2 |
| 2 |
172 |
204 |
24 |
240 |
70 |
0 |
4 |
12 |
2 |
| 3 |
258 |
306 |
36 |
240 |
70 |
0 |
2 |
12 |
2 |
|
3 |
1 |
76 |
91 |
10 |
240 |
70 |
0 |
6 |
12 |
2 |
| 2 |
152 |
182 |
20 |
240 |
70 |
0 |
4 |
12 |
2 |
| 3 |
228 |
273 |
30 |
240 |
70 |
0 |
2 |
12 |
2 |
|
4 |
1 |
72 |
72 |
17 |
240 |
70 |
0 |
6 |
12 |
2 |
| 2 |
144 |
144 |
34 |
240 |
70 |
0 |
4 |
12 |
2 |
| 3 |
216 |
216 |
51 |
240 |
70 |
0 |
2 |
12 |
2 |
|
5 – 59 |
1 |
80 |
90 |
15 |
240 |
77 |
0 |
6 |
12 |
2 |
| 2 |
160 |
180 |
30 |
240 |
70 |
0 |
4 |
12 |
2 |
| 3 |
240 |
270 |
45 |
240 |
70 |
0 |
2 |
12 |
2 |
|
60 – 68 |
1 |
80 |
90 |
15 |
DA |
DA |
0 |
6 |
12 |
2 |
| 2 |
160 |
180 |
30 |
DA |
DA |
0 |
4 |
12 |
2 |
| 3 |
240 |
270 |
45 |
DA |
DA |
0 |
2 |
12 |
2 |
|
69 – 131 |
1 |
40 |
45 |
8 |
240 |
77 |
0 |
2 |
12 |
- |
| 2 |
80 |
90 |
16 |
240 |
70 |
0 |
2 |
12 |
- |
| 3 |
120 |
135 |
24 |
240 |
70 |
0 |
2 |
12 |
- |
|
Background |
1 |
100 |
90 |
21 |
240 |
75 |
0 |
6 |
12 |
2 |
| 2 |
200 |
180 |
42 |
240 |
75 |
0 |
4 |
12 |
2 |
| 3 |
300 |
270 |
63 |
240 |
75 |
0 |
2 |
12 |
2 |
Note: DA - Dynamic anisotropy
angles.
Source: AMC Mining Consultants
(Canada) Ltd., 2022.
The estimation was carried out in Datamine™ software
and the interpolation methods used were as follows:
| · | Domains 1-4, Ag, As, and S grades interpolated by OK |
| · | Background model, Ag, As, and S grades interpolated by OK |
| · | Domains 5-132, Ag, As, and
S grades interpolated ID2 |
| · | Total model, Pb, Zn, and Cu interpolated by OK |
| · | Oxidation attributes interpolated by OK |
| Silver Sand Project Pre-Feasibility Study |
| | New Pacific Metals Corp. | 0723071 |
The blocks inside the block model
are coded by estimated Ag, As, S, Cu, Pb, and Zn. In addition, the oxidation type and an assigned bulk density value are included. Only
silver, which has a proven metallurgical recovery method, is reported in the Mineral Resource statement.
| 14.7 | Resource classification |
Mineral Resource classification
was completed using an assessment of geological and mineralization continuity, data quality, and data density. Search passes, which were
different from those used to estimate grade, were used as an initial guide for classification. Wireframes were then generated manually
to build coherent areas defining the different classes.
Interpolation for classification was carried out using the
OK method. Three passes were employed, each using different search distances and multiples as follows:
| · | Pass 1 = 1 x search distance |
| · | Pass 2 = 2 x search distance |
| · | Pass 3 = 3 x search distance |
These are shown in Table 14.7 along with the minimum and
maximum number of samples used for each pass.
| Table 14.7 |
Class interpolation search
parameters |
| Pass |
X (m) |
Y (m) |
Z (m) |
Minimum no.
of samples |
Maximum no.
of samples |
Minimum no.
of drillholes |
| 1 |
30 |
30 |
10 |
8 |
24 |
4 |
| 2 |
60 |
60 |
20 |
6 |
20 |
3 |
| 3 |
90 |
90 |
30 |
4 |
20 |
2 |
Source: AMC Mining Consultants (Canada) Ltd.,
2022.
Figure 14.5 shows a 3D view of the resource classification
constrained by the domains in the block model.
| Silver Sand Project Pre-Feasibility Study |
| | New Pacific Metals Corp. | 0723071 |
| Figure
14.5 |
3D view of the resource classification |
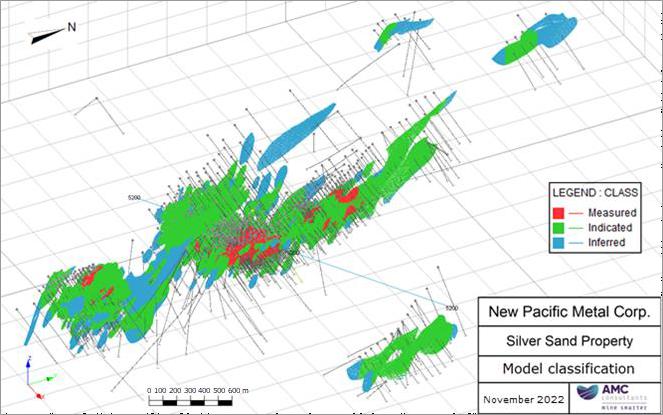
| 14.8 | Block model validation |
The block model was validated
in four ways. First, visual checks were carried out to ensure that the grades respected the raw assay data. Secondly, swath plots were
reviewed. Thirdly, the estimate was statistically compared to the capped assay data, with satisfactory results. Lastly the OK estimates
were compared to an ID2, and inverse distance cubed (ID3)
and a nearest neighbour (NN) estimate, all with acceptable results.
Figure 14.6 shows a plan view of
the block model showing drillhole composite silver grades on drillhole traces compared to the block model estimated grades.
The comparison was viewed on a
number of sections and as an example Section 5200 is located on Figure 14.6 and this section is shown in Figure 14.7 as a representative
section.
| Silver Sand Project Pre-Feasibility Study |
| | New Pacific Metals Corp. | 0723071 |
| Figure 14.6 |
Plan view of the block model
and drillholes |
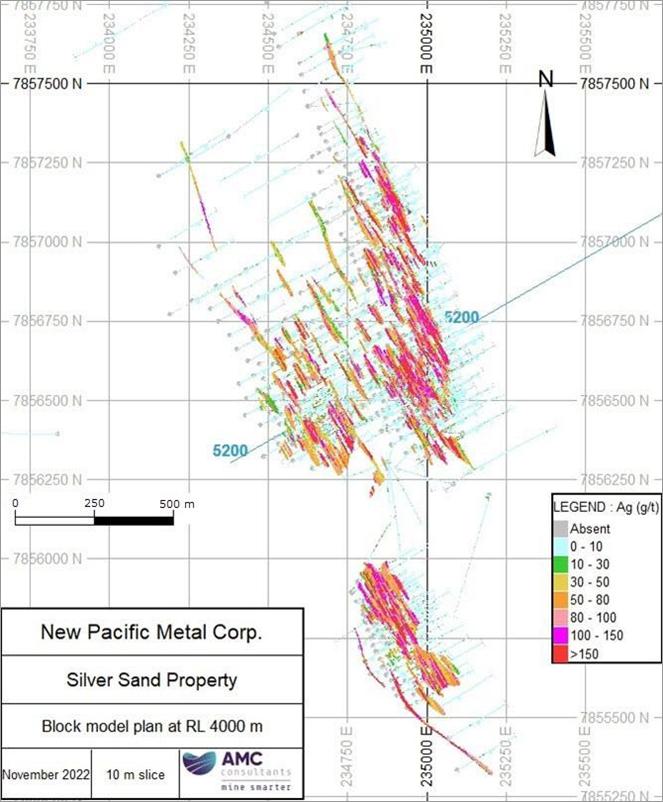
| Silver Sand Project Pre-Feasibility Study |
| | New Pacific Metals Corp. | 0723071 |
| Figure 14.7 |
Block model
versus drillhole grade on Section 5200 |
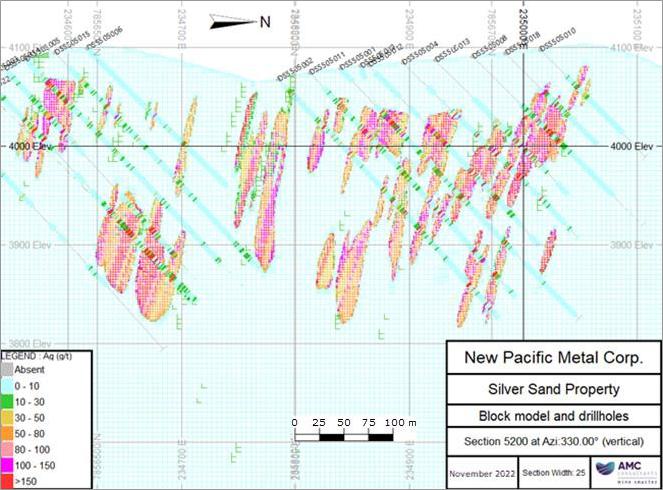
Swath plots for all domains for
the combined Measured, Indicated, and Inferred Ag mineralization are shown below in Figure 14.8. Except for some areas where there is
sparse data there is acceptable agreement between drillhole and block model silver grades.
| Silver Sand Project Pre-Feasibility Study |
| | New Pacific Metals Corp. | 0723071 |
| Figure 14.8 |
All domains swath plot for
silver |
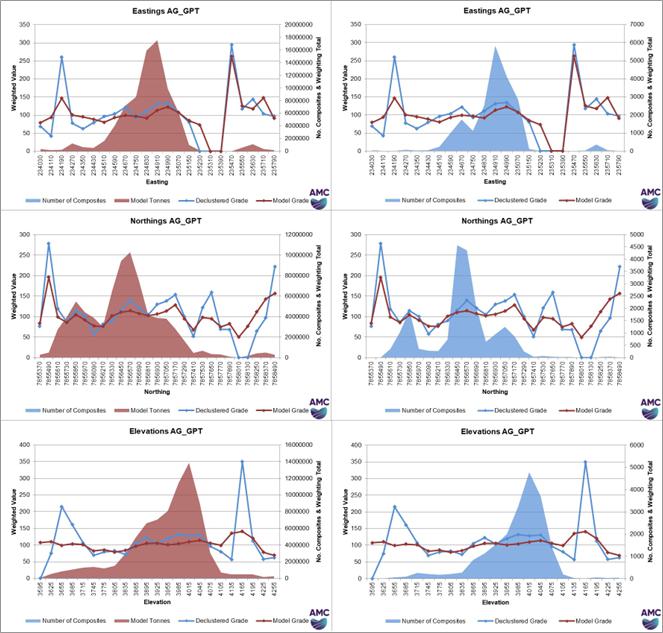
Source: AMC Mining Consultants (Canada) Ltd.,
2022.
The swath plots show a reasonable correlation between block
model grades and composite grades.
| 14.8.3 | Statistical comparison |
Table 14.8 shows the statistical comparison on the composites
versus the block model grades for silver.
| Silver Sand Project Pre-Feasibility Study |
| | New Pacific Metals Corp. | 0723071 |
| Table 14.8 |
Statistical
comparison of capped assay data and block model for Ag |
| Domain |
1 |
2 |
3 |
4 |
5 – 131 |
| Data |
Comps |
Model |
Comps |
Model |
Comps |
Model |
Comps |
Model |
Comps |
Model |
| N records |
5,366 |
1,234,369 |
8,726 |
788,030 |
210 |
50,533 |
204 |
35,802 |
2,238 |
721,335 |
| Minimum |
0.00 |
0.00 |
0.00 |
0.00 |
0.20 |
1.33 |
0.50 |
2.80 |
0.00 |
0.00 |
| Maximum |
2,000 |
1,606 |
2,000 |
1,477 |
2,000 |
1,244 |
1,120 |
645 |
2,000 |
1,939 |
| Mean |
109 |
93 |
133 |
120 |
111 |
101 |
74 |
80 |
104 |
105 |
| SD |
217.45 |
72.05 |
255.55 |
92.67 |
254.01 |
105.37 |
110.61 |
60.04 |
219.31 |
118.03 |
| CV |
2.00 |
0.78 |
1.92 |
0.77 |
2.29 |
1.04 |
1.50 |
0.75 |
2.11 |
1.13 |
Notes: SD – Standard Deviation,
CV – Coefficient of Variation.
Source: AMC Mining Consultants (Canada) Ltd., 2022.
| 14.8.4 | Comparison with other interpolation methods |
The OK estimates were compared
to an ID2, and ID3 and a NN estimate,
also with acceptable results. Note, domains 5-131 were estimated by ID2 and the comparison
was to ID3 and NN models.
| 14.9 | Mineral Resource estimate |
The Mineral Resources are reported
for blocks within a pit shell based on a $22.50/ounce Ag price. This shell includes Mineral Resources reported both within the AMC claim
boundary and the MPC.
The cut-off applied for reporting
the Mineral Resources is 30 g/t Ag. Assumptions made to derive the COG and build the pit shell included mining costs, processing costs
and metallurgical recoveries. These inputs were obtained from benchmarked comparable studies and metallurgical testwork. These parameters
are shown in Table 14.9. The model is depleted for historical mining activities. Measured, Indicated, and Inferred blocks were used to
define the pit shell.
| Table 14.9 |
Cut-off grade
and conceptual pit parameters |
| Input |
Units |
Value |
| Silver price |
$/oz Ag |
22.5 |
| Silver process recovery |
% |
91 |
| Payable silver |
% |
99 |
| Mining recovery factor |
% |
100 |
| Mining cost |
$/t mined |
2.6 |
| Process cost |
$/t minable material > COG |
16 |
| G&A cost |
$/t minable material > COG |
2 |
| Slope angle |
Degrees |
44 – 47 |
Notes:
| · | Sustaining capital cost has not been included. |
| · | Measured, Indicated, and Inferred Mineral Resources included. |
| · | G&A cost refers to General
and Administration costs. |
Source: AMC Mining Consultants (Canada) Ltd.,
2022.
| Silver Sand Project Pre-Feasibility Study |
| | New Pacific Metals Corp. | 0723071 |
The Mineral Resource estimate is shown in Table 14.10.
| Table 14.10 |
Silver Sand Mineral Resource
as of 31 October 2022
|
| Resource category |
Tonnes (Mt) |
Ag (g/t) |
Ag (Moz) |
| Measured |
14.88 |
131 |
62.60 |
| Indicated |
39.38 |
110 |
139.17 |
| Measured & Indicated |
54.26 |
116 |
201.77 |
| Inferred |
4.56 |
88 |
12.95 |
Notes:
| · | CIM Definition Standards (2014) were used for reporting the Mineral Resources. |
| · | The Qualified Person is Dinara Nussipakynova, P.Geo. of BBA, formerly employed withAMC Consultants. |
| · | Mineral Resources are constrained by optimized pit shells at a metal price
of US$22.50/oz Ag, recovery of 91% Ag and COG of 30 g/t Ag. |
| · | Drilling results up to 25 July 2022. |
| · | The numbers may not compute exactly due to rounding. |
| · | Mineral Resources that are not
Mineral Reserves do not have demonstrated economic viability. |
Source:
AMC Mining Consultants (Canada) Ltd., 2022.
The majority of the Mineral Resources
lie within the AMC. Table 14.11 shows the split of the 2022 Mineral Resource within the AMC boundary and outside the boundary. Since the
2019 Mineral Resources were reported, a subsequent agreement with COMIBOL permits the reporting of Mineral Resources outside the AMC.
Mineral Resources in the MPC will be subject to a royalty of 6% payable to COMIBOL during the production stage according to the agreement
reached with COMIBOL.
| Table 14.11 |
Mineral
Resources within and outside the AMC |
| Resource category |
Inside AMC boundary |
Outside AMC boundary |
| Tonnes (Mt) |
Ag (g/t) |
Ag (Moz) |
Tonnes (Mt) |
Ag (g/t) |
Ag (Moz) |
| Measured |
14.57 |
131 |
61.51 |
0.31 |
108 |
1.08 |
| Indicated |
34.38 |
110 |
121.38 |
5.00 |
111 |
17.79 |
| Measured & Indicated |
48.95 |
116 |
182.90 |
5.31 |
111 |
18.87 |
| Inferred |
3.17 |
77 |
7.88 |
1.40 |
113 |
5.07 |
Source: AMC Mining Consultants (Canada) Ltd.,
2022.
The results of reporting the Measured
and Indicated portion of the block model at a range of cut-offs are shown in Table 14.12, with the preferred cut-off shown in bold text.
The QP notes the block model is relatively insensitive to COG.
| Table 14.12 |
Model sensitivity
to cut-offs |
| Cut-off grade Ag (g/t) |
Tonnes (Mt) |
Ag (g/t) |
Ag (Moz) |
| 25 |
55.46 |
114 |
202.83 |
| 30 |
54.26 |
116 |
201.77 |
| 35 |
52.41 |
119 |
199.83 |
| 40 |
50.02 |
122 |
196.94 |
| 45 |
47.36 |
127 |
193.30 |
Source: AMC Mining Consultants (Canada) Ltd.,
2022.
| Silver Sand Project Pre-Feasibility Study |
| | New Pacific Metals Corp. | 0723071 |
| 14.10 | Comparison with previous Mineral Resource estimate |
A comparison of the
2019 and 2022 Mineral Resource estimates are shown in Table 14.13. Table 14.10 and Table 14.13 list the estimate footnotes for the
2022 and 2019 estimates respectively. The differences between the estimates are most notably in silver price, recovery, and COG. An
increased mining cost assumption for the 2022 estimate has resulted in an optimum pit shell that does not go as deep as the 2019
estimate. In addition, the 2022 Mineral Resource includes material within the MPC, which can now be considered available to New
Pacific for reporting purposes.
| Table 14.13 |
Mineral
Resource comparison with previous 2019 estimate |
| |
Class |
Tonnes (Mt) |
Ag (g/t) |
Ag (Moz) |
|
2019
(cut-off 45 g/t Ag) |
Measured |
8.40 |
159 |
43.05 |
| Indicated |
26.99 |
130 |
112.00 |
| Measured and Indicated |
35.39 |
137 |
155.05 |
| Inferred |
9.84 |
112 |
35.55 |
|
2022
(cut-off 30 g/t Ag) |
Measured |
14.88 |
131 |
62.60 |
| Indicated |
39.38 |
110 |
139.17 |
| Measured and Indicated |
54.26 |
116 |
201.77 |
| Inferred |
4.56 |
88 |
12.95 |
|
Difference |
Measured |
6.48 |
-28 |
19.55 |
| Indicated |
12.39 |
-20 |
27.17 |
| Measured and Indicated |
18.87 |
-21 |
46.72 |
| Inferred |
-5.28 |
-24 |
-22.60 |
Notes applicable to both estimates:
| · | CIM Definition Standards (2014) were used for reporting the Mineral Resources. |
| · | The Qualified Person is Dinara Nussipakynova, P.Geo., of BBA, formerly employed with of AMC Consultants. |
| · | The numbers may not compute exactly due to rounding. |
| · | Mineral Resources that are not
Mineral Reserves do not have demonstrated economic viability. |
| 2022 Mineral Resource notes: |
| · | Mineral Resources are constrained by optimized pit shells at a metal price
of US$22.50/oz Ag, recovery of 91% Ag and COG of 30 g/t Ag. |
| · | Drilling results up to 25 July
2022. |
| 2019 Mineral Resource notes: |
| · | Mineral Resources are constrained by an optimized pit shell at a metal price
of US$18.70/oz Ag and recovery of 90% Ag. |
| · | COG is 45 g/t Ag. |
| · | Mineral Resources are reported inside the AMC claim boundary. |
| · | Pit optimization allows waste to extend outside the AMC to the NE and SW. |
| · | Drilling results up to 31 December
2020. |
| Source: AMC Mining Consultants (Canada) Ltd., 2022. |
For future Mineral Resource modelling
the following should be considered:
| · | At the next update of the model include all remaining drill data which missed the closing date. |
| · | Incorporate geometallurgical attributes into the block model. |
| · | Verify mined-out volumes by surveying historical waste dumps. |
| · | Conduct structural analysis of available data and complete initial structural
/ geotechnical drilling as required. |
| · | Update the 3D geological model to include detailed geology – deposit
oxidation domaining and structures. |
| Silver Sand Project Pre-Feasibility Study |
| | New Pacific Metals Corp. | 0723071 |
The Silver Sand deposit, as currently
defined, remains open for expansion at depth. While it is understood that engineering work for the pre-feasibility study is based on the
current block model, it is recommended that future drilling on the deposit should consider the following:
| · | Infill
drilling to upgrade areas of high-grade mineralization within the current Inferred resource
area. |
| · | Additional
drilling around the current Mineral Resources, where the deposit remains open at depth. |
The QP also notes that there has
been no modern district scale exploration outside of Silver Sand deposit. It is recommended that additional drilling be completed at the
other prospects to assess for the potential for Mineral Resources.
| Silver Sand Project Pre-Feasibility Study |
| | New Pacific Metals Corp. | 0723071 |
| 15 | Mineral Reserve estimates |
| 15.1 | Mineral Reserve estimates |
Open pit life-of-mine (LOM) plans
and resulting open pit Mineral Reserves are determined based on a silver price of US$23/oz Ag. Reserves stated in this report are dated
effective as of 19 June 2024. The mine design and Mineral Reserve estimate have been completed to a level appropriate for pre- feasibility
studies.
The ore material is converted from
Mineral Resource to Mineral Reserve based primarily on positive cash flow pit optimization results, pit design, and geological classification
of Measured and Indicated resources. The in-situ value is derived from the estimated grade and certain modifying factors.
The Silver Sand project will be
mined using a conventional open pit mining method, utilizing 115 t hydraulic backhoe excavators and haulage by off-highway 72 t capacity
rear dump haul trucks. Mining is anticipated to be completed by a contract mining company. The majority of the excavated material will
require drilling and blasting. Drilling and blasting is performed on 10 m benches. Flitch height is variable depending on the material
being mined. Overburden and waste will be mined in 5 m flitches and ore is to be mined in 3.3 m flitches. Ore will be hauled to a crusher
or to run-of- mine (ROM) stockpiles. Waste will be hauled to external and in-pit waste rock dumps.
The open pit Mineral Reserves are
reported within a pit design based on open pit optimization results. The Mineral Reserves represent the economically mineable part of
Measured and Indicated Mineral Resources and are presented in Table 15.1.
| Table 15.1 | Mineral Reserve estimate as of 19 June 2024 |
| |
Tonnes (Mt) |
Ag (g/t) |
Ag (Moz) |
| Proven |
15.09 |
121 |
58.84 |
| Probable |
36.92 |
98 |
116.58 |
| Proven & Probable |
52.01 |
105 |
175.42 |
Notes:
| · | CIM Definition Standards (2014) were used for reporting the Mineral Reserves. |
| · | The Qualified Person is Wayne Rogers, P.Eng. of AMC Mining Consultants (Canada) Ltd. |
| · | Cut-off grade of 27 g/t Ag for material inside the AMC, and 29 g/t Ag
outside the AMC limit based on operating costs of 16.71 US$/t of ore, 91% Ag metallurgical recovery, 0.50 US$/oz Ag treatment and
selling costs, 6% royalty within AMC, 12% royalty outside
AMC, and 99.00% payable silver. |
| · | Ag price assumed is US$23.00 per troy ounce. |
| · | Mineral Reserves include dilution and mining recovery. |
| · | Reserves are converted from Resources through the process of pit optimization,
pit design, production schedule, and supported by a positive cash flow model. |
| · | The totals may not sum due to rounding. |
| · | Probable Mineral Reserves are based on Indicated Mineral Resources only. |
| · | Proven Mineral Reserves are based on Measured Mineral Resources only. |
| · | Ag metal (Moz) represents contained
metal. |
Source: AMC Mining Consultants (Canada) Ltd., 2024.
The majority of the Mineral Reserves
lie within the AMC claim boundary. There is not a reporting restriction to within the AMC claim boundary as an agreement has been reached
with COMIBOL regarding the surrounding MPC. Table 15.2 shows the split of the Mineral Reserve within the AMC boundary and outside the
boundary.
| Silver Sand Project Pre-Feasibility Study |
| | New Pacific Metals Corp. | 0723071 |
| Table 15.2 | Mineral Reserves within and
outside the AMC |
| Resource category |
Inside AMC boundary |
Outside AMC boundary |
| Tonnes (Mt) |
Ag (g/t) |
Ag (Moz) |
Tonnes (Mt) |
Ag (g/t) |
Ag (Moz) |
| Proven |
14.79 |
122 |
57.86 |
0.30 |
99 |
0.97 |
| Probable |
33.08 |
99 |
105.04 |
3.85 |
93 |
11.54 |
| Proven & Probable |
47.86 |
106 |
162.90 |
4.15 |
94 |
12.52 |
Source: AMC Mining Consultants (Canada) Ltd.,
2024.
To convert Mineral Resources to Mineral Reserves, the following
process was applied to Measured and Indicated Mineral Resources, and is described in more detail in Section 16:
| · | Determination
of cut-off grades based on metal prices and costs, processing costs and metallurgical recoveries,
incremental ore mining costs, and general and administration costs. |
| · | Selection
of an appropriate mining dilution and mining recovery method to convert the resource block
model into a mining block model. |
| · | Definition
of ultimate and interim pit shells using the pseudoflow algorithm as implemented in GEOVIA
Whittle software. |
| · | Design
of ultimate and staged pit designs based on the selected pit shells, geotechnical, and operational
mining considerations. |
| · | Derivation
of a mine plan based on the pit designs, mining equipment operational constraints, and productive
capacities by material type to achieve mill feed targets and associated material movement. |
| · | Derivation
of mining costs based on the mine plan. |
| · | Economic
evaluation of the mine plan as presented in Section 22. |
The cut-off grade applied for reporting
the Mineral Reserves is 27 g/t Ag within the AMC and 29 g/t Ag outside the AMC. Assumptions made to derive the COG included mining costs,
processing costs and metallurgical recoveries. Table 15.3 summarizes the calculation of the open pit cut-off grade for the Silver Sand
project. Inputs were either based on contractor quotes, derived from the 2023 PEA, or provided by New Pacific. The overall pit slopes
used for the pit optimization were based on the Itasca (2023) Geotechnical and Hydrogeological Study for PFS Silver Sand Project and range
from 45° to 47°. This includes allowances for ramps and geotechnical catch benches.
| Silver Sand Project Pre-Feasibility Study |
| | New Pacific Metals Corp. | 0723071 |
| Table 15.3 | Cut-off grade
input parameters and calculations for Mineral Reserves |
| Input |
Unit |
Value |
| Silver price |
$/oz Ag |
23 |
| Silver metallurgical recovery |
% |
91 |
| Payable silver |
% |
99 |
| Selling & transport costs |
$/oz Ag |
0.50 |
| Mining cost |
$/t mined |
2.00 |
| Incremental mining cost |
$/t mined / 10 m bench |
0.04 |
| Process cost |
$/t ore mined |
14.20 |
| TSF operating cost |
$/t ore mined |
0.65 |
| G&A cost |
$/t ore mined |
1.86 |
| Royalty |
% (inside AMC / outside AMC) |
6 / 12 |
| Cut-off grade |
Ag g/t (inside AMC / outside AMC) |
27 / 29 |
Notes:
| ● | TSF
cost refers to Tailings Storage Facility costs. |
| ● | G&A
cost refers to General and Administration costs. |
Source:
AMC Mining Consultants (Canada) Ltd., 2024.
| 15.4 | Mining dilution and recovery factors |
In the process of estimating the
Mineral Reserves, dilution and mining recovery factors were applied to the Mineral Resource using a block model regularization process.
The resource block model used as
a basis for the study was ag_sand_mod_2022_fin.dm and created by AMC for the 2023 Silver Sand PEA. The model was a rotated sub-cell model
with parent cell dimensions of 5 m x 10 m x 5 m.
Prior to the regularization process,
the mined-out blocks were removed from the resource model to prevent additional dilution in the regularized model.
AMC Consultants regularized the
resource model to a uniform size of 5 m x 5 m x 5 m to better reflect the minimum parcel size that can selectively be mined. This block
size is considered appropriate for the backhoe excavator loading units anticipated to be used by the mining contractor. The parent cell
size of the regularized model is unchanged in the X and Z directions and split in half in the Y direction. Sub-celling is maintained at
the surface topography and along mined-out boundaries.
Globally, the metal content in
the sub-cell resource model and the regularized model is the same. However, the distribution between resource categories changes slightly
after the regularization due to the resource category with the maximum volume is selected.
The average dilution and mining recovery factors are tabulated in Table 15.4.
| Table 15.4 | Mining dilution and recovery parameters |
| Input |
Unit |
Value |
| Recovery |
% |
92 |
| Dilution |
% |
10 |
Source: AMC Mining Consultants (Canada) Ltd.,
2024.
| Silver Sand Project Pre-Feasibility Study |
| | New Pacific Metals Corp. | 0723071 |
To achieve the projected dilution, the following operational
recommendations are proposed:
| ● | Diligent
and experienced grade control and sampling personnel are employed. |
| ● | Rapid
turn-around of grade control assays. |
| ● | Timely
feedback of assay data into mine planning activities. |
| ● | Blast
control and monitoring of blast movement are utilized. |
| 15.5 | Open pit optimization |
The economic pit optimization for the
Silver Sand project was conducted using GEOVIA Whittle 4.8.0. The mining block model used for the pit optimization was prepared
using Datamine™ software and is based on the resource geological model.
Slope angles for the pit optimization
were based on “PPT-682.002.03-Recommended IRAk Stage 2-R0.pdf” (Itasca, 2023), with adjustments to allow for haulage ramps
in the designs. Overall pit slope angles vary by slope domain, ranging from 45° to 47°. This includes allowances for ramps and
geotechnical catch benches. See Table 15.5 for the different slope domains, and Section 16.3 for additional information regarding geotechnical
considerations.
| Table 15.5 | Slope angles for
pit optimization |
| Azimuth (°) |
Overall slope angle (°) |
| 0 – 110 |
47 |
| 110 – 250 |
45 |
| 250 – 360 |
47 |
Source: AMC Mining Consultants
(Canada) Ltd., 2024.
The pseudoflow pit optimization
algorithm, as implemented in GEOVIA Whittle software, was used to determine the ultimate pit shell for Silver Sand. The pseudoflow algorithm
achieves the same result as the Lerchs-Grossman algorithm but is more computationally efficient. All economic inputs used in the pit optimization
follow Table 15.3. The pit optimization was not constrained to the AMC limit and community limits.
The results of the pit optimization
are summarized in Table 15.6 and Figure 15.1. These results are based on the pit shells produced during the optimization.
The graph in Figure 15.1 shows indicative
discounted pit values for each revenue factor (RF) in terms of “best case”, “worst case”, and undiscounted values.
The best case gives the maximum indicative discounted value and requires that each shell be mined sequentially. The indicative value calculated
for the best case is theoretical and cannot be practically achieved for an optimization conducted in small revenue factor increments because
there is not enough horizontal width between mining phases to practically mine them. The worst case assumes that the deposit is mined
on a bench-by-bench basis across all shells and gives the lowest discounted value. Discounted values are based on a discount rate of 8%
per year.
The pit optimization was conducted
on a direct-feed basis for processing and without a pre-production period restriction. Discounted values were estimated using a fixed
processing throughput limit of 4.0 Mtpa. Since the Silver Sand project is planned to be a contractor-run operation, the owner will not
be required to purchase a mining fleet and is not anticipating additional costs for minor changes to the mining rate, aside from the variable
cost paid to the contractor. Capital costs were not considered in the optimization process because they are not expected to vary materially
for the selection of the ultimate pit.
| Silver Sand Project Pre-Feasibility Study |
| | New Pacific Metals Corp. | 0723071 |
| Table 15.6 | Pit optimization results |
| Pit shell |
Revenue factor |
Indicative disc. value |
Undiscounted
value |
Ore
tonnes |
Waste
tonnes |
Total
tonnes |
Strip
ratio |
Ag process feed
grade |
Incremental mining
cost |
Incremental disc. value
of ore |
| Best case |
Worst case |
| - |
- |
US$ M |
US$ M |
US$ M |
kt |
kt |
kt |
t:t |
g/t |
US$/t of ore |
US$/t of ore |
| 1 |
0.10 |
11.5 |
11.5 |
11.5 |
60 |
37 |
97 |
0.6 |
348.6 |
0.00 |
0.00 |
| 2 |
0.15 |
42.4 |
42.4 |
42.7 |
348 |
358 |
707 |
1.0 |
234.3 |
4.39 |
214.11 |
| 3 |
0.20 |
106.5 |
106.5 |
109.1 |
1,239 |
1,504 |
2,744 |
1.2 |
178.5 |
4.72 |
143.93 |
| 4 |
0.25 |
387.2 |
387.0 |
425.5 |
6,419 |
10,592 |
17,011 |
1.7 |
144.6 |
5.84 |
108.33 |
| 5 |
0.30 |
738.2 |
727.5 |
883.6 |
15,326 |
31,665 |
46,992 |
2.1 |
131.9 |
7.06 |
77.62 |
| 6 |
0.35 |
910.6 |
885.1 |
1,141.0 |
21,366 |
45,190 |
66,555 |
2.1 |
125.2 |
6.88 |
54.65 |
| 7 |
0.40 |
1,009.0 |
970.4 |
1,304.4 |
25,948 |
56,436 |
82,384 |
2.2 |
120.3 |
7.52 |
40.10 |
| 8 |
0.45 |
1,190.5 |
1,120.0 |
1,658.1 |
36,275 |
94,695 |
130,971 |
2.6 |
114.6 |
10.49 |
32.06 |
| 9 |
0.50 |
1,276.9 |
1,188.3 |
1,854.8 |
43,408 |
120,800 |
164,208 |
2.8 |
110.6 |
10.92 |
21.68 |
| 10 |
0.55 |
1,301.2 |
1,205.9 |
1,914.7 |
45,763 |
130,916 |
176,679 |
2.9 |
109.5 |
12.97 |
17.78 |
| 11 |
0.60 |
1,321.3 |
1,218.8 |
1,967.4 |
48,253 |
142,344 |
190,597 |
2.9 |
108.2 |
13.56 |
13.23 |
| 12 |
0.65 |
1,331.5 |
1,223.8 |
1,994.2 |
49,626 |
150,250 |
199,875 |
3.0 |
107.6 |
16.48 |
11.12 |
| 13 |
0.70 |
1,338.4 |
1,225.9 |
2,013.5 |
50,788 |
157,795 |
208,582 |
3.1 |
107.1 |
18.49 |
7.75 |
| 14 |
0.75 |
1,343.6 |
1,225.2 |
2,028.8 |
51,844 |
166,599 |
218,443 |
3.2 |
106.7 |
22.08 |
4.28 |
| 15 |
0.80 |
1,347.0 |
1,224.6 |
2,038.4 |
52,714 |
173,799 |
226,514 |
3.3 |
106.3 |
22.76 |
3.17 |
| 16 |
0.85 |
1,349.3 |
1,222.9 |
2,044.9 |
53,534 |
180,529 |
234,063 |
3.4 |
105.8 |
22.76 |
0.73 |
| 17 |
0.90 |
1,350.5 |
1,220.5 |
2,048.4 |
54,075 |
186,018 |
240,092 |
3.4 |
105.6 |
27.63 |
-2.33 |
| 18 |
0.95 |
1,351.3 |
1,216.7 |
2,051.2 |
54,921 |
193,798 |
248,719 |
3.5 |
105.1 |
25.42 |
-3.43 |
| 19 |
1.00 |
1,351.4 |
1,213.9 |
2,051.7 |
55,250 |
197,657 |
252,907 |
3.6 |
105.0 |
30.57 |
-8.21 |
| 20 |
1.05 |
1,351.0 |
1,204.3 |
2,050.8 |
55,998 |
206,670 |
262,668 |
3.7 |
104.5 |
29.32 |
-13.48 |
| 21 |
1.10 |
1,350.6 |
1,200.4 |
2,049.5 |
56,359 |
211,577 |
267,936 |
3.8 |
104.4 |
34.62 |
-11.87 |
| 22 |
1.15 |
1,349.6 |
1,191.7 |
2,046.5 |
56,902 |
218,668 |
275,569 |
3.8 |
104.0 |
31.92 |
-17.91 |
| 23 |
1.20 |
1,348.7 |
1,186.5 |
2,044.0 |
57,242 |
223,190 |
280,432 |
3.9 |
103.8 |
33.67 |
-17.63 |
| 24 |
1.25 |
1,346.2 |
1,174.6 |
2,036.1 |
57,923 |
235,306 |
293,229 |
4.1 |
103.6 |
43.70 |
-21.30 |
| 25 |
1.30 |
1,345.2 |
1,169.4 |
2,033.2 |
58,168 |
239,111 |
297,279 |
4.1 |
103.4 |
37.43 |
-25.04 |
| 26 |
1.35 |
1,343.3 |
1,160.3 |
2,027.1 |
58,559 |
246,597 |
305,157 |
4.2 |
103.2 |
44.87 |
-28.16 |
| 27 |
1.40 |
1,339.1 |
1,152.1 |
2,013.6 |
59,391 |
258,899 |
318,290 |
4.4 |
102.8 |
42.26 |
-14.87 |
| 28 |
1.45 |
1,337.9 |
1,148.5 |
2,009.6 |
59,618 |
262,441 |
322,059 |
4.4 |
102.6 |
41.81 |
-21.28 |
Source: AMC Mining Consultants (Canada) Ltd.,
2024.
| Silver Sand Project Pre-Feasibility Study |
| | New Pacific Metals Corp. | 0723071 |
| Figure 15.1 | Pit optimization results |
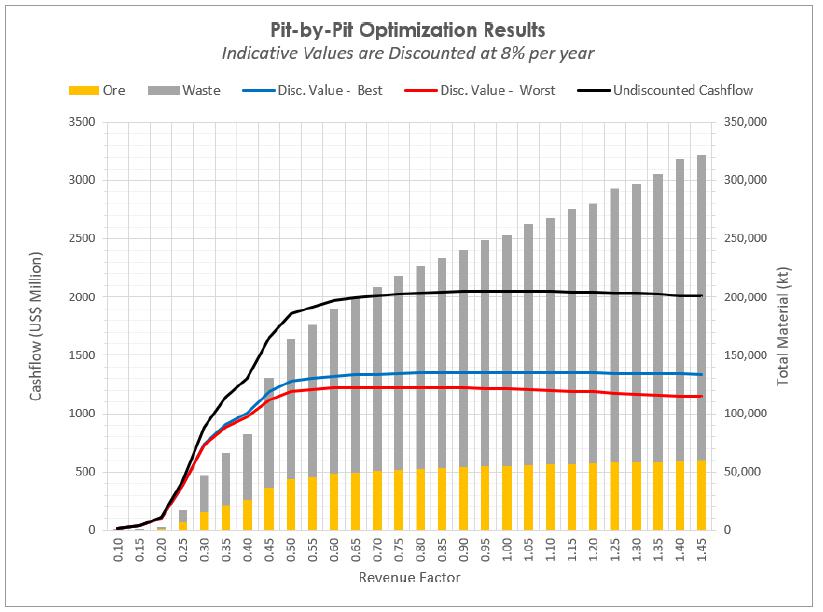
Source: AMC Mining Consultants (Canada) Ltd.,
2024.
Pit shell 17 (RF 0.90) was selected to guide the ultimate
pit design, with the following justification:
| ● | The
RF 0.90 shell satisfies New Pacific’s objective of maximizing ore tonnes. |
| ● | The
incremental discounted value per tonne of ore is negative beyond the RF 0.9 shell. |
| ● | The
RF 0.90 shell contains 98% of the ore tonnes in the RF
1.0 shell and 6% less waste material. |
An ultimate pit was designed using
the GEOVIA Whittle optimization shells as a guide. The ultimate pit has been divided into eight phases; refer to Section 16 for a detailed
description of the phasing plan. Figure 15.2 presents the final pit geometry used to report the Mineral Reserve.
| Silver Sand Project Pre-Feasibility Study |
| | New Pacific Metals Corp. | 0723071 |
| Figure 15.2 | Final pit geometry |
Source: AMC Mining Consultants (Canada) Ltd.,
2024.
| 15.7 | Items impacting Mineral Reserves |
The Qualified Person is not aware of any mining, metallurgical,
infrastructure, permitting, environmental, political or other factors that may materially affect the current Mineral Reserves.
| Silver Sand Project Pre-Feasibility Study |
| | New Pacific Metals Corp. | 0723071 |
Silver Sand comprises of one Main
Pit split into eight phases (MP1, MP2, MP3, MP4, MP5, MP6, MP7, and MP8). Silver Sand will be mined using a conventional open pit approach
of drilling and blasting ore and waste rock, with material mined by hydraulic excavators loading into off-highway rear dump haul trucks.
Ore will be hauled directly to the primary crusher or to the run-of-mine (ROM) ore pad located adjacent to the ore processing plant. Waste
will be hauled to ex-pit waste rock dumps. When possible, waste rock will be backfilled into the mined-out pit void once mining has progressed
sufficiently to allow this activity to be completed safely.
| 16.2 | Hydrogeological and hydrological considerations |
AMC Consultants engaged Hydrotechnica
Ltd (Hydrotechnica) to review hydrology and hydrogeology studies prepared by P.C.A. Ingenieros Consultores S.A. and Itasca Chile SpA (Itasca),
respectively. AMC Consultants has adopted the findings of Hydrotechnica for this Technical Report, and for which the QP accepts responsibility.
The following information was reviewed:
| ● | Itasca
(April 2024) Geotechnical and Hydrogeological Study for PFS Silver Sand Project. |
| ● | Itasca,
October 2022. Hydrological and hydrogeological conceptual study – Silver Sand Project.
ITASCA-INF-682.002.01. |
| ● | P.C.A.
Ingenieros Consultores S.A., March 2023. DISEÑO PRELIMINAR “PRESA MACHACAMARCA”,
INFORME FINAL. |
| 16.2.1 | Hydrology and surface water management |
Hydrotechnica reviewed rainfall
data from the Tacobamba and Machacamarca weather stations and evaporation data from the Machacamarca basin, as presented in the report
completed by P.C.A. This data was used to estimate effective daily rainfall and indicate an annual wet season of approximately four months.
To predict the maximum amount of rainfall that could occur in a 24-hour period, an extreme rainfall analysis was conducted using frequencies
of 25, 50, 100, 500, and 1000 years.
Diversion channels will be located
up-slope of the open pit mining areas to intercept surface water run-off and direct it towards natural drainage channels. Open pit catchment
areas, presented in Table 16.1, were estimated using the pit phase designs and a digital terrain model. These estimates were used to calculate
pumping requirements. Catchment areas and diversion channels are presented in Figure 16.1, Figure 16.2, and Figure 16.3.
| Table 16.1 | Open pit catchment areas and corresponding diversion channels |
| Pit |
Catchment area (m2) |
Diversion channel ID |
| Pit 1 (MP1) |
n/a |
Pit 1 |
| Pit 2 (MP2) |
130,292 |
Pit 2, 3,4 & 6 |
| Pit 3 (MP3) |
105,793 |
Pit 2, 3,4 & 6 |
| Pit 4 (MP4) |
62,004 |
Pit 2, 3,4 & 6 |
| Pit 5 (MP5) |
155,782 |
Pit 5 U & 5 L |
| Pit 6 (MP6) |
592,623 |
Pit 2, 3,4 & 6 |
| Pit 7 (MP7) |
343,955 |
Pit 7 |
| Pit 8 (MP8) |
786,367 |
Pit 8 |
Source: Hydrotechnica, 2024.
| Silver Sand Project Pre-Feasibility Study |
| | New Pacific Metals Corp. | 0723071 |
| Figure 16.1 | Surface water catchments for
MP2, MP3, MP4, and MP5 |
Source: Hydrotechnica, 2024.
| Figure 16.2 | Surface water catchments for
MP6 and MP7 |
Source: Hydrotechnica, 2024.
| Silver Sand Project Pre-Feasibility Study |
| | New Pacific Metals Corp. | 0723071 |
| Figure 16.3 | Surface water catchments for MP7 and MP8 |
Source: Hydrotechnica, 2024.
MP1 will be free draining
(cut into the slope and open down gradient). Sumps will be required in all other phases. To estimate pumping requirements, a one-in-25-year,
24-hour duration rainfall event was applied to each of the open pit catchment areas with an 80% “run-off coefficient” (to
allow for 20% infiltration and evaporation). A pumping capacity of 15,000 m3/day and
a drawdown period of five days were assumed. The estimated pumping requirements are summarized in Table 16.2.
| Table 16.2 | Estimated pumping requirements |
| Catchment |
Daily volume (1 in 25 year, 24-hour event) |
Typical pump capacity (m3/day) |
Number of pumps |
| Pit 2 |
57,855 |
15,000 |
1.0 |
| Pit 3 |
46,976 |
15,000 |
1.0 |
| Pit 4 |
27,532 |
15,000 |
1.0 |
| Pit 5 |
69,173 |
15,000 |
1.0 |
| Pit 6 |
263,148 |
15,000 |
4.0 |
| Pit 7 |
152,730 |
15,000 |
3.0 |
| Pit 8 |
349,178 |
15,000 |
5.0 |
Source: Hydrotechnica, 2024.
| 16.2.2 | Hydrogeology and groundwater management |
At the time of Hydrotechnica’s
review, no site-specific hydrogeological data was available. Three boreholes were installed with standpipe piezometers to measure a deep-water
table, located between approximately 3910 – 4020 metres above sea level.
Water table contour maps are presented
by Itasca for two aquifer systems: shallow and deep. Itasca notes there is uncertainty in the contours of the shallow system.
| Silver Sand Project Pre-Feasibility Study |
| | New Pacific Metals Corp. | 0723071 |
The level of the contours, approximately
50 m below ground level suggests an aquifer in the shallow fractured rock, potentially compartmentalized by faults. However, there are
numerous springs, particularly to the north and west of Main Pit 4 (MP4), suggesting a shallower groundwater system. The source of water
in the nearby springs and wetlands is not known, some of the springs appear associated with the shallow alluvial-colluvial system, while
others may issue at geological contacts or structures in the fresh rock.
Itasca refers to published literature
values for a potential range in hydraulic conductivity (the key hydraulic property) for three “domains”:
| ● | UH,
the alluvial system which comprises alluvium, colluvium, and glacial deposits. The hydraulic
conductivity range assigned is 10 to 100 m/d. |
| ● | UH2,
the relatively shallow Tarapaya Formation and Breccia Diatreme, which geotechnical logging
shows to have an average RQD of 66%, equivalent to a ‘fair’ rock quality designation.
The hydraulic conductivity range assigned is 1.0 to 0.1 m/d; and, |
| ● | The
remaining fresh rock underlies the Tarapaya formation where present and extends to depth
across the project area. Geotechnical logging shows this domain to have an average RQD of
86%, equivalent to a “good” rock quality designation. The hydraulic conductivity
range assigned is 0.01 to 0.0001 m/d. |
Itasca presents a basic estimate
of groundwater inflow to the open pits using the hydraulic gradient from the stand-pipe piezometers (0.5) and a hydraulic conductivity
of 0.005 m/d. Inflow is not considered from the alluvial system (UH1) nor the Tarapaya Formation (UH2). The inflow estimate for MP4 is
9.6 L/s. This is very low and would likely be managed by a combination of evaporation and sump pumping. Higher inflows are likely from
discrete permeable horizons, such as the north-south orientated geological structures.
Dewatering boreholes (and a hydraulic
curtain) are not considered appropriate for the PFS based on the inflows predicted by Itasca. Instead, horizontal drain holes are recommended
for depressurization.
Hydrotechnica recommends the following
steps be taken to further develop an understanding of the hydrological and hydrogeological parameters impacting the Silver Sand project:
| ● | Review
of drillhole records and geological data for improved conceptual understanding of the shallow
groundwater system. |
| ● | Sampling
of the springs and wetland to the north and west of the Main Pit. |
| ● | Shallow
drilling (auger or diamond drilling) to install shallow piezometers and prove the depth of
the colluvial system, and whether it supports a water table upstream of the springs and within
the wetland area. |
| ● | Permeability
testing of the existing standpipe piezometers. |
| ● | Construction
of a trial dewatering borehole in the alluvial deposits of the main river channel to investigate
its hydrogeological properties and allow for a targeted dewatering strategy, if required. |
| ● | Construction
of at least one trial dewatering borehole into a major fault structure and surrounding piezometer
array to investigate fault properties and surrounding fracture connectivity. |
| ● | The
installation of multi-level vibrating wire piezometers is recommended to improve the understanding
of the hydrogeological system. The following targets are recommended: |
| ¾ | At least one major and one
local fault structure; |
| Silver Sand Project Pre-Feasibility Study |
| | New Pacific Metals Corp. | 0723071 |
| ¾ | The shallow aquifer system in hill-slope colluvium (further to positive
results from exploratory drilling); |
| ¾ | The Tarapaya Formation (where saturated); |
| ¾ | UH3 orthogonal to the existing standpipe piezometers for triangulation
of groundwater pressure; and, |
| ¾ | UH3 north and south of the river. |
| 16.3 | Geotechnical considerations |
The QP has reviewed the geotechnical
work completed for the open pit and adopted the findings for this Technical Report. The following information was provided to support
the QP’s, findings and conclusions:
| ● | Itasca
(April 2024) Geotechnical and Hydrogeological Study for PFS Silver Sand Project. |
| ● | Itasca
(October 2022) Hydrological and Hydrogeological Conceptual Study – Silver Sand Project. |
| ● | Itasca
(May 2023) PPT-682.002.04 – Preliminary Recommendation of Inter-ramp Angles for Silver
Sand Open Pit. |
| ● | Core
photographs of 2022 geotechnical drillholes. |
| ● | Drillhole
historical data. |
| 16.3.1 | Geotechnical investigation |
Geotechnical investigations completed
to support the geotechnical assessments for the PFS include:
| ● | Historical
drilling and logging from the 2017 and 2022 programs. In the 2022 geotechnical campaign,
there were 15 geotechnical drillholes of 2,650 metres completed for geotechnical data collection.
Most of the core logging includes geological parameters, RQD, and basic geotechnical features
such as core recovery and fracture count. |
| ● | Oriented
drill core measurements of historical geological drilling campaigns and the 2022 geotechnical
campaign. |
| ● | Laboratory
testing of typical intact rock units. For the PFS study, 52 Uniaxial Compressive Strength
(UCS) tests, 63 Triaxial Compressive Strength (Tx) tests, and 50 Tensile Strength (Ti) tests
have been undertaken. |
| 16.3.2 | Rock mass characterization |
| 16.3.2.1 | Geotechnical domain |
The rock mass at Silver Sand was
divided into five geotechnical domains based on the lithology domains. Table 16.3 presents the geotechnical domains and their correlation
with the lithological units for the pit and areas within 150 m away from the pit. Figure 16.4 shows the spatial distribution of the geotechnical
domains over the pre-mining topography.
Table 16.3
Geotechnical domains and their correlation with lithological units
| Lithology |
Description |
Geotechnical domain |
| SSdOtl-BHY |
Breccia Diatreme |
UG1 |
| SsdOtl-HEM, SSdTar-SSN |
La Puerta Formation Sandstone – Nodular |
UG2 |
| SsdLap-SSM |
La Puerta Formation Sandstone – Massive |
UG3 |
| SsdLap-SSS-SSX |
La
Puerta Formation Sandstone – Dune Cross Bedded, Sandstone Streaky |
UG4 |
| SSTar-SLT-SST |
Tarapaya Formation Siltstone (Upper) – Sandstone (Upper) |
UG5 |
Source: Itasca, 2024.
| Silver Sand Project Pre-Feasibility Study |
| | New Pacific Metals Corp. | 0723071 |
| Figure 16.4 | Spatial
distribution of the geotechnical domains (left: isotropic view, right: plan view) |
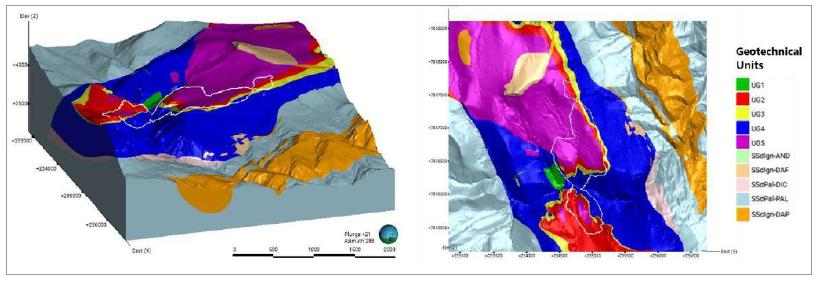
Source: Itasca, 2024.
The structural model developed for
the PFS contains two regional faults, 14 local faults, and more than 50 minor faults, as shown in Figure 16.5.
| Figure 16.5 | Structural
model (blue: regional; red: local; green: minor) |
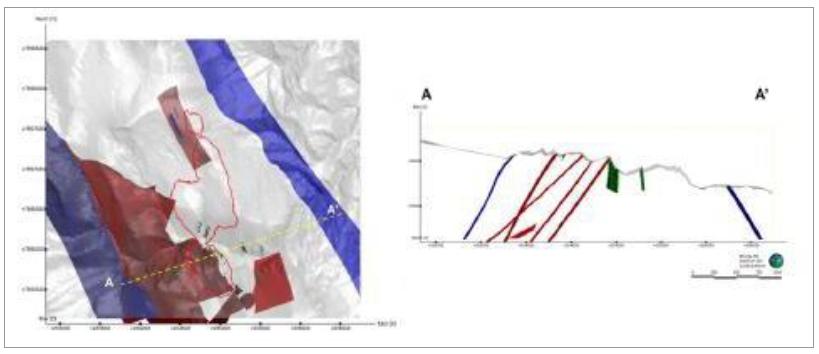
Source: Itasca, 2024.
Based on stereographic analysis
of oriented structural data, a total of three structural domains have been defined for the Silver Sand project. Table 16.4 presents the
structural domains and their correlation with the lithological units for the pit. Figure 16.6 shows the spatial distribution of the structural
domains over the pre-mining topography.
| Silver Sand Project Pre-Feasibility Study |
| | New Pacific Metals Corp. | 0723071 |
| Table 16.4 | Structural domains and their
correlation with lithological units |
| Lithology |
Structural domain |
| SsdLap-SSM |
UG3 |
| SsdOtl-HEM SSdTar-SSN |
Dom2 |
| SSTar-SLT-SST |
| SsdLap-SSS-SSX |
Dom3 |
| SSdOtl-BHY |
Source: Itasca, 2024.
| Figure 16.6 | Spatial distribution
of the structural domains (left: isotropic view, right: plan view) |
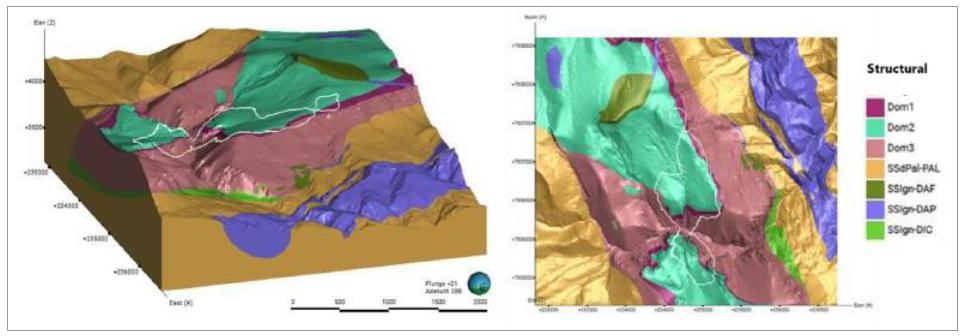
Source: Itasca, 2024.
Table 16.5 presents the mean sets
identified for each domain, the sets for each domain are primarily sub-vertical, with preferential dip directions from NNW to NNE and
with small variations among domains.
| Silver Sand Project Pre-Feasibility Study |
| | New Pacific Metals Corp. | 0723071 |
| Table 16.5 |
Mean sets for each structural domain |
| Domain |
Type |
Set |
Dip (°) |
Dip direction (°) |
|
Dom1 |
Joints |
J1 |
89 |
81 |
| J2 |
82 |
115 |
| J3 |
83 |
233 |
| J4 |
78 |
319 |
|
Faults |
F1 |
85 |
82 |
| F2 |
80 |
253 |
| F3 |
80 |
225 |
| F4 |
84 |
121 |
|
Dom2 |
Joints |
J1 |
89 |
253 |
| J2 |
83 |
97 |
| J3 |
81 |
125 |
| J4 |
82 |
229 |
|
Faults |
F1 |
84 |
87 |
| F2 |
80 |
253 |
| F3 |
83 |
121 |
| F4 |
82 |
256 |
| F5 |
18 |
256 |
|
Dom3 |
Joints |
J1 |
86 |
254 |
| J2 |
85 |
112 |
| J3 |
87 |
93 |
| J4 |
79 |
225 |
|
Faults |
F1 |
87 |
112 |
| F2 |
78 |
84 |
| F3 |
80 |
260 |
| F4 |
82 |
136 |
| F5 |
78 |
333 |
Source: Itasca, 2024.
| 16.3.2.3 | Laboratory testing |
Table 16.6 shows a summary
of tests and meters logged in the 2020 geotechnical campaign. The 35th percentile strength
properties were used to develop the failure envelope for each domain. Figure 16.7 presents the test results and the Hoek-Brown failure
envelope for each geotechnical domain.
| Table 16.6 |
Geotechnical domains and their correlation with lithological units |
| Geotechnical domain |
UCS |
Tx |
Ti |
Metres logged |
| UG1 |
4 |
6 |
3 |
99 |
| UG2 |
9 |
15 |
7 |
425 |
| UG3 |
10 |
16 |
9 |
234 |
| UG4 |
17 |
29 |
16 |
1460 |
| UG5 |
12 |
17 |
15 |
426 |
Source: Itasca, 2024.
| Silver Sand Project Pre-Feasibility Study |
| | New Pacific Metals Corp. | 0723071 |
| Figure 16.7 |
Test results
and the Hoek-Brown failure envelope for each geotechnical domain |
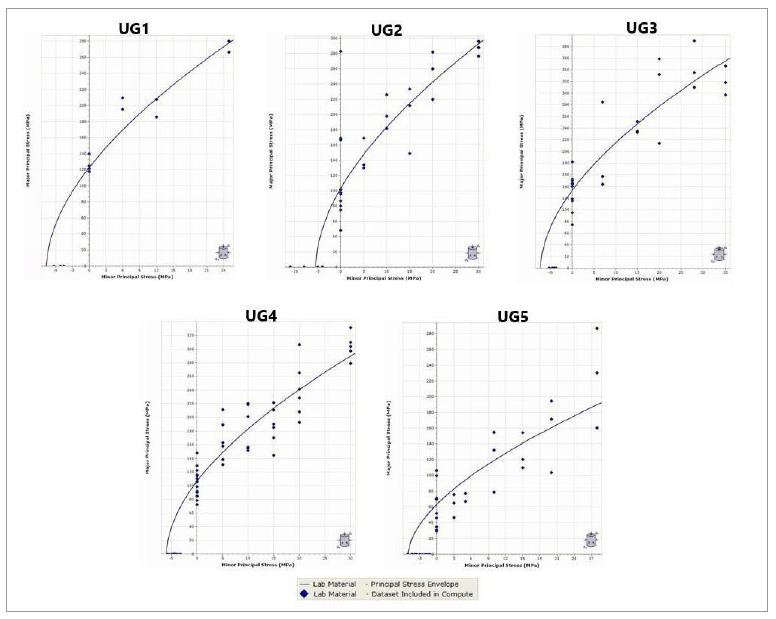
Source: Itasca, 2024.
No Young’s modulus or Poisson’s ratio have been
obtained from the UCS tests. No tests have been undertaken to obtain shear strength parameters of typical joints or faults.
| 16.3.2.4 | Rock mass classification |
RQD values of core intervals were collected in core logging.
Table 16.7 summarizes the mean and average RQD values for each domain.
| Table 16.7 |
RQD values for
each domain |
| Geotechnical domain |
RQD median |
RQD average1 |
| UG1 |
70 |
66 |
| UG2 |
90 |
85 |
| UG3 |
93 |
87 |
| UG4 |
92 |
86 |
| UG5 |
73 |
66 |
Note: 1Derived from Itasca conceptual
study.
| Silver Sand Project Pre-Feasibility Study |
| | New Pacific Metals Corp. | 0723071 |
Other geotechnical parameters of
RMR or Q system were not recorded / collected. The Geological Strength Index (GSI) was estimated by Itasca using the quantitative approach
proposed by Cai et al. (2004), as shown in Figure 16.8 It remains unclear how the parameters of joint spacing and joint surface conditions
(roughness, weathering, and infilling) are determined.
| Figure 16.8 |
Boxplot of GSI or each geotechnical domain |
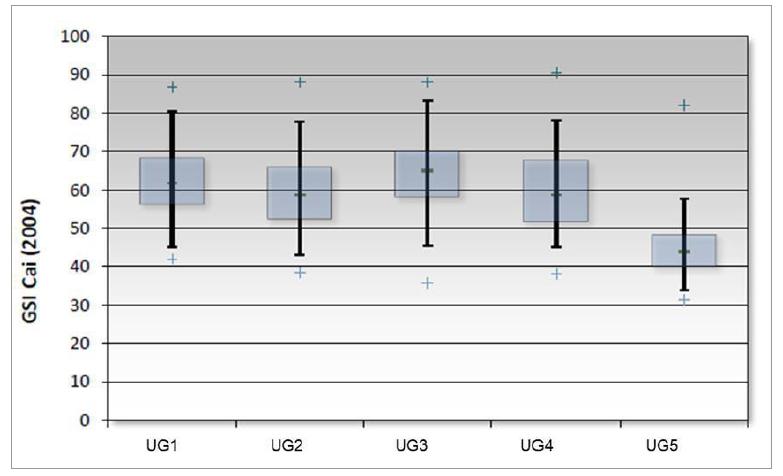
Source: Itasca, 2024.
Overall, the data indicates generally
‘fair’ to ‘good’; rock mass conditions throughout the mining area with poorer quality rock masses being expected
in UG5 and the near-surface overburden and highly weathered zone.
| 16.3.2.5 | Strength parameters for geotechnical design |
The Hoek-Brown strength parameters
of intact rock for geotechnical design are summarized in Table 16.8.
| Table 16.8 |
Index properties and strength parameters for each domain |
| Geotechnical domain |
Density (kg/m3) |
σci P35 (MPa) |
mi P35 |
GSI P35 |
| UG1 |
2500 |
116 |
16 |
58 |
| UG2 |
2460 |
86 |
20 |
55 |
| UG3 |
2500 |
119 |
19 |
61 |
| UG4 |
2380 |
95 |
19 |
54 |
| UG5 |
2400 |
52 |
14 |
41 |
Source: Itasca, 2024.
| Silver Sand Project Pre-Feasibility Study |
| | New Pacific Metals Corp. | 0723071 |
| 16.3.3.1 | Design acceptance criteria |
The design acceptance criteria in
the PFS study are adopted based on the guidelines (Read & Stacey, 2009) for large open pit mines, and is shown in Table 16.9. Only
static conditions were assessed in the PFS study.
| Table 16.9 |
Design acceptance
criteria values (Read & Stacey, 2009) |
| Slope scale |
Consequence of failure |
Acceptance criteria |
| FOS (Min.) - Static |
FOS (Min.) - Dynamic |
PoF (Max.) |
| Bench |
Low – high |
1.1 |
- |
25% – 50% |
|
Inter-ramp |
Low |
1.15 – 1.2 |
1.0 |
25% |
| Moderate |
1.2 |
1.0 |
20% |
| High |
1.2 – 1.3 |
1.1 |
10% |
|
Overall |
Low |
1.2 – 1.3 |
1.0 |
15% – 20% |
| Moderate |
1.3 |
1.05 |
10% |
| High |
1.3 – 1.5 |
1.1 |
5% |
Notes: FOS = Factor of Safety;
PoF = Probability of Failure; values in bold are adopted FOS and PoF.
| 16.3.3.2 | Kinematic analysis |
A bench scale kinematic analyses
were conducted using commercial software KATS (Kinematic Analysis for Slopes) to estimate the potential structural failure for three primary
modes: planar, wedge, and toppling. The POF of each joint set identified in each structural domain was assessed for a design bench height
of 20 m and bench face angle of 80° under the following assumed conditions and joint properties:
| ● | A
friction angle of 30° and zero cohesion on joints. |
| ● | Joint
persistence of 15 m. |
| ● | The
70th
percentile
of the back-break. |
| ● | The
80th
percentile
of the spill length. |
The results indicate that flexural
toppling is most likely to occur due to the dominant sub-vertical trend of the joint sets. The recommended kinematic Inter-Ramp Angle
(IRAk) per domain and wall orientation is shown in Figure 16.9 The slope design recommendations
for the Silver Sand open pit are summarized in Table 16.10.
| Figure
16.9 |
Recommended IRAk for each structural domain |
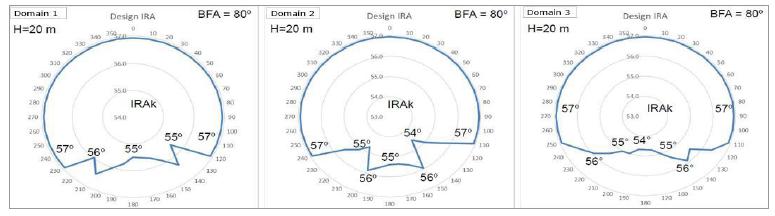
Source: Itasca, 2024.
| Silver Sand Project Pre-Feasibility Study |
| | New Pacific Metals Corp. | 0723071 |
| Table
16.10 |
Slope design recommendations |
| Domain |
Dom1 |
Dom2 |
Dom3 |
| Bench height (m) |
20 |
20 |
20 |
| BFA (deg) |
80 |
80 |
80 |
| Berm width (m) |
9.5 – 10.5 |
9.5 – 11.0 |
10.5 – 11.0 |
| IRA (deg) |
55 - 57 |
54 - 57 |
54 - 55 |
Source: Itasca, 2024.
| 16.3.3.3 | Inter-ramp stability analysis |
Inter-ramp stability analyses were
conducted using commercial software, FLAC2D, to develop a FOS design chart of the inter-ramp angle (IRArm)
controlled by rock mass strength versus inter-ramp heights for each geotechnical domain. Two scenarios (dry and wet conditions) were analyzed
under the following assumed conditions:
| ● | Maximum
IRA of 60° and maximum inter-ramp height of 200 m. |
| ● | Modelling
inputs being shown in Table 16.8, with the disturbance factor D being taken as 1.0 to account
for large production blasting. |
| ● | Groundwater
table being 25 m behind slope wall for the wet scenario. |
The results indicate that the IRArm
of 60° with the inter-ramp height of 200 m can be achieved under both dry and wet conditions for all geotechnical domains
(UG1 through UG4) except UG5, which has relatively weaker rock mass strength. For UG5, the maximum inter-ramp heights are 80 m and 75
m at IRArm of 60° for dry and wet conditions, respectively. Nevertheless, it is recommended
that the inter-ramp height be limited to 150 m or less, and a geotechnical berm of up to 25 m every 150 m be considered.
| 16.3.3.4 | Overall slope stability analysis |
In addition to the inter-ramp stability
analyses, the overall slope stability analyses have been performed for each geotechnical domain by incorporating faults which are sub-parallel
to the pit slope. Two scenarios (dry and wet conditions) were considered. A total of six sections were analyzed under the following assumed
conditions and model inputs:
| · | A
friction angle of 35° and a cohesion of 75 kPa for faults. |
| ● | Lithostatic
pre-mining stress (the horizontal stresses are equal to the vertical stress). |
| ● | The
phreatic lines for wet conditions are estimated based on hydraulic parameters selected from
literature for each hydrogeological unit. |
The results indicate that the FOS
of all sections exceeds the design criteria under both dry and wet conditions.
A geotechnical data gap analysis
has been completed by AMC Consultants to determine the data confidence level for PFS and data requirements to support a feasibility study
level geotechnical design for the Silver Sand project. The available data were evaluated based on the guidelines for the confidence level
required for geological, hydrogeological, and geotechnical data provided in Read and Stacey (2009).
| Silver Sand Project Pre-Feasibility Study |
| | New Pacific Metals Corp. | 0723071 |
The data gaps for the PFS are summarized
below:
| · | Geotechnical parameters including intact rock strength,
joint conditions, joint spacing, joint shape and roughness, weathering, and ground water condition have not been collected in geotechnical
core logging. As a result, rock mass ratings cannot be determined directly from geotechnical logging but estimated from empirical estimates.
The weathering horizon model (weathered, transitional, and fresh) has not been developed and considered in the slope stability assessment.
As a result, the BFA and IRArm could be too steep for the near-surface
overburden and weathered zone. Shear strength testing has not been undertaken on structural defects to define strength parameters of defects
in each geotechnical domain. Defects may include bedding, joints, shear, and faults. |
| · | No pumping or packer testing have been conducted
to establish initial hydrogeological parameters across all geotechnical domains. |
The results of the gap analysis
indicate several important factors that required additional work. For feasibility studies, a higher level of data confidence is required,
and the geotechnical and hydrogeological models will need to be updated with additional data. Recommended geotechnical data collection
and interpretation tasks are outlined as below:
| · | Conduct geotechnical core logging using Bieniawski’s
1989 rock mass rating. Geotechnical parameters including intact rock strength, RQD, joint conditions, joint spacing, joint shape and roughness,
weathering, and groundwater conditions should be collected in geotechnical core logging. |
| · | Geotechnical drilling programs must include orientation
of the drill core and collect structural orientation data. |
| · | Select typical samples of typical joints from geotechnical
drill cores for satellite pits and perform direct shear testing. Determine strength parameters of joints and justify design assumptions
made in the PFS. |
| · | Select typical samples of rock units from geotechnical
drill cores for satellite pits and perform UCS, Tx, and Ti testing. |
| · | Conduct packer and pumping tests to develop hydrogeological
parameters and justify design assumptions made in the PFS. |
Rock mass characterization should be updated with updated
data, including:
| · | Geotechnical domain |
| · | Structural domain |
| · | Lithological domain |
| · | Rock mass classification |
| · | Weathering horizon model |
| · | Strength parameters for geotechnical design |
| · | Hydrogeological model |
| 16.3.5 | Conclusions and recommendations |
For the PFS study, the geological
model, structural models (major and fabric), hydrogeological model, and rock mass characterization have been developed with variable levels
of confidence. The 3D geotechnical model has allowed the geotechnical design parameters to be developed. The pit design criteria are appropriate
and comply with industry norms. Methodologies used for the slope design are sound and to international standards.
| Silver Sand Project Pre-Feasibility Study |
| | New Pacific Metals Corp. | 0723071 |
There are two uncertainties for the project that should be
explored in future studies:
| · | The extent of the weathered horizon remains unknown. The geotechnical PFS
has not considered a weathered zone in the pit slope design. |
| · | The Silver Sand project is in the medium seismic hazard zone. The pit
slope stability under seismic conditions has not been assessed. |
It is recommended to develop a
weathering horizon model and collect additional geotechnical data as per Section 16.3.4 to increase the geotechnical model reliability.
Geotechnical slope design criteria should be updated when further information is available and pit slope stability should be assessed
under static and seismic conditions.
| 16.4 | Resource model for mining |
The Mineral Resource block model
used for evaluating the open pit mining potential at the Silver Sand project was ag_sand_mod_2022_fin.dm. The block model is a sub-celled,
rotated model, with parent block dimensions of 5 m in the X (east) direction by 10 m in the Y (north) direction by 5 m in the Z (vertical)
direction. The model was developed using Datamine™ software.
In the process of estimating the
Mineral Reserves, dilution, and mining recovery factors were applied to the Mineral Resource using a block model regularization process.
For more information, please refer to Section 15.4.
Details of the pit optimization
and shell selection for the ultimate pit are provided in Section 15.5 of this report.
Pit shell 17 (RF 0.90) was selected
to guide the ultimate pit design, with the following justification:
| · | The RF 0.90 shell satisfies New Pacific’s objective of maximizing ore tonnes. |
| · | The incremental discounted value per tonne of ore is negative beyond the RF 0.9 shell. |
| · | The RF 0.90 shell contains 98% of the ore tonnes in the RF 1.0 shell and
6% less waste material. |
To enable the deferment of waste
stripping and access to high-grade ore earlier in the mine life intermediate phases were designed. Pit shells 4 (RF 0.25), 5 (RF 0.30),
and 8 (RF 0.45) were selected to guide pit phase designs within the footprint of the Main Pit. These shells were selected with consideration
of minimum mining width requirements between pushbacks (25 m) as well as ore tonnage requirements.
The Main Pit is approximately 2,300
m in length, 350 m to 700 m in width, and 280 m at its deepest point. Using the selected shells as guidance, eight sub-phases were designed.
The phases and their corresponding shells are summarized in Table 16.11. All pit designs were completed in accordance with the geotechnical
parameters discussed in Section 16.3.
| Silver Sand Project Pre-Feasibility Study |
| | New Pacific Metals Corp. | 0723071 |
| Table 16.11 | Main Pit phases |
| Phase |
Pit shell |
| MP1 |
RF 0.30 |
| MP2 |
RF 0.25 |
| MP3 |
RF 0.30 |
| MP4 |
RF 0.30 |
| MP5 |
RF 0.45 |
| MP6 |
RF 0.45 |
| MP7 (ultimate pit south of Machacamarca Creek) |
RF 0.90 |
| MP8 (ultimate pit north of Machacamarca Creek) |
RF 0.90 |
Source: AMC
Mining Consultants (Canada) Ltd., 2024.
Haulage ramps were designed at a
maximum 10% gradient, with widths of 21 m for double-lane traffic, and 12 m for single-lane traffic. The bottom three benches of all pits
were designed with single-lane access, with one final sub-excavation bench (also known as a “goodbye cut”) in the final pit
floor.
The ultimate pit design, Main Pit
phase designs, and representative sections through the pits displaying Ag grade (g/t) are presented in Figure 16.10 to Figure 16.13.
| Silver Sand Project Pre-Feasibility Study |
| | New Pacific Metals Corp. | 0723071 |
| Figure 16.10 | Ultimate pit design with long sections |
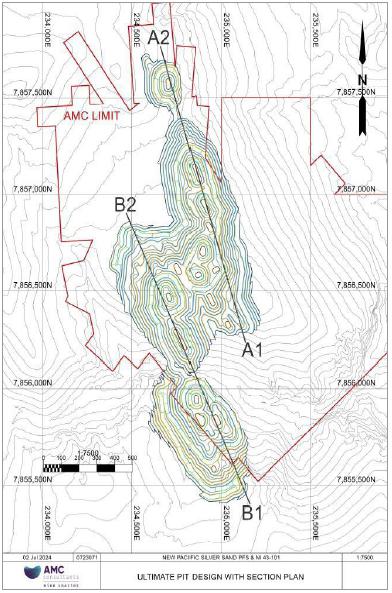
| Silver Sand Project Pre-Feasibility Study |
| | New Pacific Metals Corp. | 0723071 |
| Figure 16.11 | Section view A1 - A2 with Ag grade (g/t) |
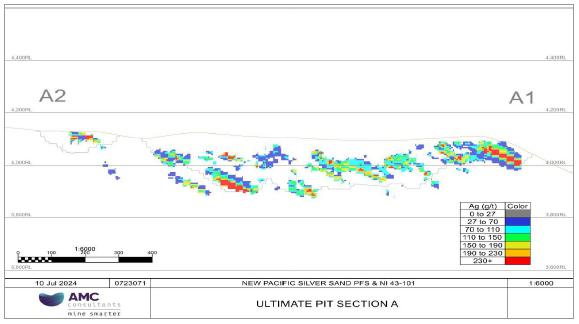
| Figure 16.12 | Section view B1 - B2 with Ag grade (g/t) |
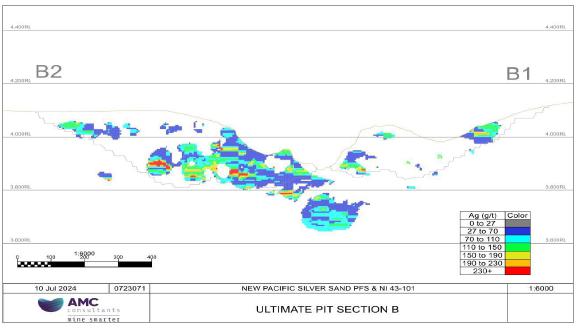
| Silver Sand Project Pre-Feasibility Study |
| | New Pacific Metals Corp. | 0723071 |
| Figure 16.13 | Main Pit phase designs |
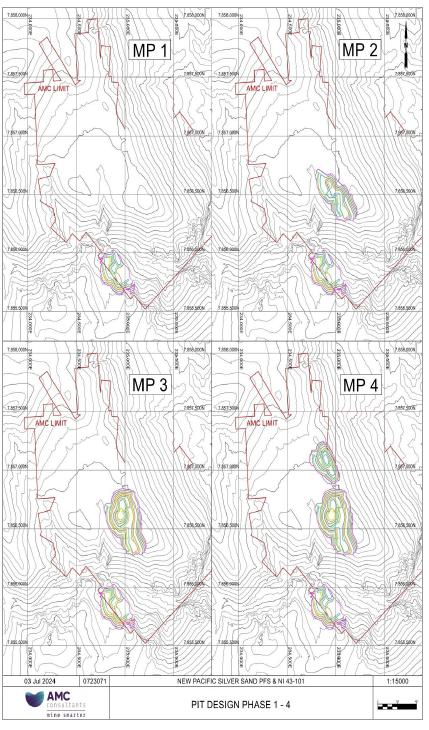
| Silver Sand Project Pre-Feasibility Study |
| | New Pacific Metals Corp. | 0723071 |
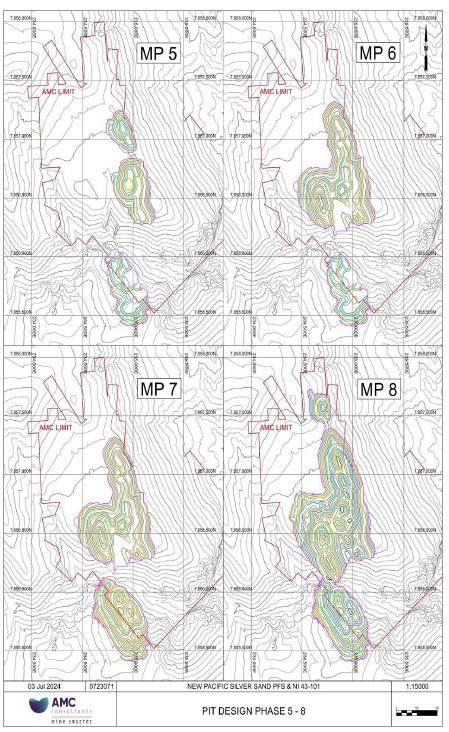
| Silver Sand Project Pre-Feasibility Study |
| | New Pacific Metals Corp. | 0723071 |
A summary of the tonnes of ore and
waste contained within the ultimate pit design is presented in Table 16.12. Tonnes in Table 16.12 do not match the tonnes presented in
the pit optimization results (Table 15.1) due to minor differences in whittle shell versus design, and the three smaller satellite pits
have not been included due to their marginal economic value and current social and community relations concerns.
| Table 16.12 | Ore and waste tonnage within the ultimate pit design |
| Item |
Values |
| Ore tonnage (Mt) |
52.0 |
| Waste tonnage (Mt) |
181.9 |
| Total tonnage (Mt) |
233.9 |
| Stripping ratio (t:t) |
3.5:1 |
Source:
AMC Mining Consultants (Canada) Ltd., 2024.
| 16.6 | Layout of other mining-related facilities |
A general overview of the Silver
Sand site layout showing surface infrastructure is presented in Figure 16.14. Additional information on site infrastructure is presented
in Section 18.
| Silver Sand Project Pre-Feasibility Study |
| | New Pacific Metals Corp. | 0723071 |
| Figure 16.14 | General site layout |
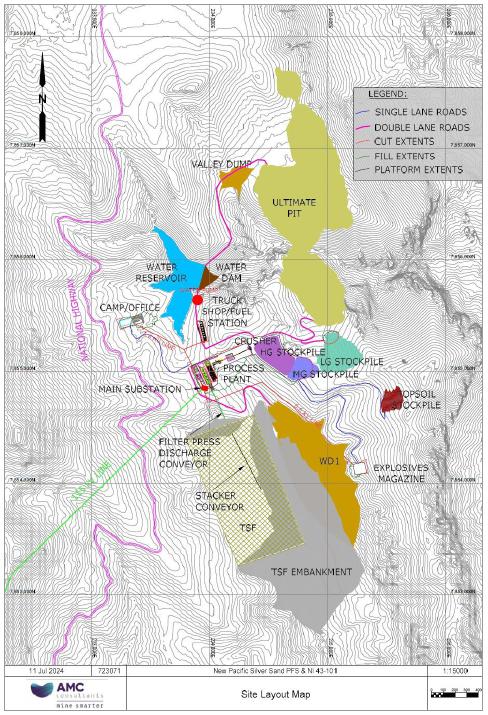
Source: AMC Mining Consultants (Canada) Ltd.,
2024.
| Silver Sand Project Pre-Feasibility Study |
| | New Pacific Metals Corp. | 0723071 |
ROM stockpiles will be constructed
near the plant for low-grade, medium-grade, and high-grade ore. The capacities of the stockpiles are shown in Table 16.13. The ore stockpiles
will be used to allow for blending of the different grades of ore to provide a constant feed grade to the plant for sustained periods
which will assist in maximizing metallurgical recovery.
| Table 16.13 | Stockpile capacities |
| Stockpile |
Capacity (Mt) |
| Low grade |
3.3 |
| Medium grade |
1.1 |
| High grade |
2.0 |
Source:
AMC Mining Consultants (Canada) Ltd., 2024.
Six dumping areas for waste material
are planned; these include two in-pit dumps and four external dumps. Upstream of the open pit, a water dam will be constructed in the
Machacamarca Creek valley using waste rock from initial waste stripping. The valley dump, located north of the water dam, will also be
constructed to establish access to the mining phases north of the creek. Waste material will also be used to construct the embankment
for the tailings storage facility (TSF).
Later in the mine life, waste will
be dumped into depleted pits to take advantage of shorter haul distances. Waste dumps and their designed capacities are listed in Table
16.14. For mine closure the waste dumps will be rehabilitated by re-shaping the dumps to a final slope, capping with a layer of topsoil,
and revegetating. Approximately 30 cm of topsoil will be removed from the surface of the footprint of the pits, mine roads, stockpiles,
and ex-pit dumps to be stored on a topsoil stockpile for use in future rehabilitation.
| Table 16.14 | Waste dump storage capacities |
| Dump ID |
Capacity (Mm3) |
| Water dam |
0.72 |
| Valley |
0.43 |
| WD1 |
22.9 |
| TSF embankment |
78.2 |
| IPD1 |
5.1 |
| IPD2 |
10.9 |
| Topsoil stockpile |
0.14 |
Source:
AMC Mining Consultants (Canada) Ltd., 2024.
The
Silver Sand project will be mined using a conventional open pit mining method, utilizing 115 t hydraulic backhoe excavators and haulage
by off-highway 72 t capacity rear-dump haul trucks. Mining is anticipated to be completed by a contract mining company. The majority
of the excavated material will require drilling and blasting.
Drilling and blasting will be performed
on 10 m benches. Proposed drilling parameters for ore and waste are presented in Table 16.15; these parameters may be adjusted as operational
experience is gained.
| Silver Sand Project Pre-Feasibility Study |
| | New Pacific Metals Corp. | 0723071 |
| Table 16.15 | Proposed drill and blast parameters |
| Parameter |
Unit |
Ore |
Waste |
| Bench height |
m |
10 |
10 |
| Burden |
m |
4.4 |
4.8 |
| Spacing |
m |
5.1 |
5.5 |
| Hole diameter |
mm |
165 |
165 |
| Subdrill |
m |
1.0 |
1.0 |
| Powder factor |
kg/t |
0.24 |
0.20 |
Source:
AMC Mining Consultants (Canada) Ltd., 2024.
Explosives will be stored on-site.
At least four weeks of explosives storage capacity is recommended given the remoteness of the project. An Ammonium Nitrate Fuel Oil (ANFO)
storage facility will be constructed and operated by the mining contractor. The site will also require two explosive magazines (one for
detonators and one for high-powered explosives). The magazines will be located at least 1,000 m from other occupied infrastructure. The
number of mobile manufacturing units (MMU) supplied by the contractor will depend on site arrangements. With ANFO to be stored one-site,
one MMU with 12 to 18 tonnes of capacity is expected to be sufficient.
It is estimated that the mine will
consume between 3,500 – 3,800 tonnes of ANFO per year during peak production. It is estimated that 25,000 – 30,000 blastholes
per year will be required during peak production.
It has been assumed that in-pit
dewatering will be suitable to ensure that the groundwater table remains below the bottom of the pit. Therefore, ANFO is considered suitable
for the anticipated dry hole blasting conditions. ANFO is a dry and free-flowing product and can be delivered to the hole by loose pour
or pneumatic loading.
Down-the-hole hammer drill rigs
will be equipped with blasthole sampling equipment to collect samples for grade control. Where possible, blast boundaries will be designed
to preserve the ore-waste contact. Separate blasts for ore and waste will be used wherever possible to eliminate the mixing of grade boundaries
that result in excessive ore loss and dilution. Monitoring of material movement within blasts will be carried out to predict the post-blast
position of the ore-waste boundaries.
Controlled blasting techniques will
be used to prevent excessive movement of ore. Blasting against final pit walls will be done using specialized techniques including trim
and pre-split blasting. Pre-splitting will utilize small diameter holes and will be drilled at 20 m vertical depths. Decoupled or decked
explosive charges will be used for blasting along final walls. Trim blasting is expected to be required to buffer final walls against
production blasts.
A conventional open pit truck and
excavator mining method will be employed at Silver Sand. Following drilling and blasting activities, loading will take place on variable
height flitches. Waste will be mined in two 5 m flitches per bench, and ore will be mined in three 3.3 m flitches per bench. Mining ore
in smaller flitches will improve ore selectivity and reduce dilution. A backhoe configuration (XCMG XE1250G excavators) will be used for
mining ore and waste. The average productivity of the XE1250G excavators in blasted material is expected to be approximately 830 t/op
hr.
| Silver Sand Project Pre-Feasibility Study |
| | New Pacific Metals Corp. | 0723071 |
Ore and waste will be hauled 72
t off-highway trucks (XCMG XDR80T). Ore will be hauled to the primary crusher or the ore stockpiles. Waste will be hauled to the TSF,
external, and in-pit waste dumps.
| 16.7.3 | Stockpile rehandling |
Stockpiled material will be reclaimed
as required to meet grade blending requirements at the plant. The high-grade stockpile will be reclaimed with a front-end loader (XCMG
XC958U) to feed material directly into the primary crusher. Stockpiled low and medium-grade material will be rehandled using hydraulic
excavators (XCMG XE700D) and 65 t off-highway trucks (XCMG XDR70T).
Stockpiles were designed according
to the storage requirements of the tactical schedule (see Section 16.9). Peak storage requirements do not occur simultaneously, which
will allow the mine to expand stockpiles into underused areas of the stockpile platform.
| 16.7.4 | Ancillary equipment |
Ancillary equipment requirements
have been estimated based on total production fleet numbers and operational experience. Activities considered when selecting the ancillary
equipment fleet include:
| · | Dust suppression and haul road maintenance. |
| · | Waste dump construction and maintenance. |
| · | Servicing of the production fleet. |
| · | Clean-up and preparation of drilling and digging areas. |
| · | Topsoil clearing. |
The support fleet consists of three
50-tonne dozers (such as the CAT D9) that will be used for clearing topsoil, constructing waste dumps, the TSF embankment, and managing
stockpiles. The dozers will also be used for developing pioneering roads to access mining and dumping areas at the start of the mine life.
During production, the dozers will provide support in the pits and waste dumps. At the end of the mine life, the dozer fleet will be used
for reclamation activities, such as re-contouring of disturbed areas.
In addition, three motor graders
with 5 m blades (such as the CAT 16) graders will be required for road maintenance, drill pattern leveling, and post-mining reclamation.
Two water trucks will be used as required for dust suppression on haul roads as well as mining and dumping areas. When not required for
stockpile reclaim, the front-end loader (XCMG XC958U) will be used for in-pit support and spill-rock clean-up on haul roads. Equipment
numbers reflect planned operating requirements; the mining contractor may keep additional pieces of key ancillary mining equipment on
site to ensure that adequate backup is available.
| 16.8 | Strategic mining schedule |
The strategic mining schedule was
developed using Minemax Scheduler 7 software (Minemax). Minemax is a schedule optimizer that seeks to maximize the discounted operating
cash flows while honouring constraints related to processing and mining inputs. The objective of the strategic schedule is to maximize
the net present value (NPV) of the plan while achieving a realistic mining sequence and maintaining a steady plant throughput rate. The
strategic schedule was developed on an annual basis using a discount rate of 8% per annum.
| Silver Sand Project Pre-Feasibility Study |
| | New Pacific Metals Corp. | 0723071 |
The main inputs to the strategic
schedule include the regularized mining model, the pit designs discussed in Section 16.5, preliminary external and in-pit waste dump designs,
and haulage cycle times. To estimate cycle times, a comprehensive haulage network model was developed using Micromine Alastri’s
Haul Infinity software. Cycle times were defined from the centroid of each bench to each destination. The following scheduling constraints
were applied when developing the strategic schedule:
| · | Achieve planned plant feed tonnage of 4 Mtpa. Including a 3-month ramp-up
period in year one for a total 3.7 Mtpa feed. |
| · | Maximum stockpile capacity of 5 Mt. |
| · | Produce a smooth total material movement and haul truck requirement. |
| · | Pre-strip sufficient waste material to achieve TSF embankment and water
dam construction requirements. |
| · | Limit vertical advance rate to 10 benches per year, per phase. |
| · | Limit the number of phases mined to a maximum of four per year. |
| 16.8.2 | Strategic schedule mining sequence |
To optimize the overall value of
the project and the sequence of mining, the value of each pit phase was estimated. The value, defined as the indicative undiscounted cash
flow per tonne of mineralized material, accounts for preliminary mining costs, G&A, and processing costs.
The projected value from each source
and consideration of practical scheduling constraints provided a basis for the order in which the pits are scheduled. The indicative value
by mining area is shown in Figure 16.15.
| Figure 16.15 | Indicative value by mining area |

Source: AMC Mining Consultants
(Canada) Ltd., 2024.
MP2, MP3, and MP4 are the highest-value
phases, but they are located north of the Machacamarca Creek. The water dam spanning the creek valley needs to be constructed before they
can be mined. Therefore, phases MP1, MP5, and MP7 are mined first in Year -2 and waste material from these phases is used to construct
the water dam. More information on the water dam is presented in Section 18.
| Silver Sand Project Pre-Feasibility Study |
| | New Pacific Metals Corp. | 0723071 |
In addition to considering the
value by mining area when developing the preferred mining sequence, consideration was also given to mining in a sequence that supports
backfilling the pit with waste from phase MP8.
During the pre-strip period (Year
-2 and Year -1), the schedule is driven predominately by waste stripping to achieve TSF embankment construction requirements. Other activities
during the pre-strip period include haul road construction, mine development, and some ore stockpiling.
| 16.8.3 | Strategic schedule summary |
Multiple strategic mine plans were
developed to test the project’s NPV on a pre-tax basis against different silver production profiles, mining rates, and stockpile
sizes.
A strategic mine plan resulting
in annual payable output exceeding 15 Moz of silver in the first three years of production was selected for this study. Relative to the
other plans considered, this mine plan produced a value close to the highest NPV case, a stable production profile, limited stockpile
reclamation costs, and was in line with New Pacific’s corporate goals.
Mining is planned to extend over
13 years, excluding the 2-year pre-production period. An ex-pit production rate of 17.5 Mtpa is adequate to achieve the plant feed target
of 4.0 Mtpa. This included consideration of the vertical advance rate. The LOM ex-pit total material movement (TMM) profile is presented
in Figure 16.16.
| Figure 16.16 | Total material mined by phase |
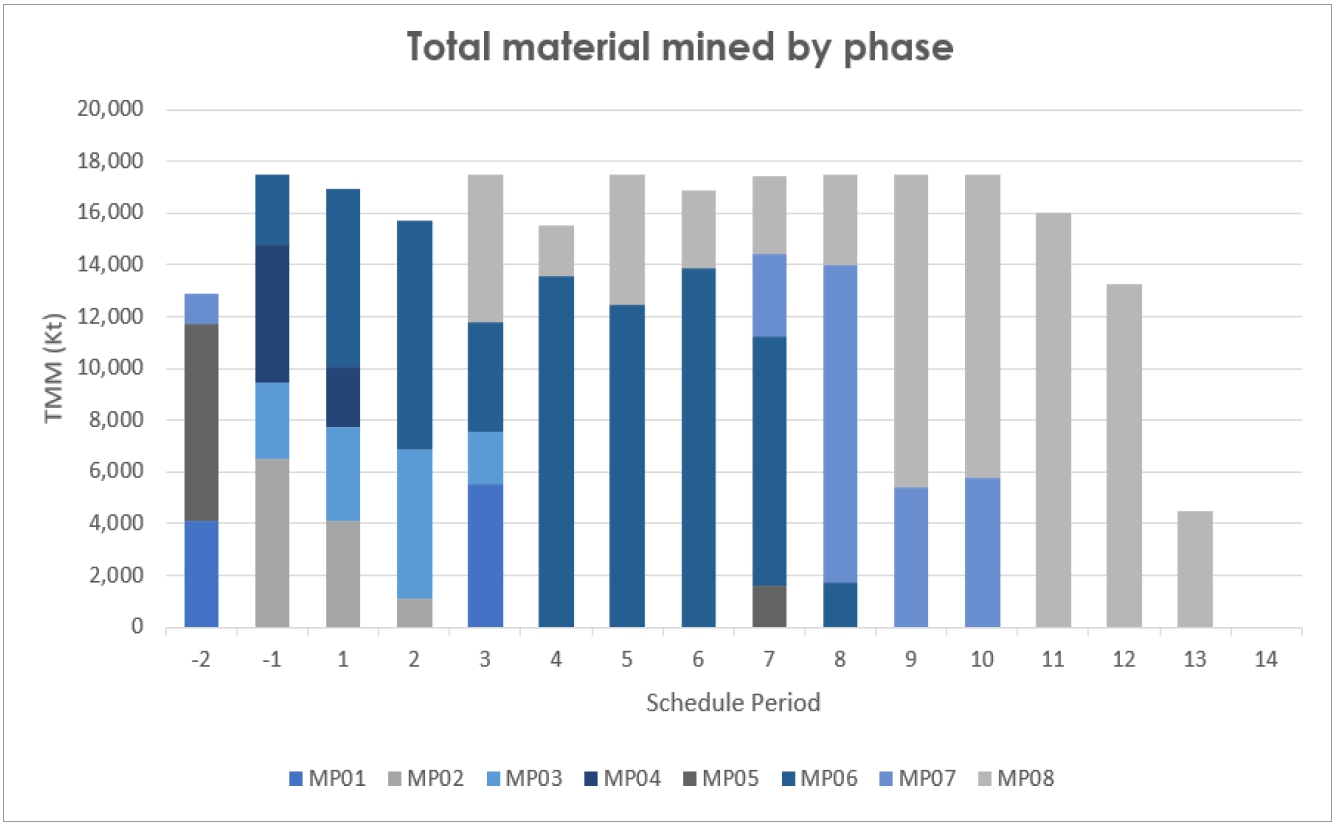
Source: AMC Mining Consultants
(Canada) Ltd., 2024.
| Silver Sand Project Pre-Feasibility Study |
| | New Pacific Metals Corp. | 0723071 |
MP1, MP5, and MP7 are mined first
in Year -2 and waste material from these phases is used to construct the water dam and TSF embankment. Two years of pre-production mining
are required to achieve the TSF embankment and water dam construction requirements. Once the water dam is constructed, higher-value phases
MP2, MP3, and MP4 are mined as the strategic schedule targets high-grade and low strip-ratio ore. Mining in MP7 is expedited to take advantage
of short-hauling waste from MP8, towards the end of mining.
| 16.8.4 | Strategic schedule process feed |
The strategic schedule confirmed
that stockpiling and reclaiming plant feed allows the ex-pit mining profile to be smoothed, and revenue to be brought forward by maximizing
head grade based on available feedstock.
The head grade to the process plant
is over 160 g/t in Year 1 and over 130 g/t for the first three years of production. Plant production includes a 3-month ramp-up in Year
1. Feeding low-grade ore during ramp-up was not included in the strategic schedule. Low-grade feed was incorporated into the tactical
schedule discussed in Section 16.9.
The strategic schedule
process feed tonnes and grade profile are presented in Figure 16.17. Figure 16.18 shows the strategic mine plan stockpile
balance.
| Figure 16.17 | Process feed tonnes and grade |
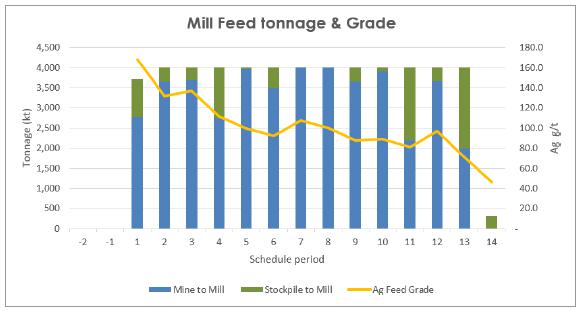
Source: AMC Mining Consultants
(Canada) Ltd., 2024.
| Silver Sand Project Pre-Feasibility Study |
| | New Pacific Metals Corp. | 0723071 |
| Figure 16.18 | Strategic mine plan stockpile balance |
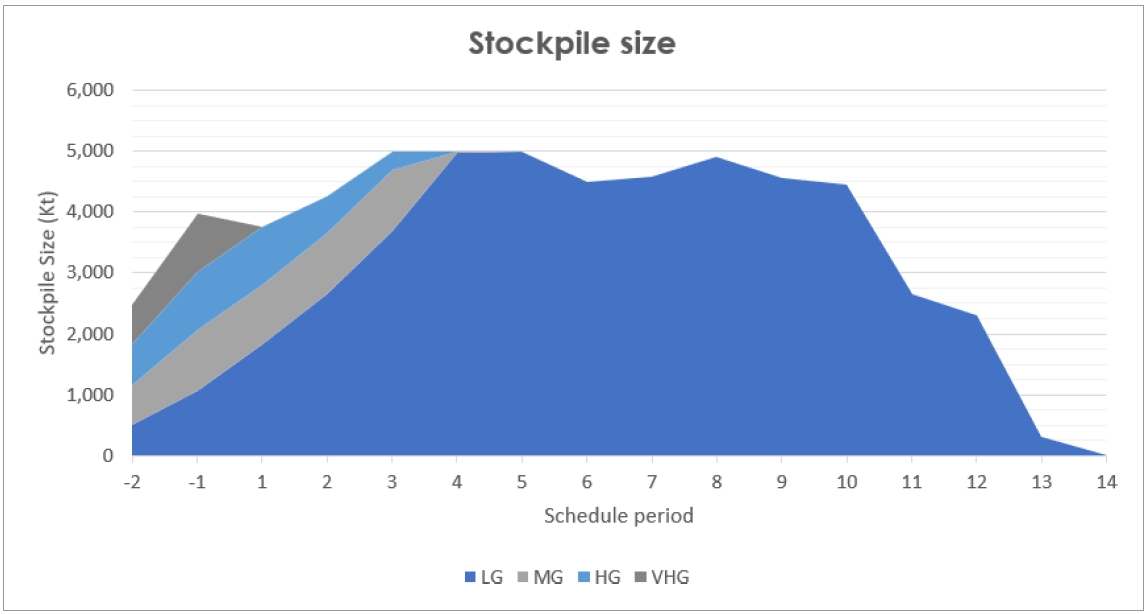
Source: AMC Mining Consultants
(Canada) Ltd., 2024.
| 16.9 | Tactical mining schedule |
The life-of-mine tactical mining
schedule is a refined, detailed schedule that uses the strategic schedule as a guide for mine sequencing, total material movement, plant
feed, and waste dumping strategy. The lengths of scheduling periods were reduced early in the schedule to provide sufficient detail to
ensure that the mining sequence is practical and achievable. Haulage is estimated for each parcel and is optimized to minimize haulage
for the entire schedule based on the sequence constraints.
The Deswik suite of software was
used to develop the tactical schedule. Tactical schedule results were used to develop detailed equipment fleet requirements, the basis
for Mineral Reserves, and mine operating and capital cost estimation.
The tactical schedule considered:
| · | The strategic schedule developed in Minemax. |
| · | Phased pit designs. |
| · | In-pit and external waste dump designs. |
| · | TSF construction requirements. |
| · | Haulage profiles: in-pit ramps, pioneering roads, and dump access. |
| · | Fleet sizes and productivities. |
| · | Consistent bench sequencing. |
| · | Vertical advance rates and proximity of mining equipment. |
| · | Advanced destination scheduling in Deswik.LHS (Deswik’s haulage modelling module). |
| · | Material flows as shown in Figure 16.19. |
| Silver Sand Project Pre-Feasibility Study |
| | New Pacific Metals Corp. | 0723071 |
| Figure 16.19 | Tactical schedule material flow |
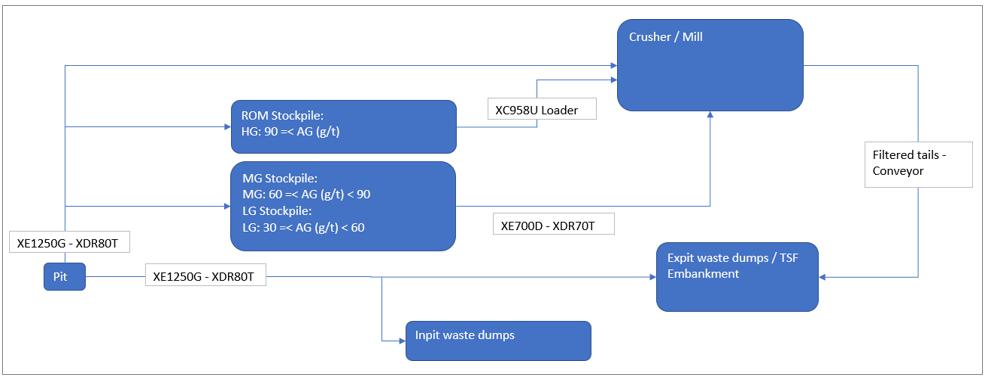
Source: AMC Mining Consultants (Canada) Ltd.,
2024.
The ROM inventory
for each phase was calculated in Deswik and is summarized in Table 16.16. Only economic material classified as a Measured or Indicated
Resource was considered as ore.
| Table 16.16 | ROM inventory for tactical schedule |
| Phase |
Total tonnes (Mt) |
Ore tonnes (Mt) |
Waste tonnes (Mt) |
Strip Ratio1 (t:t) |
| MP1 |
9.73 |
3.96 |
5.77 |
1.46 |
| MP2 |
11.71 |
3.73 |
7.98 |
2.14 |
| MP3 |
14.25 |
4.71 |
9.50 |
2.03 |
| MP4 |
7.67 |
1.19 |
6.49 |
5.47 |
| MP5 |
9.00 |
1.55 |
7.46 |
4.82 |
| MP6 |
73.76 |
17.45 |
56.3 |
3.23 |
| MP7 |
27.79 |
7.13 |
20.66 |
2.90 |
| MP8 |
79.97 |
12.30 |
67.67 |
5.50 |
| Total |
233.89 |
52.01 |
181.88 |
3.50 |
Notes:
| 1. | Strip ratio includes material mined during pre-production period. |
2.
The ore tonnage includes a dilution rate of 10% and a mining recovery rate of 92%. A COG of 27 g/t
Ag was applied to ore within the AMC limit and a COG of 29 g/t was applied for ore outside of the AMC limit.
Source: AMC Mining Consultants (Canada) Ltd.,
2024.
| 16.9.2.2 | Material destinations |
The tactical schedule included advanced destination scheduling
to model material movements as follows:
| · | Ag ≥ 90 g/t: HG stockpile or direct feed to plant. |
| · | 60 g/t ≤ Ag < 90 g/t: MG stockpile or direct feed to plant. |
| · | COG g/t ≤ Ag < 60 g/t: LG stockpile or direct feed to plant. |
| · | Ag < COG g/t: in-pit and external waste dumps. |
| Silver Sand Project Pre-Feasibility Study |
| | New Pacific Metals Corp. | 0723071 |
Note that the HG and VHG stockpiles
were separate during the strategic schedule but have been combined for the tactical schedule because very little material was considered
VHG and it was a short-lived stockpile. The pits, phases, and dumps are all divided by bench and smaller scheduling parcels.
The pit inventory was aggregated
into schedule blocks of dimensions 50 mE x 50 mN x 10 mZ for each individual pit phase and bench. Waste is to be mined on a 5 m flitch
and ore is to be mined on a 3.3 m flitch.
The waste dumps were aggregated
into 100 mE x 100 mN x 10 mZ blocks within lifts to model haulage as the waste dump faces advance.
The schedule block aggregation
size for the pit and dumping destinations is considered appropriate to represent the required granularity of mining and dumping for the
tactical mining schedule.
| 16.9.2.3 | Scheduling assumptions |
The start date of the tactical
schedule is Year -2. Two years of pre-production mining beginning in Year -2 are required to achieve TSF embankment and water dam construction
requirements. Year -2 was sequenced in months, Years -1 and 1 were sequenced in quarters, and the remainder of the mine life was sequenced
in annual periods. 350 operating days per year were used in the tactical schedule. Mining constraints applied to the tactical schedule
include a minimum distance of 50 metres between excavators, a maximum vertical advance rate of 10 benches per year (with a minimum threshold
of 100,000 tonnes), and a maximum of 4 active mining phases per year.
The process plant throughput capacity
targets were provided by Halyard for use in mine scheduling. It is assumed that the plant will require a 3-month ramp-up period starting
in Year 1. The plant will run at 50% capacity in month 1, 66.7% capacity in month 2, and will reach full throughput in month 3. Steady-state
plant throughput will be 4 million tonnes per year.
| 16.9.2.4 | Fleet assumptions |
The mine fleet productivity assumptions
used in the tactical schedule were derived from the experience of the QP. These are summarized in Table 16.17.
| Table 16.17 | Mine fleet productivity assumptions |
| |
Unit |
XE1250G |
XE700D |
XC958U |
XDR80T |
XDR70T |
Epiroc D65 |
| Equipment type |
|
Excavator |
Excavator |
Loader |
Truck |
Truck |
Drill |
|
Use criteria |
|
Ore &
waste
mining |
Ore reclaim
from LG &
MG stockpiles |
Ore reclaim
from HG
stockpile |
Ore &
waste
mining |
Ore reclaim
from LG & MG
stockpiles |
Production
drilling |
| Mechanical availability |
% |
85 |
85 |
85 |
85 |
85 |
85 |
| Utilization |
% |
85 |
85 |
85 |
85 |
85 |
85 |
| Operating efficiency |
% |
85 |
85 |
85 |
87.5 |
87.5 |
82.5 |
| Productivity |
t/h |
830 |
585 |
530 |
72 |
891 |
18 m/hr |
| Operating hours per year |
h/year |
5,183 |
5,183 |
5,183 |
5,310 |
5,310 |
5,007 |
Notes:
1 Based on LOM average cycle time 46 mins.
Source: AMC Mining Consultants (Canada) Ltd.,
2024.
| Silver Sand Project Pre-Feasibility Study |
| | New Pacific Metals Corp. | 0723071 |
| 16.9.2.5 | Haulage cycle estimation |
A comprehensive haulage network
was modelled in the Deswik.LHS module using the in-pit haulage ramps designed for each phase, pioneering roads, and ex-pit access roads.
The Deswik.LHS module accounts for
dynamic changes in haul path due to increased depth of mining within the pit as well as increased dump lift height, dump lateral extension,
and haul truck specific performance parameters.
Fuel burn rates were estimated
for each haulage route within the Deswik.LHS model using estimated rimpull and retard curve engine load factors. These were accumulated
to determine an overall variable fuel consumption per haulage cycle.
The haulage travel times, fuel burn
rates, and haulage distances for each haul truck were evaluated and reported according to the tactical schedule destination. Key haulage
assumptions are presented in Table 16.18
Table 16.18 Haulage
assumptions
| |
Unit |
Value |
| Ex-pit mining (ore and waste) |
| Queue at loader |
min |
0.5 |
| Spot at loader |
min |
0.35 |
| Load time |
min |
2.6 |
| Spot and dump |
min |
0.85 |
| Total |
min |
4.3 |
| Stockpile reclaim |
| Queue at loader |
min |
0 |
| Spot at loader |
min |
0.35 |
| Load time |
min |
2.6 |
| Spot and dump |
min |
0.85 |
| Total |
min |
3.8 |
| Max truck speed on ramp (loaded / unloaded) |
km/h |
20 / 20 |
| Max truck speed ex-pit (loaded / unloaded) |
km/h |
40 / 40 |
| Max truck speed on bench / on dump |
km/h |
20 / 20 |
| Max truck speed corners (loaded / unloaded) |
km/h |
15 / 15 |
| Rolling resistance |
% |
2 |
Source: AMC Mining Consultants
(Canada) Ltd., 2024.
Figure 16.20 shows the total material
mined by phase. Figure 16.21 shows the mining sequence on 3-year intervals. End-of-period plans are presented in Figure 16.22 and Figure
16.23.
Table 16.19 summarizes the LOM
production schedule by year and includes the process feed, stockpile balances, ex-pit material movements, drill and blast, and load and
haul equipment operating hours.
| Silver Sand Project Pre-Feasibility Study |
| | New Pacific Metals Corp. | 0723071 |
| Figure 16.20 | Total material mined by phase |

Source: AMC Mining Consultants (Canada) Ltd.,
2024.
| Figure 16.21 | Mining sequence |

Source: AMC Mining Consultants (Canada) Ltd.,
2024.
| Silver Sand Project Pre-Feasibility Study |
| | New Pacific Metals Corp. | 0723071 |
| Figure 16.22 |
End of period plans from Year -2 to Year 2 |
| Silver Sand Project Pre-Feasibility Study |
| | New Pacific Metals Corp. | 0723071 |
| Figure 16.23 |
End of period plans from Year 5 to the end-of-mine. |
| Silver Sand Project Pre-Feasibility Study |
| | New Pacific Metals Corp. | 0723071 |
| Table 16.19 |
LOM production schedule by year |
| |
Units |
Year
-2 |
Year
-1 |
Year
1 |
Year
2 |
Year
3 |
Year
4 |
Year
5 |
Year
6 |
Year
7 |
Year
8 |
Year
9 |
Year
10 |
Year 11 |
Year 12 |
Year 13 |
Year 14 |
| Plant
summary |
| Process
feed |
| Feed
tonnes |
Mt |
|
|
3.73 |
4.00 |
4.00 |
4.00 |
4.00 |
4.00 |
4.00 |
4.00 |
4.00 |
4.00 |
4.00 |
4.00 |
4.00 |
0.29 |
| Feed
grade Ag |
g/t |
147 |
144 |
135 |
101 |
100 |
98 |
93 |
107 |
92 |
81 |
85 |
110 |
78 |
43 |
| Direct
feed tonnes |
Mt |
1.25 |
4.00 |
3.42 |
3.32 |
3.58 |
3.48 |
3.25 |
4.00 |
3.87 |
2.69 |
2.30 |
4.00 |
3.11 |
0.00 |
| Stockpile
reclaim tonnes |
Mt |
2.48 |
|
0.58 |
0.68 |
0.42 |
0.52 |
0.75 |
|
0.13 |
1.31 |
1.70 |
|
0.89 |
0.29 |
| Stockpile
closing balance |
| HG
stockpile |
Mt |
1.23 |
1.73 |
0.69 |
0.58 |
|
|
|
|
|
|
|
|
|
|
|
|
| Grade
AG |
g/t |
162 |
163 |
158 |
158 |
|
|
|
|
|
|
|
|
|
|
|
| MG
stockpile |
Mt |
0.57 |
0.87 |
1.47 |
1.74 |
1.74 |
1.06 |
0.64 |
0.11 |
|
|
|
|
|
|
|
| Grade
AG |
g/t |
74 |
74 |
74 |
74 |
74 |
74 |
74 |
74 |
|
|
|
|
|
|
|
| LG
stockpile |
Mt |
0.43 |
0.89 |
0.83 |
1.81 |
2.69 |
3.13 |
3.40 |
3.55 |
2.95 |
3.16 |
3.10 |
1.88 |
0.19 |
1.17 |
0.29 |
| Grade
AG |
g/t |
48 |
47 |
46 |
46 |
46 |
45 |
45 |
45 |
45 |
44 |
44 |
44 |
43 |
43 |
43 |
| Material
movement Summary |
| Waste
(ex-pit) |
Mt |
9.15 |
15.11 |
13.16 |
9.69 |
10.04 |
10.75 |
13.54 |
13.38 |
14.19 |
13.81 |
13.64 |
15.24 |
13.96 |
11.33 |
4.89 |
|
| Ore
(ex-pit) |
Mt |
2.22 |
1.54 |
2.98 |
5.11 |
4.30 |
3.76 |
3.85 |
3.63 |
3.28 |
4.21 |
3.95 |
2.77 |
2.32 |
4.98 |
3.11 |
|
| Total
mined (ex-pit) |
Mt |
11.38 |
16.65 |
16.14 |
14.80 |
14.33 |
14.51 |
17.39 |
17.01 |
17.47 |
18.02 |
17.59 |
18.02 |
16.28 |
16.31 |
8.00 |
|
| Reclaimed
ore |
Mt |
|
|
2.48 |
0.00 |
0.58 |
0.68 |
0.42 |
0.52 |
0.75 |
|
0.13 |
1.31 |
1.70 |
|
0.89 |
0.29 |
| Total
mined & reclaimed |
Mt |
11.38 |
16.65 |
18.62 |
14.80 |
14.91 |
15.19 |
17.81 |
17.53 |
18.21 |
18.02 |
17.71 |
19.33 |
17.98 |
16.31 |
8.89 |
0.29 |
| Total
movement (ex-pit) by pit |
| MP1 |
Mt |
4.23 |
|
|
|
5.50 |
|
|
|
|
|
|
18.02 |
16.28 |
16.31 |
|
|
| MP2 |
Mt |
|
6.52 |
2.92 |
2.28 |
|
|
|
|
|
|
|
|
| MP3 |
Mt |
|
2.85 |
4.76 |
5.51 |
1.13 |
|
|
|
|
|
|
|
| MP4 |
Mt |
|
5.46 |
2.21 |
|
|
|
|
|
|
|
|
|
| MP5 |
Mt |
6.45 |
|
|
|
|
|
|
|
2.56 |
|
|
|
| MP6 |
Mt |
|
1.82 |
6.25 |
7.01 |
7.70 |
12.54 |
11.53 |
14.00 |
8.00 |
4.01 |
0.95 |
|
| MP7 |
Mt |
0.70 |
|
|
|
|
|
|
|
3.89 |
8.00 |
8.63 |
6.56 |
| MP8 |
Mt |
|
|
|
|
|
1.98 |
5.85 |
3.00 |
3.01 |
6.01 |
8.01 |
1.44 |
| Equipment
summary |
| Trucks |
| XDR80T
operating hours (ex-pit) |
hrs
x1,000 |
99.7 |
192.3 |
177.1 |
154.3 |
158.3 |
166.6 |
194.1 |
209.0 |
199.1 |
206.2 |
199.0 |
220.7 |
198.4 |
178.5 |
81.6 |
|
| XDR80T
average productivity (ex-pit) |
tph |
114.2 |
86.6 |
91.1 |
95.9 |
90.5 |
87.1 |
89.6 |
81.4 |
87.7 |
87.4 |
88.4 |
81.6 |
82.0 |
91.4 |
98.0 |
| XDR80T
average cycle time (ex-pit) |
mins |
37.1 |
48.7 |
46.3 |
44.0 |
46.6 |
48.4 |
47.1 |
51.8 |
48.1 |
48.3 |
47.7 |
51.7 |
51.4 |
46.2 |
43.0 |
| XDR80T
total trucks |
# |
19 |
36 |
33 |
29 |
30 |
31 |
37 |
39 |
37 |
39 |
37 |
42 |
37 |
34 |
15 |
| Excavators |
|
| XE1250G
operating hours |
hrs
x1,000 |
13.7 |
20.1 |
19.4 |
17.8 |
17.3 |
17.5 |
20.9 |
20.5 |
21.0 |
21.7 |
21.2 |
21.7 |
19.6 |
19.7 |
9.6 |
|
| XE700D
operating hours |
hrs
x1,000 |
1.2 |
1.2 |
0.7 |
0.9 |
1.3 |
0.0 |
0.2 |
2.2 |
2.9 |
1.5 |
| Drills |
|
| Drill
metres |
m
x1,000 |
210.1 |
344.6 |
282.6 |
271.4 |
255.7 |
277.4 |
305.0 |
272.7 |
303.4 |
311.6 |
238.0 |
318.4 |
250.4 |
251.9 |
116.2 |
|
| Drill
operating hours |
hrs
x1,000 |
11.7 |
19.1 |
15.7 |
15.1 |
14.2 |
15.4 |
16.9 |
15.1 |
16.9 |
17.3 |
13.2 |
17.7 |
13.9 |
14.0 |
6.5 |
| Waste
dump summary |
| TSF
embankment |
Mm3 |
3.54 |
7.73 |
6.74 |
4.96 |
5.14 |
5.50 |
6.93 |
6.85 |
7.26 |
7.07 |
6.98 |
7.80 |
1.74 |
|
2.50 |
|
| WD1 |
Mm3 |
|
|
5.40 |
5.01 |
| Valley
dump |
Mm3 |
|
0.43 |
|
|
| Water
dam |
Mm3 |
0.72 |
|
|
|
| Inpit
dumps |
Mm3 |
|
|
|
0.79 |
Source: AMC Mining Consultants (Canada) Ltd.,
2024.
| Silver Sand Project Pre-Feasibility Study |
| | New Pacific Metals Corp. | 0723071 |
Some important milestones of the mining schedule are presented in Table 16.20.
Table
16.20 Schedule milestones
| Date |
Milestones |
| Year
-2 |
Mine haul road construction starts (MP1 / MP5 to Process Plant, Water Dam)
Mine haul road construction starts (Process Plant to TSF and WD1)
Road construction starts (to topsoil stockpile, magazines, camp / office)
Topsoil clearing under TSF, magazine, plant, camp, and other infrastructure
Topsoil clearing and pre-strip starts MP1, MP5, and MP7
Stockpile platform construction starts
Water dam construction starts
TSF embankment construction starts |
| Year
-1 |
Mine haul road construction starts (MP2 / MP3 / MP4 to Valley dump, Water Dam)
Topsoil clearing and pre-strip starts MP2, MP3, MP4, and MP6
Topsoil clearing under the Valley dump
Valley dump construction starts |
| Year
1 |
Plant
production commences with a ramp-up period |
| Year
2 |
Plant
feed at full capacity
MP2 mining complete |
| Year
3 |
MP1
and MP3 mining complete |
| Year
4 |
Topsoil
clearing and mining starts MP8 |
| Year
7 |
MP5
mining complete |
| Year
9 |
MP6
mining complete |
| Year
10 |
Topsoil
clearing under WD1
WD1 dump construction starts |
| Year
11 |
TSF
embankment construction complete |
| Year
12 |
In-pit
dumping starts |
| Year
13 |
End
of mining operations. Rehabilitation commenced |
| Year
14 |
Final
ore from the low-grade stockpiles is processed |
| Year
18 |
Rehabilitation
completed |
Source: AMC Mining Consultants (Canada) Ltd.,
2024.
The main outcomes of the tactical schedule are presented
below:
| · | Mining operations will take 15 years, including the pre-production period. |
| · | Processing will last 14 years, the last year of which will be stockpile
re-handle only (partial year). |
| · | Total annual ex-pit material movement peaks at approximately 18 Mtpa. |
| · | Ex-pit tonnes average 40 ktpd over the LOM. |
| · | The silver production profile follows the strategic schedule with at least
15 Moz for the first three years of mill production. |
| · | In-pit dumping starts in year 12. |
| · | A maximum long-term stockpile capacity of 4.40 Mt
is required as seen in Figure 16.25. The majority of this stockpile is made up of the lowest grade material, which is being stored for
plant feed at the end of the mine life. It has been assumed that there will be no detrimental effect to the metallurgical recovery of
the stockpiled ore. |
| Silver Sand Project Pre-Feasibility Study |
| | New Pacific Metals Corp. | 0723071 |
| 16.9.4 | Plant feed schedule |
Figure
16.24 shows the plant feed tonnes and grades.
| Figure 16.24 |
Tactical schedule plant feed |

Source: AMC Mining Consultants (Canada) Ltd.,
2024.
The inventory of the stockpiles over the mine life is presented
in Figure 16.25.
| Silver Sand Project Pre-Feasibility Study |
| | New Pacific Metals Corp. | 0723071 |
| Figure 16.25 |
Tactical schedule stockpile inventory |
Source: AMC Mining Consultants
(Canada) Ltd., 2024.
| 16.10 | Equipment and personnel requirements |
It is assumed that the management and technical
staff will be part of the owner’s team. Contractor personnel numbers were estimated for mine supervision, mine operations, and mobile
equipment maintenance.
All staff are planned to work the same shift roster. Features
of this roster are:
| · | 14 days on shift and seven days off shift, per shift cycle |
| · | 20 days per year of vacation leave |
| · | Five days of absenteeism /sick / special leave per year |
| · | Five days of training / professional development per year. |
Allowances have been made to the
number of staff to ensure that shift coverage will be available for mine supervision, operations, and mobile equipment maintenance personnel
on leave. Allowances have not been made for coverage of management and technical staff positions. It was assumed that other personnel
from the owner’s team could provide coverage, or additional support could be sourced from contractors and consultants.
| Silver Sand Project Pre-Feasibility Study |
| | New Pacific Metals Corp. | 0723071 |
Management and technical roles are
staffed for a single day shift only. Limiting these roles to a single shift will cause gaps in staffing that may be partially alleviated
by staggering when each person starts their shift. Operations, maintenance, and support personnel will be staffed day and night, for two
shifts per day. Since personnel are scheduled for 14 days on and seven days off, the starting day of each shift will be staggered by seven
days to ensure that staff are scheduled year-round for day and night shifts.
The above roster and mining schedules
were used to derive peak equipment requirements. The open pit equipment requirement at peak production is summarized in Figure 16.26.
| Figure 16.26 |
Open pit equipment requirements at peak production |

Source: AMC Mining Consultants
(Canada) Ltd., 2024.
Note: 1Equipment models indicated are for sizing
and costing purposes only and are not meant to be recommendations regarding equipment manufacturers for purchasing decisions.
Total operator numbers required
were calculated for the number of machines on-site at any given time, taking into account rosters, sick, and vacation leave. Production
equipment such as haul trucks, loading units, drills, and dozers were considered to be staffed at all times.
The number of personnel required
for mobile equipment maintenance was determined using maintenance labour ratios and the quantity of each type of equipment required by
the period in the tactical schedule. The maintenance labour ratios were estimated from the QP’s field experience and are based on
the number of hours of maintenance to the number of hours of operation. Ratios varied depending on the type of equipment.
Mining production and maintenance
positions are expected to be filled by the local workforce. It was assumed that the local workforce would be accommodated in nearby towns
and villages.
| Silver Sand Project Pre-Feasibility Study |
| | New Pacific Metals Corp. | 0723071 |
Management staff, technical staff, and expatriates will be
accommodated in the camp built at the mine site.
The yearly requirement for the open pit workforce peaks at
283 people in Year 10 and is presented for the LOM in Figure 16.27.
| Figure 16.27 |
Open-pit workforce requirements |
Source: AMC Mining Consultants (Canada) Ltd.,
2024.
| Silver Sand Project Pre-Feasibility Study |
| | New Pacific Metals Corp. | 0723071 |
The results from recent metallurgical
testwork programs (described in Section 13) have been used as a basis for confirming the selected mineral processing flowsheet for the
Silver Sand project. Interpretation of the testwork data has enabled the preparation of a preliminary process design criteria, mass and
metal balances, equipment selections and a flowsheet.
Several processing options have
been considered by the metallurgical team, including heap leaching, froth flotation and agitated tank cyanidation (with and without activated
carbon). The findings of preliminary trade-off studies that compared the capital cost, operating cost and metallurgical efficiency of
these different options have been verified by the most recent metallurgical work, and an agitated tank cyanidation process has been selected
for the PFS.
The selected flowsheet represents a commonly practiced, low-risk
approach to silver extraction, and consists of the following unit operations:
| · | ROM receiving, crushing and crushed rock stockpiling. |
| · | Stockpile draw-down, followed by grinding using a conventional SAG mill
and ball mill configuration. |
| · | SAG mill pebble crushing, utilizing SAG mill pebble ports, a scalping screen,
recycle conveyors and a cone crusher. |
| · | Pre-leach thickening of the milled slurry, followed by cyanide leaching
using agitated, oxygen and air sparged tanks. |
| · | Liquid / solid separation using counter-current decantation (thickeners). |
| · | Recovery of silver from pregnant leach solution using
a zinc precipitation process followed by drying and smelting of the silver precipitates with a mixture of fluxes to produce silver doré
bars. |
| · | Filtration of leach residues. |
| · | Conveying of tailing filter cake and long-term storage at the tailing storage
area. |
The processing rate
was selected to match the mine production rate of 12,000 tpd or 4,000,000 tpa. Simplified flow diagrams for the full processing plant
are given in Figure 17.1 and Figure 17.2.
| Silver Sand Project Pre-Feasibility Study |
| | New Pacific Metals Corp. | 0723071 |
| Figure 17.1 |
Leaching-CCD PFSD 1 |

| Silver Sand Project Pre-Feasibility Study |
| | New Pacific Metals Corp. | 0723071 |
| Figure 17.2 |
Leaching-CCD PFSD |
| Silver Sand Project Pre-Feasibility Study |
| | New Pacific Metals Corp. | 0723071 |
| 17.2 | Process design criteria |
The Process Design Criteria (PDC) developed as a basis
for flowsheet design and costing in the PFS is summarized in Table 17.1 below.
| Table 17.1 |
Process design criteria |
| Criteria |
Unit |
Design |
| Mean
Annual Throughput |
dmtpa |
4,000,000 |
| Crushing
Circuit |
Availability |
% |
75 |
| |
Operating
hours per annum |
h |
6,570 |
| |
Hourly
feed rate |
dmtpoh |
667 |
| Grinding
Circuit |
Availability |
% |
91.3 |
| |
Operating
Hours per annum |
h |
8,000 |
| |
hourly
feed rate |
dmtpoh |
500 |
| ROM
Characteristics Solids Specific Gravity |
t/m3 |
2.56 |
| (average
blend) |
Crushing
Work Index |
kW.h/t |
10.3 |
| |
Abrasion
Index |
g |
0.28 |
| |
Axb |
- |
45.2 |
| |
Rod
Mill Work Index |
kW.h/t |
7.5 |
| |
Bond
Ball Work Index |
kW.h/t |
14.8 |
| |
Silver
grade (average) |
g/t |
113 |
| |
Copper
grade |
g/t |
319 |
| Crushing
Circuit |
Feed
top size |
mm |
700 |
| |
Feed
size, F80 |
mm |
450 |
| |
Product
size, P80 |
mm |
125 |
| |
Peak
hourly throughput |
dmtpoh |
670 |
| Grinding
Circuit |
Feed
top size |
mm |
220 |
| |
Configuration |
|
SABC |
| |
SAG
mill feed size, F80 |
mm |
125 |
| |
Cyclone
overflow size, P80 |
µm |
75 |
| |
Applied
energy |
kWh/t |
23.8 |
| |
Hourly
Throughput |
dmtpoh |
500 |
| Pre-Leach
Thickener |
Diameter |
m |
30 |
| |
Unit
area |
t/m2/d |
15.5 |
| |
Underflow
% solids |
% |
48 |
| Leaching
Circuit |
Retention
time |
h |
72 |
| |
No
of tanks |
|
15 |
| |
Each
tank volume |
m3 |
3,925 |
| |
pH
range |
|
10.5
– 11.0 |
| |
NaCN
concentration |
g/L |
2.0 |
| |
Pulp
density |
%
solid |
45 |
| |
DO2
levels |
ppm |
12-15 |
| |
Silver
dissolution rate |
% |
91.0 |
| Silver Sand Project Pre-Feasibility Study |
| | New Pacific Metals Corp. | 0723071 |
| Criteria |
Unit |
Design |
| CCD |
No of stages |
|
4 |
| |
Thickener
diameter |
m |
35x1,
30x3 |
| |
Unit area |
t/m2/d |
11.4,
15.5 |
| |
Wash water
/ solids ratio |
w/w |
3.0 |
| |
Underflow
%solids |
% |
50-55 |
| |
Wash
efficiency |
% |
99.5 |
| Merrill
Crowe |
Clarifying
Filters |
# |
5
(4+1) |
| |
Filtration
area of each filter |
m2 |
188 |
| |
Zinc addition
rate |
kg
Zn/kg Ag |
1.5 |
| |
Lead nitrate |
kg
Pb(NO3)2/kg Ag |
0.6 |
| |
Precipitation
Filters |
# |
6
(5+1) |
| |
Precipitation
cycle time |
days |
1 |
| Refinery |
Precipitate cake handling
Moisture content of filter cake |
t/d
% |
10 (wet)
30 |
| |
Drying ovens |
# |
3 |
| |
Induction
furnace |
kW |
800 |
| |
Overall
Silver Recovery into doré |
% |
91.0 |
| Tailings |
|
|
|
| |
Tail filter
feed slurry density |
t/m3 |
1.51 |
| |
% Solids |
%
(w/w) |
55 |
| |
Tailings filter
capacity |
dmtph |
500 |
| |
Number of
filters |
# |
7 |
| |
Total
filtration area |
m2 |
5,600 |
The 4 Mtpa processing plant is
described in the following subsections and illustrated in Figure 17.3 to Figure 17.13.
ROM ore will be delivered to the
plant area in 70-tonne trucks and dumped via an earth ramp into an inload bin. The maximum particle size accepted into the plant will
be 700 mm. The inload bin will be discharged by a variable speed vibrating grizzly feeder (VGF) allowing both fines bypass and throughput
control for the primary jaw crusher. Approximately 50% of the ore will report to the crusher, whilst the finer fractions will pass through
the VGF onto the conveyor beneath, bypassing the crusher.
The jaw crusher, a 1200 mm x 1400
mm unit, will crush VGF oversize material with discharge falling onto a short sacrificial conveyor together with VGF fines. The sacrificial
conveyor will transfer primary crushed ore onto the stockpile feed conveyor via a lined chute that will also present the material to a
magnet that can remove tramp steel that might be present from time to time. The stockpile feed conveyor will transport the crushed ore
from the crushing station to the top of an uncovered conical stockpile that will provide a 16-hour throughput buffer at nominal rates.
Dust extraction and/or suppression
units will assist with the control of fugitive dust emissions around transfer points and will return captured fine material back to process
via internal recirculation.
The crushing circuit design is based
on an average 669 dmtph throughput rate, with an assumed operational availability of 75%.
| Silver Sand Project Pre-Feasibility Study |
| | New Pacific Metals Corp. | 0723071 |
The crushed ore stockpile will be
drawn down using three variable speed vibratory feeders (two running, one on standby). The feeders control the rate at which the stockpile
will be drawn onto the SAG Mill feed conveyor. A weightometer located on the SAG mill feed conveyor will measure and accumulate tonnage
rates, allowing for accurate process control and metallurgical accounting.
Lime will be added to the SAG mill
feed conveyor in powdered form to bring the pre-leach thickener feed slurry pH up to 9.5 - 9.8. The balance of lime (required to raise
pH to 10.5) will be added as a slurry directly to the first 2 leach tanks.
An 8.5 m diameter x 4.0 m EGL,
SAG mill with 5,500 kW single pinion drive will be fed with primary crushed ore via the SAG mill feed conveyor, whereupon it will be mixed
with cyanide-bearing process water and ground to a coarse pulp using 5” steel balls and other large rocks already part of the mill
charge. The SAG mill will be equipped with a VFD for speed control. As the slurry / pebble mixture is drawn from the SAG mill via internal
pan lifters and a discharge grate, it will pass over a vibrating screen fitted with 15 mm aperture panels. This screen will protect the
slurry pumps from oversize material, directing it instead into the pebble crushing circuit. The screen undersize stream, a coarsely ground
slurry of roughly 55% solids content by weight, will gravitate into the common mill discharge pumpbox where it will combine with ball
mill discharge slurry.
Scalping screen oversize material, consisting
mainly of pebbles, will discharge onto a recycle conveyor system equipped with self-cleaning magnets and a metal detector. The pebble
stream will discharge into a storage bin sized to provide a 15 to 20-minute capacity buffer. This storage bin will be discharged using
a vibrating pan feeder into the pebble crusher before being conveyed back to the SAG mill as a recycle stream. The pebble crusher will
reduce 50-60mm pebbles to 80% passing 10 mm.
Back at the SAG mill, discharge
screen undersize slurry will combine with ball mill discharge slurry and process water in the common mill discharge pumpbox. From here,
the slurry mixture will be pumped to a hydrocyclone cluster for classification. The cyclone underflow slurry (containing the coarse size
fractions) will gravitate to the ball mill for additional grinding, while the cyclone overflow slurry (containing the finer size fractions)
will gravitate to the pre-leaching thickener. Because of the presence of cyanide in the process water, a significant amount of silver
is expected to dissolve during grinding.
The ball mill will be a 6.2 m diameter
x 10.8 m EGL rubber lined overflow discharge unit with a 7,500 kW drive arrangement. A trommel screen on the mill discharge will protect
pumps and help to remove tramp steel and other coarse material that may exit via the mill overflow.
Grinding balls (125 mm diameter
for the SAG mill and 40 mm diameter for the ball mill) will be added to the SAG and ball mills on a regular basis in 2-tonne lots using
a system of electric hoists, magnets and ball loading kibbles.
Slurry spilled within the grinding
area will be directed into floor sumps, where vertical sump pumps will pump the collected spillage slurry back into the process.
The grinding circuit product (cyclone
overflow) will have a size specification of 80% passing 75 µm.
The grinding area structural steelwork
will be designed from day one to accommodate a future gravity concentration circuit (including concentrate regrinding) as this option
has shown promise in the recent testwork to increase silver recovery. The gravity concentration circuit is not included in base-case PFS
designs but is viewed as an obvious opportunity for further process improvement (via higher recovery, faster leach kinetics or reduced
cyanide consumption).
| Silver Sand Project Pre-Feasibility Study |
| | New Pacific Metals Corp. | 0723071 |
| 17.3.3 | Cyanide leaching circuit |
Cyclone overflow slurry at 33%
solids will gravitate from the grinding area to the pre-leach thickener area via a two-stage sampling station that will automatically
collect shift samples for metallurgical accounting purposes. Slurry bypassing the sampler will be directed onto a pair of trash screens
before entering the pre-leach thickener feed launder. A dilute flocculant solution will be mixed into the thickener feed slurry to accelerate
settling rates and to improve thickener overflow clarity.
As the finely ground solids settle
within the pre-leach thickener, rotating rakes within the thickener will direct material to the centre cone, and into the suction side
of the thickener underflow pumps. The thickener underflow pumps will pump thickened slurry from the thickener into the leaching tanks.
The leaching circuit will
consist of 15 agitated tanks in series. Each tank will contain roughly 4,000 m3 of slurry
and will be equipped with a 200kW twin blade agitator. Tanks will be cascaded, to allow gravity flow through the circuit. Lime slurry
will be added to the first 2 or 3 leach tanks to ensure that pH is maintained above 10.5 during the cyanidation process. A cyanide dosing
system will be provided to allow controlled addition to any tank. 72 hours of retention time will be provided by the leaching tanks,
assuming a slurry density of 1.42 t/m3 (i.e. 48 weight % solids). Higher densities may
be achievable in practice, and this would increase retention time (and possibly silver extraction rate) accordingly. Oxygen availability
is a particularly important aspect of the silver leaching process, and testwork has already demonstrated how initial dissolved oxygen
levels of >10 ppm are very beneficial to both silver extraction kinetics and cyanide consumption. To aid the efficient transfer of
oxygen into the circuit, an on-site oxygen plant and high-velocity gas injection spargers will be included in the leach tank design.
Slurry overflow from leach tank
#15 will gravitate into the feed mixing box of counter current decantation (CCD) thickener #1. A train of 4 CCD thickeners operating with
a wash ratio of 3:1 will provide the necessary solids / liquid separation after the leaching process to achieve a wash efficiency of greater
than 99%. Each CCD thickener will be equipped with flocculant dosing and mixing facilities, to accelerate solids settling rates and to
improve overflow clarity.
The CCD circuit will employ counter-current
washing of leached solids with barren solution to reduce residue solution silver losses to minimum practical levels. The thickened underflow
slurry from each CCD thickener will be pumped downstream (i.e. thickener #1 underflow is pumped to thickener #2 feed), whilst the overflow
solution from each thickener will gravitate from thickener #4 to #3 to #2 to #1. Efficient mixing of the upstream slurry and downstream
solution prior to entering the thickener is an important aspect of the design, and this will be effected through the use of static mixing
boxes directly ahead of each CCD thickener.
The overflow solution from CCD thickener
#1 will be the pregnant leach solution (PLS) and it is expected that this will contain about 99.5% of the silver dissolved during leaching.
Mass and solution balance calculations for the overall flowsheet indicate a PLS flowrate of approximately 1,850 m3/h.
| 17.3.4 | Zinc precipitation and silver dore production |
The PLS from CCD thickener
#1 will be pumped into a surge / storage tank ahead of the zinc cementation circuit. The 1,600 m3
tank will provide close to 1-hour of surge capacity in case the zinc cementation (Merrill Crowe) plant is shut down temporarily.
From the PLS storage tank, pregnant
solution will be pumped to the zinc precipitation circuit. This plant area will follow the standard Merrill Crowe flowsheet, with PLS
solution clarification, vacuum deaeration, zinc dust and lead nitrate addition, silver precipitate filtration, and precipitate handling.
Two stages of solution clarification have been allowed for, with a large sand filter providing
| Silver Sand Project Pre-Feasibility Study |
| | New Pacific Metals Corp. | 0723071 |
additional solids removal capacity
under non-ideal conditions. Thereafter, a set of five automatic leaf filters (4 operating, one on standby) will further reduce solids
content to no more than 1 ppm. An automatic precoat system will be employed to assist the capture of ultrafine solid particles whilst
maintaining reasonable media permeability. Diatomaceous Earth is used as the precoat medium and is added as a slurry at the commencement
of a clarification cycle (pre-coat) and during the cycle (body feed).
Silver precipitate filter cake will
be removed from the precipitate filter presses at a rate of roughly 2 tonnes (wet) per press every 2-day cycle, with an assumed 75% silver+copper
grade and a 30% cake moisture content. As the precipitate is expected to contain significant quantities of copper in some cases, the flowsheet
makes allowance for an oxidative sulphuric acid leaching stage, which will preferentially leach copper into solution without mobilizing
silver. This is standard operating practice when copper levels become problematic for precious metal doré production. The sulphuric
acid leaching area will be very well ventilated due to the risk of HCN generation. Likewise, the acid solution storage/reticulation will
be closely monitored and strictly contained within a small area of the refinery. A small amount of silver may dissolve in sulphuric acid
solution under the oxidizing conditions. When this happens, the dissolved silver will be precipitated with the addition of sodium chloride.
As copper levels in the sulphuric
leach solutions reach a threshold level, then a solution bleed will become necessary. Allowance has been made for the bleed stream to
be neutralized and pumped to tailings as required (The precipitated copper will dissolve instantaneously upon contacting with cyanide
in the tailing slurry. Therefore, it is better to filter it separately and then dispose it separately in an isolated area at the TSF).
Sulphuric leach residues will be
silver rich, and these will be filtered and dried in ovens prior to transportation to the doré smelting area. Dry residue material
will be mixed with fluxes in a flux mixing area, and then added to one of three induction furnaces for smelting. Once smelting is completed,
slag is skimmed from the melt surface and the molten doré metal is poured into pre-heated moulds. The resultant doré bars
will be cleaned and stored within the refinery vault.
As the Merrill Crowe process is
expected to be ~99% efficient, filtrate from the silver precipitation pressure filter will contain only traces of silver although it will
still contain significant cyanide levels. The filtrate, known as “barren solution”, will be directed to a 1,600 m3
surge tank – sized to give almost 1 hour of surge capacity. From the surge tank, pumps will distribute barren solution back into
the grinding, leaching and CCD process areas to ensure efficient recycling of cyanide whilst also retaining any residual dissolved silver.
As a result of the relatively high
cyanide concentrations required for effective silver dissolution, the solution within CCD residue slurry will still contain a significant
amount of free cyanide. Effective dewatering of the residue prior to disposal on the tailing storage facility is therefore important,
for environmental and economic reasons.
The residue slurry is pumped at roughly
60% solids (by weight) from the CCD area to the tailing filtration area for thorough dewatering before disposal. An agitated tailing filter
feed tank provides over 1-hour of surge capacity between the CCD circuit and the pressure filtration plant.
Slurry from the filter feed tank
will be pumped to one of seven tailings pressure filters for further dewatering. Each tailing filter will use high pressure feed pumping,
followed by membrane squeezing and air blowing to drive remaining moisture levels down to give a filter cake product that achieves transportable
moisture targets (less than 15% moisture). Each filter will discharge automatically using plate shifters to allow a rapid cycle time and
high throughput rates.
| Silver Sand Project Pre-Feasibility Study |
| | New Pacific Metals Corp. | 0723071 |
Cake from each press will gravitate
via platework onto a dedicated discharge conveyor belt which in turn feeds onto the overland tailing conveyor.
The overland tailing conveyor will
transfer cake from the process area to the tailing storage area. The overland conveyor will discharge onto a radial stacking conveyor
which will deposit cake in a large semi-circular pile near the edge of the storage facility. The radial stacking arrangement will operate
on a highly compacted pad area and will allow for safe cake removal and distribution using bulldozers.
Filtrate recovered from residue
slurry by the tailing pressure filters will be directed to a filtrate holding tank and then pumped back to the process water tank where
it will be re-used within the process area.
The filter cake will be washed using
cyanide-free make-up water to achieve 50% wash efficiency in order to improve recovery of cyanide.
Reagents will be delivered to site by road, and suitable
offloading, storage, mixing and dosing facilities will be provided within the process area. Addition of the following chemicals is anticipated:
Where practical, dry reagents (flocculant,
lead nitrate, zinc powder etc.) will be offloaded and stored within the dedicated reagents storage area. Lime will be offloaded into and
stored in a lime silo adjacent to the plant. Lime slaking, slurry storage and distribution will be located inside the building, within
the reagents area.
A ventilated storage and mixing
area will be provided for sodium cyanide and this will be kept apart from other reagent areas. Fixed HCN (hydrogen cyanide) gas detectors
will be located within the building at strategic points, and personnel will wear appropriate personal protective equipment and portable
HCN monitors.
Flocculant will be mixed in packaged mixing/dosing systems
that will include mixing / hydration tanks and storage tanks.
Acid, caustic soda, hydrogen peroxide and antiscalent will
be delivered in 1,000 litre FIBC containers and the reagents will be dosed directly from these as required using reagent dosing pumps.
Raw water will be pumped to site (by others) and stored within
several storage tanks and earth impoundments, to ensure that sufficient water will always be available for processing.
| Silver Sand Project Pre-Feasibility Study |
| | New Pacific Metals Corp. | 0723071 |
Raw water and process water pumps
will distribute water as required throughout the process plant. Process water is recovered from the tailing thickener and recycled within
the plant.
A significant volume of pregnant
and barren solutions will also add to the volume of water stored and recycled within the process plant.
Instrument grade compressed air
will be distributed throughput the plant for actuation of control valves and operation of other instruments.
Oxygen will be generated using
vacuum pressure swing technology and piped to spargers on leach tanks at roughly 600 kPa. The spargers allow rapid oxygenation of slurry
within the early stages of leaching.
| 17.4 | Process plant flowsheets |
The process plant is illustrated
via a series of Process Flow Diagrams (PFD’s) in Figure 17.3 to Figure 17.12 on the following pages.
| 17.5 | Process plant layout drawings |
The process plant is further described
by layout drawings, shown in Figure 17.13.
These drawings form the basis for
the estimation of material quantities used in the capital cost estimate (discussed in Section 21).
| Silver Sand Project Pre-Feasibility Study |
| | New Pacific Metals Corp. | 0723071 |
| Figure 17.3 |
Process flowsheet: Comminution |
| Silver Sand Project Pre-Feasibility Study |
| | New Pacific Metals Corp. | 0723071 |
| Figure 17.4 |
Process flowsheet: Leaching |

| Silver Sand Project Pre-Feasibility Study |
| | New Pacific Metals Corp. | 0723071 |
| Figure 17.5 | Process flowsheet: Counter current decantation |

| Silver Sand Project Pre-Feasibility Study |
| | New Pacific Metals Corp. | 0723071 |
| Figure 17.6 | Process flowsheet: Merrill Crowe (1) |

| Silver Sand Project Pre-Feasibility Study |
| | New Pacific Metals Corp. | 0723071 |
| Figure 17.7 | Process flowsheet: Merrill Crowe (2) |

| Silver Sand Project Pre-Feasibility Study |
| | New Pacific Metals Corp. | 0723071 |
| Figure 17.8 | Process flowsheet: Tailings dewatering |

| Silver Sand Project Pre-Feasibility Study |
| | New Pacific Metals Corp. | 0723071 |
| Figure 17.9 | Process flowsheet: Refinery |

| Silver Sand Project Pre-Feasibility Study |
| | New Pacific Metals Corp. | 0723071 |
| Figure 17.10 | Process flowsheet: Services (Gas) |

| Silver Sand Project Pre-Feasibility Study |
| | New Pacific Metals Corp. | 0723071 |
| Figure 17.11 | Process flowsheet: Reagents |

| Silver Sand Project Pre-Feasibility Study |
| | New Pacific Metals Corp. | 0723071 |
| Figure 17.12 | Process flowsheet: Services (Water) |

| Silver Sand Project Pre-Feasibility Study |
| | New Pacific Metals Corp. | 0723071 |
| Figure 17.13 | Site plan: Process plant area |

| Silver Sand Project Pre-Feasibility Study |
| | New Pacific Metals Corp. | 0723071 |
| 17.6 | Major equipment lists |
The following table lists the major equipment items by process
area, together with installed power ratings (where applicable).
| Table 17.2 | Equipment list summary |
| Plant area |
No. off |
Equipment description |
Installed power, kW |
| Unit |
Total |
|
Crushing |
1 |
Vibrating Grizzly Feeder |
30 |
30 |
| 1 |
Primary Jaw Crusher |
200 |
200 |
| 1 |
Dust Extraction Systems |
11 |
11 |
| 1 |
Sacrificial Conveyor |
30 |
30 |
| 1 |
Magnets/Metal Detectors |
5 |
5 |
| 1 |
Stockpile Feed Conveyor |
75 |
75 |
|
Ore Storage |
3 |
SAG Mill Stockpile feeders |
30 |
90 |
| 1 |
Dust Extraction Systems |
7.5 |
7.5 |
| 1 |
SAG Mill Feed Conveyor |
45 |
45 |
|
Grinding |
1 |
SAG Mill |
5500 |
5,500 |
| 1 |
Ball Mill |
7500 |
7,500 |
| 1 |
Scalping Screen |
55 |
55 |
| 2 |
Cyclone Feed Pumps |
600 |
1,200 |
| 1 |
Cyclone Pack |
- |
- |
| 1 |
Cyclone Overflow Sampler |
11 |
11 |
| 2 |
Grinding Area Sump Pumps (2 off) |
22 |
44 |
| 1 |
Misc. minor Items |
100 |
100 |
|
Pebble Crushing |
3 |
Pebble Crusher Conveyors |
15 |
45 |
| 1 |
Magnets/Metal Detectors |
7.5 |
7.5 |
| 1 |
Feeder |
7.5 |
7.5 |
| 1 |
Pebble Crusher |
132 |
132 |
|
Leaching & CCD |
1 |
Pre-Leach Thickener |
15 |
15 |
| 2 |
Pre-Leach Thickener U/F Pump |
250 |
500 |
| 15 |
Leaching Tanks, 4,000m3 |
- |
- |
| 15 |
Leaching Tank Agitator |
175 |
2,625 |
| 2 |
Samplers |
5.5 |
11 |
| 4 |
CCD Thickener |
15 |
60 |
| 8 |
CCD Thickener U/F Pumps |
125 |
1000 |
| 2 |
CCD Area Sump Pump |
15 |
30 |
|
Tailings |
5 |
Tailings Filter Press |
300 |
1,500 |
| 5 |
Cake discharge Feeder |
11 |
55 |
| 1 |
Filtrate Tank |
- |
- |
| 2 |
Filtrate Pumps |
55 |
110 |
| 1 |
Tailings Filter Press Feed Tank |
- |
- |
| 1 |
Filter Press Feed Tank Agitator |
55 |
110 |
| 2 |
Tailings Filter O/Land Conveyors |
70 |
140 |
| 3 |
Tailings Filter Press Feed Pump |
110 |
330 |
| 1 |
Misc. minor Items |
40 |
40 |
| Silver Sand Project Pre-Feasibility Study |
| | New Pacific Metals Corp. | 0723071 |
| Plant area |
No. off |
Equipment description |
Installed power, kW |
| Unit |
Total |
|
Merrill
Crowe +
Smelting |
1 |
Pregnant Solution Tank |
- |
- |
| 2 |
Pregnant Solution Pump |
150 |
300 |
| 5 |
Merrill Crowe: Leaf Filters |
75 |
150 |
| 1 |
Merrill Crowe: Crowe Tower |
55 |
55 |
| 4 |
Merrill Crowe: Zinc Precipitation |
30 |
60 |
| 1 |
Precoat/Body Coat System |
30 |
30 |
| 1 |
Merrill Crowe Smelting/Refining Package |
1250 |
1,250 |
| 1 |
Acid leaching and filtration package |
55 |
55 |
| 1 |
Misc. minor Items |
40 |
40 |
|
Reagents |
1 |
Cyanide Mixing & Dosing System |
50 |
50 |
| 1 |
Lime Vendor Package |
120 |
120 |
| 2 |
Lime Dosing Pump |
45 |
90 |
| 1 |
NaOH mixing & dosing package |
22 |
22 |
| 1 |
Surfactant mixing & dosing package |
10 |
10 |
| 1 |
Flocculant mixing & dosing package |
30 |
30 |
| 1 |
Lead Nitrate mixing/dosing package |
22 |
22 |
| 1 |
Oxygen Plant Package |
600 |
600 |
| 2 |
Reagent Storage area ventilation fans |
15 |
30 |
| 1 |
Misc. minor Items |
40 |
40 |
|
Services |
1 |
Process Water Tank |
- |
- |
| 2 |
Process Water Pump |
250 |
500 |
| 2 |
Gland Water Pump |
30 |
60 |
| 2 |
Fresh Water Pump |
90 |
180 |
| 1 |
Fire Water System |
15 |
15 |
| 1 |
Misc. minor Items |
40 |
40 |
| 2 |
Compressors |
300 |
600 |
The process plant equipment includes
an installed power rating of approximately 24.5MW. Initial estimates of power consumption for this process plant under normal operating
conditions gives an applied power of 36.4 kWh/t.
| 17.7 | Process control philosophy |
A control philosophy will be implemented
for the Project that is typical of those used in similar modern processing operations.
Field instruments will provide
analog and digital inputs to a group of Programmable Logic Controllers (PLCs) or a Distributed Control System (DCS). Process control cubicles
will be located within the local Motor Control Centres (MCCs) and will contain the system hardware, power supplies and I/O cards for instrument
monitoring and loop control.
The PLC/DCS infrastructure will assist the plant operators
with process control functions by providing the following services:
| · | Communicating the status information of all drives, instruments, and vendor packages. |
| · | Allowing remote drive control (stop / start) and required process interlocking. |
| · | Providing PID (proportional-integral-derivative) control for various control loops. |
| Silver Sand Project Pre-Feasibility Study |
| | New Pacific Metals Corp. | 0723071 |
The main Human-Machine Interface
(HMI) will be in a Main Control Room (MCR) and a Crusher Control Room (CCR), consisting of PC-based terminals with industrial keyboards
and mice. The Supervisory Control and Data Acquisition (SCADA) system architecture will be configured to provide outputs to alarms, control
the function of process equipment, and provide logging and trending facilities to assist in analysis of plant operations.
The control rooms will be purpose-built
structures. Much of the plant will be controlled from the MCR, to be located adjacent to the grinding area. Operator control stations
are fully redundant so that the failure of one station does not affect the operability of the other station or control of the plant. Control
stations are supplied from an Uninterruptible Power Supply unit (UPS) with at least 30 minutes standby capability.
Drives that form part of a vendor
package will be controlled from the vendor’s control panel. As a minimum requirement, ‘Run’ and ‘Fault’
signals from each vendor control panel are made available to the SCADA system via the PLC.
The general control strategy adopted for the Project will
be as follows:
| · | Integrated control via the Process Control System (PCS) for areas where
equipment requires sequencing and process interlocking. |
| · | Hard-wired interlocks for personnel safety. |
| · | Motor controls for starting and stopping of drives
at local control stations via the PCS or hard-wired, depending on the drive classification. All drives can always be stopped from the
local control station. Local and remote starting is dependent on the drive class and control mode. |
| · | Control loops via the PCS except where exceptional circumstances apply. |
| · | Monitoring of all relevant operating conditions on
the PCS and recording selected information for data logging or trending. |
Trip and alarm inputs to the PCS
will be failsafe in operation, i.e., the signal reverts to the de-energized state when a fault occurs.
| Silver Sand Project Pre-Feasibility Study |
| | New Pacific Metals Corp. | 0723071 |
As a comprehensive greenfield project,
the Silver Sand project will require the development of supporting infrastructure. This would include the following items:
| · | A process plant that will include crushing, conveying,
grinding, leaching, counter current decantation (CCD), leach residue dewatering and disposal, zinc precipitation (Merrill Crowe), and
doré smelting. |
| · | An assay lab in close proximity to the process plant. |
| · | A warehouse and truck shop. |
| · | Administration offices and supporting infrastructure. |
| · | Filtered TSF and structural earth dams, initial waste rock piles. |
| · | A network of access and on-site roads. |
| · | A fresh water supply and distribution system. |
| · | Power supply and distribution, including a power transmission line, a
substation at the plant site, and power distribution lines throughout the site. |
| · | Contractor’s camp and facilities. |
Tentative locations have been identified
for the above facilities. The final location of these facilities is dependant on further exploration drilling program to ensure there
is no sterilization of Mineral Resources as well as accessibility. All facilities will be located close to the plant site in an elevated
and dry area.
Figure 18.1 shows the location of
the Property in relation to city of Potosí and principal supporting infrastructure. As there is no rail access to the mine / concentrator
site, delivery of all supplies and services, and reagents to the site will be by truck.
| Silver Sand Project Pre-Feasibility Study |
| | New Pacific Metals Corp. | 0723071 |
| Figure 18.1 | Silver Sand site location |
Source: New Pacific Metals
Corp, 2022.
Figure 18.2 shows the proposed site
layout with the ultimate pit, waste dumps, process plant, filtered TSF, ore stockpiles, crusher, site access road, water reservoir, truckshop,
accommodations, explosives magazine and haul roads.
| Silver Sand Project Pre-Feasibility Study |
| | New Pacific Metals Corp. | 0723071 |
| Figure 18.2 | Preliminary site infrastructure layout |
Source: AMC Mining Consultants (Canada) Ltd.,
2024.
| Silver Sand Project Pre-Feasibility Study |
| | New Pacific Metals Corp. | 0723071 |
The Property is situated in the
Colavi District of Potosí Department in southwestern Bolivia, 25 km north-east of Potosí city, the department capital. The
current access road is shown in the above figure.
The Property is accessible from Potosí
via a 54 km long road made up of a 27 km stretch of the paved Bolivia National Highway 5 and an all-season gravel road built for mining
in the Colavi District. The gravel road is currently being widened and upgraded to paved road by the government.
Plant roads will be constructed
in and around the process plant area to provide access to buildings and equipment for deliveries, operation, and maintenance access. These
roads will be two-way unsealed roadways nominally 10 m wide to accommodate highway trucks and other site equipment as required.
The Silver Sand project is estimated
to require approximately 25 MW of power annually.
New Pacific has engaged with Bolivia’s
national power supply companies CNDC and ENDE. A preliminary power supply plan for the Silver Sand future operations has been discussed
and agreed upon. The Company has submitted a power supply application to the Bolivia Ministry of Energy following the formal procedure
in the country. The Ministry of Energy has issued an official letter to the Company acknowledging the application.
A transmission line connects to
the Potosí existing ENDE substation, and a substation on the Silver Sand site needs to be constructed. CNDC and ENDE have provided
a quotation to Silver Sand project to construct a 55 km powerline from Potosí to the project site. When the Company commits to
building the power supply infrastructure, ENDE will be responsible for permitting and constructing the transmission line and the substation
at the Silver Sand site. It is estimated that the permitting and construction of the transmission line and the substation will take up
to two years.
Figure 18.2 which is the site plan
shows the alignment of the proposed powerline to the Silver Sand property.
Bolivia is a country with an abundant
quantity of energy. There are many suppliers of power. National grid power supply for the Silver Sand project has been determined to be
the most suitable choice for the project. However, the company is also very active in pursuing green mine concept and is studying the
use of solar and windmill energies.
The main substation at site will
consist of disconnect switches, circuit breakers, protection equipment, utility-tie transformers, power factor correction capacitors,
and medium voltage switchgear. The calculated total running load of the facility is approximately 25 MVA. Two 115/6.6 kV transformers
will be installed, with the load being distributed evenly to each in normal operation. Each transformer will be sized such that in the
event of a failure of one transformer, the remaining one can provide the total required plant load capacity. Two 2,500 kW diesel generators
will be installed at the main substation to provide critical backup in the event of a utility outage.
Three 6.6 kV feeders will be run
from the substation to the process plant – main feeder 1, main feeder 2, and an emergency feeder. In normal operation, the two main
feeders will be utilized. The emergency feeder will be energized in the event of a failure of one of the two main feeders. Additional
overhead line feeder circuits will be run to the camp and workshop areas of the facility, as well as the explosives magazine.
| Silver Sand Project Pre-Feasibility Study |
| | New Pacific Metals Corp. | 0723071 |
Water has not been a concern at
the Property. Water for domestic use can be sourced from a small lake, approximately 3.5 km north-west of the Property. Water for drilling
can be sourced from nearby drainages.
A hydrological and hydrogeological
conceptual study was completed by Itasca Chile in October 2022. 3 piezometers were also installed in the main open pit area to monitor
the groundwater flow.
A water dam will be built upstream
from the mine (Figure 18.3) in the narrowest part of the creek to hold the water in a reservoir with a capacity of about 3.0 million cubic
metres. A cross-section through the dam is shown in Figure 18.4.
The water dam will be constructed
as a rockfill embankment with an upstream Bituminous Geomembrane Liner system. Run-of-mine rockfill will be used to construct the majority
of the embankment. Upstream zones of select run-of-mine rock, transition and bedding will be constructed below the liner system, to provide
a smooth surface for construction of the liner. The liner will be anchored and sealed to bedrock at the upstream toe of the dam, to provide
a cutoff and reduce potential seepage losses from the reservoir. An emergency overflow spillway will be excavated through rock on the
north abutment to pass runoff from extreme storm events once the reservoir has reached the full supply level.
| Figure 18.3 | Water dam overview |

Source: NewFields Canada
Mining & Environment ULC, 2024.
| Silver Sand Project Pre-Feasibility Study |
| | New Pacific Metals Corp. | 0723071 |
| Figure 18.4 | Water dam cross section |
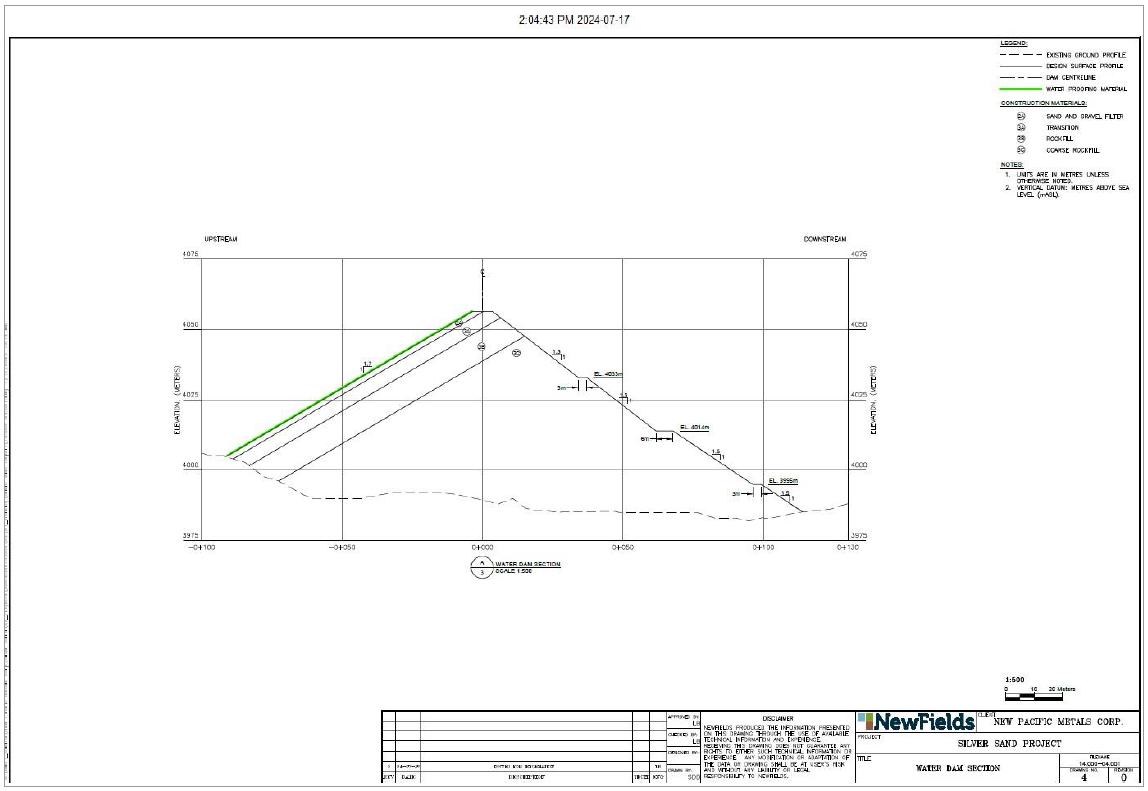
Source: NewFields Canada
Mining & Environment ULC, 2024.
This will provide water for the
mineral processing plant and mining camp and could supply downstream residents for farming and daily life water needs if required. It
is expected that the water dam will reach full supply level within about four years of start of filling, under average precipitation conditions,
while also providing make-up water to the process plant.
The average make-up water
requirement for the process plant is estimated at about 2,200 m3 per day, that is equivalent
to the maximum water usage per year of the project estimated at 0.8 million m3. This
is below the capacity of the reservoir of 3.0 million m3. However, Silver Sand project
area has about eight months of dry season every year.
Most of the processing water will
be recycled and reused, except the moisture trapped in the dry tailings that either remains locked within voids or evaporates. No processing
water will be discharged without treatment.
A small fuel storage facility with
a capacity for one week of operations or approximately 400,000 litres has been allowed for. This will be needed to supply fuels to the
onsite light vehicles and mill maintenance equipment. Mining will be contracted to third-party companies. They will build their own fuel
storage facilities onsite. Initially the contractor will be providing its own fuel requirements.
| Silver Sand Project Pre-Feasibility Study |
| | New Pacific Metals Corp. | 0723071 |
| 18.7 | Offices and warehouse |
Offices with a capacity of 35 employees
has been designed and costed for the project and warehouses are planned to be built onsite, close to the processing plant.
| 18.8 | Equipment maintenance workshop |
Heavy equipment maintenance workshop
is planned to be built and used by the mining contractor. Silver Sand has also costed a 6-bay truck shop equipped with a 5-tonne travelling
crane for the shop.
Explosive and accessory depots will
be built, with all the standards and specifications required by the government for the use and handling of explosives. The consumption
is expected to be approximately 3,500 – 3,800 tonnes per year.
The Silver Sand site has an excellent
cell phone signal. Most mobile phones can receive 3G / LTE signal on site. However, a radio communication system is planned to be constructed
for everyday operations communication.
| 18.11 | Gate house / security |
Security gates and fences are planned
to be built around the mine operations area.
Most employees will be commuting
from the nearby Potosí. However, a camp with capacity for 100 persons has been allowed for those who will be working at site and
not residing in the area. Accommodations are envisaged to be built close to the processing plant.
| 18.13 | Filtered tailings storage facility |
The filtered TSF will be integrated
within the waste rock storage area. The TSF will be fully lined to provide protection against release of potentially contaminated water
to the local surface and groundwater systems. A leachate collection system will be installed below the liner system to collect any seepage
that may occur through small holes in the TSF liner system.
The TSF will be
developed in a valley to the south of the mine and process plant as shown in Figure 18.2. A seepage and runoff collection pond will
be developed downstream of the TSF. An initial starter berm of mine waste rock will be constructed on the south and east sides of
the facility to provide structural support for the tailings and liner system. A starter TSF cell will be developed along the western
perimeter of the waste rock storage facility, with sufficient capacity to store tailings from the first one year of operations. The
general layout of the TSF and waste rock storage facility is shown in plan in Figure 18.5 and a section view of the waste dump and
TSF is shown in Figure 18.6.
The TSF will be raised as required
over the operating life of the facility. Suitable waste rock is expected to be place continuously as it becomes available from the mining
operations. Compaction of the waste rock will be provided by the fully loaded mine haul trucks and dozers used for spreading the rockfill
in thin layers.
As discussed, the TSF will be fully
lined with a linear low-density polyethylene (LLDPE) liner system, which will be constructed over a prepared foundation of the base of
the facility and will extend up the upstream slope of the perimeter waste rock containment berm. On the perimeter berm, zones
| Silver Sand Project Pre-Feasibility Study |
| | New Pacific Metals Corp. | 0723071 |
of processed transition and liner
bedding material will be placed over the bulk rockfill, to provide a smooth surface on which to construct the liner. The transition and
bedding materials will be compacted using a vibratory drum roller.
Source:
NewFields Canada Mining & Environment ULC, 2024.
| Silver Sand Project Pre-Feasibility Study |
| | New Pacific Metals Corp. | 0723071 |
| Figure 18.6 | TSF sectional view |
Source: NewFields Canada
Mining & Environment ULC, 2024.
Filtered tailings will be transported
approximately 1,000 m from the process plant to the filtered TSF via an overland conveyor. The overland conveyor will discharge the tailings
onto a radial stacking conveyor which will discharge the tailings onto a semi-circular pile within the lined facility. Tailings deposited
onto the radial stacking conveyor stockpile will be removed, spread and nominally compacted using a bulldozer. As containment of the tailings
will be provided through the placement of waste rock to the south and east of the TSF, safe operation of the TSF will only require sufficient
compaction to provide a safe working surface for the mobile equipment.
As noted above, the
perimeter containment berms for the TSF will be constructed of run-of-mine waste rock. Based on the chemical analysis completed,
waste rock will be separated into three categories based on the total suphur content of the waste (<1% Sulphur, 1% to 2% Sulphur
and >2% Sulphur). Approximately 3% of the total waste rock has a total sulphur content greater than 2%. This material will be
disposed in the TSF and intermingled with the placed tailings, to limit oxygen exposure of this material. In general, waste rock
with less than 1% Sulphur will be used for construction of the perimeter containment berms for the TSF.
As the tailings will be filtered,
there will be no excess tailings transport water which will require management throughout operations. The main source of excess water
will be runoff from precipitation events during the wet seasons at the site. Any tailings contact water from precipitation events will
be collected in internal sumps or the Seepage Collection Pond at the downstream end of the facility and recirculated to the process plant
for re-use in the milling process.
| Silver Sand Project Pre-Feasibility Study |
| | New Pacific Metals Corp. | 0723071 |
To reduce the volume of water that
will contact the placed tailings and waste rock during precipitation events, a series of diversion ditches will be excavated around the
perimeter of the TSF. The diversion ditches will direct non-contact runoff around the TSF to natural drainage courses downstream of the
facility. Contact run-off will be collected in a seepage and runoff collection pond which will be constructed at the south end of the
facility. Water collected within the pond, will be pumped back to the process plant for use as process water. It is anticipated that the
seepage and runoff collection pond will be dry for at least four months of the year.
A site wide water balance
was developed for the project. Based on the available climate and operational data, it is estimated that the operation will require approximately
2,200 m3/day of make-up water on average over the operating life of the mine. The make-up
water will come from a number of sources including runoff from the waste storage facility (seepage collection pond), plant site runoff
and from the water supply reservoir. Make-up water will only be taken from the water supply reservoir when insufficient make-up water
is available from other sources of contact water on site. The remainder of the process water requirements will come from recycle from
the thickeners and filter plant, as well as seepage and runoff recycled from the seepage and runoff collection pond.
For further detailed description refer to Section 17. The
selected flowsheet represents a very conventional, low-risk approach to silver extraction, and consists of the following unit operations:
| · | ROM receiving, crushing, and crushed
rock storage. |
| · | Stockpile discharge, grinding
via SAG milling, and ball milling. |
| · | SAG mill pebble crushing via SAG
mill pebble ports, scalping screen, recycle conveyors, and cone crusher. |
| · | Pre-leach thickening and cyanide
leaching using stirred, oxygen sparged tanks. |
| · | Liquid / solid separation using
counter-current decantation (thickeners). |
| · | Recovery of silver from pregnant
leach solution using a zinc precipitation process followed by drying and smelting with fluxes to produce silver doré bars. |
| · | Filtration of leach residues. |
| · | Conveying of filter cake and long-term
storage at the tailing storage area. |
| · | Crusher and conveyor locations
shown in plant layout below. |
There is currently no infrastructure on site.
The plant
layout is shown in Figure 18.7.
| Silver Sand Project Pre-Feasibility Study |
| | New Pacific Metals Corp. | 0723071 |
| Figure 18.7 | Topography and infrastructure plant layout |
Source: Halyard Inc., 2024.
| Silver Sand Project Pre-Feasibility Study |
| | New Pacific Metals Corp. | 0723071 |
| 19 | Market studies and contracts |
The Silver Sand Project will produce
doré bars that will contain at least 95% silver. Impurities consist mainly of base metals, which must be removed to produce silver
bullion of 99.9% purity. The global market for silver doré of this quality is very well established, and refineries around the
world are willing to purchase and refine doré for bullion production.
Silver, whether in 99.9% bullion
form or otherwise, is considered a global commodity and is widely traded through a variety of outlets. As such, a project-specific market
study is considered unnecessary at this stage of the project. Silver bullion is commonly traded through the London Bullion Market Association
(LBMA) and via futures contracts on The Commodity Exchange Inc. (COMEX) in New York.
Relative to global markets such
as copper or gold, the global silver market is less significant in value. According to data published by the Silver Institute, total silver
supply in 2023 reached 1,011 million ounces (Moz) and demand outstripped that by approximately 184 Moz. Global mine production fell by
1% (year on year) in 2023 to 830 Moz with primary silver production making up 28% (235 Moz) of that amount.
With an average 2023 spot silver
price of US$23.35 per ounce, the value of total silver supply in 2023 reached US$23.6 billion.
As a result of its relatively small
market value, the price of silver can be somewhat variable/volatile. This makes short-term predictions and/or forecasts less reliable.
However, plotting the price of silver over the last 5 years (Figure 19.1) a long-term rising price trend is readily apparent. Calculating
average prices over various time periods within this 5-year window, the average values are noted in Table 19.1.
| Table 19.1 | Average silver prices by period |
| Period |
Value (US$/Oz) |
| June 2019 – May 2024 (5 Years) |
22.2 |
| June 2020 – May 2024 (4 Years) |
23.6 |
| June 2021 – May 2024 (3 Years) |
23.3 |
| June 2022 – May 2024 (2 Years) |
22.9 |
| June 2023 – May 2024 (1 Year) |
24.2 |
| Silver Sand Project Pre-Feasibility Study |
| | New Pacific Metals Corp. | 0723071 |
| Figure 19.1 | Historical silver prices (May 2019 to May 2024) |
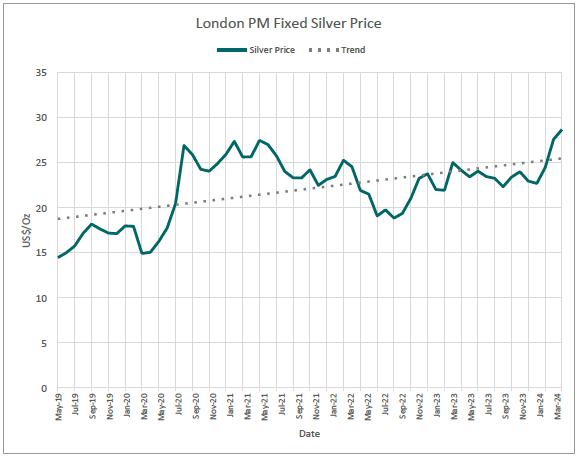
Source:
LBMA (London Bullion Market Association) London PM Fix, 2024.
For the Silver Sand project, the
QP has reviewed a selection of consensus forecasts and public disclosures by existing silver producers, in addition to recent publications
by the Silver Institute and the CPM Group. These references, together with the price history and trend analysis given above, indicate
that a silver price of US$24.00 per troy ounce is an applicable input to the PFS economic analysis.
Other price assumptions, used for
resource and reserve calculations, are given in Section 14 and Section 15, respectively.
Several contracts are envisaged
for the project, however none of these are in place or are being negotiated at the time of writing.
| 19.2.1 | Product sales contracts |
Although these are considered necessary
once operations commence, no contracts for the sale of silver doré are in place at this stage of project development.
| Silver Sand Project Pre-Feasibility Study |
| | New Pacific Metals Corp. | 0723071 |
The PFS has assumed typical contract
terms for the product, including a 99.5% payable for the silver content of doré, and a $0.20 per troy ounce refining charge.
Doré must be transported
from site to the refinery, and a transportation and insurance cost of $0.25 per troy ounce has been included in the PFS economic analysis.
New Pacific does not presently plan
to hedge silver sales, and the PFS has assumed products would be sold on the spot market.
| 19.2.2 | Services and supplies |
In addition to the typical supply
contracts for various consumables including grinding media, explosives, process plant reagents, and maintenance spares, the PFS envisages
several contract services, including inter alia:
| · | Supply of power |
| · | Mining operations contractor |
| · | Specialized services for processing |
| · | Miscellaneous consulting services |
| · | Transportation of personnel |
These would typically be negotiated
and finalized closer to the commencement of operations.
| Silver Sand Project Pre-Feasibility Study |
| | New Pacific Metals Corp. | 0723071 |
| 20 | Environmental studies, permitting and social or community impact |
In order to obtain the environmental
license for the Arena de Plata (Silver Sand) mining project in the department of Potosí, New Pacific is preparing studies and activities
that will allow it to provide a comprehensive Analytical Environmental Impact Assessment Study (EEIA-AI) in accordance with the current
environmental legislation in force in the Plurinational State of Bolivia, a study that is prepared by an independent engineering firm
and registered with the Plurinational State of Bolivia (www.tierralta.org).
In the area there are current sources
of pollution that come from activities other than those proposed by New Pacific, such as mining carried out by local community members
and/or mining cooperatives and agricultural activities. Additionally, within the sector there is evidence of abandoned mining operations
with environmental liabilities, that in some cases are sources of contamination such as Acid Rock Drainage (ARD).
| 20.2 | Environmental legislation and applicable procedures |
According to the model of living
well, in harmony, balance, care and protection of Mother Earth, the Silver Sand mining project, is subject to compliance with Bolivian
laws and regulations on environmental matters, it is important to highlight:
| · | The Political Constitution of the State (CPE), decreed
on 7 February 2009, has the purposes and goals of constituting a just and harmonious society, to guarantee the well-being, preserving
plurinational diversity as historical and human heritage and promoting the responsible and planned use of natural resources in preserving
the environment, for the well-being of current and future generations. |
| · | Law 071, Law on the Rights of Mother Earth, enacted
on 21 December 2010, aims to recognize the rights of Mother Earth, as well as the obligations and duties of the Plurinational State and
society to ensure respect for these rights. |
| · | Law 300, Framework Law of Mother Earth and Integral
Development for Living Well, promulgated on 15 October 2012, establishes the vision and foundations of integral development in harmony
and balance with Mother Earth for Living Well, within the framework of the complementarity of rights, obligations and duties of all sectors
of the central level of the Plurinational State of Bolivia and the autonomous territorial entities. |
| · | Law No. 1333 “Environmental Law” enacted
on 27 April 1992, is the fundamental axis of national environmental policy and marks the formal beginning of the Bolivian environmental
regulation process. The main objective of this Law is to protect and conserve the environment without affecting the development of the
country. This Law includes aspects related to renewable and non-renewable natural resources, environmental education, citizen participation,
sanctions, and others. |
| · | The Regulations of the Environmental Law, promulgated
by Supreme Decree 24176 of 8 December 1995, issue six regulations referring to: |
| ¾ | General Environmental Management Regulation (Reglamento
General de Gestión Ambiental; RGGA). |
| ¾ | Environmental Prevention and
Control Regulation (Reglamento de Prevención y Control Ambiental; RPCA). |
| ¾ | Regulation on Atmospheric Contamination (Reglamento en materia de Contaminación
Atmosférica; RMCA). |
| ¾ | Water Pollution Regulation (Reglamento en materia de Contaminación Hídrica; RMCH). |
| ¾ | Regulation for Handling of Hazardous Substances (Reglamento para Manejo
de Sustancias Peligrosas; RMSP). |
| Silver Sand Project Pre-Feasibility Study |
| | New Pacific Metals Corp. | 0723071 |
| ¾ | Regulation for Solid Waste Management (Reglamento de Gestión de
Residuos Sólidos; RGRS). |
| · | The Environmental Regulations for Mining Activities
(Reglamento Ambiental para Actividades Mineras; RAAM), promulgated by Supreme Decree 24782 in 1997. The RAAM expressly points out the
need for comprehensive environmental management in mining from its inception, from the exploration phase to the closure and abandonment
of mining activities. |
| · | Law No. 535, the Mining and Metallurgy Law, enacted
on 28 May 2014, aims to regulate mining-metallurgical activities by establishing principles, guidelines, and procedures for the development
and continuity of activities in a responsible, planned, and sustainable manner. |
In addition, for the preparation
of the studies, related regulations are considered, among which Law No. 530 of the Bolivian Archaeological Heritage and its regulations,
Ministerial Resolutions, Administrative Resolutions issued by national, departmental and/or municipal authorities, environmental guides,
among others, stand out.
According to the legal procedure,
the review of the Environmental Categorization Form (Formulario de Categorización Ambiental; FNCA) and the Environmental Impact
Assessment Study (EEIA-AI) will be executed by:
| · | The competent sectoral body (Organismo Sectorial
Competente; OSC): Environment Unit of the Directorate of Environment and Public consultation under the Ministry of Mining and Metallurgy
(MMM). |
| · | National Competent Environmental Authority (Autoridad
Ambiental Competente Nacional; AACN): General Directorate of Environment and Climate Change, under the Ministry of Environment and Water
(Ministerio de Medio Ambiente y Agua; MMAYA). |
As it is a project that is not
located within a protected area, the national service of protected areas (or Servicio Nacional de Areas Protegidas; SERNAP) does not participate
in the review of the studies.
The socio-environmental description
and characterization of the area includes the studies of the abiotic, biotic, and socioeconomic environments that could potentially be
positively or negatively affected by the mining project in its areas of influence.
From the environmental point of
view, the areas of influence (direct and indirect) have been defined based on guidelines established in the Methodology for the Identification
of Environmental Impacts published by the Ministry of Environment and Water, a document that is not exhaustive and that was complemented
with contributions from a multidisciplinary team of environmental science professionals, social sciences, and other specialties.
| 20.3.2 | Baseline of surface water, groundwater, water for human consumption |
Sampling has been carried out since
2019, prioritizing a monitoring network design, constantly updated, which allows establishing evaluation sites with a basin approach,
prioritizing the collection of monthly data and the collection of data in representative periods of dry season (September) and rainy season
(March).
Within the study area, and for the
purposes of the surface water baseline, three basins have been identified, in which 20 evaluation sites have been defined, which allow
establishing, on a monthly basis, the current conditions of the watercourses, specifically the quality of the waters and their flow.
| Silver Sand Project Pre-Feasibility Study |
| | New Pacific Metals Corp. | 0723071 |
For water quality, 59 parameters
were analyzed on a monthly basis, including physical, chemical, and microbiological in 20 evaluation sites. These sites have been modified
based on the dynamics of the monitoring plan, as a result of the need to obtain data from more relevant sites within the areas of influence
and area of study.
New Pacific has data for 154 samples,
obtained between 2019 and 2023. Figure 20.1 shows the distribution of samples by location.
| Figure 20.1 | Distribution of samples by location |
Source: New Pacific Metals
Corp, 2024.
Measurement of flows were carried
out at different evaluation sites to obtain flow data from watercourses with and without permanent flow.
The monitoring network for surface
water considered the collection of data in headwaters, middle, and lower parts of the micro-basins and basins that are part of the study
area, an aspect that allows the identification of the environmental conditions of the project in these sectors.
In general, existing heavy metal
acid contamination was found in the area, especially sectors of the Aullagas, Machacamarca, Aguas abajo de San Andrés de Huayllani,
Canutillos and Ancomarca.
All the data obtained have been
compared with permissible limits established in the Water Pollution Regulation and with the Environmental Regulation for Mining Activities
(RAAM) as applicable and appropriate. For the specific case of groundwater, hydrological, and hydrogeological studies have been carried
out to determine the hydrogeological units: one alluvial aquifer unit and two fractured aquifers. Preliminary piezometry indicates that
groundwater flow follows topography and major surface water streams, such as the Machacamarca River.
| Silver Sand Project Pre-Feasibility Study |
| | New Pacific Metals Corp. | 0723071 |
Hydrochemistry indicates that the
surface water samples correspond to fresh water, close to the recharge area of the basin, with the exception of the samples located downstream,
which have different chemical composition, probably due to local mining activities, an aspect that coincides with the information obtained
from surface water sampling.
Regarding the quality of drinking
water, water samples have been taken from water supply sources for human consumption in the communities where the project has influence,
to determine the quality, origin, storage, accessibility, in addition to other data collected in surveys or local interviews. Obtaining
water quality data from different sources of supply (public pool, household pools, wells, waterwheels, cisterns, springs, others) in the
communities that are part of the areas of influence allows us to determine the current situation with respect to a basic elementary service.
For the purposes of interpreting the results, the regulatory compendium for drinking water, published by the Ministry of Environment and
Water (NB 512, Regulation NB 512, NB 495, NB 496), was used as a reference.
| 20.3.3 | Air quality / environmental risk baseline |
Regarding air quality, the execution
of semi-annual monitoring has been considered for more representative parameters and defined in the Atmospheric Pollution Regulation (RMCA),
prioritizing the collection of data in representative periods of dry season and rainy season, to date between the period 2022 and 2023,
11 measurements have been obtained in different evaluation sites that have been established in a monitoring program, prioritizing the
homes within communities present in the study area, existing roads, and in sectors where infrastructure that will be part of the mining
operation will be implemented in the future. Environmental noise has been monitored at the same evaluation sites.
| 20.3.4 | Soil and sediment baseline |
Regarding the baseline for soil
and sediments, Bolivia does not have environmental regulations to allow comparisons to determine the quality, however, the baseline makes
comparisons based on soil environmental regulations of other countries in addition to other guidelines prepared by institutions such as
the Food and Agriculture Organization (FAO).
Regarding soil / sediment quality,
the execution of semi-annual monitoring for 42 parameters has been considered, prioritizing the collection of data in representative periods
of dry season and rainy season, between the period 2022 and 2023, 18 samples have been obtained at evaluation sites that have been established
in the monitoring program, prioritizing places such as: cultivated soils, uncultivated soils, special sectors, sediments of the most representative
watercourses or sectors with the presence of contamination by other activities existing in the study area (illegal mining, mining cooperatives,
mining environmental liabilities of others).
| 20.3.5 | Biological baseline |
Based on the main findings of the biological baseline study
in dry and wet seasons it can be concluded that:
Flora:
| · | Flora was reviewed at 17 designated sites and 3,272
plant data and 1,319 physical records (stone, soil, stubble, and feces) have been recorded. 30 families, 57 genres, and 87 species have
been identified. |
| Silver Sand Project Pre-Feasibility Study |
| | New Pacific Metals Corp. | 0723071 |
| · | Four threatened species have been recorded: Azorella
compacta “yareta” and Polylepis tomentella and Polylepis besserim both “keñua”, both in the Endangered (EN)
category, and Trichocereus cf. tarijensis “cardón” in the Vulnerable (VU) category. All of the cacti species are listed
in CITES Appendix II. |
Large and small
mammals:
| · | In the sites evaluated in the localities Huayllani,
Calimali, El Fuerte and Ancomarca, a total of 17 species of mammals were identified during both seasons, these species are distributed
in five orders, 11 families and 15 genres. The family with the highest number of species was Cricetidae with five species, the rest of
the families with only one species, respectively. |
| · | The locality with the highest number of records was
Calimali with 12 species, followed by Ancomarca with 11, then Villa Trapiche with 10, San Andrés de Huayllani with 9 and finally
Del Fuerte, with four species. |
| · | Of all the mammal species recorded, one species Leopardus
geoffroyi is found in CITES I. From all the data obtained in the field, local inhabitants indicate that this species still maintains
stable populations in the vicinity (mountain ranges) of the communities of Ancomarca and Calimali, so its food availability and habitats
are likely also abundant. |
| · | In the present study, no species have been reported
in the Red Book of Vertebrate Wildlife of Bolivia (2009), but they have been reported in CITES I (Leopardus geoffroyi). |
| · | A species of wide global distribution and invasive
was identified, Lepus europaeus (hare). It was recorded at all study sites. |
Herpetology:
| · | A total of ten species were recorded, six amphibians and four reptiles. |
| · | The species recorded represent the typical community
for species of puna habitats above 4000 masl, made up of Rhinella spinulosa, one to two species of Telmatobius spp., Boana
riojana, Gastrotheca marsupiata, Pleurodema cinereum, and in reptiles, two to three species of lizards of the genus Liolaemus
spp., and the altoantine snake Tachymenis peruviana, so it can be indicated that in terms of richness and composition the study
achieved results that adequately represented the herpetofauna community for the High Andean Puna area, in the case of the lowest points
corresponding to inter-Andean dry valleys (3600 to 3800 masl), it would be expected to record some additional species with a longer sampling
time. |
| · | The presence of two endemic species, Telmatobius
cf. hintoni and Telmatobius cf. simonsi, both, under some category of threat at the national level (both as Vulnerable
(VU)); and global (Telmatobius cf. hintoni as Vulnerable (VU) and Telmatobius cf. simonsi Critically Endangered
(CR)). The case of T. cf. simonsi, which would constitute the first record for Potosí, expanding its geographical
and altitudinal distribution. From indications of dead individuals, it is very possible that there is chytrid in the study area, therefore,
the record of good populations for aquatic amphibian species is an important reference in terms of actions to be taken for their conservation.
The record of Rhinella spinulosa is highlighted, since its populations have been reported in Bolivia in decline, being apparently
stable in this area. In the case of reptiles, there is a record of a probable new species of Liolaemus sp. nov., however, to be
confirmed, field scientific collections are required, as for Telmatobius spp. |
| Silver Sand Project Pre-Feasibility Study |
| | New Pacific Metals Corp. | 0723071 |
Ornithology
| · | A total of 61 species of birds distributed in 25 families
and 16 orders were recorded. Among the species evaluated, two have been found with national and international threat status, being the
Andean condor (Vultur gryphus) with the category of Vulnerable (VU) and the giant coot (Fulica gigantea) with national category
of Vulnerable (VU), whose threats are closely linked to anthropogenic activities and particularly mining. |
| · | No species under national or international extinction
category have been detected, however, it was possible to register an endemic species of Bolivia, the chickadee flowerhopper (Diglossa
carbonaria) which is closely associated with Kewiña forests (Polylepis sp.), likewise two species with a threatened
category have been registered during the evaluation time period. These were the Andean condor (Vultur gryphus) with the category
of Vulnerable (VU) and the giant coot (Fulica gigantea) with the national category of Vulnerable (VU), whose threats are closely
linked to anthropogenic activities and particularly to mining. |
| · | Evidence of disturbance identified is primarily due
to existing mining activities (cooperatives and illegal mining), either due to discharges into the tributaries and effluents of the different
basins within the study area or also in the form of noise pollution, which causes many of the bird species to be deterred from remaining
in the area. since they are very sensitive to disturbances in their environment. |
Aquatic Life
/ Ichthyology
| · | All the aquatic systems analyzed present some degree
of contamination, mainly of mining origin (mining cooperatives, illegal mining, environmental liabilities). In most of the systems analyzed,
biological communities with very low richness and diversity are found, with aquatic systems with a total absence of aquatic vegetation
(filamentous algae and higher aquatic plants), as well as aquatic fauna (zooplankton, benthos or aquatic macroinvertebrates), also resulting
in the absence of fish communities. |
| · | In the study area, the presence of a single species
belonging to the genus Trichomycterus is found. The species was captured in an aquatic system in the town of Calimali, also presenting
an evident low density. |
| · | All the aquatic systems in the study area show evidence
of material contribution, which increases the presence of dissolved solids that precipitate in the beds of rivers and streams mainly in
the form of sand. |
| · | The main source of contamination and disturbances
is local mining activity, which is also associated with other activities related to the extraction and transport of minerals, the construction
of road and road infrastructure affects aquatic systems, particularly with the construction of speed bumps that cross rivers, affecting
their structure and flows. |
Aquatic life
/ macroinvertebrates
| · | The evaluation sites have a higher percentage of aquatic
macroinvertebrates tolerant to pollution and in turn this group is composed of abundant taxa. This situation may be due to three types
of impacts on the study area, mining, human settlements, and agriculture. These impacts have an impact on water quality, which was evidenced
by the calculation of the BMWP / Bol index, categorizing the 16 evaluation sites in biological condition of Doubtful, Critical, and Very
Critical. |
| · | In terms of the Ecological Integrity Index, which
brings together both the biological conditions and the characteristics of the riverbank, river habitat and anthropogenic impact, it resulted
in two categories which are Terrible and Bad. |
Baseline dry season studies conclude that the species accumulation
curve indicates higher probability of finding more species in the assessment during the wet season.
| Silver Sand Project Pre-Feasibility Study |
| | New Pacific Metals Corp. | 0723071 |
As established in the document “Methodology
for the Identification of Environmental Impacts” by the Ministry of Environment and Water of Bolivia, the baseline describes “the
current conditions of the area of influence (direct and indirect) of the activity, work or project (...)”.
The scope of the social baseline
(LBS) covers the surface territory of the communities of Machacamarca, San Andrés de Huayllani, El Fuerte, as part of the area
of direct social influence; and Canutillos and Orko Cocha, as part of the area of indirect influence. All of these are located in the
municipality of Tacobamba. This municipality is in the province of Cornelio Saavedra, in the department of Potosí.
The characterization of the communities
was carried out with different secondary sources, using quantitative and qualitative techniques. The following dimensions were addressed:
| · | Demography: total population, five-year age groups,
population by sex, number of households, dwellings and household members, migration, emigration. |
| · | Housing: type of tenure, type of property, property
titles, building materials, type of water supply, toilets, lighting, sources of energy for domestic use, solid waste management mode,
main communication routes, transportation. |
| · | Culture: mother tongue, religion, belonging to indigenous or native peoples. |
| · | Education: educational attainment, illiteracy rate,
student rate, school attendance, dropout and school backwardness; access to basic, intermediate and higher education, and main professional
careers. |
| · | Health: causes and rates of morbidity and mortality,
available health centers, traditional practices, rate of doctors, promoters, and beds by population, and average transportation time to
the health center. |
| · | Economic activities: working-age population, economically
active and inactive population, and occupation categories. |
| · | Territory: use of soil and natural resources, characteristics of agricultural
production. |
The sources of information used
are presented below. Updated information from the education and health sectors with jurisdiction in the communities in the area of social
influence from the following sources was used:
| · | INE: National Population and Housing Census 2012. |
| · | INE: Agricultural Census 2013. |
| · | “Final Report: Socioeconomic Baseline, Risk
Analysis and Community Engagement Recommendations for New Pacific Metals Corp – Silver Sands Project in the Department of Potosí-Bolivia,
2018”. |
| · | “Territorial Plan for Integral Development 2016-2020”
of the Autonomous Municipal Government of Tacobamba. |
In general terms, it is a mainly
rural environment, with a population with a slight male predominance, which has migrated permanently or intermittently to nearby cities
such as Potosí. Therefore, the bulk of the population is mainly in the range of 0 to 24 years of age. As for the houses, they are
their own, although built with precarious materials (adobe walls, dirt floors, thatched or calamine roofs). Access to water supply, toilets,
and lighting is limited. The population has Quechua as their mother tongue.
Access to educational
services within the communities is limited, with a high rate of illiteracy and educational attainment, mainly primary. While access
to health services is through public
| Silver Sand Project Pre-Feasibility Study |
| | New Pacific Metals Corp. | 0723071 |
establishments in Colavi and traditional doctors in their own communities. The main economic
activity is agriculture, although mining cooperatives have also been identified in Machacamarca and San Andrés de Huayllani,
which are dedicated to extracting silver, which is marketed to mills in the area, rescuers or other informal buyers. However, in San
Andrés de Huayllani it was declared that it was also sold to formal marketers. As for the use of the territory, a large part
of the land is destined for the homes of the community members and other inhabitants, as well as for agriculture and livestock,
linked to the productive land given to each community member. Likewise, there is land on which the educational units and local
health establishments are located. Another important activity, linked to land use, is mining, with areas of exploitation by
cooperatives or independent miners. The breeding of large animals, mainly sheep and camelids, was recorded; and small animals.
It should be noted that the presence
of New Pacific (and the previous owners of the project) in the communities dates back to the exploration stage of the Project in 2012.
Since New Pacific (and previous owners of the project) have had a presence in the communities in the area of social influence, it has
participated in multiple communal assemblies, meetings with authorities and conversations with interest groups and community members.
Various activities were discussed that will benefit the population, such as the construction of social infrastructure, education scholarships,
water supply, hiring of community members, transportation services, among others.
Likewise, a Community Relations
Plan specific to the exploitation stage has been developed, which has three programs: Social Impact Management Program, Local Benefit
Generation Programs, and Stakeholder Involvement Program. It has also made available to community members and authorities various mechanisms
for citizen participation, such as attending the Information Office in the city of Potosí, preparing and delivering informative
material, and holding informative meetings. In order to achieve a successful process, this community relations strategy will continue,
expanding the mechanisms and spaces for dialogue.
| 20.3.7 | Archaeological baseline |
An archaeological baseline study
was conducted in the study area of the project, this research documented 32 archaeological, historical, and ethnographic entities that
include a total of 463 architectural and landscape features, which have been identified, recorded, and evaluated for their archaeological
importance, their heritage value and the potential impact they could suffer from the project activity.
The results of the extensive explorations
and stratigraphic surveys do not report the detection or finding of archaeological material evidence that accounts for the presence of
pre-Hispanic settlements within the area covered by the project.
Only 10 of the 32 architectural
complexes recorded presented material antecedents of occupation during the colonial phase, but most of these were rebuilt and remodeled
in later phases, mainly during the Republican Phase, which runs between 1830 and 1920.
The archaeological assessment of
the registered sites indicates that only 11 sites show values of archaeological interest and of these, only six show high value, among
which are Piquiza, Machacamarca Antiguo, the Camp around the Machacamarca Rescue Bank, and the mills located in Huayllani and the streams
that converge in the town of Machacamarca.
| Silver Sand Project Pre-Feasibility Study |
| | New Pacific Metals Corp. | 0723071 |
At the heritage level, seven groups
have sufficient attributes to enter this category, three with medium value, two with high value, and two with very high value, the main
ones being those that are protected by municipal (LM 038/2020) and departmental (LD 144/2020) laws and groups ten of Huayllani (Ingenio
de San Andrés) and 19 of Jatun Pampa (Poblado de Piquiza).
The possibility of a potentially
zero impact on 25 entities (78%), mild on one entity (3%), moderate on one unit (3%), severe on one entity (3%) and a potentially critical
impact on four entities (13%) has been observed. These last four entities are the ones that include 60% of the architectural structures
in the study area (Complexes of old Machacamarca, Rescue Bank of Machacamarca or San Jorge, Aullagas, and the upper area of the Alalaypata
ravine).
Based on the above results, and
in accordance with current regulations, mitigation measures have been defined for each identified architectural complex, considering the
following possibilities: Strict Exclusion, Effective Precaution, Preventive Precaution, and Compensatory Measures; all of them subject
to the definition of zoning in the Management Plan of the heritage area proposed by local laws.
| 20.3.8 | Public Consultation process |
The Public Consultation is a mechanism
for citizen participation that allows citizens, communities, and indigenous peoples to have access to information on mining ventures and
projects.
The Public Consultation is mandatory
and concludes when the operator submits its report to the competent environmental authority, justifying if the criteria of the population
affected by the mining operation have been taken into account.
Public Consultation is fully instituted
in the Political Constitution of the State, applying to activities that involve the exploitation of natural resources, which may directly
affect the affected population, so that the use and exploitation of natural resources must be subject to compliance with technical regulations.
It is therefore possible to implement a process that complements to the methodology of the Public Consultation for Environmental Impact
Assessment Studies. As part of the application of the environmental impact assessment systems and environmental quality control, without
exception and in a transversal manner to all activities of production of goods and services that use, transforms or affects natural resources
and the environment, since non-compliance with the law will lead to the reversion or annulment of the rights of use or exploitation in
accordance with the provisions of Article 358 of the Magna Carta.
The participation of the social
actors linked to the EEIA is established in current environmental regulations and it establishes that during the review phase of the Environmental
Category Level Form, the EEIA, or the granting of the Environmental License (EIS), any natural or collective person through the territorial
grassroots organizations, may make known in writing its observations, criticisms and proposals regarding a project, work or activity,
before the competent environmental authority, competent sectoral body or municipal government, within the scope of its jurisdiction, in
a technically and legally supported manner.
The regulations establish that,
in the phase of identification of impacts, in order to consider an EEIA, the Public Consultation must be carried out, to take into account
the observations, suggestions, and recommendations of the beneficiary and/or affected population, in the area of intervention of the project,
for this it must have dissemination documentation in addition to the documentation of the EEIA, which must be made known to the population
through procedures established in the regulations.
| Silver Sand Project Pre-Feasibility Study |
| | New Pacific Metals Corp. | 0723071 |
Once the mining company completes
the preparation of its EEIA-AI, it will promote the execution of the Public Consultation, in which a notarized act must be generated,
that is, a legal document that will contain the points and aspects of conformity and observations of the community on the mining operation
in Public Consultation and the socio-environmental impact that it could generate. In Bolivia, the Public Consultation process occurs late
in the permitting process and has not currently been initiated for the Silver Sand Project.
Based on the provisions
of mining environmental regulations, the accumulations of solid mining-metallurgical waste must be classified based on their volume and
hazardousness, in this sense, according to the size of the facilities that will store solid and/or liquid waste, the execution of a project
for the accumulation of large volume waste (total projected volume greater than 50,000 m3),
which must consider technical guidelines established in the environmental regulations for the mining sector.
A total of ten core samples and
50 samples of coarse assay reject materials were analyzed to assess the potential for acid generation within the waste rock materials.
Samples were analyzed.
Based on the analysis completed, the waste rock
materials have been classified by total sulphur content as follows:
| · | Sulphur content less than 1.0%; |
| · | Sulphur content between 1.0% and 2.0%; and |
| · | Sulphur content greater than 2.0%. |
Static testing on all samples of
waste rock included: Whole Rock Analysis, ICP Elemental Analysis, and Acid Base Accounting (Modified Sobek). In addition, kinetic testing
was completed on three samples of waste rock within the ranges of sulphur content noted above, to assess the potential rate of acidification
that may occur by Humidity Cell testing.
Based on the test work completed
to date, the waste rock with higher total sulphur content (>2%) appears to have a higher potential for generating acidity than lower
sulphur content waste rock materials. In addition, samples of this material tend to consume the buffering capacity of the waste rock,
resulting in acidification, in a shorter period of time in the testing completed, when compared to the lower sulphur content waste rock.
The testing also indicated that
all samples tested in the humidity cells showed a slightly depressed pH from the first week of testing, while there was limited change
in pH over the 30 weeks of testing. The test results also show that leachate from the waste rock has slightly elevated levels of some
metals following the first weekly testing cycle, with concentration of these metals remaining relatively constant over the full period
of testing.
A total of four samples of process
detox tailings were characterized using the same suite of testing as completed for the waste rock samples. While the neutralizing potential
of the tailings was assessed to be lower than that acid potential, during the 27 weeks of testing, none of the samples produced acidic
leachate. Some samples showed elevated levels of dissolved Silver, Cadmium, and Copper after the first weekly testing cycle, with limited
change in the concentrations over the remaining period of testing of the samples.
For the Silver Sand Project, waste
rock from the pit, tailings from the processing plant, and general waste have been considered. Waste rock that is not potentially acid
generating, or not shown to generate acidic runoff, will be used in the construction of the TSF embankment, the water dam and for other
projects on site, with the remainder placed in the in-pit and external waste dumps.
| Silver Sand Project Pre-Feasibility Study |
| | New Pacific Metals Corp. | 0723071 |
Waste rock from the open pit that
is shown to go acidic in the humidity cell tests will be placed inside the lined containment of the TSF and co-mingled with the process
tailings. Approximately 3% of the waste rock is expected to be in this category.
Encapsulating of the high sulphur
content waste rock within the tailings will preclude exposure to oxidation which will ultimately result in generation of acidity. In addition,
encapsulation will provide additional buffering capacity in the tailings to neutralize any acidity generated in the waste rock.
Tailings from the process plant
will be placed within the lined TSF. Any surface contact water collected within this facility will be reclaimed to the process plant for
re-use in the milling process. General waste from the site office and shop facilities will be treated in accordance with local requirements
and legislation.
The closure plan is an environmental
management instrument that establishes guidelines to be carried out in a mining operation, in order to rehabilitate the intervened and
impacted areas.
The Mining Law in Bolivia establishes
that a mining operator must establish an accounting provision to cover the cost of closing operations.
The Environmental Regulations for
Mining Activities oblige the concessionaire or mining operator to close and rehabilitate the area of its mining activity when it ends,
in whole or in part, its activities in accordance with its environmental license; or when it abandons its mining operations or activities
for more than three years.
The closure plans
minimally consider: i) the objectives of the closure and rehabilitation of the area; ii) a program for the closure of operations and
rehabilitation of the area, iii) the control of pollutant flows and the physical and chemical stabilization of waste accumulations;
(iv) rehabilitation of the area, surface drainage and erosion control; v) post-closure actions, which are the control of the
stability of the structure of the accumulations of waste and the monitoring of the flows of drains, tank gutters, dams or closed
fills and batteries of infiltration monitoring wells.
New Pacific have been in contact
with local communities to discuss options for the closure plan and will continue these discussions through the development of the final
closure plan. The closure plan is expected to be completed following operations. At this stage the closure plan considers re-sloping of
disturbed areas and the placement of topsoil as possible followed by revegetation. The TSF will be capped and covered with topsoil and
revegetated. Facilities will be removed where possible. Surface drainages will be rehabilitated to manage erosion. Monitoring of water
and drainage from the disturbed areas will continue post closure to ensure commitments have been met prior to return of the project to
the government and communities.
| 20.5 | Environmental guarantees |
The mining law in Bolivia establishes
that a mining operator must establish an accounting provision to cover the cost of closing operations, however, it does not establish
other environmental guarantees as is the case in other countries in the Andean region.
| Silver Sand Project Pre-Feasibility Study |
| | New Pacific Metals Corp. | 0723071 |
| 21 | Capital and operating costs |
All currency is in US dollars (US$)
and are based on prices obtained during the second quarter of 2024 (Q2 2024). Costs for the project have been estimated based on a hybrid
owner-contractor project delivery model.
The responsibility of providing
various capital and operating cost inputs for the project financial model are as follows:
| · | Mining – Costs related to the development
and operation of the open pit mine, surface haul roads, and stockpiles were developed by AMC Consultants. QP Mr W Rogers has relied on
HydroTechnica Ltd. to develop mine dewatering costs but accepts them as reasonable and takes responsibility for them. |
| · | Processing – Costs related to the construction
and operation of mineral processing infrastructure were developed by Halyard Inc. QP Mr A Holloway takes responsibility for those costs. |
| · | Tailings storage & the water dam –
Costs related to the transportation and storage of tailings and the water dam were developed by NewFields Canada Mining & Environment
ULC. QP Mr L. Botham takes responsibility for those costs. |
| · | Site Infrastructure – Costs related
to the deployment of site infrastructure and earthworks to support the on-site camp, mobile maintenance workshop, explosives storage,
fuel storage infrastructure, transmission infrastructure, communications, and network infrastructure were developed by AMC Consultants.
QP Mr M Molavi takes responsibility for those costs. |
| · | General & admin – Costs related to
permitting, community compensation and projects, logistics, administration, and labour were developed by New Pacific. QP Mr W Rogers takes
responsibility for those costs. |
| 21.2 | Operating cost estimate |
The operating cost estimate allows
for all labour, equipment, supplies, power, consumables, supervision, technical services, as well as general and administrative (G&A)
costs. The overall operating cost was estimated at 1,281 US$ million (US$M), excluding capitalized operating costs. The average operating
cost over the LOM can be expressed as 8.16 US$/Troy Oz. of silver produced and as 24.63 US$/tonne milled. An overview of average LOM costs
by activity is presented in Table 21.1.
| Table 21.1 | Average LOM unit operating cost summary |
| Operating cost category |
Total costs |
Cost per payable Oz produced |
Cost per tonne |
| US$M |
US$/Troy Oz. |
US$/tonne milled |
| Mining |
482 |
3.07 |
9.28 |
| Processing & tailings |
713 |
4.54 |
13.71 |
| G&A |
86 |
0.54 |
1.65 |
| Total operating cost |
1,281 |
8.16 |
24.63 |
Notes: The totals may not
sum due to rounding.
| Silver Sand Project Pre-Feasibility Study |
| | New Pacific Metals Corp. | 0723071 |
Open
pit mining costs were estimated for a contract mining operation. Costs were built up on a first principles basis using supporting data
from quotes provided by New Pacific, quotes from contractors, and AMC Consultant’s internal database of costs. The open pit operating
cost is composed of the following items and activities:
| · | Drilling and blasting. |
| · | Loading and hauling to the processing
plant, waste dump, and stockpiles. |
| · | Stockpile re-handle. |
| · | Pit, waste dump, and stockpile dozing. |
| · | Haul road maintenance. |
| · | Auxiliary
activities and equipment costs for items such as pickup trucks, crew buses, light plants,
generators, utility equipment, and logistics equipment such as forklifts, equipment float
trucks, and flat deck transportation trucks. |
| · | Mobile
equipment maintenance. |
| · | Management
and technical staff. |
| · | Pit dewatering. |
| · | Geotechnical
support for the pit walls and waste rock dumps. |
| · | Grade
control sampling for drilling and blasting. |
Staff were divided into two broad categories
for the open pit operating cost estimate:
| · | Fixed staffing – Fixed staff requirements
are constant and independent of mine production. This includes management, admin, and technical staff. |
| · | Variable staff – Variable staff requirements
are based on mine production & equipment productivity. Variable staffing requirements vary by schedule period. This includes equipment
operators, blasters, and mobile maintenance staff. |
All staff were assigned to a two-weeks
on, one-week off shift schedule. Personnel from the contractor’s team will be staffed around the clock with three crews in total.
Two crews will be active on day and night shift at a time, with an inactive third crew on days off. The three-crew roster requires the
start and end time of each shift set to be staggered by 7 days. Only one crew was assigned to the owner’s team. This is summarized
in Table 21.2, with the shift configuration summarized in Table 21.3.
| Table 21.2 | Shift coverage and crew count |
| Team |
Shift coverage |
Number of crews |
| Owner’s team |
Day shift only |
1 |
| Contractor’s team |
Day and night shift |
3 |
| Silver Sand Project Pre-Feasibility Study |
| | New Pacific Metals Corp. | 0723071 |
| Table 21.3 | Shift schedule configuration |
| |
Shift schedule |
| Item |
Units |
2 WK ON / 1 WK OFF |
| Shift configuration |
| Shift length |
Hours / day |
12 |
| Days on |
Days / shift cycle |
14 |
| Days off |
Days / shift cycle |
7 |
| Leave |
| Annual leave / other |
Days / year |
20 |
| Long service / sick leave / special leave |
Days / year |
5 |
| Training / professional development |
Days / year |
5 |
| Annual leave / other |
Equiv. # of cycles / year |
2.1 |
| Shift cycles |
| No. of shift cycles before leave |
Cycle / year |
17.4 |
| Effective no. cycles per year |
Cycle / year |
15.2 |
| Avg. on-days per year, per shift |
Days / year |
213 |
| Avg. off-days per year, per shift |
Days / year |
122 |
Projected salary cost estimates
were obtained by New Pacific and provided to AMC Consultants for estimating labour costs. Salary costs were quoted in Bolivian Bolivianos
(BS) per month at a FOREX rate of 6.96 BS/US$. Salary cost estimates were not available for all positions on-site. Salaries for unlisted
positions were based on rates for similar positions. For instance, salary rates for drillers were assumed to be similar to those of dozer
operators. Contractor salaries include a 15% mark-up.
Salary and on-costs do not include
expenses for ex-patriots (ex-pats) travelling to and from the site, or camp costs. Travel costs and camp costs are included as part of
G&A costs in Section 21.2.3. Salary costs were escalated at a rate of 3% per year with the guidance of New Pacific.
AMC Consultants assumed that most
positions will be staffed by locals. Select fixed staff positions are fly-in, fly-out (FIFO) and are designated for ex-pats. Fixed staffing
requirements are presented in Table 21.4.
| Table 21.4 | Fixed staffing summary for the open pit |
| Staff position |
Total people required |
| Mine Manager |
1 |
| Mine Superintendent |
1 |
| Mine Supervisor |
3 |
| Mine Foreman |
3 |
| Maintenance Superintendent |
1 |
| Maintenance Supervisor |
1 |
| Maintenance Foreman |
1 |
| Administration Assistant |
1 |
| Sr. Mining Engineer |
1 |
| Mining Engineer |
3 |
| Sr. Geologist |
1 |
| Geologist |
2 |
| Surveyor |
2 |
| Silver Sand Project Pre-Feasibility Study |
| | New Pacific Metals Corp. | 0723071 |
The open pit portion of the mine is planned to have a maximum
of 283 people employed. Staffing requirements for the open pit are presented by year in Section 16.10.
| 21.2.1.2 | Equipment operating costs |
Operating costs for equipment were built up from three components:
| · | Fuel, maintenance parts, lube, and consumables |
Labour requirements for each piece
of equipment were based on equipment productivity, annual operating hours and delays, and mine production requirements. Costs for fuel,
maintenance parts, lube, and tires were based on average hourly cost quotes for equivalent equipment at similar operations, from AMC Consultant’s
internal database. Operating costs were adjusted from similiar-sized equipment based on the sixth-tenths cost estimation methodology for
items where costs were unavailable. The sixth-tenths methodology assumes a non-linear relationship between cost and capacity for equipment.
An unknown equipment cost can be estimated by applying a factor to a known equipment cost, where the factor is calculated by dividing
the capacity of the unknown equipment by that of the known equipment and raising the quotient to the power of 0.6. The QP believes that
this methodology was applied reasonably considering the development stage of this project.
Labour costs for mechanics and welders
were based on labour ratio assumptions for the number of maintenance staff required per operating machine. Labour ratios were assigned
based on the type of machine to weigh maintenance labour requirements reasonably. Maintenance labour requirements vary over time according
to the required operating fleet.
Equipment requirements for haul
trucks, loading units, and drills were based on equipment productivity rates and scheduled mine production requirements. This is discussed
further in Section 16.9.2. Other ancillary and support equipment requirements were derived from production requirements and assumptions
by AMC Consultants for the following items:
| · | Pit dozing (building in-pit roads & ramps, building berms, dozing
blast heaves, and preparing blast patterns for drilling) |
| · | TSF dozing (spreading run-of-mine waste rock for constructing the TSF embankment) |
| · | Pit clean up (dig face clean up and haul road spillage clean up) |
| · | Haul road dust suppression |
Based on experience, AMC Consultants also made assumptions
on requirements for the following supporting equipment:
| · | Mobile maintenance trucks and welding trucks |
| Silver Sand Project Pre-Feasibility Study |
| | New Pacific Metals Corp. | 0723071 |
| · | Flat deck truck and trailer |
| 21.2.1.3 | Drill and blast costs |
Drill and blast costs were estimated
based on AMC Consultant’s first principles cost build-up and a non-binding contractor quote. The combined drill and blast costs
were estimated to be US$0.65/tonne mined. This cost includes the following items:
| · | Drill operating cost, including fuel, maintenance, consumables, and labour. |
| · | Explosives and blasting accessories |
| · | Blast crew labour and supporting equipment such as pickup trucks |
| · | Stemming – sourcing / manufacturing, delivery, and loading |
| · | Mobile mixing units (MMUs) for loading bulk explosives |
| 21.2.1.4 | Other support mining costs |
The mine operating cost also includes
costs for other items such as dewatering the pit, grade control sampling, and geotechnical support services.
Dewatering costs include the operating
cost of sump pumps as well as the development of horizontal drain holes. HydroTechnica estimated the annual operating cost by pit phase
for sump pumping and assumed an energy cost of US$0.053/kWh for electricity. The cost of developing horizontal drain holes is estimated
to be approximately US$125,000 per year.
AMC Consultants referenced similar
projects for grade control sampling costs. AMC estimated grade control costs on the basis that all blastholes that are anticipated to
contain ore will be sampled, and that 25% of blastholes are anticipated to contain waste will be sampled. Samples will be collected at
a rate of one sample / selected blasthole. Sample testing costs were estimated to be US$6.00/sample.
The QP included an allowance for
geotechnical support services for the open pit, waste rock dumps, and stockpiles. This includes monitoring, ongoing material testing,
and consulting support (design revisions, site inspections, regulatory reporting, etc.). These costs are assumed to be higher during site
development and will decrease to a steady state for ongoing reporting and inspections. Costs are assumed to increase in the final two
full years of production. Other support mining costs include supervision staff from the contractor’s team, pit services (support)
personnel for operations, and personnel from the owner’s team that are specifically assigned to support open pit operations. This
includes:
| · | Maintenance Superintendent |
| Silver Sand Project Pre-Feasibility Study |
| | New Pacific Metals Corp. | 0723071 |
The cost of other personnel
from the owner’s team is included as part of general & administrative costs in Section 21.2.3 of this report.
Note that costs incurred during
the pre-production period are capitalized. A summary of other mine operating costs is summarized in Table 21.5. Costs for dewatering and
grade control sampling include a 15% contractor markup as they are part of the contractor’s operations.
| Table 21.5 | Summary of other mining costs |
| Other mining costs |
US$M (LOM total1) |
| Contractor supervision staff |
4.9 |
| Pit services support staff |
3.1 |
| Owner’s team (mining only) |
12.9 |
| Pit dewatering |
2.3 |
| Grade control sampling |
1.0 |
| Geotechnical support services |
3.1 |
| Total |
27.3 |
Note1:
Excludes capitalized operating costs.
| 21.2.1.5 | Open pit operating cost summary |
Operating costs for the LOM have
been summarized in Table 21.6. Operating costs presented do not include capitalized operating costs. These costs only include operating
the open pit and do not include processing or tailings, general and administrative costs (G&A), capital costs, or any other costs.
Mine operating costs by period are presented in Table 21.7 and Figure 21.1.
| Table 21.6 | Mine operating cost summary |
| Mine unit operating
costs |
Total
US$M |
US$/tonne
mined |
Percentage
of total (%) |
| Loading |
45.4 |
0.22 |
9 |
| Hauling |
220.1 |
1.07 |
46 |
| Drilling |
29.2 |
0.14 |
6 |
| Blasting |
103.7 |
0.50 |
21 |
| Dozing |
21.8 |
0.11 |
5 |
| Road
maintenance |
23.8 |
0.12 |
5 |
| Supporting
equipment |
11.2 |
0.05 |
2 |
| Other
mine operating costs |
27.3 |
0.13 |
6 |
| Total |
482.5 |
2.34 |
100 |
Notes: The totals may not sum due to rounding.
| Silver Sand Project Pre-Feasibility Study |
| | New Pacific Metals Corp. | 0723071 |
| Table 21.7 | Mine operating cost by period, in US$M |
| Mine operating costs (US$M) |
Total |
1 |
2 |
3 |
4 |
5 |
6 |
7 |
8 |
9 |
10 |
11 |
12 |
13 |
14 |
| Loading |
45.4 |
3.7 |
3.0 |
3.1 |
3.2 |
3.7 |
3.7 |
3.9 |
3.8 |
3.8 |
4.1 |
3.8 |
3.4 |
2.0 |
0.1 |
| Hauling |
220.1 |
16.2 |
14.1 |
14.5 |
15.5 |
18.0 |
19.5 |
18.7 |
19.2 |
18.8 |
21.0 |
19.2 |
17.1 |
8.2 |
0.1 |
| Drilling |
29.2 |
2.3 |
2.3 |
2.1 |
2.3 |
2.5 |
2.3 |
2.5 |
2.6 |
2.0 |
2.7 |
2.2 |
2.2 |
1.1 |
0.0 |
| Blasting |
103.7 |
8.0 |
7.4 |
7.2 |
7.3 |
8.7 |
8.5 |
8.7 |
9.0 |
8.8 |
9.1 |
8.2 |
8.3 |
4.4 |
0.0 |
| Dozing |
21.8 |
2.0 |
1.6 |
1.6 |
1.6 |
2.0 |
1.9 |
2.0 |
2.0 |
2.0 |
2.2 |
1.3 |
1.1 |
0.5 |
0.0 |
| Road maintenance |
23.8 |
1.8 |
1.7 |
1.7 |
1.7 |
1.9 |
1.9 |
2.0 |
2.0 |
2.0 |
2.0 |
1.9 |
1.9 |
1.2 |
0.0 |
| Supporting equipment |
11.2 |
0.8 |
0.8 |
0.9 |
0.8 |
0.9 |
0.9 |
0.9 |
0.9 |
0.9 |
0.9 |
0.9 |
0.8 |
0.9 |
0.1 |
| Other mine operating costs |
27.3 |
1.6 |
1.7 |
1.8 |
1.8 |
1.9 |
1.9 |
2.0 |
2.0 |
2.0 |
2.1 |
2.1 |
3.1 |
3.1 |
0.1 |
| Total |
482.5 |
36.6 |
32.6 |
32.8 |
34.3 |
39.5 |
40.5 |
40.6 |
41.6 |
40.3 |
44.1 |
39.7 |
38.0 |
21.4 |
0.3 |
Notes: The totals may not sum due to rounding.
| Silver Sand Project Pre-Feasibility Study |
| | New Pacific Metals Corp. | 0723071 |
| Figure 21.1 | Mine unit operating costs by period |
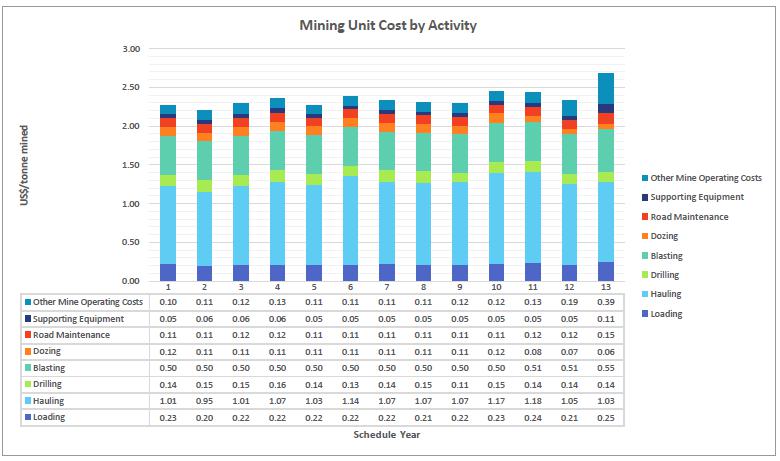
Note: Mining is scheduled to finish in year
13. Costs planned post-year 13 are not shown in the above chart because they are not measured in terms of US$/tonne mined. The processing
plant was scheduled to process the remaining stockpiled material in year 14.
Source: AMC Mining Consultants (Canada) Ltd.,
2024.
| Silver Sand Project Pre-Feasibility Study |
| | New Pacific Metals Corp. | 0723071 |
| 21.2.2 | Processing & tailings operating costs |
| 21.2.2.1 | Process operating costs |
An estimate of operating costs for the 4 Mtpa
process plant described in Section 17 was generated by Halyard Inc. The estimate was developed from first principles, using data from
recent metallurgical test work, New Pacific’s in-country salary / benefit guidelines, established process design criteria, mass
balance calculations, engineered process area specifications, equipment counts, and benchmarking against historical data for similar process
plants. High-quality globally sourced suppliers were selected to supply the site via Chilean ports.
The operating cost breakdown includes
reagents, consumables, personnel, electrical power, maintenance, and laboratory testing. The consumables accounted for in the operating
costs include spare parts, grinding media, and liner and screen components. The main operating costs for the process plant are grinding
media, electrical power, and reagents. The bulk of the reagent costs are associated with cyanide leaching.
Wear parts and maintenance allocations
were calculated as a ratio of the value of purchased equipment (inclusive of transportation to the site), applied annually to project
the cost of replacing mechanical equipment due to normal wear and tear.
The annual cost of grinding media
for the SAG and ball mill was estimated using the ore abrasion index, the expected media consumption (g/kWh), and the cost per tonne of
steel media. The unit cost of media ($/t steel media) was established using a quotation from a reputable supplier.
Oxygen (required to assist leaching)
is produced on-site by oxygen generation equipment. Other process reagents will be delivered from North America and China, and other parts
of the world in bulk containers with appropriate on-site unloading and storage facilities.
An annual operating cost of $51.6M
has been estimated (assuming 4 Mtpa throughput). The costs cover all plant operations from the ROM receiving and primary crushing through
to doré truck loading and tailings filtering and transportation via conveyors. Average process plant operating costs over the project
LOM are estimated to be $12.89/t of processed ore in Table 21.8. A summary of processing unit costs and their relative proportions is
presented in Table 21.9.
| Table 21.8 | Process unit cost summary |
| Item |
Unit cost ($/t milled) |
Percentage of total |
| Reagents |
6.45 |
50% |
| Wear parts and maintenance supplies |
0.79 |
6% |
| Personnel costs |
0.77 |
6% |
| Grinding media and liners |
2.41 |
19% |
| Power costs |
1.92 |
15% |
| Lesser cost components |
0.56 |
4% |
| Total |
12.89 |
100% |
Note: Values may not sum
due to rounding.
Costs have also been categorized
either as fixed (independent of throughput) or variable (proportional to throughput).
| Silver Sand Project Pre-Feasibility Study |
| | New Pacific Metals Corp. | 0723071 |
| Table 21.9 | Summary of estimated mill operating cost |
| Category |
$M per annum |
Total ($/t milled) |
| Fixed costs |
| Labour – salaried |
1.11 |
0.28 |
| Labour – hourly |
1.96 |
0.49 |
| Tools / equipment / safety supplies |
0.13 |
0.03 |
| Maintenance supplies |
0.60 |
0.15 |
| Assaying & general laboratory |
0.10 |
0.03 |
| Subtotal fixed |
3.90 |
0.98 |
| Variable costs |
| Power |
7.70 |
1.92 |
| Tailings Filtration consumables |
0.75 |
0.19 |
| Water usage |
0.38 |
0.09 |
| Reagents |
25.79 |
6.45 |
| Grinding media |
6.84 |
1.71 |
| Liners (Crusher + Mills) |
2.80 |
0.70 |
| Maintenance supplies |
1.82 |
0.45 |
| In-plant piping replacement |
0.45 |
0.11 |
| Lubricants |
0.16 |
0.04 |
| Misc contracts and supplies |
0.25 |
0.06 |
| Abnormal / miscellaneous Items |
0.75 |
0.19 |
| Subtotal variable |
47.67 |
11.92 |
| Total |
51.57 |
12.89 |
Source: Halyard Inc.
The management team size, operations
and maintenance personnel headcounts per area were developed for a 12,000 tpd process plant, with a 33.4% burden applied to gross earnings
(base + bonuses) to derive the total labor costs. The personnel costs incorporate requirements for plant management, metallurgy, operations,
maintenance, site services, and a contractor allowance. Salaries and benefits guidelines were provided by New Pacific via their HR plan.
A total of 105 employees are accounted for in the process operating costs.
A summary of labour requirements and
costs are summarized in Table 21.10.
| Silver Sand Project Pre-Feasibility Study |
| | New Pacific Metals Corp. | 0723071 |
| Table 21.10 | Labour details - Processing |
| |
# |
Total US$M p.a. |
| Salaried positions |
| Management & training |
4 |
0.37 |
| Engineering management |
5 |
0.34 |
| Metallurgical / lab |
5 |
0.39 |
| Total salaried |
14 |
1.11 |
| Hourly positions |
| Plant operations |
56 |
1.35 |
| Plant maintenance |
25 |
0.45 |
| Sampling / analytical |
10 |
0.16 |
| Total hourly |
91 |
1.96 |
| Total salaried + hourly |
105 |
3.06 |
Source: Halyard Inc.
Inputs from various equipment vendors
and power calculations for smaller plant equipment assisted in the determination of average annual power requirements for processing.
Total plant power consumption is estimated at 36.2 kWh per tonne processed. Power supply rates were obtained from written minutes of recent
discussions between New Pacific and a Bolivian national utility company. A straight unit rate for power (i.e., no maximum demand tariff)
of $53 per MWh has been used. At an annual power consumption of 145,200 MWh per annum, the annual power cost is estimated to be $7.7M.
A quotation for the supply (through a Chilean
Port) of grinding balls for SAG and Ball mills, and testwork consumption rates were used to calculate the required quantities of each.
The estimate includes agent handling and site delivery costs. This is presented in Table 21.11.
| Table 21.11 | Steel wear parts |
| |
Tonnes p.a. |
Total US$M p.a. |
| Steel wear parts |
| Mill balls |
6,380 |
6.84 |
| Crusher and chute liners |
364 |
2.80 |
| Total |
|
9.63 |
Source: Halyard Inc.
Budget quotations were obtained
from suppliers for many of the process reagents, including sodium cyanide (the most significant reagent cost). Where quotations were not
provided, rates from recent North American Projects were used. The estimate includes agent handling and site delivery costs.
| Silver Sand Project Pre-Feasibility Study |
| | New Pacific Metals Corp. | 0723071 |
| Table 21.12 | Consumable details - Processing |
| |
Tonnes p.a. |
Total $M p.a. |
| Reagents |
| Lime |
5,200 |
1.81 |
| Flocculant |
320 |
1.95 |
| Sodium Cyanide |
6,200 |
14.88 |
| Zinc Powder |
655 |
3.63 |
| Lead Nitrate |
164 |
0.73 |
| NaOH |
300 |
0.26 |
| H2SO4 |
40 |
0.02 |
| H2O2 |
40 |
0.17 |
| Fluxes |
180 |
0.32 |
| Anti-Scalant |
40 |
0.21 |
| Diatomaceous Earth |
1,200 |
1.80 |
| Total |
14,339 |
25.79 |
Source: Halyard Inc.
Water used by the process
facilities is assumed to be supplied at an average cost of $0.40 per m3. Plant makeup water volume is estimated to be 0.88
Mm3 per annum.
| 21.2.2.2 | Tailings Storage Facility operating cost |
An estimate of operating costs
for the TSF described in Section 18 was generated by NewFields Canada Mining & Environment ULC. The estimate was developed from first
principles, using performance data from heavy equipment supplier specifications. Labour costs were provided by New Pacific Metals.
The operating cost breakdown includes
equipment, personnel and fuel costs. Transportation of tailings by conveyor from the process plant to the TSF are included in the processing
costs developed by Halyard.
An annual operating cost of $3.0M
has been estimated (assuming 4.0 Mtpa throughput). The costs are summarized in Table 21.13. Wear parts and maintenance allocations are
included within the hourly operating costs for the equipment, which is included in the costs below.
| Table 21.13 | TSF operating costs |
| Item |
$M per annum |
Total ($/m3 of tailings) |
| Filtered tailings – placement & compaction |
2.2 |
0.81 |
| Surface water management – collection & pumping |
0.3 |
0.10 |
| ARD collection & treatment |
0.5 |
0.20 |
| Total |
3.0 |
1.11 |
| 21.2.3 | General and administrative costs |
The following general and administrative (G&A costs)
were prepared by New Pacific for the Silver Sand Project.
| · | Ongoing land compensation costs for the community |
| · | An allowance for ongoing permitting and technical studies |
| · | General support personnel for site security, operating the warehouse, and general site support |
| Silver Sand Project Pre-Feasibility Study |
| | New Pacific Metals Corp. | 0723071 |
| · | Insurance for mine operations |
| · | General management and supervision |
| · | Travel costs for FIFO personnel |
| · | Camp operating costs for FIFO personnel |
A summary of G&A costs is presented
in Table 21.14. G&A costs incurred during the pre-production period have been capitalized as part of site development costs. G&A
costs for year 1 and onwards are considered to be operating costs.
| G&A cost |
Annual cost ($M) |
| Ongoing land compensation |
1.0 |
| Allowance for ongoing permitting & studies |
0.1 |
| General support personnel |
1.5 |
| Software |
0.3 |
| Mine operations insurance |
1.0 |
| General management & supervision1 |
0.3 |
| Travel costs |
0.5 |
| Camp costs |
1.5 |
| Total |
6.1 |
Note: Values may not sum
due to rounding.
1General management
& supervision costs escalate each year according to labour cost escalations.
| 21.2.4 | Product selling costs |
The Silver Sand Project is planned
to produce silver doré on site. Halyard provided estimates for product payability rates product transportation, product insurance,
and refining charges. New Pacific provided royalty selling costs for royalties due to the Bolivian government and the Bolivian Mining
Corporation (COMIBOL). Royalties are calculated on gross revenue. The royalty to COMIBOL only applies to gross revenue from silver mined
outside the AMC limit. Selling costs are summarized in Table 21.15.
| Table 21.15 | Product selling costs |
| Selling cost item |
Value |
Units |
| Payable silver |
99.50% |
of Ag produced |
| Transportation & insurance costs |
0.25 |
US$/Oz |
| Refining charges |
0.20 |
US$/Oz |
| Royalty to COMIBOL (outside the AMC limit) |
6.00% |
of gross revenue |
| Royalty to the Bolivian Government |
6.00% |
of gross revenue |
| Silver Sand Project Pre-Feasibility Study |
| | New Pacific Metals Corp. | 0723071 |
| 21.2.5 | Operating cost summary |
The operating cost for the Silver Sand Project is summarized
by the following items in Table 21.16.
| · | Processing and tailings storage operating cost |
| · | Product transportation and insurance costs |
| · | Royalty to the Bolivian Mining Corporation |
| · | Royalty to the Bolivian government |
| Silver Sand Project Pre-Feasibility Study |
| | New Pacific Metals Corp. | 0723071 |
| Table 21.16 | Operating cost by year |
| Production
Schedule |
Units |
Total |
1 |
2 |
3 |
4 |
5 |
6 |
7 |
8 |
9 |
10 |
11 |
12 |
13 |
14 |
| Material
mined |
Mt |
205.9 |
16.1 |
14.8 |
14.3 |
14.5 |
17.4 |
17.0 |
17.5 |
18.0 |
17.6 |
18.0 |
16.3 |
16.3 |
8.0 |
- |
| Material
moved |
Mt |
215.6 |
18.6 |
14.8 |
14.9 |
15.2 |
17.8 |
17.5 |
18.2 |
18.0 |
17.7 |
19.3 |
18.0 |
16.3 |
8.9 |
0.3 |
| Material
processed |
Mt |
52.0 |
3.7 |
4.0 |
4.0 |
4.0 |
4.0 |
4.0 |
4.0 |
4.0 |
4.0 |
4.0 |
4.0 |
4.0 |
4.0 |
0.3 |
| Payable
silver produced |
Moz. |
157.1 |
15.8 |
16.5 |
15.6 |
11.6 |
11.5 |
11.3 |
10.7 |
12.3 |
10.6 |
9.3 |
9.7 |
12.6 |
9.0 |
0.4 |
| Operating
costs |
| Mining |
US$M |
482.5 |
36.6 |
32.6 |
32.8 |
34.3 |
39.5 |
40.5 |
40.6 |
41.6 |
40.3 |
44.1 |
39.7 |
38.0 |
21.4 |
0.3 |
| Processing
& tailings |
US$M |
713.0 |
51.1 |
54.5 |
54.5 |
54.5 |
54.5 |
54.5 |
54.5 |
54.5 |
54.5 |
54.5 |
54.5 |
54.5 |
54.5 |
7.5 |
| G&A |
US$M |
85.6 |
6.1 |
6.1 |
6.1 |
6.1 |
6.1 |
6.1 |
6.1 |
6.1 |
6.2 |
6.2 |
6.2 |
6.2 |
6.2 |
5.8 |
Product
transportation &
insurance |
US$M |
39.3 |
3.9 |
4.1 |
3.9 |
2.9 |
2.9 |
2.8 |
2.7 |
3.1 |
2.6 |
2.3 |
2.4 |
3.2 |
2.3 |
0.1 |
| Refining
costs |
US$M |
31.4 |
3.2 |
3.3 |
3.1 |
2.3 |
2.3 |
2.3 |
2.1 |
2.5 |
2.1 |
1.9 |
1.9 |
2.5 |
1.8 |
0.1 |
| Royalty
to the Bolivian Mining Corporation (COMIBOL) |
US$M |
16.1 |
2.4 |
- |
2.0 |
0.2 |
0.1 |
0.2 |
3.2 |
4.6 |
2.3 |
0.1 |
0.2 |
- |
0.8 |
0.0 |
| Royalty
to the Bolivian Government |
US$M |
226.2 |
22.7 |
23.8 |
22.4 |
16.7 |
16.6 |
16.3 |
15.5 |
17.7 |
15.2 |
13.4 |
14.0 |
18.2 |
13.0 |
0.5 |
| Total
operating cost |
US$M |
1,594.1 |
126.0 |
124.5 |
124.9 |
117.1 |
122.1 |
122.8 |
124.8 |
130.1 |
123.3 |
122.6 |
119.0 |
122.6 |
100.0 |
14.4 |
Note: Values may not sum due to rounding.
| Silver Sand Project Pre-Feasibility Study |
| | New Pacific Metals Corp. | 0723071 |
The project capital cost estimate
for the surface infrastructure is based upon quoted cost estimates from a Bolivian national utility company, and quotes from various earthworks
contractors, building suppliers, and QP experience regarding unit rates.
The project capital cost estimate
for surface infrastructure, including surface ancillary equipment, is $50.7M, and is summarized in Table 21.17. The major components of
this cost estimate are grid power, local electrical distribution, site access roads, and camp construction. Other items include an on-site
office and maintenance workshop. Water for the mine site and processing plant will be supplied from the water dam reservoir to be constructed
using waste material from the pit. Infrastructure costs include an average contingency of 15%.
| Table 21.17 | Surface infrastructure project capital cost estimate |
| Description |
Total cost ($M) |
| Power to site and one mine site substation |
16.64 |
| Access roads and upgrading |
8.19 |
| Site prep and excavations for foundations |
2.13 |
| Stockpile site preparation |
3.50 |
| Camp |
1.90 |
| Electrical distribution, communications, yard lighting |
7.70 |
| Critical spares |
2.30 |
| Explosives magazine |
0.50 |
| Warehouse, light vehicle shop, tools, and lube oil |
2.20 |
| Fuel storage |
0.24 |
| Indirect costs including EPCM |
5.40 |
| Total |
50.70 |
Source: AMC Mining Consultants
(Canada) Ltd., 2024.
Costs detailed in Table 21.25 include
$47.0M of initial project capital costs and $3.7M of sustaining capital costs. Sustaining capital costs were estimated to be 1% per year
of direct infrastructure costs. Sustaining capital costs include rebuilds, repairs, and replacements of site infrastructure (and associated
equipment).
Mine development capital costs consist of:
| · | Pit development including mine road construction, and clearing land for
the pit and waste storage facility |
| · | Capitalized pre-production mining (waste stripping) |
Land clearing costs were
estimated to cost $0.60/m2, in addition to a 15% contingency cost and a 15% contractor markup. Land clearing costs were based
on quotes from similar studies within AMC Consultants internal database. Land clearing costs were timed on an as-needed basis to allocate
capital appropriately. Pre-production mining was planned to provide fill material for site earthworks and to open access to the ore body.
The cost of pre-production mining was estimated based on the first-principles operating costs prepared by the QP for the mine production
schedule.
| Silver Sand Project Pre-Feasibility Study |
| | New Pacific Metals Corp. | 0723071 |
The QP has relied on hydrogeological
consultants HydroTechnica Ltd. to estimate mine dewatering costs. Sump pumping costs are treated as a capital cost item and the cost of
establishing free-draining boreholes was treated as an operating cost because they’ll have to be established on an ongoing basis
and they will be excavated as mining progresses.
A summary of mine development costs is presented in Table 21.18.
| Table 21.18 | Mine development capital
costs. |
| Mine
development CAPEX item |
Initial
CAPEX ($M) |
Sustaining
CAPEX ($M) |
Total
($M) |
| Pit
development land clearing |
4.2 |
0.4 |
4.6 |
| Land
clearing for the waste storage facility |
0.3 |
- |
0.3 |
| Dewatering |
0.5 |
0.1 |
0.5 |
| Capitalized
pre-production mining |
71.2 |
- |
71.2 |
| Total |
76.1 |
0.5 |
76.6 |
Note: Values may not sum
due to rounding.
Procurement of a mining fleet is not included
in the capital cost estimate since this will be a contract mining operation, with contractor-supplied equipment. New Pacific has conveyed
to the QP that a fleet mobilization fee will be charged to New Pacific upon commissioning the fleet on-site, and this mobilization fee
will be credited back to New Pacific against ongoing operating costs charged by the contractor. This will be credited over the first few
months of operations.
An estimate of capital cost for
the 4 Mtpa process plant described in Section 17 was generated by Andy Holloway of Halyard Inc. The estimate was built up by plant area
and by engineering discipline using appropriate estimating methodology. The engineering work completed for this study is preliminary,
but it provides the level of detail necessary to enable the bottom-up estimation of costs to AACE Class 4 standards.
| 21.3.3.1 | Basis of estimate |
The capital cost for process plant
facilities includes the supply to site, construction, and installation of all structures, utilities, materials, and equipment, as well
as all associated indirect and management costs. It encompasses contractor and engineering support to commission the process plant and
ensure all systems are operational. At the point of handover of the plant to the client, all operational costs, including ramp-up to full
production, are considered operating costs. The capital cost estimate is based on a 24-month base case development schedule, starting
with the receipt of the necessary Bolivian regulatory construction permits.
The estimate describes the base case operating scenario,
includes all process areas and ancillary buildings of the plant, and encompasses:
| · | Direct costs including construction and commissioning of all structures,
utilities, and equipment |
| · | Indirect costs associated with design, construction and commissioning |
| · | Provisions for contingency |
| Silver Sand Project Pre-Feasibility Study |
| | New Pacific Metals Corp. | 0723071 |
Cost estimates are expressed in
Q2 2024 US dollars with no allowances for escalation, currency fluctuation or interest during construction. Costs quoted in foreign currencies
were converted to US dollars at the following exchange rates:
The following references were used as
support for the capital estimate:
| · | Overall site plan and layout drawings for each process area. |
| · | Process flow diagrams (PFDs). |
| · | Material take-offs per area. |
| · | Equipment list per area. |
| · | Mass and water balance for the plant. |
| · | Consumables consumption calculations. |
| · | MCC, transformers, and switchgear specifications. |
| · | Written budgetary quotations from vendors, based on equipment specifications from Halyard. |
| · | Halyard’s internal project cost database. |
No fixed / firm quotations were
used to prepare this estimate. For larger equipment items, multiple budgetary quotations were generally requested from vendors, whereas
for smaller items, single quotations or database costs were used. Greater than 85% of the mechanical equipment supply budget is derived
from budget quotations.
The process plant will be located
mostly outdoors. However, a brick/steel building to enclose the high-security areas (Merrill Crowe and the furnace / refinery) has been
included in the capital estimate and the cost for this includes the building shell, HVAC, and electrical.
The estimates for mechanical and
electrical equipment capital expenditures are based on various data sources, including budget quotations from well-established equipment
vendors in China and North America, and cost databases from similar recent projects. The process team prepared a mechanical equipment
list by area, containing information on ratings, power, size, and weight. Requests for quotations, which included equipment datasheets,
were issued to vendors to obtain budgetary proposals for major equipment items, including large platework items such as leach tanks.
Budgets for other platework
items were estimated by calculating weights and fabricators’ unit rates from recent projects.
Equipment installation man-hours
were derived based on Halyard’s installation man-hour norms. These norms are North American unit work hours and thus considered
ideal working conditions, which were then adjusted using a productivity factor to account for conditions at the project site. Wage rates
for equipment installation crews were established based on discussions with local contractors in Bolivia.
| Silver Sand Project Pre-Feasibility Study |
| | New Pacific Metals Corp. | 0723071 |
These productivity factors were
incorporated into the labour unit work hours as multipliers on the base man-hours. Estimates for contractors’ construction equipment
are included in the direct costs.
The QP relied upon Halyard’s
civil engineering team to derive preliminary material take-offs (MTOs) based on the mechanical layouts of the plant areas. MTOs contain
calculated quantities of concrete, structural steel, rebar, earthwork, and architectural elements by area. Halyard’s procurement
team engaged Bolivian construction companies to obtain “all-inclusive” supply and install (erection) rates in the form of
formal proposals. The estimating team used MTO quantities and supplied rates to estimate the civil, structural, earthwork, and architectural
costs for each area of the plant.
Budgets for pipework, electrical
bulk items, and general instrumentation items were estimated using plant area-specific factors from other similar gold/silver projects.
The budgets include transportation to the site, which is either factored (for North American supply) or based on budget quotations (for
containerized and bulk shipping to the site from Shanghai, PRC).
Indirect costs are accounted for
using quoted, calculated, and factored values. Construction contractor site costs were described in quotations from multiple Bolivian
contractors based on the provided scope of work and engineering deliverables. These indirect costs include mobilization and demobilization,
mobile equipment costs, consumables, accommodation, food and transport for workers, management and supervision, and miscellaneous items.
Vendor commissioning services costs
were calculated based on obtained formal proposals. The plant’s first fill expenditures were calculated based on required reagent
and grinding media quantities and proposals from suppliers. EPCM (Engineering, Procurement, and Construction Management), consultants
and spare parts inventory costs were factored.
Transportation costs for each piece
of equipment are adjusted based on recent quotes from other projects.
Contingency has been applied based
on a joint risk assessment discussion between Halyard and the client, which involved defining the level of contingency per engineering
discipline. Established contingency factors were then applied to the direct costs of each discipline.
No allowances were made within the
direct cost estimate to cover for material wastage, weather delays, rework and claims and extras.
The process plant capital cost
estimate is $209.4M, which includes $148.5M direct capital, $36.1M of indirect capital and $24.8M of contingency. A high-level breakdown
of plant area capital is given in Table 21.19.
| Table 21.19 | Mill area capital estimate |
| Description |
Total cost ($M) |
| Direct capital |
148.49 |
| Indirect capital |
36.11 |
| Contingency |
24.75 |
| Total |
209.35 |
Source: Halyard Inc.
| Silver Sand Project Pre-Feasibility Study |
| | New Pacific Metals Corp. | 0723071 |
The $148.5M direct capital budget
is broken down by plant area in Table 21.20. The direct capital budget includes the estimated cost of civil and earthworks, the supply,
delivery to the site, and installation of mechanical equipment, structural steel, platework, piping, and electrical / instrumentation
items. It also includes any buildings and mobile equipment items (plant trucks, mobile crane, forklift, skid-steer, etc.).
| Table 21.20 | Process plant direct capital breakdown by area |
| Plant area |
Total cost ($M) |
| Site preparation |
13.5 |
| Crushing |
4.9 |
| Coarse ore storage |
2.4 |
| Grinding (SAG, ball & pebble crushing) |
24.3 |
| Pre-leach thickener |
4.2 |
| Leaching |
32.1 |
| CCD |
15.0 |
| Merrill Crowe |
11.5 |
| Refinery |
4.5 |
| Tailings (dewatering and overland conveyors) |
12.9 |
| Reagents |
6.5 |
| Services |
8.6 |
| Refinery building & laboratory |
0.5 |
| Transportation |
6.9 |
| Mobile equipment |
0.7 |
| Total |
148.5 |
Source: Halyard Inc.
The same budget is broken down by engineering discipline in Table 21.21.
| Table 21.21 | Process
Plant direct capital breakdown by discipline |
| Discipline |
Total cost ($M) |
| Civil and earthworks |
33.6 |
| Mechanical equipment |
42.6 |
| Structural steel |
17.4 |
| Platework |
19.8 |
| Piping |
8.3 |
| Electrical and instrumentation |
19.2 |
| Misc (buildings / architectural / transport) |
7.6 |
| Total |
148.5 |
Source: Halyard Inc.
| 21.3.4 | Tailings Storage Facility |
An estimate of capital cost for the waste
storage facility described in Section 18 was generated by NewFields Canada Mining & Environment ULC.
| Silver Sand Project Pre-Feasibility Study |
| | New Pacific Metals Corp. | 0723071 |
| 21.3.4.1 | Basis of estimate |
The capital cost for the TSF includes the
processing, placement and compaction of fill materials required for the liner for the tailings disposal area, as well as supply to site
and installation of the geomembrane liner materials. The costs associated with the bulk rockfill for construction of the perimeter containment
berms are included in the mining costs as fill materials will be transported directly from the open pit mining operation. The capital
cost estimate is based on a 24-month base case development schedule, starting with the receipt of the necessary Bolivian regulatory construction
permits.
The capital cost estimate includes:
| · | Direct costs including construction of the liner and required transition
and bedding zones in the containment berms |
| · | Indirect costs associated with design and construction |
| · | Provisions for contingency |
Cost estimates are expressed in Q2 2024 US dollars with no
allowances for escalation, currency fluctuation, or interest during construction.
The following references were used as support for the capital
estimate:
| · | Layout drawings for the TSF |
| · | NewFields’ internal project cost database |
No fixed / firm quotations were used to prepare this estimate.
The estimates for construction
are based on budgetary quotations for liner supply, construction equipment supplier performance specifications, and internal databases
for liner installation production rates. Costs for bulk fill for the containment embankments are excluded as they have been accounted
for as part of the mining costs. Wage rates for construction crews were provided by New Pacific.
Preliminary MTOs based on the layout
of the TSF and typical cross-sections for the perimeter embankments. Estimates of site stripping and preparation were developed based
on experience in similar settings. A summary of direct capital costs for the TSF are summarized in Table 21.22.
| Table 21.22 | TSF direct capital costs |
| TSF capital costs |
Total cost (US$M) |
Initial capital costs |
Sustaining capital costs |
| TSF earthworks |
3.3 |
1.3 |
2.0 |
| TSF geosynthetics |
4.3 |
3.2 |
1.2 |
| Stormwater management |
0.2 |
0.1 |
0.1 |
| TSF Instrumentation |
0.1 |
0.1 |
- |
| Water treatment plant |
5.0 |
- |
5.0 |
| Subtotal – Direct costs |
12.9 |
4.7 |
8.2 |
| Silver Sand Project Pre-Feasibility Study |
| | New Pacific Metals Corp. | 0723071 |
| 21.3.4.3 | Indirect & other capital costs |
Indirect costs are accounted for using the following factors
applied to direct costs:
| · | Construction management – 7% |
| · | Quality assurance and quality control – 5% |
| · | Third-part surveying – 3% |
No allowances were made within the
direct cost estimate for material wastage, weather delays, rework, claims, and extras. A contingency of 15% of direct and indirect costs
was applied. New Pacific also included an allowance of US$1.00/tonne of tailings produced as part of sustaining capital costs, based on
operating data from similar TSF facilities, to account for costs for tailings raises and compaction. A summary of indirect, contingency,
and construction allowance costs are presented in Table 21.23.
| Table 21.23 | Indirect & other capital costs for the TSF |
| Tailings Storage Facility capital costs |
Total cost (US$M) |
Initial capital costs |
Sustaining capital costs |
| Indirect construction costs |
3.0 |
1.1 |
1.9 |
| Contingency costs |
2.4 |
0.9 |
1.5 |
| Dam raises and material compaction costs |
52.0 |
- |
52.0 |
| Subtotal - Other costs |
57.4 |
2.0 |
55.4 |
| 21.3.5 | Owner’s capital costs |
Costs related to the water reservoir,
community compensation, and project permitting have been treated as owner’s costs. New Pacific has estimated costs in the project
budget for the following items related to the local community:
| · | Relocating the community cemetery |
New Pacific has also made an allowance for additional support
for project permitting. Costs for the above items have been estimated by New Pacific.
New Fields has prepared an estimate
for construction costs for the water reservoir dam. This estimate excludes the cost of mining and hauling fill material to the dam site,
which is included in the project’s budget as capitalized pre-production mining cost.
An estimate of capital cost for the water
dam as described in Section 18 was generated by NewFields Canada Mining & Environment ULC.
The capital cost for the water
dam includes the processing, placement, and compaction of fill materials required for the liner for the dam, as well as supply to the
site and installation of the geomembrane liner materials. The costs associated with the bulk rockfill for the construction of the water
dam are included in the mining costs as fill materials will be transported directly from the open pit mining operation. The capital cost
estimate is based on a 24-month base case development schedule, starting with the receipt of the necessary Bolivian regulatory construction
permits.
| Silver Sand Project Pre-Feasibility Study |
| | New Pacific Metals Corp. | 0723071 |
The estimate includes the base case scenario and encompasses:
| · | Direct costs including construction of the liner and required transition
and bedding zones in the containment berms. |
| · | Indirect costs associated with design and construction. |
| · | Provisions for contingency. |
Cost estimates are expressed in Q2 2024 US dollars with no
allowances for escalation, currency fluctuation, or interest during construction.
The following references were used as support for the capital
estimate:
| · | Layout drawings for the water dam |
| · | NewFields’ internal project cost database |
No fixed / firm quotations were used to prepare this estimate.
The estimates for construction are
based on budgetary quotations for liner supply, construction equipment supplier performance specifications and internal databases for
liner installation production rates. Costs for bulk fill for the containment embankments are excluded as they have been accounted for
in the mining costs. Wage rates for construction crews were provided by New Pacific.
Preliminary MTOs based on the layout of the
water dam facility and typical cross-sections for the embankment. Estimates of site stripping and preparation were developed based on
experience in similar settings. Indirect costs are accounted for using factored values, in the same manner as the TSF (Section 21.3.4.3).
No allowances were made within
the direct cost estimate to cover for material wastage, weather delays, rework and claims, and extras.
The water dam capital cost estimate
is $3.9M, which includes $2.8M of direct capital, $0.6M of indirect capital and $0.5M of contingency. A high-level breakdown of plant
area capital is given in Table 21.24.
| Table 21.24 | Water dam capital costs |
| Water dam capital costs |
Total cost (US$M) |
| Direct costs |
| Water dam earthworks |
1.6 |
| Water dam geosynthetics |
1.0 |
| Water dam instrumentation |
0.1 |
| Stormwater management |
0.1 |
| Subtotal - Direct costs |
2.8 |
| Other costs |
| Indirect construction costs |
0.6 |
| Contingency costs |
0.5 |
| Subtotal - Other costs |
1.1 |
| Total |
3.9 |
| Silver Sand Project Pre-Feasibility Study |
| | New Pacific Metals Corp. | 0723071 |
| 21.3.5.2 | Other owner’s costs |
Costs related to the following items have been included as
part of the owner’s capital costs.
| · | An allowance for community projects |
| · | Cemetery relocation costs |
| · | An allowance for additional project permitting |
| · | Land compensation payments to the community |
| · | Capitalized operating costs for project development |
| · | Mine closure and rehabilitation |
The QP has reviewed the cost estimates
and determined them to be reasonable at the PFS stage. A 15% contingency cost has been included. Community engagement and consultation
is an ongoing process. As such, these costs have been kept confidential.
The owner’s sustaining capital
costs also include closure and post-closure monitoring. A detailed closure and reclamation plan has not been conducted for the Silver
Sand Project. The QP has assumed reclamation costs of $10 million.
This cost was split over two years immediately
following final production (years 14 and 15 of the production schedule). AMC Consultants also assumed post-closure monitoring & maintenance
costs of $250k/year for five years following final production (years 14-18). A 15% contractor markup and 15% contingency were applied
to closure and reclamation costs. The total closure and reclamation cost was estimated to be $14.9M. Bolivian environmental consultants
engaged by New Pacific have communicated to New Pacific that they are not required to post a reclamation bond or other financial security
before commencing site development.
Capital costs for initial project
construction and development are planned to be expended over a two-year pre-production period. This period covers years -2 and -1 in the
project schedule. The pre-production period includes the following activities:
| · | Building haul roads to connect working areas |
| · | Pre-production mining, to provide rock fill and construct ore stockpiles |
| · | Earthworks and construction of site infrastructure such as: |
| ¾ | Mineral processing plant |
| ¾ | Main substation and electrical infrastructure |
| ¾ | Mobile equipment maintenance shop |
| · | TSF site clearing and construction |
| · | Waste rock storage site clearing |
| · | Constructing the water reservoir dam |
| · | Installing a dewatering system |
| Silver Sand Project Pre-Feasibility Study |
| | New Pacific Metals Corp. | 0723071 |
New Pacific has also made allowances during the pre-production
period for community related costs pertaining to:
| · | Land compensation to affected stakeholders |
| · | Additional studies and project permitting |
A summary of initial and sustaining capital costs is presented
in Table 21.25.
Table
21.25 Capital cost summary
| Capital
cost item (US$M) |
Total
cost |
Initial
capital costs |
Sustaining
capital costs |
| Infrastructure |
50.7 |
47.0 |
3.7 |
| Mine
development |
76.6 |
76.1 |
0.5 |
| Processing
plant |
209.4 |
207.3 |
2.0 |
| Tailings
Storage Facility |
70.3 |
6.7 |
63.6 |
| Owner's
capital costs |
21.2 |
21.2 |
0.0 |
| Closure
costs |
14.9 |
0.0 |
14.9 |
| Total |
443.0 |
358.3 |
84.7 |
| Silver Sand Project Pre-Feasibility Study |
| | New Pacific Metals Corp. | 0723071 |
An economic model was developed
to estimate annual cash flows and sensitivities of the Silver Sand project. Pre-tax estimates of project values were prepared for comparative
purposes, while post-tax estimates were developed in conjunction with New Pacific, and are likely to approximate the true investment value.
All currency is in US$ unless otherwise
stated. The cost estimate was prepared with a base date of Year -2 and does not include any escalation beyond this date. For net present
value (NPV) estimation, all costs and revenues are discounted at 5% from the second half of Year -2 (1 July). The economic model shows
the Project under construction for two years (Year -2 and Year -1), which is considered the development phase which is followed by the
production phase for the balance of the projected cash flows, which is considered operating (Years 1 to 14). The mine closure phase of
the project is from Years 15 to 18.
A regular Bolivian corporate income
tax rate of 25% is applied. As a mining property, the Project is subject to an additional tax of 12.5%, with a 5% reduction for companies
that produce pure metal products (as is the case with the Silver Sand project producing silver doré onsite). A tax schedule was
prepared for corporate income tax based on information provided by New Pacific. No tax credits have been applied.
No tax planning has been applied
for corporate income tax, all historical tax attributes such as any loss carry forwards, recapture, mineral property, exploration costs
or net tax basis of capital assets are ignored. Taxes are paid in the year they are incurred.
The project’s
economics were assessed to determine if the Bolivian Mining Surtax (Surtax) would be applicable. The Surtax policy applies an
additional 25% corporate income tax when extraordinary profits are generated from mining within Bolivia. Based on the economic
parameters defined in this technical report, a Surtax liability will not be incurred at the assumed silver selling price of
$24.00/oz. A Surtax payment may be due if the project’s economics change. The Surtax assessment was conducted by AMC Consultants and
New Pacific. It is based on information provided in the memo titled “Analysis of the Bolivian Mining Surtax effective
application” (8 August 2023) by PPO Legal & Tax (New Pacific’s taxation experts in Bolivia).
Initial capital expended in Year
-2 and Year -1 for developing the project was depreciated at fixed rates per year. Capital costs were depreciated to reduce taxable profit
in year 1, and onwards. The rates of depreciation listed in Table 22.1 were provided by New Pacific, based on information provided by
local tax experts.
| Table 22.1 |
Depreciation rates |
| Item |
Rate of depreciation |
| Pre-production mining |
33.3% |
| Owner’s capital costs |
33.3% |
| Mine development costs (land clearing) |
33.3% |
| Mineral processing capital costs |
12.5% |
| Tailings storage facility capital costs |
20.0% |
| G&A costs* |
7.1% |
| Infrastructure capital costs |
10.0% |
| * | G&A costs were assumed to be
depreciated evenly over the LOM. |
Source: PPO Legal & Tax Offices,
2024.
| Silver Sand Project Pre-Feasibility Study |
| | New Pacific Metals Corp. | 0723071 |
Sustaining capital costs were depreciated
proportionally to the remaining life of the project because they are ongoing costs. The allowance for unforeseen construction challenges
related to the TSF (discussed in Section 21.3.4.3) was completely depreciated in a given year due to the unforeseen nature of these costs.
Operating costs were counted against taxable profit each year to calculate income tax.
The estimates of capital and operating
costs have been developed specifically for this project and are summarized in Section 21 of this report. The economic analysis has been
run with no inflation (constant dollar basis).
Project revenue is derived from
the sale of silver doré. A metal price of $24.00/Troy Oz. was selected after discussion with New Pacific and referencing current
markets and forecasts in the public domain. The selling costs for silver doré are summarized in Table 22.2. The selling costs and
payability rate are based on information provided by New Pacific and Halyard.
| Selling cost item |
Value |
Units |
| Payable Silver |
99.50% |
of Ag produced |
| Transportation & Insurance Costs |
0.25 |
US$/Oz |
| Refining Charges |
0.20 |
US$/Oz |
| Royalty to COMIBOL (outside the AMC limit) |
6.00% |
of gross revenue |
| Royalty to the Bolivian Government |
6.00% |
of gross revenue |
Source: New Pacific Metals
Corp. and Halyard Inc., 2024.
A 6.00% royalty on gross revenue
is applied to all silver doré produced. An additional 6.00% royalty is paid to the Bolivian Mining Corporation (COMIBOL) for silver
produced from ore mined outside of the AMC area (i.e. silver produced in the MPC area).
A discount rate of 5.0% per year
was applied for the project. Discount rates applied to projected cash flows also recognize the time value of money as well the risks and
variables associated with the project, such as metal price fluctuation, marketability of the commodity, location of the project, stage
of development, and experience of the owner.
It is assumed that silver doré
produced each year is considered sold in the same period with no inventories of work-in-process or finished goods.
A high-level economic assessment
of the proposed open pit operation of the Silver Sand deposit was conducted. The project is projected to generate a pre-tax NPV of $1,135M
and a post-tax NPV of $740M at a discount rate of 5% per year, with a pre-tax IRR of 50% and post-tax IRR of 37%.
Initial project capital is estimated
at $358M with a payback period of 1.9 years (measured on a post-tax basis from the beginning of production, after construction is completed).
Key assumptions and results of the economics are provided in Table 22.3. The LOM production schedule, average metal grades, recovered
metal, and cash flow forecast are shown in Table 22.4. Pre-tax and post-tax cashflow graphs are presented in Figure 22.1 and Figure 22.2.
| Silver Sand Project Pre-Feasibility Study |
| | New Pacific Metals Corp. | 0723071 |
| Table 22.3 |
Silver Sand deposit – Key economic input assumptions and cost summary |
| Item |
Unit |
Value |
| Total process feed material |
kt |
52,014 |
| Total waste mined |
kt |
181,878 |
| Pre-production waste mined |
kt |
24,261 |
| Production waste mined |
kt |
157,617 |
| Silver feed grade |
g/t |
105 |
| Silver processing recovery rate |
% |
90.00% |
| Silver selling price |
$/oz |
24.00 |
| Discount rate |
% |
5% |
| Silver payability rate |
% |
99.50% |
| Payable silver metal |
Moz |
157 |
| Gross revenue |
$M |
3,770 |
| Product selling costs & royalties |
$M |
313 |
| Total net revenue |
$M |
3,457 |
| Total capital costs |
$M |
443 |
| Initial capital costs |
$M |
358 |
| Sustaining capital costs |
$M |
85 |
| Total operating costs1 |
$M |
1,281 |
| Mine operating costs1 |
$M |
482 |
| Process and tailings storage operating costs1 |
$M |
713 |
| General and administrative operating costs1 |
$M |
86 |
| Operating cash cost1 (excl. selling costs) |
$/oz Ag payable |
8.16 |
| Pre-tax all in sustaining cost2 |
$/oz Ag payable |
10.69 |
| Pre-tax payback period3 |
Yrs |
1.4 |
| Post-tax payback period3 |
Yrs |
1.9 |
| Pre-tax NPV5% |
$M |
1,135 |
| Pre-tax IRR |
% |
50% |
| Post-tax NPV5% |
$M |
740 |
| Post-tax IRR |
% |
37% |
Notes:
Values may not sum due to rounding.
| 1. | Does not include capitalized operating costs |
| 2. | Does not include site development (initial) capital costs. |
| 3. | The payback period is measured
from the beginning of production, after construction is completed. |
| Source: AMC Mining Consultants (Canada) Ltd., 2024. |
| Silver Sand Project Pre-Feasibility Study |
| | New Pacific Metals Corp. | 0723071 |
| Table 22.4 |
Annual Silver Sand Project production and cashflow forecast |
| Item / parameter |
Unit |
Total |
-2 |
-1 |
1 |
2 |
3 |
4 |
5 |
6 |
7 |
8 |
9 |
10 |
11 |
12 |
13 |
14 |
15 |
16 |
17 |
18 |
| Total ore mined |
Mt |
52 |
2 |
2 |
3 |
5 |
4 |
4 |
4 |
4 |
3 |
4 |
4 |
3 |
2 |
5 |
3 |
|
|
|
|
|
| Total waste mined |
Mt |
182 |
9 |
15 |
13 |
10 |
10 |
11 |
14 |
13 |
14 |
14 |
14 |
15 |
14 |
11 |
5 |
|
|
|
|
|
| Total plant feed |
Mt |
52 |
|
|
4 |
4 |
4 |
4 |
4 |
4 |
4 |
4 |
4 |
4 |
4 |
4 |
4 |
|
|
|
|
|
| Silver feed grade |
g/t |
105 |
|
|
147 |
144 |
135 |
101 |
100 |
98 |
93 |
107 |
92 |
81 |
85 |
110 |
78 |
43 |
|
|
|
|
| Silver recovery |
% |
90 |
90 |
90 |
90 |
90 |
90 |
90 |
90 |
90 |
90 |
90 |
90 |
90 |
90 |
90 |
90 |
90 |
90 |
90 |
90 |
90 |
| Gross revenue |
$M |
3,770 |
|
|
378 |
397 |
374 |
279 |
277 |
272 |
258 |
295 |
254 |
224 |
234 |
303 |
217 |
9 |
|
|
|
|
| Selling costs |
$M |
313 |
|
|
32 |
31 |
31 |
22 |
22 |
22 |
24 |
28 |
22 |
18 |
19 |
24 |
18 |
1 |
|
|
|
|
| Silver payability rate |
% |
99.5 |
99.5 |
99.5 |
99.5 |
99.5 |
99.5 |
99.5 |
99.5 |
99.5 |
99.5 |
99.5 |
99.5 |
99.5 |
99.5 |
99.5 |
99.5 |
99.5 |
99.5 |
99.5 |
99.5 |
99.5 |
| Payable Silver produced |
Moz |
157 |
|
|
16 |
17 |
16 |
12 |
12 |
11 |
11 |
12 |
11 |
9 |
10 |
13 |
9 |
|
|
|
|
|
| Total net revenue |
$M |
3,457 |
|
|
346 |
365 |
342 |
257 |
255 |
251 |
234 |
267 |
232 |
206 |
215 |
280 |
199 |
8 |
|
|
|
|
| Mining |
$M |
482 |
|
|
37 |
33 |
33 |
34 |
40 |
41 |
41 |
42 |
40 |
44 |
40 |
38 |
21 |
|
|
|
|
|
| Processing & Tailings |
$M |
713 |
51 |
55 |
55 |
55 |
55 |
55 |
55 |
55 |
55 |
55 |
55 |
55 |
55 |
8 |
| G&A |
$M |
86 |
6 |
6 |
6 |
6 |
6 |
6 |
6 |
6 |
6 |
6 |
6 |
6 |
6 |
6 |
| Total operating cost |
$M |
1,281 |
|
|
94 |
93 |
93 |
95 |
100 |
101 |
101 |
102 |
101 |
105 |
100 |
99 |
82 |
14 |
|
|
|
|
| Initial capital |
$M |
358 |
160 |
199 |
10 |
8 |
5 |
5 |
6 |
4 |
4 |
5 |
4 |
4 |
5 |
4 |
4 |
7 |
7 |
|
|
|
| Sustaining capital |
$M |
85 |
| Total capital cost |
$M |
443 |
160 |
199 |
10 |
8 |
5 |
5 |
6 |
4 |
4 |
5 |
4 |
4 |
5 |
4 |
4 |
7 |
7 |
0.3 |
0.3 |
0.3 |
| Undiscounted cash flows (pre-tax) |
$M |
1,733 |
-160 |
-199 |
242 |
264 |
244 |
157 |
149 |
145 |
129 |
160 |
126 |
97 |
110 |
177 |
112 |
-13 |
-7 |
|
|
|
| Undiscounted cash flows (post-tax) |
$M |
1,162 |
-160 |
-199 |
181 |
197 |
184 |
117 |
111 |
109 |
97 |
118 |
87 |
68 |
75 |
120 |
77 |
-13 |
-7 |
| Discounted cash flows (pre-tax) |
$M |
1,135 |
-156 |
-185 |
215 |
223 |
196 |
120 |
109 |
101 |
85 |
100 |
76 |
55 |
60 |
91 |
55 |
-6 |
-3 |
| Discounted cash flows (post-tax) |
$M |
740 |
-156 |
-185 |
160 |
166 |
148 |
89 |
81 |
75 |
64 |
74 |
52 |
39 |
41 |
62 |
38 |
-6 |
-3 |
Source: AMC Mining Consultants (Canada) Ltd.,
2024.
| Silver Sand Project Pre-Feasibility Study |
| | New Pacific Metals Corp. | 0723071 |
| Figure 22.1 |
Pre-tax project cashflow |
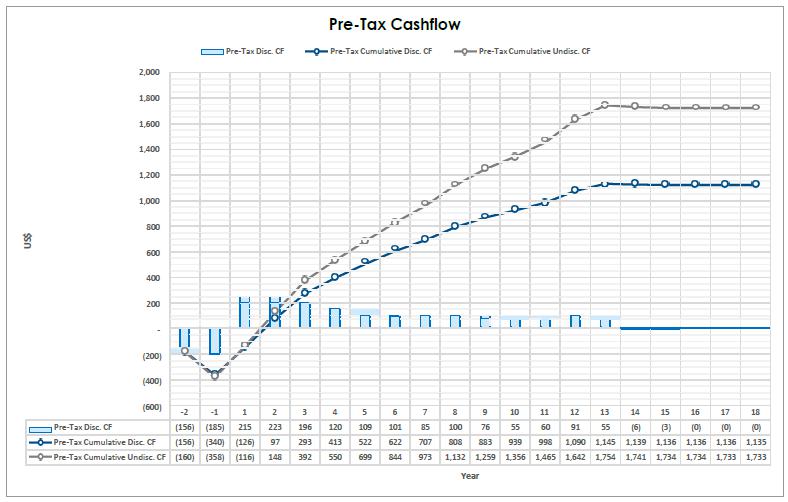
Source: AMC Mining
Consultants (Canada) Ltd., 2024.
| Silver Sand Project Pre-Feasibility Study |
| | New Pacific Metals Corp. | 0723071 |
| Figure 22.2 |
Post-tax project cashflow |
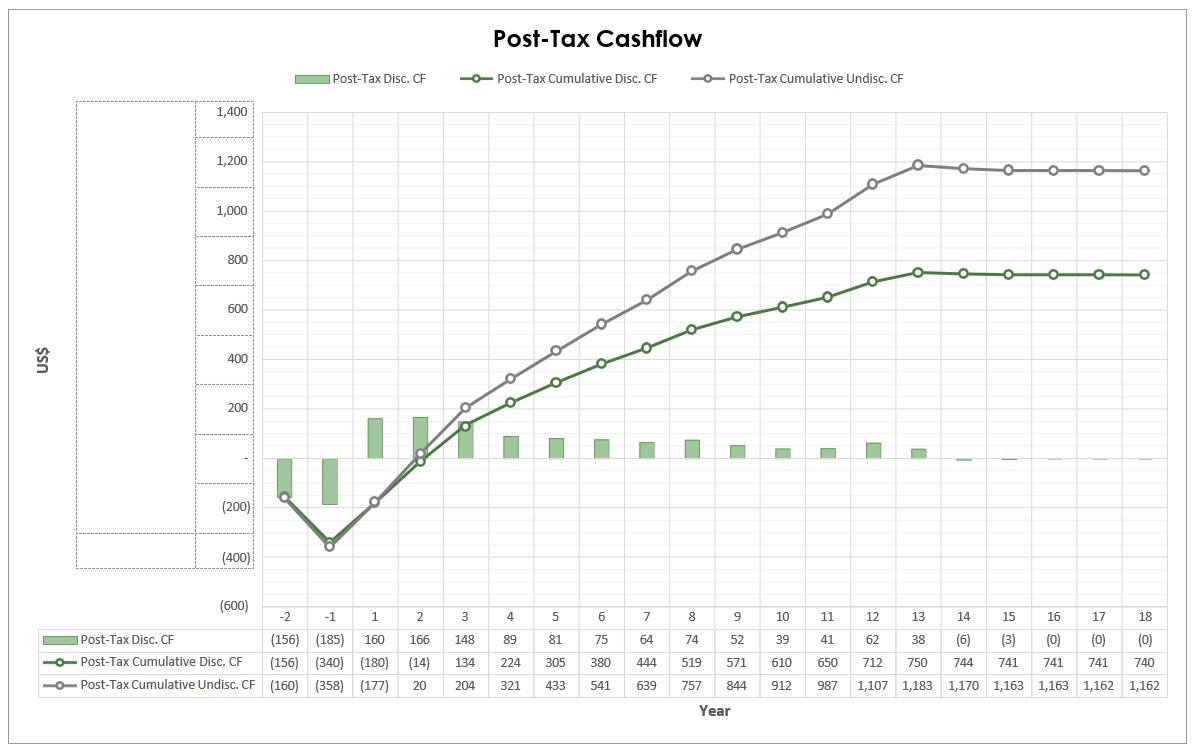
Source: AMC Mining
Consultants (Canada) Ltd., 2024.
| Silver Sand Project Pre-Feasibility Study |
| | New Pacific Metals Corp. | 0723071 |
A sensitivity analysis was
performed for variations in capital costs and operating costs to determine their relative importance as project value drivers. The
sensitivity analysis examined the impact on post-tax NPV (at a discount rate of 5% per year) and IRR by varying the following input
items by +/-10 to +/-20%.
The results of the cost sensitivity analysis are summarized in Table 22.5.
| Table 22.5 |
Sensitivity analysis by input cost |
| |
Cost
sensitivity - NPV US$ M / IRR (%) |
| Sensitivity
input items |
-20% |
-10% |
0% |
+10% |
+20% |
| Base
Case |
| Mine
operating cost |
784
/ 38% |
762
/ 37% |
740
/ 37% |
719
/ 36% |
697
/ 36% |
| Process
operating cost |
803
/ 39% |
773
/ 38% |
740
/ 37% |
708
/ 36% |
676
/ 35% |
| Life-of-Mine
CAPEX |
797
/ 46% |
770
/ 41% |
740
/ 37% |
711
/ 33% |
682
/ 30% |
Note: This table presents NPV / IRR by varying
the input sensitivity items. For example, if LOM CAPEX changes by +20%, while other costs remain the same as the “Base Case”,
the NPV becomes $682 M and IRR is 30%. NPV values are discounted at a rate of 5% per annum.
Source: AMC Mining Consultants (Canada) Ltd.,
2024.
An additional sensitivity analysis was
conducted for the silver metal price and the discount rate. The change in NPV and IRR is presented in Table 22.6 and Source: AMC Mining
Consultants (Canada) Ltd., 2024.
An additional sensitivity analysis was conducted for
the silver metal price and the discount rate. The change in NPV and IRR is presented in Table 22.6 and Figure 22.3.
| Table 22.6 |
Sensitivity analysis of silver prices and discount rates |
| |
Silver price (US$/Troy Oz.) |
| $18.00 |
$21.00 |
$24.00 |
$27.00 |
$30.00 |
|
Discount rate |
5.0% |
329 / 22% |
535 / 30% |
740 / 37% |
936 / 43% |
1,124 / 48% |
| 6.5% |
277 / 22% |
463 / 30% |
649 / 37% |
825 / 43% |
994 / 48% |
| 8.0% |
232 / 22% |
401 / 30% |
569 / 37% |
729 / 43% |
882 / 48% |
| 9.5% |
192 / 22% |
346 / 30% |
500 / 37% |
645 / 43% |
783 / 48% |
| 11.0% |
157 / 22% |
298 / 30% |
438 / 37% |
571 / 43% |
697 / 48% |
Source: AMC Mining Consultants (Canada) Ltd.,
2024.
| Silver Sand Project Pre-Feasibility Study |
| | New Pacific Metals Corp. | 0723071 |
| Figure 22.3 |
Sensitivity analysis of silver prices and discount rates graph |
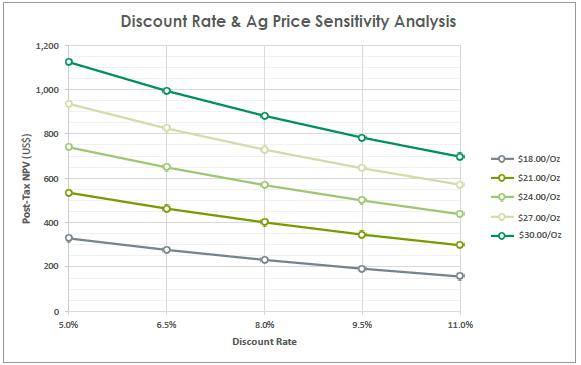
Source: AMC Mining Consultants
(Canada) Ltd., 2024.
The results of the sensitivity
analysis show that the post-tax NPV is robust and remains positive for the range of sensitivities evaluated. The post-tax NPV is most
sensitive to changes in the silver price and the discount rate. The NPV is moderately sensitive to changes in the capital cost and changes
in operating cost.
| Silver Sand Project Pre-Feasibility Study |
| | New Pacific Metals Corp. | 0723071 |
COMIBOL, the state-owned
Bolivian Mining Corporation, holds the exploration and mining rights of the adjacent areas surrounding the concessions owned by New Pacific.
New Pacific acquired the exploration and mining rights of the direct neighbouring 57 km2
area around its concessions through an MPC (see Section 4.2) with COMIBOL, except for a few operating mines which are subleased to small
operators by COMIBOL.
The Colavi mine to the north-west
and the Canutillos mine to the west of the Property are two adjacent operating mines.
| 23.1 | Colavi Tin Polymetallic mine |
The host rock in the Colavi mine area consists
of Ordovician shale and sandstone, and Cretaceous sandstone and dacitic tuffs. Some dacitic intrusive rocks are found in Ordovician and
Cretaceous sequences as stocks, sills, or dykes. Six manto-type mineralized horizons with thicknesses ranging from 0.8 to 1 m were concordantly
developed in a horizon of calcareous sandstone within the Cretaceous red sandstone and tuffs sequence. The mineralized calcareous sandstone
gently dips to the west and occupies an area of 2 km wide and 6 km long. Ore minerals are mainly composed of pyrite, hematite, and cassiterite.
Sphalerite and galena are very rare, and quartz is absent. Volcanism and mineralization are closely related. Manto mineralization formed
first associated with earlier magmatic intrusions, and dacite sills successively intruded the Cretaceous sedimentary sequence and displaced
the manto-type mineralization. Later cassiterite veins occur in dacite (Rivas 1979; Sugaki et al., 1983).
Mining activities for tin at Colavi
can be traced back to 1890. In 1912, the recorded production capacity of the mine was 100 tons per day and produced up to 5,000 tons of
ore grading more than 3% Sn (Redwood, 2018). Production of the Colavi mine in June 1981 was 5,700 t ore grading 0.7% Sn. Mine workers
hand-picked and screened the crude ore to produce 650 to 1,000 t semi-concentrate containing 2 – 3% Sn, per month (Sugaki et al.,
1983).
The United Nations Development
Program (UNDP) and Servicio Geologico de Bolivia (GEOBOL) jointly carried out a reconnaissance exploration for tin and silver at Colavi
in 1989 and 1990 and estimated a potential resource of 3 to 5 million tons grading 0.5 to 0.9% Sn over a 4 km strike length (Redwood,
2018). The QP has been unable to verify the reported resource and the resource is not indicative of the mineralization on the Property
that is the subject of the Technical Report.
| 23.2 | Canutillos Tin Polymetallic mine |
Limited literature on Canutillos
shows that COMIBOL began operation at the mine in 1964 and Empresa Minera Tirex Ltda began to conduct silver heap leach in 2010 (Redwood,
2018). No exploration and production data are available from public sources.
| Silver Sand Project Pre-Feasibility Study |
| | New Pacific Metals Corp. | 0723071 |
| 24 | Other relevant data and information |
The QPs are not aware of any additional information or explanation
that is necessary to make the Technical Report understandable and not misleading.
| Silver Sand Project Pre-Feasibility Study |
| | New Pacific Metals Corp. | 0723071 |
| 25 | Interpretation and conclusions |
Indicative financial results indicate
that the Silver Sand Project has attractive economics and should be progressed to the next stage of study. The results of the economic
evaluation estimate approximately $1,135M pre-tax NPV and $740M post-tax NPV at a 5% discount rate, pre-tax IRR of 50% and post-tax IRR
of 37%.
Silver mineralization at the Property occurs
in ten areas: Silver Sand, El Fuerte, Snake Hole, North Plain, San Antonio, Esperanza, Jisas, El Bronce, Mascota, and Aullagas. The mineralization
identified in the Property belongs to the Bolivian polymetallic vein-type deposits represented by the giant Cerro Rico de Potosí
silver mine in Potosí.
Logging, mapping, sampling, and
analyzing procedures of New Pacific’s on-going exploration programs follow common industry practice. Results of QA/QC programs are
deemed acceptable by the QP.
The Silver Sand
deposit is defined by exploration drilling and has a conceptual pit constrained Mineral Resource using a 30 g/t Ag cut-off of
Measured and Indicated Mineral Resources of 54.26 million tonnes grading 116 g/t silver. Dinara Nussipakynova, P.Geo. of BBA
(formerly employed with AMC Consultants) takes responsibility for these estimates.
The deposit as currently defined
remains open for expansion and there has been no modern district-scale exploration. While it is understood that engineering work for the
feasibility study will be based on the current block model, there are some recommendations for future exploration. Some drilling pre-production
may be required and this may take the form of grade control drilling and that has not been quantified at this stage.
| 25.2 | Metallurgy and processing |
The metallurgical work described
within Section 13 was completed by several accredited North American laboratories with the specific aim of supporting a pre-feasibility
study and builds upon the earlier work completed over a 2-year period at SGS Lima, Peru.
The underlying process approach, having been
established during the PEA, continues to be whole ore leaching with sodium cyanide followed by silver reduction using zinc dust (Merrill
Crowe) and smelting / refining. For this reason, the PFS testwork focused on cyanidation (in tanks and using heap leach methods) but also
included comminution testwork, gravity concentration, mineralogical analysis and various characterization tests. The entire PFS work program
was completed under the close supervision of Dr. Jinxing Ji, on behalf of New Pacific, and was subsequently reviewed by the QP.
The PFS testwork was carried out
on several composite samples of mineralization that were selected to represent the established geometallurgical units and to provide a
degree of spatial variability. Additional work was completed on blended composites (blends of sulphide, oxide and transitional) in order
to establish the metallurgical response of typical production blends. The work on blended composites was predictable and forms the basis
for the metallurgical projections used in the PFS.
The work completed within the updated metallurgical
program has progressed understanding of the metallurgical behaviour of mineralization from the Silver Sand Project.
| Silver Sand Project Pre-Feasibility Study |
| | New Pacific Metals Corp. | 0723071 |
The metallurgical efficiency with
which a mineral processing plant might recover metal into a saleable product can have a significant impact on the potential for economic
extraction. The mineral resource estimate used a constrained pit shell calculation that included a 90% metallurgical recovery assumption
for silver, and this is considered appropriate and reasonable by the QP given the test work results presented in this section. Attention
should be given to the fact that the metallurgical programs discussed below are still somewhat preliminary in nature and are therefore
limited in their ability to represent the full extent of the deposit. Future metallurgical programs are planned however, and it is expected
that these will further de-risk the project in this area.
| 25.2.2 | Composite characterization |
After consideration of the updated
resource estimate and mine plans, the range of silver grades tested in PFS work programs (described in Section 13) are considered by the
QP to be a good representation of average run of mine head grades. Sufficient work was completed to gain insight into the likely variation
in metallurgical response resulting from different head grades and geometallurgical unit blends.
The database of
comminution information for the Project is still somewhat preliminary, although data has been relatively consistent so far. The
latest SAG Mill amenability results indicate an average or medium hardness, whereas finer testing gives Bond Work Index values of
14.5 kWh/t to 16.4 kWh/t. More comprehensive comminution testing, especially at the coarser sizes, is planned for future
programs.
| 25.2.4 | Gravity concentration |
The impact of gravity concentration
ahead of cyanidation was preliminarily tested as part of the PFS metallurgical program. The results of this work suggest that a gravity
circuit can be configured to recover approximately 5% of the densest material in the cyclone overflow, and that this material can subsequently
be reground to a fine size (approximately 80% -15 µm). If this reground product is then re-inserted into the cyanidation circuit
for leaching, then the cyanidation characteristics of the product appear to be enhanced, and this results in a higher overall recovery
of silver.
Despite these encouraging initial
results, gravity concentration was not included in the PFS base case, as testwork is still considered preliminary in nature. The additional
preproduction capital required to include this element of the flowsheet would be approximately $15M.
Further gravity testwork is considered
necessary before the gravity process can be incorporated into the overall flowsheet.
Although stated to be semi-quantitative
in nature, the silver deportment data derived from the SGS Lakefield TIMA-X mineralogy program (2022) is still quite useful as it highlights
significant differences that help to explain metallurgical behaviour.
The following points were noted in the
PEA:
| · | Silver within the Oxide and Transition units is found
almost entirely within Argentite / Chloroargyrite whereas these minerals carry only half the silver within the sulphide unit. |
| · | The high concentration of silver (~80%) within these
minerals helps with the generation of high-grade flotation concentrates, as seen in the Oxide Master Composite locked cycle test. |
| Silver Sand Project Pre-Feasibility Study |
| | New Pacific Metals Corp. | 0723071 |
| · | Approximately one third of the silver found within
the sulphide unit is in tetrahedrite. As this mineral tends to be richer in copper and antimony than silver, then one should expect significant
concentrations of these elements in flotation products from the sulphide unit. |
| · | The sulphosalts carry a minority of silver in each
unit, ranging from 2.3% in the oxide composite to 12.7% in the sulphide composite. These minerals float well in a sulphide flotation environment
and are also amenable to cyanide leaching. |
Subsequent mineralogical work for
the PFS examined individual geometallurgical units with XRD (semi-quantitative) and the production composites with QEMScan (quantitative).
Silver deportment data continues to identify silver-copper sulphide minerals, acanthite and silver halide minerals as the main carriers
of this paymetal. Copper is found in chalcopyrite and other cyanide soluble sulphides.
In general, all major silver-bearing
minerals are amenable to cyanidation, assuming adequate liberation is achieved.
A new program of bottle roll testing
allowed further study of the amenability of tank leaching with cyanide. Composites samples were tested under a range of conditions including
variable grind, leaching time, cyanide concentration, dissolved oxygen concentration, and lead nitrate addition. Bottle rolls equipped
with internal lifter bars (for additional agitation) gave good results compared to those tests conducted without lifters.
Leach kinetics were
noted to be rather slow, which is quite typical for cyanidation of silver minerals. 72 hour leaching in a 2.0 gpL sodium cyanide
solution appears to be necessary to achieve the desired extraction rates.
The best leaching results are achieved
with high dissolved oxygen levels. For this reason, the injection of oxygen with high-energy spargers into some of the early leaching
tanks is a feature of the flowsheet.
Copper is present in most samples
at Silver Sand, and the copper minerals are often partially soluble in cyanide solutions. Dissolution of copper is approximately 50% on
average and this is responsible for a significant proportion of the cyanide consumption. The copper can either be rejected in the zinc
precipitation process, or recovered to precipitate, depending on the temperature of feed solutions. If copper is recovered to the silver
precipitate, it can be selectively removed using acidic atmospheric oxidative leaching followed by copper precipitation. Whilst this represents
additional complexity in the flowsheet, the scale is small, and the circuit prevents a buildup of copper in process water and the increase
of cyanide consumption.
The process flowsheet selected
for this PFS represents a very conventional approach and is similar to those practiced by nearby Bolivian operations.
Key elements of the flowsheet include
primary crushing with a single jaw crusher, grinding to 75 µm with a SAG mill and ball mill combination, pre-leach thickening, cyanidation
in 15 large agitated and oxygenated / aerated tanks, solid-liquid separation using CCD thickeners, and silver precipitation and recovery
in a standard Merrill Crowe type refinery.
| Silver Sand Project Pre-Feasibility Study |
| | New Pacific Metals Corp. | 0723071 |
The cyanidation circuit is currently
quite large compared to typical gold leaching circuits – a result of the slower leaching kinetics typically seen with silver compared
to gold. Initial designs used Chinese equipment and platework, but fabrication / shipping challenges were reported by vendors to limit
the practical size of leach tanks to about 17 m diameter and 18.7 m high. This results in a larger leach circuit footprint and higher
civil costs. Subsequent optimization work has considered the use of larger tanks (22 m diameter x 23 m high) and agitators supplied from
North American fabricators. Although this was too late for incorporation into the PFS, an optimized smaller footprint design will be considered
in subsequent studies. This represents an opportunity for capital optimization.
The incorporation of continuous
gravity equipment into the grinding circuit is considered to be another opportunity as initial testwork has shown that fine grinding of
gravity concentrates has the potential to improve the overall circuit extraction rates. Again, this has been excluded from the PFS flowsheet
but is earmarked for additional testwork and potential incorporation into future flowsheet designs.
| 25.2.8 | Metallurgical predictions |
Analysis of metallurgical results
and PFS mine plan data has determined that a simple fixed recovery model is adequate for the financial analysis of the project. Several
more complex models were tested with similar outcomes.
For the PFS, a fixed recovery of
90% Ag has been used, based on a Y1-7 mill feed composition of 11% Oxide, 66% Transitional, and 21% sulphide. 3% of the mine plan material
was reported as “unknown ID”.
| 25.3 | Mining and infrastructure |
The Silver Sand open pit is split
into two areas by the Machacamarca Creek. The ultimate pit is split into eight sub-phases. The ultimate pit is approximately 2,300 m long,
350 – 700 m wide, and has a maximum depth of 280 m.
Slope angles used for pit designs
are steep and reflect the good condition of the surrounding rock but will require appropriate wall control blasting and mining practices
to ensure that walls can be maintained at the proposed angles. It is recommended to develop a weathering horizon model and collect additional
geotechnical data as per Section 16.3.4 to increase the geotechnical model reliability. Geotechnical slope design criteria should be updated
when further information is available and pit slope stability should be assessed under static and seismic conditions.
The open pit is proposed to be mined
using a conventional truck and excavator mining method using 72 t payload trucks and 115 t excavators. Ore and waste will be mined on
10 m benches, with waste mined in two 5 m flitches, and ore mined in three 3.3 m flitches per bench. The open pit is planned to be a contractor-run
operation with a contractor-provided mining fleet.
The mine production schedule requires
an average fleet size of 35 haul trucks and 5 loading units. The required fleet varies according to production requirements. At peak production
in year 10, the mine requires 43 haul trucks and 6 loading units to fulfill production requirements. Staffing levels fluctuate based on
the mining schedule and equipment requirements, with a peak of 283 staff required for the open pit in year 10 of operations.
Waste material is planned to be
used as fill for earthworks for infrastructure, such as the water dam and TSF embankment.
| Silver Sand Project Pre-Feasibility Study |
| | New Pacific Metals Corp. | 0723071 |
Waste material not used to support
construction has been scheduled to be stored in the Valley Dump immediately west of the pit, and the main waste dump (WD1), which is south
of the processing plant. Two in-pit dumps have also been designed in the main pit to provide flexibility and cost savings for waste placement.
The open pits contain
approximately 52.0 Mt of ore with an average grade of 105 g/t Ag, and 181.9 Mt of waste material, with an overall
waste-to-mineralized material strip ratio of 3.50 to 1 (including pre-production mining). The open pit operation includes two years
of pre-production mining (starting in Year -2) and 13 years of production.
The production plan is based on delivering
4.0 Mtpa of ore to the processing plant. The mine plan includes a stockpiling strategy with low-grade, mid-grade, and high-grade ore stockpiles
that will be used to maximize silver production in the early years of the project. A maximum stockpile size of 4.4 Mt of ore is required.
The total annual ex-pit material mined peaks at 18.0 Mtpa, before dropping to 8.0 Mtpa at the end of the open pit mine life.
A rockfill water dam with an upstream
geomembrane liner will be built upstream from the mine. The reservoir developed behind the dam will have a maximum capacity of about 3.0
million cubic metres. The reservoir will provide water for the mineral processing plant and mining camp and could supply downstream residents
for farming and daily life water requirements if required.
The processing plant will produce
filtered tailings that will be stored in a valley adjacent to the plant. Filtered tailings will be conveyed to the storage facility and
deposited using a radial stacker spread using tracked dozers. Tailings will be stored behind a fully lined rock-fill embankment. The embankment
will be constructed using waste rock provided from the open pit. Diversion ditches will be constructed around the TSF to re-route non-contact
water. Seepage and run-off from the TSF will be collected in a pond which will be located downstream of the facility. Water from this
pond will be pumped back to the processing plant to be re-used for mineral processing.
There is currently no significant
infrastructure on site aside from access roads. New Pacific has undertaken discussions with the power authorities in Bolivia to arrange
for access to grid power. A water supply can be secured with the construction of a small dam across the Machacamarca Creek to create a
reservoir to supply the mill and local community.
There is a 54 km long road made
up of a 27 km stretch of the paved Bolivia National Highway 5 and an all-season gravel road built for mining in the Colavi District. The
gravel road is currently being widened and upgraded to paved road by the government.
The infrastructure has been costed
at a suitable level of accuracy for this type of study. The mine will have a small on-site camp to house select management personnel.
All other staff are planned to be housed in nearby communities.
Risks and opportunities relating to
this project are discussed below.
| · | Mineral reserves are based on modifying factors applied
to the mineral resource. Deviation from the modifying factors will change the mineral reserve. Until mineral reserves are mined and processed,
the quantity of mineralization and grades must be considered as estimates only. |
| · | Portions of the Silver Sand deposit have been mined
intermittently since the 16th century. Activities conducted by artisanal miners are not well documented, so it is not possible to quantify
the extent of deposit depletion. Depletion is believed to be a minor risk to the project’s economics. |
| Silver Sand Project Pre-Feasibility Study |
| | New Pacific Metals Corp. | 0723071 |
| · | Mining risks include greater-than-expected dilution
and ore loss. Greater dilution can have a severe impact on project economics. The mine must ensure adequate drilling and blasting practices,
and ore control processes, are implemented to minimize dilution from wall rock and other low-grade mineralized zones. |
| · | Other mining risks and control measures identified
included a large number of typical mining risks such as heavy vehicle interaction with light vehicles and personnel, haul ramp failure,
pit wall failure, excessive ore dilution, and waste dump failure. Controls to be implemented to mitigate these risks include development
of a traffic management plan, targeted geotechnical drilling and investigation, development of a ground control management plan, surface
water study, grade control drilling, and design of facilities to the required codes and standards. |
| · | Historical buildings exist on small portions of the
Silver Sand deposit, south of the Machacamarca creek. This is a risk that requires further investigation and reflect in the Historical
Buildings Management Plan. |
| · | Opposition to the project from the community is seen
as a risk to the timely and successful execution of the project. |
| · | The government of the current President, elected
at the end of 2020, supports and encourages private and foreign investments in the economic sectors of the country. New laws were approved
by congress to encourage private investments in the mining sector, for example, Law 1391 (Supreme Decree 4579, 2021) to waive value-added
tax for the import of equipment and vehicles. |
| · | Although the country is generally friendly to private
and foreign investments in mining sector, risks associated with government instability caused by political polarization and visible divisions
in the governing party are noteworthy. For instance, Bolivia experienced a failed coup d’etat led by the military on 26 June 2024.
(Ramos, 2024). Additionally, local protests and blockages by various social groups may pose unforeseen instability from time to time.
Bolivia has experienced intermittent periods of socioeconomic and political instability that can lead to social unrest and economic uncertainty. |
| · | The amount of time required for site development
and construction will significantly influence the value of the project. Delays during the construction period pose a significant risk
to the project’s economics. |
| · | Potential for formation of Acid Rock Drainage is
not well understood. Testing indicates that most waste rock has the potential to generate Acid Rock Drainage, but testing to evaluate
the time to acidification and the extent of Acid Rock Drainage has not been completed. |
| · | The Bolivian government provides significant subsidies
to lower the cost of diesel fuel, at a high fiscal cost to the government. The removal or reduction of the fuel subsidy would adversely
impact the economics of the Silver Sand Project. Escalations to the operating costs have been evaluated under the sensitivities presented
in Section 22. |
| · | Should Silver Sand not be able to get access to grid
power, diesel power generation must be considered, though this is considered low risk. |
| · | The water dam is upstream from the pit. Should there
be a breach of the dam, the pit could potentially flood. |
| · | Metallurgical testwork has characterized a growing
set of composite samples that have been compiled using lengths of half and quarter core from resource drilling. The sample set is judged
to be adequate for the PFS, but more work should be completed to enrich the data set with more variability analysis (silver / copper grade,
deposit location etc.) as this will allow a more complete analysis of economic drivers such as silver recovery and cyanide consumption.
Certain areas of the reserve may be found to provide lower recoveries or higher cyanide consumptions than the average values estimated
for the PFS. |
| Silver Sand Project Pre-Feasibility Study |
| | New Pacific Metals Corp. | 0723071 |
| · | The process flowsheet selected for the Project is
straightforward, uses commonly available mineral processing equipment and is in many ways similar to established silver operations in
the region. However, the leaching of silver is slow (compared to gold), and the negative influence of copper on cyanide consumption and
potentially also silver recovery should not be underestimated. Further testwork will focus on the characterization of these effects, in
addition to other development work. |
| · | The filtration of tailings at 4 Mtpa rate is a significant
undertaking that requires several large pressure filters to be in operation simultaneously. The buildup of ultra fines within the filter
media can, over time, blind filtration media which reduce the availability of this critical equipment and causes production bottlenecks.
The PFS process designs have made some allowance for this potential issue, and further testwork should examine the phenomenon to ensure
that design contingencies are adequate. |
| · | Three potential satellite pit locations have been
identified to the north and east of the main pit. These satellite pits were evaluated at a high level at a silver price of US$23.00/Troy
Oz. These pits had marginal value and could be included in the mine plan at higher silver prices. |
| · | Longer term, there is potential for expansion and
upgrading of the Silver Sand deposit through additional drilling. |
| · | Work to identify alternative dump locations with short
hauls to provide flexibility and costs savings for waste placement. One potential area identified is the Machacamarca Creek gully adjacent
to the main pit. |
| · | Revisions to the TSF configuration could potentially
reduce the volume of fill (waste) material required for constructing the embankment. A lower waste mining requirement in the early years
of the project would reduce the mine development capital costs and would allow for a more flexible mining sequence, that may be able to
extract more additional-grade ore in the early years of production. |
| · | Geotechnical and hydrogeological investigations have
not been completed in the area of the proposed waste and tailings storage facilities. Identification of suitable low-permeability surficial
soils could preclude the requirement for the inclusion of a geomembrane liner over the base of the tailings storage facility. |
| · | Several areas of the process plant flowsheet are open
to improvement, as testwork and engineering is developed. Opportunities such as the use of fewer (larger) leaching tanks for a smaller
footprint. The development of gravity concentration and regrind milling, particularly for sulphide-rich areas of the deposit, have shown
the potential to significantly improve silver recovery. |
| · | Many areas of the Silver Sand deposit include concentrations
of copper. The copper can be a complication for cyanidation circuits as it tends to consume cyanide. For Silver Sand, the process flowsheet
allows for the removal of copper, thereby avoiding buildup of this element to more challenging levels. Production of a copper-rich byproduct
represents an opportunity to increase revenues slightly, although current metal prices may not support this option. |
| · | New Pacific should retain a tax specialist for the
FS to investigate the possibility of including tax credits (i.e. royalty tax credit) and income tax planning measures, to further improve
project value. |
| · | The presence of traceable gold in the ore feed, measured
at approximately 0.02 g/t, presents an opportunity to enhance the economic outcomes of the project. While the primary focus remains on
silver production, the recovery of even small quantities of gold can contribute positively to the overall project economics. |
| Silver Sand Project Pre-Feasibility Study |
| | New Pacific Metals Corp. | 0723071 |
The main recommendation is to advance the
Silver Sand project to a feasibility study level. This will require advancing the definition and engineering level of all of the mining,
processing, and infrastructural aspects.
| 26.2 | Quality Assurance / Quality Control |
There are a number of recommendations
on all facets of QA/QC summarized below. These are expanded on in Section 11.
| · | Purchase an additional CRM at the average grade of the
deposit which has been certified using similar digestion methodology. |
| · | Investigate performance issues with CRMs CDN-ME-1603
and CDN-ME-1605 if these are to be used in future programs. |
| · | If the ME-MS41 analytical method continues to be used
going forward it is recommended that the OG46 over-limit threshold be dropped from 100 g/t Ag to a level below the anticipated COG. |
| · | Continue to include blanks in every batch of samples
submitted at a rate of at least 1 in every 20 samples (5%) and consistently monitor them in real time on a batch-by-batch basis and that
remedial action is taken as issues arise. |
| · | Ensure that all blank sample follow up is recorded. |
| · | Implement investigative work to understand geological variance. |
| · | Ensure that all future programs include 4 - 5% duplicate
samples including field duplicates, coarse (crush) duplicates, and pulp duplicates to enable the various stages of sub-sampling to be
monitored. |
| · | In future programs, submit umpire duplicates, as
was done for the October 2017 – 2019 programs. |
| · | Submit pulp samples (rather than coarse reject) so
that umpire samples only monitor analytical accuracy and variance. |
| · | Include CRMs at the average grade and higher grades in umpire sample submissions. |
For future Mineral Resource modelling, the following should
be considered:
| · | At the next update of the model include all remaining drill data which missed the closing date. |
| · | Incorporate geometallurgical attributes into the block model. |
| · | Verify mined-out volumes by surveying historical waste dumps. |
| · | Conduct structural analysis of available data and complete initial structural
/ geotechnical drilling as required. |
| · | Update the 3D geological model to include detailed geology – deposit
oxidation domaining and structures. |
The Silver Sand deposit, as currently defined, remains open
for expansion at depth. It is recommended that future drilling on the deposit should consider the following:
| · | Infill drilling to upgrade areas of high-grade mineralization within the
current Inferred Resource area. |
| · | Additional drilling around the current Mineral Resources, where the deposit
remains open at depth. |
| Silver Sand Project Pre-Feasibility Study |
| | New Pacific Metals Corp. | 0723071 |
The QP also notes that there has
been no modern district-scale exploration outside of Silver Sand deposit. It is recommended that additional drilling be completed at the
other prospects to assess for the potential for Mineral Resources.
| 26.4 | Metallurgy and mineral processing |
The PFS metallurgical program included
extensive cyanide leach testing of 18 mineralized samples, and this has demonstrated that cyanide leaching is a technically viable option
to recover silver for the project. The work has incrementally de-risked metallurgical aspects of the project, although opportunities for
improvement are believed to remain. Further metallurgical investigations are warranted to increase silver recovery and to reduce cyanide
consumption.
| 26.4.1 | Sample selection and characterization |
Sampling and compositing of material
for the various metallurgical programs completed over the last three years has been based on a consistent geometallurgical model that
identifies material by the degree of oxidation of host rock as either Oxidized, Transitional, or Fresh (Sulphide) material. Although relatively
straightforward, these models have generated a robust data set that highlights slightly different metallurgical responses.
Despite the different degrees of
host rock oxidation, the nature of silver mineralization is less variable, and cyanide leaching behaviour is relatively consistent under
the right conditions.
The further development of metallurgical
programs is encouraged, and it is expected that these will further refine the metallurgical performance predictions – primarily
silver recovery, copper recovery, and cyanide consumption rate. The completion of more extensive metallurgical sampling, characterization
testing, and performance modelling is recommended as infill drilling programs continue.
The physical characterization of
metallurgical composites has highlighted a relatively low level of variability within the deposit, and a marginal trend towards harder
samples as oxidation levels increase. Accurate sizing and selection of comminution equipment requires additional data, and an extended
variability program in this area is recommended as part of a feasibility program. The involvement of comminution specialists will become
more important as the designs progress towards “for construction” status.
Additional quantitative mineralogy
programs will assist in understanding silver deportment within geometallurgical zones and is recommended for inclusion in future metallurgical
programs.
| 26.4.2 | Gravity concentration |
Gravity concentration with the
fine grinding of the resultant gravity concentrate has been demonstrated to significantly increase silver recovery for the high-grade
sample from the sulphide domain. Further testing is needed to optimize the consumption of cyanide while silver recovery is being improved.
Also, the testing of gravity concentration should be extended to determine the necessary gravity concentrate mass pull and the minimum
regrind size. Further testing should include the joint cyanide leach where the finely reground gravity concentrate is leached together
with the gravity tail.
The latest metallurgical studies
have highlighted some of the sensitivities within a typical cyanidation leach circuit – such as those practiced by nearby Bolivian
operations. In particular, a large capacity leaching circuit appears necessary, to provide long leach times.
| Silver Sand Project Pre-Feasibility Study |
| | New Pacific Metals Corp. | 0723071 |
The cost of imported sodium cyanide
together with the significant consumption of this key reagent is the single largest operating cost, and further work to optimize process
conditions to minimize cyanide consumption is recommended.
As the process plant will be located
at a high altitude (>4,000 m), it is important that further cyanidation test work continues to focus on leach conditions that include
high dissolved oxygen (DO2) levels. The DO2 vs silver recovery relationship should be defined further to allow optimized design oxygenation
equipment in the flowsheet.
Heap leach is not considered to
be a viable option for the project at this point in time, due primarily to the expectation that day-to-day operation at a high elevation
will be problematic.
| 26.4.4 | Process water effects |
When process water is recycled
to the grinding circuit and other circuits in the process plant, a number of phenomena occur. For instance, the recirculation of cyanide
means that silver dissolution will start during grinding, and this will likely have a positive impact on silver recovery. Also, the dissolved
copper cyanide complex and zinc cyanide complex will likely be able to dissolve silver. If this happens, then sodium cyanide consumption
is likely to decrease. However, because of copper dissolution during the cyanide leach, the level of dissolved copper will tend to accumulate
over time. Higher levels of dissolved copper in the process water may interfere with cyanide titration and the reduction of dissolved
silver within the Merrill Crowe circuit.
If the copper in solution precipitates
together with silver in the Merrill Crowe circuit, the separation between copper and silver will become necessary for the silver precipitate
before smelting. Therefore, more detailed metallurgical testing is needed to study the impact of recycled process solutions.
| 26.4.5 | Pre-leach thickening |
The PFS metallurgical program included thickening
test work that used the detoxed cyanide leach residue slurry. As the flowsheet does not include a detoxification step then comparative
thickening testing is needed for the cyanide-leached tailing without prior cyanide destruction.
| 26.4.6 | Optimization of Merrill Crowe |
Silver reduction using zinc dust
should be tried without the addition of lead nitrate. Also, further testing should be carried out with a lower dosage of zinc dust. The
impact of the elevated level of dissolved copper on the reduction of silver needs to be fully investigated.
| 26.4.7 | Cyanidation methods |
Although the use of a lifterbottle
roll has been demonstrated to produce good results with respect to silver recovery and cyanide consumption, cyanide leach testing in a
mechanically agitated tank should be investigated further. The tank should have an adequately sized agitator, the impeller should be properly
positioned (i.e., vertically), and the depth of slurry to the tank diameter should be close to 1:1. This is particularly important since
test work has demonstrated a sensitivity to these details.
| 26.4.8 | Oxygen intake during cyanide leach |
Air entrainment from atmosphere
into the slurry is often significant when cyanide leach is carried out in a small tank / bottle in the laboratory. However, for a large
tank in commercial operation, air entrainment from atmosphere into the slurry is negligible. As a result, oxygen intake during the cyanide
leaching process must be measured correctly.
| Silver Sand Project Pre-Feasibility Study |
| | New Pacific Metals Corp. | 0723071 |
The measured oxygen intake data will be used
for final air / oxygen sparging system designs and to set sparging rates during future commercial operations.
| 26.4.9 | Copper removal from Merrill Crowe precipitates |
Considering the dissolved copper
may precipitate together with silver in the Merrill Crowe circuit, testing is needed to selectively dissolve copper in the presence of
metallic silver while hydrogen peroxide and sulphuric acid are used. Process variables such as temperature, retention time, and hydrogen
peroxide utilization need to be investigated and optimized.
| 26.4.10 | Preg-robbing, preg-borrowing, and instability of silver cyanide complex |
A significant risk remains in that
the preg-robbing or preg-borrowing phenomenon, which was experienced by Bureau Veritas Mineral / Metallurgy, did not occur at ALS Metallurgy
in Kamloops, BC. In addition, ALS Metallurgy in Kamloops experienced issues where additional silver was generated midway through the cyanide
leaching process.
It is thought that these issues
could be related to the instability of the silver complex in cyanide solutions, the contamination of sample bottles, the carry-over of
mild steel from the grinding mill (or media), and unreliable silver assay procedures. Detailed investigations are warranted in these specific
areas.
| 26.5 | Hydrogeology and hydrology |
It is recommended the following
steps be taken to further develop an understanding of the hydrological and hydrogeological parameters impacting the Silver Sand project:
| · | Review of drillhole records and geological data for
improved conceptual understanding of the shallow groundwater system. |
| · | Sampling of the springs and wetland to the north and west of the Main Pit. |
| · | Shallow drilling (auger or diamond drilling) to install
shallow piezometers and prove the depth of the colluvial system, and whether it supports a water table upstream of the springs and within
the wetland area. |
| · | Permeability testing of the existing standpipe piezometers. |
| · | Construction of a trial dewatering borehole in the
alluvial deposits of the main river channel to investigate its hydrogeological properties and allow for a targeted dewatering strategy,
if required. |
| · | Construction of at least one trial dewatering borehole
into a major fault structure and surrounding piezometer array to investigate fault properties and surrounding fracture connectivity. |
| · | The installation of multi-level vibrating wire piezometers
is recommended to improve the understanding of the hydrogeological system. The following targets are recommended: |
| ¾ | At least one major and one local fault structure. |
| ¾ | The shallow aquifer system in hill-slope colluvium (further to positive
results from exploratory drilling). |
| ¾ | The Tarapaya Formation (where saturated). |
| ¾ | UH3 orthogonal to the existing standpipe piezometers for triangulation
of groundwater pressure. |
| ¾ | UH3 north and south of the river. |
| Silver Sand Project Pre-Feasibility Study |
| | New Pacific Metals Corp. | 0723071 |
| · | It is recommended to develop a weathering horizon
model and collect additional geotechnical data as per Section 16.3.4 to increase the geotechnical model reliability. Geotechnical slope
design criteria should be updated when further information is available and pit slope stability should be assessed under static and seismic
conditions. |
| · | The ongoing geotechnical program should be continued
to collect additional data for pit wall angle stability analysis. |
| · | In addition, soil and weathered core samples should be collected for lab
testing. |
It is recommended that the following
aspects are examined in the next study stage:
| · | It is recommended to undertake a detailed bench height
and dilution study. The study should consider lateral block extents, flitch / bench heights, equipment specifications, drill and blast,
mining rates, dilution and grade control strategies, and geotechnical implications. Grade control strategies, such as grade control drilling
and blast movement monitoring should also be further evaluated. |
| · | It is recommended that quotes from multiple Bolivian
mining contractors are collected to firm up the mining costs estimates for the open pit operations. New Pacific is recommended to acquire
binding (or “firm”) quotes for the primary mining contractor to achieve a higher level of accuracy for the FS. |
| · | Further work should be conducted to identify alternative
dump locations, i.e., in the creek gully, to reduce haul distance. |
| · | The amount of time required for site development and
construction will significantly influence the value of the project. As part of the FS, New Pacific is recommended to prepare an operational
readiness assessment and create a detailed development schedule to ensure the project is fully prepared for operation. |
| · | It is recommended that all technical and commercial
aspects of site infrastructure are pursued to a higher level of accuracy as part of the feasibility study. |
| · | Location and placement of accommodation camp, waste
dump, crusher, and process plant be confirmed following civil geotechnical and condemnation drilling. |
| · | Continue to negotiate with power authorities to confirm
the cost estimate, and that sufficient grid capacity can be provided. |
| · | The site requires significant earthworks to construct
the supporting infrastructure. New Pacific should investigate the potential for engaging contractors who are familiar with this type of
work to obtain an accurate and dependable estimate of costs. |
| · | The early years of the mine production schedule are
driven by silver grades and the requirement to produce waste material to be used as rock fill for the tailings storage embankment. As
part of the FS, it is recommended to investigate alternative configurations for tailings storage, to reduce the volume (and cost) of waste
production in the early years of the project. |
| · | Initiate geotechnical, geological, and hydrogeological
investigations to fully characterize the site conditions in the location of the proposed waste storage facility. |
| Silver Sand Project Pre-Feasibility Study |
| | New Pacific Metals Corp. | 0723071 |
| · | Initiate detailed geochemical characterization program,
including static and kinetic testing to fully characterize the tailings and waste rock materials to be produced from the mining and processing
operations. |
| · | Potential for formation of Acid Rock Drainage is
not well understood. It is recommended to undertake testing to evaluate the time to acidification and the extent of Acid Rock Drainage
of the waste rock. |
| · | Complete the environmental baseline study, impact analysis, and mitigation
plans. Permitting has to be advanced. |
| · | New Pacific is recommended to conduct a detailed closure and reclamation
plan as part of the FS. |
| · | Environmental programs have commenced with a reasonable
set of samples characterized. As the project continues to progress towards permitting and construction, a larger set of variability samples
should be submitted to develop the dataset of geochemical behavior (acid- generation and metals leaching) in plant tailing streams and
waste rock piles. FS level environmental test work should include static tests and kinetic (humidity cell) tests on filtered slurry samples
generated by the most recent test work. These tests would not include cyanide detoxification as this process is no longer included in
the process flowsheet. |
It is recommended that New Pacific retain a tax specialist
for the FS to investigate the possibility of including tax credits and income tax planning measures, to further improve project value.
| 26.12 | Community and social studies |
It is recommended that community and social studies are continued
and expanded to levels appropriate for the FS.
The above activities will be managed and collated as part
of an FS report.
| 26.14 | Recommendation cost summary |
The estimated costs for the recommended programs including
contingency are tabulated below in Table 26.1.
| Table 26.1 | Cost summary estimate for recommendations |
| Cost category |
Budget totals (US$) |
| Geometallurgical addition to the block model |
30,000 |
| Metallurgical & mineral processing test work |
200,000 |
| Geotechnical, hydrogeology, and hydrology |
1,000,000 |
| Open pit mining |
250,000 |
| Infrastructure engineering |
200,000 |
| Tailings storage |
1,100,000 |
| Environmental studies and permitting |
750,000 |
| Community & social studies and programs |
500,000 |
| Completion of FS reporting |
1,000,000 |
| Contingency – 10% |
500,000 |
| Grand total |
5,530,000 |
Source: AMC Mining Consultants (Canada) Ltd.,
2024, with input from New Pacific, Halyard, and Newfields.
| Silver Sand Project Pre-Feasibility Study |
| | New Pacific Metals Corp. | 0723071 |
Aguirre, F.B. 2019, Bufete Aguirre
Soc. Civ., Mining in Bolivia: overview, Practical Law Country Q&A w-010-2113.
ALS Metallurgy Kamloops, Comminution
Testwork on Composites from the Silver Sand Project, New Pacific Metals Corp, KM 6875, 8 February 2023.
ALS Metallurgy Kamloops, Pre-Feasibility
Study Metallurgical Testing for the Silver Sand Project, Bolivia, New Pacific Metals Corp, KM6855, 13 July 2023.
ALS Metallurgy Perth, Merrill Crowe
Testing, Report No. A24428, July 2023.
AMC Consultants, NI 43-101 Technical
Report, Silver Sand Deposit Preliminary Economic Assessment, New Pacific Metals Corp, 30 November 2022.
AMC Mining Consultants (Canada)
Ltd. 2020, “Silver Sand Deposit Mineral Resource Report (Amended) for New Pacific Metals Corp Property Potosí, Bolivia”,
effective date 16 January 2020, amended date 3 June 2020.
Arce-Burgoa, O. & Goldfarb, R. 2009,
Metallogeny of Bolivia, SEG Newsletter, No.79.
Autonomous Municipal Government
of Tacobamba. N.d. Territorial Plan for Integral Development 2016-2020.
Bieniawski, Z. T., 1989. Engineering
Rock Mass Classification. New York: Wiley.
Birak, D.J. 2017, “NI 43-101
Technical Report on Silver Sand Project”, Potosí Department, Bolivia, 15 August 2017.
Bolivian Ministry of Environment
and Water 2018, Methodology for the Identification of Environmental Impacts, p. 2.
Bufete Aguirre Soc. Civ. 2017, Basics of Mining
Law in Bolivia, GlobalMineTM Basics of Mining Law 2017, pp. 26-41.
Bureau Veritas Minerals / Metallurgical, Metallurgical
Testing for Silver Recovery, New Pacific Metals – Silver Sand Project, Project No. 2201508, 28 October 2022.
Cai, M., Kaiser, P.K., Uno, H.,
Tasaka, Y. and Minami, M. (2004). “Estimation of rock mass deformation modulus and strength of jointed hard rock masses using the
GSI system”. International Journal of Rock Mechanics and Mining Sciences, 41(1), pp. 3-19
Convention on International Trade
in Endangered Species of Wild Fauna and Flora (CITES). (14 February 2021). Appendices I, II and III.
Dietrich, A., Lehmann, B., &
Wallianos, A. 2000, Bulk rock and melt inclusion geochemistry of Bolivian tin porphyry systems, Economic Geology, Vol. 95, 2000, pp. 313–326.
Holloway, Andy, Metallurgical Program,
Silver Sand Project, Q4 2020 – Q2 2021, SGS Lima, Peru, July 2021.
| Silver Sand Project Pre-Feasibility Study |
| | New Pacific Metals Corp. | 0723071 |
Itasca, PPT-682.002.03 - Preliminary
Recommendation of Inter-ramp Angles for Silver Sand Open pit, May 2023.
Itasca, Geotechnical and Hydrogeological
Study for PFS Silver Sand Project, April 2024.
Itasca, Hydrological, and Hydrogeological
Conceptual Study – Silver Sand Project, October 2022.
JKTech, SMC Test Report Silver Sand, JKTech Job No 23017/P1, January 2023.
Kemetco Research, Cyanide Detoxification
Study, Project R0703, 31 May 2023.
Lamb, S., Hoke, L., Kennan, L., & Dewey, J.
1997, “Cenozoic evolution of the Central Andes in Bolivia and northern Chile”, Geological Society of London, Special
Publications, Vol. 121, pp. 237-264.
London Bullion Market Association, London
PM Fix, May 2024.
Long, S.D., Parker, H.M., & Françis-Bongarçon,
D. 1997, “Assay quality assurance quality control programme for drilling projects at the prefeasibility to feasibility report level”,
Prepared by Mineral Resources Development Inc. (MRDI) August 1997.
Ministerio de La Presidencia, (1
September 2021). Decreto Supremo 4579. Edición: 1424NEC Gaceta Oficial del Estado plurinacional de bolivia (http://www.gacetaoficialdebolivia.gob.bo/edicions/view/1424NEC).
Ministry of Environment and Water, (2009).
Red Book of Vertebrate Wildlife of Bolivia. National Institute of Statistics (INE) (2012). National Population and Housing Census 2012.
National Institute of Statistics
(INE). (2013). Agricultural Census 2013.
New Pacific Metals Corp 2017, News Release, 10 April 2017.
New Pacific Metals Corp (2018).
Final Report: Socioeconomic Baseline, Risk Analysis and Community Engagement Recommendations for New Pacific Metals Corp – Silver
Sands Project in the Department of Potosí-Bolivia.
P.C.A Ingenieros Consultores S.A. – DISEÑO PRELIMINAR “PRESA
MACHACAMARCA”, INFORME FINAL, March 2023.
PPO Legal & Tax (8 August 2023).
Analysis of the Bolivian Mining Surtax effective application.
Plurinational State of Bolivia.
(1997). Supreme Decree No. 24,782 the Environmental Regulations for Mining Activities, Bolivia.
Plurinational State of Bolivia. (2009).
Constitution of Bolivia.
Plurinational State of Bolivia. (21
December 2010). Law No. 71 - Law of Rights of Mother Earth.
Plurinational State of Bolivia.
(15 October 2021). Law 300, Framework Law of Mother Earth and Integral Development for Living Well.
Plurinational State of Bolivia. (23
May 2014). Law No. 535, Bolivian Cultural Heritage Law.
| Silver Sand Project Pre-Feasibility Study |
| | New Pacific Metals Corp. | 0723071 |
Plurinational State of Bolivia. (28 May 2014). Law No. 535,
the Mining and Metallurgy Law.
Plurinational State of Bolivia. (27 April 1992). Law No. 1333, Environmental Law.
Plurinational State of Bolivia. (8 December 1995). Supreme
Decree No. 24,176 - Regulation of the Environmental Law. Regulations for activities with dangerous substances.
Pratt, W. & Francis-Smith, B. (2018). Structural Control on
Mineralization at Silver Sands, Bolivia. Technical Report.
Pocock Industrial, Flocculant Screening, Gravity
Sedimentation, Slurry Rheology and Pressure Filtration, PI2404, May 2023.
Ramos, D. (2024a, June 27). Bolivia coup attempt
fails after military assault on Presidential Palace | Reuters. Reuters
(https://www.reuters.com/world/americas/bolivias-president-slams-irregular- mobilization-army-units-2024-06-26/).
Read, J. & Stacey, P., 2009. Guildelines for Open
Pit Slope Design. s.l.:CSIRO PUBLISHING.
Redwood, S.D. 2018, New Pacific Internal Report, A review
on the Silver Sand Project, Potosí, Bolivia, 27 December 2018.
Rivas, S. 1979, Geology of the principal tin deposits of
Bolivia. Geological Society of Malaysia, Bulletin 11, December 1979, pp. 161-180.
Ruijin Jiang, Andy Holloway and Alex Zhang, NI 43-101 Technical
Report, Silver Sand Project, Potosí, Bolivia, 31 August 2019.
SGS Burnaby, TML Report Analysis, report reference 0000025992,
31 May 2023.
SGS Lakefield, An Investigation into Mineralogical Characterization
of Three Silver Feed Samples from Bolivia, Project 18131-01, 27 August 2020.
SGS Lima, Metallurgical Report for New Pacific Metals Corp,
August 2019.
SGS Lima, Metallurgical Tests Service by Cyanide Leaching
for the Assessment of Silver Minerals, Project Silver Sand – Phase I, Project# Cz. MET 0285-2018 MIN, May 2019.
SGS Lima, Metallurgical Tests Services of Comminution, Floating
and Leaching for the Evaluation of Silver Ores, Silver Sand Project, Project# Cz. MET 0169-2020 MIN, July 2021.
Sugaki, A., Ueno, H., Kitakaze,
A., Hayashi, K., Shimada, N., Kusachi, I., & Sanjines, O. 1983, “Geological study on the polymetallic ore deposits in the Potosí
district, Bolivia”, The Science Reports of the Tohoku University, Series III, Vol. XV, No. 3.
U.S. Central Intelligence Agency (CIA) in 1971, map no. 78499
1971, available from the website of The University of Texas at Austin (https://legacy.lib.utexas.edu/maps/bolivia.html).
World Population Review. (2024). Potosí
Population. Retrieved 19 July 2024 from worldpopulationreview.com/world-cities/potosi-population.
World Population Review. (2024).
Sucre Population. Retrieved 19 July 2024 from https://worldpopulationreview.com/world-cities/sucre-population.
| Silver Sand Project Pre-Feasibility Study |
| | New Pacific Metals Corp. | 0723071 |
CERTIFICATE OF
AUTHOR
I, Eugene Tucker, P.Eng., of Vancouver,
British Columbia, do hereby certify that:
| 1 | I am currently employed as a Principal
Mining Engineer and Regional Manager - Canada with AMC Mining Consultants (Canada) Ltd. (EGBC #1002350), with an office at Suite 202,
200 Granville Street, Vancouver, British Columbia, V6C 1S4. |
| 2 | This certificate applies to the
technical report titled “Silver Sand Project Pre-Feasibility Study”, with an effective date of 19 June 2024, (the “Technical
Report”) prepared for New Pacific Metals Corp. (“the Issuer”) in respect of the Issuer’s Silver Sand property (the
“Property”). |
| 3 | I am a graduate of the University
of Alberta in Edmonton, Canada (Bachelor of Science degree in Engineering in 1996 and Master of Engineering in 1999). I am a registered
member in good standing with Engineers and Geoscientists British Columbia (License #30131) and Association of Professional Engineers
and Geoscientists of Alberta (License #60027). I have worked as a Mining Engineer for a total of 25 years and have relevant experience
in open pit mining of gold, base metals and coal, design and planning, mine production and financial evaluation, reserve estimation,
technical reviews, feasibility and pre-feasibility studies, project and construction management, contracts management and cost estimation. |
I have read the definition of “qualified
person” set out in National Instrument 43-101 (NI 43-101) and certify that by reason of my education, affiliation with a professional
association (as defined in NI 43-101) and past relevant work experience, I fulfill the requirements to be a “qualified person”
for the purposes of NI 43-101.
| 4 | I have not visited the Property. |
| 5 | I am responsible for Sections
2-6, 20, 23, 24, 25, 26 and part of 1 of the Technical Report. |
| 6 | I am independent of the Issuer
and any related companies as described in Section 1.5 of the NI 43-101; |
| 7 | I have not had prior involvement
with the property that is the subject of the Technical Report; |
| 8 | I have read NI 43-101, and the
Technical Report has been prepared in compliance with NI 43- 101 and Form 43-101F1. |
| 9 | As of the effective date of the
Technical Report and the date of this certificate, to the best of my knowledge, information and belief, this Technical Report contains
all scientific and technical information that is required to be disclosed to make the Technical Report not misleading. |
Effective Date: 19 June 2024
Signing Date: 6 August 2024
Original signed and sealed by
Eugene Tucker, P.Eng.
Regional Manager – Canada / Principal Mining
Engineer
AMC Mining Consultants (Canada) Ltd.
| Silver Sand Project Pre-Feasibility Study |
| | New Pacific Metals Corp. | 0723071 |
CERTIFICATE OF AUTHOR
I, Dinara Nussipakynova, P.Geo., of North Vancouver, British
Columbia, do hereby certify that:
| 1 | I am currently employed as a Principal
Geologist with BBA Engineering Ltd., with an office at 1050 West Pender Street, Suite 800, Vancouver, British Columbia V6E 3S7. |
| 2 | This certificate applies to the
Technical Report titled “Silver Sand Project Pre-Feasibility Study”, with an effective date of 19 June 2024 (the “Technical
Report”), prepared for New Pacific Metals Corp. (“the Issuer”). |
| 3 | I am a graduate of Kazakh National
Polytechnic University (Bachelor of Science and Master of Science in Geology in 1987). I am a member in good standing of the Association
of Engineers and Geoscientists of British Columbia (Registration #37412) and the Association of Professional Geoscientists of Ontario
(Registration #1298). I have practiced my profession continuously since 1987 and have been involved in mineral exploration and mine geology
for a total of 35 years since my graduation from university. My experience is principally in Mineral Resource estimation, database management,
and geological interpretation. |
I have
read the definition of “qualified person” set out in National Instrument 43-101 (NI 43-101) and certify that by reason of my
education, affiliation with a professional association (as defined in NI 43-101) and past relevant work experience, I fulfill the requirements
to be a “qualified person” for the purposes of NI 43-101.
| 4 | I visited the Property from 28
- 29 May 2022 for 2 days. |
| 5 | I am responsible for Sections
7 - 12, 14 and parts of 1, 25, 26, and 27 of the Technical Report. |
| 6 | I am independent of the Issuer
and related companies applying all of the tests in Section 1.5 of the NI 43-101. |
| 7 | I have had prior involvement with
the Property in that I was a qualified person for previous AMC Technical Report in 2020 (dated 25 May 2020, amended and restated on 3
June 2020 with an effective date of 16 January 2020), as well as the AMC Technical Report in 2022 (effective date of 30 November 2022). |
| 8 | I have read NI 43-101 and the
sections of the Technical Report for which I am responsible have been prepared in compliance with NI 43-101. |
| 9 | As of the effective date of the
Technical Report, to the best of my knowledge, information, and belief, the sections of the Technical Report for which I am responsible
contain all scientific and technical information that is required to be disclosed to make the Technical Report not misleading. |
Effective Date: 19 June 2024
Signing Date: 1 August 2024
Original signed and sealed by
Dinara
Nussipakynova, P.Geo.
Principal Geologist
BBA Engineering Ltd.
| Silver Sand Project Pre-Feasibility Study |
| | New Pacific Metals Corp. | 0723071 |
CERTIFICATE OF AUTHOR
I, Andrew Holloway, P.Eng., do hereby certify that:
| 1 | I am currently employed as Process
Director with Halyard Inc., with an office at 212 King St. West, Suite 501, Toronto, Ontario M5H 1K5. |
| 2 | This certificate applies to the
Technical Report titled “Silver Sand Project Pre-Feasibility Study”, with an effective date of 19 June 2024 (the “Technical
Report”), prepared for New Pacific Metals Corp. (“the Issuer”) in respect of the Issuer’s Silver Sand property (the
“Property”). |
| 3 | I graduated from the University
of Newcastle upon Tyne, England, B.Eng. (Hons) Metallurgy, 1989. I am a registered member in good standing of the Association of Professional
Engineers of Ontario (Membership #100082475). I have practiced my profession in the mining industry continuously since graduation. |
My relevant experience with respect
to process plant engineering, precious metals metallurgy and metals marketing includes 34 years’ experience in the mining sector,
working for operating mining companies, engineering companies and mining consultancies.
I have
read the definition of “qualified person” set out in National Instrument 43-101 (NI 43-101) and certify that by reason of my
education, affiliation with a professional association (as defined in NI 43-101) and past relevant work experience, I fulfill the requirements
to be a “qualified person” for the purposes of NI 43-101.
| 4 | I visited the Property from 14
- 16 January 2020. |
| 5 | I am responsible for Sections
13, 17, 19 and parts of 1, 21, 25, 26, and 27 of the Technical Report. |
| 6 | I am independent of the Issuer
and related companies applying all of the tests in Section 1.5 of the NI 43-101. |
| 7 | I have had prior involvement with
the Property in that I was a qualified person for the previous AMC Preliminary Economic Assessment Report on the Silver Sand Property
in 2022 (date 30 November 2022). |
| 8 | I have read NI 43-101 and the
sections of the Technical Report for which I am responsible have been prepared in compliance with NI 43-101. |
| 9 | As of the effective date of the
Technical Report, to the best of my knowledge, information, and belief, the sections of the Technical Report for which I am responsible
contain all scientific and technical information that is required to be disclosed to make the Technical Report not misleading. |
Effective Date: 19 June 2024
Signing Date: 1 August 2024
Original signed and sealed by
Andrew Holloway, P.Eng.
Process Director
Halyard Inc.
| Silver Sand Project Pre-Feasibility Study |
| | New Pacific Metals Corp. | 0723071 |
CERTIFICATE OF AUTHOR
I, Wayne Rogers, P.Eng., of Vancouver, British Columbia,
do hereby certify that:
| 1 | I am currently employed as a Principal
Mining Engineer and Open Pit Manager with AMC Mining Consultants (Canada) Ltd. (EGBC #1002350), with an office at Suite 202, 200 Granville
Street, Vancouver, British Columbia V6C 1S4. |
| 2 | This certificate applies to the
Technical Report titled “Silver Sand Project Pre-Feasibility Study”, with an effective date of 19 June 2024, (the “Technical
Report”), prepared for New Pacific Metals Corp. (“the Issuer”) in respect of the Issuer’s Silver Sand property (the
“Property”). |
| 3 | I am a graduate of the University
of Western Australia in Perth, Australia (Bachelor of Mining Engineering in 2005) and the University of Queensland in Brisbane, Australia
(Master of Philosophy (MPhil) in Mining Engineering in 2014).
I am a member in good standing of the Engineers and Geoscientists British Columbia (Registration #49953). I have worked as a Mining Engineer
for a total of 19 years since my graduation from university and have relevant experience in project management, feasibility studies,
and technical report preparations for mining projects. My expertise includes strategic and tactical mine planning, mine design, mine
optimization, feasibility studies, and drill and blast. |
I have
read the definition of “qualified person” set out in National Instrument 43-101 (NI 43-101) and certify that by reason of my
education, affiliation with a professional association (as defined in NI 43-101) and past relevant work experience, I fulfill the requirements
to be a “qualified person” for the purposes of NI 43-101.
| 4 | I visited the Property from 4-5
May 2023 for 2 days. |
| 5 | I am responsible for Sections
15, 16, 22 and parts of 1, 21, 25, 26, and 27 of the Technical Report. |
| 6 | I am independent of the Issuer
and related companies applying all of the tests in Section 1.5 of the NI 43-101. |
| 7 | I have had prior involvement with
the Property in that I was a qualified person for the AMC Technical Report in 2022 (effective date of 30 November 2022). |
| 8 | I have read NI 43-101 and the
sections of the Technical Report for which I am responsible have been prepared in compliance with NI 43-101. |
| 9 | As of the effective date of the
Technical Report, to the best of my knowledge, information, and belief, the sections of the Technical Report for which I am responsible
contain all scientific and technical information that is required to be disclosed to make the Technical Report not misleading. |
Effective Date: 19 June 2024
Signing Date: 31 July 2024
Original signed and sealed by
Wayne Rogers, P.Eng.
Open Pit Manager / Principal Mining Engineer
AMC Mining
Consultants (Canada) Ltd.
| Silver Sand Project Pre-Feasibility Study |
| | New Pacific Metals Corp. | 0723071 |
CERTIFICATE OF AUTHOR
I, Mo Molavi, P.Eng., of Vancouver, British Columbia, do
hereby certify that:
| 1 | I am currently employed as a Director
/ Mining Services Manager / Principal Mining Engineer with AMC Mining Consultants (Canada) Ltd. (EGBC #1002350), with an office at Suite
202, 200 Granville Street, Vancouver, British Columbia V6C 1S4. |
| 2 | This certificate applies to the
Technical Report titled “Silver Sand Project Pre-Feasibility Study”, with an effective date of 19 June 2024 (the “Technical
Report”), prepared for New Pacific Metals Corp. (“the Issuer”) in respect of the Issuer’s Silver Sand property (the
“Property”). |
| 3 | I am a graduate from Laurentian
University in Sudbury, Canada (Bachelor of Engineering in 1979) and McGill University of Montreal, Canada (Master of Engineering in Rock
Mechanics and Mining Methods in 1987). I am a registered member in good standing of the Association of Professional Engineers and Geoscientists
of Saskatchewan (License #5646), the Engineers and Geoscientists British Columbia (Registration #37594), and a Member of the Canadian
Institute of Mining, Metallurgy and Petroleum. I have worked as a Mining Engineer for a total of 45 years since my graduation from university
and have relevant experience in project management, feasibility studies, and technical report preparations for mining projects. |
I have
read the definition of “qualified person” set out in National Instrument 43-101 (NI 43-101) and certify that by reason of my
education, affiliation with a professional association (as defined in NI 43-101) and past relevant work experience, I fulfill the requirements
to be a “qualified person” for the purposes of NI 43-101.
| 4 | I have not visited the Property. |
| 5 | I am responsible for parts of
Sections 1, 18, 25, and 26 of the Technical Report. |
| 6 | I am independent of the Issuer and related companies
applying all of the tests in Section 1.5 of the NI 43-101. |
| 7 | I have had prior involvement with
the Property in that I was a qualified person for the AMC Technical Report in 2022 (effective date of 30 November 2022). |
| 8 | I have read NI 43-101 and the
sections of the Technical Report for which I am responsible have been prepared in compliance with NI 43-101. |
| 9 | As of the effective date of the
Technical Report, to the best of my knowledge, information, and belief, the sections of the Technical Report for which I am responsible
contain all scientific and technical information that is required to be disclosed to make the Technical Report not misleading. |
Effective Date: 19 June 2024
Signing Date: 31 July 2024
Original signed and sealed by
Mo Molavi, P.Eng.
Director / Mining Services Manager / Principal Mining
Engineer
AMC Mining Consultants (Canada) Ltd.
| Silver Sand Project Pre-Feasibility Study |
| | New Pacific Metals Corp. | 0723071 |
CERTIFICATE OF AUTHOR
I, Leon Botham, P.Eng., of Saskatoon, Saskatchewan, do hereby
certify that:
| 1 | I am currently employed as a Principal
Engineer with NewFields Canada Mining & Environment ULC, with an office at 640 Broadway Avenue, Suite 204, Saskatoon, Saskatchewan
S7N 1A9. |
| 2 | This certificate applies to the
Technical Report titled “Silver Sand Project Pre-Feasibility Study”, with an effective date of 19 June 2024 (the “Technical
Report”), prepared for New Pacific Metals Corp. (“the Issuer”) in respect of the Issuer’s Silver Sand property (the
“Property”). |
| 3 | I am a graduate of the University
of Saskatchewan in Saskatoon, Canada (B.E. Civil Engineering in 1988) and Purdue University in Indiana, United States (MSCE Civil/Geotechnical
Engineering in 1991). I am a registered member in good standing of the Association of Professional Engineers and Geoscientists of Saskatchewan
(License #06604 ), the Engineers and Geoscientists British Columbia (License #35852), the Professional Engineers of Ontario (License
#90325408), the Engineers Yukon (License #1482), the Northwest Territories and Nunavut Association of Professional Engineers and Geoscientists
(License #L1194) and a Member of the Canadian Institute of Mining, Metallurgy and Petroleum. I have worked in the field of Mine Waste
Management, Mine Water Management and Geotechnical Engineering for a total of 35 years since my graduation from university. I have relevant
experience in tailings facility design, construction, feasibility studies and technical report preparation for projects in Canada and
internationally. |
I have
read the definition of “qualified person” set out in National Instrument 43-101 (NI 43-101) and certify that by reason of my
education, affiliation with a professional association (as defined in NI 43-101) and past relevant work experience, I fulfill the requirements
to be a “qualified person” for the purposes of NI 43-101.
| 4 | I have not visited the Property. |
| 5 | I am responsible for parts of
Sections 1, 18, 21, 25, and 26 of the Technical Report. |
| 6 | I am independent of the Issuer
and related companies applying all of the tests in Section 1.5 of the NI 43-101. |
| 7 | I have had prior involvement with
the Property in that I was a qualified person for the AMC Technical Report in 2022 (effective date of 30 November 2022). |
| 8 | I have read NI 43-101 and the
sections of the Technical Report for which I am responsible have been prepared in compliance with NI 43-101. |
| 9 | As of the effective date of the
Technical Report, to the best of my knowledge, information, and belief, the sections of the Technical Report for which I am responsible
contain all scientific and technical information that is required to be disclosed to make the Technical Report not misleading. |
Effective Date: 19 June 2024
Signing Date: 2 August 2024
Original signed and sealed by
Leon Botham, P.Eng.
Principal Engineer
NewFields Canada Mining & Environment ULC
| Silver Sand Project Pre-Feasibility Study |
| | New Pacific Metals Corp. | 0723071 |
Our offices
| Australia |
|
|
Adelaide
Level 1, 12 Pirie Street
Adelaide
SA 5000 Australia
T +61 8 8201 1800
E adelaide@amcconsultants.com |
Brisbane
Level 15, 100 Creek Street
Brisbane
Qld 4000 Australia
T +61 7 3230 9000
E brisbane@amcconsultants.com |
| |
|
|
Melbourne
Level 12, 477 Collins Street
Melbourne
Vic 3000 Australia
T +61 3 8601 3300
E melbourne@amcconsultants.com |
Perth
Level 1, 1100 Hay Street
West Perth
WA 6005 Australia
T +61 8 6330 1100
E perth@amcconsultants.com |
| |
|
| Canada |
|
|
Toronto
140 Yonge Street, Suite 200
Toronto
ON M5C 1X6 Canada
T +1 647 953 9730
E toronto@amcconsultants.com |
Vancouver
200 Granville Street, Suite 202
Vancouver
BC V6C 1S4 Canada
T +1 604 669 0044
E vancouver@amcconsultants.com |
| |
|
| South Africa |
United Kingdom |
|
Cape Town
First Floor, Willowbridge Centre
Carl Cronje Drive
Cape Town 7530 South Africa
T +27 720 833 231
E capetown@amcconsultants.com |
Maidenhead
Registered in England and Wales
Company
No. 3688365
Building 3, 1st Floor
Concorde Park, Concorde Road
Maidenhead
SL6 4BY United Kingdom
T +44 1628 778 256
E maidenhead@amcconsultants.com
Registered Office:
The Kinetic Centre
Theobald Street
Elstree
Hertfordshire WD6 4PG United Kingdom |

CERTIFICATE OF AUTHOR
I, Leon Botham, P.Eng., of Saskatoon, Saskatchewan, do hereby certify that:
| 1 |
I am currently employed as a Principal Engineer with NewFields Canada Mining & Environment ULC, with an office at 640 Broadway Avenue, Suite 204, Saskatoon, Saskatchewan S7N 1A9. |
|
|
| 2 |
This certificate applies to the Technical Report titled “Silver Sand Project Pre-Feasibility Study” with an effective date of 19 June 2024 (the “Technical Report”), prepared for New Pacific Metals Corp. (“the Issuer”) in respect of the Issuer's Silver Sand property (the "Property"). |
|
|
| 3 |
I am a graduate of the University of Saskatchewan in Saskatoon, Canada (B.E. Civil Engineering in 1988) and Purdue University in Indiana, United States (MSCE Civil/Geotechnical Engineering in 1991). I am a registered member in good standing of the Association of Professional Engineers and Geoscientists of Saskatchewan (License #06604), the Engineers and Geoscientists British Columbia (License #35852), the Professional Engineers of Ontario (License #90325408), the Engineers Yukon (License #1482), the Northwest Territories and Nunavut Association of Professional Engineers and Geoscientists (License #L1194) and a Member of the Canadian Institute of Mining, Metallurgy and Petroleum. I have worked in the field of Mine Waste Management, Mine Water Management and Geotechnical Engineering for a total of 35 years since my graduation from university. I have relevant experience in tailings facility design, construction, feasibility studies and technical report preparation for projects in Canada and internationally. |
|
|
| |
I have read the definition of "qualified person" set out in National Instrument 43-101 (NI 43-101) and certify that by reason of my education, affiliation with a professional association (as defined in NI 43-101) and past relevant work experience, I fulfill the requirements to be a "qualified person" for the purposes of NI 43-101. |
|
|
| 4 |
I have not visited the Property. |
|
|
| 5 |
I am responsible for parts of Sections 1, 18, 21, 25, and 26 of the Technical Report. |
|
|
| 6 |
I am independent of the Issuer and related companies applying all of the tests in Section 1.5 of the NI 43-101. |
|
|
| 7 |
I have had prior involvement with the Property in that I was a qualified person for the AMC Technical Report in 2022 (effective date of 30 November 2022). |
|
|
| 8 |
I have read NI 43-101 and the sections of the Technical Report for which I am responsible have been prepared in compliance with NI 43-101. |
|
|
| 9 |
As of the effective date of the Technical Report, to the best of my knowledge, information, and belief, the sections of the Technical Report for which I am responsible contain all scientific and technical information that is required to be disclosed to make the Technical Report not misleading. |
Effective Date: 19 June 2024
Signing Date: 2 August 2024
Original signed by
Leon Botham, P.Eng.
Principal Engineer
NewFields Canada Mining & Environment ULC
CERTIFICATE OF AUTHOR
I, Andrew Holloway, P.Eng., do hereby certify that:
| 1 |
I am currently employed as Process Director with Halyard Inc., with an office at 212 King St. West, Suite 501, Toronto, Ontario M5H 1K5. |
|
|
| 2 |
This certificate applies to the Technical Report titled “Silver Sand Project Pre-Feasibility Study” with an effective date of 19 June 2024 (the “Technical Report”), prepared for New Pacific Metals Corp. (“the Issuer”) in respect of the Issuer's Silver Sand property (the "Property"). |
|
|
| 3 |
I graduated from the University of Newcastle upon Tyne, England, B.Eng. (Hons) Metallurgy, 1989. I am a registered member in good standing of the Association of Professional Engineers of Ontario (Membership #100082475). I have practiced my profession in the mining industry continuously since graduation. |
|
|
| |
My relevant experience with respect to process plant engineering, precious metals metallurgy and metals marketing includes 34 years’ experience in the mining sector, working for operating mining companies, engineering companies and mining consultancies. |
|
|
| |
I have read the definition of "qualified person" set out in National Instrument 43-101 (NI 43-101) and certify that by reason of my education, affiliation with a professional association (as defined in NI 43-101) and past relevant work experience, I fulfill the requirements to be a "qualified person" for the purposes of NI 43-101. |
|
|
| 4 |
I visited the Property from 14 - 16 January 2020 for 3 days. |
|
|
| 5 |
I am responsible for Sections 13, 17, 19 and parts of 1, 21, 25, 26, and 27 of the Technical Report. |
|
|
| 6 |
I am independent of the Issuer and related companies applying all of the tests in Section 1.5 of the NI 43-101. |
|
|
| 7 |
I have had prior involvement with the Property in that I was a qualified person for previous AMC Technical Report on the Silver Sand Property in 2020 (dated 25 May 2020, amended and restated on 3 June 2020 with an effective date of 16 January 2020) and for the AMC Technical Report in 2022 (effective date of 30 November 2022). |
|
|
| 8 |
I have read NI 43-101 and the sections of the Technical Report for which I am responsible have been prepared in compliance with NI 43-101. |
|
|
| 9 |
As of the effective date of the Technical Report, to the best of my knowledge, information, and belief, the sections of the Technical Report for which I am responsible contain all scientific and technical information that is required to be disclosed to make the Technical Report not misleading. |
Effective Date: 19 June 2024
Signing Date: 1 August 2024
Original signed by
Andrew Holloway, P.Eng.
Process Director, Halyard Inc.

CERTIFICATE OF AUTHOR
I, Mo Molavi, P.Eng., of Vancouver, British Columbia, do hereby certify that:
| 1 |
I am currently employed as a Director / Mining Services Manager / Principal Mining Engineer with AMC Mining Consultants (Canada) Ltd., with an office at Suite 202, 200 Granville Street, Vancouver, British Columbia V6C 1S4. |
|
|
| 2 |
This certificate applies to the Technical Report titled “Silver Sand Project Pre-Feasibility Study” with an effective date of 19 June 2024 (the “Technical Report”), prepared for New Pacific Metals Corp. (“the Issuer”) in respect of the Issuer's Silver Sand property (the "Property"). |
|
|
| 3 |
I am a graduate from Laurentian University in Sudbury, Canada (Bachelor of Engineering in 1979) and McGill University of Montreal, Canada (Master of Engineering in Rock Mechanics and Mining Methods in 1987). I am a registered member in good standing of the Association of Professional Engineers and Geoscientists of Saskatchewan (License #5646), the Engineers and Geoscientists British Columbia (Registration #37594), and a Member of the Canadian Institute of Mining, Metallurgy and Petroleum. I have worked as a Mining Engineer for a total of 45 years since my graduation from university and have relevant experience in project management, feasibility studies, and technical report preparations for mining projects. |
|
|
| |
I have read the definition of "qualified person" set out in National Instrument 43-101 (NI 43-101) and certify that by reason of my education, affiliation with a professional association (as defined in NI 43-101) and past relevant work experience, I fulfill the requirements to be a "qualified person" for the purposes of NI 43-101. |
|
|
| 4 |
I have not visited the Property. |
|
|
| 5 |
I am responsible for parts of Sections 1, 18, 25, and 26 of the Technical Report. |
|
|
| 6 |
I am independent of the Issuer and related companies applying all of the tests in Section 1.5 of the NI 43-101. |
|
|
| 7 |
I have had prior involvement with the Property in that I was a qualified person for the AMC Technical Report in 2022 (effective date of 30 November 2022). |
|
|
| 8 |
I have read NI 43-101 and the sections of the Technical Report for which I am responsible have been prepared in compliance with NI 43-101. |
|
|
| 9 |
As of the effective date of the Technical Report, to the best of my knowledge, information, and belief, the sections of the Technical Report for which I am responsible contain all scientific and technical information that is required to be disclosed to make the Technical Report not misleading. |
Effective Date: 19 June 2024
Signing Date: 31 July 2024
Original signed by
Mo Molavi, P.Eng.
Director / Mining Services Manager / Principal Mining Engineer
AMC Mining Consultants (Canada) Ltd.
CERTIFICATE OF AUTHOR
I, Dinara Nussipakynova, P.Geo., of North Vancouver, British Columbia, do hereby certify that:
| 1 |
I am currently employed as a Principal Geologist with BBA Engineering Ltd., with an office at 1050 West Pender Street, Suite 800, Vancouver, British Columbia V6E 3S7. |
|
|
| 2 |
This certificate applies to the Technical Report titled “Silver Sand Project Pre-Feasibility Study” with an effective date of 19 June 2024 (the “Technical Report”), prepared for New Pacific Metals Corp. (“the Issuer”). |
|
|
| 3 |
I am a graduate of Kazakh National Polytechnic University (Bachelor of Science and Master of Science in Geology in 1987). I am a member in good standing of the Association of Engineers and Geoscientists of British Columbia (Registration #37412) and the Association of Professional Geoscientists of Ontario (Registration #1298). I have practiced my profession continuously since 1987 and have been involved in mineral exploration and mine geology for a total of 35 years since my graduation from university. My experience is principally in Mineral Resource estimation, database management, and geological interpretation. |
|
|
| |
I have read the definition of "qualified person" set out in National Instrument 43-101 (NI 43-101) and certify that by reason of my education, affiliation with a professional association (as defined in NI 43-101) and past relevant work experience, I fulfill the requirements to be a "qualified person" for the purposes of NI 43-101. |
|
|
| 4 |
I visited the Property from 28 - 29 May 2022 for 2 days. |
|
|
| 5 |
I am responsible for Sections 7 - 12, 14 and parts of 1, 25, 26, and 27 of the Technical Report. |
|
|
| 6 |
I am independent of the Issuer and related companies applying all of the tests in Section 1.5 of the NI 43-101. |
|
|
| 7 |
I have had prior involvement with the Property in that I was a qualified person for previous AMC Technical Report in 2020 (dated 25 May 2020, amended and restated on 3 June 2020 with an effective date of 16 January 2020), as well as the AMC Technical Report in 2022 (effective date of 30 November 2022). |
|
|
| 8 |
I have read NI 43-101 and the sections of the Technical Report for which I am responsible have been prepared in compliance with NI 43-101. |
|
|
| 9 |
As of the effective date of the Technical Report, to the best of my knowledge, information, and belief, the sections of the Technical Report for which I am responsible contain all scientific and technical information that is required to be disclosed to make the Technical Report not misleading. |
Effective Date: 19 June 2024
Signing Date: 1 August 2024
Original signed by
Dinara Nussipakynova, P.Geo.
Principal Geologist
BBA Engineering Ltd.

CERTIFICATE OF AUTHOR
I, Wayne Rogers, P.Eng., of Vancouver, British Columbia, do hereby certify that:
| 1 |
I am currently employed as a Principal Mining Engineer and Open Pit Manager with AMC Mining Consultants (Canada) Ltd., with an office at Suite 202, 200 Granville Street, Vancouver, British Columbia V6C 1S4. |
| |
|
| 2 |
This certificate applies to the Technical Report titled “Silver Sand Project Pre-Feasibility Study” with an effective date of 19 June 2024, (the “Technical Report”), prepared for New Pacific Metals Corp. (“the Issuer”) in respect of the Issuer's Silver Sand property (the "Property"). |
| |
|
| 3 |
I am a graduate of the University of Western Australia in Perth, Australia (Bachelor of Mining Engineering in 2005) and the University of Queensland in Brisbane, Australia (Master of Philosophy (MPhil) in Mining Engineering in 2014). I am a member in good standing of the Engineers and Geoscientists British Columbia (Registration #49953). I have worked as a Mining Engineer for a total of 19 years since my graduation from university and have relevant experience in project management, feasibility studies, and technical report preparations for mining projects. My expertise includes strategic and tactical mine planning, mine design, mine optimization, feasibility studies, and drill and blast. |
| |
|
| |
I have read the definition of "qualified person" set out in National Instrument 43-101 (NI 43-101) and certify that by reason of my education, affiliation with a professional association (as defined in NI 43-101) and past relevant work experience, I fulfill the requirements to be a "qualified person" for the purposes of NI 43-101. |
| |
|
| 4 |
I visited the Property from 4-5 May 2023 for 2 days. |
| |
|
| 5 |
I am responsible for Sections 15, 16, 22 and parts of 1, 21, 25, 26, and 27 of the Technical Report. |
| |
|
| 6 |
I am independent of the Issuer and related companies applying all of the tests in Section 1.5 of the NI 43-101. |
| |
|
| 7 |
I have had prior involvement with the Property in that I was a qualified person for the AMC Technical Report in 2022 (effective date of 30 November 2022). |
| |
|
| 8 |
I have read NI 43-101 and the sections of the Technical Report for which I am responsible have been prepared in compliance with NI 43-101. |
| |
|
| 9 |
As of the effective date of the Technical Report, to the best of my knowledge, information, and belief, the sections of the Technical Report for which I am responsible contain all scientific and technical information that is required to be disclosed to make the Technical Report not misleading. |
Effective Date: 19 June 2024
Signing Date: 31 July 2024
Original signed by
Wayne Rogers, P.Eng.
Open Pit Manager / Principal Mining Engineer
AMC Mining Consultants (Canada) Ltd.

CERTIFICATE OF AUTHOR
I, Eugene Tucker, P.Eng., of Vancouver, British Columbia, do hereby certify that:
| 1 |
I am currently employed as a Principal Mining Engineer and Regional Manager - Canada with AMC Mining Consultants (Canada) Ltd. with an office at Suite 202, 200 Granville Street, Vancouver, British Columbia, V6C 1S4. |
|
|
| 2 |
This certificate applies to the technical report titled “Silver Sand Project Pre-Feasibility Study”, with an effective date of 19 June 2024, (the “Technical Report”) prepared for New Pacific Metals Corp. (“the Issuer”) in respect of the Issuer's Silver Sand property (the "Property"). |
|
|
| 3 |
I am a graduate of the University of Alberta in Edmonton, Canada (Bachelor of Science degree in Engineering in 1996 and Master of Engineering in 1999). I am a registered member in good standing with Engineers and Geoscientists British Columbia (License #30131) and Association of Professional Engineers and Geoscientists of Alberta (License #60027). I have worked as a Mining Engineer for a total of 25 years and have relevant experience in open pit mining of gold, base metals and coal, design and planning, mine production and financial evaluation, reserve estimation, technical reviews, feasibility and pre-feasibility studies, project and construction management, contracts management and cost estimation. |
|
|
| |
I have read the definition of "qualified person" set out in National Instrument 43-101 (NI 43-101) and certify that by reason of my education, affiliation with a professional association (as defined in NI 43-101) and past relevant work experience, I fulfill the requirements to be a "qualified person" for the purposes of NI 43-101. |
|
|
| 4 |
I have not visited the Property. |
|
|
| 5 |
I am responsible for Sections 2-6, 20, 23, 24, 25, 26 and part of 1 of the Technical Report. |
|
|
| 6 |
I am independent of the Issuer and any related companies as described in Section 1.5 of the NI 43-101; |
|
|
| 7 |
I have not had prior involvement with the property that is the subject of the Technical Report; |
|
|
| 8 |
I have read NI 43-101, and the Technical Report has been prepared in compliance with NI 43- 101 and Form 43-101F1. |
|
|
| 9 |
As of the effective date of the Technical Report and the date of this certificate, to the best of my knowledge, information and belief, this Technical Report contains all scientific and technical information that is required to be disclosed to make the Technical Report not misleading. |
Effective Date: 19 June 2024
Signing Date: 6 August 2024
Original signed by
Eugene Tucker, P.Eng.
Regional Manager – Canada / Principal Mining Engineer
AMC Mining Consultants (Canada) Ltd.
New Pacific Metals (AMEX:NEWP)
過去 株価チャート
から 12 2024 まで 1 2025

New Pacific Metals (AMEX:NEWP)
過去 株価チャート
から 1 2024 まで 1 2025
