U.S. SECURITIES AND EXCHANGE COMMISSION
Washington, D.C. 20549
FORM 6-K
REPORT OF FOREIGN PRIVATE ISSUER
PURSUANT TO RULE 13a-16 OR 15d-16 UNDER THE
SECURITIES EXCHANGE
ACT OF 1934
For the Month of August 2024
Nexa Resources S.A.
(Exact Name as Specified in its Charter)
N/A
(Translation of Registrant’s Name)
37A, Avenue J.F. Kennedy
L-1855, Luxembourg
Grand Duchy of Luxembourg
(Address of principal executive offices)
Indicate by check mark
whether the registrant files or will file annual reports under cover Form 20-F or Form 40-F.
Indicate by check mark
if the registrant is submitting the Form 6-K in paper as permitted by Regulation S-T Rule 101(b)(1): ____
Indicate by check mark
if the registrant is submitting the Form 6-K in paper as permitted by Regulation S-T Rule 101(b)(7): ____
Indicate by check mark
whether by furnishing the information contained in this Form, the registrant is also thereby furnishing the information to the Commission
pursuant to Rule 12g3-2(b) under the Securities Exchange Act of 1934.
If “Yes” is marked,
indicate below the file number assigned to the registrant in connection with Rule 12g3-2(b): Not applicable.
SIGNATURES
Pursuant to the requirements
of the Securities Exchange Act of 1934, the registrant has duly caused this report to be signed on its behalf by the undersigned, thereunto
duly authorized.
Date: August 1, 2024
| Nexa Resources S.A. |
| By:/s/ José Carlos del Valle |
| Name: José Carlos del Valle |
|
Title: Senior Vice President
of Finance and Group Chief Financial Officer |
EXHIBIT INDEX

Nexa Reports Second
Quarter 2024 Results including
Net Loss of US$69 million and Adjusted EBITDA of US$200 million
Luxembourg, August
1, 2024 – Nexa Resources S.A. (“Nexa Resources”, “Nexa”, or the “Company”)
announces today its results for the three and six-month periods ended on June 30, 2024.
CEO Message – Ignacio
Rosado
We are pleased to report a favorable second
quarter of 2024, highlighting our continued operational efficiency, increased production, improved margins at our Aripuanã mine,
and disciplined capital allocation supported by higher zinc prices. Our ability to adapt to market dynamics has led to enhanced execution
across our operations.
The quarter began with positive momentum
from the end of 1Q24, which was sustained throughout 2Q24, resulting in solid operational performance and financial results. We achieved
a reduction in our net leverage ratio compared to both 2Q23 and 1Q24, higher Adjusted EBITDA across segments and at consolidated levels,
stable production and sales volumes, and strategic portfolio optimization, all of which have reinforced our healthy and steady business
fundamentals.
Aripuanã performed as expected, demonstrating
increased utilization rates, stable concentrate quality, and metallurgical recoveries. This resulted in higher metal production and improved
margins compared to 1Q24, contributing to solid Adjusted EBITDA for the second consecutive quarter. In June, Aripuanã achieved
a milestone by generating positive operational cash flow. As we approach the final stage of its ramp up phase in light of its recent solid
operational and financial performances, we confirm the transitions of Aripuanã to an ongoing operation. Moving forward, our efforts
will focus on further increasing production and reducing costs, continually improving the asset's margin and cash generation capacity.
On the zinc price side, the overall outlook
has brightened since mid-April, bolstered by solid fundamentals, mainly driven by a persistently tight concentrate market. Despite
potential volatility, prices across the base metals complex could receive a tailwind in the coming quarters in a scenario of potential
lower interest rates, and ongoing supply constraints.
At Nexa, the safety of our people and operations
remains our topmost priority. We are committed to ensuring safe operations in our facilities and continue to invest in strengthening the
organization-wide safety framework. In early May, we implemented a structured 30-day, 90-day and 180-day safety plan, focusing on key
actions to reduce risk exposure, boost safety practices, and reinforce leadership oversight. Our goal is to continuously improve our solid
safety system.
Looking ahead, we will continue to focus
on enhancing productivity, efficiency, and performance across operations and corporate areas, while also prioritizing the safety of our
people. We will maintain our disciplined focus on our priorities, including the improvement of Aripuanã’s performance, the
development of the Cerro Pasco Integration Project, delivering on guidance, extending the life of our mines, and consistently improving
in our cash generation.
We remain confident in the long-term fundamentals
of our industry, and we are prepared to capitalize on new opportunities in our operations, always striving to create shared value for
all our stakeholders and the communities in which we operate.

Summary of Financial
Performance
| US$ million (except per share amounts) |
2Q24 |
1Q24 |
2Q23 |
1H24 |
1H23 |
| Net revenues |
736 |
580 |
627 |
1,316 |
1,294 |
| Gross profit |
179 |
87 |
62 |
266 |
161 |
| Net loss |
(69) |
(11) |
(103) |
(81) |
(118) |
| EBITDA (1) |
89 |
121 |
(44) |
210 |
71 |
| Basic and diluted loss per share |
(0.58) |
(0.18) |
(0.77) |
(0.76) |
(0.92) |
| Adjusted net income (loss) (1) |
42 |
(10) |
12 |
33 |
15 |
| Adjusted EBITDA (1) |
200 |
123 |
72 |
323 |
205 |
| Adjusted basic and diluted earnings (loss) per share (1) |
0.15 |
(0.15) |
0.04 |
(0.01) |
0.03 |
| Cash provided by operating activities before working capital (1) (2) |
133 |
81 |
56 |
214 |
172 |
| Capex |
64 |
74 |
60 |
138 |
116 |
| Free cash flow (1) |
149 |
(144) |
34 |
5 |
(97) |
| Total cash (3) |
474 |
324 |
421 |
474 |
421 |
| Net debt (1) |
1,387 |
1,427 |
1,262 |
1,387 |
1,262 |
| Net Debt/LTM Adj. EBITDA |
2.72x |
3.75x |
2.83x |
2.72x |
2.83x |
(1) Refer
to “Use of Non-IFRS Financial Measures” for further information. Adjusted EBITDA, adjusted net income (loss) and adjusted
EPS, exclude the items presented in the “Net income (loss) reconciliation to Adjusted EBITDA” section of this earnings release.
For details on segment definition and accounting policy, please refer to explanatory note 2 – “Information by business segment”
in the “Condensed consolidated interim financial statements at and for the three and six-month periods ended on June 30, 2024.”
(2) Working
capital variations in 2Q24 had a negative impact of US$17 million, totaling US$141 million in 1H24. Working capital variations in 2Q23
had a positive impact of US$79 million, totaling negative impact of US$36 million in 1H23.
(3) Cash,
cash equivalents and financial investments.
Executive Summary
Operational Performance
| § | Zinc
production of 83kt in the quarter rose by 2% from 2Q23, mainly due to higher average zinc
grades, particularly at Cerro Lindo. Compared to 1Q24, zinc production decreased by 5%, mainly
due to lower volumes from the Peruvian mines and the absence of contributions from Morro
Agudo in May and June 2024, following the cessation of mining operations on April 30, 2024
due to the divestment of this mine announced on April 5, 2024. |
| § | Run-of-mine mining cost in 2Q24 was US$49/t, 10%
higher compared to 2Q23, due to lower treated ore volumes by the cease of mining operations in Morro Agudo on April 30, 2024, partially
offset by lower operating costs related to maintenance expenses, energy costs and materials (e.g.
explosives and related items). Compared to 1Q24, run-of-mine mining cost increased by 7%, primarily due
to higher third-party services and increased personnel costs associated with workers participation. Despite this increase, run-of-mine
mining cost in 2Q24 performed within the guidance range for the year. |
| § | Mining cash cost net of by-products1
in 2Q24 decreased to US$0.03/lb compared to US$0.37/lb in 2Q23. This decrease was
primarily due to higher by-products contribution, driven by higher copper and lead prices, and lower TCs, which were partially offset
by higher operating costs due to increased variable costs. Compared to 1Q24, cash cost decreased by US$0.24/lb, also impacted by lower
TCs and higher by-products contribution, which were partially offset by higher operating costs, particularly in Cerro Lindo and El Porvenir.
Mining cash cost net of by-products in 2Q24 and 1H24 performed below the lower range of the guidance for the year. |
| § | The smelting segment achieved a total production (zinc metal and
oxide) of 152kt in 2Q24, up 3% year-over-year and 10% quarter-over-quarter, mainly driven by higher volumes at the Cajamarquilla and Juiz de
Fora smelters, attributed to improved performance in the roasters, which enhanced production stability in the period. |
1
Our cash cost net of by-products credits is measured with respect to zinc sold.
| | |
 | 2 |
| § | In 2Q24, zinc metal and oxide sales were 148kt, down 1% from 2Q23. Compared
to 1Q24, metal sales increased by 7%, following higher production volumes in Cajamarquilla and Juiz de Fora. |
| § | Smelting conversion cost was US$0.30/lb in 2Q24 compared with US$0.32/lb
in 2Q23, mainly due to improved operational efficiency. Compared to 1Q24, conversion cost was relatively flat. Smelting conversion cost
performed within the guidance range for the year. |
| § | Smelting cash cost1 was US$1.19/lb in
2Q24 compared to US$1.12/lb in 2Q23. This increase was mainly driven by higher costs of raw materials
attributed to higher zinc prices and lower TCs. Compared to 1Q24, cash cost increased by 21%, primarily
due to higher zinc prices and lower TCs. Smelting cash cost performed within the guidance range for the year. |
Financial Performance
| § | Net revenues in 2Q24 were US$736 million compared with US$627 million
in 2Q23. This increase was primarily driven by higher LME metal prices and increased mining sales volumes, which was partially offset
by lower net premium and slightly lower smelting sales volume. Compared to 1Q24, net revenues increased by 27%, mainly due to higher LME
metal prices and higher smelting sales volume, which were partially offset by lower net premium. In 1H24, net revenues amounted to US$1,316
million, up by 2% compared to the same period a year ago. |
| § | In 2Q24, net loss amounted to US$69 million,
totaling US$81 million in 1H24, resulting in basic and diluted loss per share attributable to Nexa's
shareholders of US$0.58 and US$0.76, respectively. |
| § | Adjusted
net income in 2Q24 was US$42 million, with adjusted net income attributable to Nexa’s shareholders
of US$20 million, resulting in adjusted basic and diluted earnings per share of US$0.15. In 1H24, Adjusted
net income was US$33 million, with adjusted net loss attributable to Nexa’s shareholders of US$1 million, resulting in adjusted
basic and diluted loss per share of US$0.01. Refer to our “Net income (loss)” section for further details. |
| § | Adjusted EBITDA2
in 2Q24 was US$200 million compared to US$72 million in 2Q23 and US$123 million in
1Q24. The year-over-year increase was primarily driven by higher mining sales volume, higher by-products contribution, lower variable
costs and higher zinc prices. The quarter-over-quarter increase was attributed to higher by-products contribution, higher zinc prices
and increased smelting sales volume. In 1H24, Adjusted EBITDA
amounted to US$323 million, up by 58% compared to the same period a year ago. |
| § | Adjusted EBITDA margin increased to 27.2% in 2Q24, 6.1bps and 15.8bps
higher than 1Q24 and 2Q23, respectively. |
| § | Adjusted EBITDA for the mining segment in 2Q24 was US$132 million compared
to US$74 million in 1Q24. This increase was mainly driven by higher LME metal prices, higher by-products contribution and increased mining
sales volumes, which were partially offset by higher fixed and variable costs, and higher mineral exploration and project evaluation expenses.
Compared to 2Q23, Adjusted EBITDA increased by US$112 million. |
| § | Adjusted EBITDA for the smelting segment in 2Q24 was US$67 million compared
with US$49 million in 1Q24. This increase was mainly driven by higher by-products contribution, lower variable costs and higher sales
volume, which were partially offset by higher zinc prices and lower TCs, negatively impacting the purchase of zinc concentrate. Compared
to 2Q23, Adjusted EBITDA increased by 33%. |
2
Adjusted EBITDA excludes the items presented in the “Net income (loss) reconciliation to Adjusted EBITDA” section of this
earnings release – US$112 million in 2Q24, totaling US$113 million in 1H24.
| | |
| | 3 |
Financial Position,
Investments and Financing
| § | Total cash3
at June 30, 2024, was US$474 million compared to US$324 million at March 31, 2024.
Our available liquidity in 2Q24 was US$794 million, including our undrawn sustainability-linked revolving credit facility of US$320 million. |
| § | In 2Q24, our free cash flow was positive US$149 million,
primarily impacted by a debenture issuance and partially offset by negative working capital variations amounting to US$17 million. This
was mainly due to an increase in inventories, tax credits and trade accounts receivables,
which were partially offset by an increase in other liabilities, primarily related to compensation costs for Morro Agudo’s employees.
Despite its negative position in 2Q24, working capital intensity reduced significantly compared to 1Q24. We remain focused on implementing
initiatives to reverse this position in the following quarters. Our investments in sustaining CAPEX (including HS&E investments) totaled
US$64 million, with US$10 million allocated to Aripuanã. Refer to our “Net cash flows from operating activities excluding
working capital variations and free cash flow - Reconciliation” section for further details. |
| § | Net debt to Adjusted EBITDA ratio for the last twelve months (“LTM”)
decreased to 2.72x at the end of 2Q24 compared with 3.75x at the end of 1Q24 and 2.83x at the end of 2Q23. This improvement was primarily
due to higher LTM Adjusted EBITDA and lower net debt, reflecting our strategy and efforts to reduce leverage. Total debt increased mainly
due to a debenture issuance in 2Q24. |
Environmental,
Social and Governance (“ESG”) and Corporate Highlights
| § | In May 2024, as part of Nexa’s circular economy
initiatives, we completed our first commercial sale transaction involving 26.4 tonnes of waste material (manganese
dioxide - MnO2) from our Três Marias smelter. This project aims to sell significant amounts of waste
from our smelters by developing partnerships and evaluating viable technologies and trade routes for these materials. |
| § | In May 2024, Nexa, in collaboration with the Brazilian Mining Association
(“IBRAM”), Brazilian Mining Hub, and other mining companies operating in Brazil, began discussions on structuring a decarbonization
roadmap for the mining sector in Brazil. |
| § | In May 2024, Nexa signed a three-year collaboration agreement with the
National University Daniel Alcides Carrión (“UNDAC”) in Pasco, Peru. The partnership aims to foster the exchange of
scientific and technological knowledge in the mining sector. The partnership also aims to enhance professional training, develop innovative
technological solutions, and establish a startup incubator for social impact. This initiative highlights Nexa's commitment to supporting
the Pasco region's communities through education and entrepreneurship. |
| § | In 2Q24, Nexa provided school supplies to nearly 13,000 students from
communities near its operations and greenfield projects in Peru. This initiative, part of our annual School Supplies Campaign, aligns
with the UN's Sustainable Development Goals (“SDGs”) by aiming to alleviate the economic burden on families by supporting
children's education. |
| § | In May 2024, Nexa renewed its partnership with Amazon Web Services for
the second edition of the "Talento na Nuvem" (Talent in the Cloud) program in Brazil, offering 40,000 scholarships. The program
focuses on generative AI and cloud solution architecture, aiming to equip professionals from various fields with valuable technological
skills. This initiative is part of the partnership announced in 2Q23, intended to train 100,000 individuals in cloud computing fundamentals
in Brazil and Peru by 2025. The program has already trained more than 20,000 people in 2023, underscoring Nexa's commitment to fostering
professional development and inclusion. |
| § | In 2Q24, Nexa, in collaboration with the Brazilian Agricultural Research
Corporation (“Embrapa”) and the Brazilian Micro and Small Business Support Service (“Sebrae”) partnered to expand
the Rural Practices Project in Vazante, Brazil. This initiative aims to enhance the income of 40 selected farmers by introducing new agricultural
techniques and market strategies. This project demonstrates Nexa's dedication
to improving local agricultural practices and supporting community development. |
3
Cash and cash equivalents and financial investments.
| | |
| | 4 |
| § | In May 2024, Nexa Peru was recognized for the third consecutive year
as one of the 16 leading companies in sustainable practices by the S&P/BVL Peru General ESG Index for 2024-2025 period. This recognition
reflects Nexa's ongoing commitment to integrating ESG strategies into its operations and advancing responsible mining practices. |
| § | In June 2024, Nexa in collaboration with Brazil’s National Industrial
Training Service (“SENAI”), helped 13 young individuals graduate from a mining technical course in Aripuanã, Brazil,
with 11 of them joining Nexa's workforce. Nexa continues to invest in local talent development, having trained over 600 residents in various
technical fields across all of our operations since 2019. |
| § | In June 2024, Nexa launched the 9th edition of its solid
and recognized Mining Lab Challenge program, inviting innovative solutions from the global ecosystem to address five defined challenges
across three main themes: Decarbonization, Circular Economy, and Productivity and Security. |
| § | On April 5, 2024, we announced the signing of a definitive agreement
to divest the Morro Agudo Complex, which encompasses the Morro Agudo and Ambrósia mines. Furthermore, on July 1, 2024, we announced
the closing of this transaction, and pursuant to the terms of the definitive agreement, Nexa has sold, transferred and assigned all rights,
titles, and interests in the Morro Agudo Complex to Casa Verde. The transaction was completed following the fulfillment of all closing
conditions. |
| § | On April 3, 2024, Nexa Brazil, a subsidiary of Nexa Resources, announced
its first ESG-linked debenture issuance, totaling R$650 million (approximately US$130 million) with a 6-year term. Settled on April 2,
2024, the unsecured debentures feature a bullet repayment and bears interest at 100% of CDI rate plus 1.50 per annum. This issuance, part
of Nexa’s liquidity improvement and liability management strategy, aligns with the ESG framework of our US$320 million sustainability-linked
revolving credit facility. |
| § | On April 3, 2024, Nexa announced the pricing of its offering of US$600
million 6.750% senior unsecured notes due in 2034, which closed on April 9, 2024. The net proceeds of this offering were used to fund
cash tender offers for Nexa’s existing notes due 2027 and 2028. |
| § | On April 5, 2024, Nexa announced the results of the tender offer for
its 2027 Notes, pursuant to which Nexa purchased approximately 69.2% of the outstanding principal amount, reducing it to US$215.5 million
following the settlement on April 10, 2024. Subsequently, on April 12, 2024, Nexa announced the results of the tender offer for its 2028
Notes, purchasing approximately 19.9% of the outstanding principal amount at a proration factor of 32.3%, reducing it to US$400,501,000.00
following the settlement on April 15, 2024. |
| § | In June 2024, at the Annual General Meeting, Mr. Paulo Macedo was elected
as a director of the Company for a term starting on June 13, 2024, and ending at the 2026 Annual General Meeting of the shareholders.
Mr. Macedo brings extensive experience in private equity, M&A, investment banking, and capital markets. He is the co-founder and partner
of 4x4 Capital, a New York-based private equity firm, and serves as board observer of 1440 Foods and as board member of Hejoassu, the
ownership board of Votorantim. |
| § | In June 2024, at the Annual General Meeting, Mr. Diego Hernandez and
Mr. Eduardo Borges de Andrade Filho, members of our Board of Directors who served as chairs of the Sustainability and Capital Projects
Committee and Compensation, Nominating and Governance Committee, respectively, ended their respective mandates, effective June 13, 2024. |
Growth Strategy
and Asset Portfolio
| § | We remain focused on free cash flow generation and continue to evaluate
our capital allocation framework, which prioritizes sustaining capital, brownfield mineral exploration and ESG and Health, Safety and
Environment (“HS&E”) initiatives. |
| § | The strategic review of our assets continues with additional
initiatives to optimize the portfolio. In 2Q24, Nexa initiated a structured process to sell its non-operational Peruvian subsidiary,
Minera Pampa de Cobre S.A.C (owner
of the Chapi mine asset), and the greenfield project Pukaqaqa. These potential sales are aligned with Nexa’s portfolio optimization
initiatives, aiming to ensure efficient capital allocation to the highest return assets. |
| | |
| | 5 |
| § | In 2Q24, we had important advancements in the main work fronts of the
Cerro Pasco integration project, such as engineering for the underground mine connection and the El Porvenir shaft upgrade. Additionally,
we progressed in the engineering studies for the tailings pumping system and the engineering assessment of the El Porvenir plant, which
presents opportunities to enhance processing capacity. Support activities, including technical reviews and environmental studies and permits,
are also advancing as expected. We are moving forward with the project, closely monitoring market conditions, and expect to submit it
for approval in the upcoming months. |
| § | Nexa submitted a request to modify the Environmental Impact Assessment
(“MEIA”) for the Magistral Copper Project in Peru to the National Environmental Certification Agency (“SENACE”).
During the review process, the Peruvian Water Authority (“ANA”) and Protected Natural Areas Service (“SERNANP”)
raised unfavorable observations regarding Nexa’s MEIA request. Consequently, on May 24, 2024, SENACE formally rejected the MEIA.
Nexa is currently addressing this situation with the competent authorities and expects to receive a response in the coming months. The
denial of the request modification to the environmental permit is relevant and could impact the assessment of the project’s economic
feasibility and technical development, as well as the recoverability of its assets. The project remains in Nexa's portfolio of Exploration
and Evaluation (“E&E”) assets, and the Company has decided to reassess the engineering studies and continue evaluating
options for the project. This reassessment may affect the project’s current maturity stage and was considered an impairment indicator.
For more information on impairment, refer to the “Others” section.
|
| | |
| | 6 |
Outlook
Production and
Sales Guidance
Guidance is based on several assumptions
and estimates and is subject to the continuous evaluation of several factors, including, but not limited to, metal prices, operational
performance, maintenance, input costs and exchange rates.
Nexa will continue to monitor risks associated
with global supply chain disruptions, which could be exacerbated, among other factors, by the ongoing Russia-Ukraine war, the Middle-East
conflict, unusual weather conditions, the global recession, and its potential impact on the demand for our products, inflationary cost
pressure, metal price volatility, local community or union’s protests, and changes to the political situations or regulatory frameworks
in the countries in which we operate that could affect our production levels and our costs. Refer to “Risks and Uncertainties”
and “Cautionary Statement on Forward-Looking Statements” for further information.
| § | As of date of this Earnings Release, Nexa reiterates its 2024 consolidated
production guidance for all metals, including zinc and lead. The guidance for zinc metal sales, consolidated cash cost for mining and
smelting, capital expenditures, exploration, project evaluation, and other expenses is outlined below. |
| o | Cerro Lindo: as
per the mining plan for the year, zinc production in 3Q24 is expected to be lower compared to 2Q24, primarily
explained by lower average head grades. Copper production is also expected to decrease due to lower average grades, resulting in reduced
recoveries. |
| o | El Porvenir: based on mine sequencing, zinc production in 3Q24
is expected to increase compared to 2Q24, driven by higher mined ore volumes and higher average grades. Additionally, lead and silver
production is expected to increase, following the same trend, as we expect higher average head grades for those metals. |
| o | Atacocha: we anticipate a slight decrease in zinc production
in 3Q24 compared to 2Q24. However, lead and silver production are expected to increase, driven by mining activities in areas with higher
grades. |
| o | Vazante: ore throughput in 3Q24 is expected to remain at same
level as 2Q24, while zinc head grade is anticipated to increase, resulting in slightly higher zinc production for the period. |
| o | Morro Agudo: as previously disclosed, on July 1, 2024, we announced
the closing of the sale transaction, and pursuant to the terms of the definitive agreement (signed on April 5, 2024), Nexa has sold, transferred
and assigned all rights, titles, and interests in the Morro Agudo Complex to Casa Verde. Under these conditions, mining activities attributed
to Nexa were ceased on April 30, 2024. |
| o | Aripuanã: operational performance boosted in 2Q24 compared
to 1Q24, driven by higher utilization capacity, improved plant feed and throughput rates, stable concentrate quality within commercial
specifications, as well as higher metallurgical recoveries. Solid Adjusted EBITDA for the second consecutive quarter and positive operating
cash flow in June. Moving forward, we anticipate further increases in plant feed and throughput rates, improvements in concentrate grades,
and higher metal recoveries. Additionally, we expect utilization capacity to continue improving, reaching around 90% in the upcoming months.
As of now, we expect Aripuanã’s zinc production to be closer to the lower end of the guidance for the year. |
| | |
| | 7 |
Mining segment – production
| Mining production |
|
1H24 |
|
Guidance 2024 |
| (Metal in concentrate) |
|
| |
|
|
|
|
|
|
|
| Zinc |
kt |
|
170 |
|
323 |
- |
381 |
| Cerro Lindo |
|
|
48 |
|
73 |
- |
86 |
| El Porvenir |
|
|
25 |
|
51 |
- |
57 |
| Atacocha |
|
|
4.8 |
|
8 |
- |
9 |
| Vazante |
|
|
69 |
|
130 |
- |
148 |
| Morro Agudo |
|
|
7 |
|
18 |
- |
23 |
| Aripuanã |
|
|
15 |
|
42 |
- |
57 |
| |
|
|
|
|
|
|
|
| Copper |
kt |
|
17 |
|
30 |
- |
35 |
| Cerro Lindo |
|
|
14 |
|
24 |
- |
28 |
| El Porvenir |
|
|
0.2 |
|
0.2 |
- |
0.3 |
| Aripuanã |
|
|
2.8 |
|
5.7 |
- |
7.3 |
| |
|
|
|
|
|
|
|
| Lead |
kt |
|
35 |
|
66 |
- |
82 |
| Cerro Lindo |
|
|
8 |
|
11 |
- |
13 |
| El Porvenir |
|
|
13 |
|
23 |
- |
28 |
| Atacocha |
|
|
5 |
|
11 |
- |
12 |
| Vazante |
|
|
0.4 |
|
1.0 |
- |
1.4 |
| Morro Agudo |
|
|
2.3 |
|
4.3 |
- |
6.6 |
| Aripuanã |
|
|
5.8 |
|
16 |
- |
20 |
| |
|
|
|
|
|
|
|
| Silver |
MMoz |
|
6 |
|
11 |
- |
13 |
| Cerro Lindo |
|
|
2.3 |
|
4.0 |
- |
4.2 |
| El Porvenir |
|
|
2.2 |
|
4.6 |
- |
5.4 |
| Atacocha |
|
|
0.6 |
|
1.1 |
- |
1.2 |
| Vazante |
|
|
0.2 |
|
0.3 |
- |
0.5 |
| Aripuanã |
|
|
0.5 |
|
1.0 |
- |
1.5 |
Smelting segment – sales
| § | Metal sales guidance also remains unchanged at 580-605kt. |
| o | Peru: we expect production at Cajamarquilla in 3Q24 to be higher
compared to 2Q24, mainly driven by better performance and production stability. |
| o | Brazil: in Três Marias, we expect production in 3Q24 to
slightly decrease compared to 2Q24, while production in Juiz de Fora is expected to increase due to the reprocessing of third-party High
Grade (“HG”) zinc to produce Special High Grade (“SHG”) zinc. |
| Smelting sales |
|
1H24 |
|
Guidance 2024 |
| |
|
|
|
|
|
|
|
| Zinc metal |
kt |
|
270 |
|
545 |
- |
565 |
| Cajamarquilla |
|
|
156 |
|
315 |
- |
325 |
| Três Marias |
|
|
73 |
|
155 |
- |
160 |
| Juiz de Fora |
|
|
41 |
|
75 |
- |
80 |
| |
|
|
|
|
|
|
|
| Zinc oxide |
kt |
|
16 |
|
35 |
- |
40 |
| Três Marias |
|
|
16 |
|
35 |
- |
40 |
| |
|
|
|
|
|
|
|
| Metal Sales |
kt |
|
287 |
|
580 |
- |
605 |
| | |
| | 8 |
Cash Costs
| § | Nexa also estimates that 2024 consolidated cash cost guidance for its
mining and smelting segments will be achieved. |
| o | Mining and smelting volumes are expected to remain at the same levels
or slightly increase in 3Q24 compared to 2Q24, remaining within the guidance ranges noted above. |
| o | We anticipate that continuous improvements in operational efficiency
and cost management will positively impact our overall performance. Several initiatives are already being implemented across our mines
and smelters. |
| o | We observed a significant increase in copper, lead, and silver prices
in 2Q24 compared to 1Q24. Although there may be volatility, we expect these prices to remain at similar levels in 3Q24. Nexa’s C1
cash cost is sensitive to by-product prices and volumes, which may impact our final cost results. |
| o | Foreign exchange rates assumptions are maintained (BRL/USD: 4.90 and
Soles/USD: 3.67). |
| o | Zinc TCs assumptions for the year of US$174/t remain unchanged. |
| Mining Operating costs |
|
Cost ROM
(US$/t) |
|
Cash Cost
(US$/lb) |
|
Cost ROM
(US$/t) |
|
Cash Cost
(US$/lb) |
| |
|
|
|
| |
1H24 |
|
1H24 |
|
Guidance 2024 |
|
Guidance 2024 |
| |
|
|
|
|
|
|
|
|
|
|
|
|
| Mining (1) |
|
46.8 |
|
0.15 |
|
44.0 |
- |
51.4 |
|
0.23 |
- |
0.42 |
| Cerro Lindo |
|
43.7 |
|
(0.41) |
|
41.0 |
- |
45.0 |
|
(0.22) |
- |
0.03 |
| El Porvenir |
|
63.8 |
|
0.10 |
|
58.4 |
- |
71.6 |
|
(0.02) |
- |
0.25 |
| Atacocha |
|
33.1 |
|
(0.53) |
|
34.3 |
- |
43.2 |
|
(0.27) |
- |
(0.02) |
| Vazante |
|
49.9 |
|
0.53 |
|
55.8 |
- |
63.6 |
|
0.52 |
- |
0.60 |
| Morro Agudo |
|
40.8 |
|
0.96 |
|
27.9 |
- |
40.0 |
|
0.80 |
- |
1.24 |
(1) C1 Weighted Cash cost net of
by-products credits is measured with respect to zinc sold per mine.
Note: Consolidated cash costs do not include
Aripuanã.
| Smelting Operating costs |
|
Conversion cost
(US$/lb) |
|
Cash Cost
(US$/lb) |
|
Conversion cost
(US$/lb) |
|
Cash Cost
(US$/lb) |
| |
|
|
|
| |
1H24 |
|
1H24 |
|
Guidance 2024 |
|
Guidance 2024 |
| |
|
|
|
|
|
|
|
|
|
|
|
|
| Smelting (2) |
|
0.30 |
|
1.09 |
|
0.29 |
- |
0.32 |
|
1.07 |
- |
1.18 |
| Cajamarquilla |
|
0.27 |
|
1.06 |
|
0.29 |
- |
0.32 |
|
1.02 |
- |
1.13 |
| Três Marias |
|
0.30 |
|
1.12 |
|
0.25 |
- |
0.27 |
|
1.12 |
- |
1.23 |
| Juiz de Fora |
|
0.43 |
|
1.17 |
|
0.38 |
- |
0.42 |
|
1.17 |
- |
1.28 |
(2) C1 Weighted Cash cost net
of by-products credits is measured with respect to zinc sold per smelter.
| § | In 1H24, Mining C1 cash cost of US$0.15/lb was below our 2024 guidance,
primarily driven by higher by-products contribution, particularly from Cerro Lindo, and lower TCs across all units. The run-of-mine mining
costs of US$46.8/t was in line with our 2024 guidance. For further information, please see the section “Business performance –
Mining segment.” |
| § | In 1H24, Smelting C1 cash cost of US$1.09/lb and conversion cost of
US$0.30/lb were in line with our 2024 guidance. For further information, please see the section “Business performance – Smelting
segment.” |
Capital Expenditures
(“CAPEX”) Guidance
| § | Nexa invested US$64 million in 2Q24, nearly
all of which was sustaining, which includes CAPEX to sustain operations as well as mine development. In
1H24, total CAPEX amounted to US$138 million. |
| § | The depreciation of the Brazilian real against the U.S. dollar resulted
in a positive impact of US$1.2 million in the quarter, totaling US$1.9 million in 1H24. |
| | |
| | 9 |
| § | We expect investment disbursement to accelerate in the upcoming quarters,
and 2024 CAPEX guidance remains unchanged at US$311 million. |
| CAPEX |
|
1H24 |
|
Guidance 2024 |
| (US$ million) |
|
|
| Non-Expansion |
|
142 |
|
307 |
| Sustaining (1) |
|
135 |
|
261 |
| HS&E |
|
3 |
|
24 |
| Others (2) |
|
4 |
|
21 |
| |
|
|
|
|
| Expansion projects (3) |
|
2 |
|
4 |
| Reconciliation to Financial Statements (4) |
|
(6) |
|
- |
| TOTAL |
|
138 |
|
311 |
(1) Investments
in tailing dams are included in sustaining expenses.
(2) Modernization,
IT and others.
(3) Includes
Vazante deepening, among several other projects to improve operational performance.
(4) The
amounts are mainly related to capitalization of interest net of advanced payments for imported materials and tax credits.
Exploration &
Project Evaluation and Other Expenses Guidance
| § | In 2Q24, we invested US$16 million in exploration and project evaluation,
totaling US$29 million in 1H24. |
| § | In 2Q24, we also allocated a total of US$5 million to technology and
community initiatives, totaling US$7 million in 1H24. These investments aim to enhance our current operations and to further contribute
to the social and economic development of our host communities. |
| § | Our total 2024 guidance for exploration and project evaluation, and
other operating expenses remains unchanged at US$72 million and US$21 million, respectively. We expect investment disbursements to accelerate
in the upcoming quarters. |
| § | As part of our long-term strategy, we remain focused on replacing and
increasing mineral reserves and resources. We expect to continue advancing our exploration activities, primarily by identifying new ore
bodies and upgrading resources classification through infill drilling campaigns. |
| Other Operating Expenses |
|
1H24 |
|
Guidance 2024 |
| (US$ million) |
|
|
| Exploration |
|
23 |
|
58 |
| Mineral Exploration |
|
17 |
|
42 |
| Mineral rights |
|
3 |
|
6 |
| Sustaining (mine development) |
|
3 |
|
10 |
| |
|
|
|
|
| Project Evaluation |
|
6 |
|
14 |
| |
|
|
|
|
| Exploration & Project Evaluation |
|
29 |
|
72 |
| |
|
|
|
|
| Other |
|
7 |
|
21 |
| Technology |
|
1 |
|
4 |
| Communities |
|
6 |
|
17 |
Note: Exploration and project evaluation expenses
consider several stages of development, from mineral potential definition, R&D, and subsequent scoping and pre-feasibility studies
(FEL1 and FEL2).
| | |
| | 10 |
Earnings Release
2Q24
This Earnings Release should be read
in conjunction with the “Condensed consolidated interim financial statements at and for the three and six-month periods ended on
June 30, 2024.” This document contains forward-looking statements.
Table of contents
UPCOMING EVENT
Earnings Conference
Call
Date: Friday, August 2, 2024 –
9:00am (EST)
Dial In
US: +1-833-816-1265
Canada: +1-647-484-8814
Brazil: +55 11 3181-8565
International: +1-412-317-5635
Conference ID: Nexa Resources
Live audio webcast with slide presentation
will be available on:
https://ir.nexaresources.com
| | |
| | 11 |
Consolidated performance
Selected financial
information
US$ million
(except where otherwise indicated) |
2Q24 |
1Q24 |
2Q23 |
1H24 |
1H23 |
| |
|
|
|
|
|
| Net Revenues |
736 |
580 |
627 |
1,316 |
1,294 |
| Mining |
377 |
294 |
268 |
671 |
536 |
| Smelting |
508 |
418 |
465 |
926 |
1,008 |
| Intersegment results | Adjustments |
(149) |
(133) |
(107) |
(281) |
(250) |
| |
|
|
|
|
|
| Cost of Sales |
(557) |
(493) |
(565) |
(1,050) |
(1,133) |
| Mining |
(257) |
(252) |
(256) |
(510) |
(499) |
| Current Operations |
(215) |
(210) |
(195) |
(424) |
(398) |
| Aripuanã |
(42) |
(43) |
(60) |
(85) |
(101) |
| Smelting |
(450) |
(373) |
(415) |
(823) |
(884) |
| Intersegment results | Adjustments |
150 |
132 |
106 |
282 |
250 |
| |
|
|
|
|
|
| Selling, general and administrative |
(30) |
(34) |
(33) |
(64) |
(61) |
| Mining |
(16) |
(17) |
(14) |
(33) |
(29) |
| Smelting |
(14) |
(15) |
(16) |
(30) |
(31) |
| Intersegment results | Adjustments |
0 |
(1) |
(3) |
(1) |
(1) |
| |
|
|
|
|
|
| Depreciation and amortization |
70 |
73 |
72 |
142 |
143 |
| Mining |
51 |
53 |
53 |
104 |
105 |
| Smelting |
18 |
19 |
19 |
37 |
38 |
| Intersegment results | Adjustments |
1 |
0 |
0 |
1 |
0 |
| |
|
|
|
|
|
| Adjusted EBITDA (1) |
200 |
123 |
72 |
323 |
205 |
| Mining |
132 |
74 |
20 |
206 |
61 |
| Smelting |
67 |
49 |
51 |
116 |
140 |
| Intersegment results | Adjustments |
1 |
(0) |
1 |
1 |
3 |
| Adj. EBITDA margin (%) |
27.2% |
21.1% |
11.4% |
24.5% |
15.8% |
| |
|
|
|
|
|
| Net loss |
(69) |
(11) |
(103) |
(81) |
(118) |
| Attributable to Nexa's shareholders |
(76) |
(24) |
(102) |
(100) |
(122) |
| Attributable to non-controlling interests |
7 |
12 |
(0) |
19 |
4 |
| |
|
|
|
|
|
| Basic and diluted loss per share |
(0.58) |
(0.18) |
(0.77) |
(0.76) |
(0.92) |
| |
|
|
|
|
|
| Adjusted net income (loss) (1) |
42 |
(10) |
12 |
33 |
15 |
| Attributable to Nexa's shareholders |
20 |
(20) |
6 |
(1) |
4 |
| Attributable to non-controlling interests |
23 |
11 |
7 |
33 |
10 |
| |
|
|
|
|
|
| Adjusted basic and diluted earnings (loss) per share (1) |
0.15 |
(0.15) |
0.04 |
(0.01) |
0.03 |
(1) Refer to “Use of Non-IFRS Financial
Measures” for further information. Adjusted EBITDA, adjusted net income (loss) and adjusted EPS, exclude the items presented in
the “Net income (loss) reconciliation to Adjusted EBITDA” section of this earnings release. For details on segment definition
and accounting policy, please refer to explanatory note 2 – “Information by business segment” in the “Condensed
consolidated interim financial statements at and for the three and six-month periods ended on June 30, 2024.”
| | |
| | 12 |
Net revenues
In 2Q24, net revenues were US$736 million,
17% higher year-over-year, primarily driven by higher LME metal prices and higher mining sales volumes, which were partially offset by
lower net premium and slightly lower smelting sales volume. The LME average prices for zinc, copper, and lead increased by 12%, 15% and
2%, respectively, compared to the same period in 2023 – for more information on metal prices, refer to the “Market Scenario”
section.
Compared to 1Q24, net revenues rose by
27%, mainly due to higher LME metal prices, higher smelting sales volume, and higher by-products contribution, partially offset by lower
net premium.
In 1H24, net revenues amounted to US$1,316
million, up 2% compared to the same period a year ago, as a result of the aforementioned reasons.
Cost of Sales
In 2Q24, cost of sales amounted to US$557
million, down 1% year-over-year, primarily due to the positive impact of lower consumption of third-party concentrate in the smelting
segment and slightly lower smelting sales volume, which was offset by higher mining sales volumes and the negative hedge impact. Compared
to 1Q24, cost of sales increased by 13% driven by higher smelting sales volume, the impact of higher zinc prices on the purchase of zinc
concentrates for our smelting segment, and the negative hedge impact.
In 1H24, cost of sales amounted to US$1,050
million, down 7% compared to the same period a year ago, mainly due to the aforementioned reasons.
Mineral exploration
and project evaluation
In 2Q24, mineral exploration and project
evaluation investments were US$16 million, compared to US$21 million in 2Q23. In 1H24, mineral exploration and project evaluation investment
amounted to US$29 million.
For additional information about our exploration
results in the second quarter 2024, please refer to our 2Q24 Exploration Report published on July 25, 2024.
SG&A
In 2Q24, SG&A expenses of US$30 million
were down by 7% compared to 2Q23, mainly driven by lower third-party services in support areas, which was partially offset by higher employee
benefit expenses. SG&A expenses also decreased by 10% compared to 1Q24.
In 1H24, SG&A expenses amounted to
US$64 million, up by 5% compared to the same period a year ago, primarily due to higher employee benefit expenses.
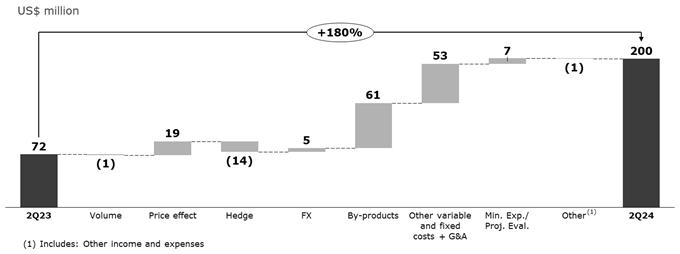
Adjusted EBITDA
In 2Q24, Adjusted EBITDA was US$200 million
compared with US$72 million in 2Q23. The main factors that contributed to this increase were (i) higher by-products contribution of US$61
million, mainly due to higher prices and volumes; (ii) the positive net impact of US$53 million due to lower costs, driven by Aripuanã’s
margin improvement, the positive raw material inventory consumption costs, and lower third-party concentrate consumption in our smelting
segment; (iii) the positive net price effect of US$19 million, primarily attributed to higher zinc prices; and (iv) lower mineral exploration
and project evaluation expenses, which were partially offset by (v) the negative hedge effect of US$14 million.
| | |
| | 13 |
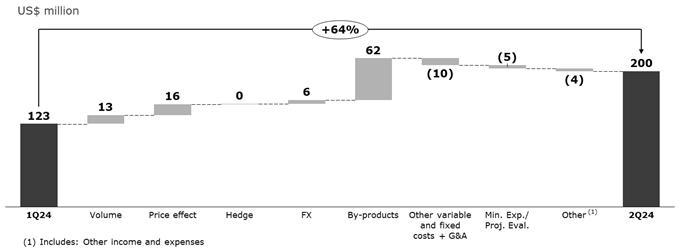
Compared to 1Q24, Adjusted EBITDA increased
by 64%. This increase was primarily driven by (i) higher by-products contribution of US$62 million, attributed to increased copper and
lead sales volumes and prices, higher payable values for silver and gold in our Peruvian operations and Aripuanã, increased sulphuric
acid sales volume, and higher copper cement and silver prices in Cajamarquilla; (ii) a positive net price effect of US$16 million due
to higher zinc prices; (iii) higher smelting sales volume of US$13 million, mainly in Cajamarquilla, partially offset by lower sales volume
in Três Marias. The positive factors were partially offset by (iv) the negative net impact of US$14 million in costs, mainly due
to higher operational costs in our mining segment.
During 1H24, Adjusted EBITDA was US$323
million compared to US$205 million in the same period a year ago, primarily driven by higher by-products contribution, higher LME metal
prices and lower mineral exploration and project evaluation expenses, partially offset by lower metal net premium.
| | |
| | 14 |
Net income (loss) reconciliation
to Adjusted EBITDA
| US$ million |
2Q24 |
1Q24 |
2Q23 |
1H24 |
1H23 |
| Net loss |
(69.3) |
(11.5) |
(102.8) |
(80.8) |
(118.2) |
| Depreciation and amortization |
69.9 |
72.6 |
71.7 |
142.4 |
143.4 |
| Share in the results of associates |
(5.3) |
(5.7) |
(5.7) |
(11.1) |
(11.1) |
| Net financial results |
116.6 |
66.0 |
26.5 |
182.6 |
65.7 |
| Income tax expense |
(23.0) |
(0.4) |
(33.5) |
(23.4) |
(8.4) |
| EBITDA |
88.8 |
120.9 |
(43.7) |
209.8 |
71.5 |
| Changes in fair value of the offtake agreement (2) |
17.2 |
1.8 |
(13.4) |
19.0 |
(0.0) |
| Impairment loss (reversal) of long-lived assets (3) |
60.2 |
(17.2) |
57.2 |
43.0 |
57.2 |
| Ramp-up expenses of greenfield projects (Aripuanã) (4) |
11.3 |
13.8 |
(3.8) |
25.2 |
1.8 |
| Impairment of other assets (5) |
0.0 |
0.3 |
0.0 |
0.3 |
0.0 |
| Loss on sale of property, plant and equipment (6) |
0.0 |
0.2 |
1.0 |
0.2 |
1.3 |
| Remeasurement in estimates of asset retirement obligations (7) |
14.8 |
2.6 |
1.4 |
17.4 |
(0.1) |
| Remeasurement adjustment of streaming agreement (8) |
0.0 |
0.0 |
0.0 |
0.0 |
0.0 |
| Energy forward contracts – Changes in Fair Value (9) |
(3.8) |
(4.4) |
9.7 |
(8.2) |
9.7 |
| Tax voluntary disclosure – Value added tax ("VAT") discussions (10) |
0.0 |
0.0 |
63.2 |
0.0 |
63.2 |
| Other restoration obligations (11) |
(0.2) |
1.4 |
0.0 |
1.1 |
0.0 |
| Divestment and restructuring (12) |
2.4 |
3.2 |
0.0 |
5.6 |
0.0 |
| Dividends received from associate (13) |
9.7 |
0.0 |
0.0 |
9.7 |
0.0 |
| Adjusted EBITDA (1) |
200.5 |
122.6 |
71.5 |
323.1 |
204.5 |
(1) Adjusted EBITDA excludes the items presented
above in the “Net income (loss) reconciliation to Adjusted EBITDA.” For details on segment definition and accounting policy,
please refer to explanatory note 2 – “Information by business segment” in the “Condensed consolidated interim
financial statements at and for the three and six-month periods ended on June 30, 2024.”
(2) Non-cash adjustment: Derivative financial
instrument related to the “Offtake agreement” described in the section “Others—Offtake agreement” of this
earnings release.
(3) Non-cash adjustment: Cash generating unit
and individual PP&E assets impairment loss (reversal). Please refer to “Others – Impairment” section in this Earnings
Release for further details.
(4) Expenses related to pre-operating and ramp-up
expenses incurred during the commissioning and ramp-up phases of greenfield projects which have not achieved their expected production
capacity. Once the Aripuanã operation is stabilized and operational at its expected production capacity, such effects will no longer
be excluded. Commencing on July 1, 2024, we expect these effects to be no longer included since, at the end of June 2024, it was approaching
the final stage of its ramp-up phase, transitioning to an ongoing operation.
(5) Non-cash adjustment: Value-added-taxes impairment
loss.
(6) Non-cash adjustment: Results from sale and
disposal of certain non-current assets.
(7) Non-cash adjustment: Asset retirement obligation
remeasurement of discount rate and updated studies that are not subject to capitalization.
(8) Non-cash adjustment: Remeasurement of contractual
obligation related to the forward sale contract of Cerro Lindo's Silver contained in the ore.
(9) Non-cash adjustment: The fair value adjustment
of the energy surplus resulting from electric energy purchase contracts of the Company’s subsidiary, Pollarix.
(10) Expenses related to the impact of accruals
related to VAT discussions.
(11) Non-cash adjustment: Expenses related to
the remeasurement of provision related to estimated costs of anticipated additional obligations in relation to certain inactive industrial
waste containment structures in Brazil that have been closed for more than 20 years and that do not contain mining tailings, water or
liquid waste.
(12) Expenses related to the effects of obligations
of restructuring and divestment related to assets held for sale.
(13) Amount received in cash related to dividends
from associate, since the results from these dividends were not consolidated on prior periods. Please refer to “Others – Dividends
received form associate” section in this Earnings Release for further details.
Net financial
results
The net financial result in 2Q24 was US$117
million in expenses compared to US$66 million in 1Q24, mainly driven by FX losses and higher financial expenses due to interest paid on
loans and financing, partially offset by higher financial income related to interest on financial investments and cash equivalents.
The foreign
exchange variation resulted in a negative impact of US$64 million in 2Q24 compared to a US$22 million negative impact in 1Q24, mainly
due to the 11% depreciation of the Brazilian real against the U.S. dollar4
in 2Q24.
Excluding the effect of the foreign exchange
variation, the net financial results in 2Q24 were an expense of US$53 million compared to an expense of US$44 million in the previous
quarter.
4
In 2Q24, the Brazilian real / U.S. dollar (end of period) exchange rate was R$5.559/US$1.00 compared to R$4.996/US$1.00 in 1Q24.
| | |
| | 15 |
| US$ thousand |
2Q24 |
1Q24 |
2Q23 |
| |
|
|
|
| Financial income |
6,775 |
5,013 |
6,700 |
| |
|
|
|
| Financial expenses |
(60,619) |
(48,958) |
(59,363) |
| |
|
|
|
| Other financial items, net |
(62,734) |
(22,042) |
26,149 |
| Foreign exchange gain (loss) |
(63,766) |
(21,902) |
26,812 |
| |
|
|
|
| Net financial result |
(116,578) |
(65,987) |
(26,514) |
| Net financial result excluding FX |
(52,812) |
(44,085) |
(53,326) |
Net income (loss)
In 2Q24,
Net loss was US$69 million compared to Net loss of US$103 million and US$11 million in 2Q23 and 1Q24, respectively. Compared to 1Q24,
the decrease was primarily driven by the recognition of an impairment loss5,
higher Other income and expenses6
related to changes in the fair value of the offtake agreements, adjustments to asset retirement, restoration,
and environmental obligations, as well as increased mineral exploration and project evaluation expenses.
Excluding miscellaneous adjustments detailed
below and above in the Net income (loss) reconciliation to Adjusted EBITDA section, Adjusted Net Income was US$42 million in the quarter,
totaling US$33 million in 1H24.
Adjusted Net Income attributable to Nexa’s
shareholders was US$20 million in 2Q24, resulting in adjusted earnings per share of US$0.15. In 1H24, Adjusted Net Loss attributable to
Nexa’s shareholders was US$1 million, resulting in adjusted loss per share of US$0.01.
US$ million
(except where otherwise indicated) |
2Q24 |
1Q24 |
2Q23 |
1H24 |
1H23 |
| Net Loss |
(69.3) |
(11.5) |
(102.8) |
(80.8) |
(118.2) |
| Attributable to Nexa's shareholders |
(76.3) |
(23.8) |
(102.5) |
(100.1) |
(122.2) |
| Attributable to non-controlling interests |
7.0 |
12.4 |
(0.3) |
19.4 |
4.0 |
| Basic and diluted loss per share |
(0.58) |
(0.18) |
(0.77) |
(0.76) |
(0.92) |
| |
|
|
|
|
|
| Miscellaneous adjustments (1) |
111.6 |
1.7 |
115.2 |
113.3 |
133.0 |
| Attributable to Nexa's shareholders |
95.9 |
3.5 |
108.2 |
99.4 |
126.6 |
| Attributable to non-controlling interests |
15.7 |
(1.8) |
7.0 |
13.9 |
6.4 |
| Basic and diluted miscellaneous adjustments per share |
0.72 |
0.03 |
0.82 |
0.75 |
0.96 |
| |
|
|
|
|
|
| Adjusted net income (loss) |
42.4 |
(9.8) |
12.5 |
32.6 |
14.8 |
| Attributable to Nexa's shareholders |
19.6 |
(20.3) |
5.7 |
(0.7) |
4.4 |
| Attributable to non-controlling interests |
22.8 |
10.5 |
6.7 |
33.3 |
10.5 |
| Weighted average number of outstanding shares - in thousand |
132,439 |
132,439 |
132,439 |
132,439 |
132,439 |
| Adjusted basic and diluted earnings (loss) per share |
0.15 |
(0.15) |
0.04 |
(0.01) |
0.03 |
(1) Miscellaneous adjustments include: (i) Changes in fair value of
the offtake agreement; (ii) Impairment loss (reversal) of long-lived assets; (iii) Ramp-up expenses of greenfield projects (Aripuanã);
(iv) Impairment of other assets; (v) Loss on sale of property, plant and equipment; (vi) Remeasurement in estimates of asset retirement
obligations; (vii) Remeasurement adjustment of streaming agreement; (viii) Changes in fair value of energy forward contracts; (ix) Tax
voluntary disclosure – VAT discussions; (x) Other restoration obligations; (xi) Divestment and restructuring; and (x) Dividends
received from associate.
5
For more information, please refer to explanatory note 18 – “Impairment of long-lived assets”
in the “Condensed consolidated interim financial statements at and for the three and six-month periods ended on June 30, 2024.”
6
For more information, please refer to explanatory notes 10 (e) – “Financial instruments in the
offtake agreement: fair value” and 16 (ii) – “Changes in asset retirement, restoration and environmental obligations”
in the “Condensed consolidated interim financial statements at and for the three and six-month periods ended on June 30, 2024.”
| | |
| | 16 |
Business Performance
Mining segment
| Consolidated |
|
2Q24 |
1Q24 |
2Q23 |
2Q24 vs. 2Q23 |
1H24 |
1H23 |
1H24 vs. 1H23 |
| Ore Mined |
kt |
3,216 |
3,263 |
3,214 |
0.0% |
6,479 |
6,153 |
5.3% |
| Treated Ore |
kt |
3,281 |
3,393 |
3,546 |
(7.5%) |
6,674 |
6,677 |
(0.0%) |
| |
|
|
|
|
|
|
|
|
| Grade |
|
|
|
|
|
|
|
|
| Zinc |
% |
2.99 |
3.02 |
2.72 |
27 bps |
3.00 |
2.81 |
19 bps |
| Copper |
% |
0.38 |
0.31 |
0.35 |
4 bps |
0.35 |
0.31 |
3 bps |
| Lead |
% |
0.65 |
0.69 |
0.64 |
1 bps |
0.67 |
0.67 |
0 bps |
| Silver |
oz/t |
1.12 |
1.14 |
1.02 |
10.5% |
1.13 |
1.02 |
10.7% |
| Gold |
oz/t |
0.006 |
0.006 |
0.005 |
12.8% |
0.006 |
0.005 |
14.5% |
| |
|
|
|
|
|
|
|
|
| Production | metal contained |
|
|
|
|
|
|
|
| Zinc |
kt |
82.5 |
87.2 |
80.7 |
2.3% |
169.8 |
155.5 |
9.2% |
| Copper |
kt |
9.7 |
7.5 |
8.7 |
12.6% |
17.2 |
14.7 |
16.9% |
| Lead |
kt |
16.7 |
18.2 |
16.0 |
4.6% |
35.0 |
31.2 |
12.1% |
| Silver |
MMoz |
2.8 |
3.0 |
2.6 |
7.9% |
5.8 |
5.0 |
16.5% |
| Gold |
koz |
8.6 |
8.7 |
6.8 |
25.5% |
17.2 |
13.3 |
29.4% |
| Zinc Equivalent (1) |
kt |
159.1 |
158.8 |
151.9 |
4.7% |
318.1 |
284.9 |
11.7% |
(1) Consolidated mining production in
kt of zinc equivalent is calculated by converting copper, lead, silver, and gold contents to a zinc equivalent grade, assuming 2023 LME
average prices: Zn: US$1.20/lb; Cu: US$3.85/lb; Pb: US$0.97/lb; Ag: US$23.4/oz; Au: US$1,943/oz.
In 2Q24, treated ore volume reached 3,281kt,
down 7% year-over-year, mainly attributed to lower plant performance across all mines, primarily due to delays in mine development and
limited availability of third-party employees, except for Atacocha. Additionally, the absence of contributions from Morro Agudo in May
and June 2024 further impacted overall performance.
Compared to 1Q24, treated ore volume decreased
by 3%, mainly due to the absence of contributions from Morro Agudo in May and June 2024, despite positive performance from all other mines.
The ore throughput, year-over-year, increased
at Vazante (+10%) and Atacocha (+2%), while Cerro Lindo decreased by (-4%), both El Porvenir and Aripuanã decreased by (-2%), in
addition to the absence of contributions from Morro Agudo in May and June.
Zinc equivalent production totaled 159kt
in 2Q24, up 5% compared to 2Q23. The average zinc, copper, lead and silver head grades increased by 27bps to 2.99%, 4bps to 0.38%, 1bps
to 0.65% and 11% to 1.12oz/t. Compared to 1Q24, zinc equivalent production was relatively flat.
Zinc production of 83kt in the quarter
rose by 2% from 2Q23, mainly due to higher average grades, particularly at Cerro Lindo. Compared to 1Q24, zinc production decreased by
5%, mainly due to the absence of contributions from Morro Agudo in May and June 2024, in addition to slightly lower volumes from Cerro
Lindo, El Porvenir and Vazante.
Copper production of 10kt increased by
13% from 2Q23 and 30% from 1Q24, driven by positive contribution from the Cerro Lindo.
Lead production increased by 5% year-over-year,
mainly explained by higher contributions from El Porvenir, Atacocha and Aripuanã, and decreased by 8% quarter-over-quarter, mainly
driven by the absence of contributions from Morro Agudo
in May and June 2024, in addition to lower production at Cerro Lindo and El Porvenir.
| | |
| | 17 |
In 1H24, treated ore volume was relatively
flat year-over-year, totaling 6,674kt. Zinc average grade was up 19bps to 3.00%. Therefore, zinc production totaled 170kt, 9% higher than
in 1H23. Copper production of 17kt was 17% higher and lead production increased by 12% to 35kt.
Cerro Lindo
Cerro Lindo
(100% basis) |
|
2Q24 |
1Q24 |
1H24 |
4Q23 |
3Q23 |
2Q23 |
1Q23 |
1H23 |
| |
|
|
|
|
|
|
|
|
|
| Ore Mined |
kt |
1,484 |
1,457 |
2,941 |
1,617 |
1,515 |
1,595 |
1,254 |
2,850 |
| Treated Ore |
kt |
1,472 |
1,471 |
2,943 |
1,644 |
1,540 |
1,530 |
1,277 |
2,807 |
| |
|
|
|
|
|
|
|
|
|
| Grade |
|
|
|
|
|
|
|
|
|
| |
|
|
|
|
|
|
|
|
|
| Zinc |
% |
1.86 |
1.87 |
1.87 |
1.70 |
1.63 |
1.31 |
1.38 |
1.34 |
| Copper |
% |
0.66 |
0.51 |
0.59 |
0.58 |
0.63 |
0.57 |
0.48 |
0.53 |
| Lead |
% |
0.31 |
0.44 |
0.38 |
0.32 |
0.32 |
0.33 |
0.25 |
0.29 |
| Silver |
oz/t |
0.92 |
1.14 |
1.03 |
0.83 |
0.81 |
0.83 |
0.72 |
0.78 |
| Gold |
oz/t |
0.002 |
0.003 |
0.003 |
0.003 |
0.002 |
0.002 |
0.002 |
0.002 |
| |
|
|
|
|
|
|
|
|
|
| Production | metal contained |
|
|
|
|
|
|
|
|
| |
|
|
|
|
|
|
|
|
|
| Zinc |
kt |
24.1 |
24.3 |
48.4 |
24.6 |
21.7 |
16.9 |
15.0 |
31.9 |
| Copper |
kt |
8.4 |
5.9 |
14.3 |
7.9 |
8.1 |
7.4 |
5.2 |
12.5 |
| Lead |
kt |
3.3 |
4.9 |
8.2 |
3.8 |
3.6 |
3.6 |
2.1 |
5.7 |
| Silver |
MMoz |
1.0 |
1.3 |
2.3 |
1.0 |
0.9 |
0.9 |
0.6 |
1.6 |
| Gold |
koz |
1.0 |
1.2 |
2.2 |
1.2 |
0.7 |
0.8 |
0.7 |
1.5 |
| |
|
|
|
|
|
|
|
|
|
| Zinc sales |
kt |
24.4 |
22.8 |
47.3 |
25.3 |
20.8 |
17.5 |
14.8 |
32.3 |
| |
|
|
|
|
|
|
|
|
|
| Costs |
|
|
|
|
|
|
|
|
| |
|
|
|
|
|
|
|
|
|
| Cost of sales |
US$ mm |
92.9 |
84.9 |
177.8 |
98.1 |
88.6 |
86.5 |
81.6 |
168.1 |
| Cost ROM (2) |
US$/t |
45.8 |
41.6 |
43.7 |
41.5 |
41.3 |
39.8 |
39.6 |
39.7 |
| Cash cost (1) |
US$/lb |
(0.58) |
(0.23) |
(0.41) |
0.06 |
(0.18) |
(0.13) |
(0.02) |
(0.08) |
| Sustaining cash cost (1) |
US$/lb |
(0.36) |
(0.06) |
(0.22) |
0.29 |
0.07 |
0.15 |
0.23 |
0.19 |
| |
|
|
|
|
|
|
|
|
|
| CAPEX |
US$ mm |
|
|
|
|
|
|
|
|
| |
|
|
|
|
|
|
|
|
|
| Sustaining |
|
11.5 |
8.5 |
20.0 |
11.2 |
9.1 |
9.4 |
8.0 |
17.3 |
| Other |
|
0.1 |
0.0 |
0.1 |
1.7 |
2.0 |
1.5 |
0.4 |
1.9 |
(1) Our cash cost and sustaining cash cost
are net of by-products credits, measured with respect to zinc sold per mine. For a cash cost reconciliation to COGS, please refer to Appendix
– All in Sustaining Cash Cost | Mining.
(2) Our cost per ROM is measured with respect
to treated ore volume. Refer to “Use of Non-IFRS Financial Measures” for further information.
In 2Q24, treated ore volume was 1,472kt,
down by 4% year-over-year and remained relatively flat quarter-over-quarter.
Zinc production of 24kt increased by 43%
compared to 2Q23, primarily due to accessing areas with higher zinc grades. Compared to 1Q24, zinc production slightly decreased, primarily
due to corrective maintenance on the underground conveyor
belt area in April, which lasted for 10 days. As a result, mine development and rehabilitation activities in areas with higher zinc grades
were reduced in the period.
| | |
| | 18 |
Zinc head grade averaged 1.86% in the
quarter, up 55bps and down 1bps compared to 2Q23 and 1Q24, respectively.
Copper production of 8.4kt increased by
13% year-over-year and 41% quarter-over-quarter, attributed to operations in areas with higher copper grades. The average copper grade
was 0.66% in 2Q24 compared to 0.57% in 2Q23 and 0.51% in 1Q24.
Lead production was 3.3kt, down from 3.6kt
in 2Q23 and 4.9kt in 1Q24, mainly driven by lower average grade in the period, decreasing by 2bps year-over-year and 13bps quarter-over-quarter.
In the first six months of 2024, zinc
production totaled 48kt, up 52% compared to 1H23, mainly driven by a significant reduction in daily production in 1Q23 and higher treated
ore volumes throughout the period. Copper also rose by 14% to 14kt, while lead production increased by 43% to 8kt, both attributed to
higher average grades.
Cost
Cost of sales was US$93 million in 2Q24
compared to US$87 million in the same period last year. This increase was primarily due to higher variable costs associated with increased
metal production and inflation. Compared to 1Q24, cost of sales rose by 9%, mainly driven by higher metal sales, increased personnel costs,
higher variable costs associated with mine development, increased third-party services, and higher maintenance expenses during the period.
Run-of-mine mining cost was US$46/t in
the quarter, up 15% year-over-year, mainly explained by higher variable costs, higher inflation and lower mined ore. Compared to 1Q24,
run-of-mine mining cost increased by 10%, explained by the aforementioned reasons.
Cash cost net of by-products in 2Q24 decreased
to US$(0.58)/lb compared with US$(0.13)/lb in 2Q23 and US$(0.23)/lb in 1Q24. The year-over-year improvement was primarily driven by higher
by-products contribution, supported by higher LME metal prices and lower TCs, which were partially offset by higher operational costs.
The quarter-over-quarter decrease was mainly attributed to a higher contribution from by-products, mainly driven by increased copper volumes
and prices.
CAPEX
In 2Q24, sustaining capital expenditures
amounted to US$11 million, primarily allocated to mine development, maintenance, and equipment acquisition, totaling US$20 million in
1H24.
| | |
| | 19 |
El Porvenir
El Porvenir
(100% basis) |
|
2Q24 |
1Q24 |
1H24 |
4Q23 |
3Q23 |
2Q23 |
1Q23 |
1H23 |
| |
|
|
|
|
|
|
|
|
|
| Ore Mined |
kt |
538 |
530 |
1,068 |
562 |
568 |
546 |
544 |
1,090 |
| Treated Ore |
kt |
538 |
530 |
1,068 |
562 |
568 |
546 |
544 |
1,090 |
| |
|
|
|
|
|
|
|
|
|
| Grade |
|
|
|
|
|
|
|
|
|
| |
|
|
|
|
|
|
|
|
|
| Zinc |
% |
2.56 |
2.76 |
2.66 |
2.83 |
2.89 |
2.89 |
2.82 |
2.85 |
| Copper |
% |
0.14 |
0.16 |
0.15 |
0.16 |
0.16 |
0.17 |
0.15 |
0.16 |
| Lead |
% |
1.41 |
1.48 |
1.44 |
1.39 |
1.36 |
1.35 |
1.38 |
1.36 |
| Silver |
oz/t |
2.42 |
2.47 |
2.45 |
2.20 |
2.22 |
2.42 |
2.55 |
2.48 |
| Gold |
oz/t |
0.009 |
0.011 |
0.010 |
0.010 |
0.010 |
0.011 |
0.011 |
0.011 |
| |
|
|
|
|
|
|
|
|
|
| Production | metal contained |
|
|
|
|
|
|
|
|
| |
|
|
|
|
|
|
|
|
|
| Zinc |
kt |
12.1 |
12.9 |
24.9 |
13.9 |
14.4 |
13.8 |
13.6 |
27.5 |
| Copper |
kt |
0.1 |
0.1 |
0.2 |
0.1 |
0.1 |
0.1 |
0.1 |
0.2 |
| Lead |
kt |
6.4 |
6.6 |
13.0 |
6.5 |
6.3 |
6.0 |
6.2 |
12.2 |
| Silver |
MMoz |
1.1 |
1.1 |
2.2 |
1.0 |
1.0 |
1.1 |
1.2 |
2.2 |
| Gold |
koz |
1.7 |
2.2 |
3.9 |
2.1 |
2.0 |
2.2 |
2.3 |
4.5 |
| |
|
|
|
|
|
|
|
|
|
| Zinc sales |
kt |
12.0 |
12.7 |
24.8 |
14.2 |
14.5 |
14.5 |
14.4 |
28.9 |
| |
|
|
|
|
|
|
|
|
|
| Costs |
|
|
|
|
|
|
|
|
| |
|
|
|
|
|
|
|
|
|
| Cost of sales |
US$ mm |
50.2 |
49.0 |
99.2 |
57.4 |
47.8 |
48.1 |
51.8 |
99.9 |
| Cost ROM (2) |
US$/t |
65.7 |
62.0 |
63.8 |
70.6 |
57.5 |
63.1 |
60.1 |
61.6 |
| Cash cost (1) |
US$/lb |
(0.05) |
0.24 |
0.10 |
0.37 |
0.20 |
0.35 |
0.22 |
0.28 |
| Sustaining cash cost (1) |
US$/lb |
0.40 |
1.14 |
0.78 |
1.30 |
0.73 |
0.65 |
0.64 |
0.65 |
| |
|
|
|
|
|
|
|
|
|
| CAPEX |
US$ mm |
|
|
|
|
|
|
|
|
| |
|
|
|
|
|
|
|
|
|
| Sustaining |
|
12.0 |
25.2 |
37.2 |
28.8 |
16.7 |
9.7 |
13.4 |
23.1 |
| Other |
|
0.0 |
0.0 |
0.0 |
0.0 |
- |
(0.0) |
(0.0) |
(0.0) |
(1) Our cash cost and sustaining cash cost
are net of by-products credits, measured with respect to zinc sold per mine. For a cash cost reconciliation to COGS, please refer to Appendix
– All in Sustaining Cash Cost | Mining.
(2) Our cost per ROM is measured with respect
to treated ore volume. Refer to “Use of Non-IFRS Financial Measures” for further information.
In 2Q24, treated ore volume was 538kt,
down 2% year-over-year and up 1% quarter-over-quarter.
In 2Q24, zinc production totaled 12kt,
down 13% from 2Q23 and 6% from 1Q24. This performance was primarily due to reduced treated ore volumes and lower zinc grades during the
period, caused by delays in developing primary areas with higher zinc grade due to limited availability of third-party employees. Additionally,
preventive maintenance on the mill circuit was carried out in April, which took 1 week.
Zinc average grade decreased to 2.56%
in the quarter compared to 2.89% in 2Q23 and 2.76% in 1Q24.
Lead production in 2Q24 increased by 7%
compared to 2Q23, in line with the mine sequencing plan. Compared to 1Q24, lead production decreased by 2% due to the abovementioned reasons,
while silver production was relatively flat compared to both periods.
In the first six months of 2024, zinc
production totaled 25kt, down 9% compared to 1H23. Lead and silver production increased by 7% to 13kt and down 1% to 2.2MMoz, respectively.
Cost
Cost of sales amounted to US$50 million
in 2Q24 compared to US$48 million in 2Q23, mainly due to higher depreciation and amortization, idleness costs, higher inflation and increased
in workers participation, which were partially offset by lower operating costs associated to lower maintenance expenses and lower third-party
services. Compared to 1Q24, cost of sales was up 2%, mainly due to higher personnel and variable costs, which were partially offset by
lower fixed costs and depreciation and amortization.
Run-of-mine mining cost was US$66/t in
the quarter, up 4% from 2Q23, mainly due to lower treated ore volumes. Compared with 1Q24, run-of-mine mining costs increased by 6%, mainly
driven by higher personnel costs, associated to an increase
in workers participation, higher maintenance expenses and higher variable costs associated with mine development.
| | |
| | 20 |
Cash cost net of by-products in 2Q24 decreased
to US$(0.05)/lb compared to US$0.35/lb in 2Q23 due to higher by-products contribution and lower TCs, which were partially offset by lower
zinc volumes. Compared to 1Q24, cash cost decreased by US$0.29/lb, also driven by higher by-products contribution, which was partially
offset by higher operational costs.
CAPEX
In 2Q24, sustaining capital expenditures
amounted to US$12 million, mainly related to the tailings dam project and mine development, totaling US$37 million in 1H24.
Atacocha
Atacocha
(100% basis) |
|
2Q24 |
1Q24 |
1H24 |
4Q23 |
3Q23 |
2Q23 |
1Q23 |
1H23 |
| |
|
|
|
|
|
|
|
|
|
| Ore Mined |
kt |
379 |
347 |
725 |
399 |
290 |
363 |
342 |
705 |
| Treated Ore |
kt |
379 |
347 |
725 |
393 |
290 |
373 |
342 |
715 |
| |
|
|
|
|
|
|
|
|
|
| Grade |
|
|
|
|
|
|
|
|
|
| |
|
|
|
|
|
|
|
|
|
| Zinc |
% |
0.86 |
0.89 |
0.87 |
0.87 |
0.58 |
0.67 |
0.94 |
0.80 |
| Lead |
% |
0.90 |
0.81 |
0.86 |
0.86 |
0.84 |
0.80 |
1.23 |
1.00 |
| Silver |
oz/t |
0.98 |
1.02 |
1.00 |
1.20 |
1.33 |
1.11 |
1.24 |
1.17 |
| Gold |
oz/t |
0.010 |
0.008 |
0.009 |
0.007 |
0.009 |
0.010 |
0.012 |
0.011 |
| |
|
|
|
|
|
|
|
|
|
| Production | metal contained |
|
|
|
|
|
|
|
|
| |
|
|
|
|
|
|
|
|
|
| Zinc |
kt |
2.4 |
2.4 |
4.8 |
2.6 |
1.2 |
1.9 |
2.5 |
4.4 |
| Lead |
kt |
2.9 |
2.3 |
5.3 |
2.9 |
2.1 |
2.6 |
3.6 |
6.1 |
| Silver |
MMoz |
0.3 |
0.3 |
0.6 |
0.4 |
0.3 |
0.3 |
0.4 |
0.7 |
| Gold |
koz |
2.1 |
1.4 |
3.5 |
1.4 |
1.4 |
2.2 |
2.6 |
4.7 |
| |
|
|
|
|
|
|
|
|
|
| Zinc sales |
kt |
2.4 |
2.1 |
4.5 |
2.7 |
1.1 |
2.4 |
2.3 |
4.6 |
| |
|
|
|
|
|
|
|
|
|
| Costs |
|
|
|
|
|
|
|
|
| |
|
|
|
|
|
|
|
|
|
| Cost of sales |
US$ mm |
16.5 |
16.3 |
32.8 |
20.4 |
13.1 |
19.8 |
16.5 |
36.3 |
| Cost ROM (2) |
US$/t |
32.5 |
33.7 |
33.1 |
32.4 |
30.7 |
31.7 |
36.6 |
34.0 |
| Cash cost (1) |
US$/lb |
(1.05) |
0.05 |
(0.53) |
0.17 |
(1.22) |
(1.05) |
(0.12) |
(0.60) |
| Sustaining cash cost (1) |
US$/lb |
(0.40) |
0.95 |
0.24 |
1.25 |
(0.19) |
(0.58) |
0.81 |
0.10 |
| |
|
|
|
|
|
|
|
|
|
| CAPEX |
US$ mm |
|
|
|
|
|
|
|
|
| |
|
|
|
|
|
|
|
|
|
| Sustaining |
|
3.4 |
4.2 |
7.6 |
6.4 |
2.6 |
2.5 |
4.7 |
7.1 |
| Other |
|
0.0 |
0.0 |
0.0 |
0.1 |
0.0 |
0.0 |
(0.0) |
0.0 |
(1) Our cash cost and sustaining cash cost
are net of by-products credits, measured with respect to zinc sold per mine. For a cash cost reconciliation to COGS, please refer to Appendix
– All in Sustaining Cash Cost | Mining.
(2) Our cost per ROM is measured with respect
to treated ore volume. Refer to “Use of Non-IFRS Financial Measures” for further information.
| | |
| | 21 |
Treated ore volume of 379kt in 2Q24 increased
by 2% compared to 2Q23 and 9% compared to 1Q24, mainly explained by plant stabilization, resulting in better performance and prioritization
of mining activities in the period, including operations in areas with higher zinc grades.
Zinc production of 2.4kt in 2Q24 increased
by 29% and 2% compared to 2Q23 and 1Q24, respectively. Zinc average grade in the quarter was 0.86%, up 19bps year-over-year and down 3bps
quarter-over-quarter.
Lead production increased to 2.9kt compared
to 2.6kt in 2Q23 and 2.3kt in 1Q24, while silver production was relatively flat compared to both periods.
In 1H24, treated ore volume totaled 725kt,
up 1% compared to the same period last year. Zinc production was up 9% to 4.8kt, while lead and silver decreased by 14% to 5kt and 21%
to 559koz, respectively.
Cost
Cost of sales was US$16 million in 2Q24,
down 17% year-over-year due to reduced expenses in maintenance and third-party services. Compared to 1Q24, cost of sales slightly increased
by 1%, mainly driven by higher variable costs.
Run-of-mine mining cost was US$32/t in
the quarter, up 2% from 2Q23, mainly due to higher operational costs related to higher stripping activities in the period. Compared to
1Q24, run-of-mine mining costs decreased by 4%, mainly explained by higher treated ore volumes.
Cash cost net of by-products was US$(1.05)/lb
in 2Q24, relatively flat compared to 2Q23. Compared to 1Q24, cash cost decreased by US$1.09/lb, mainly due to higher by-products contributions
and lower variable costs.
CAPEX
In 2Q24, sustaining capital expenditures
amounted to US$3.4 million, mainly related to the tailings dam deposit area, totaling US$7.6 million in 1H24.
| | |
| | 22 |
Vazante
Vazante
(100% basis) |
|
2Q24 |
1Q24 |
1H24 |
4Q23 |
3Q23 |
2Q23 |
1Q23 |
1H23 |
| |
|
|
|
|
|
|
|
|
|
| Ore Mined |
kt |
381 |
374 |
755 |
382 |
384 |
366 |
385 |
751 |
| Treated Ore |
kt |
444 |
427 |
871 |
407 |
427 |
405 |
394 |
799 |
| |
|
|
|
|
|
|
|
|
|
| Grade |
|
|
|
|
|
|
|
|
|
| |
|
|
|
|
|
|
|
|
|
| Zinc |
% |
9.18 |
9.55 |
9.36 |
9.86 |
10.22 |
10.25 |
10.44 |
10.35 |
| Lead |
% |
0.28 |
0.26 |
0.27 |
0.29 |
0.35 |
0.35 |
0.34 |
0.35 |
| Silver |
oz/t |
0.62 |
0.58 |
0.60 |
0.66 |
0.70 |
0.66 |
0.69 |
0.67 |
| |
|
|
|
|
|
|
|
|
|
| Production | metal contained |
|
|
|
|
|
|
|
|
| |
|
|
|
|
|
|
|
|
|
| Zinc |
kt |
34.5 |
34.9 |
69.4 |
34.9 |
38.4 |
36.6 |
35.8 |
72.4 |
| Lead |
kt |
0.3 |
0.1 |
0.4 |
0.3 |
0.4 |
0.4 |
0.4 |
0.8 |
| Silver |
MMoz |
0.1 |
0.1 |
0.2 |
0.1 |
0.2 |
0.2 |
0.1 |
0.3 |
| |
|
|
|
|
|
|
|
|
|
| Zinc sales |
kt |
34.5 |
34.9 |
69.4 |
34.9 |
38.4 |
36.6 |
35.8 |
72.4 |
| |
|
|
|
|
|
|
|
|
|
| Costs |
|
|
|
|
|
|
|
|
| |
|
|
|
|
|
|
|
|
|
| Cost of sales |
US$ mm |
31.9 |
33.4 |
65.3 |
29.4 |
33.5 |
32.0 |
29.8 |
61.7 |
| Cost ROM (2) |
US$/t |
51.2 |
48.7 |
49.9 |
58.1 |
57.7 |
57.0 |
55.4 |
56.2 |
| Cash cost (1) |
US$/lb |
0.51 |
0.55 |
0.53 |
0.57 |
0.63 |
0.61 |
0.63 |
0.62 |
| Sustaining cash cost (1) |
US$/lb |
0.61 |
0.63 |
0.62 |
0.65 |
0.72 |
0.72 |
0.71 |
0.72 |
| |
|
|
|
|
|
|
|
|
|
| CAPEX |
US$ mm |
|
|
|
|
|
|
|
|
| |
|
|
|
|
|
|
|
|
|
| Sustaining |
|
7.3 |
5.9 |
13.2 |
5.9 |
7.2 |
8.8 |
6.2 |
15.0 |
| Other |
|
0.9 |
0.7 |
1.6 |
0.8 |
1.7 |
0.8 |
0.2 |
1.0 |
(1) Our cash cost and sustaining cash cost
are net of by-products credits, measured with respect to zinc sold per mine. For a cash cost reconciliation to COGS, please refer to Appendix
– All in Sustaining Cash Cost | Mining.
(2) Our cost per ROM is measured with respect
to treated ore volume. Refer to “Use of Non-IFRS Financial Measures” for further information.
In 2Q24, treated ore volume was 444kt,
up 10% year-over-year and 4% quarter-over-quarter, mainly driven by higher tailings re-treatment (+62% from 2Q23 and +23% from 1Q24),
as well as higher ore mined in line with the mine sequencing plan.
Zinc production of 34kt in 2Q24 decreased
by 6% compared to 2Q23 and 1% compared to 1Q24, mainly explained by lower zinc head grades in the period, which resulted from a reduced
average grade in the mineral reserve.
Zinc average grade in the quarter was
9.18%, down 107bps and 37bps from 2Q23 and 1Q24, respectively.
Lead production was 0.3kt in 2Q24 compared
to 0.4kt in 2Q23 and 0.1kt in 1Q24, while silver production was relatively flat compared to both periods.
In 1H24, treated ore volume totaled 871kt,
up 9% from the same period of last year. Zinc production decreased by 4% to 69kt from 1H23.
Cost
Cost of sales was US$32 million in 2Q24,
relatively flat year-over-year. Compared to 1Q24, cost of sales was down 5%, primarily due to lower operating costs.
Run-of-mine mining cost was US$51/t in
2Q24 compared to US$57/t in 2Q23 mainly due to higher treated ore volumes. Compared to 1Q24, run-of-mine mining cost was up 5%, mainly
explained by higher operating costs.
Cash cost net of by-products decreased
to US$0.51/lb compared with US$0.61/lb in 2Q23, primarily driven by lower variable costs and lower TCs. Compared to 1Q24, cash cost decreased
by US$0.04/lb, impacted by higher by-products contribution and lower TCs, which were partially offset by higher personnel costs and lower
zinc sales volumes.
CAPEX
In 2Q24, sustaining capital expenditures
amounted to US$7.3 million, mainly related to mine development to support life of mine extension, and other expenses related to infrastructure
and equipment, totaling US$13 million in 1H24.
| | |
| | 23 |
Morro Agudo
Morro Agudo
(100% basis) |
|
2Q24 |
1Q24 |
1H24 |
4Q23 |
3Q23 |
2Q23 |
1Q23 |
1H23 |
| |
|
|
|
|
|
|
|
|
|
| Ore Mined |
kt |
76 |
256 |
332 |
288 |
291 |
283 |
265 |
548 |
| Treated Ore |
kt |
82 |
297 |
378 |
348 |
330 |
320 |
296 |
616 |
| |
|
|
|
|
|
|
|
|
|
| Grade |
|
|
|
|
|
|
|
|
|
| |
|
|
|
|
|
|
|
|
|
| Zinc |
% |
2.38 |
2.16 |
2.21 |
2.12 |
2.03 |
1.79 |
2.02 |
1.90 |
| Lead |
% |
0.90 |
0.72 |
0.76 |
0.75 |
0.98 |
0.81 |
0.91 |
0.85 |
| |
|
|
|
|
|
|
|
|
|
| Production | metal contained |
|
|
|
|
|
|
|
|
| |
|
|
|
|
|
|
|
|
|
| Zinc |
kt |
1.7 |
5.7 |
7.4 |
6.8 |
6.0 |
5.1 |
5.3 |
10.4 |
| Lead |
kt |
0.6 |
1.7 |
2.3 |
1.9 |
2.6 |
1.9 |
1.9 |
3.8 |
| |
|
|
|
|
|
|
|
|
|
| Zinc sales |
kt |
1.7 |
5.7 |
7.4 |
6.8 |
6.0 |
5.1 |
5.3 |
10.4 |
| |
|
|
|
|
|
|
|
|
|
| Costs |
|
|
|
|
|
|
|
|
| |
|
|
|
|
|
|
|
|
|
| Cost of sales |
US$ mm |
5.2 |
13.3 |
18.5 |
15.3 |
16.6 |
17.6 |
15.5 |
33.1 |
| Cost ROM (2) |
US$/t |
45.4 |
41.6 |
40.8 |
44.9 |
22.9 |
31.7 |
36.9 |
34.7 |
| Cash cost (1) |
US$/lb |
1.17 |
0.90 |
0.96 |
0.77 |
0.61 |
0.87 |
1.05 |
0.96 |
| Sustaining cash cost (1) |
US$/lb |
1.18 |
0.90 |
0.97 |
0.82 |
0.67 |
0.97 |
1.07 |
1.02 |
| |
|
|
|
|
|
|
|
|
|
| CAPEX |
US$ mm |
|
|
|
|
|
|
|
|
| |
|
|
|
|
|
|
|
|
|
| Sustaining |
|
0.1 |
0.0 |
0.1 |
0.8 |
0.8 |
1.0 |
0.2 |
1.3 |
| Other |
|
- |
0.0 |
0.0 |
0.0 |
0.0 |
0.1 |
0.0 |
0.1 |
(1) Our cash cost and sustaining cash cost
are net of by-products credits, measured with respect to zinc sold per mine. For a cash cost reconciliation to COGS, please refer to Appendix
– All in Sustaining Cash Cost | Mining.
(2) Our cost per ROM is measured with respect
to treated ore volume. Refer to “Use of Non-IFRS Financial Measures” for further information.
As previously disclosed, on April 5, 2024,
we announced the signing of a definitive agreement to divest the Morro Agudo Complex, which encompasses the Morro Agudo and Ambrósia
mines. Furthermore, on July 1, 2024, we announced the closing of this transaction, and pursuant to the terms of the definitive agreement,
Nexa has sold, transferred and assigned all rights, titles, and interests in the Morro Agudo Complex to Casa Verde. The transaction was
completed following the fulfillment of all closing conditions.
Under the mentioned conditions, mining
activities attributed to Nexa were only accounted for April 2024. Consequently, all figures in the table above reflect data for just one
month (from April 1, 2024 to April 30, 2024) within the second quarter of 2024.
In April 2024, treated ore volume was
82kt. Zinc production was 1.7kt, while zinc head grade averaged 2.38% in the period.
In the first four months of the year,
zinc production totaled 7.4kt.
The Morro Agudo Complex year-production
accounted approximately 5% and 6% of Nexa’s zinc and lead production, respectively.
Cost
Cost of sales was US$5 million in 2Q24
(April 2024), compared to US$18 million in 2Q23 and US$13 million in 1Q24. This decrease is primarily due to lower operating expenses
and lower sales volumes.
Run-of-mine mining cost was US$45/t in
the quarter (April 2024), up 43% from 2Q23 due to reduced limestone contribution, which impacted the costs. Compared to 1Q24, run-of-mine
mining costs was up 9%, attributed to lower treated ore
volumes, as contributions were limited to just one month in the period.
| | |
| | 24 |
In 2Q24 (April 2024), cash cost net of
by-products was US$1.17/lb compared to US$0.87/lb in 2Q23, mainly attributed to lower TCs and higher by-products contribution. Compared
to 1Q24, cash cost increased by US$0.27/lb due to reduced volumes and lower by-products contribution.
CAPEX
In April 2024, sustaining capital expenditures
amounted to US$0.1 million related to the infrastructure project.
Aripuanã
Aripuanã
(100% basis) |
|
2Q24 |
1Q24 |
1H24 |
4Q23 |
3Q23 |
2Q23 |
1Q23 |
1H23 |
| |
|
|
|
|
|
|
|
|
|
| Ore Mined |
kt |
359 |
299 |
658 |
276 |
237 |
61 |
148 |
209 |
| Treated Ore |
kt |
367 |
322 |
689 |
347 |
315 |
372 |
277 |
650 |
| |
|
|
|
|
|
|
|
|
|
| Grade |
|
|
|
|
|
|
|
|
|
| |
|
|
|
|
|
|
|
|
|
| Zinc |
% |
2.99 |
3.11 |
3.04 |
3.66 |
3.66 |
2.92 |
2.98 |
2.95 |
| Copper |
% |
0.54 |
0.70 |
0.65 |
0.75 |
0.65 |
0.74 |
0.57 |
0.67 |
| Lead |
% |
1.05 |
0.97 |
1.07 |
1.12 |
1.14 |
0.94 |
1.04 |
0.98 |
| Silver |
oz/t |
1.07 |
0.91 |
1.05 |
1.09 |
0.97 |
0.89 |
0.86 |
0.88 |
| Gold |
oz/t |
0.018 |
0.026 |
0.023 |
0.016 |
0.017 |
0.013 |
0.013 |
0.013 |
| |
|
|
|
|
|
|
|
|
|
| Production | metal contained |
|
|
|
|
|
|
|
|
| |
|
|
|
|
|
|
|
|
|
| Zinc |
kt |
7.7 |
7.2 |
14.9 |
7.4 |
5.8 |
6.5 |
2.5 |
9.0 |
| Copper |
kt |
1.3 |
1.5 |
2.8 |
1.4 |
1.0 |
1.2 |
0.9 |
2.0 |
| Lead |
kt |
3.2 |
2.6 |
5.8 |
2.3 |
1.5 |
1.5 |
1.1 |
2.5 |
| Silver |
MMoz |
0.3 |
0.2 |
0.5 |
0.2 |
0.1 |
0.1 |
0.1 |
0.2 |
| Gold |
koz |
3.7 |
4.0 |
7.7 |
3.0 |
2.4 |
1.7 |
0.9 |
2.6 |
| |
|
|
|
|
|
|
|
|
|
| CAPEX |
US$ mm |
|
|
|
|
|
|
|
|
| |
|
|
|
|
|
|
|
|
|
| Sustaining |
|
9.6 |
14.4 |
24.1 |
28.4 |
19.9 |
15.9 |
15.2 |
31.1 |
| Other (1) |
|
0.4 |
0.2 |
0.6 |
0.1 |
3.1 |
(19.3) |
(2.8) |
(22.1) |
(1) The negative amounts are mainly related
to reclassifications between Aripuanã and Corporate, and capitalization of interest net of advanced payments for imported materials
and tax credits.
ROM production in 2Q24 reached 359kt compared
to 61kt in 2Q23 and 299kt in 1Q24, primarily due to higher production from the Vertical Retreat Mining (“VRM”) method, and
improved efficiency resulting from the mine’s performance in the quarter.
In 2Q24, treated ore volume totaled 367kt
compared to 372kt in 2Q23. Compared to 1Q24, treated ore volume increased by 14%, driven primarily by the completion of necessary upgrades,
including the replacement of critical pumps to increase capacity in line with the revised design of the flotation pumping system. Additionally,
there was a 10% reduction in plant downtime from 1Q24 combined with a significant reduction in corrective maintenance hours, a 14% improvement
in plant treatment compared to 1Q24, and stable utilization rate averaging above 70% for the period and above 80% in June, having operated
for some days in the month close to 90%.
| | |
| | 25 |
Zinc production in 2Q24 was 7.7kt compared
to 6.5kt in 2Q23 (+19%) and 7.2 in 1Q24 (+7%), primarily attributed to higher treated ore volumes, stable recovery rates, and consistent
concentrate grades, which was partially offset by lower average zinc grade.
Copper production in 2Q24 was 1.3kt, up
12% year-over-year. Compared to 1Q24, copper production was down 12% due to lower grades, while copper recovery and concentrate grades
were stable.
At the end of 2Q24, zinc recovery reached
72%, stable compared to 1Q24, driven by mine grades. Copper recovery reached 72% and lead recovery reached 86% in the same period. Both
metals’ recoveries increased compared to 1Q24.
In 1H24 zinc production totaled 15kt,
up 66% compared to the same period last year. Lead and Copper totaled 5.8kt and 2.8kt, respectively, during the first six months of the
year.
Additionally, there was a significant
improvement in the operational cash flow during the quarter, with the operation achieving positive operating cash flow in June. This was
accompanied by an Adjusted EBITDA of US$13 million in the quarter.
We are continuing to work on improving
the performance of the operation, including the tailings filter circuit to mitigate further performance challenges.
Moving forward, we anticipate further
increases in plant throughput rates, improvements in concentrate grades, and maximized metal recoveries. We also expect the utilization
rate to continue improving, reaching 85% to 90% in the coming months.
CAPEX
In 2Q24 sustaining capital expenditures
amounted to US$9.6 million, mainly related to mine development, and other sustaining activities, totaling US$24 million in 1H24.
Financial performance
| US$ million |
|
2Q24 |
1Q24 |
2Q23 |
2Q24 vs. 2Q23 |
1H24 |
1H23 |
1H24 vs. 1H23 |
| Net Revenues |
377.3 |
293.9 |
268.2 |
40.7% |
671.3 |
536.0 |
25.2% |
| Cost of Sales (1) |
(257.3) |
(252.4) |
(255.6) |
0.6% |
(509.6) |
(499.1) |
2.1% |
| Gross Profit |
120.1 |
41.6 |
12.6 |
852.4% |
161.7 |
36.9 |
338.5% |
| Adjusted EBITDA |
132.0 |
73.7 |
20.0 |
561.9% |
205.7 |
61.5 |
234.7% |
| Adjusted EBITDA Mrg. |
35.0% |
25.1% |
7.4% |
27.6pp |
30.6% |
11.5% |
19.2pp |
Note: Financial performance pre intersegment
eliminations. (1) Includes the cost of sales of Aripuanã of US$42 million in 2Q24, US$60 million in 2Q23 and US$43 million
in 1Q24. Totaling US$85 million in 1H24 and US$101 million in 1H23.
Net revenues for the mining segment
totaled US$377 million in 2Q24, up 41% versus 2Q23. This performance was mainly driven by higher LME metal prices, increased sales across
all metals, and lower TCs. Compared to 1Q24, net revenues increased by 28%, mainly due to higher LME metal prices and higher copper sales,
partially offset by lower zinc and lead sales.
In 1H24, net revenues amounted to US$671
million, 25% higher compared to the same period a year ago, primarily explained by higher LME metal prices, increased sales across all
metals, and lower TCs.
Cost of sales in 2Q24 was US$257
million, including US$42 million attributed to Aripuanã. Excluding the impact of Aripuanã, cost of sales increased by 10%
to US$215 million from US$195 million in 2Q23 due to higher royalties paid and higher workers participation, which were partially offset
by lower costs in Morro Agudo. Compared to 1Q24, cost of sales was up 2%, excluding the impact of Aripuanã due to higher operating
costs related to third-party services and maintenance expenses, which were partially offset by lower depreciation and amortization.
| | |
| | 26 |
In 1H24, cost of sales amounted to US$510
million, 2% higher compared to the same period a year ago, primarily explained by the increase in sales across all metals.
Reconciliation of realized prices
Revenues are recorded at provisional prices
and, typically, an adjustment is then made after delivery, based on the pricing terms under the relevant contract. In addition, the difference
between the provisional and the final price received is recognized by adjusting the price in the period in which the sale is concluded.
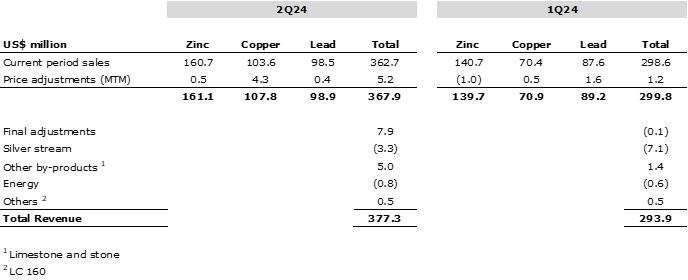
Adjusted
EBITDA for the mining segment in 2Q24 was US$132 million compared to US$20 million in 2Q23. This increase was primarily explained
by (i) the positive net price effect of US$57 million, mainly due to higher LME metal prices; (ii) lower TCs of US$22 million; (iii) higher
by-products contribution of US$19 million, mainly due to higher silver and gold prices, as well as increased lead and copper volumes;
(iv) the positive impact of US$13 million, mainly due to higher zinc and copper sales volumes in Cerro Lindo and higher zinc and lead
sales volumes in Aripuanã, partially offset by lower zinc sales volume in Vazante; (v) the positive impact of US$4 million due
to lower mineral exploration and project evaluation expenses; (vi) the positive impact of US$5 million in costs, mainly related to Aripuanã’s
margin improvement; and (vii) the positive impact of US$4 million from FX variations, which were partially offset by (viii) the negative
impact of US$11 million in other expenses, mainly due to the sale effect of Morro Agudo, partially offset by dividends received from Enercan7.
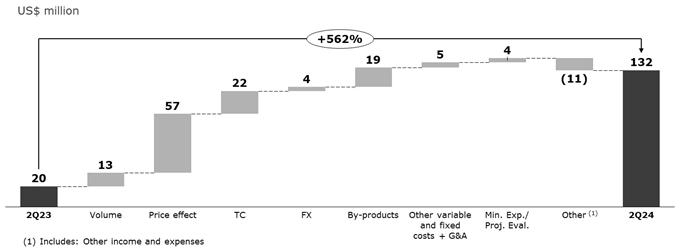
7
Amount received in cash related to dividends from associate, as the results from these dividends were not
consolidated in prior periods. Please refer to the “Others – Dividends received form associate” section in this Earnings
Release for further details.
| | |
| | 27 |
Compared
to 1Q24, Adjusted EBITDA increased by 79%. This performance was mainly driven by (i) the positive net price effect of US$49 million, mainly
due to higher LME metal prices; (ii) higher contribution from by-products of US$16 million, primarily due to higher payable values for
silver and gold in Aripuanã, as well as increased silver and gold prices; (iii) the positive impact of US$15 million in volumes,
mainly due to higher copper sales volumes in Cerro Lindo and higher zinc sales in Aripuanã, partially offset by lower volumes in
Cerro Pasco, which were partially offset by (iv) the negative impact of US$11 million in costs, mainly related to higher maintenance expenses
and third-party services in our operations; (v) the negative impact of US$5 million due to higher mineral exploration and project evaluation
expenses; and (vi) the negative impact of US$10 million in other expenses, mainly due to the sale effect of Morro Agudo, partially offset
by dividends received from Enercan8.
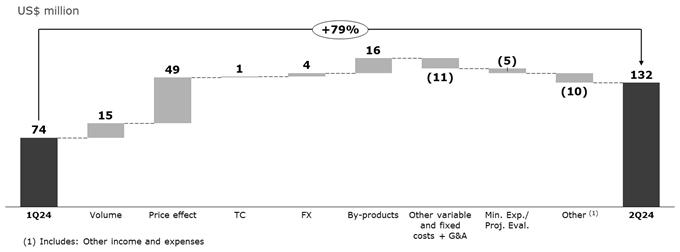
Cash cost and AISC 9,10
| Consolidated cash cost |
2Q24 |
1Q24 |
2Q23 |
2Q24 vs. 2Q23 |
1H24 |
1H23 |
1H24 vs. 1H23 |
| Run-of-mine mining cost |
US$/t |
48.5 |
45.2 |
43.9 |
10.4% |
46.8 |
44.5 |
5.1% |
| Cash cost net of by-products |
US$/t |
71 |
597 |
817 |
(91.3%) |
340 |
881 |
(61.5%) |
| AISC net of by-products |
US$/t |
873 |
1,580 |
1,423 |
(38.6%) |
1,234 |
1,627 |
(24.1%) |
| Cash cost net of by-products |
US$/lb |
0.03 |
0.27 |
0.37 |
(91.3%) |
0.15 |
0.40 |
(61.5%) |
| AISC net of by-products |
US$/lb |
0.40 |
0.72 |
0.65 |
(38.6%) |
0.56 |
0.74 |
(24.1%) |
Note: Cash cost and AISC per ton sold does
not include the impact of the cost of idleness capacity of US$1.5 million and US$1.2 million in El Porvenir in 2Q24 and 1Q24, respectively,
totaling US$2.7 million in 1H24, and US$0.9 million in Atacocha and US$5.2 million in Cerro Lindo in 1H23.
Cash cost net of by-products for
the mining segment in 2Q24 decreased to US$0.03/lb compared to US$0.37/lb in 2Q23. This decrease was primarily due to higher by-products
contribution, driven by higher copper and lead prices, and lower TCs, which were partially offset by higher operating costs due to increased
variable costs associated with royalties and freight expenses.
Compared to 1Q24, cash cost decreased
by US$0.24/lb, also impacted by lower TCs and higher by-products contribution, which were partially offset by higher operating costs,
particularly in Cerro Lindo and El Porvenir.
8
Amount received in cash related to dividends from associate, as the results from these dividends were not
consolidated in prior periods. Please refer to the “Others – Dividends received form associate” section in this Earnings
Release for further details.
9
Our cash cost and AISC are net of by-products credits, measured with respect to zinc sold.
10
AISC does not include Aripuanã.
| | |
| | 28 |
Run-of-mine mining cost was US$49/t in
the quarter, 10% higher compared to 2Q23, due to lower treated ore volumes impacted by Morro Agudo, partially offset by lower operating
costs related to maintenance expenses, energy costs and
materials (e.g. explosives and related items). Compared to 1Q24, run-of-mine mining cost
increased by 7%, primarily due to higher third-party services and increased personnel costs associated with workers participation.
AISC net of by-products in 2Q24 was US$0.40/lb,
down 39% and 45% compared to US$0.65/lb in 2Q23 and US$0.72/lb in 1Q24, respectively.
For a reconciliation of cash cost and
AISC net of by-products, please refer to the appendix section “All in Sustaining Cash Cost | Mining.”
| | |
| | 29 |
Smelting segment
| Consolidated |
|
2Q24 |
1Q24 |
2Q23 |
2Q24 vs. 2Q23 |
1H24 |
1H23 |
1H24 vs. 1H23 |
| Production |
|
|
|
|
|
|
|
|
| Zinc metal |
kt |
143.5 |
130.6 |
139.1 |
3.2% |
274.1 |
277.0 |
(1.1%) |
| Zinc oxide |
kt |
8.8 |
7.7 |
8.4 |
4.9% |
16.5 |
16.6 |
(0.4%) |
| Total |
kt |
152.4 |
138.3 |
147.5 |
3.3% |
290.6 |
293.6 |
(1.0%) |
| Sales |
|
|
|
|
|
|
|
|
| Zinc metal |
kt |
139.3 |
131.0 |
140.4 |
(0.8%) |
270.3 |
276.1 |
(2.1%) |
| Zinc oxide |
kt |
8.7 |
7.6 |
8.5 |
3.0% |
16.3 |
16.6 |
(1.6%) |
| Total |
kt |
148.0 |
138.6 |
148.9 |
(0.6%) |
286.6 |
292.7 |
(2.1%) |
In 2Q24, total production was 152kt, up
3% year-over-year and 10% quarter-over-quarter, mainly driven by higher volumes at the Cajamarquilla and Juiz de Fora smelters due to
improved performance in the roasters, which enhanced production stability in the period.
In 2Q24, zinc metal and oxide sales were
148kt, down by 1% from 2Q23. Compared to 1Q24, metal sales were up 7% following higher production volumes in Cajamarquilla and Juiz de
Fora.
In 1H24, total production amounted to
291kt, down 1% compared to the same period a year ago. Total sales decreased by 2% to 287kt.
Peru
Cajamarquilla
(100% basis) |
|
2Q24 |
1Q24 |
1H24 |
4Q23 |
3Q23 |
2Q23 |
1Q23 |
1H23 |
| |
|
|
|
|
|
|
|
|
|
| Zinc metal production |
kt |
85.4 |
73.9 |
159.2 |
78.2 |
80.8 |
82.7 |
81.3 |
164.1 |
| Global Recovery |
% |
93.8 |
95.8 |
94.8 |
95.3 |
92.6 |
93.8 |
94.0 |
93.9 |
| Zinc metal sales |
kt |
83.7 |
72.7 |
156.4 |
79.4 |
87.1 |
81.2 |
78.8 |
159.9 |
| |
|
|
|
|
|
|
|
|
|
| Zinc content in products |
kt |
83.5 |
72.6 |
156.1 |
79.3 |
87.0 |
81.1 |
78.6 |
159.7 |
| |
|
|
|
|
|
|
|
|
|
| Cost of sales (2) |
US$ mm |
262 |
201 |
464 |
221 |
261 |
218 |
261 |
479 |
| (-) Raw material |
|
(181) |
(142) |
(322) |
(128) |
(147) |
(156) |
(199) |
(356) |
| (+) By-product |
|
(6.7) |
(7.3) |
(13.9) |
(8.4) |
(9.1) |
(7.6) |
(6.7) |
(14.4) |
| (+/-) Consolidation effects |
(14.7) |
(11.7) |
(26.4) |
(34.3) |
(48.5) |
(8.5) |
(6.4) |
(14.9) |
| (+) Others |
|
(9.6) |
3.1 |
(6.5) |
(5.1) |
(5.5) |
7.7 |
2.2 |
9.9 |
| (=) Conversion cost |
US$ mm |
50.6 |
43.8 |
94.4 |
45.1 |
50.8 |
53.4 |
50.4 |
103.7 |
| Conversion cost |
US$/lb |
0.27 |
0.27 |
0.27 |
0.26 |
0.26 |
0.30 |
0.29 |
0.29 |
| |
|
|
|
|
|
|
|
|
|
| Cash cost (1) |
US$/lb |
1.18 |
0.92 |
1.06 |
0.94 |
0.97 |
1.06 |
1.17 |
1.12 |
| Sustaining cash cost (1) |
US$/lb |
1.24 |
0.99 |
1.13 |
1.05 |
1.01 |
1.09 |
1.20 |
1.14 |
| |
|
|
|
|
|
|
|
|
|
| CAPEX |
US$ mm |
|
|
|
|
|
|
|
|
| |
|
|
|
|
|
|
|
|
|
| Sustaining |
|
11.4 |
11.7 |
23.2 |
16.4 |
6.2 |
3.2 |
4.0 |
7.2 |
| Other |
|
0.8 |
0.4 |
1.1 |
2.4 |
1.1 |
1.3 |
0.5 |
1.8 |
(1) Our cash cost and sustaining cash cost
are net of by-products credits, measured with respect to zinc sold per smelter. For a cash cost reconciliation to COGS, please refer to
Appendix - Conversion and All in Sustaining Cash Cost | Smelting.
(2) Cost of sales does not include resale
operations from third parties.
| | |
| | 30 |
In 2Q24, Cajamarquilla smelter production
was 85kt, up 3% year-over-year and 16% quarter-over-quarter, mainly attributed to better roaster performance, following the successful
scheduled maintenance last quarter, which enhanced production stability, as well as improvement of calcine inventory levels.
Recovery rates averaged 93.8% in 2Q24
and 2Q23, and 95.8% in 1Q24.
Metal sales totaled 84kt in 2Q24 and were
up 3% year-over-year and 15% quarter-over-quarter, following higher production volumes and demand.
In 1H24, smelter production totaled 159kt,
down by 3% compared to 1H23. Smelter sales amounted to 156kt, down by 2% from the same period last year, following reduced production
in 1Q24.
Costs
Cost of sales was US$262 million in 2Q24
compared to US$218 million in 2Q23 and US$201 million in 1Q24, mainly explained by higher sales volumes, the inventory hedge effect associated
with higher zinc prices, and lower TCs in the period.
In 2Q24, conversion cost was US$0.27/lb,
down by US$0.02/lb compared to 2Q23, primarily due to lower energy costs and lower variable costs, which were partially offset by higher
maintenance expenses in the period. Compared to 1Q24, conversion cost was relatively flat.
Cash cost net of by-products in 2Q24 was
US$1.18/lb compared to US$1.06/lb in 2Q23, mainly due to higher zinc prices, and lower TCs, which were partially offset by higher by-products
contribution. Compared to 1Q24, cash cost increased by US$0.26/lb, mainly due to higher zinc prices, which impacted raw material costs.
CAPEX
In 2Q24, sustaining capital expenditures
amounted to US$11 million, mainly due to the acquisition and repairs of equipment and disbursements related to tailings dam improvements,
totaling US$23 million in 1H24.
Brazil
In 2Q24, total smelter production amounted
to 67kt and was up 3% and 4% compared to 2Q23 and 1Q24, respectively, primarily driven by Juiz de Fora smelter.
During the quarter, total sales volume
(zinc metal + zinc oxide) amounted to 64kt a decrease of 5% year-over-year and 2% quarter-over-quarter, mainly explained by lower production
volumes at Três Marias.
In 1H24, smelter production was 131kt,
up 1% compared to 1H23. Metal sales decreased by 2% to 114kt, while total sales volume (zinc metal + oxide) also decreased by 2% to 130kt.
| | |
| | 31 |
Três Marias
Três Marias
(100% basis) |
|
2Q24 |
1Q24 |
1H24 |
4Q23 |
3Q23 |
2Q23 |
1Q23 |
1H23 |
| |
|
|
|
|
|
|
|
|
|
| Zinc metal production |
kt |
36.3 |
37.5 |
73.8 |
35.8 |
39.0 |
35.7 |
37.9 |
73.6 |
| Zinc oxide production |
kt |
8.8 |
7.7 |
16.5 |
7.8 |
9.6 |
8.4 |
8.2 |
16.6 |
| Global Recovery |
% |
91.1 |
90.5 |
90.8 |
90.5 |
89.3 |
91.7 |
91.4 |
90.4 |
| Zinc metal sales |
kt |
34.4 |
38.4 |
72.8 |
33.4 |
38.0 |
38.9 |
36.8 |
75.7 |
| Zinc oxide sales |
kt |
8.7 |
7.6 |
16.3 |
7.9 |
9.4 |
8.5 |
8.1 |
16.6 |
| |
|
|
|
|
|
|
|
|
|
| Zinc content in products |
kt |
43.0 |
45.3 |
88.3 |
40.7 |
45.4 |
45.6 |
43.1 |
88.7 |
| |
|
|
|
|
|
|
|
|
|
| Cost of sales (2) |
US$ mm |
127 |
115 |
242 |
119 |
113 |
132 |
138 |
270 |
| (-) Raw material |
|
(66) |
(55) |
(121) |
(52) |
(43) |
(61) |
(85) |
(146) |
| (+) By-product |
|
(13.9) |
(15.0) |
(29.0) |
(17.3) |
(17.5) |
(19.7) |
(12.9) |
(32.6) |
| (+/-) Consolidation effects |
(0.3) |
1.8 |
1.5 |
(5.5) |
(5.6) |
2.1 |
0.9 |
3.1 |
| (+) Others |
|
(17.8) |
(18.4) |
(36.2) |
(22.2) |
(21.3) |
(22.3) |
(18.8) |
(41.1) |
| (=) Conversion cost |
US$ mm |
29.1 |
28.3 |
57.5 |
22.5 |
26.2 |
30.8 |
22.6 |
53.4 |
| Conversion cost |
US$/lb |
0.31 |
0.28 |
0.30 |
0.25 |
0.26 |
0.31 |
0.24 |
0.27 |
| |
|
|
|
|
|
|
|
|
|
| Cash cost (1) |
US$/lb |
1.22 |
1.03 |
1.12 |
1.13 |
0.97 |
1.18 |
1.36 |
1.26 |
| Sustaining cash cost (1) |
US$/lb |
1.27 |
1.06 |
1.16 |
1.20 |
1.01 |
1.25 |
1.40 |
1.32 |
| |
|
|
|
|
|
|
|
|
|
| CAPEX |
US$ mm |
|
|
|
|
|
|
|
|
| |
|
|
|
|
|
|
|
|
|
| Sustaining |
|
4.4 |
2.4 |
6.9 |
5.0 |
3.5 |
5.2 |
2.4 |
7.6 |
| Other |
|
0.8 |
0.8 |
1.6 |
1.4 |
1.2 |
2.1 |
1.4 |
3.6 |
(1) Our cash cost and sustaining cash cost
are net of by-products credits, measured with respect to zinc sold per smelter. For a cash cost reconciliation to COGS, please refer to
Appendix – Conversion and All in Sustaining Cash Cost | Smelting.
(2) Cost of sales does not include resale
operations from third parties.
In Três Marias, total production
(zinc metal + oxide) was 45kt in 2Q24, up 2% from 2Q23. Compared to 1Q24, total production was relatively flat due to scheduled maintenance
in the roaster in June, which took 9 days in the period, reducing production and consequently impacting the unit’s performance.
Recoveries rates averaged 91.1% during
the quarter, compared to 91.7% in 2Q23 and 90.5% in 1Q24.
In 2Q24, metallic zinc sales amounted
to 34kt, down 12% year-over-year and 10% quarter-over-quarter, primarily driven by lower production volumes in the period and efforts
to restore inventory levels.
Zinc oxide sales totaled 8.7kt and increased
by 3% year-over-year and 15% quarter-over-quarter, mainly due to higher demand in our domestic market, particularly from the tire manufacturing
industry.
In 1H24, Três Marias total production
amounted to 90kt, relatively flat compared to 1H23. Zinc metal sales decreased by 4% to 73kt and zinc oxide sales decreased by 2% to 16kt,
respectively.
Costs
Cost of sales of US$127 million in 2Q24
decreased by 3% from 2Q23, mainly explained by lower sales volumes, which was partially offset by higher raw materials costs. Compared
to 1Q24, cost of sales increased by 10%, mainly due to higher zinc prices.
In 2Q24, conversion cost was US$0.31/lb,
relatively flat compared to 2Q23. Compared to 1Q24, conversion cost increased by US$0.02/lb, mainly due to higher operating costs and
higher maintenance expenses.
Cash cost net of by-products in 2Q24
increased to US$1.22/lb compared to US$1.18/lb in 2Q23 and US$1.03 in 1Q24. The year-over-year increase was driven by higher cost of raw
material due to higher zinc prices, while the quarter-over-quarter performance was primarily driven by higher operating costs and higher
zinc prices.
| | |
| | 32 |
CAPEX
In 2Q24, sustaining capital expenditures
amounted to US$4.4 million, mainly due to scheduled maintenance in the period, acquisition and repairs of equipment, as well as disbursements
related to the tailings dam, totaling US$6.9 million in 1H24.
Juiz de Fora
Juiz de Fora
(100% basis) |
|
2Q24 |
1Q24 |
1H24 |
4Q23 |
3Q23 |
2Q23 |
1Q23 |
1H23 |
| |
|
|
|
|
|
|
|
|
|
| Zinc metal production |
kt |
21.9 |
19.2 |
41.1 |
22.4 |
20.3 |
20.7 |
18.7 |
39.4 |
| Global Recovery |
% |
94.4 |
91.6 |
93.1 |
94.6 |
93.8 |
94.0 |
92.3 |
93.2 |
| Zinc metal sales |
kt |
21.2 |
19.8 |
41.1 |
22.6 |
19.4 |
20.3 |
20.2 |
40.5 |
| |
|
|
|
|
|
|
|
|
|
| Zinc content in products |
kt |
21.1 |
19.7 |
40.8 |
22.5 |
19.2 |
20.2 |
20.0 |
40.2 |
| |
|
|
|
|
|
|
|
|
|
| Cost of sales |
US$ mm |
66 |
59 |
125 |
65 |
66 |
67 |
71 |
138 |
| (-) Raw material |
|
(37) |
(32) |
(68) |
(35) |
(36) |
(47) |
(43) |
(90) |
| (+) By-product |
|
(0.4) |
(1.1) |
(1.6) |
(0.5) |
(0.1) |
(0.4) |
(1.0) |
(1.4) |
| (+/-) Consolidation effects |
(0.3) |
(0.8) |
(1.0) |
3.0 |
2.0 |
5.1 |
1.2 |
6.3 |
| (+) Others |
|
(9.6) |
(5.7) |
(15.3) |
(9.2) |
(9.9) |
(4.2) |
(4.4) |
(8.6) |
| (=) Conversion cost |
US$ mm |
18.9 |
19.9 |
38.8 |
24.1 |
21.5 |
20.4 |
24.0 |
44.3 |
| Conversion cost |
US$/lb |
0.40 |
0.46 |
0.43 |
0.49 |
0.51 |
0.46 |
0.54 |
0.50 |
| |
|
|
|
|
|
|
|
|
|
| Cash cost (1) |
US$/lb |
1.21 |
1.13 |
1.17 |
1.01 |
1.27 |
1.24 |
1.35 |
1.29 |
| Sustaining cash cost (1) |
US$/lb |
1.26 |
1.15 |
1.20 |
1.09 |
1.39 |
1.30 |
1.40 |
1.35 |
| |
|
|
|
|
|
|
|
|
|
| CAPEX |
US$ mm |
|
|
|
|
|
|
|
|
| |
|
|
|
|
|
|
|
|
|
| Sustaining |
|
1.8 |
0.7 |
2.5 |
4.1 |
4.5 |
2.5 |
1.5 |
4.0 |
| Other |
|
0.1 |
0.1 |
0.2 |
0.3 |
0.3 |
0.4 |
0.8 |
1.2 |
(1) Our cash cost and sustaining cash cost
are net of by-products credits, measured with respect to zinc sold per smelter. For a cash cost reconciliation to COGS, please refer to
Appendix - Conversion and All in Sustaining Cash Cost | Smelting.
In 2Q24, Juiz de Fora production reached
22kt, up 6% year-over-year and 14% quarter-over-quarter, primarily due to improved plant performance and enhanced production stability,
bolstered by the reprocessing of third-party High Grade (“HG”) zinc to produce Special High Grade (“SHG”) zinc,
which positively contributed to the increase in production during the period.
Recoveries rates averaged 94.4% during
the quarter, compared to 94.0% in 2Q23 and 91.6% in 1Q24.
Zinc metal sales totaled 21kt in 2Q24,
up 4% from 2Q23 and 7% from 1Q24, respectively, following higher production volumes.
In the first six months of 2024, zinc
metal production increased by 4% to 41kt, and sales of 41kt were 1% higher compared to 1H23.
Costs
Cost of sales was US$66 million in 2Q24,
down 1% compared to US$67 million in 2Q23, primarily due to lower operating costs. Compared to 1Q24, cost of sales increased by 11%, mainly
driven by higher sales volumes and higher operating costs.
In 2Q24, conversion cost decreased to
US$0.40/lb from US$0.46/lb in 2Q23, mainly due to higher sales volumes associated with higher production of Special High Grade (“SHG”)
zinc in the period, in addition to lower energy costs and lower variable costs. Compared to 1Q24, conversion cost decreased by US$0.05/lb, also due to higher sales
volumes associated with higher production of Special High Grade (“SHG”) zinc, the impact of foreign exchange variations, as
well as lower energy costs and lower variable costs, which were partially offset by higher maintenance expenses in the period.
| | |
| | 33 |
Cash cost net of by-products in 2Q24 was
US$1.21/lb, down from US$1.24/lb in 2Q23, primarily due to lower raw material costs, which were previously purchased at lower prices,
resulting in reduced operating costs for the period. Compared to 1Q24, cash cost net of by-products increased by 8% due to higher operating
costs and lower TCs, which were partially offset by higher production volumes.
CAPEX
In 2Q24, sustaining capital expenditures
amounted to US$1.8 million, mainly driven by the acquisition, replacement, and repairs of equipment, totaling US$2.5 million in 1H24.
Financial performance
| US$ million |
|
2Q24 |
1Q24 |
2Q23 |
2Q24 vs. 2Q23 |
1H24 |
1H23 |
1H24 vs. 1H23 |
| Net Revenues |
507.6 |
418.4 |
465.1 |
9.1% |
926.0 |
1,008.4 |
(8.2%) |
| Cost of Sales |
(450.2) |
(372.9) |
(415.1) |
8.5% |
(823.1) |
(883.7) |
(6.9%) |
| Gross Profit |
57.4 |
45.5 |
50.0 |
14.9% |
102.9 |
124.8 |
(17.5%) |
| Adjusted EBITDA |
67.1 |
49.2 |
50.6 |
32.6% |
116.3 |
139.8 |
(16.8%) |
| Adjusted EBITDA Mrg. |
13.2% |
11.8% |
10.9% |
2.3pp |
12.6% |
13.9% |
(1.3pp) |
Note: Financial performance pre intersegment
eliminations.
Net revenues were US$508 million
in 2Q24, up by 9% compared to US$465 million in 2Q23, mainly due to higher zinc prices, partially offset by slightly lower sales volume
and lower net premium in the period. Compared to 1Q24, net revenues increased by 21%, mainly due to higher zinc prices and higher sales
volume.
In 1H24, net revenues amounted to US$926
million, 8% lower compared to the same period a year ago, primarily explained by lower sales volume and lower net premium.
Cost of sales increased by 8%
in 2Q24, totaling US$450 million compared to US$415 million in 2Q23, mainly explained by higher raw material costs associated with higher
zinc prices, lower TCs and the negative hedge impact. Compared to 1Q24, cost of sales rose by 21%, mainly driven by higher raw materials
costs and the negative hedge impact.
In 1H24, cost of sales amounted to US$823
million, 7% lower compared to the same period a year ago, primarily explained by lower sales volume.
Reconciliation of realized prices
Purchases of zinc in concentrate are recorded
at provisional prices and, typically, an adjustment is made after delivery, which is based on the pricing terms provided for under the
respective contract. In addition, the difference between the provisional and the final price received is recognized by adjusting the price
in the period in which the purchase is concluded.
| | |
| | 34 |
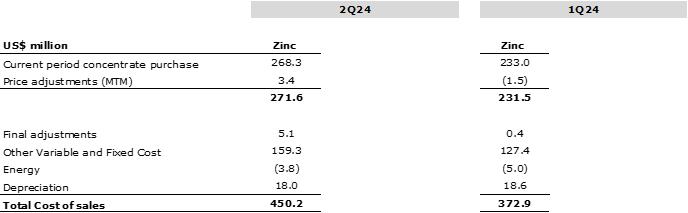
Sources
of Zinc Concentrate to Nexa Smelters (kt) – 2Q24 |
|
|
|
In 2Q24, Nexa acquired 51% of zinc from
its own mines, with the remainder supplied by third parties and secondary feed. The smelters use zinc concentrate as feedstock, which
is supplied from our mines, and we apply a benchmark TC for our operations. From third-party suppliers, the treatment charge is based
on the benchmark TC, spot TCs, or TCs negotiated annually, which remained relatively flat throughout the year. |
|
 |
The 2024 benchmark TC, negotiated in April
2024, was US$165/t concentrate, down 40% from 2023 (US$274/t). To reduce volatility, for the majority of our third-party contracts, which
are renewed during different periods throughout the year, we consider the 3-year benchmark TC. The reference benchmark for TC 2024, 2023
and 2022 is US$165/t concentrate, US$274/t concentrate, and US$230/t concentrate, respectively.
Adjusted
EBITDA for the smelting segment totaled US$67 million in 2Q24 compared to US$51 million reported in 2Q23. This increase was primarily
attributed to (i) the positive net impact of US$46 million in costs, mainly due to the positive raw material inventory consumption cost
effect, and lower sales, freights and energy expenses; (ii) the positive net impact of US$14 million in other expenses, mainly due to
dividends received from Enercan11
and lower project evaluation expenses, which were partially offset by (iii) lower TCs of US$20 million;
(iv) the negative hedge variation of US$14 million; and (v) the negative net price effect of US$9 million, mainly due to higher zinc prices
negatively impacting zinc concentrate purchases and lower metal net premium.
11
Amount received in cash related to dividends from associate, as the results from these dividends were not
consolidated in prior periods. Please refer to the “Others – Dividends received form associate” section in this Earnings
Release for further details.
| | |
| | 35 |
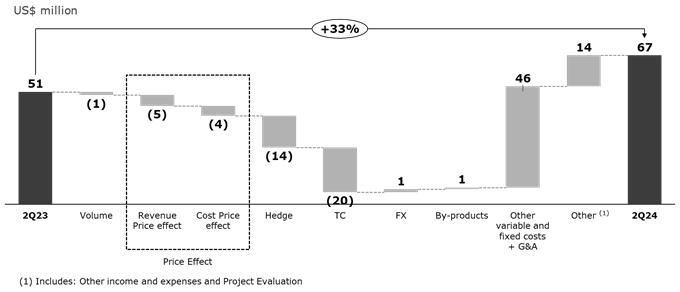
Compared to 1Q24, Adjusted EBITDA increased
by 37%, mainly driven by (i) higher by-products contribution of US$10 million, primarily related to higher sulphuric acid sales and copper
cement prices; (ii) the positive net impact of US$8 million in costs, primarily due to positive raw material inventory consumption cost
effect and lower third-party services in Cajamarquilla; (iii) higher sales volume of US$5 million, particularly in Cajamarquilla, partially
offset by lower sales volume in Três Marias; and (iv) the positive net impact of US$4 million in
other expenses, mainly due to dividends received from Enercan12,
which were partially offset by (v) the negative net price effect of US$8 million, mainly due to higher zinc prices negatively impacting
zinc concentrate purchases and lower metal net premium.
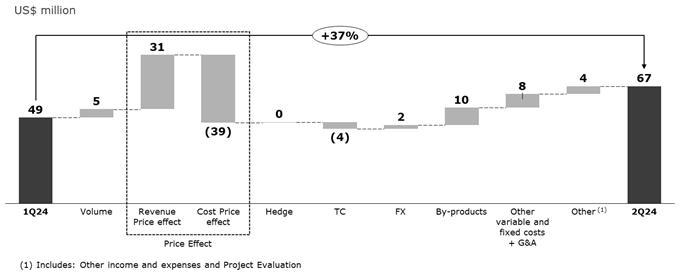
Conversion cost, Cash cost and
AISC 13
| Consolidated |
|
2Q24 |
1Q24 |
2Q23 |
2Q24 vs. 2Q23 |
1H24 |
1H23 |
1H24 vs. 1H23 |
| Smelting conversion cost |
US$/t |
668 |
669 |
712 |
(6.2%) |
668 |
698 |
(4.2%) |
| Cash cost net of by-products |
US$/t |
2,634 |
2,169 |
2,474 |
6.4% |
2,410 |
2,615 |
(7.9%) |
| AISC net of by-products |
US$/t |
2,853 |
2,306 |
2,721 |
4.8% |
2,589 |
2,819 |
(8.1%) |
| Smelting conversion cost |
US$/lb |
0.30 |
0.30 |
0.32 |
(6.2%) |
0.30 |
0.32 |
(4.2%) |
| Cash cost net of by-products |
US$/lb |
1.19 |
0.98 |
1.12 |
6.4% |
1.09 |
1.19 |
(7.9%) |
| AISC net of by-products |
US$/lb |
1.29 |
1.05 |
1.23 |
4.8% |
1.17 |
1.28 |
(8.1%) |
Note: Cash cost and AISC per ton sold does
not include the impact of the cost of metal purchased for resale.
12
Amount received in cash related to dividends from associate, since the results from these dividends were
not consolidated on prior periods. Please refer to “Others – Dividends received form associate” section in this Earnings
Release for further details.
13
Our conversion cost, cash cost and AISC net of by-products credits are measured with respect to zinc sold.
| | |
| | 36 |
Cash
cost net of by-products for the smelting segment was US$1.19/lb in 2Q24, up from US$1.12/lb in 2Q23.
This increase was primarily attributed to higher zinc prices impacting concentrate purchases and higher operating costs, partially offset
by higher by-products credits. Compared to 1Q24, cash cost rose by 21%, mainly driven by higher zinc prices impacting concentrate purchases
and lower TCs, which was partially offset by higher by-products credits and higher zinc sales volume.
AISC net of by-products in 2Q24 was US$1.29/lb,
up 5% and 24% from US$1.23/lb in 2Q23 and US$1.05/lb in 1Q24, respectively.
Conversion cost for the smelting
segment in 2Q24 was US$0.30/lb compared to US$0.32/lb in 2Q23, primarily due to reduced energy consumption and improved operational efficiency,
partially offset by increased maintenance expenses. Compared to 1Q24, conversion cost was relatively flat.
For a reconciliation of conversion cost,
cash cost and AISC, please refer to the appendix section “Conversion and All in Sustaining Cash Cost | Smelting.”
| | |
| | 37 |
Liquidity and
Indebtedness
On June
30, 2024, Nexa’s consolidated gross debt14
amounted to US$1,854 million, 7% higher compared to March 31, 2024, mainly due to a debenture issuance,
partially offset by the 11% depreciation of the Brazilian real (end of period) against the U.S. dollar.
At the end of the period, 79% (or US$1,466
million) of the gross debt was denominated in U.S. dollars and 21% (or US$388 million) in Brazilian reais. The following charts show Nexa’s
gross debt by category and currency.
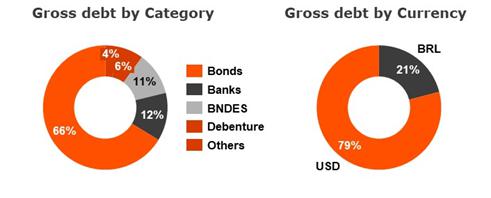
Cash and cash equivalents and financial
investments (“total cash”) amounted to US$474 million on June 30, 2024, 46% higher compared to March 31, 2024, mainly driven
by a debenture issuance in the quarter and positive operating cash flows, partially offset by working capital investment of US$17 million.
In April 2024, Nexa successfully extended
its debt maturity profile through the issuance of new debentures and bonds. This strategic move allowed us to optimize our financial structure,
diversify our funding sources, enhance our liquidity position and extend our debt maturity profile, with a current average debt maturity
of approximately 6 years.
The debenture issuance by Nexa Brazil,
an ESG-linked instrument with a 6-year term, amounted to approximately US$130 million. This issuance not only signifies our entry into
the Brazilian debenture market but also underscores our commitment to ESG principles.
Simultaneously, we completed a new bond
offering totaling US$600 million 6.750% senior unsecured notes due in April 2034. The net proceeds of this offering were directed towards
funding a cash tender offer for part of our existing notes due in 2027 and in 2028.
In June 2024, Nexa Brazil accessed a R$200
million (approximately US$40 million) credit line from BNDES for an approximately 8-year term (maturing in March 2032, with amortization
in 72 consecutive installments after a 2-year grace period as defined in this agreement). The interest rate is IPCA plus 5.41% bps, plus
1.84% spread rate that can be reduced by 0.4% if ESG targets are achieved; otherwise, the rate is increased by 1%.
Total cash at the end of 2Q24 is sufficient
to cover the payment of all obligations maturing over the next 4 years. At the end of 2Q24, the average maturity of the total debt was
5.9 years at an average interest rate of 6.61% per year with only 2% (US$44 million) of the total debt maturing in 2024, 5% (US$92 million)
maturing between 2025 and 2026, 43% (US$797 million) maturing between 2027 and 2028 and 50% (US$1,568 million) of the total debt maturing
in and after 2029.
14
Loans and financing (“gross debt”)
| | |
| | 38 |
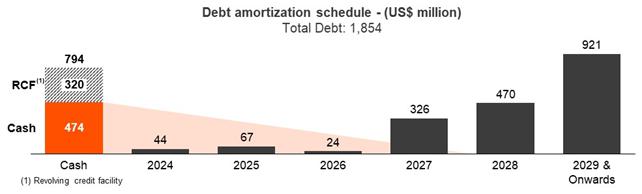
On
June 30, 2024, Nexa’s net debt15
was US$1,387 million compared with US$1,427 million at the end of 1Q24.
| US$ million |
Jun 30, 2024 |
Mar 31, 2024 |
| Net debt |
1,387.5 |
1,427.4 |
| LTM Adj. EBITDA |
509.7 |
380.8 |
| Net debt/LTM Adj. EBITDA |
2.72x |
3.75x |
In addition to continuing to assess short-term
and mid-term commodities prices, management continuously reviews Nexa’s capital structure, financial position, and the maturity
profile of our debt. Actions to improve the quantum and profile of outstanding debt, focusing on extending maturity, reducing average
cost of debt and assessing financing alternatives, continue to be constantly evaluated.
15
Gross debt (US$1,854 million) minus cash and cash equivalents (US$462 million), minus financial investments (US$12 million), plus derivatives
(US$2 million), plus Lease Liabilities (US$10 million). It does not include the financial instrument related to the offtake agreement.
| | |
| | 39 |
Cash flows
| US$ million |
2Q24 |
1H24 |
| Cash provided by operating activities before working capital |
132.8 |
213.8 |
| Variations in operating assets and liabilities ("Working Capital") |
(16.6) |
(141.2) |
| Net cash flows provided by (used in): |
|
|
| Operating activities |
77.8 |
(11.8) |
| Investing activities |
(56.5) |
(130.2) |
| Financing activities |
133.2 |
155.1 |
| Increase in cash and cash eq. |
148.7 |
4.7 |
| Cash and cash eq. at the beginning of the period |
313.3 |
457.3 |
| Cash and cash eq. at the end of the period (1) |
461.9 |
461.9 |
(1) Does not include financial investments
totaling US$12 million at June 30, 2024.
Note: For details on Cash flows, please refer
to the “Condensed consolidated interim financial statements at and for the three and six-month periods ended on June 30, 2024.”
In 2Q24, the cash provided by operating
activities before working capital variations was US$133 million. Working capital variations had a negative impact of US$17 million, primarily
due to (i) the increase in inventories of US$56 million related to sales contracts negotiated for the second half of the year; (ii) the
increase in other assets of US$52 million, mainly related to tax credits, insurance renewal, and dividends received from associate; (iii)
the increase in trade accounts receivables of US$28 million due to higher metal prices and increased smelting sales volume; partially
offset by (iv) the increase in other liabilities of US$63 million, mainly related to an increase in tax liabilities, provisions for property
insurance, higher income tax in Cajamarquilla and compensation costs for Morro Agudo’s employees; (v) the increase in trade payables
of US$52 million; and (iv) the increase in confirming payables of US$6 million. In 2Q24, we paid US$26 million in interest and US$11 million
in taxes. Consequently, net cash flows provided by operating activities were US$78 million.
We used US$56 million of net cash flows
for investing activities in 2Q24, primarily including US$67 million of CAPEX, nearly all of which was sustaining CAPEX, partially offset
by dividends received of US$10 million.
Net cash flows from financing activities
in the quarter was US$133 million due to the net impact of our new bond offering of US$600 million, a debenture issuance of approximately
US$130 million, and the BNDES credit line of approximately US$40 million, which were partially offset by payments of loans and financing
(including the cash tender for part of the bonds maturing in 2027 and 2028), and lease liabilities.
Foreign exchange effects on cash and cash
equivalents had a negative impact of US$6 million in the quarter, totaling US$8 million in 1H24.
As a result, cash and cash equivalents
excluding financial investments increased by US$149 million to US$462 million at the end of 2Q24.
| | |
| | 40 |
Others
Offtake agreement
As previously disclosed, in January 2022
Nexa signed an offtake agreement with a third-party international player (the “Offtaker”), in which Nexa agreed to sell 100%
of the copper concentrate produced by Aripuanã for a 5-year period starting in February 2023 and limited to 30,810 tonnes, at the
lower of current market prices or a price cap.
In September 2023, the parties agreed
to amend the offtake agreement, which states that no penalty will be applied in case of delays in the agreed shipment schedule per year.
However, if lower volumes are delivered in any given year within the contract period, the remaining balance will be shipped at the end
of the contract period, totaling the 30,018 tonnes. The offtake agreement was structured to completely extinguish a previously existing
future royalty obligation that Nexa had with the offtaker.
The offtake agreement resulted from negotiations
with the Offtaker to sell the copper concentrate in lieu of paying future royalties related to the previous acquisition of the Aripuanã
project mining rights from the Offtaker. Additionally, the Company opted to voluntarily and irrevocably designate the entire offtake agreement
at fair value through profit and loss within the scope of IFRS 9, rather than separate the value of the embedded derivative associated
with the price cap. This resulted in a non-cash accumulated loss of US$19 million recognized in the income statement for the period ended
on June 30, 2024.
For further information, please refer
to explanatory note 10 (e) – “Financial instruments in the offtake agreement: fair value” in the “Condensed consolidated
interim financial statements at and for the three and six-month periods ended on June 30, 2024.”
Legal Matters
As previously mentioned, new legislation
enacted by Minas Gerais State that requires mining companies to present guarantees for their tailings dam facilities. The Company had
until March 28, 2024, to submit a proposal. However, a new Minas Gerais decree published on June 26, 2024 has postponed the deadline to
September 25, 2024, which was previously set for June 28, 2024.
In addition,
there are ongoing tax-related discussions with the Peruvian tax authorities related to the Stability Agreement of Cerro Lindo operations
that may evolve in 2024 depending on ongoing legal proceedings. Both events may impact the Company’s results and cash flow and,
ultimately, the Company’s liquidity16.
Impairment
Nexa submitted a request to modify the
Environmental Impact Assessment (“MEIA”) for the Magistral Copper Project in Peru to the National Environmental Certification
Agency (“SENACE”). In May 2024, SENACE formally rejected the MEIA modification request. Nexa is currently addressing this
situation with the competent authorities and expects to receive a response in the coming months. The denial of this environmental permit
is relevant and could impact the assessment of the project’s economic feasibility and technical development, as well as the recoverability
of its assets. The project remains in Nexa's portfolio of Exploration and Evaluation assets, and the Company has decided to reassess the
engineering studies and continue evaluating options for the project. This reassessment may affect the project’s current maturity
stage and is considered an impairment indicator.
16
For more information on Dams Obligations and the Tax Stability Agreement, please refer to explanatory note
17 (b) – “Environmental Guarantee for Dams” and note 8 (c) – “Summary of uncertain tax positions on income
tax,” respectively, in the “Condensed consolidated interim financial statements at and for the three and six-month periods
ended on June 30, 2024” and “Information on the Company—Mining operations—Tailings disposal” and “Additional
Information—Legal Proceedings,” respectively, in our annual report on Form 20-F for the year ended 2023.
| | |
| | 41 |
In June 2024, the Magistral Project was
tested for impairment. As a result, the Company recognized a pre-tax impairment loss of US$58 million (after-tax US$42 million) in 2Q24,
classified under “Property, Plant and Equipment.”
This impairment was conducted using the
fair value less cost of disposal (“FVLCD”), estimated through the discounted cash flows method (using a post-tax discount
rate) or market past transaction multiples (amount paid per ton of minerals for projects in similar stages).
For further information, please refer
to note 18 – “Impairment of long-lived assets” in the “Condensed consolidated interim financial statements at
and for the three and six-month periods ended on June 30, 2024.”
Dividends received
from associate
Adjusted EBITDA for Segments and Consolidated
Dividends received from associate company
Campos Novos Energia S.A – Enercan, an entity focused on energy generation. As the purpose of Nexa’s investment in Enercan
is to secure long-term energy supply for its operations in Brazil, management reviews Nexa’s energy costs for a given period together
with dividends received from Enercan during such period. Nexa recognized its share of the assets, liabilities, revenues and expenses for
its interest in Enercan until November 2022, when it ceased to be a jointly controlled operation.
Beginning in 2024, Nexa includes these
dividends in its Adjusted EBITDA, consistently with Nexa’s Adjusted EBITDA for segments. As the adjustment consists of dividends
received during the period, these dividends reflect the results of Enercan for prior periods. The adjustment does not reflect equity-method
accounting required under IFRS. Adjusted EBITDA is not a replacement for net income - refer to “Use of Non-IFRS Financial Measures”
for further information. Numbers for three and six-months ended June 30, 2023, do not include dividends received from Enercan because
it referred to the period during which Enercan was recognized as a jointly controlled operation in Nexa’s results. If Nexa had not
made the adjustment for the three and six-months ended June 30, 2024, the Adjusted EBITDA for those periods would have been US$191 million
and US$313 million, respectively.
| | |
| | 42 |
Market Scenario
2Q24
| LME Prices |
|
2Q24 |
1Q24 |
2Q23 |
2Q24 vs. 2Q23 |
1H24 |
1H23 |
1H24 vs. 1H23 |
| |
|
|
|
|
|
|
|
|
| |
|
|
|
|
|
|
|
|
| Zinc |
US$/t |
2,833 |
2,450 |
2,526 |
12.2% |
2,640 |
2,835 |
(6.9%) |
| Copper |
US$/t |
9,753 |
8,438 |
8,464 |
15.2% |
9,090 |
8,703 |
4.5% |
| Lead |
US$/t |
2,167 |
2,077 |
2,117 |
2.3% |
2,121 |
2,129 |
(0.4%) |
| Silver |
US$/oz |
28.84 |
23.34 |
24.13 |
19.5% |
26.07 |
23.31 |
11.8% |
| Gold |
US$/oz |
2,338 |
2,070 |
1,976 |
18.3% |
2,203 |
1,932 |
14.0% |
Source: Bloomberg
In 2Q24, the LME zinc price averaged US$2,833
/t (or US$1.29/lb), up 12% from 2Q23 and 16% from 1Q24.
The increase in zinc prices was supported
by a combination of macroeconomic factors and fundamentals, such as lower zinc inventories worldwide. From a macroeconomic perspective,
expectations of lower U.S. interest rates through the end of 2024 positively impacted base metals prices and demand. Additionally, local
manufacturing activity in China grew following government economic stimulus measures. Zinc spot TCs in China for both domestic and imported
material decreased quarter-over-quarter, with TCs falling for the 11th consecutive month in June, mainly due to the persistent
and tight concentrate global market. However, higher prices during the quarter have supported the reopening of some operations, such as
the Tara mine (Ireland), which is scheduled to resume its operations in 4Q24, and the Budel smelter (Netherlands), which resumed its operations
last May.
The LME copper price averaged US$9,753/t
(or US$4.42/lb) in 2Q24, up 15% from 2Q23 and 16% from 1Q24.
In addition to macroeconomic factors,
copper prices were also impacted by bullish fund manager investments, reaching a peak of US$10,857/t in May. However, prices dropped back
to US$9,500/t levels in June as contracts were liquidated.
Looking ahead, base metal prices are expected
to continue being impacted primarily by U.S. monetary policy and economic stimulus in China. The U.S. Federal Reserve maintained interest
rates at the same levels during its May and June meetings, but some market analysts still anticipate interest rate cuts in the second
half of 2024. In China, the government continues to seek monetary resources for economic and fiscal stimulus policies, which is expected
to positively impact the base metals market in the short-term. Chinese authorities have also increased
efforts to stimulate the infrastructure sector, which could play a significant role in zinc and copper demand in the upcoming months.
For copper, a tight concentrate market is expected to continue supporting prices in the near-term, while long-term
demand remains positive due to the ongoing energy transition.
In our Home Market (Latin America, excluding
Mexico), demand for zinc metal slightly increased in 2Q24 compared to 1Q24, primarily driven by a significant surge in demand in Peru,
particularly in the export sector. Brazil recorded the second-best performance in the region, with a 3% increase in local demand. Looking
ahead, zinc demand in Latin America is expected to remain relatively stable, supported by a cautiously optimistic economic outlook and
modestly buoyed by the recent decrease in interest rates in Brazil.
| | |
| | 43 |
Foreign Exchange
| FX |
|
2Q24 |
1Q24 |
2Q23 |
2Q24 vs. 2Q23 |
1H24 |
1H23 |
1H24 vs. 1H23 |
| BRL/USD (Average) |
5.213 |
4.951 |
4.948 |
5.3% |
5.084 |
5.074 |
0.2% |
| BRL/USD (End of period) |
5.559 |
4.996 |
4.819 |
15.3% |
5.559 |
4.819 |
15.3% |
| PEN/USD (Average) |
3.744 |
3.760 |
3.697 |
1.2% |
3.752 |
3.758 |
(0.2%) |
| PEN/USD (End of period) |
3.843 |
3.718 |
3.625 |
6.0% |
3.843 |
3.625 |
6.0% |
Source: Bloomberg
The average exchange rate for the Brazilian
real in 2Q24 was 5.213 BR/US$, a depreciation of 5% compared to both periods (4.958 BRL/US$) in 2Q23 and (4.951 BR/US$) in 1Q24. By the
end of June, the exchange rate was 5.559 BRL/US$. During the quarter, the Brazilian Central Bank reported a public account deficit of
63.9 billion Brazilian reais (approximately US$11 billion), surpassing market expectations. The fiscal deficit and the political uncertainties
surrounding the Brazilian government's ability to meet its annual fiscal target have eroded confidence in the government administration,
leading to a depreciation of the Brazilian real against the U.S. dollar.
The average exchange rate for the Peruvian
soles in 2Q24 was 3.744/US$, which is 1% higher compared to 2Q23 and 0.4% lower compared to 1Q24. By the end of June, the Peruvian soles/US$
exchange rate was 3.843.
| | |
| | 44 |
Risks and Uncertainties
Risk management is one of the key points
in our business strategy and contributes to value creation and increasing the level of confidence in the Company held by its main stakeholders,
including shareholders, employees, customers, suppliers and the local communities.
As a result, we have adopted an Enterprise
Risk Management (“ERM”) Policy that describes Nexa’s Risk Management Model. The ERM forms an integral part of the processes
in our operational units, corporate departments and projects, and provides support for decision-making by our Executive Officers and Board
of Directors.
The risk assessment cycle is performed
annually focusing on our strategy, operations and key projects. We seek to identify material risks, which are then assessed with consideration
of the potential health, safety, environmental, social, reputational, legal and financial impacts. By embedding risk management into our
work processes and critical business systems, we work to ensure we make decisions based on relevant inputs and valid data. The material
risks identified during the risk management process are monitored and reported to the Executive Team, Audit Committee and Board of Directors.
Our operations are exposed to a number
of inherent risks and uncertainties, and our results may be influenced by the following factors, including, among others:
| · | the cyclical and volatile prices of commodities; |
| · | the changes in the expected level of supply and demand for commodities; |
| · | foreign exchange rates and inflation; |
| · | the risks and uncertainties relating to economic and political conditions in the countries in which we
operate; |
| · | changes in global market conditions; |
| · | the impact of expanded regional or global conflict, including the conflicts between Russia and Ukraine,
and the Middle-East conflict, and the resulting potential impacts on supply and demand for commodities, global security concerns, and
market volatility; |
| · | outbreaks of contagious diseases or health crises impacting overall economic activity regionally or globally,
such as the coronavirus (“COVID-19”) pandemic, and the potential impact thereof on commodity prices and exchange rate variations
in the currencies to which we are exposed to, our business and operating sites, and the global economy; |
| · | increasing demand and evolving expectations from stakeholders with respect to our environmental, social
and governance (“ESG”) practices, performance and disclosures, including the ability to meet energy requirements while complying
with greenhouse gas emissions regulations and other energy transition policy changes and laws in the countries in which we operate; |
| · | the impact of climate change on our operations, workforce and value chain; |
| · | environmental, safety and engineering challenges and risks inherent to mining; |
| · | the ability to meet energy requirements while complying with greenhouse gas emissions regulations and
other energy transition policy changes and laws in the countries in which we operate; |
| · | severe natural disasters, such as storms and earthquakes, disrupting our operations; |
| · | operational risks, such as operator errors, mechanical failures and other accidents; |
| · | the availability of materials, supplies, insurance coverage, equipment, required permits or approvals
and financing; |
| · | supply-chain and logistic related interruptions, including impacts to international freight and transportation
networks; |
| · | the implementation of our growth strategy and risks associated with related capital expenditures; |
| | |
| | 45 |
| · | failure to obtain financial assurance to meet closure and remediation obligations; |
| · | the possible material differences between our estimates of Mineral Reserves and Mineral Resources and
the mineral quantities we actually recover; |
| · | the possibility that our concessions may be terminated or not renewed by governmental authorities in the
countries in which we operate; |
| · | the possibility that permits, concessions, environmental studies, modificatory
environmental studies and other governmental authorities requests may be terminated, not renewed, or not granted impacting, therefore,
the carrying amount of certain assets potentially resulting in impairment charges, fines and/or penalties. |
| · | the impact of political and government changes in the countries in which we operate, and the effects of
potential new legislation, including changes in taxation laws and any related agreements that Nexa has entered or may enter into with
local governments; |
| · | legal and regulatory risks, including ongoing or future investigations by local authorities with respect
to our business and operations, as well as the conduct of our customers, as well as the impact to our financial statements regarding the
resolution of any such matters; |
| · | labor disputes or disagreements with local communities or unions in the countries in which we operate; |
| · | loss of reputation due to unanticipated operational failures or significant occupational incidents; |
| · | failure or outage of our digital infrastructure or information and operating technology systems; |
| · | cyber events or attacks (including ransomware, state-sponsored and other cyberattacks) due to negligence
or IT security failures; |
| · | the future impact of competition and changes in domestic and international governmental and regulatory
policies that apply to our operations; |
| · | currency exchange rate and interest rate fluctuations; and |
For a broader discussion of risks please
refer to our annual report on form 20-F filed with the SEC (www.sec.gov), on SEDAR (www.sedarplus.ca) and available on the Company’s
website (ir.nexaresources.com).
Use of Non-IFRS
Financial Measures
Nexa’s management uses Consolidated
Adjusted EBITDA as an additional performance measure on a consolidated basis, in addition to, and not as a substitute for, net income.
We believe this measure provides useful information about the performance of our operations as it facilitates consistent comparisons between
periods, planning and forecasting of future operating results reflecting the operational performance of our existing business without
the impact of interest, taxes, amortization, depreciation, non-cash items that do not reflect our operational performance for the specific
reporting period and the impact of pre-operating and ramp-up expenses during the commissioning and ramp-up phases of greenfield projects
(currently, only Aripuanã has reached these stages). Pre-operating and ramp-up expenses incurred during the commissioning and ramp-up
of phases of Aripuanã are not considered infrequent, unusual or non-recurring expenses, as they have recurred in prior years with
respect to Aripuanã and may recur in the future with respect to Aripuanã or any other projects that may reach the commissioning
or ramp-up phases. Our management believes this adjustment is helpful because it shows our performance without the impact of specific
expenses relating to a greenfield project that has reached the commissioning or ramp-up phases, with no connection with the performance
of our other existing operations.
| | |
| | 46 |
When applicable, Adjusted EBITDA also
excludes the impact of (i) events that are non-recurring, unusual or infrequent, and (ii) other specific events that, by their nature
and scope, do not reflect our operational performance for the specific period in our management’s view. These events did not impact
our Adjusted EBITDA in 2023 and 2022 but may impact future periods.
In this report, we present Consolidated
Adjusted EBITDA, which we define as net income (loss) for the year/period, adjusted by (i) share in the results of associates, depreciation
and amortization, net financial results and income tax; (ii) addition of cash dividends received from associates; (iii) non-cash events
and non-cash gains or losses that do not specifically reflect our operational performance for the specific period (including: (loss) gain
on sale of investments; impairment and impairment reversals; (loss) gain on sale of long-lived assets; write-offs of long-lived assets;
remeasurement in estimates of asset retirement obligations; and other restoration obligations); and (iv) pre-operating and ramp-up expenses
incurred during the commissioning and ramp-up phases of greenfield projects (currently, Aripuanã).
Our calculation of Adjusted EBITDA may
be different from the calculation used by other companies, including our competitors in the mining industry, so our measures may not be
comparable to those of other companies.
Mining segment | Cash cost net of by-products
credits: for our mining operations, cash cost after by-products credits includes all direct costs associated with mining, concentrating,
leaching, solvent extraction, on-site administration and general expenses, any off-site services essential to the operation, concentrate
freight costs, marketing costs and property and severance taxes paid to state or federal agencies that are not profit-related. Treatment
and refining charges on metal sales, which are typically recognized as a deduction component of sales revenues, are added to cash cost.
Cash cost net of by-products credits is measured with respect to zinc sold per mine.
Mining segment | Cost ROM: includes all
direct production costs for mining, concentrating, leaching, on-site mineral transportation, and other on-site administration expenses,
excluding royalties and workers’ participation costs. Cost ROM is measured with respect to total treated ore volume and non-metallic
products revenue (such as limestone and stones) are considered as cost-reduction for our mining operations.
Smelting segment | Cash cost net of by-products
credits: for our smelting operations, cash cost, after by-products credits includes all the costs of smelting, including costs associated
with labor, net energy, maintenance, materials, consumables and other on-site costs, as well as raw material costs. Cash cost net of by-products
credits is measured with respect to zinc sold per smelter.
Smelting segment | Conversion cost: costs
incurred to convert zinc concentrate (feed) into final products measured with respect to contained zinc sold per smelter, including energy,
consumables, and other fixed and on-site expenses. Conversion cost does not include raw material, alloys, and by-products related cost.
Sustaining cost net of by-products credits
is defined as the cash cost, net of by-product credits plus non-expansion capital expenditure, including sustaining, health, safety and
environment, modernization and other non-expansion-related capital expenditures. Sustaining cash cost net of by-products credits is measured
with respect to zinc sold.
All in sustaining cost (“AISC”)
net of by-products credits is defined as sustaining cash cost, net of by-products credits plus corporate general and administrative expenses,
royalties and workers’ participation. AISC net of by-products credits is measured with respect to zinc sold.
Net debt: defined as (i) loans and financing
(the most comparable IFRS measure), less (ii) cash and cash equivalents, less (iii) financial investments, plus or less (iv) the fair
value of derivative financial instruments, plus (v) leases liabilities. Our management believes that net debt is an important figure because
it indicates our ability to repay outstanding debts that become due simultaneously using available cash and highly liquid assets.
| | |
| | 47 |
All forward-looking non-IFRS financial
measures in this release, including cash cost guidance, are provided only on a non-IFRS basis. This is due to the inherent difficulty
of forecasting the timing or amount of items that would be included in the most directly comparable forward-looking IFRS financial measures.
As a result, reconciliation of the forward-looking non-IFRS financial measures to IFRS financial measures is not available without unreasonable
effort and the Company is unable to assess the probable significance of the unavailable information.
See “Cautionary Statement on Forward-Looking
Statements” below.
Technical information
Jose Antonio Lopes, B.Geo., FAusIMM: 224829,
a Mineral Resources manager, a qualified person for purposes of National Instrument 43-101 and a Nexa employee, has approved the scientific
and technical information contained in this Earnings Release. Please note that the mineral reserves included in this Earnings Release
were estimated in accordance with the Canadian Institute of Mining, Metallurgy and Petroleum (“CIM”) 2014 Definition Standards
for Mineral Reserves and Mineral Resources, whose definitions are incorporated by reference in National Instrument 43-101. Accordingly,
such information may not be comparable to similar information prepared in accordance with Subpart 1300 of Regulation S-K (“S-K 1300”).
Our estimates of mineral reserves may be materially different from mineral quantities we actually recover, and market price fluctuations
and changes in operating capital costs may render certain mineral reserves uneconomical to mine.
CAUTIONARY STATEMENT
ON FORWARD-LOOKING STATEMENTS
This Earnings
Release contains certain forward-looking information and forward-looking statements as defined in applicable securities laws (collectively
referred to in this Earnings Release as “forward-looking statements”). All statements other than statements of historical
fact are forward-looking statements. The words “believe,” “will,” “may,” “may have,” “would,”
“estimate,” “continues,” “anticipates,” “intends,” “plans,” “expects,”
“budget,” “scheduled,” “forecasts” and similar words are intended to identify estimates and forward-looking
statements. Forward-looking statements are not guarantees and involve known and unknown risks, uncertainties and other factors which may
cause the actual results, performance or achievements of Nexa to be materially different from any future results, performance or achievements
expressed or implied by the forward-looking statements. Actual results and developments may be substantially different from the expectations
described in the forward-looking statements for a number of reasons, many of which are not under our control, among them, the activities
of our competition, the future global economic situation, weather conditions, market prices and conditions, exchange rates, and operational
and financial risks. The unexpected occurrence of one or more of the abovementioned events may significantly change the results of our
operations on which we have based our estimates and forward-looking statements. Our estimates and forward-looking statements may also
be influenced by, among others, legal, political, environmental or other risks that could materially affect the potential development
of our projects, including risks related to outbreaks of contagious diseases or health crises impacting overall economic activity regionally
or globally, as well as risks relating to ongoing or future investigations by local authorities with respect to our business and
operations and the conduct of our customers, including the impact to our financial statements regarding the resolution of any such matters.
These forward-looking statements related
to future events or future performance and include current estimates, predictions, forecasts, beliefs and statements as to management’s
expectations with respect to, but not limited to, the business and operations of the Company and mining production our growth strategy,
the impact of applicable laws and regulations, future zinc and other metal prices, smelting sales, CAPEX, expenses related to exploration
and project evaluation, estimation of mineral reserves and mineral resources, mine life and our financial liquidity.
Forward-looking statements are necessarily
based upon a number of factors and assumptions that, while considered reasonable and appropriate by management, are inherently subject
to significant business, economic and competitive uncertainties and contingencies and may prove to be incorrect.
| | |
| | 48 |
Statements concerning future production
costs or volumes are based on numerous assumptions of management regarding operating matters and on assumptions that demand for products
develops as anticipated, that customers and other counterparties perform their contractual obligations, full integration of mining and
smelting operations, that operating and capital plans will not be disrupted by issues such as mechanical failure, unavailability of parts
and supplies, labor disturbances, interruption in transportation or utilities, and adverse weather conditions, and that there are no material
unanticipated variations in metal prices, exchange rates, or the cost of energy, supplies or transportation, among other assumptions.
We assume no obligation to update forward-looking
statements except as required under securities laws. Estimates and forward-looking statements refer only to the date when they were made,
and we do not undertake any obligation to update or revise any estimate or forward-looking statement due to new information, future events
or otherwise, except as required by law. Estimates and forward-looking statements involve risks and uncertainties and do not guarantee
future performance, as actual results or developments may be substantially different from the expectations described in the forward-looking
statements. Further information concerning risks and uncertainties associated with these forward-looking statements and our business
can be found in our annual report on Form 20-F and in our other public disclosures available on our website and filed under our profile
on SEDAR (www.sedarplus.ca) and on EDGAR (www.sec.gov).
| | |
| | 49 |
Appendix
| | |
| | 50 |
Income Statement
| US$ million |
1Q23 |
2Q23 |
3Q23 |
4Q23 |
1Q24 |
2Q24 |
| Net Revenues |
667.3 |
626.7 |
649.3 |
629.9 |
579.8 |
736.3 |
| Cost of sales |
(567.8) |
(565.0) |
(582.5) |
(561.4) |
(493.2) |
(557.1) |
| Gross Profit |
99.5 |
61.7 |
66.8 |
68.5 |
86.6 |
179.2 |
| SG&A |
(28.5) |
(32.6) |
(33.1) |
(32.7) |
(33.6) |
(30.2) |
| Mineral Exploration and Project Evaluation |
(22.0) |
(21.3) |
(29.6) |
(26.8) |
(12.8) |
(18.0) |
| Impairment (loss) reversal of long-lived assets |
- |
(57.2) |
(1.9) |
(55.5) |
17.2 |
(60.2) |
| Other income and expenses, net |
(5.5) |
(66.1) |
(7.2) |
(31.8) |
(9.0) |
(51.9) |
| Operating income (loss) |
43.5 |
(115.5) |
(5.0) |
(78.4) |
48.4 |
19.0 |
| Share in the results of associates |
5.4 |
5.7 |
6.3 |
6.1 |
5.7 |
5.3 |
| Net Financial Results |
(39.2) |
(26.5) |
(64.4) |
(31.5) |
(66.0) |
(116.6) |
| Financial income |
5.6 |
6.7 |
8.4 |
4.8 |
5.0 |
6.8 |
| Financial expenses |
(46.4) |
(59.4) |
(45.3) |
(53.1) |
(49.0) |
(60.6) |
| Other financial items, net |
1.6 |
26.1 |
(27.4) |
16.7 |
(22.0) |
(62.7) |
| Depreciation and amortization |
(71.7) |
(71.7) |
(72.1) |
(82.9) |
(72.6) |
(69.9) |
| Adjusted EBITDA |
133.0 |
71.5 |
81.7 |
104.9 |
122.6 |
200.5 |
| Adj. EBITDA margin |
19.9% |
11.4% |
12.6% |
16.7% |
21.1% |
27.2% |
| Income tax benefit (expense) |
(25.1) |
33.5 |
(0.4) |
(3.8) |
0.4 |
23.0 |
| Net Income (loss) |
(15.4) |
(102.8) |
(63.4) |
(107.6) |
(11.5) |
(69.3) |
| Attributable to Nexa's shareholders |
(19.7) |
(102.5) |
(73.7) |
(93.4) |
(23.8) |
(76.3) |
| Attributable to non-controlling interests |
4.3 |
(0.3) |
10.4 |
(14.2) |
12.4 |
7.0 |
| Weighted average number of outstanding shares - in thousand |
132,439 |
132,439 |
132,439 |
132,439 |
132,439 |
132,439 |
| Basic and diluted earnings (loss) per share - (in US$) |
(0.15) |
(0.77) |
(0.56) |
(0.71) |
(0.18) |
(0.58) |
| Adjusted Net Income (loss) |
2.4 |
12.5 |
(48.8) |
(7.1) |
(9.8) |
42.4 |
| Adjusted basic and diluted earnings (loss) per share - (in US$) |
(0.01) |
0.04 |
(0.43) |
(0.01) |
(0.15) |
0.15 |
| | |
| | 51 |
Net cash flows
from operating activities excluding working capital variations and free cash flow - Reconciliation
Nexa manages and reports cash flows from
operating activities excluding variations in working capital. Working capital can be volatile due to several factors, including prices
and a build-up or reduction of inventories.
Furthermore, we also exclude from the
analysis interest and income tax payments. Management believes excluding these measures provides investors with a better visibility of
the operating cash flow performance and our capital allocation strategy.
The following table provides a reconciliation
of the cash from operating activities before variations in working capital to free cash flow.
| US$ million |
2Q24 |
1H24 |
| |
|
|
| Cash provided by (used in) operating activities |
116 |
73 |
| (-) Working capital variations |
(17) |
(141) |
| Trade accounts receivables |
(28) |
(72) |
| Inventory |
(56) |
(73) |
| Other assets |
(49) |
(55) |
| Payables |
57 |
15 |
| Other liabilities |
59 |
44 |
| |
|
|
| Cash flows from operations excluding working capital variations |
133 |
214 |
| |
|
|
| Interest paid |
(26) |
(58) |
| Income tax |
(11) |
(25) |
| Sustaining CAPEX (1) |
(64) |
(138) |
| |
|
|
| Net cash flows from operations excluding working capital variations |
33 |
(7) |
| |
|
|
| Other investments (2) |
(3) |
(4) |
| Loans and investments (3) |
146 |
169 |
| Dividends and share premium |
(4) |
(4) |
| Foreign exchange effects |
(6) |
(8) |
| Working capital changes |
(17) |
(141) |
| |
|
|
| Free cash flow |
149 |
5 |
(1) Non expansion investments related to sustaining
and HS&E.
(2) Other non-expansion investments. Refer to
page 9 of this earnings release for CAPEX breakdown.
(3) Loans and financing, bonds repurchase and
net sales of financial investments.
For details on cash flows, please refer to the
“Condensed consolidated interim financial statements at and for the three and six-month periods ended on June 30, 2024.”
| | |
| | 52 |
CAPEX
| US$ million |
2Q24 |
1Q24 |
4Q23 |
3Q23 |
2Q23 |
1Q23 |
2023 |
| Mining |
45.1 |
59.2 |
84.1 |
63.1 |
30.4 |
45.4 |
223.1 |
| Cerro Lindo |
11.5 |
8.5 |
12.9 |
11.1 |
10.9 |
8.3 |
43.3 |
| El Porvenir |
12.0 |
25.2 |
28.8 |
16.7 |
9.7 |
13.4 |
68.6 |
| Atacocha |
3.4 |
4.2 |
6.5 |
2.6 |
2.5 |
4.7 |
16.2 |
| Vazante |
8.2 |
6.6 |
6.7 |
8.9 |
9.6 |
6.4 |
31.6 |
| Morro Agudo |
0.1 |
0.0 |
0.8 |
0.8 |
1.1 |
0.2 |
3.0 |
| Aripuanã (1) |
10.0 |
14.6 |
28.4 |
23.0 |
(3.4) |
12.4 |
60.4 |
| Smelting |
19.5 |
16.1 |
29.6 |
16.7 |
14.7 |
10.7 |
71.7 |
| Cajamarquilla |
12.3 |
12.1 |
18.8 |
7.3 |
4.5 |
4.5 |
35.0 |
| Três Marias |
5.3 |
3.3 |
6.4 |
4.6 |
7.3 |
3.9 |
22.2 |
| Juiz de Fora |
2.0 |
0.8 |
4.4 |
4.8 |
2.9 |
2.3 |
14.4 |
| Other |
2.8 |
(1.2) |
(3.1) |
2.5 |
14.8 |
0.1 |
14.3 |
| Total |
67.5 |
74.1 |
110.5 |
82.4 |
59.9 |
56.2 |
309.0 |
| |
|
|
|
|
|
|
|
| Sustaining (US$ million) |
2Q24 |
1Q24 |
4Q23 |
3Q23 |
2Q23 |
1Q23 |
2023 |
| Mining |
43.9 |
58.3 |
81.4 |
56.3 |
47.3 |
47.7 |
232.7 |
| Cerro Lindo |
11.5 |
8.5 |
11.2 |
9.1 |
9.4 |
8.0 |
37.7 |
| El Porvenir |
12.0 |
25.2 |
28.8 |
16.7 |
9.7 |
13.4 |
68.7 |
| Atacocha |
3.4 |
4.2 |
6.4 |
2.6 |
2.5 |
4.7 |
16.1 |
| Vazante |
7.3 |
5.9 |
5.9 |
7.2 |
8.8 |
6.2 |
28.0 |
| Morro Agudo |
0.1 |
0.0 |
0.8 |
0.8 |
1.0 |
0.2 |
2.8 |
| Aripuanã |
9.6 |
14.4 |
28.4 |
19.9 |
15.9 |
15.2 |
79.4 |
| Smelting |
17.7 |
14.9 |
25.5 |
14.2 |
10.9 |
7.9 |
58.5 |
| Cajamarquilla |
11.4 |
11.7 |
16.4 |
6.2 |
3.2 |
4.0 |
29.8 |
| Três Marias |
4.4 |
2.4 |
5.0 |
3.5 |
5.2 |
2.4 |
16.1 |
| Juiz de Fora |
1.8 |
0.7 |
4.1 |
4.5 |
2.5 |
1.5 |
12.6 |
| Total Operations Sustaining |
61.5 |
73.1 |
106.9 |
70.5 |
58.2 |
55.6 |
291.2 |
| Corporate Sustaining (2) |
0.4 |
0.1 |
0.5 |
0.3 |
0.3 |
0.4 |
1.6 |
| Total Sustaining |
62.0 |
73.2 |
107.4 |
70.8 |
58.5 |
56.0 |
292.8 |
(1) The negative amounts are mainly related
to reclassifications between Aripuanã and Corporate, and capitalization of interest net of advanced payments for imported materials
and tax credits.
(2) Until 4Q22, Aripuanã sustaining expenses
were included in Corporate Sustaining.
| | |
| | 53 |
All in Sustaining
Cash Cost | Mining (1)
2Q24
| |
US$ million
(excepted indicated otherwise) |
Vazante |
Morro Agudo |
Cerro Lindo |
El Porvenir |
Atacocha |
Consolidation of Operations |
Corporate & Others |
Mining |
| |
Sales Volume (Zinc content in Products) |
|
|
|
|
|
|
|
|
| |
Tonnes |
34,483 |
1,729 |
24,408 |
12,022 |
2,359 |
75,000 |
|
75,000 |
| (+) |
COGS |
31.9 |
5.2 |
92.9 |
50.2 |
16.5 |
196.6 |
2.2 |
198.8 |
| (+) |
On-site G&A |
0.1 |
0.0 |
0.2 |
0.8 |
0.7 |
1.8 |
|
1.8 |
| (-) |
By-products revenue |
(4.0) |
(1.4) |
(112.0) |
(44.1) |
(18.8) |
(180.4) |
(2.3) |
(182.7) |
| (+) |
Treatment Charges |
17.1 |
0.8 |
8.6 |
5.3 |
1.0 |
32.8 |
|
32.8 |
| (+) |
Selling Expenses |
0.1 |
0.0 |
0.3 |
0.1 |
0.1 |
0.6 |
|
0.6 |
| (-) |
Depreciation, amortization and depletion |
(5.9) |
(0.0) |
(18.7) |
(11.3) |
(3.8) |
(39.8) |
0.0 |
(39.8) |
| (-) |
Royalties |
(0.5) |
(0.1) |
(1.6) |
(0.7) |
(0.2) |
(3.1) |
|
(3.1) |
| (-) |
Workers participation & Bonus |
(0.4) |
(0.0) |
(1.7) |
(1.4) |
(0.4) |
(3.9) |
|
(3.9) |
| (+) |
Others |
0.5 |
0.0 |
1.0 |
(0.3) |
(0.5) |
0.8 |
|
0.8 |
| (=) |
Cash Cost (Sold) |
38.8 |
4.5 |
(31.1) |
(1.4) |
(5.4) |
5.5 |
(0.1) |
5.3 |
| |
Cash Cost (Sold) (per ton) |
1,126.6 |
2,587.2 |
(1,272.4) |
(112.4) |
(2,306.5) |
72.9 |
0.0 |
71.1 |
| (+) |
Sustaining Capital Expenditure |
7.4 |
0.0 |
11.5 |
12.0 |
3.4 |
34.3 |
10.2 |
44.5 |
| (=) |
Sustaining Cash Cost (Sold) |
46.3 |
4.5 |
(19.5) |
10.6 |
(2.1) |
39.8 |
10.1 |
49.8 |
| |
Sustaining Cash Cost (Sold) (per ton) |
1,341.3 |
2,599.1 |
(799.3) |
881.7 |
(881.0) |
530.1 |
0.0 |
664.6 |
| (+) |
Workers participation & Bonus |
0.4 |
0.0 |
1.7 |
1.4 |
0.4 |
3.9 |
|
3.9 |
| (+) |
Royalties |
0.5 |
0.1 |
1.6 |
0.7 |
0.2 |
3.1 |
|
3.1 |
| (+) |
Corporate G&A |
|
|
|
|
|
|
8.6 |
8.6 |
| (=) |
AISC (Sold) |
|
|
|
|
|
|
|
65.5 |
| (=) |
AISC (Sold) (per ton) |
|
|
|
|
|
|
|
873.2 |
| (=) |
AISC (Sold) in US$/lb |
|
|
|
|
|
|
|
0.40 |
(1) Our cash cost, sustaining cash cost and
AISC are net of by-products credits, measured with respect to zinc sold.
Note: Cash cost and AISC per ton sold does not
include the impact of the cost of idleness capacity of US$1.5 million in El Porvenir in 2Q24.
| | |
| | 54 |
2Q23
| |
US$ million
(excepted indicated otherwise) |
Vazante |
Morro Agudo |
Cerro Lindo |
El Porvenir |
Atacocha |
Consolidation of Operations |
Corporate & Others |
Mining |
| |
Sales Volume (Zinc content in Products) |
|
|
|
|
|
|
|
|
| |
Tonnes |
36,556 |
5,052 |
17,468 |
14,498 |
2,356 |
75,929 |
|
75,929 |
| (+) |
COGS |
32.0 |
17.6 |
86.5 |
48.1 |
19.8 |
204.0 |
(4.9) |
199.1 |
| (+) |
On-site G&A |
0.2 |
0.1 |
0.1 |
0.2 |
0.1 |
0.7 |
|
0.7 |
| (-) |
By-products revenue |
(4.3) |
(8.8) |
(78.5) |
(35.0) |
(19.3) |
(145.9) |
7.5 |
(138.3) |
| (+) |
Treatment Charges |
28.4 |
3.2 |
9.4 |
9.3 |
1.5 |
51.9 |
|
51.9 |
| (+) |
Selling Expenses |
0.1 |
0.1 |
0.9 |
0.2 |
0.0 |
1.3 |
|
1.3 |
| (-) |
Depreciation, amortization and depletion |
(6.1) |
(2.0) |
(20.4) |
(9.8) |
(4.1) |
(42.4) |
(0.0) |
(42.4) |
| (-) |
Royalties |
(0.6) |
(0.3) |
0.0 |
(0.3) |
0.0 |
(1.2) |
|
(1.2) |
| (-) |
Workers participation & Bonus |
(0.8) |
(0.3) |
(0.8) |
(0.4) |
(0.2) |
(2.5) |
|
(2.5) |
| (+) |
Others |
0.2 |
0.1 |
(2.2) |
(1.3) |
(3.3) |
(6.5) |
|
(6.5) |
| (=) |
Cash Cost (Sold) |
49.2 |
9.7 |
(5.0) |
11.1 |
(5.5) |
59.5 |
2.6 |
62.1 |
| |
Cash Cost (Sold) (per ton) |
1,345.8 |
1,913.1 |
(286.1) |
763.6 |
(2,321.9) |
783.2 |
0.0 |
817.5 |
| (+) |
Sustaining Capital Expenditure |
8.9 |
1.1 |
10.9 |
9.7 |
2.5 |
33.1 |
(0.5) |
32.6 |
| (=) |
Sustaining Cash Cost (Sold) |
58.1 |
10.8 |
5.9 |
20.8 |
(3.0) |
92.5 |
2.1 |
94.7 |
| |
Sustaining Cash Cost (Sold) (per ton) |
1,589.2 |
2,137.8 |
336.5 |
1,432.7 |
(1,272.1) |
1,218.8 |
0.0 |
1,246.7 |
| (+) |
Workers participation & Bonus |
0.8 |
0.3 |
0.8 |
0.4 |
0.2 |
2.5 |
|
2.5 |
| (+) |
Royalties |
0.6 |
0.3 |
0.0 |
0.3 |
0.0 |
1.2 |
|
1.2 |
| (+) |
Corporate G&A |
|
|
|
|
|
|
9.7 |
9.7 |
| (=) |
AISC (Sold) |
|
|
|
|
|
|
|
108.0 |
| (=) |
AISC (Sold) (per ton) |
|
|
|
|
|
|
|
1,422.8 |
| (=) |
AISC (Sold) in US$/lb |
|
|
|
|
|
|
|
0.65 |
Note: Cash cost and AISC per ton sold does not
include the impact of the cost of idleness capacity of US$0.9 million in Atacocha in 2Q23.
| | |
| | 55 |
1H24
| |
US$ million
(excepted indicated otherwise) |
Vazante |
Morro Agudo |
Cerro Lindo |
El Porvenir |
Atacocha |
Consolidation of Operations |
Corporate & Others |
Mining |
| |
Sales Volume (Zinc content in Products) |
|
|
|
|
|
|
|
|
| |
Tonnes |
69,403 |
7,394 |
47,255 |
24,764 |
4,480 |
153,295 |
0 |
153,295 |
| (+) |
COGS |
65.3 |
18.5 |
177.8 |
99.2 |
32.8 |
393.5 |
1.4 |
395.0 |
| (+) |
On-site G&A |
0.5 |
0.3 |
0.5 |
1.6 |
1.3 |
4.0 |
0.0 |
4.0 |
| (-) |
By-products revenue |
(7.2) |
(5.6) |
(193.6) |
(78.5) |
(31.9) |
(316.8) |
(3.7) |
(320.5) |
| (+) |
Treatment Charges |
35.8 |
3.4 |
16.5 |
10.4 |
2.0 |
68.1 |
0.0 |
68.1 |
| (+) |
Selling Expenses |
0.2 |
0.1 |
0.7 |
0.6 |
0.1 |
1.7 |
0.0 |
1.7 |
| (-) |
Depreciation, amortization and depletion |
(11.9) |
(0.2) |
(37.6) |
(23.9) |
(7.8) |
(81.4) |
0.0 |
(81.4) |
| (-) |
Royalties |
(1.2) |
(0.4) |
(2.8) |
(1.3) |
(0.4) |
(5.9) |
0.0 |
(5.9) |
| (-) |
Workers participation & Bonus |
(1.2) |
(0.4) |
(4.3) |
(2.3) |
(0.9) |
(9.2) |
0.0 |
(9.2) |
| (+) |
Others |
0.9 |
0.1 |
0.1 |
(0.3) |
(0.5) |
0.3 |
0.0 |
0.3 |
| (=) |
Cash Cost (Sold) |
81.1 |
15.7 |
(42.8) |
5.5 |
(5.2) |
54.3 |
(2.3) |
52.1 |
| |
Cash Cost (Sold) (per ton) |
1,168.9 |
2,125.9 |
(904.7) |
220.2 |
(1,165.4) |
354.4 |
0.0 |
339.7 |
| (+) |
Sustaining Capital Expenditure |
13.3 |
0.0 |
20.0 |
37.2 |
7.6 |
78.2 |
24.8 |
103.0 |
| (=) |
Sustaining Cash Cost (Sold) |
94.5 |
15.8 |
(22.7) |
42.6 |
2.4 |
132.5 |
22.6 |
155.1 |
| |
Sustaining Cash Cost (Sold) (per ton) |
1,361.1 |
2,131.1 |
(480.7) |
1,722.2 |
525.9 |
864.4 |
0.0 |
1,011.7 |
| (+) |
Workers participation & Bonus |
1.2 |
0.4 |
4.3 |
2.3 |
0.9 |
9.2 |
|
9.2 |
| (+) |
Royalties |
1.2 |
0.4 |
2.8 |
1.3 |
0.4 |
5.9 |
|
5.9 |
| (+) |
Corporate G&A |
|
|
|
|
|
|
19.0 |
19.0 |
| (=) |
AISC (Sold) |
|
|
|
|
|
|
|
189.2 |
| (=) |
AISC (Sold) (per ton) |
|
|
|
|
|
|
|
1,234.4 |
| (=) |
AISC (Sold) in US$/lb |
|
|
|
|
|
|
|
0.56 |
Note: Cash cost and AISC per ton sold does not
include the impact of the cost of idleness capacity of US$2.7 million in El Porvenir in 1H24.
| | |
| | 56 |
1H23
| |
US$ million
(excepted indicated otherwise) |
Vazante |
Morro Agudo |
Cerro Lindo |
El Porvenir |
Atacocha |
Consolidation of Operations |
Corporate & Others |
Mining |
| |
Sales Volume (Zinc content in Products) |
|
|
|
|
|
|
|
|
| |
Tonnes |
72,393 |
10,401 |
32,301 |
28,941 |
4,628 |
148,663 |
0 |
148,663 |
| (+) |
COGS |
61.7 |
33.1 |
168.1 |
99.9 |
36.3 |
399.2 |
(3.3) |
395.9 |
| (+) |
On-site G&A |
0.2 |
0.2 |
0.2 |
0.2 |
0.1 |
1.0 |
0.0 |
1.0 |
| (-) |
By-products revenue |
(7.5) |
(13.0) |
(139.2) |
(70.5) |
(34.1) |
(264.4) |
7.0 |
(257.3) |
| (+) |
Treatment Charges |
56.9 |
6.8 |
16.5 |
17.0 |
2.7 |
100.0 |
0.0 |
100.0 |
| (+) |
Selling Expenses |
0.1 |
(0.3) |
1.3 |
0.4 |
0.1 |
1.6 |
0.0 |
1.6 |
| (-) |
Depreciation, amortization and depletion |
(11.5) |
(3.8) |
(41.9) |
(20.3) |
(8.0) |
(85.6) |
(0.0) |
(85.6) |
| (-) |
Royalties |
(1.1) |
(0.7) |
(0.7) |
(1.6) |
(0.2) |
(4.3) |
0.0 |
(4.3) |
| (-) |
Workers participation & Bonus |
(1.2) |
(0.6) |
(2.5) |
(1.9) |
(0.5) |
(6.6) |
0.0 |
(6.6) |
| (+) |
Others |
1.3 |
0.3 |
(7.8) |
(5.0) |
(2.5) |
(13.7) |
0.0 |
(13.7) |
| (=) |
Cash Cost (Sold) |
99.0 |
22.1 |
(5.8) |
18.1 |
(6.1) |
127.3 |
3.7 |
131.0 |
| |
Cash Cost (Sold) (per ton) |
1,368.0 |
2,120.1 |
(179.6) |
625.3 |
(1,312.9) |
856.3 |
0.0 |
881.2 |
| (+) |
Sustaining Capital Expenditure |
15.1 |
1.4 |
19.2 |
23.1 |
7.1 |
66.0 |
12.0 |
78.0 |
| (=) |
Sustaining Cash Cost (Sold) |
114.2 |
23.4 |
13.4 |
41.2 |
1.1 |
193.3 |
15.7 |
209.0 |
| |
Sustaining Cash Cost (Sold) (per ton) |
1,576.9 |
2,253.0 |
415.5 |
1,423.3 |
229.0 |
1,300.0 |
0.0 |
1,405.8 |
| (+) |
Workers participation & Bonus |
1.2 |
0.6 |
2.5 |
1.9 |
0.5 |
6.6 |
|
6.6 |
| (+) |
Royalties |
1.1 |
0.7 |
0.7 |
1.6 |
0.2 |
4.3 |
|
4.3 |
| (+) |
Corporate G&A |
|
|
|
|
|
|
22.0 |
22.0 |
| (=) |
AISC (Sold) |
|
|
|
|
|
|
|
241.9 |
| (=) |
AISC (Sold) (per ton) |
|
|
|
|
|
|
|
1,627.0 |
| (=) |
AISC (Sold) in US$/lb |
|
|
|
|
|
|
|
0.74 |
Note: Cash cost and AISC per ton sold does not
include the impact of the cost of idleness capacity of US$0.9 million in Atacocha and US$5.2 million in Cerro Lindo in 1H23.
| | |
| | 57 |
Conversion and
All in Sustaining Cash Cost | Smelting (2)
2Q24
| |
US$ million
(excepted indicated otherwise) |
Três Marias |
Juiz de Fora |
Cajamarquilla |
Consolidation of Operations |
Corporate |
Smelting |
| |
Sales Volume (Zinc content in Products) |
|
|
|
|
|
|
| |
Tonnes |
43,029 |
21,142 |
83,520 |
147,691 |
|
147,691 |
| (+) |
COGS |
127.0 |
65.7 |
262.1 |
454.8 |
(1.6) |
453.1 |
| (-) |
Cost of freight |
(3.8) |
(1.7) |
(10.7) |
(16.2) |
|
(16.2) |
| (+) |
On-site G&A |
0.5 |
0.3 |
1.2 |
2.0 |
0.0 |
2.0 |
| (-) |
Depreciation, amortization and depletion |
(5.0) |
(3.1) |
(10.2) |
(18.3) |
|
(18.3) |
| (-) |
By-products revenue |
(4.5) |
(7.0) |
(39.2) |
(50.7) |
1.6 |
(49.1) |
| (-) |
Workers participation & Bonus |
(1.9) |
(0.3) |
(2.6) |
(4.8) |
|
(4.8) |
| (+) |
Others |
3.3 |
2.7 |
16.2 |
22.2 |
|
22.2 |
| (=) |
Cash Cost (Sold) |
115.5 |
56.6 |
216.9 |
389.0 |
0.0 |
389.0 |
| |
Cash Cost (Sold) (per ton) |
2,684.7 |
2,676.4 |
2,596.6 |
2,633.7 |
|
2,633.7 |
| (+) |
Sustaining Capital Expenditure |
5.3 |
2.0 |
12.3 |
19.5 |
2.7 |
22.2 |
| (=) |
Sustaining Cash Cost (Sold) |
120.8 |
58.5 |
229.1 |
408.5 |
2.7 |
411.1 |
| |
Sustaining Cash Cost (Sold) (per ton) |
2,807.1 |
2,768.7 |
2,743.5 |
2,765.6 |
|
2,783.8 |
| (+) |
Workers participation & Bonus |
1.9 |
0.3 |
2.6 |
4.8 |
|
4.8 |
| (+) |
Corporate G&A |
|
|
|
|
5.4 |
5.4 |
| (=) |
AISC (Sold) |
|
|
|
|
|
421.3 |
| (=) |
AISC (Sold) (per ton) |
|
|
|
|
|
2,852.6 |
| (=) |
AISC (Sold) in US$/lb |
|
|
|
|
|
1.29 |
Note: Cash cost and AISC per ton sold does
not include the impact of the cost of metal purchased for resale.
| |
US$ million
(excepted indicated otherwise) |
Três Marias |
Juiz de Fora |
Cajamarquilla |
Smelting |
| |
Contained Zinc Sales |
|
|
|
|
| |
Tonnes |
43,029 |
21,142 |
83,520 |
147,691 |
| |
COGS |
127.0 |
65.7 |
262.1 |
454.8 |
| (-) |
Raw Material |
(65.8) |
(36.5) |
(180.6) |
(282.9) |
| (+) |
By product cost |
(13.9) |
(0.4) |
(6.7) |
(21.0) |
| (+/-) |
Consolidation effects |
(0.3) |
(0.3) |
(14.7) |
(15.3) |
| (+) |
Others |
(17.8) |
(9.6) |
(9.6) |
(37.0) |
| (=) |
Conversion Cost |
29.1 |
18.9 |
50.6 |
98.6 |
| (=) |
Conversion Cost in US$/t |
677.4 |
891.6 |
606.2 |
667.8 |
| (=) |
Conversion Cost in US$/lb |
0.31 |
0.40 |
0.27 |
0.30 |
(2) Our conversion cost, cash cost, sustaining
cash cost and AISC net of by-products credits are measured with respect to zinc sold.
| | |
| | 58 |
2Q23
| |
US$ million
(excepted indicated otherwise) |
Três Marias |
Juiz de Fora |
Cajamarquilla |
Consolidation of Operations |
Corporate |
Smelting |
| |
Sales Volume (Zinc content in Products) |
|
|
|
|
|
|
| |
Tonnes |
45,572 |
20,194 |
81,054 |
146,820 |
|
146,820 |
| (+) |
COGS |
131.5 |
66.6 |
218.1 |
416.2 |
(1.0) |
415.1 |
| (-) |
Cost of freight |
(5.1) |
(2.0) |
(9.1) |
(16.2) |
|
(16.2) |
| (+) |
On-site G&A |
0.3 |
0.2 |
1.3 |
1.7 |
0.0 |
1.7 |
| (-) |
Depreciation, amortization and depletion |
(4.9) |
(3.4) |
(10.6) |
(18.8) |
|
(18.8) |
| (-) |
By-products revenue |
(4.1) |
(6.1) |
(33.2) |
(43.4) |
1.0 |
(42.4) |
| (-) |
Workers participation & Bonus |
(0.5) |
(0.6) |
(1.0) |
(2.1) |
|
(2.1) |
| (+) |
Others |
0.8 |
0.5 |
24.7 |
25.9 |
|
25.9 |
| (=) |
Cash Cost (Sold) |
118.1 |
55.1 |
190.1 |
363.3 |
0.0 |
363.3 |
| |
Cash Cost (Sold) (per ton) |
2,590.7 |
2,727.8 |
2,345.7 |
2,474.3 |
|
2,474.3 |
| (+) |
Sustaining Capital Expenditure |
7.3 |
2.9 |
4.2 |
14.5 |
14.3 |
28.8 |
| (=) |
Sustaining Cash Cost (Sold) |
125.4 |
58.0 |
194.4 |
377.7 |
14.3 |
392.1 |
| |
Sustaining Cash Cost (Sold) (per ton) |
2,751.1 |
2,871.8 |
2,398.1 |
2,572.8 |
|
2,670.5 |
| (+) |
Workers participation & Bonus |
0.5 |
0.6 |
1.0 |
2.1 |
|
2.1 |
| (+) |
Corporate G&A |
|
|
|
|
5.4 |
5.4 |
| (=) |
AISC (Sold) |
|
|
|
|
|
399.5 |
| (=) |
AISC (Sold) (per ton) |
|
|
|
|
|
2,721.2 |
| (=) |
AISC (Sold) in US$/lb |
|
|
|
|
|
1.23 |
Note: Cash cost and AISC per ton sold does
not include the impact of the cost of metal purchased for resale.
| |
US$ million
(excepted indicated otherwise) |
Três Marias |
Juiz de Fora |
Cajamarquilla |
Smelting |
| |
Contained Zinc Sales |
|
|
|
|
| |
Tonnes |
45,572 |
20,194 |
81,054 |
146,820 |
| |
COGS |
131.5 |
66.6 |
218.1 |
416.2 |
| (-) |
Raw Material |
(60.8) |
(46.7) |
(156.3) |
(263.8) |
| (+) |
By product cost |
(19.7) |
(0.4) |
(7.6) |
(27.7) |
| (+/-) |
Consolidation effects |
2.1 |
5.1 |
(8.5) |
(1.3) |
| (+) |
Others |
(22.3) |
(4.2) |
7.7 |
(18.9) |
| (=) |
Conversion Cost |
30.8 |
20.4 |
53.4 |
104.5 |
| (=) |
Conversion Cost in US$/t |
675.1 |
1,008.5 |
658.3 |
711.7 |
| (=) |
Conversion Cost in US$/lb |
0.31 |
0.46 |
0.30 |
0.32 |
| | |
| | 59 |
1H24
| |
US$ million
(excepted indicated otherwise) |
Três Marias |
Juiz de Fora |
Cajamarquilla |
Consolidation of Operations |
Corporate |
Smelting |
| |
Sales Volume (Zinc content in Products) |
|
|
|
|
|
|
| |
Tonnes |
88,313 |
40,828 |
156,128 |
285,270 |
|
285,270 |
| (+) |
COGS |
242.3 |
124.9 |
463.6 |
830.8 |
(1.6) |
829.2 |
| (-) |
Cost of freight |
(7.0) |
(2.8) |
(21.9) |
(31.7) |
0.0 |
(31.7) |
| (+) |
On-site G&A |
1.0 |
0.5 |
2.6 |
4.1 |
0.0 |
4.1 |
| (-) |
Depreciation, amortization and depletion |
(10.2) |
(6.2) |
(20.7) |
(37.2) |
0.0 |
(37.2) |
| (-) |
By-products revenue |
(8.0) |
(12.6) |
(70.4) |
(91.0) |
1.6 |
(89.3) |
| (-) |
Workers participation & Bonus |
(4.1) |
(1.1) |
(3.7) |
(9.0) |
0.0 |
(9.0) |
| (+) |
Others |
4.0 |
3.0 |
14.4 |
21.3 |
0.0 |
21.3 |
| (=) |
Cash Cost (Sold) |
218.0 |
105.6 |
363.8 |
687.4 |
0.0 |
687.4 |
| |
Cash Cost (Sold) (per ton) |
2,468.1 |
2,585.9 |
2,330.4 |
2,409.6 |
|
2,409.6 |
| (+) |
Sustaining Capital Expenditure |
8.5 |
2.7 |
24.3 |
35.6 |
(5.6) |
29.9 |
| (=) |
Sustaining Cash Cost (Sold) |
226.5 |
108.3 |
388.2 |
722.9 |
(5.6) |
717.3 |
| |
Sustaining Cash Cost (Sold) (per ton) |
2,564.5 |
2,652.9 |
2,486.1 |
2,534.2 |
|
2,514.5 |
| (+) |
Workers participation & Bonus |
4.1 |
1.1 |
3.7 |
9.0 |
0.0 |
9.0 |
| (+) |
Corporate G&A |
|
|
|
0.0 |
12.3 |
12.3 |
| (=) |
AISC (Sold) |
|
|
|
0.0 |
|
738.6 |
| (=) |
AISC (Sold) (per ton) |
|
|
|
|
|
2,589.1 |
| (=) |
AISC (Sold) in US$/lb |
|
|
|
|
|
1.17 |
Note: Cash cost and AISC per ton sold does
not include the impact of the cost of metal purchased for resale.
| |
US$ million
(excepted indicated otherwise) |
Três Marias |
Juiz de Fora |
Cajamarquilla |
Smelting |
| |
Contained Zinc Sales |
|
|
|
|
| |
Tonnes |
88,313 |
40,828 |
156,128 |
285,270 |
| |
COGS |
242.3 |
124.9 |
463.6 |
830.8 |
| (-) |
Raw Material |
(121.2) |
(68.3) |
(322.4) |
(511.9) |
| (+) |
By product cost |
(29.0) |
(1.6) |
(13.9) |
(44.4) |
| (+/-) |
Consolidation effects |
1.5 |
(1.0) |
(26.4) |
(25.9) |
| (+) |
Others |
(36.2) |
(15.3) |
(6.5) |
(58.0) |
| (=) |
Conversion Cost |
57.5 |
38.8 |
94.4 |
190.7 |
| (=) |
Conversion Cost in US$/t |
650.6 |
949.8 |
604.9 |
668.4 |
| (=) |
Conversion Cost in US$/lb |
0.30 |
0.43 |
0.27 |
0.30 |
| | |
| | 60 |
1H23
| |
US$ million
(excepted indicated otherwise) |
Três Marias |
Juiz de Fora |
Cajamarquilla |
Consolidation of Operations |
Corporate |
Smelting |
| |
Sales Volume (Zinc content in Products) |
|
|
|
|
|
|
| |
Tonnes |
88,697 |
40,242 |
159,703 |
288,642 |
|
288,642 |
| (+) |
COGS |
269.7 |
137.6 |
478.7 |
886.0 |
(2.3) |
883.7 |
| (-) |
Cost of freight |
(10.0) |
(5.0) |
(24.0) |
(39.0) |
0.0 |
(39.0) |
| (+) |
On-site G&A |
0.6 |
0.3 |
2.6 |
3.5 |
0.0 |
3.5 |
| (-) |
Depreciation, amortization and depletion |
(9.5) |
(6.5) |
(21.6) |
(37.5) |
0.0 |
(37.5) |
| (-) |
By-products revenue |
(6.6) |
(12.7) |
(67.0) |
(86.3) |
2.3 |
(84.0) |
| (-) |
Workers participation & Bonus |
(0.8) |
(0.9) |
(4.8) |
(6.5) |
0.0 |
(6.5) |
| (+) |
Others |
3.6 |
2.0 |
29.2 |
34.7 |
0.0 |
34.7 |
| (=) |
Cash Cost (Sold) |
247.0 |
114.8 |
393.1 |
754.9 |
0.0 |
754.9 |
| |
Cash Cost (Sold) (per ton) |
2,785.3 |
2,852.4 |
2,461.2 |
2,615.3 |
|
2,615.3 |
| (+) |
Sustaining Capital Expenditure |
11.2 |
5.2 |
8.7 |
25.1 |
14.4 |
39.5 |
| (=) |
Sustaining Cash Cost (Sold) |
258.2 |
120.0 |
401.8 |
780.0 |
14.4 |
794.4 |
| |
Sustaining Cash Cost (Sold) (per ton) |
2,911.2 |
2,982.5 |
2,515.9 |
2,702.4 |
|
2,752.2 |
| (+) |
Workers participation & Bonus |
0.8 |
0.9 |
4.8 |
6.5 |
0.0 |
6.5 |
| (+) |
Corporate G&A |
|
|
|
0.0 |
12.7 |
12.7 |
| (=) |
AISC (Sold) |
|
|
|
0.0 |
|
813.6 |
| (=) |
AISC (Sold) (per ton) |
|
|
|
|
|
2,818.6 |
| (=) |
AISC (Sold) in US$/lb |
|
|
|
|
|
1.28 |
Note: Cash cost and AISC per ton sold does
not include the impact of the cost of metal purchased for resale.
| |
US$ million
(excepted indicated otherwise) |
Três Marias |
Juiz de Fora |
Cajamarquilla |
Smelting |
| |
Contained Zinc Sales |
|
|
|
|
| |
Tonnes |
88,697 |
40,242 |
159,703 |
288,642 |
| |
COGS |
269.7 |
137.6 |
478.7 |
886.0 |
| (-) |
Raw Material |
(145.7) |
(89.6) |
(355.6) |
(590.9) |
| (+) |
By product cost |
(32.6) |
(1.4) |
(14.4) |
(48.4) |
| (+/-) |
Consolidation effects |
3.1 |
6.3 |
(14.9) |
(5.5) |
| (+) |
Others |
(41.1) |
(8.6) |
9.9 |
(39.4) |
| (=) |
Conversion Cost |
53.4 |
44.3 |
103.7 |
201.5 |
| (=) |
Conversion Cost in US$/t |
602.0 |
1,101.9 |
649.4 |
697.9 |
| (=) |
Conversion Cost in US$/lb |
0.27 |
0.50 |
0.29 |
0.32 |
| | |
| | 61 |
Nexa Resources (NYSE:NEXA)
過去 株価チャート
から 7 2024 まで 8 2024

Nexa Resources (NYSE:NEXA)
過去 株価チャート
から 8 2023 まで 8 2024
