UNITED STATES
SECURITIES AND EXCHANGE COMMISSION
Washington, D.C. 20549
FORM 6-K
REPORT OF FOREIGN
PRIVATE ISSUER PURSUANT TO RULE 13a-16
OR 15d-16 UNDER THE SECURITIES EXCHANGE ACT OF 1934
For the month of August, 2024
Commission File Number: 001-35129
Arcos Dorados Holdings Inc.
(Exact name of
registrant as specified in its charter)
Río Negro 1338, First Floor
Montevideo, Uruguay, 11100
(Address of principal
executive office)
Indicate by check
mark whether the registrant files or will file annual reports under cover of Form 20-F or Form 40-F:
ARCOS DORADOS
HOLDINGS INC.
TABLE OF CONTENTS
| ITEM |
|
| 1. |
Press Release dated August 14, 2024 titled “Arcos Dorados Reports
Second Quarter Financial Results” |
SIGNATURE
Pursuant to the
requirements of the Securities Exchange Act of 1934, the registrant has duly caused this report to be signed on its behalf by the undersigned,
thereunto duly authorized.
| |
Arcos Dorados Holdings Inc. |
| |
|
| |
|
| |
By: |
/s/ Juan David Bastidas |
| |
|
Name: |
Juan David Bastidas |
| |
|
Title: |
Chief Legal Counsel |
Date:
August 14, 2024
Item 1
|
Arcos Dorados
2Q 2024
Results
|
 |
 |
|
August
14, 2024

 |
ARCOS DORADOS REPORTS SECOND QUARTER FINANCIAL RESULTS |
 |
| • | Total revenues of $1.1 billion in the quarter, up 6.8% in US dollars versus the prior year period. |
| • | Systemwide comparable sales¹ grew 40.8% year-over-year, including strong guest volume growth. |
| • | Digital channels (Mobile App, Delivery and Self-order Kiosks) accounted for more than 57% of systemwide
sales in the period, including 24% identified sales. |
| • | Loyalty Program implemented in three markets, grew to 11.2 million registered members2. |
| • | Consolidated Adjusted EBITDA¹ was $118.8 million, rising 7.9% year-over-year in US dollars. |
| • | Net Income was $26.6 million in the second quarter, or $0.13 per share. |
Montevideo, Uruguay,
August 14, 2024 – Arcos Dorados Holdings Inc. (NYSE: ARCO) (“Arcos Dorados” or the “Company”), Latin America
and the Caribbean’s largest restaurant chain and the world’s largest independent McDonald’s franchisee, today reported
unaudited results for the three and six months ended June 30, 2024.
 |
Second Quarter 2024 Highlights |
|
| • | Consolidated revenues totaled $1.1 billion, rising 6.8% in US dollars versus the prior year period. |
| • | Systemwide comparable sales¹ rose 40.8% versus the second quarter of 2023, or 10.2% and 2.4x blended
inflation, excluding Argentina. |
| • | Consolidated Adjusted EBITDA¹ of $118.8 million, grew 7.9% in US dollars year-over-year. |
| • | Net Debt to Adjusted EBITDA leverage ratio ended the second quarter unchanged at 1.2x from the end of
the first quarter of 2024. |
| • | The Company opened 15 Experience of the Future restaurants in the quarter, all of them free-standing,
including 10 in Brazil. |
| • | Digital channel sales growth was boosted by continued strong Delivery sales and expanding Loyalty Program
membership, leading to 24% identified sales in the quarter. |
1
For definitions, please refer to page 15 of this document.
2
As of July 31, 2024.
|
Message from Marcelo Rabach, Chief Executive Officer |
 |
We believe our second quarter 2024
results demonstrate our ability to perform strongly in any operating context. Sales and profitability growth through June have been consistent
with our strategy, especially when you consider the tougher-than-expected macroeconomic and consumer environments we are facing this year.
To manage through this period, we are focused on the factors we can control to minimize short-term volatility and maximize long-term growth.
Consolidated revenue rose 6.8% in the
second quarter, reaching the highest level ever for a second quarter in US dollars. Guest traffic growth continued to support comparable
sales growth even as consumers have become more discerning with their discretionary spending. This is where our omnichannel approach,
strong value proposition and operational excellence have established McDonald’s as the region’s favorite QSR brand.
Systemwide comparable sales growth
was 2.4x the Company’s blended inflation, excluding Argentina. According to our proprietary research, we expanded market share by
nearly three percentage points across the region, outpacing our nearest competitors by a wide margin.
The Three D’s Strategy of Digital,
Delivery and Drive-thru has set a new standard of quality, service and value for the quick service restaurant industry in Latin America
and the Caribbean. Today’s guests expect their QSR experience to be convenient and versatile, with multiple alternatives to receive
great service and high-quality food at a fair value.
And we are meeting their expectations
with sophisticated digital capabilities, a dedication to operational excellence, convenient free-standing restaurant locations and the
best menu offerings in the QSR industry. No other restaurant brand in the region can match these structural competitive advantages.
Additionally, the business model has
evolved in a way that allowed us to deliver the second-best EBITDA in US dollars for a second quarter in our history. We did this despite
macroeconomic and currency headwinds in some of our largest markets and even after adjusting for a positive impact from the reduction
of labor contingencies due to a favorable judgement in Brazil.
During the first half of 2024, we opened
37 Experience of the Future (EOTF) restaurants, including 34 free-standing locations. In our biggest market, Brazil, we added 21 EOTF
restaurants in the first half, including 20 new free-standing units.
We believe we are positioned to generate
sustainable US dollar cash flow growth by leveraging our structural competitive advantages. And Sustainability is about more than just
financial results. It is about making a positive impact on the communities we serve through our Recipe for the Future ESG platform. Because
it is the right thing to do, and it is good for business.
Finally, it is worth reminding you
that we operate in a highly underpenetrated region for both the QSR industry, as well as for the McDonald’s Brand. We see tremendous
growth potential ahead and will work to capture it, as strategically and profitably as possible.
 |
Consolidated |
| |
Results |
| |
 |

|
Consolidated Results |
|
| |
Figure
1. AD Holdings Inc Consolidated: Key Financial Results
(In millions of U.S. dollars, except as
noted)
|
|
| |
2Q23
(a) |
Currency Translation
(b) |
Constant
Currency
Growth
(c) |
2Q24
(a+b+c) |
% As Reported |
% Constant Currency |
| Total Restaurants (Units) |
2,317 |
|
|
2,395 |
|
|
| |
|
|
|
|
|
|
| Sales by Company-operated Restaurants |
994.5 |
(426.9) |
493.1 |
1,060.7 |
6.7% |
49.6% |
| Revenues from franchised restaurants |
46.0 |
(12.2) |
16.4 |
50.2 |
9.1% |
35.7% |
| Total Revenues |
1,040.5 |
(439.2) |
509.5 |
1,110.9 |
6.8% |
49.0% |
| Systemwide Comparable Sales |
|
|
|
|
|
40.8% |
| Adjusted EBITDA |
110.1 |
(11.2) |
19.9 |
118.8 |
7.9% |
18.1% |
| Adjusted EBITDA Margin |
10.6% |
|
|
10.7% |
0.1 p.p. |
|
| Net income (loss) attributable to AD |
28.4 |
43.7 |
(45.4) |
26.6 |
-6.1% |
-160.0% |
| No. of shares outstanding (thousands) |
210,626 |
|
|
210,660 |
|
|
| EPS (US$/Share) |
0.13 |
|
|
0.13 |
|
|
Arcos Dorados’ total revenues
reached $1.1 billion, up 6.8% in US dollars versus the prior year quarter, despite the challenging macroeconomic and consumer environments
in the region, the significant negative impact on results from the Argentina business and the depreciation of the Brazilian real during
the quarter.
Systemwide comparable sales rose 40.8%
with most markets increasing sales above local inflation, including positive guest volumes. The Company’s systemwide comparable
sales grew 2.4x blended inflation for the period, excluding Argentina.
The Three-D’s strategy (Digital,
Delivery and Drive-thru) together with the industry’s most compelling value proposition, drove guest volume and sales growth in
the quarter. This led to continued market share gains for the McDonald’s Brand throughout the region. According to the Company’s
proprietary research, market share expanded by nearly three percentage points compared with the prior year period, across the Company’s
operating footprint.
Off-premise sales (Delivery and Drive-thru)
rose 11% in US dollars versus the prior year, and represented 45% of systemwide sales in the second quarter of 2024. On-premise sales
(front counter, self-order kiosks, dessert centers and McCafé) grew 4% in US dollars year-over-year, accounting for 55% of systemwide
sales in the quarter.
The Company’s Digital platform
offered guests the ability to choose their preferred experience, whether through the convenience of self-order kiosks in the Company’s
restaurants or through Mobile App functionalities, such as Own Delivery and Mobile Order and Pay. Digital channel sales grew 24% versus
the prior year and reached 57% of systemwide sales, strongly contributing to topline performance in the quarter.
As of the end of June 2024, Arcos Dorados’
Customer Relationship Management platform had about 90 million unique registered users and the Mobile App surpassed 130 million cumulative
downloads, reaching more than 21 million monthly active users in the quarter. Loyalty Program members’ visit frequency was 1.5 to
2.0x that of non-Loyalty guests in the period, with healthy levels of both 90-day active customers and redemption rates. During the quarter,
identified sales represented 24% of total sales, compared with 19% in the prior year quarter.
|
2Q24 Adjusted EBITDA Bridge |
|
| |
($
million) |
|
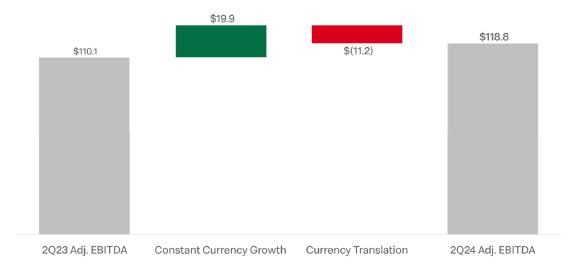
Second quarter consolidated Adjusted
EBITDA reached $118.8 million, up 7.9% in US dollars over the prior year quarter. The result included a $16.0 million positive impact
from the reduction of labor contingencies due to a favorable judgement in Brazil. Excluding this positive impact, Adjusted EBITDA was
still the second highest US dollar result for a second quarter in Arcos Dorados’ history.
Consolidated Adjusted EBITDA margin
was 10.7%, relatively flat versus the 10.6% EBITDA margin registered in the prior year. This included lower Food and Paper (F&P) costs
as a percentage of revenue, driven by a better gross margin in Brazil, coupled with operating leverage in General and Administrative expenses
(G&A) in all divisions when compared with the prior year.
These effects were partially offset
by higher Occupancy & Other Operating expenses as a percentage of revenue in the second quarter, explained by an increase in expenses
related to delivery fees and utilities as well as expenses related to running and maintaining the Company’s information technology
tools and capabilities.
|
Notable items in the Adjusted EBITDA reconciliation |
|
Included in Adjusted EBITDA:
Brazil’s result in the second quarter of 2024 included a $16.0 million positive impact from the reduction of labor contingencies
due to a favorable judgement.
Adjusted EBITDA in the second quarter
2024 and second quarter 2023 included a $4.2 million and a $4.0 million gain, respectively, from the sale of restaurants to sub-franchisees
in Chile.
Excluded from Adjusted EBITDA:
There were no notable items excluded from Adjusted EBITDA in either the second quarter of 2024 or the second quarter of 2023.
|
Non-operating Results |
|
Arcos Dorados’ non-operating
results for the second quarter included a net interest expense of $14.1 million and a $14.9 million loss from non-cash foreign exchange
and derivative instruments. The Company recorded an income tax expense of $18.1 million in the quarter.
Net income attributable to the Company
totaled $26.6 million, or $0.13 per share, in the second quarter of 2024. Total weighted average shares for the second quarter of 2024
amounted to 210,660,444 compared to 210,625,859 in the prior year’s quarter.
 |
Divisional |
| |
Results |
| |
|

|
Brazil Division |
|
| |
Figure
2. Brazil Division: Key Financial Results
(In
millions of U.S. dollars, except as noted)
|
|
| |
2Q23
(a) |
Currency Translation
(b) |
Constant
Currency
Growth
(c) |
2Q24
(a+b+c) |
% As Reported |
% Constant Currency |
| Total Restaurants (Units) |
1,098 |
|
|
1,150 |
|
|
| |
|
|
|
|
|
|
| Total Revenues |
405.2 |
(24.6) |
61.4 |
442.0 |
9.1% |
15.2% |
| Systemwide Comparable Sales |
|
|
|
|
|
10.2% |
| Adjusted EBITDA |
69.1 |
(4.3) |
21.4 |
86.2 |
24.6% |
30.9% |
| Adjusted EBITDA Margin |
17.1% |
|
|
19.5% |
2.4 p.p. |
|
Brazil’s revenues increased 9.1%
year-over-year, reaching $442.0 million, despite the material devaluation of the Brazilian real during the second quarter. Systemwide
comparable sales rose 10.2% year-over-year, or 2.6x inflation in the period, with a strong guest traffic contribution.
Digital sales rose 23% versus the prior
year and generated almost 70% of the division’s systemwide sales in the period, including 28% identified sales in the quarter. Delivery
sales rose 28% in US dollars versus the prior year and reached a new quarterly sales record in the country. Off-premise channel sales
represented 43% of Brazil’s systemwide sales in the quarter.
The Loyalty program “Meu Méqui”
continues to drive guest frequency, with a higher average check. The Company continued to invest in the attractiveness of the program,
which accumulated more than 10.5 million registered members at the end of July 2024, up from 8 million at the end of April 2024.
Brazil’s marketing campaigns
included strong Happy Meal properties such as Inside Out 2 to boost the family business. Arcos Dorados continued sponsoring Big Brother
Brazil, the country’s most popular reality TV program, with associated promotions to support the chicken category. The Company also
ran promotions and limited time offers to strengthen brand affinity with menu favorites such as McFish, McFries, Tasty Sauce and desserts.
As reported Adjusted EBITDA in the division
reached $86.2 million in the quarter, rising 24.6% versus the prior year in US dollars. Adjusted EBITDA margin was 19.5%, including lower
F&P costs as a percentage of revenue and efficiencies in both Payroll and G&A due to strong sales growth above inflation in the
division. The Adjusted EBITDA margin also benefited from a positive impact from the reduction of labor contingencies due to a favorable
judgement in this market.
|
North Latin American Division (NOLAD) |
|
| |
Figure
3. NOLAD Division: Key Financial Results
(In
millions of U.S. dollars, except as noted)
|
|
| |
2Q23
(a) |
Currency Translation
(b) |
Constant
Currency
Growth
(c) |
2Q24
(a+b+c) |
% As Reported |
% Constant Currency |
| Total Restaurants (Units) |
639 |
|
|
649 |
|
|
| |
|
|
|
|
|
|
| Total Revenues |
277.6 |
4.8 |
27.8 |
310.2 |
11.7% |
10.0% |
| Systemwide Comparable Sales |
|
|
|
|
|
7.9% |
| Adjusted EBITDA |
28.2 |
0.3 |
(2.4) |
26.2 |
-7.3% |
-8.5% |
| Adjusted EBITDA Margin |
10.2% |
|
|
8.4% |
-1.8 p.p. |
|
As reported revenues in NOLAD totaled
$310.2 million, up 11.7% in US dollars versus the prior year quarter. Systemwide comparable sales rose 7.9% year-over-year, despite a
challenging comparison with the same period last year, which included strong sales during Holy Week.
Systemwide sales increased 2.5x the
division’s blended inflation in the period, with sales growing above inflation in most markets and particularly strong traffic growth
in Panama, Mexico and the French West Indies.
Arcos Dorados continued to invest in
the modernization and digitalization of its restaurants in the division. As a result, digital sales grew 61% versus the prior year and
represented 39% of systemwide sales in the quarter, benefiting from a significant increase in sales through Delivery and self-order kiosks
versus the previous year. Identified sales almost doubled compared to the same quarter last year, driven by continued customer lifecycle
management efforts, coupled with increasing digital campaigns and the recent launch of the Loyalty Program in Costa Rica.
NOLAD’s marketing initiatives
included the launch of Best Burger in Mexico, leading to a robust comparable unit volume growth for the Big Mac, cheeseburger and the
Quarter Pounder with cheese, in the country. Happy Meal sales also performed strongly in the quarter with properties such as Inside Out
2 and Minions. Arcos Dorados combined the regional Formula One sponsorship with the indulgent Grands platform to drive growth in the Three
D’s. Finally, the Company introduced new menu offerings in the important chicken and dessert categories in several of the division’s
markets.
As reported Adjusted EBITDA in the
division was $26.2 million in the quarter, down 7.3% versus the prior year in US dollars. Adjusted EBITDA margin declined by 180 basis
points in the quarter, primarily due to the impact of higher Payroll expenses as well as an increase in Occupancy & Other Operating
expenses. These were partially offset by operating leverage in G&A expenses.
|
South Latin American Division (SLAD) |
|
| |
Figure
4. SLAD Division: Key Financial Results
(In
millions of U.S. dollars, except as noted)
|
|
| |
2Q23
(a) |
Currency Translation
(b) |
Constant
Currency
Growth
(c) |
2Q24
(a+b+c) |
% As Reported |
% Constant Currency |
| Total Restaurants (Units) |
580 |
|
|
596 |
|
|
| |
|
|
|
|
|
|
| Total Revenues |
357.7 |
(419.3) |
420.3 |
358.7 |
0.3% |
117.5% |
| Systemwide Comparable Sales |
|
|
|
|
|
113.4% |
| Adjusted EBITDA |
36.9 |
(30.5) |
24.2 |
30.6 |
-17.1% |
65.7% |
| Adjusted EBITDA Margin |
10.3% |
|
|
8.5% |
-1.8 p.p. |
|
As reported revenues in SLAD totaled
$358.7 million, driven by an 113.4% increase in systemwide comparable sales versus the prior year, which includes the impact of Argentina
and Venezuela’s high inflation rates. Excluding Argentina, the division’s systemwide comparable sales grew 2.0x blended inflation,
driven by Chile, Colombia, Uruguay and Venezuela.
The division’s results in the
second quarter reflect a more challenging consumer environment, as well as significant macroeconomic and currency headwinds in Argentina.
Against this backdrop, the Company focused on leveraging its competitive advantages to strengthen value perception and brand preference
among guests.
Digital sales represented 56% of systemwide
sales in SLAD, leading to a jump in identified sales across its markets, mainly due to the continued increase in sales penetration from
Delivery and Own Delivery together with the strong performance of the Mobile Order and Pay functionality on the Mobile App. The nationwide
launch of the Loyalty Program in Uruguay at the end of April of 2024 drove improvements in guest frequency and record levels of identified
sales.
SLAD’s marketing activities included
attractive Happy Meal offerings across the division, chicken-focused promotions in Chile, and innovations in the dessert category in Colombia.
In addition, Arcos Dorados drove sales by focusing on the sports passion point during the Copa America tournament with activations related
to local football federation sponsorships.
As reported Adjusted EBITDA totaled
$30.6 million in the second quarter and Adjusted EBITDA margin contracted 180 basis points versus the prior year quarter. The division’s
Adjusted EBITDA was positively impacted by operating leverage in G&A expenses and a relatively flat Payroll and F&P expenses as
a percentage of revenue, despite the challenging environment in Argentina. These were offset by higher Occupancy & Other Operating
expenses as a percentage of revenue.
|
New Unit Development |
|
| |
Figure
5. Total Restaurants (end of period)* |
|
| |
June
2024 |
March
2024 |
December
2023 |
September
2023 |
June
2023 |
| Brazil |
1,150 |
1,141 |
1,130 |
1,113 |
1,098 |
| NOLAD |
649 |
647 |
647 |
638 |
639 |
| SLAD |
596 |
593 |
584 |
588 |
580 |
| TOTAL |
2,395 |
2,381 |
2,361 |
2,339 |
2,317 |
*Considers Company-operated and franchised
restaurants at period-end
Figure
6. Footprint as of June 30, 2024
| |
Store
Type* |
Total
Restaurants |
Ownership |
McCafes |
Dessert
Centers |
| |
FS |
IS |
MS
& FC |
Company
Operated |
Franchised |
| Brazil |
599 |
91 |
460 |
1,150 |
706 |
444 |
114 |
2,002 |
| NOLAD |
408 |
48 |
193 |
649 |
495 |
154 |
19 |
519 |
| SLAD |
250 |
125 |
221 |
596 |
503 |
93 |
201 |
733 |
| TOTAL |
1,257 |
264 |
874 |
2,395 |
1,704 |
691 |
334 |
3,254 |
FS: Free-Standing; IS: In-Store; MS: Mall
Store; FC: Food Court.
During the second quarter of 2024,
the Company opened 15 Experience of the Future (EOTF) restaurants, all of them free-standing units, including 10 restaurants in Brazil.
At the end of June, 52% of Arcos Dorados’
restaurant footprint was made up of free-standing units and the Company plans to continue focusing its investments on this format to offer
guests the most complete McDonald’s restaurant experience while leveraging the incrementality of Drive-thru and Delivery sales to
continue capturing the highest sales volume per restaurant in the region.
During the second quarter, the Company
continued investing in the modernization of existing restaurants and, as of the end of June 2024, there were 1,471 EOTF restaurants making
up 61% of the Company’s total footprint.
Arcos Dorados’ restaurant development
plan remains on track, with a strong pipeline of restaurant openings and modernizations underway in the second semester.
|
Balance Sheet & Cash Flow Highlights |
|
| |
Figure
7. Consolidated Debt and Financial Ratios
(In
thousands of U.S. dollars, except ratios)
|
|
| |
June 30, |
December 31, |
| 2024 |
2023 |
| Total Cash & cash equivalents (i) |
139,356 |
246,767 |
| Total Financial Debt (ii) |
716,434 |
728,093 |
| Net Financial Debt (iii) |
577,078 |
481,326 |
| LTM Adjusted EBITDA |
489,461 |
472,304 |
| Total Financial Debt / LTM Adjusted EBITDA ratio |
1.5 |
1.5 |
| Net Financial Debt / LTM Adjusted EBITDA ratio |
1.2 |
1.0 |
| (i) | Total
cash & cash equivalents include short-term investment. |
| (ii) | Total
financial debt includes short-term debt, long-term debt, accrued interest payable and derivative
instruments (including the asset portion of derivatives amounting to $64.7 million and $46.5
million as a reduction of financial debt as of June 30, 2024 and December 31, 2023, respectively). |
| (iii) | Net
financial debt equals total financial debt less total cash & cash equivalents. |
As of June 30, 2024, total cash and
cash equivalents were $139.4 million and total financial debt (including the net derivative instrument position) was $716.4 million. Net
debt (total financial debt minus total cash and cash equivalents) was $577.1 million, up from $481.3 million at the end of 2023, due to
the lower cash balance.
The net debt to Adjusted EBITDA leverage
ratio ended the quarter at 1.2x, unchanged from the end of the first quarter 2024.
On April 15, 2024, the Company entered
into a revolving credit facility with Itaú Unibanco S.A., Nassau Branch, for up to $25 million that matures on April 14, 2025.
Each loan under this agreement will bear interest at an annual rate equal to Term SOFR plus a range of between 2.65% and 4.85%.
Net cash generated from operating activities
for the six months ended June 30, 2024, totaled $63.7 million. Cash used in net investing activities totaled $134.0 million, including
capital expenditures of $148.9 million. Net cash used in financing activities was $17.6 million, which included $25.3 million corresponding
to the first two installments of the 2024 dividend.
 |
Recent |
| |
Developments |
| |
|

|
Master Franchise Agreement |
|
On August 1, 2024, Arcos Dorados Holdings Inc. received
a Renewal Notice from McDonald’s to replace the parties’ existing Master Franchise Agreement (MFA) with a new, 20-year Master
Franchise Agreement, to be effective as of January 1, 2025. The parties are working to finalize the terms of this new MFA and will communicate
additional progress in the renewal process as appropriate and in line with the requirements of the US Securities and Exchange Commission.
|
Second Quarter 2024 Earnings Webcast |
|
A webcast to discuss the information contained in
this press release will be held today, August 14, 2024, at 10:00 a.m. ET. In order to access the webcast, members of the investment community
should follow this link: Arcos Dorados Second Quarter 2024 Earnings Webcast.
A
replay of the webcast will be available later today in the investor section of the Company’s website: www.arcosdorados.com/ir.
|
Investor Relations
Contact
Dan Schleiniger
VP of Investor Relations
Arcos Dorados
daniel.schleiniger@mcd.com.uy
|
Media Contact
David Grinberg
VP of Corporate Communications
Arcos Dorados
david.grinberg@mcd.com.uy
|
| |
|
| |
|
| Follow us on: |
 |
|
Definitions |
|
In analyzing business trends, management
considers a variety of performance and financial measures which are considered to be non-GAAP including: Adjusted EBITDA, Constant Currency
basis, Systemwide sales, and Systemwide comparable sales growth.
Adjusted EBITDA: In addition
to financial measures prepared in accordance with the general accepted accounting principles (GAAP), this press release and the accompanying
tables use a non-GAAP financial measure titled ‘Adjusted EBITDA’. Management uses Adjusted EBITDA to facilitate operating
performance comparisons from period to period.
Adjusted EBITDA is defined as the Company’s
operating income plus depreciation and amortization plus/minus the following losses/gains included within other operating income (expenses),
net, and within general and administrative expenses on the statement of income: gains from sale or insurance recovery of property and
equipment, write-offs of long-lived assets, and impairment of long-lived assets.
Management believes Adjusted EBITDA
facilitates company-to-company operating performance comparisons by backing out potential differences caused by variations such as capital
structures (affecting net interest expense and other financing results), taxation (affecting income tax expense) and the age and book
depreciation of facilities and equipment (affecting relative depreciation expense), which may vary for different companies for reasons
unrelated to operating performance. Figure 8 of this earnings release includes a reconciliation for Adjusted EBITDA. For more information,
please see Adjusted EBITDA reconciliation in Note 9 – Segment and geographic information – of our financial statements (6-K
Form) filed today with the S.E.C.
Constant Currency basis: refers
to amounts calculated using the same exchange rate over the periods under comparison to remove the effects of currency fluctuations from
this trend analysis. To better discern underlying business trends, this release uses non-GAAP financial measures that segregate year-over-year
growth into two categories: (i) currency translation and (ii) constant currency growth. (i) Currency translation reflects the impact on
growth of the appreciation or depreciation of the local currencies in which the Company conducts its business against the US dollar (the
currency in which the Company’s financial statements are prepared). (ii) Constant currency growth reflects the underlying growth
of the business excluding the effect from currency translation. The Company also calculates variations as a percentage in constant currency,
which are also considered to be non-GAAP measures, to provide a more meaningful analysis of its business by identifying the underlying
business trends, without distortion from the effect of foreign currency fluctuations.
Systemwide sales: Systemwide
sales represent measures for both Company-operated and sub-franchised restaurants. While sales by sub-franchisees are not recorded as
revenues by the Company, management believes the information is important in understanding its financial performance because these sales
are the basis on which it calculates and records sub-franchised restaurant revenues and are indicative of the financial health of its
sub-franchisee base.
Systemwide comparable sales growth:
this non-GAAP measure, refers to the change, on a constant currency basis, in Company-operated and sub-franchised restaurant sales in
one period from a comparable period for restaurants that have been open for thirteen months or longer (year-over-year basis) including
those temporarily closed. Management believes it is a key performance indicator used within the retail industry and is indicative of the
success of the Company’s initiatives as well as local economic, competitive and consumer trends. Sales by sub-franchisees are not
recorded as revenues by the Company.
|
About Arcos Dorados |
|
Arcos
Dorados is the world’s largest independent McDonald’s franchisee, operating the largest quick service restaurant chain in
Latin America and the Caribbean. It has the exclusive right to own, operate and grant franchises of McDonald’s restaurants in 20
Latin American and Caribbean countries and territories with more than 2,350 restaurants, operated by the Company or by its sub-franchisees,
that together employ more than 100 thousand people (as of 06/30/2024). The Company is also committed to the development of the communities
in which it operates, to providing young people their first formal job opportunities and to utilize its Recipe
for the Future to achieve a positive environmental impact. Arcos Dorados is listed for trading on the New York Stock
Exchange (NYSE: ARCO). To learn more about the Company, please visit the Investors section of our website: www.arcosdorados.com/ir.
|
Cautionary Statement on Forward-Looking Statements |
This press release contains forward-looking statements.
The forward-looking statements contained herein include statements about the Company’s business prospects, its ability to attract
customers, its expectation for revenue generation, its outlook and guidance for 2024 and the renewal of its Master Franchise Agreement
with McDonald’s. These statements are subject to the general risks inherent in Arcos Dorados' business. These expectations may or
may not be realized. Some of these expectations may be based upon assumptions or judgments that prove to be incorrect. In addition, Arcos
Dorados' business and operations involve numerous risks and uncertainties, many of which are beyond the control of Arcos Dorados, which
could result in Arcos Dorados' expectations not being realized or otherwise materially affect the financial condition, results of operations
and cash flows of Arcos Dorados. Additional information relating to the uncertainties affecting Arcos Dorados' business is contained in
its filings with the Securities and Exchange Commission. The forward-looking statements are made only as of the date hereof, and Arcos
Dorados does not undertake any obligation to (and expressly disclaims any obligation to) update any forward-looking statements to reflect
events or circumstances after the date such statements were made, or to reflect the occurrence of unanticipated events.
|
Second Quarter 2024 Consolidated Results |
|
| |
Figure
8. Second Quarter 2024 Consolidated Results
(In
thousands of U.S. dollars, except per share data)
|
|
| |
For Three-Months ended |
For Six-Months ended |
| |
June 30, |
June 30, |
| |
2024 |
2023 |
2024 |
2023 |
| REVENUES |
|
|
|
|
| Sales by Company-operated restaurants |
1,060,709 |
994,530 |
2,092,131 |
1,940,884 |
| Revenues from franchised restaurants |
50,192 |
45,991 |
100,126 |
90,429 |
| Total Revenues |
1,110,901 |
1,040,521 |
2,192,257 |
2,031,313 |
| OPERATING COSTS AND EXPENSES |
|
|
|
|
| Company-operated restaurant expenses: |
|
|
|
|
| Food and paper |
(372,926) |
(351,745) |
(733,913) |
(685,611) |
| Payroll and employee benefits |
(193,538) |
(194,065) |
(395,498) |
(379,382) |
| Occupancy and other operating expenses |
(315,558) |
(278,997) |
(614,611) |
(542,720) |
| Royalty fees |
(66,361) |
(58,520) |
(131,364) |
(115,259) |
| Franchised restaurants - occupancy expenses |
(20,285) |
(20,420) |
(42,275) |
(38,629) |
| General and administrative expenses |
(72,954) |
(69,526) |
(141,612) |
(135,118) |
| Other operating income, net |
4,940 |
7,644 |
8,786 |
6,583 |
| Total operating costs and expenses |
(1,036,682) |
(965,629) |
(2,050,487) |
(1,890,136) |
| Operating income |
74,219 |
74,892 |
141,770 |
141,177 |
| Net interest expense and other financing results |
(14,141) |
(12,128) |
(30,579) |
(21,987) |
| Gain / (Loss) from derivative instruments |
3,182 |
(9,191) |
1,249 |
(14,120) |
| Foreign currency exchange results |
(18,117) |
13,662 |
(19,115) |
20,945 |
| Other non-operating income / (expenses), net |
(223) |
116 |
(652) |
6 |
| Income before income taxes |
44,920 |
67,351 |
92,673 |
126,021 |
| Income tax expense, net |
(18,145) |
(38,824) |
(37,106) |
(59,850) |
| Net income |
26,775 |
28,527 |
55,567 |
66,171 |
| Net income attributable to non-controlling interests |
(143) |
(159) |
(426) |
(396) |
| Net income attributable to Arcos Dorados Holdings Inc. |
26,632 |
28,368 |
55,141 |
65,775 |
| Earnings per share information ($ per share): |
|
|
|
|
| Basic net income per common share |
$ 0.13 |
$ 0.13 |
$ 0.26 |
$
0.31 |
| Weighted-average number of common shares outstanding-Basic |
210,660,444 |
210,625,859 |
210,658,096 |
210,610,288 |
| Adjusted EBITDA Reconciliation |
|
|
|
|
| Operating income |
74,219 |
74,892 |
141,770 |
141,177 |
| Depreciation and amortization |
45,202 |
35,000 |
88,293 |
68,520 |
| Operating charges excluded from EBITDA computation |
(639) |
164 |
(2,346) |
863 |
| Adjusted EBITDA |
118,782 |
110,056 |
227,717 |
210,560 |
| Adjusted EBITDA Margin as % of total revenues |
10.7 % |
10.6 % |
10.4 % |
10.4 % |
|
Second Quarter 2024 Results by Division |
|
| |
Figure
9. Second Quarter 2024 Consolidated Results by Division
(In
thousands of U.S. dollars)
|
|
| |
For
Three-Months ended |
as |
Constant |
For
Six-Months ended |
as |
Constant |
| |
June
30, |
reported |
Currency |
June
30, |
reported |
Currency |
| |
2024 |
2023 |
Incr/(Decr)% |
Incr/(Decr)% |
2024 |
2023 |
Incr/(Decr)% |
Incr/(Decr)% |
| Revenues |
|
|
|
|
|
|
|
|
| Brazil |
441,990 |
405,199 |
9.1
% |
15.2% |
890,927 |
779,397 |
14.3
% |
14.8% |
| NOLAD |
310,205 |
277,590 |
11.7
% |
10.0% |
612,926 |
536,856 |
14.2
% |
10.5% |
| SLAD |
358,706 |
357,732 |
0.3% |
117.5% |
688,404 |
715,060 |
-3.7% |
112.1% |
| TOTAL |
1,110,901 |
1,040,521 |
6.8
% |
49.0% |
2,192,257 |
2,031,313 |
7.9
% |
47.9% |
| |
|
|
|
|
|
|
|
|
| Operating
Income (loss) |
|
|
|
|
|
|
|
|
| Brazil |
68,194 |
52,912 |
28.9
% |
35.2% |
125,236 |
97,002 |
29.1
% |
29.9% |
| NOLAD |
13,191 |
18,410 |
-28.3% |
-29.1% |
31,174 |
32,357 |
-3.7% |
-7.3% |
| SLAD |
19,719 |
29,452 |
-33.0% |
25.2% |
34,161 |
62,914 |
-45.7% |
8.3% |
| Corporate
and Other |
(26,885) |
(25,882) |
-3.9% |
-97.5% |
(48,801) |
(51,096) |
4.5% |
-103.6% |
| TOTAL |
74,219 |
74,892 |
-0.9% |
-6.0% |
141,770 |
141,177 |
0.4
% |
-15.0% |
| |
|
|
|
|
|
|
|
|
| Adjusted
EBITDA |
|
|
|
|
|
|
|
|
| Brazil |
86,168 |
69,129 |
24.6
% |
30.9% |
161,614 |
128,602 |
25.7
% |
26.3% |
| NOLAD |
26,161 |
28,210 |
-7.3% |
-8.5% |
54,763 |
51,910 |
5.5
% |
1.9% |
| SLAD |
30,571 |
36,874 |
-17.1% |
65.7% |
55,312 |
77,590 |
-28.7% |
47.3% |
| Corporate
and Other |
(24,118) |
(24,157) |
0.2% |
-96.4% |
(43,972) |
(47,542) |
7.5% |
-105.3% |
| TOTAL |
118,782 |
110,056 |
7.9
% |
18.1% |
227,717 |
210,560 |
8.1
% |
10.2% |
Figure
10. Average Exchange Rate per Quarter*
| |
Brazil |
Mexico |
Argentina |
| 2Q24 |
5.22 |
17.26 |
885.90 |
| 2Q23 |
4.95 |
17.68 |
231.76 |
*
Local $ per 1 US$
|
Summarized Consolidated Balance Sheet |
|
| |
Figure
11. Summarized Consolidated Balance Sheet
(In
thousands of U.S. dollars)
|
|
| |
June 30, |
December 31, |
| |
2024 |
2023 |
| ASSETS |
|
|
| Current assets |
|
|
| Cash and cash equivalents |
104,216 |
196,661 |
| Short-term investments |
35,140 |
50,106 |
| Accounts and notes receivable, net |
141,156 |
147,980 |
| Other current assets (1) |
232,257 |
210,531 |
| Derivative instruments |
364 |
— |
| Total current assets |
513,133 |
605,278 |
| Non-current assets |
|
|
| Property and equipment, net |
1,104,280 |
1,119,885 |
| Net intangible assets and goodwill |
66,930 |
70,026 |
| Deferred income taxes |
102,709 |
98,163 |
| Derivative instruments |
64,309 |
46,486 |
| Equity method investments |
17,483 |
18,111 |
| Leases right of use asset |
927,721 |
954,564 |
| Other non-current assets (2) |
99,458 |
106,725 |
| Total non-current assets |
2,382,890 |
2,413,960 |
| Total assets |
2,896,023 |
3,019,238 |
| LIABILITIES AND EQUITY |
|
|
| Current liabilities |
|
|
| Accounts payable |
332,993 |
374,986 |
| Taxes payable (3) |
168,498 |
163,143 |
| Accrued payroll and other liabilities |
144,292 |
142,487 |
| Royalties payable to McDonald’s Corporation |
19,843 |
21,292 |
| Provision for contingencies |
1,360 |
1,447 |
| Interest payable |
8,048 |
7,447 |
| Financial debt (4) |
48,462 |
37,361 |
| Operating lease liabilities |
93,122 |
93,507 |
| Total current liabilities |
816,618 |
841,670 |
| Non-current liabilities |
|
|
| Accrued payroll and other liabilities |
20,686 |
27,513 |
| Provision for contingencies |
32,146 |
49,172 |
| Financial debt (5) |
724,597 |
729,771 |
| Deferred income taxes |
1,598 |
1,166 |
| Operating lease liabilities |
829,850 |
853,107 |
| Total non-current liabilities |
1,608,877 |
1,660,729 |
| Total liabilities |
2,425,495 |
2,502,399 |
| Equity |
|
|
| Class A shares of common stock |
389,967 |
389,907 |
| Class B shares of common stock |
132,915 |
132,915 |
| Additional paid-in capital |
8,659 |
8,719 |
| Retained earnings |
570,772 |
566,188 |
| Accumulated other comprehensive loss |
(613,597) |
(563,081) |
| Common stock in treasury |
(19,367) |
(19,367) |
| Total Arcos Dorados Holdings Inc shareholders’ equity |
469,349 |
515,281 |
| Non-controlling interest in subsidiaries |
1,179 |
1,558 |
| Total equity |
470,528 |
516,839 |
| Total liabilities and equity |
2,896,023 |
3,019,238 |
| (1) | Includes
"Other receivables", "Inventories" and "Prepaid expenses and other
current assets”. |
| (2) | Includes
"Miscellaneous" and "Collateral deposits". |
| (3) | Includes
"Income taxes payable" and "Other taxes payable". |
| (4) | Includes
"Short-term debt”, “Current portion of long-term debt" and "Derivative
instruments”. |
| (5) | Includes
"Long-term debt, excluding current portion" and "Derivative instruments". |
Thank
you!
|
|

Arcos Dorados (NYSE:ARCO)
過去 株価チャート
から 12 2024 まで 1 2025

Arcos Dorados (NYSE:ARCO)
過去 株価チャート
から 1 2024 まで 1 2025
