US Market News
2月前
US Market News
2月前
Vermilion Energy Inc. Reports Strong Q1 2026 Operational and Financial Results and Continued Debt ReductionMay 6, 2026 6:01 AM
PR Newswire (US) CALGARY, AB, May 6, 2026 /PRNewswire/ - Vermilion Energy Inc. ("Vermilion", "We", "Our", "Us" or the "Company") (TSX: VET) (NYSE: VET) is pleased to report operating and condensed financial results for the three months ended March 31, 2026. The unaudited interim financial statements and management discussion and analysis for the three months ended March 31, 2026 will be available on the System for Electronic Document Analysis and Retrieval Plus ("SEDAR+") at www.sedarplus.ca, on EDGAR at www.sec.gov/edgar.shtml, and on Vermilion's website at www.vermilionenergy.com.HighlightsQ1 2026 ResultsGenerated $232 million ($1.52/basic share)(2) of fund flows from operations ("FFO")(1) and $98 million of free cash flow ("FCF")(6), fully funding $135 million of exploration and development ("E&D") capital expenditures(3) while strengthening the balance sheet and returning cash to shareholders.Cost structure of controllable expenses reduced by 25% in Q1 2026 from Q1 2025 reflecting the impact of recent asset repositioning and continued focus on operational excellence.Reduced net debt(7) by $50 million to $1.29 billion at March 31, 2026, bringing net debt reduction to $770 million over the past 12 months.Returned $27 million to shareholders through dividends and share buybacks, including $21 million in dividends and the repurchase and cancellation of 0.4 million shares.Realized an average natural gas sales price of $5.41/mcf, more than double the AECO benchmark, reflecting structural exposure to premium international gas markets and portfolio diversification.Reported a net loss of $146 million ($0.95/basic share) driven by a $286 million unrealized loss on derivative instruments, which is the result of significant increases in spot and forward oil and European gas prices resulting from geopolitical events in Q1 2026, partially offset by gains on AECO hedges.Production averaged 125,618 boe/d(9) (72% natural gas), increasing 4% quarter-over-quarter and 22% from Q1 2025, comprised of 99,746 boe/d(9) from Canadian assets and 25,872 boe/d(9) from International assets. With strong operational results in Q1 2026 carrying through to our Q2 2026 outlook, full-year production is trending to the higher end of the annual guidance range.Several of the Company's Deep Basin wells ranked among the most prolific new wells in Alberta during the quarter, highlighting the depth, consistency and capital efficiency of the Deep Basin asset base and the technical execution of our teams.In the Montney, Vermilion brought on six (6.0 net) liquids-rich gas wells ahead of schedule, delivering tier 1 performance and lower drill, complete, equip and tie-in ("DCET") costs of $8.2 million per well compared to the prior planned cost of $8.5 million per well.In Germany, the Company progressed infrastructure development on the Wisselshorst well and expects first production by mid-2026. The Osterheide well has produced at an average of 8 mmcf/d over the first year of production and has generated approximately $30 million of excess free cash flow ("EFCF")(6) to-date.Announced the signing of a deal to acquire producing assets in Germany, adding approximately 1,000 boe/d (85% natural gas) of low-decline production, increasing exposure to European TTF-linked gas and Brent-linked oil production, enhancing EFCF, and improving control of gathering infrastructure surrounding the Osterheide well.Added three new land concessions in the North German Basin, adjacent to our existing acreage in Germany, doubling the Company's land base to over 1 million net acres and providing potential upside for our deep gas exploration program.In March 2026, signed an agreement to divest the remaining 60% interest in the SA-07 block in Croatia for net proceeds of approximately €15MM ($24MM). The proceeds will be primarily used for incremental debt reduction, and the transaction is expected to close in the second half of 2026.OutlookVermilion expects Q2 2026 production to average 123,000 to 125,000 boe/d (69% natural gas)(13), with full-year production trending to the top end of the stated guidance range of 118,000 to 122,000 boe/d (70% natural gas)(13) on E&D capital expenditures of $600 to $630 million.Declared a quarterly cash dividend of $0.135 per common share, payable on June 30, 2026, to shareholders of record on June 15, 2026.($M except as indicated)Q1 2026Q4 2025Q1 2025Financial
Fund flows from operations (1)232,277240,734256,029 Fund flows from operations ($/basic share) (2)1.521.571.66 Fund flows from operations ($/diluted share) (2)1.491.551.65Net (loss) earnings
Net (loss) earnings from continuing operations (141,206)(437,788)3,849Net (loss) earnings from discontinued operations (4,332)13511,104Net (loss) earnings(145,538)(437,653)14,953 Net (loss) earnings from continuing operations ($/basic share)(0.92)(2.86)0.03 Net (loss) earnings from discontinued operations ($/basic share)(0.03)—0.07 Net (loss) earnings ($/basic share)(0.95)(2.86)0.10Cash flows from operating activities227,398133,357280,384Cash flows used in investing activities188,773109,0621,255,746Capital expenditures (3)134,580191,752182,119Acquisitions (4)6,0351,6461,120,998Dispositions (5)—41,782—Repurchase of shares 4,6926,52716,576Cash dividends ($/share)0.1350.1300.130Dividends declared20,60119,89520,043Free cash flow (6)97,69748,98273,910Long-term debt1,254,3331,243,3971,874,033Net debt (7)1,292,5671,342,3902,062,805Net debt to four quarter trailing fund flows from operations (8)1.41.41.7Shares outstanding - basic ('000s)152,600152,950154,177Weighted average shares outstanding - diluted ('000s) (9)155,510155,183155,609Operational
Production (10)
Crude oil and condensate (bbls/d)23,69225,40132,386 NGLs (bbls/d)12,04412,1409,167 Natural gas (mmcf/d)539.29502.60369.36 Total (boe/d)125,618121,308103,115Average realized prices
Crude oil and condensate ($/bbl)100.6183.2199.36 NGLs ($/bbl)23.0021.1731.56 Natural gas ($/mcf)5.415.137.80Average realized price ($/boe)44.9640.9961.71Production mix (% of production)
% priced with reference to AECO58 %54 %42 % % priced with reference to TTF and NBP13 %15 %17 % % priced with reference to WTI22 %21 %29 % % priced with reference to Dated Brent7 %10 %12 %Netbacks
Operating netback ($/boe) (11)25.4925.6238.48 Fund flows from operations ($/boe) (12)20.3321.4727.78 (1) Fund flows from operations (FFO) is a total of segments and non-GAAP financial measure most directly comparable to net (loss) earnings and is calculated as sales less royalties, transportation expense, operating expense, G&A expense, corporate income tax expense (recovery), PRRT expense, interest expense, equity based compensation settled in cash, realized (gain) loss on derivatives, realized foreign exchange (gain) loss, and realized other (income) expense. The measure is used by management to assess the contribution of each business unit to Vermilion's ability to generate income necessary to pay dividends, repay debt, fund asset retirement obligations, and make capital investments. FFO does not have a standardized meaning under IFRS® Accounting Standards and therefore may not be comparable to similar measures provided by other issuers. More information and a reconciliation to net earnings (loss), the most directly comparable primary financial statement measure, can be found in the "Non-GAAP and Other Specified Financial Measures" section of this document. Fund flows from continuing operations and fund flows from discontinued operations are calculated in the same manner as FFO and are most directly comparable to net earnings (loss) from continuing operations and net earnings (loss) discontinued operations, respectively.(2) Fund flows from operations per basic share and diluted share is calculated by dividing fund flows from operations (total of segments and non-GAAP financial measure) by the basic weighted average shares outstanding as defined under IFRS Accounting Standards. Fund flows from operations per diluted share is calculated by dividing fund flows from operations by the sum of basic weighted average shares outstanding and incremental shares issuable under the equity based compensation plans as determined using the treasury stock method. Management assesses fund flows from operations on a per share basis as we believe this provides a measure of our operating performance after taking into account the issuance and potential future issuance of Vermilion common shares. More information and a reconciliation to cash flows used in investing activities, the most directly comparable primary financial statement measure, can be found in the "Non-GAAP and Other Specified Financial Measures" section of this document. Fund flows from continuing operations per basic and diluted share and fund flows from discontinued operations per basic and diluted share are calculated in the same manner as FFO per basic and diluted share.(3) Capital expenditures is a non-GAAP financial measure most directly comparable to cash flows used in investing activities and is calculated as the sum of drilling and development costs and exploration and evaluation costs. Management considers capital expenditures to be a useful measure of our investment in our existing asset base. Capital expenditures does not have a standardized meaning under IFRS Accounting Standards and therefore may not be comparable to similar measures provided by other issuers. More information and a reconciliation to cash flows used in investing activities, the most directly comparable primary financial statement measure, can be found in the "Non-GAAP and Other Specified Financial Measures" section of this document. Capital expenditures is also referred to as E&D capital expenditures.(4) Acquisitions is a non-GAAP financial measure and is not a standardized financial measure under IFRS Accounting Standards and therefore may not be comparable to similar measures disclosed by other issuers. Acquisitions is calculated as the sum of acquisitions, net of cash acquired, acquisitions of securities and net acquired working capital (deficit). Management believes that including these components provides a useful measure of the economic investment associated with our acquisition activity and is most directly comparable to cash flows used in investing activities. More information and a reconciliation to acquisitions, net of cash acquired and acquisition of securities, the most directly comparable primary financial statement measure, can be found in the "Non-GAAP and Other Specified Financial Measures" section of this document.(5) Dispositions is a non-GAAP financial measure and is not a standardized financial measure under IFRS Accounting Standards and therefore may not be comparable to similar measures disclosed by other issuers. Dispositions is calculated as the sum of dispositions, and disposition of securities. Management believes that including these components provides a useful measure of the proceeds associated with our disposition activities and is most directly comparable to cash flows used in investing activities. More information and a reconciliation to dispositions and disposition of securities, the most directly comparable primary financial statement measures, can be found in the "Non-GAAP and Other Specified Financial Measures" section of this document.(6) Free cash flow (FCF) and excess free cash flow (EFCF) are non-GAAP financial measures most directly comparable to cash flows from operating activities. FCF is calculated as FFO less drilling and development costs and exploration and evaluation costs and EFCF is calculated as FCF less payments on lease obligations and asset retirement obligations settled. FCF is used by management to determine the funding available for investing and financing activities including payment of dividends, repayment of long-term debt, reallocation into existing business units and deployment into new ventures. EFCF is used by management to determine the funding available to return to shareholders after costs attributable to normal business operations. FCF and EFCF do not have standardized meanings under IFRS Accounting Standards and therefore may not be comparable to similar measures provided by other issuers. More information and a reconciliation to cash flows from operating activities, the most directly comparable primary financial statement measure, can be found in the "Non-GAAP and Other Specified Financial Measures" section of this document.(7) Net debt is a capital management measure in accordance with IAS 1 "Presentation of Financial Statements" that is most directly comparable to long-term debt and is calculated as long-term debt (excluding unrealized foreign exchange on swapped USD borrowings) plus adjusted working deficit (capital), a non-GAAP financial measure described in the "Non-GAAP and Other Specified Financial Measures" section of this document. Management considers this a helpful representation of Vermilion's net financing obligations after adjusting for the timing of working capital fluctuations. More information and a reconciliation to long-term debt, the most directly comparable primary financial statement measure, can be found in the "Non-GAAP and Other Specified Financial Measures" section of this document.(8) Net debt to four quarter trailing fund flows from operations is a non-GAAP ratio and is not a standardized financial measure under IFRS Accounting Standards and therefore may not be comparable to similar measures disclosed by other issuers. Net debt to four quarter FFO is calculated as net debt divided by FFO from the preceding four quarters. Management uses this measure to assess the Company's ability to repay debt. More information can be found in the "Non-GAAP and Other Specified Financial Measures" section of this document.
Subsequent to February 26, 2025, net debt to four quarter trailing fund flows from operations is calculated inclusive of Westbrick Energy's pre-acquisition four quarter trailing fund flows from operations, as if the acquisition of Westbrick Energy occurred at the beginning of the four quarter trailing period, and exclusive of the four quarter trailing fund flows from discontinued operations to reflect the Company's ability to repay debt on a pro forma basis.(9) Diluted shares outstanding represents the sum of shares outstanding at the period end plus outstanding awards under the Long-term Incentive Plan, based on current estimates of future performance factors and forfeiture rates.(10) Please refer to Supplemental Table 4 "Production" of the accompanying Management's Discussion and Analysis for disclosure by product type.(11) Operating netback is a non-GAAP financial measure that is not standardized under IFRS Accounting Standards and may not be comparable to similar measures disclosed by other issuers. Operating netback is most directly comparable to net (loss) earnings and is calculated as sales less royalties, operating expense, transportation expense, PRRT expense, and realized hedging (gain) loss, and when presented on a per unit basis is a non-GAAP ratio. Management assesses operating netback as a measure of the profitability and efficiency of our field operations. More information and a reconciliation to net (loss) earnings, the most directly comparable primary financial statement measure, can be found in the "Non-GAAP and Other Specified Financial Measures" section of this document.(12) Fund flows from operations per boe is a non-GAAP ratio that is not standardized under IFRS Accounting Standards and may not be comparable to similar measures disclosed by other issuers. FFO per boe is calculated as FFO divided by boe production. FFO per boe is used by management to assess the profitability of Vermilion's business units and Vermilion as a whole. More information can be found in the "Non-GAAP and Other Specified Financial Measures" section of this document. Fund flows from continuing operations per boe and fund flows from discontinued operations per boe are calculated in the same manner as FFO per boe.(13) Based on Company estimates as at May 4, 2026.
Message to ShareholdersThe first quarter of 2026 was marked by heightened geopolitical uncertainty, particularly in the Middle East, which intensified through March and continued to impact global energy markets subsequent to quarter-end. These events underscore the importance of energy security and the value of reliable, diversified supply.Vermilion's large, long-duration resource base and diversified exposure to multiple commodities and pricing benchmarks enhances resilience across a wide range of market conditions. In Q1 2026, production was comprised of approximately 59% Canadian natural gas, 13% European natural gas and 28% liquids, with liquids largely priced off WTI and Brent benchmarks. While production remains weighted toward natural gas, stronger liquids and European gas prices resulted in approximately 77% of Q1 2026 revenue being derived from European gas and liquids production, highlighting the value of Vermilion's diversified portfolio, including exposure to the liquids-rich window of the Deep Basin and the oil window of the Montney.Against this backdrop, Vermilion delivered strong operational performance, with production of 125,618 boe/d (72% natural gas)(1) exceeding the top end of guidance, driven primarily by exceptional results in the Deep Basin, new Montney oil-window wells brought on ahead of schedule and robust production from the Osterheide well in Germany. Continued focus on efficiencies resulted in a further $300,000 per well reduction in Montney drill, complete, equip and tie-in ("DCET") costs, which reduces future capital requirements by an estimated $60 million and improves full cycle economics.In Europe, gas production achieved an average sales price of approximately $16/MMBtu, benefitting from elevated day-ahead gas prices in March. Market fundamentals remain supportive of higher prices, with current pricing for the next four quarters averaging over $20/MMBtu(2). Global LNG flows have been impacted by disruptions in the Strait of Hormuz, while European gas inventories remain at multi-year lows, with storage levels in Germany at approximately 25% and the Netherlands at 10%. It is estimated that European countries will be required to add approximately 2 Tcf of gas to storage by November 1, 2026 in order to meet mandated 80% capacity levels. The majority of this gas will have to be secured in a competitive global LNG market. Domestically, Vermilion remains on track to bring the first Wisselshorst well in Germany online by mid-year, plans to spud follow-up wells on the Bommelsen license early next year, and expects to commence drilling activities in the Netherlands in the second half of 2026. These activities support European energy security through locally produced gas with a lower operational (Scope 1) emissions profile than imported alternatives, based on independent studies.In Canada, Deep Basin and Montney operations continued to outperform budget assumptions. The depth and quality of the inventory within Vermilion's land base provides investors with exposure to the liquids-weighted fairway of these basins, and the Company has shifted the Deep Basin drilling program to higher liquids-rate wells to capitalize on stronger liquids pricing. The recent Montney pad brought on production ahead of schedule is consistent with tier 1 expectations. The Company was able to achieve strong well performance while simultaneously decreasing DCET cost per well, through continued focus on operational excellence. Subsequent to quarter-end, Vermilion joined the Rockies LNG consortium to evaluate additional diversification for Montney gas through the Ksi Lisims LNG project. This potential diversification option would complement the 26 mmcf/d currently shipped on the Alliance pipeline to the premium-priced Chicago hub, further diversifying our Montney gas by increasing exposure to premium global markets.Vermilion continues to prioritize operational scale in core areas, including the Deep Basin, the Montney, and prospects in Germany and the Netherlands. The benefits of this focus are flowing through recent results and Q1 2026 was no different, with continued outperformance on both production and cost structure. With strong excess free cash flow ("EFCF")(3) from diversified commodity exposure and operational excellence, Vermilion is well positioned to accelerate debt reduction while continuing to return capital to our shareholders. Looking forward, with 1.3 million net acres of land in Canada and over 2 million net acres of land in Germany and the Netherlands, Vermilion's long-duration asset base, disciplined capital allocation optionality and focus on operational excellence and profitability position the Company to generate expected sustainable free cash flow for decades to come.Q1 2026 ReviewIn the first quarter of 2026, Vermilion generated $232 million of FFO on E&D capital expenditures of $135 million, resulting in FCF of $98 million that was primarily allocated to the balance sheet and shareholder returns. Net debt was reduced by $50 million to $1.29 billion at March 31, 2026, resulting in net debt to four quarter trailing FFO(4) of 1.4 times. Debt reduction remains a priority for Vermilion, with current pricing improving visibility to the $1.0 billion net debt target. The Company also returned $27 million to shareholders through $21 million of dividends and the repurchase of 0.4 million shares. During the quarter, the Company recorded non-cash, price-related losses on risk management contracts of $286 million ($219 million net of taxes). When commodity prices increase, Vermilion's net asset value increases, while the liability position of risk management contracts where production has been forward sold also increases. Changes in the fair value of these contracts, which include hedges extending out to Q4 2028, are fully recognized in the current quarter's income statement and do not reflect the future cash generating capability of the business. The unrealized loss for the quarter was primarily driven by shorter-dated crude oil hedges and European gas hedges, partially offset by gains on AECO hedges. Vermilion has hedged approximately 30% of estimated corporate net-of-royalty production out to Q4 2028, providing exposure to higher prices.Production averaged 125,618 boe/d (72% natural gas)(1), an increase of 4% over the prior quarter and 22% over Q1 2025. Production from Vermilion's Canadian operations averaged 99,746 boe/d(1) in Q1 2026, a 10% increase over the prior quarter. Production from Vermilion's International operations averaged 25,872 boe/d(1) in Q1 2026, a decrease of 14% from the prior quarter primarily driven by cyclone-related downtime in Australia, as well as natural declines across the European business units. Operational excellence and the repositioned portfolio delivered a significant reduction to the cost structure of controllable expenses, defined as operating, transportation, G&A and interest expense per boe. Compared to Q1 2025, controllable cost structure decreased by 25% in Q1 2026. This enhanced cost structure coupled with strong capital efficiencies captured in the year-end 2025 reserve report will drive sustainable and growing EFCF. In Q1 2026, the Company maintained a three-rig drilling program in the Deep Basin, drilling ten (9.3 net), completing fourteen (13.8 net), and bringing on production eighteen (18.0 net) liquids-rich gas wells. Several of the Company's Deep Basin wells ranked among the most prolific in Alberta during the quarter, reflecting the depth, consistency and capital efficiency of the Deep Basin asset base and the technical execution of our teams. In the Montney, Vermilion drilled five (5.0 net), completed six (6.0 net), and brought on production six (6.0 net) liquids-rich gas wells. With a focus on operational excellence, supported by the realized cost savings from this most recent pad, Vermilion reduced the planned cost in the Montney to $8.2 million per well, which reduces total future capital requirements and improves full cycle economics on our Mica Montney asset.In Germany, the Company progressed infrastructure build-out on the Wisselshorst well during Q1 2026 and expects first production from this well by mid-2026. In France, a cargo that was scheduled for late March was deferred to early April and was sold at the higher April Dated Brent price. This shifted approximately $10 million of cash flows out of Q1 2026 but provides more profitability overall with the spot sale in April benefiting from higher pricing. In Australia, production operations at Wandoo safely resumed in mid-March 2026 following downtime related to Cyclone Mitchell in February 2026, and a subsequent shut-in due to Cyclone Narelle in late March 2026. Experiencing two cyclones events in one quarter is extremely rare, and our teams successfully managed all aspects of the safe shut-in of operations and evacuation of personnel before returning to the platform to initiate inspections. Production resumed subsequent to the quarter following necessary repair work. While production operations were shut-in, Vermilion exported approximately 300,000 barrels of oil in February 2026.In March 2026, the Company reached an agreement to acquire producing assets in Germany, adding approximately 1,000 boe/d (85% natural gas) of low-decline production. This acquisition increases Vermilion's European TTF-linked gas and Brent-linked oil production, enhances EFCF, and provides strategic value through control of key gathering infrastructure, including local infrastructure at the Osterheide well. The transaction has an effective date of January 1, 2025, and is expected to close in the second half of 2026. The Company also expanded our acreage in the North German Basin with the award of three new concessions, doubling our acreage in Germany to well over 1 million net acres. The terms of this new acreage provides time for Vermilion's teams to evaluate seismic data and, if prospective, extend our tenure through work commitments.In Croatia, the Company signed an agreement to divest the remaining 60% interest in the SA-07 block for net proceeds of approximately €15MM ($24MM). This block had four successful exploration wells drilled in 2024, however with the success in Germany, Vermilion has elected to prioritize capital allocation to the deep pool of prospects that we have across Germany and the Netherlands. The proceeds from SA-07 will primarily be used for incremental debt reduction and the transaction is expected to close in the second half of the year.Outlook and Guidance UpdateConsistent with its disciplined capital allocation approach, Vermilion actively managed natural gas production during periods of weak AECO pricing in the summer of 2025, prioritizing value over volumes. Reflecting this profitability-focused approach, Vermilion expects Q2 2026 production to average 123,000 to 125,000 boe/d (69% natural gas)(2). Our full-year 2026 production guidance is unchanged, the Company is trending to the upper end of the annual range, reflecting Q1 2026 outperformance carrying into Q2 2026. This is expected to be partially offset by lower production in Q3 2026, driven by planned maintenance-related downtime, including a 32-day turnaround in Ireland and other maintenance activities across the asset base.Commodity HedgingVermilion hedges to manage commodity price exposures and increase the stability of our cash flows. In aggregate, we have 48% of our expected net-of-royalty production hedged for the remainder of 2026. With respect to individual commodity products, we have hedged 59% of our European natural gas production, 59% of our crude oil production, and 42% of our Canadian natural gas volumes, respectively. Please refer to the Hedging section of our website under Invest With Us for further details using the following link: https://www.vermilionenergy.com/invest-with-us/hedging.(Signed "Dion Hatcher")Dion Hatcher
President & Chief Executive Officer
May 6, 2026(1) Please refer to Supplemental Table 4 "Production" of the accompanying Management's Discussion and Analysis for disclosure by product type.(2) Based on Company estimates as at May 4, 2026 and May 4, 2026 pricing strip.(3) Free cash flow (FCF) and excess free cash flow (EFCF) are non-GAAP financial measures most directly comparable to cash flows from operating activities. FCF is calculated as FFO less drilling and development costs and exploration and evaluation costs and EFCF is calculated as FCF less payments on lease obligations and asset retirement obligations settled. FCF is used by management to determine the funding available for investing and financing activities including payment of dividends, repayment of long-term debt, reallocation into existing business units and deployment into new ventures. EFCF is used by management to determine the funding available to return to shareholders after costs attributable to normal business operations. FCF and EFCF do not have standardized meanings under IFRS Accounting Standards and therefore may not be comparable to similar measures provided by other issuers. More information and a reconciliation to cash flows from operating activities, the most directly comparable primary financial statement measure, can be found in the "Non-GAAP and Other Specified Financial Measures" section of this document.(4) Net debt to four quarter trailing fund flows from operations is a non-GAAP ratio and is not a standardized financial measure under IFRS Accounting Standards and therefore may not be comparable to similar measures disclosed by other issuers. Net debt to four quarter FFO is calculated as net debt divided by FFO from the preceding four quarters. Management uses this measure to assess the Company's ability to repay debt. More information can be found in the "Non-GAAP and Other Specified Financial Measures" section of this document.
Subsequent to February 26, 2025, net debt to four quarter trailing fund flows from operations is calculated inclusive of Westbrick Energy's pre-acquisition four quarter trailing fund flows from operations, as if the acquisition of Westbrick Energy occurred at the beginning of the four quarter trailing period, and exclusive of the four quarter trailing fund flows from discontinued operations to reflect the Company's ability to repay debt on a pro forma basis.Non-GAAP and Other Specified Financial MeasuresThis report and other materials released by Vermilion includes financial measures that are not standardized, specified, defined, or determined under IFRS Accounting Standards and are therefore considered non-GAAP or other specified financial measures and may not be comparable to similar measures presented by other issuers. These financial measures include:Total of Segments MeasuresFund flows from operations (FFO): Most directly comparable to net (loss) earnings, FFO is a non-GAAP financial measure and total of segments measure comprised of sales less royalties, transportation, operating, G&A, corporate income tax, PRRT, interest expense, equity based compensation settled in cash, realized gain (loss) on derivatives, realized foreign exchange gain (loss), and realized other income (expense). The measure is used by management to assess the contribution of each business unit to Vermilion's ability to generate income necessary to pay dividends, repay debt, fund asset retirement obligations and make capital investments. Reconciliation to the most directly comparable primary financial statement measures can be found below. Fund flows from continuing operations and fund flows from discontinued operations are calculated in the same manner as FFO and is most directly comparable to net (loss) earnings from continuing operations and net (loss) earnings from discontinued operations, respectively.Reconciliation of fund flows from continuing operations to net (loss) earnings from continuing operations:
Q1 2026Q1 2025
$M$/boe$M$/boeSales513,33144.96468,69359.33Royalties(31,270)(2.74)(30,091)(3.81)Transportation(33,307)(2.92)(28,241)(3.58)Operating(141,705)(12.41)(113,780)(14.40)General and administration (1)(19,965)(1.75)(29,735)(3.76)Corporate income tax expense (11,664)(1.02)(19,059)(2.41)Petroleum resource rent tax——(3,018)(0.38)Interest expense(26,697)(2.34)(32,979)(4.17)Realized (loss) gain on derivatives(15,885)(1.39)11,1191.41Realized foreign exchange (loss) gain(544)(0.05)2,4990.32Realized other income (expense)1350.01(14,466)(1.83)Fund flows from continuing operations232,42920.35210,94226.72Equity based compensation(2,451)
(5,931)
Unrealized loss on derivative instruments (2)(285,648)
(13,675)
Unrealized foreign exchange loss (2)(15,273)
(36,016)
Accretion(18,838)
(15,793)
Depletion and depreciation(164,130)
(148,282)
Deferred tax recovery112,789
12,923
Unrealized other expense (2)(84)
(319)
Net (loss) earnings from continuing operations(141,206)
3,849
(1) General and administration expenses previously presented within the Corporate segment have been reclassified to our Canadian segment. The prior period results have been presented to conform with current period presentation.(2) Unrealized loss on derivative instruments, Unrealized foreign exchange loss and Unrealized other expense are line items from the respective Consolidated Statements of Cash Flows.Reconciliation of fund flows from discontinued operations to net (loss) earnings from discontinued operations:
Q1 2026Q1 2025
$M$/boe$M$/boeSales——100,15375.93Royalties——(19,199)(14.56)Transportation——(2,945)(2.23)Operating(74)—(27,997)(21.23)General and administration(78)—(4,925)(3.73)Fund flows from discontinued operations(152)—45,08734.18Unrealized foreign exchange gain (1)6
117
Accretion—
(2,087)
Depletion and depreciation(5,137)
(28,106)
Deferred tax recovery (expense) 951
(3,907)
Net (loss) earnings from discontinued operations(4,332)
11,104
Fund flows from operations232,27720.33256,02927.78
Net (loss) earnings(145,538)
14,953
(1) Unrealized loss on derivative instruments, Unrealized foreign exchange loss, and Unrealized other expense are line items from the respective Consolidated Statements of Cash Flows.
Non-GAAP Financial Measures and Non-GAAP RatiosFund flows from operations per basic and diluted share: FFO per basic share and diluted share are non-GAAP ratios. Management assesses fund flows from operations on a per share basis as we believe this provides a measure of our operating performance after taking into account the issuance and potential future issuance of Vermilion common shares. Fund flows from operations per basic share is calculated by dividing fund flows from operations (total of segments measure) by the basic weighted average shares outstanding as defined under IFRS Accounting Standards. Fund flows from operations per diluted share is calculated by dividing fund flows from operations by the sum of basic weighted average shares outstanding and incremental shares issuable under the equity based compensation plans as determined using the treasury stock method. Fund flows from continuing operations per basic and diluted share and fund flows from discontinued operations per basic and diluted share are calculated in the same manner as FFO per basic and diluted share.Fund flows from operations per boe: Management uses fund flows from operations per boe to assess the profitability of our business units and Vermilion as a whole. Fund flows from operations per boe is calculated by dividing fund flows from operations (total of segments measure) by boe production. Fund flows from continuing operations per boe and fund flows from discontinued operations per boe are calculated in the same manner as FFO per boe.Free cash flow (FCF) and excess free cash flow (EFCF): Most directly comparable to cash flows from operating activities, FCF is a non-GAAP financial measure calculated as fund flows from operations less drilling and development costs and exploration and evaluation costs and EFCF is comprised of FCF less payments on lease obligations and asset retirement obligations settled. FCF is used by management to determine the funding available for investing and financing activities including payment of dividends, repayment of long-term debt, reallocation into existing business units and deployment into new ventures. EFCF is used by management to determine the funding available to return to shareholders after costs attributable to normal business operations. Reconciliation to the primary financial statement measures can be found in the following table.($M)Q1 2026Q1 2025Cash flows from operating activities227,398280,384Changes in non-cash operating working capital(7,923)(33,702)Asset retirement obligations settled 12,8029,347Fund flows from operations 232,277256,029Drilling and development(134,146)(167,464)Exploration and evaluation(434)(14,655)Free cash flow97,69773,910Payments on lease obligations(2,763)(3,829)Asset retirement obligations settled (12,802)(9,347)Excess free cash flow82,13260,734Capital expenditures: Most directly comparable to cash flows used in investing activities, capital expenditures is a non-GAAP financial measure calculated as the sum of drilling and development costs and exploration and evaluation costs as derived from the Consolidated Statements of Cash Flows. We consider capital expenditures to be a useful measure of our investment in our existing asset base. Capital expenditures are also referred to as E&D capital. Reconciliation to the primary financial statement measures can be found below.($M)Q1 2026Q1 2025Drilling and development134,146167,464Exploration and evaluation43414,655Capital expenditures134,580182,119Payout and payout % of FFO: Payout and payout % of FFO are, respectively, a non-GAAP financial measure and non-GAAP ratio. Payout is most directly comparable to dividends declared. Payout is comprised of dividends declared plus drilling and development costs, exploration and evaluation costs, and asset retirement obligations settled, and payout % of FFO is calculated as payout divided by FFO. The measure is used by management to assess the amount of cash distributed back to shareholders and reinvested in the business for maintaining production and organic growth. Payout as a percentage of FFO is also referred to as the payout ratio or sustainability ratio. The reconciliation of the measure to the primary financial statement measure can be found below.($M)Q1 2026Q1 2025Dividends declared20,60120,043Drilling and development134,146167,464Exploration and evaluation43414,655Asset retirement obligations settled12,8029,347Payout167,983211,509 % of fund flows from operations72 %83 %Return on capital employed (ROCE): A non-GAAP ratio, ROCE is a measure that management uses to analyze our profitability and the efficiency of our capital allocation process; the comparable primary financial statement measure is earnings before income taxes. ROCE is calculated by dividing net (loss) earnings before interest and taxes ("EBIT") by average capital employed over the preceding twelve months. Capital employed is calculated as total assets less current liabilities while average capital employed is calculated using the balance sheets at the beginning and end of the twelve-month period.
Twelve Months Ended($M)Mar 31, 2026Mar 31, 2025Net loss(814,092)(34,091)Taxes(129,629)144Interest expense126,46699,193EBIT(817,255)65,246Average capital employed (1)5,547,5315,914,151Return on capital employed(15) %1 %
(1) Average capital employed includes the current portion of asset retirement obligations, previously presented on a combined basis as long-term. The prior period results have been presented to conform with current period presentation.
Adjusted working capital (deficit): Adjusted working capital (deficit) is a non-GAAP financial measure calculated as current assets less current liabilities, excluding current derivatives, current asset retirement obligations and current lease liabilities. The measure is used by management to calculate net debt, a capital management measure disclosed below.
As at($M)Mar 31, 2026Dec 31, 2025Current assets484,784467,286Current liabilities(765,072)(554,547)Current derivative asset(68,409)(78,694)Current asset retirement obligation (1)55,937—Current lease liability8,2989,206Current derivative liability243,2546,154Adjusted working capital deficit(41,208)(96,091) (1) Asset retirement obligations previously presented as a combined balance have been reclassified into current and long-term portion of asset retirement obligations. The prior period results have been presented to conform with current period presentation.
Acquisitions: Acquisitions is a non-GAAP financial measure and is calculated as the sum of acquisitions, net of cash acquired and acquisitions of securities from the Consolidated Statements of Cash Flows, Vermilion common shares issued as consideration, the estimated value of contingent consideration, the amount of acquiree's outstanding long-term debt assumed, and net acquired working capital deficit or surplus. Management believes that including these components provides a useful measure of the economic investment associated with our acquisition activity and is most directly comparable to cash flows used in investing activities. A reconciliation to the acquisitions line items in the Consolidated Statements of Cash Flows can be found below.($M)Q1 2026Q1 2025Acquisitions, net of cash acquired6,0351,084,456Shares issued for acquisition—13,363Acquired working capital deficit—23,179Acquisitions6,0351,120,998Operating netback: Operating netback is non-GAAP financial measure and is calculated as sales less royalties, operating expense, transportation costs, PRRT, and realized hedging gains and losses, and when presented on a per unit basis is a non-GAAP ratio. Operating netback is most directly comparable to net (loss) earnings. Management assesses operating netback as a measure of the profitability and efficiency of our field operations.Net debt to four quarter trailing fund flows from operations: Management uses net debt (a capital management measure, as defined below) to four quarter trailing fund flows from operations to assess the Company's ability to repay debt. Net debt to four quarter trailing fund flows from operations is a non-GAAP ratio calculated as net debt (capital management measure) divided by fund flows from operations (total of segments measure) from the preceding four quarters.Capital Management MeasureNet debt: Net debt is a capital management measure in accordance with IAS 1 "Presentation of Financial Statements" that is most directly comparable to long-term debt. Net debt is comprised of long-term debt (excluding unrealized foreign exchange on swapped USD borrowings) plus adjusted working capital (defined as current assets less current liabilities, excluding current derivatives, current asset retirement obligations and current lease liabilities), and represents Vermilion's net financing obligations after adjusting for the timing of working capital fluctuations.
As at($M)Mar 31, 2026Dec 31, 2025Long-term debt1,254,3331,243,397Adjusted working capital (1)41,20896,091Unrealized FX on swapped USD borrowings (2)(2,974)2,902Net debt 1,292,5671,342,390
Ratio of net debt to four quarter trailing fund flows from operations (3)1.41.4 (1) Adjusted working capital is defined as current assets (excluding current derivatives), less current liabilities (excluding current derivatives, current asset retirement obligations and current lease liabilities).(2) Vermilion may enter into cross currency interest rate swaps to hedge the foreign exchange movements on USD borrowings on our revolving credit facility. Unrealized FX on swapped USD borrowings relates to the unrealized gains and losses on our cross currency interest swaps. At March 31, 2026, there was $203.4 million of USD borrowings on our revolving credit facility. (December 31, 2025 - $196.7 million).(3) Subsequent to February 26, 2025, net debt to four quarter trailing fund flows from operations is calculated inclusive of Westbrick Energy's pre-acquisition four quarter trailing fund flows from operations, as if the acquisition of Westbrick Energy occurred at the beginning of the four quarter trailing period, and exclusive of the four quarter trailing fund flows from discontinued operations to reflect the Company's ability to repay debt on a pro forma basis.
Supplementary Financial MeasuresDiluted shares outstanding: The sum of shares outstanding at the period end plus outstanding awards under the Long-term Incentive Plan ("LTIP"), based on current estimates of future performance factors and forfeiture rates.('000s of shares)Q1 2026Q1 2025Shares outstanding152,600154,177Potential shares issuable pursuant to the LTIP4,4333,488Diluted shares outstanding157,033157,665Production per share growth: Calculated as the change in production determined on a per weighted average shares outstanding basis over a predefined period of time, expressed as a compounded, annualized return percentage. Measuring production growth per share better reflects the interests of our existing shareholders by reflecting the dilutive impact of equity issuances.F&D (finding and development) and FD&A (finding, development and acquisition) costs: used as a measure of capital efficiency, calculated by dividing the applicable capital expenditures for the period, including the change in undiscounted FDC (future development capital), by the change in the reserves, incorporating revisions and production, for the same period.Operating Recycle Ratio: A non-GAAP ratio that is calculated by dividing the Operating Netback, excluding PRRT and realized hedging gains and losses, by the cost of adding reserves (F&D and FD&A cost). Management assesses operating recycle ratio as a measure of the reinvestment of earnings.Management's Discussion and Analysis and Consolidated Financial StatementsTo view Vermilion's Management's Discussion and Analysis and Interim Condensed Consolidated Financial Statements for the three months ended March 31, 2026 and 2025, please refer to SEDAR+ (www.sedarplus.ca) or Vermilion's website at www.vermilionenergy.com.Conference Call and Webcast DetailsVermilion will discuss its Q1 2026 operating and condensed financial results in a conference call and webcast presentation on Wednesday, May 6, 2026, at 8:00 AM MT (10:00 AM ET). To participate, call 1-888-510-2154 (Canada and US Toll Free) or 1-437-900-0527 (International and Toronto Area). A recording of the conference call will be available for replay by calling 1-888-660-6345 (Canada and US Toll Free) or 1-289-819-1450 (International and Toronto Area) and using conference replay entry code 81761# from May 6, 2026, at 12:00 PM MT to May 13, 2026, at 12:00 PM MT.To join the conference call without operator assistance, you may register and enter your phone number at https://emportal.ink/4lXhj3k to receive an instant automated call back. You may also access the webcast at https://app.webinar.net/Z02K9Bq8g4m. The webcast link will be available on Vermilion's website at https://www.vermilionenergy.com/invest-with-us/events-presentations/ under Upcoming Events prior to the conference call. Participants who would like to submit questions ahead of time may do so by emailing investor_relations@vermilionenergy.com.Annual General MeetingVermilion will hold its Annual General Meeting on May 6, 2026 at 3:00 pm MT. Our Meeting will be held as a virtual only shareholder meeting with participation electronically as explained further in the Management Information Circular. As a reminder, proxies must be received by 3:00 pm MT on Monday, May 4, 2026.Shareholders can participate electronically at https://meetings.lumiconnect.com/400-593-993-161. Please see our Virtual Meeting Guide at https://www.vermilionenergy.com/wp-content/uploads/2026/03/Meeting-Guide.pdf for detailed instructions on how to access the meeting, vote on resolutions and submit questions. Guests may also view the event at https://meetings.lumiconnect.com/400-593-993-161 by registering as a guest. The live webcast link, webcast slides, and archive link will be available on Vermilion's website at https://www.vermilionenergy.com/invest-with-us/events-presentations.Please visit the Annual General Meeting page on our website under Invest with Us for complete details and links to all relevant documents ahead of the Meeting at https://www.vermilionenergy.com/annual-general-meeting.About VermilionVermilion is a global gas producer that seeks to create value through the acquisition, exploration and development of liquids-rich natural gas in Canada and conventional natural gas in Europe while optimizing low-decline oil assets. Our repositioned portfolio is focused on per share value creation, with long-life assets that deliver top decile realized gas prices and enhanced capital allocation optionality.Vermilion's priorities are health and safety, the environment, and profitability, in that order. Nothing is more important than the safety of the public and those who work with Vermilion, and the protection of the natural surroundings. In addition, the Company emphasizes strategic community investment in each of its operating areas.Vermilion trades on the Toronto Stock Exchange and the New York Stock Exchange under the symbol VET.DisclaimerCertain statements included or incorporated by reference in this document may constitute forward-looking statements or information under applicable securities legislation. Such forward-looking statements or information typically contain statements with words such as "anticipate", "believe", "expect", "plan", "intend", "estimate", "propose", or similar words suggesting future outcomes or statements regarding an outlook. Forward-looking statements or information in this document may include, but are not limited to: capital expenditures, including Vermilion's 2026 guidance and outlook, and Vermilion's ability to fund such expenditures; the flexibility of Vermilion's capital program and operations; business strategies and objectives; operational and financial performance; wells expected to be drilled and the timing thereof; exploration and development plans and the timing thereof; future drilling prospects; the ability of our asset base to deliver modest production growth; the evaluation of international acquisition opportunities; statements regarding the return of capital; our asset petroleum and natural gas sales; future production levels and the timing thereof, including Vermilion's 2026 guidance, and rates of average annual production growth; the effect of changes in crude oil and natural gas prices, changes in exchange and inflation rates; the payment and amount of future dividends, including management's intention to increase the Company's dividend and the timing thereof; the effect of possible changes in critical accounting estimates; the Company's review of the impact of potential changes to financial reporting standards; the potential financial impact of climate-related risks; Vermilion's goals regarding its debt levels, including maintenance of a ratio of net debt to four quarter trailing fund flows from operations; statements regarding Vermilion's hedging program and the stability of our cash flows; operating and other expenses; royalty and income tax rates and Vermilion's expectations regarding future taxes and taxability and the timing of regulatory proceedings and approvals; and timing of the divestitures of certain of the Company's operations and the use of such sale proceeds.Such forward-looking statements or information are based on a number of current expectations and assumptions, all or any of which may prove to be incorrect. In addition to any other assumptions identified in this document, assumptions that have been made include, but are not limited to: the ability of Vermilion to obtain equipment, services and supplies in a timely manner to carry out its activities in Canada and internationally; the ability of Vermilion to market crude oil, natural gas liquids, and natural gas successfully to current and new customers; the timing and costs of pipeline and storage facility construction and expansion and the ability to secure adequate product transportation; the timely receipt of required regulatory approvals; the ability of Vermilion to obtain financing on acceptable terms; foreign currency exchange rates and interest rates; future crude oil, natural gas liquids, and natural gas prices; management's expectations relating to the timing and results of exploration and development activities; the impact of Vermilion's dividend policy on its future cash flows; credit ratings; hedging program; expected earnings/(loss) and adjusted earnings/(loss); expected earnings/(loss) or adjusted earnings/(loss) per share; expected future cash flows and free cash flow and expected future cash flow and free cash flow per share; estimated future dividends; financial strength and flexibility; debt and equity market conditions; general economic and competitive conditions; ability of management to execute key priorities; and the effectiveness of various actions resulting from the Vermilion's strategic priorities.Although Vermilion believes that the expectations reflected in such forward-looking statements or information are reasonable as of the date hereof, undue reliance should not be placed on forward-looking statements because Vermilion can give no assurance that such expectations will prove to be correct. Financial outlooks are provided for the purpose of understanding Vermilion's financial position and business objectives, and the information may not be appropriate for other purposes. Forward-looking statements or information are based on current expectations, estimates, and projections that involve a number of risks and uncertainties which could cause actual results to differ materially from those anticipated by Vermilion and described in the forward-looking statements or information. These risks and uncertainties include, but are not limited to: the ability of management to execute its business plan; the risks of the oil and gas industry, both domestically and internationally, such as operational risks in exploring for, developing and producing crude oil, natural gas liquids, and natural gas; risks and uncertainties involving geology of crude oil, natural gas liquids, and natural gas deposits; risks inherent in Vermilion's marketing operations, including credit risk; the uncertainty of reserves estimates and reserves life and estimates of resources and associated expenditures; the uncertainty of estimates and projections relating to production and associated expenditures; potential delays or changes in plans with respect to exploration or development projects; Vermilion's ability to enter into or renew leases on acceptable terms; fluctuations in crude oil, natural gas liquids, and natural gas prices, foreign currency exchange rates, interest rates and inflation; health, safety, and environmental risks; uncertainties as to the availability and cost of financing; the ability of Vermilion to add production and reserves through exploration and development activities; the possibility that government policies or laws may change or governmental approvals may be delayed or withheld; uncertainty in amounts and timing of royalty payments; risks associated with existing and potential future law suits and regulatory actions against or involving Vermilion; and other risks and uncertainties described elsewhere in this document or in Vermilion's other filings with Canadian securities regulatory authorities. In particular, please also see Vermilion's MD&A and Annual Information Form, each for the year ended December 31, 2025, available on SEDAR+ at www.sedarplus.ca or on Vermilion's website at www.vermilionenergy.com. References to Vermilion or the Company in this document include Westbrick Energy Ltd. ("Westbrick" or "Westbrick Energy") which was acquired by Vermilion Energy Inc. on February 26, 2025.The forward-looking statements or information contained in this document are made as of the date hereof and Vermilion undertakes no obligation to update publicly or revise any forward-looking statements or information, whether as a result of new information, future events, or otherwise, unless required by applicable securities laws.This document may disclose certain oil and gas metrics, including capital spent to drill, complete, equip and tie-in a well ("DCET costs"), which do not have standardized meanings or standard methods of calculation and therefore such measures may not be comparable to similar measures used by other companies and should not be used to make comparisons. Such metrics have been included in this MD&A to provide readers with additional measures to evaluate the Company's performance; however, such measures are not reliable indicators of the Company's future performance and future performance may not compare to the Company's performance in previous periods and therefore such metrics should not be unduly relied upon. Additional oil and gas metrics in this document may include, but are not limited to:Boe Equivalency: Per barrel of oil equivalent amounts have been calculated using a conversion rate of six thousand cubic feet of natural gas to one barrel of oil equivalent (6:1). Barrel of oil equivalents (boe) may be misleading, particularly if used in isolation. A boe conversion ratio of 6 Mcf:1 bbl is based on an energy equivalency conversion method primarily applicable at the burner tip and does not represent a value equivalency at the wellhead. In addition, as the value ratio between natural gas and crude oil based on the current prices of natural gas and crude oil is significantly different from the energy equivalency of 6:1, utilizing a conversion on a 6:1 basis may be misleading as an indication of value.Estimates of Drilling Locations: Unbooked drilling locations are the internal estimates of Vermilion based on Vermilion's prospective acreage and an assumption as to the number of wells that can be drilled per section based on industry practice and internal review. Unbooked locations do not have attributed reserves or resources (including contingent and prospective). Unbooked locations have been identified by Vermilion's management as an estimation of Vermilion's multi-year drilling activities based on evaluation of applicable geologic, seismic, engineering, production and reserves information. There is no certainty that Vermilion will drill all unbooked drilling locations and if drilled there is no certainty that such locations will result in additional oil and natural gas reserves, resources or production. The drilling locations on which Vermilion will actually drill wells, including the number and timing thereof is ultimately dependent upon the availability of funding, regulatory approvals, seasonal restrictions, oil and natural gas prices, costs, actual drilling results, additional reservoir information that is obtained and other factors. While a certain number of the unbooked drilling locations have been de-risked by Vermilion drilling existing wells in relative close proximity to such unbooked drilling locations, the majority of other unbooked drilling locations are farther away from existing wells where management of Vermilion has less information about the characteristics of the reservoir and therefore there is more uncertainty whether wells will be drilled in such locations and if drilled there is more uncertainty that such wells will result in additional oil and gas reserves, resources or production.Financial data contained within this document are reported in Canadian dollars, unless otherwise stated. View original content to download multimedia:https://www.prnewswire.com/news-releases/vermilion-energy-inc-reports-strong-q1-2026-operational-and-financial-results-and-continued-debt-reduction-302763527.htmlSOURCE Vermilion Energy Inc. Original: Vermilion Energy Inc. Reports Strong Q1 2026 Operational and Financial Results and Continued Debt Reduction
 CA Market News
4月前
CA Market News
4月前
Vermilion Energy Inc. Delivers Record Annual Production and Strong Reserve Recycle Ratios, Q4 2025 Production Exceeds Guidance with Robust Fund Flows from OperationsMarch 4, 2026 5:01 PM
PR Newswire (Canada)
CALGARY, AB, March 4, 2026 /CNW/ - Vermilion Energy Inc. ("Vermilion" or the "Company") (TSX: VET) (NYSE: VET) is pleased to report operating and condensed financial results for the year ended December 31, 2025.
The audited financial statements, management discussion and analysis and annual information form for the year ended December 31, 2025 will be available on the System for Electronic Document Analysis and Retrieval Plus ("SEDAR+") at www.sedarplus.ca, on EDGAR at www.sec.gov/edgar.shtml, and on Vermilion's website at www.vermilionenergy.com.HighlightsYear End 2025 ResultsGenerated $1,010 million ($6.58/basic share)(2) of fund flows from operations ("FFO")(1) and $375 million of free cash flow ("FCF")(6), fully funding $635 million of exploration and development ("E&D") capital expenditures(3) while strengthening the balance sheet and returning cash to shareholders.Reduced net debt(7) by more than $700 million since Q1 2025, ending the year at $1.34 billion and achieving a net debt to four quarter trailing FFO(8) ratio of 1.4x, with debt levels well below any relevant financial covenants.Returned $116 million to shareholders through dividends and share buybacks, including $80 million in dividends and the repurchase and cancellation of 3.1 million shares under the NCIB.Realized an average natural gas price of $6.01/mcf after hedging in 2025, more than three times the AECO benchmark, reflecting structural exposure to premium international gas markets and portfolio diversification.Reported a net loss of $654 million ($4.25/basic share) driven by discontinued operations related to the sale of Saskatchewan and U.S. assets, and non-cash, price-related impairments on mature legacy assets in Australia, France, and Ireland, with no impact on 2025 FFO, liquidity or ongoing operations.Record production of 119,919 boe/d(10) (65% natural gas), representing 46% per share growth year over year. Production comprised of 90,062 boe/d(10) from North American assets and 29,857 boe/d(10) from International assets.Year-end total proved plus probable ("2P") reserves increased by 36% year over year to 592 mmboe(13), reflecting a reserve life index of 14 years and a reserves replacement of over 450%.Proved developed producing ("PDP") and 2P finding, development and acquisition ("FD&A") costs(14), including changes in future development costs ("FDC") of $14.91/boe and $7.71/boe, respectively, resulting in a FD&A Operating Recycle Ratio(15) of 1.8 times and 3.5 times, respectively.Before-tax net present value ("NPV") of 2P reserves, discounted at 10%, of $4.8 billion(13) or $23 per share(13) after deducting year-end net debt. The 2P NPV includes the development of 23% of Vermilion's internally identified inventory in the Deep Basin and Montney.Q4 2025 ResultsGenerated $241 million ($1.57/basic share)(2) of FFO(1) and $49 million of FCF(6), fully funding $192 million of E&D capital expenditures(3).Vermilion reduced net debt by $42 million and returned $26 million to shareholders through dividends and share buybacks, comprising $20 million in dividends and the repurchase and cancellation of 0.6 million shares through the NCIB.Realized an average natural gas price of $5.50/mcf after hedging in Q4 2025, more than twice the AECO benchmark, reflecting diversified market access.Reported a net loss from continuing operations of $438 million ($2.86/basic share), driven by non-cash impairments on legacy assets with no impact on quarterly FFO or FCF.Production averaged 121,308 boe/d(10) (69% natural gas), up 46% per share versus Q4 2024 with 91,171 boe/d(10) from North America and 30,137 boe/d(10) from International assets.During the quarter, Vermilion brought online several top performing Deep Basin wells, including wells that were deferred to mid-Q4 2025 to maximize profitability. With these wells coming on production in the quarter, as well as previously shut-in wells being brought back online, production from continuing operations in Canada was over 5,000 boe/d higher than the prior quarter.In the Montney, our Mica asset generated record production of over 16,000 boe/d in Q4 2025, while we spud the most recent pad and remained focused on continued improvement of both operating and drilling and completion costs.In the Netherlands, successfully brought two (1.2 net) conventional natural gas wells on production and advanced permitting and preparatory work for additional drilling in 2026.In Germany, advanced infrastructure construction for the Wisselshorst well, which remains on track for first production in mid-2026, while the Osterheide well delivered average production of approximately 10 mmcf/d, representing a 45% increase from Q3 2025.Operationally, the fourth quarter of 2025 was reflective of our focus on continuous improvement. Unit operating costs in Canada benefitted from greater operational scale, high-quality assets and commitment to cost management to reach their lowest level in over a decade, which drove corporate unit operating costs of $11.86/boe, the lowest since 2020.OutlookVermilion expects Q1 2026 production to average 122,000 to 124,000 boe/d (70% natural gas)(16), with full-year production of 118,000 to 122,000 boe/d (70% natural gas)(16) on E&D capital expenditures of $600 to $630 million.Declared a quarterly cash dividend of $0.135 per common share, payable on March 31, 2026, to shareholders of record on March 13, 2026. As previously announced, this quarterly cash dividend represents a 4% increase over the prior dividend, and the fifth consecutive year of dividend increases. ($M except as indicated)Q4 2025Q3 2025Q4 202420252024Financial
Fund flows from operations (1)240,734253,810262,6981,010,2511,205,783 Fund flows from operations ($/basic share) (2)1.571.651.706.587.63 Fund flows from operations ($/diluted share) (2)1.551.641.686.517.55Net earnings (loss)
Net loss from continuing operations (438,119)(4,774)(18,524)(364,805)(96,169)Net earnings (loss) from discontinued operations 4667,331208(288,796)49,430Net earnings (loss)(437,653)2,557(18,316)(653,601)(46,739) Net loss from continuing operations ($/basic share)(2.86)(0.03)(0.12)(2.37)(0.61) Net earnings (loss) from discontinued operations ($/basic share)—0.05—(1.88)0.31 Net earnings (loss) ($/basic share)(2.86)0.02(0.12)(4.25)(0.30)Cash flows from operating activities133,357389,453212,587943,661967,751Cash flows used in (from) investing activities109,062(325,061)154,6721,238,736634,868Capital expenditures (3)191,752145,562200,659634,922622,980Acquisitions (4)1,6461,0685,2571,125,30322,101Dispositions (5)—483,525—483,525—Repurchase of shares 6,5276,32017,63735,746140,707Cash dividends ($/share)0.130.130.120.520.48Dividends declared19,89519,94718,52179,90775,327Free cash flow (6)48,982108,24862,039375,329582,803Long-term debt1,243,3971,264,343963,4561,243,397963,456Net debt (7)1,342,3901,384,753966,8821,342,390966,882Net debt to four quarter trailing fund flows from operations (8)1.41.40.81.40.8Shares outstanding - basic ('000s)152,950153,434154,344152,950154,344Weighted average shares outstanding - diluted ('000s) (9)155,183154,921156,184153,863158,068Operational
Production (10)
Crude oil and condensate (bbls/d)25,40128,19730,32730,83231,427 NGLs (bbls/d)12,14010,9856,61211,2447,100 Natural gas (mmcf/d)502.60479.28279.59467.06276.10 Total (boe/d)121,308119,06283,536119,91984,543Average realized prices
Crude oil and condensate ($/bbl)83.2191.93100.0689.98104.29 NGLs ($/bbl)21.1722.9929.3824.6930.61 Natural gas ($/mcf)5.134.368.475.386.72Average realized price ($/boe)40.9942.1866.5446.4263.58Production mix (% of production)
% priced with reference to AECO54 %52 %33 %50 %32 % % priced with reference to TTF and NBP15 %15 %23 %15 %22 % % priced with reference to WTI21 %23 %29 %25 %31 % % priced with reference to Dated Brent10 %10 %15 %10 %15 %Netbacks
Operating netback ($/boe) (11)25.6228.5443.9229.9147.18 Fund flows from operations ($/boe) (12)21.4722.8234.6723.1038.71(1) Fund flows from operations (FFO) is a total of segments and non-GAAP financial measure most directly comparable to net loss and is calculated as sales less royalties, transportation expense, operating expense, G&A expense, corporate income tax expense (recovery), PRRT expense, interest expense, equity based compensation settled in cash, realized (gain) loss on derivatives, realized foreign exchange (gain) loss, and realized other (income) expense. The measure is used by management to assess the contribution of each business unit to Vermilion's ability to generate income necessary to pay dividends, repay debt, fund asset retirement obligations, and make capital investments. FFO does not have a standardized meaning under IFRS® Accounting Standards and therefore may not be comparable to similar measures provided by other issuers. More information and a reconciliation to net earnings (loss), the most directly comparable primary financial statement measure, can be found in the "Non-GAAP and Other Specified Financial Measures" section of this document. Fund flows from continuing operations and fund flows from discontinued operations are calculated in the same manner as FFO and are most directly comparable to net earnings (loss) from continuing operations and net earnings (loss) discontinued operations, respectively.
(2) Fund flows from operations per basic share and diluted share is calculated by dividing fund flows from operations (total of segments and non-GAAP financial measure) by the basic weighted average shares outstanding as defined under IFRS Accounting Standards. Fund flows from operations per diluted share is calculated by dividing fund flows from operations by the sum of basic weighted average shares outstanding and incremental shares issuable under the equity based compensation plans as determined using the treasury stock method. Management assesses fund flows from operations on a per share basis as we believe this provides a measure of our operating performance after taking into account the issuance and potential future issuance of Vermilion common shares. More information and a reconciliation to cash flows used in investing activities, the most directly comparable primary financial statement measure, can be found in the "Non-GAAP and Other Specified Financial Measures" section of this document. Fund flows from continuing operations per basic and diluted share and fund flows from discontinued operations per basic and diluted share are calculated in the same manner as FFO per basic and diluted share.
(3) Capital expenditures is a non-GAAP financial measure most directly comparable to cash flows used in investing activities and is calculated as the sum of drilling and development costs and exploration and evaluation costs. Management considers capital expenditures to be a useful measure of our investment in our existing asset base. Capital expenditures does not have a standardized meaning under IFRS Accounting Standards and therefore may not be comparable to similar measures provided by other issuers. More information and a reconciliation to cash flows used in investing activities, the most directly comparable primary financial statement measure, can be found in the "Non-GAAP and Other Specified Financial Measures" section of this document. Capital expenditures is also referred to as E&D capital expenditures.
(4) Acquisitions is a non-GAAP financial measure and is not a standardized financial measure under IFRS Accounting Standards and therefore may not be comparable to similar measures disclosed by other issuers. Acquisitions is calculated as the sum of acquisitions, net of cash acquired, acquisitions of securities and net acquired working capital (deficit). Management believes that including these components provides a useful measure of the economic investment associated with our acquisition activity and is most directly comparable to cash flows used in investing activities. More information and a reconciliation to acquisitions, net of cash acquired and acquisition of securities, the most directly comparable primary financial statement measure, can be found in the "Non-GAAP and Other Specified Financial Measures" section of this document.
(5) Dispositions is a non-GAAP financial measure and is not a standardized financial measure under IFRS Accounting Standards and therefore may not be comparable to similar measures disclosed by other issuers. Dispositions is calculated as the sum of dispositions, and disposition of securities. Management believes that including these components provides a useful measure of the proceeds associated with our disposition activities and is most directly comparable to cash flows used in investing activities. More information and a reconciliation to dispositions and disposition of securities, the most directly comparable primary financial statement measures, can be found in the "Non-GAAP and Other Specified Financial Measures" section of this document.
(6) Free cash flow (FCF) and excess free cash flow (EFCF) are non-GAAP financial measures most directly comparable to cash flows from operating activities. FCF is calculated as FFO less drilling and development costs and exploration and evaluation costs and EFCF is calculated as FCF less payments on lease obligations and asset retirement obligations settled. FCF is used by management to determine the funding available for investing and financing activities including payment of dividends, repayment of long-term debt, reallocation into existing business units and deployment into new ventures. EFCF is used by management to determine the funding available to return to shareholders after costs attributable to normal business operations. FCF and EFCF do not have standardized meanings under IFRS Accounting Standards and therefore may not be comparable to similar measures provided by other issuers. More information and a reconciliation to cash flows from operating activities, the most directly comparable primary financial statement measure, can be found in the "Non-GAAP and Other Specified Financial Measures" section of this document.(7) Net debt is a capital management measure in accordance with IAS 1 "Presentation of Financial Statements" that is most directly comparable to long-term debt and is calculated as long-term debt (excluding unrealized foreign exchange on swapped USD borrowings) plus adjusted working deficit (capital), a non-GAAP financial measure described in the "Non-GAAP and Other Specified Financial Measures" section of this document. Management considers this a helpful representation of Vermilion's net financing obligations after adjusting for the timing of working capital fluctuations. More information and a reconciliation to long-term debt, the most directly comparable primary financial statement measure, can be found in the "Non-GAAP and Other Specified Financial Measures" section of this document.
(8) Net debt to four quarter trailing fund flows from operations is a non-GAAP ratio and is not a standardized financial measure under IFRS Accounting Standards and therefore may not be comparable to similar measures disclosed by other issuers. Net debt to four quarter FFO is calculated as net debt divided by FFO from the preceding four quarters. Management uses this measure to assess the Company's ability to repay debt. More information can be found in the "Non-GAAP and Other Specified Financial Measures" section of this document.
Subsequent to February 26, 2025, net debt to four quarter trailing fund flows from operations is calculated inclusive of Westbrick Energy's pre-acquisition four quarter trailing fund flows from operations, as if the acquisition of Westbrick Energy occurred at the beginning of the four quarter trailing period, and exclusive of the four quarter trailing fund flows from discontinued operations to reflect the Company's ability to repay debt on a pro forma basis.
(9) Diluted shares outstanding represents the sum of shares outstanding at the period end plus outstanding awards under the Long-term Incentive Plan, based on current estimates of future performance factors and forfeiture rates.
(10) Please refer to Supplemental Table 4 "Production" of the accompanying Management's Discussion and Analysis for disclosure by product type.
(11) Operating netback is a non-GAAP financial measure that is not standardized under IFRS Accounting Standards and may not be comparable to similar measures disclosed by other issuers. Operating netback is most directly comparable to net (loss) earnings and is calculated as sales less royalties, operating expense, transportation expense, PRRT expense, and realized hedging (gain) loss, and when presented on a per unit basis is a non-GAAP ratio. Management assesses operating netback as a measure of the profitability and efficiency of our field operations. More information and a reconciliation to net (loss) earnings, the most directly comparable primary financial statement measure, can be found in the "Non-GAAP and Other Specified Financial Measures" section of this document.
(12) Fund flows from operations per boe is a non-GAAP ratio that is not standardized under IFRS Accounting Standards and may not be comparable to similar measures disclosed by other issuers. FFO per boe is calculated as FFO divided by boe production. FFO per boe is used by management to assess the profitability of Vermilion's business units and Vermilion as a whole. More information can be found in the "Non-GAAP and Other Specified Financial Measures" section of this document. Fund flows from continuing operations per boe and fund flows from discontinued operations per boe are calculated in the same manner as FFO per boe.
(13) Estimated gross proved, developed and producing, total proved, and total proved plus probable reserves as evaluated by McDaniel & Associates Consultants Ltd. ("McDaniel") in a report dated March 3, 2026 with an effective date of December 31, 2025 (the "McDaniel Reserves Report"). See Vermilion's annual information form for the year ended December 31, 2025 for additional information, including reserve pricing assumptions. Per share metrics calculated using basic shares outstanding at December 31, 2025.
(14) F&D (finding and development) and FD&A (finding, development and acquisition) costs are calculated by dividing the applicable capital expenditures for the period, including the change in undiscounted FDC (future development capital), by the change in the reserves, incorporating revisions and production, for the same period. More information can be found in the "Non-GAAP Financial Measures and Other Specified Financial Measures" section of this document.
(15) Operating Recycle Ratio is a non-GAAP ratio that is calculated by dividing the Operating Netback, excluding PRRT and realized hedging gains and losses, by the cost of adding reserves (F&D and FD&A cost). For the purposes of calculating 2025 Operating Recycle Ratio, this netback number was $26.60. More information can be found in the "Non-GAAP Financial Measures and Other Specified Financial Measures" section of this document.
(16) Based on Company estimates as at March 2, 2026.Message to ShareholdersIt was an impactful year for Vermilion, repositioning the Company as a Global Gas Producer with long-duration assets, improving profitability and growing free cash flow ("FCF") per share. Through the acquisition of Westbrick Energy Ltd. and the divestments of our Saskatchewan and United States businesses, our go-forward strategy is focused on our gas-weighted assets in Canada and Europe. Our portfolio is anchored by liquids–rich gas assets in the Deep Basin and Montney, complemented by premium-priced European gas assets in Germany, Ireland and the Netherlands. This exposure to global commodity prices remains a strategic advantage for Vermilion, as illustrated by our 2025 realized gas price, after hedging, of $6.01/mcf, which benefits from direct exposure to European gas prices. Europe is on track to exit the winter season with gas inventories well below the five-year average, and the requirement to refill storage ahead of the next winter season is expected to be positive to gas fundamentals.Our repositioned global gas portfolio is characterized by higher production per share and a lower cost structure, the combination of which delivers growing FCF – all underpinned by high-quality, long-life assets. Through acquisitions and exploration, we have secured large in-place resource that provides decades of development opportunities. We continue to improve on controllable elements of our business – including safety, production and costs – driving stronger profitability. Our strategic investments in Mica Montney infrastructure to achieve our target production of 28,000 boe/d, while leveraging existing Deep Basin infrastructure to profitably grow production, along with development of an existing large gas discovery in Germany, will deliver a sustainable increase in excess free cash flow ("EFCF"). The long duration of our asset base and our commitment to disciplined capital allocation, combined with a low share count, benefits our shareholders through enhanced per share outcomes. With fewer than 153 million shares outstanding, Vermilion is well positioned to add meaningful per-share value as we execute on our strategic objectives.Vermilion has a clear strategic roadmap to 2030, with a significant increase in FCF anticipated in 2028, as outlined in our recent Investor Day, which utilized a flat commodity price assumption. The roadmap underscores the depth and quality of Vermilion's portfolio well beyond 2030 and reinforces our conviction in the Company's long–term value proposition.Our long-term execution is driven by our focus on what we can control. Through a busy year of acquisition and divestiture activity, Vermilion delivered strong operational and financial performance, with Q4 2025 representing another solid quarter. Production in Q4 2025 exceeded the top end of our guidance range, while fund flows from operations ("FFO") benefitted from strong realized pricing and an improved cost structure. In the Deep Basin, we brought online some of the strongest gas wells in Alberta, which reinforces our confidence in the quality of our assets and our 2026 drilling program. Our Mica Montney asset achieved record quarterly production and successfully delineated additional acreage on the Alberta side of our asset. Global gas sales in Q4 2025 continued to benefit from strong realizations, with a realized price, after hedging, of $5.50/mcf, more than doubling the AECO benchmark for the quarter. Vermilion's direct European gas exposure, over 110 mmcf/d in Q4 2025, is a significant driver of this outperformance, while our Canadian gas production benefitted from enhanced market diversification and a sophisticated hedging program to exceed local benchmark prices.We are encouraged by Vermilion's recent performance and are excited about the outlook we shared at Investor Day. We remain focused on improving profitability and resilience across the business. With a high-quality asset base and a strong team in place, we are confident in our ability to grow FCF, reduce net debt, and return capital to shareholders – and in our ability to maintain this performance for many years to come.Q4 2025 ReviewVermilion generated $241 million of FFO in Q4 2025, with FCF of $49 million on E&D capital expenditures of $192 million. During the quarter, the Company recorded non-cash, price-related impairment charges related to legacy mature assets in Australia, France and Ireland. These price-related impairments on legacy mature assets are not an indication of deterioration in the performance or outlook of Vermilion's mature asset portfolio. With respect to Ireland, the $304 million non-cash impairment represents a partial reversal of the price-driven $439 million non-cash gain on acquisition recorded in 2023 in Ireland, based upon lower European gas prices.Production averaged 121,308 boe/d (69% natural gas)(1), with full-year 2025 production of 119,919 boe/d (65% natural gas)(1). Production from Vermilion's Canadian continuing operations averaged 91,053 boe/d(1) in Q4 2025, a 6% increase over the prior quarter, reflecting strong performance from recent Deep Basin wells and production from previously shut-in wells being brought back online. Production from Vermilion's International operations averaged 30,137 boe/d(1) in Q4 2025, in-line with the prior quarter, as new production in the Netherlands and higher gas production in Germany largely offset natural declines in Ireland, Australia and Croatia.In Canada, the Company maintained a three-rig drilling program in the Deep Basin, drilling sixteen (16.0 net), completing fourteen (14.0 net), and bringing on production seventeen (17.0 net) liquids-rich gas wells. The Company elected to defer start-up of several highly productive wells that were drilled and completed in Q3 2025 to mid-Q4 2025 to maximize profitability. With these wells coming on production in the quarter, as well as previously shut-in wells being brought back online, production from continuing operations in Canada was over 5,000 boe/d higher than the prior quarter. In addition to record Q4 production in the Montney, we drilled four (4.0 net) liquids-rich shale gas wells that are expected to be completed and brought online in 2026.In the Netherlands, Vermilion completed and brought on production two (1.2 net) conventional natural gas wells in Q4 2025. The Company also progressed preliminary work to facilitate drilling one (0.5 net) well in Netherlands in 2026, including receiving certain required permits. In Germany, we progressed infrastructure build-out for the first Wisselshorst well (0.6 net) during Q4 2025 and we expect first production from this well in mid-2026. In addition, the Osterheide well (1.0 net) that was brought on production earlier in the year increased production in Q4 2025, with average production of 10 mmcf/d (1,600 boe/d) up 45% compared to the prior quarter.Operationally, the fourth quarter of 2025 was reflective of our focus on continuous improvement. In Canada, our greater operational scale, high-quality assets and commitment to cost management drove unit operating costs to their lowest level in over a decade. On a corporate basis, this resulted in unit operating costs of $11.86, the lowest since 2020.During the fourth quarter of 2025, we accelerated debt reduction by selling a portion of our ownership of Coelacanth Energy Inc. ("Coelacanth"). The transactions, completed in December 2025, resulted in $42MM of incremental debt reduction and a realized gain on disposition of $12 million. We continue to hold a 10.1% ownership in Coelacanth and will continue to monitor delineation activity on the Coelacanth asset base.2025 Reserves UpdateVermilion's reserves are evaluated by the Company's independent qualified reserves evaluator. Total proved developed producing ("PDP") reserves increased by 25% from the prior year to 210 mmboe(2), while proved plus probable ("2P") reserves increased by 36% from the prior year to 592 mmboe(2), driven by organic growth and Vermilion's acquisition in the Deep Basin of Alberta that closed in February 2025. Vermilion added 86 mmboe of PDP reserves and 201 mmboe of 2P reserves at an average finding, development and acquisition ("FD&A")(3) cost, including future development costs, of $14.91 and $7.71 per boe, respectively, resulting in an operating recycle ratio(4) of 1.8 times on a PDP basis and 3.5 times on a 2P basis. The PDP and 2P additions reflect reserves replacement of 196% and 459%, respectively.The 2P reserve life index at December 31, 2025, is 14 years, which is consistent with our long-term average. Vermilion's internal estimate of drilling locations across our 1.3 million net acres in the Deep Basin and Montney is approximately 1,700 locations(5), of which 23% are included in our year-end reserves. In addition, internal estimates of gas initially in place related to exploration and development prospects in Europe are not included in our year-end reserves, and therefore Vermilion believes there is significant upside to future European gas reserves given our 1.4 million net acre land base across Germany and the Netherlands and the Company's track record of exploration success. The before-tax net present value of 2P reserves, discounted at 10%, using three consultant average January 1, 2026 pricing, is $4.8 billion(2), or $23 per basic share(2) after deducting year-end net debt. PDP reserves at December 31, 2025 do not reflect any volumes or present value of reserves associated with the Wisselshorst discovery on the Bommelsen license, while 2P reserves include approximately 7 mmboe of reserves associated with the initial discovery. Vermilion has identified up to six additional drilling locations on the Bommelsen license that currently have no reserves assigned.The following table provides a summary of company interest reserves by reserve category and region on an oil equivalent basis. Please refer to Vermilion's 2025 Annual Information Form for the year ended December 31, 2025 ("2025 Annual Information Form") for detailed information by country and product type.BOE (mboe)Proved Developed
ProducingProved Developed
Non-ProducingProved
UndevelopedProvedProbableProved Plus
ProbableNorth America164,0986,109140,195310,403190,972501,374International46,1111,7999,79457,70333,25890,962Vermilion210,2097,908149,989368,106224,230592,336The following table provides a reconciliation of changes in company interest reserves by reserve category and region. Please refer to Vermilion's 2025 Annual Information Form for detailed information by country and product type and for an explanation concerning the reserve change categories. The following tables may not total due to rounding.PDP (mboe)North AmericaInternationalVermilionDecember 31, 2024114,37653,600167,976Discoveries———Extensions & Improved Recovery15,12417015,294Technical Revisions15,7715,29921,071Acquisitions90,620—90,620Dispositions(36,753)—(36,753)Economic Factors(2,167)(2,061)(4,229)Production(32,873)(10,898)(43,771)December 31, 2025164,09846,111210,2091P (mboe)North AmericaInternationalVermilionDecember 31, 2024210,67068,453279,123Discoveries———Extensions & Improved Recovery29,8603,89033,750Technical Revisions(942)(1,530)(2,472)Acquisitions177,154—177,154Dispositions(70,807)—(70,807)Economic Factors(2,661)(2,212)(4,872)Production(32,873)(10,898)(43,771)December 31, 2025310,40357,703368,106 2P (mboe)North AmericaInternationalVermilionDecember 31, 2024330,612104,496435,109Discoveries———Extensions & Improved Recovery70,6616,41877,079Technical Revisions(11,051)(7,099)(18,150)Acquisitions249,963—249,963Dispositions(102,661)—(102,661)Economic Factors(3,278)(1,956)(5,233)Production(32,873)(10,898)(43,771)December 31, 2025501,37490,962592,336Additional information about the McDaniel Reserves Report can be found in our Annual Information Form on our website at www.vermilionenergy.com and on SEDAR+ at www.sedarplus.ca.Outlook and Guidance UpdateVermilion expects Q1 2026 production to average 122,000 to 124,000 boe/d (70% natural gas)(6). Q1 2026 production includes temporary downtime in Australia related to a category three cyclone event. Our staff in Australia successfully managed the safe shutdown and exported approximately 300,000 barrels of oil in Q1 2026, and are now focused on completing the necessary repair work to support the restart of operations following the shutdown.Full-year 2026 guidance is unchanged, with the Company expecting to deliver production of 118,000 to 122,000 boe/d (70% gas)(6) on E&D capital expenditures of $600 to $630 million and reflects the impact of operated and non-operated maintenance in Europe planned for Q3 2026, including a 32-day turnaround in Ireland, which occurs on a five-year cycle.Commodity HedgingVermilion hedges to manage commodity price exposures and increase the stability of our cash flows. In aggregate, we have 48% of our expected net-of-royalty production hedged for 2026. With respect to individual commodity products, we have hedged 50% of our European natural gas production, 53% of our crude oil production, and 45% of our North American natural gas volumes, respectively. Please refer to the Hedging section of our website under Invest With Us for further details using the following link:https://www.vermilionenergy.com/invest-with-us/hedging.(Signed "Dion Hatcher")Dion Hatcher
President & Chief Executive Officer
March 4, 2026(1) Please refer to Supplemental Table 4 "Production" of the accompanying Management's Discussion and Analysis for disclosure by product type.
(2) Estimated gross proved, developed and producing, total proved, and total proved plus probable reserves as evaluated by McDaniel & Associates Consultants Ltd. ("McDaniel") in a report dated March 3, 2026 with an effective date of December 31, 2025 (the "McDaniel Reserves Report"). See Vermilion's annual information form for the year ended December 31, 2025 for additional information, including reserve pricing assumptions. Per share metrics calculated using basic shares outstanding at December 31, 2025.
(3) F&D (finding and development) and FD&A (finding, development and acquisition) costs are calculated by dividing the applicable capital expenditures for the period, including the change in undiscounted FDC (future development capital), by the change in the reserves, incorporating revisions and production, for the same period. More information can be found in the "Non-GAAP Financial Measures and Other Specified Financial Measures" section of this document.
(4) Operating Recycle Ratio is a non-GAAP ratio that is calculated by dividing the Operating Netback, excluding PRRT and realized hedging gains and losses, by the cost of adding reserves (F&D and FD&A cost). For the purposes of calculating 2025 Operating Recycle Ratio, this netback number was $26.60. More information can be found in the "Non-GAAP Financial Measures and Other Specified Financial Measures" section of this document.
(5) Refer to the disclaimer on Estimates of Drilling Locations.
(6) Based on Company estimates as at March 2, 2026.Conference CallVermilion will discuss these results in a conference call and webcast presentation on Thursday, March 5, 2026, at 8:00 AM MT (10:00 AM ET). To participate, call 1-888-510-2154 (Canada and US Toll Free) or 1-437-900-0527 (International and Toronto Area). A recording of the conference call will be available for replay by calling 1-888-660-6345 (Canada and US Toll Free) or 1-289-819-1450 (International and Toronto Area) and using conference replay entry code 44923# from March 5, 2026, at 12:00 PM MT to March 12, 2026, at 12:00 PM MT.To join the conference call without operator assistance, you may register and enter your phone number at https://emportal.ink/4aeRBlw to receive an instant automated call back. You may also access the webcast at https://app.webinar.net/D4NkgeAgAMJ. The webcast link will be available on Vermilion's website at https://www.vermilionenergy.com/invest-with-us/events-presentations/ under Upcoming Events prior to the conference call.Participants who would like to submit questions ahead of time may do so by emailing investor_relations@vermilionenergy.com.Non-GAAP and Other Specified Financial MeasuresThis report and other materials released by Vermilion includes financial measures that are not standardized, specified, defined, or determined under IFRS Accounting Standards and are therefore considered non-GAAP or other specified financial measures and may not be comparable to similar measures presented by other issuers. These financial measures include:Total of Segments MeasuresFund flows from operations (FFO): Most directly comparable to net loss, FFO is a non-GAAP financial measure and total of segments measure comprised of sales less royalties, transportation, operating, G&A, corporate income tax, PRRT, interest expense, equity based compensation settled in cash, realized gain (loss) on derivatives, realized foreign exchange gain (loss), and realized other income (expense). The measure is used by management to assess the contribution of each business unit to Vermilion's ability to generate income necessary to pay dividends, repay debt, fund asset retirement obligations and make capital investments. Reconciliation to the most directly comparable primary financial statement measures can be found below. Fund flows from continuing operations and fund flows from discontinued operations are calculated in the same manner as FFO and is most directly comparable to net earnings (loss) from continuing operations and net earnings (loss) discontinued operations, respectively.Reconciliation of fund flows from continuing operations to net loss from continuing operations:
Q4 2025Q4 202420252024
$M$/boe$M$/boe$M$/boe$M$/boeSales458,72240.96410,01865.541,820,75144.681,546,49361.09Royalties(32,367)(2.89)(21,728)(3.47)(119,124)(2.92)(92,916)(3.67)Transportation(36,178)(3.23)(21,253)(3.40)(132,883)(3.26)(86,247)(3.41)Operating(133,133)(11.89)(108,141)(17.29)(508,521)(12.48)(446,173)(17.62)General and administration (1)(25,698)(2.29)(20,645)(3.30)(98,450)(2.42)(74,010)(2.92)Corporate income tax expense 8,8070.79(15,996)(2.56)(26,044)(0.64)(66,423)(2.62)Petroleum resource rent tax8,3910.753,2260.522,9550.07(11,702)(0.46)Interest expense(27,670)(2.47)(23,965)(3.83)(132,748)(3.26)(84,606)(3.34)Equity based compensation(627)(0.06)——(6,319)(0.16)(14,361)(0.57)Realized gain on derivatives21,0371.8828,7954.60141,6483.48345,31813.64Realized foreign exchange gain930.012,4420.391,2230.037,7350.31Realized other expense(844)(0.08)(5,119)(0.82)(15,800)(0.39)(7,267)(0.29)Fund flows from continuing operations240,53321.48227,63436.38926,68822.731,015,84140.14Equity based compensation(5,693)
(7,499)
(18,847)
(15,569)
Unrealized gain (loss) on derivative instruments (2)53,894
(137,273)
116,299
(452,858)
Unrealized foreign exchange gain (loss) (2)30,421
(29,079)
(41,098)
(59,463)
Accretion(19,202)
(17,112)
(71,629)
(66,179)
Depletion and depreciation(209,384)
(131,139)
(697,461)
(563,982)
Deferred tax recovery (expense) 31,754
80,955
(16,901)
51,875
Impairment expense(572,159)
—
(572,159)
—
Unrealized other income (expense) (2)11,717
(5,011)
10,303
(5,834)
Net loss from continuing operations(438,119)
(18,524)
(364,805)
(96,169)
(1) General and administration expenses previously presented within the Corporate segment have been reclassified to our Canadian segment. The prior period results have been presented to conform with current period presentation.(2) Unrealized gain (loss) on derivative instruments, Unrealized foreign exchange gain (loss), and Unrealized other income (expense) are line items from the respective Consolidated Statements of Cash Flows. Reconciliation of fund flows from discontinued operations to net earnings (loss) from discontinued operations:
Q4 2025Q4 202420252024
$M$/boe$M$/boe$M$/boe$M$/boeSales82776.8394,33471.23210,64369.80434,91474.40Royalties(205)(19.04)(18,321)(13.83)(40,591)(13.45)(85,034)(14.55)Transportation(38)(3.53)(2,708)(2.04)(7,007)(2.32)(12,686)(2.17)Operating17015.79(31,425)(23.73)(59,115)(19.59)(121,740)(20.83)General and administration(553)(51.37)(6,815)(5.15)(20,367)(6.75)(25,493)(4.36)Corporate income tax expense——(1)———(19)—Fund flows from discontinued operations20118.6835,06426.4883,56327.69189,94232.49Unrealized foreign exchange (loss) gain (1)(207)
562
(308)
992
Unrealized other expense (1)—
—
(3,986)
—
Accretion—
(2,160)
(4,235)
(8,362)
Depletion and depreciation585
(32,319)
(45,926)
(119,258)
Deferred tax (expense) recovery(113)
(939)
54,482
(13,884)
Impairment expense—
—
(372,386)
—
Net earnings (loss) from discontinued operations466
208
(288,796)
49,430
Fund flows from operations240,73421.47262,69834.671,010,25123.101,205,78338.71
Net loss(437,653)
(18,316)
(653,601)
(46,739)
(1) Unrealized gain (loss) on derivative instruments, Unrealized foreign exchange gain (loss), and Unrealized other income (expense) are line items from the respective Consolidated Statements of Cash Flows.Non-GAAP Financial Measures and Non-GAAP RatiosFund flows from operations per basic and diluted share: FFO per basic share and diluted share are non-GAAP ratios. Management assesses fund flows from operations on a per share basis as we believe this provides a measure of our operating performance after taking into account the issuance and potential future issuance of Vermilion common shares. Fund flows from operations per basic share is calculated by dividing fund flows from operations (total of segments measure) by the basic weighted average shares outstanding as defined under IFRS Accounting Standards. Fund flows from operations per diluted share is calculated by dividing fund flows from operations by the sum of basic weighted average shares outstanding and incremental shares issuable under the equity based compensation plans as determined using the treasury stock method. Fund flows from continuing operations per basic and diluted share and fund flows from discontinued operations per basic and diluted share are calculated in the same manner as FFO per basic and diluted share.Fund flows from operations per boe: Management uses fund flows from operations per boe to assess the profitability of our business units and Vermilion as a whole. Fund flows from operations per boe is calculated by dividing fund flows from operations (total of segments measure) by boe production. Fund flows from continuing operations per boe and fund flows from discontinued operations per boe are calculated in the same manner as FFO per boe.Free cash flow (FCF) and excess free cash flow (EFCF): Most directly comparable to cash flows from operating activities, FCF is a non-GAAP financial measure calculated as fund flows from operations less drilling and development costs and exploration and evaluation costs and EFCF is comprised of FCF less payments on lease obligations and asset retirement obligations settled. FCF is used by management to determine the funding available for investing and financing activities including payment of dividends, repayment of long-term debt, reallocation into existing business units and deployment into new ventures. EFCF is used by management to determine the funding available to return to shareholders after costs attributable to normal business operations. Reconciliation to the primary financial statement measures can be found in the following table.($M)Q4 2025Q4 202420252024Cash flows from operating activities133,357212,587943,661967,751Changes in non-cash operating working capital75,95326,8294,104182,698Asset retirement obligations settled 31,42423,28262,48655,334Fund flows from operations 240,734262,6981,010,2511,205,783Drilling and development(193,757)(176,505)(617,250)(586,962)Exploration and evaluation2,005(24,154)(17,672)(36,018)Free cash flow48,98262,039375,329582,803Payments on lease obligations(2,737)(82,060)(13,432)(101,539)Asset retirement obligations settled (31,424)(23,282)(62,486)(55,334)Excess free cash flow14,821(43,303)299,411425,930Capital expenditures: Most directly comparable to cash flows used in investing activities, capital expenditures is a non-GAAP financial measure calculated as the sum of drilling and development costs and exploration and evaluation costs as derived from the Consolidated Statements of Cash Flows. We consider capital expenditures to be a useful measure of our investment in our existing asset base. Capital expenditures are also referred to as E&D capital. Reconciliation to the primary financial statement measures can be found below.($M)Q4 2025Q4 202420252024Drilling and development193,757176,505617,250586,962Exploration and evaluation(2,005)24,15417,67236,018Capital expenditures191,752200,659634,922622,980Payout and payout % of FFO: Payout and payout % of FFO are, respectively, a non-GAAP financial measure and non-GAAP ratio. Payout is most directly comparable to dividends declared. Payout is comprised of dividends declared plus drilling and development costs, exploration and evaluation costs, and asset retirement obligations settled, and payout % of FFO is calculated as payout divided by FFO. The measure is used by management to assess the amount of cash distributed back to shareholders and reinvested in the business for maintaining production and organic growth. Payout as a percentage of FFO is also referred to as the payout ratio or sustainability ratio. The reconciliation of the measure to the primary financial statement measure can be found below.($M)Q4 2025Q4 202420252024Dividends declared19,89518,52179,90775,327Drilling and development193,757176,505617,250586,962Exploration and evaluation(2,005)24,15417,67236,018Asset retirement obligations settled31,42423,28262,48655,334Payout243,071242,462777,315753,641 % of fund flows from operations101 %92 %77 %63 %Return on capital employed (ROCE): A non-GAAP ratio, ROCE is a measure that management uses to analyze our profitability and the efficiency of our capital allocation process; the comparable primary financial statement measure is earnings before income taxes. ROCE is calculated by dividing net loss before interest and taxes ("EBIT") by average capital employed over the preceding twelve months. Capital employed is calculated as total assets less current liabilities while average capital employed is calculated using the balance sheets at the beginning and end of the twelve-month period.
Twelve Months Ended($M)Dec 31, 2025Dec 31, 2024Net loss(653,601)(46,739)Taxes(14,492)40,153Interest expense132,74884,606EBIT(535,345)78,020Average capital employed (1)5,120,5365,464,037Return on capital employed(10) %1 %(1) Average capital employed includes the current portion of asset retirement obligations, previously presented on a combined basis as long-term. The prior period results have been presented to conform with current period presentation.Adjusted working capital (deficit): Adjusted working capital (deficit) is a non-GAAP financial measure calculated as current assets less current liabilities, excluding current derivatives, current asset retirement obligations and current lease liabilities. The measure is used by management to calculate net debt, a capital management measure disclosed below.
As at($M)Dec 31, 2025Dec 31, 2024Current assets467,286582,326Current liabilities(554,547)(664,178)Current derivative asset(78,694)(40,312)Current asset retirement obligation (1)54,50453,588Current lease liability9,20612,206Current derivative liability6,15452,944Adjusted working capital deficit(96,091)(3,426)(1) Asset retirement obligations previously presented as a combined balance have been reclassified into current and long-term portion of asset retirement obligations. The prior period results have been presented to conform with current period presentation.Acquisitions: Acquisitions is a non-GAAP financial measure and is calculated as the sum of acquisitions, net of cash acquired and acquisitions of securities from the Consolidated Statements of Cash Flows, Vermilion common shares issued as consideration, the estimated value of contingent consideration, the amount of acquiree's outstanding long-term debt assumed, and net acquired working capital deficit or surplus. Management believes that including these components provides a useful measure of the economic investment associated with our acquisition activity and is most directly comparable to cash flows used in investing activities. A reconciliation to the acquisitions line items in the Consolidated Statements of Cash Flows can be found below.($M)Q4 2025Q4 202420252024Acquisitions, net of cash acquired1,6465,2571,088,76112,728Shares issued for acquisition——13,363—Acquisition of securities———9,373Acquired working capital deficit——23,179—Acquisitions1,6465,2571,125,30322,101Dispositions: Dispositions is a non-GAAP financial measure and is calculated as the sum of dispositions, and disposition of securities from the Consolidated Statements of Cash Flows. Management believes that including these components provides a useful measure of the proceeds associated with our disposition activities and is most directly comparable to cash flows used in investing activities. A reconciliation to dispositions, and disposition of securities, the most directly comparable primary financial statement measures, can be found below.($M)Q4 2025Q4 202420252024Dispositions——483,525—Disposition of securities41,782—41,782—Dispositions41,782—525,307—Operating netback: Operating netback is non-GAAP financial measure and is calculated as sales less royalties, operating expense, transportation costs, PRRT, and realized hedging gains and losses, and when presented on a per unit basis is a non-GAAP ratio. Operating netback is most directly comparable to net loss. Management assesses operating netback as a measure of the profitability and efficiency of our field operations.Net debt to four quarter trailing fund flows from operations: Management uses net debt (a capital management measure, as defined below) to four quarter trailing fund flows from operations to assess the Company's ability to repay debt. Net debt to four quarter trailing fund flows from operations is a non-GAAP ratio calculated as net debt (capital management measure) divided by fund flows from operations (total of segments measure) from the preceding four quarters.Capital Management MeasureNet debt: Net debt is a capital management measure in accordance with IAS 1 "Presentation of Financial Statements" that is most directly comparable to long-term debt. Net debt is comprised of long-term debt (excluding unrealized foreign exchange on swapped USD borrowings) plus adjusted working capital (defined as current assets less current liabilities, excluding current derivatives, current asset retirement obligations and current lease liabilities), and represents Vermilion's net financing obligations after adjusting for the timing of working capital fluctuations.
As at($M)Dec 31, 2025Dec 31, 2024Long-term debt1,243,397963,456Adjusted working capital (1)96,0913,426Unrealized FX on swapped USD borrowings (2)2,902—Net debt 1,342,390966,882
Ratio of net debt to four quarter trailing fund flows from operations (3)1.40.8(1) Adjusted working capital is defined as current assets (excluding current derivatives), less current liabilities (excluding current derivatives, current asset retirement obligations and current lease liabilities).(2) Vermilion may enter into cross currency interest rate swaps to hedge the foreign exchange movements on USD borrowings on our revolving credit facility. Unrealized FX on swapped USD borrowings relates to the unrealized gains and losses on our cross currency interest swaps. At December 31, 2025, there was $196.7 million of USD borrowings on our revolving credit facility. (December 31, 2024 - $nil).(3) Subsequent to February 26, 2025, net debt to four quarter trailing fund flows from operations is calculated inclusive of Westbrick Energy's pre-acquisition four quarter trailing fund flows from operations, as if the acquisition of Westbrick Energy occurred at the beginning of the four quarter trailing period, and exclusive of the four quarter trailing fund flows from discontinued operations to reflect the Company's ability to repay debt on a pro forma basis.Supplementary Financial MeasuresDiluted shares outstanding: The sum of shares outstanding at the period end plus outstanding awards under the Long-term Incentive Plan ("LTIP"), based on current estimates of future performance factors and forfeiture rates.('000s of shares)Q4 2025Q4 2024Shares outstanding152,950154,344Potential shares issuable pursuant to the LTIP4,6633,493Diluted shares outstanding157,613157,837Production per share growth: Calculated as the change in production determined on a per weighted average shares outstanding basis over a predefined period of time, expressed as a compounded, annualized return percentage. Measuring production growth per share better reflects the interests of our existing shareholders by reflecting the dilutive impact of equity issuances.F&D (finding and development) and FD&A (finding, development and acquisition) costs: used as a measure of capital efficiency, calculated by dividing the applicable capital expenditures for the period, including the change in undiscounted FDC (future development capital), by the change in the reserves, incorporating revisions and production, for the same period.Operating Recycle Ratio: A non-GAAP ratio that is calculated by dividing the Operating Netback, excluding PRRT and realized hedging gains and losses, by the cost of adding reserves (F&D and FD&A cost). Management assesses operating recycle ratio as a measure of the reinvestment of earnings.Management's Discussion and Analysis and Consolidated Financial StatementsTo view Vermilion's Management's Discussion and Analysis and Consolidated Financial Statements for the year ended December 31, 2025 and 2024, please refer to SEDAR+ (www.sedarplus.ca) or Vermilion's website at https://www.vermilionenergy.com/invest-with-us/reports-filings.cfm.About VermilionVermilion is a global gas producer that seeks to create value through the acquisition, exploration and development of liquids-rich natural gas in Canada and conventional natural gas in Europe while optimizing low-decline oil assets. This diversified portfolio delivers outsized free cash flow through direct exposure to global commodity prices and enhanced capital allocation optionality.Vermilion's priorities are health and safety, the environment, and profitability, in that order. Nothing is more important than the safety of the public and those who work with Vermilion, and the protection of the natural surroundings. In addition, the Company emphasizes strategic community investment in each of its operating areas.Vermilion trades on the Toronto Stock Exchange and the New York Stock Exchange under the symbol VET.DisclaimerCertain statements included or incorporated by reference in this document may constitute "forward-looking information" and "forward-looking statements" within the meaning of applicable Canadian securities laws and the United States Private Securities Litigation Reform Act of 1995, respectively (collectively referred to herein as "forward-looking statements or information"). Such forward-looking statements or information typically contain statements with words such as "anticipate", "believe", "expect", "plan", "intend", "estimate", "propose", "continue", "on track", "target", "focus", "grow", "will", "may", "could", or similar expressions or words suggesting future outcomes or statements regarding future events, performance, objectives, strategies or outlook. Forward-looking statements or information in this document may include, but are not limited to statements and information with respect to: capital expenditures and Vermilion's ability to fund such expenditures; future fund flows from operations and free cash flows; shareholder returns; Vermilion's anticipated future debt capacity and levels; Vermilion's budget; statements regarding the return of capital, the flexibility of Vermilion's capital program and operations; business strategies, objectives and priorities; operational and financial performance; estimated volumes of reserves and the discounted present value of future net cash flows from such reserves; petroleum and natural gas sales; future production levels and the timing thereof, including Vermilion's 2026 guidance, and rates of average annual production growth; the effect of changes in crude oil and natural gas prices, changes in exchange and interest rates and inflation rates; significant declines in production or sales volumes due to unforeseen circumstances; the effect of possible changes in critical accounting estimates; statements regarding the growth, number and production of Vermilion's future wells expected to be drilled; exploration and development plans and the timing thereof; Vermilion's aim and ability to reduce its debt; statements regarding Vermilion's hedging program, its plans to add to its hedging positions, and the anticipated impact of Vermilion's hedging program on project economics and free cash flows; the potential financial impact of climate-related risks; acquisition and disposition plans and the timing thereof; operating and other expenses, including the payment and amount of future dividends; royalty and income tax rates and Vermilion's expectations regarding future taxes and taxability; ongoing contractual commitments; asset retirement obligations; emissions targets, including reductions; sustainability and environmental, social and governance (ESG) and sustainability plans; and the timing of regulatory proceedings and the receipt of regulatory and third-party approvals.Such forward-looking statements or information are based on a number of assumptions of which all or any may prove to be incorrect. In addition to any other assumptions identified in this document, assumptions have been made regarding, among other things: the ability of Vermilion to obtain equipment, services and supplies in a timely manner to carry out its activities in Canada and internationally; the ability of Vermilion to market crude oil, natural gas liquids, and natural gas successfully to current and new customers; the timing and costs of pipeline and storage facility construction and expansion and the ability to secure adequate product transportation; the timely receipt of required regulatory, government and third-party approvals; the ability of Vermilion to obtain financing on acceptable terms; foreign currency exchange rates and interest rates and inflation rates; the accuracy of the McDaniel Reserves Report (defined below); the ability of the Company to identify, execute on and realize the anticipated benefits of attractive mergers and acquisitions opportunities; the ability of the Company to conduct operations in a safe manner; political stability of the areas in which the Company operates; the effects of changes to international trade policies; the accuracy of the Company's 2026 budget; the ability of the Company to retain key employees; production and decline rates; the absence of significant adverse changes to the legislative and regulatory frameworks, including regarding royalties, taxes and environmental matters; the political, economic and social states of the capital markets; global economic conditions; the ability of the Company to execute plans, including exploration and development plans; the success of present and future wells; future crude oil, natural gas liquids, and natural gas prices; and management's expectations relating to the timing and results of exploration and development activities.Although Vermilion believes that the expectations reflected in such forward-looking statements or information are reasonable, undue reliance should not be placed on forward-looking statements or information because Vermilion can give no assurance that such expectations will prove to be correct. Financial outlooks are provided for the purpose of understanding Vermilion's financial position and business objectives, and the information may not be appropriate for other purposes. Forward-looking statements or information are based on current expectations, estimates, and projections that involve a number of risks and uncertainties which could cause actual results to differ materially from those anticipated by Vermilion and described in the forward-looking statements or information. These risks and uncertainties include, but are not limited to: commodity prices; exchange rates; production and sales volumes; interest rates; geopolitical tensions; global tariffs; volatility of oil and gas prices; constraints at processing facilities and/or on transportation; volatility of foreign exchange rates; volatility of market price of Common Shares (defined below); hedging arrangements; inflationary pressures; increase in operating costs or a decline in production level; operator performance and payment delays; weather conditions; cost of new technology; tax, royalty, and other government legislation; government regulations; policy and legal risks; political events and terrorist attacks; discretionary nature of dividends and share buybacks; additional financing; debt service; variations in interest rates and foreign exchange rates; environmental legislation; hydraulic fracturing regulations; climate change; competition; international operations and future geographical/industry expansion; acquisition assumptions; failure to realize anticipated benefits of prior acquisitions; reserves estimates; cyber security; accounting adjustments; ineffective internal controls; the potential for new and increased U.S. tariffs and protectionist trade measures on Canadian oil and gas imports; and other risks and uncertainties described elsewhere in this document or in Vermilion's other filings with Canadian securities regulatory authorities.Many factors could cause Vermilion's or any particular business unit's actual results, performance, or achievements to vary from those described in this document, including, without limitation, those listed above and the assumptions upon which they are based proving incorrect. These factors should not be construed as exhaustive. Should one or more of these risks or uncertainties materialize, or should assumptions underlying forward-looking statements prove incorrect, actual results may vary materially from those described in this document as intended, planned, anticipated, believed, sought, proposed, estimated, forecasted, expected, projected, or targeted and such forward-looking statements included in this document should not be unduly relied upon. The impact of any one assumption, risk, uncertainty, or other factor on a particular forward-looking statement cannot be determined with certainty because they are interdependent and Vermilion's future decisions and actions will depend on management's assessment of all information at the relevant time. Such statements speak only as of the date of this document. The forward-looking statements or information contained in this document are made as of the date hereof and the Company undertakes no obligation to update publicly or revise any forward-looking statements or information, whether as a result of new information, future events or otherwise, unless required by applicable securities laws. The forward-looking statements contained in this document are expressly qualified by these cautionary statements.This document contains references to sustainability/ESG data and performance that reflect metrics and concepts that are commonly used in such frameworks as the Global Reporting Initiative, the Task Force on Climate-related Financial Disclosures, International Sustainability Standards Board and the Sustainability Accounting Standards Board. Vermilion has used best efforts to align with the most commonly accepted methodologies for ESG reporting, including with respect to climate data and information on potential future risks and opportunities, in order to provide a fuller context for our current and future operations. However, these methodologies are not yet standardized, are frequently based on calculation factors that change over time, and continue to evolve rapidly. Readers are particularly cautioned to evaluate the underlying definitions and measures used by other companies, as these may not be comparable to Vermilion's. While Vermilion will continue to monitor and adapt its reporting accordingly, the Company is not under any duty to update or revise the related sustainability/ESG data or statements except as required by applicable securities laws.All oil and natural gas reserve information contained in this document is derived from the McDaniel Reserves Report (as defined below) and has been prepared and presented in accordance with the Canadian Oil and Gas Evaluation Handbook and National Instrument 51-101, Standards of Disclosure for Oil and Gas Activities ("NI 51-101"). In this document: (A) the net present value of future net revenues attributable to reserves do not represent the fair market value of reserves; (B) the recovery and reserve estimates of crude oil, NGL and natural gas reserves provided in this document are estimates only and there is no guarantee that the estimated reserves will be recovered. Actual crude oil, natural gas and NGL reserves may be greater than or less than the estimates provided in this document; and (C) the estimates of reserves and future net revenue for individual properties may not reflect the same confidence level as estimates of reserves and future net revenue for all properties, due to the effects of aggregation.Under NI 51-101, disclosure of production volumes should include segmentation by product type as defined in the instrument. In this document, references to "crude oil" and "light and medium crude oil" mean "light crude oil and medium crude oil", "tight oil" or "heavy oil" and references to "natural gas" mean "conventional natural gas", "shale gas" or "coal bed methane".Natural gas volumes have been converted on the basis of six thousand cubic feet of natural gas to one barrel of oil equivalent. Barrels of oil equivalent (boe) may be misleading, particularly if used in isolation. A boe conversion ratio of six thousand cubic feet to one barrel of oil is based on an energy equivalency conversion method primarily applicable at the burner tip and does not represent a value equivalency at the wellhead.This document discloses certain oil and gas metrics, including reserve life index, finding, development and acquisition ("FD&A") costs, future development capital ("FDC") costs, which do not have standardized meanings or standard methods of calculation and therefore such measures may not be comparable to similar measures used by other companies and should not be used to make comparisons. Such metrics have been included in this document to provide readers with additional measures to evaluate the Company's performance; however, such measures are not reliable indicators of the Company's future performance and future performance may not compare to the Company's performance in previous periods and therefore such metrics should not be unduly relied upon.Estimates of Drilling Locations: Unbooked drilling locations are the internal estimates of Vermilion based on Vermilion's prospective acreage and an assumption as to the number of wells that can be drilled per section based on industry practice and internal review. Unbooked locations do not have attributed reserves or resources (including contingent and prospective). Unbooked locations have been identified by Vermilion's management as an estimation of Vermilion's multi-year drilling activities based on evaluation of applicable geologic, seismic, engineering, production and reserves information. There is no certainty that Vermilion will drill all unbooked drilling locations and if drilled there is no certainty that such locations will result in additional oil and natural gas reserves, resources or production. The drilling locations on which Vermilion will actually drill wells, including the number and timing thereof is ultimately dependent upon the availability of funding, regulatory approvals, seasonal restrictions, oil and natural gas prices, costs, actual drilling results, additional reservoir information that is obtained and other factors. While a certain number of the unbooked drilling locations have been de-risked by Vermilion drilling existing wells in relative close proximity to such unbooked drilling locations, the majority of other unbooked drilling locations are farther away from existing wells where management of Vermilion has less information about the characteristics of the reservoir and therefore there is more uncertainty whether wells will be drilled in such locations and if drilled there is more uncertainty that such wells will result in additional oil and gas reserves, resources or production.Financial data contained within this document are reported in Canadian dollars unless otherwise stated. References herein to "US$" or "USD" are to United States dollars.
View original content to download multimedia:https://www.prnewswire.com/news-releases/vermilion-energy-inc-delivers-record-annual-production-and-strong-reserve-recycle-ratios-q4-2025-production-exceeds-guidance-with-robust-fund-flows-from-operations-302704376.htmlSOURCE Vermilion Energy Inc.
Original: Vermilion Energy Inc. Delivers Record Annual Production and Strong Reserve Recycle Ratios, Q4 2025 Production Exceeds Guidance with Robust Fund Flows from Operations
 Hot Features
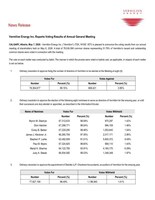


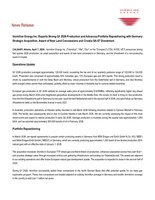


 iHub News
4月前
iHub News
4月前
 sakomoney
4年前
sakomoney
4年前
 dealerschool2006
5年前
dealerschool2006
5年前
 whytestocks
6年前
whytestocks
6年前
 Scotttrader80
6年前
Scotttrader80
6年前
 nowwhat2
10年前
nowwhat2
10年前

 メールアドレスで登録