 US Market News
2週前
US Market News
2週前
OceanaGold Reports Voting Results from its 2026 Annual Meeting of ShareholdersJune 9, 2026 5:30 PM
PR Newswire (US) VANCOUVER, BC, June 9, 2026 /PRNewswire/ - OceanaGold Corporation (TSX: OGC) (NYSE: OGC) ("OceanaGold" or the "Company") is pleased to report the voting results from the Annual General and Special Meeting of Shareholders of the Company (the "AGM") held today. A total of 184,072,822 common shares of the Company were represented in person or by proxy at the AGM, representing 82.06% of common shares outstanding as at the record date. Shareholders voted in favour of each of the items of business at the AGM.Election of DirectorsEach of the director nominees listed in OceanaGold's Management Information Circular dated April 23, 2026 was elected as a director of the Company to hold office for the ensuing year or until their successors are elected or appointed. Detailed results of the vote for each director are set out in the table below:DirectorsVotes For%Votes Withheld%Paul Benson132,452,77277.7038,003,87422.30Ian M. Reid169,552,11699.47904,5300.53Craig J. Nelsen169,280,30399.311,176,3430.69Sandra M. Dodds167,057,56598.013,399,0811.99Alan N. Pangbourne170,267,93199.89188,7150.11Linda M. Broughton170,153,52899.82303,1180.18Stefanie E. Loader169,432,12299.401,024,5240.60Gerard M. Bond170,272,11299.89184,5340.11Appointment of AuditorPricewaterhouseCoopers LLP was appointed as the auditor of the Company to hold office until the close of the next annual meeting of shareholders or until its successor is appointed, at a remuneration to be fixed by the directors of the Company.Votes For%Votes Withheld%180,933,13098.293,139,6921.71Advisory Vote on the Approach to Executive CompensationA non-binding resolution on the Company's approach to executive compensation was approved.Votes For%Votes Against%165,775,64997.254,680,9972.75Virtual-Only Annual General MeetingsA resolution to hold the Company's 2027 annual general meeting of shareholders in a virtual-only format was approved.Votes For%Votes Against%106,379,29562.4164,077,35137.59About OceanaGoldOceanaGold is a global intermediate gold and copper producer committed to safely and responsibly maximizing the generation of Free Cash Flow from our operations and delivering strong returns for our shareholders. We have a portfolio of four operating mines: the wholly-owned Haile Gold Mine in the United States of America; the wholly-owned Macraes and Waihi operations in New Zealand; and the 80%-owned Didipio Mine in the Philippines. View original content to download multimedia:https://www.prnewswire.com/news-releases/oceanagold-reports-voting-results-from-its-2026-annual-meeting-of-shareholders-302795835.htmlSOURCE OceanaGold Corporation Original: OceanaGold Reports Voting Results from its 2026 Annual Meeting of Shareholders
US Market News
1月前
OceanaGold Announces Additional High-Grade Drill Results at HaileMay 12, 2026 7:00 AM
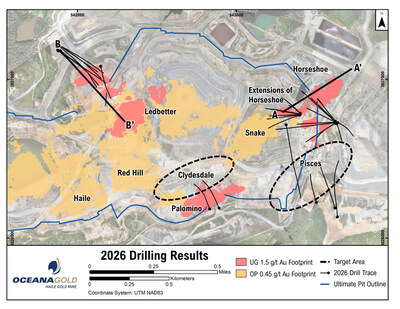
PR Newswire (US) VANCOUVER, BC, May 12, 2026 /PRNewswire/ - OceanaGold Corporation (TSX: OGC) (NYSE: OGC) ("OceanaGold" or the "Company") is pleased to announce high-grade results from its ongoing exploration and resource conversion drilling program at the Haile Gold Mine ("Haile") in the United States.Drilling Highlights (core length):Horseshoe Underground (conversion and extension drilling):15.5 m @ 30.64 g/t Au (UGD0121)30.5 m @ 13.86 g/t Au (UGD0113)22.5 m @ 13.42 g/t Au (UGD0122)18.4 m @ 9.62 g/t Au (UGD0119)21.9 m @ 6.48 g/t Au including 3.7 m @ 23.55 g/t Au (UGD0120)26.3 m @ 3.41 g/t Au and 44.3 m @ 3.72 g/t Au (UGD0107)Ledbetter Underground (conversion drilling):27.9 m @ 8.60 g/t Au (DDH1313)27.9 m @ 4.16 g/t Au (DDH1319)18.4 m @ 3.68 g/t Au (DDH1317)13.0 m @ 2.25 g/t Au and 17.1 m @ 8.20 g/t Au (DDH1283)2.6 m @ 9.63 g/t Au and 3.3 m @ 40.45 g/t Au (DDH1315)Clydesdale (initial drilling):14.5 m @ 15.81 g/t Au including 4.5 m @ 41.6 g/t Au (DDH1305)Gerard Bond, President and CEO of OceanaGold, said "Our ongoing exploration success at Haile continues to demonstrate our ability to add tremendous value through the drill bit. At Horseshoe, recent drilling points to reserve growth potential near existing infrastructure, with mineralization still open in multiple directions. Results from Ledbetter are strengthening confidence in down-plunge resource conversion, and a new significant high-grade intercept at Clydesdale confirms its potential as an emerging target area. As development of the Palomino decline progresses, we look forward to advancing these opportunities with further drilling from underground in the near term." Drill results can be viewed in 3D using VRIFY at the following link:https://vrify.com/meetings/recordings/3777660f-584a-43cb-82cc-c8fc9e773b08VRIFY note: Drill results reflect only those set forth in OceanaGold's press release dated May 12, 2026, and do not include all historical drill results except those relevant to the current targets in this release.Horseshoe UndergroundThe Horseshoe Underground has defined Mineral Reserves (see news release dated February 18, 2026) as well as three discrete zones of mineralization to the southwest (Horseshoe extensions), known as the upper (surface to 900mRL), middle (900mRl to 730mRL) and lower (below 730mRL) zones. Notably, all three of these zones are near both existing and planned underground development infrastructure. Success from the 2025 exploration program added Inferred Mineral Resources to the upper zone for the first time, while also expanding the Inferred Mineral Resources in the middle and lower zones. On the main Horseshoe orebody, the 2025 resource estimate resulted in conversion of Inferred to Indicated Mineral Resources in the lower mineralized zones. The 2026 drill program focuses on both resource conversion and extension of the main Horseshoe orebody and the three zones at Horseshoe extensions.At Horseshoe extensions (Figure 1), drilling totalling 14 holes for 4,372 m has targeted both conversion and extension opportunities. In the upper zone, the results of two holes - 15.5 m @ 30.64 g/t Au (UGD0121) and 18.4 m @ 9.62 g/t Au (UGD0119), confirm the continuity of the mineralization. Results from two extension holes in the upper zone - 21.9 m @ 6.48 g/t Au including 3.7 m @ 23.55 g/t Au (UGD0120) and 22.5 m @ 13.42 g/t Au (UGD0122), support expansion of the known mineralization in the area (Figure 2).Significant results between the middle and lower zones include 25.8 m @ 3.63 g/t Au (UGD0126) and 16.4 m @ 4.11 g/t Au (UGD0104), extending known mineralization to the west (Figure 2). Extensional drilling at the bottom of the lower zone returned 26.3 m @ 3.41 g/t Au and 44.3 m @ 3.72 g/t (UGD0107), adding mineralization at depth outside of the known resource. The lower zone remains open in multiple directions with additional follow-up drilling planned in this area (Figure 2).Since the last resource estimate, conversion drilling totalling 1,258 m in 4 holes has continued to target conversion of Inferred Mineral Resources in the lower levels of the main Horseshoe orebody (Figure 2). Notable intercepts include: 12.2 m @ 24.14 g/t Au (UGD0112); and 30.5 m @ 13.86 g/t Au (UGD0113). These results are in-line with the resource model and are expected to be included the next reserve update.Ledbetter UndergroundThe Company announced in February 2026 a change in the mining method for the final pit phase of Ledbetter to an underground mining mine. This has expanded the exploration opportunity at Ledbetter, as mineralization outside the prior pit shell is now potentially economic.In 2025, the Company began a drill program targeting known mineralization with the goal of converting Inferred Mineral Resources and increasing confidence down plunge of the existing reserve in an area referred to as Lobe 3. Eight holes have been drilled since the Company's news release dated September 11, 2025, with new drilling totalling 4,306 m. The highlight of the Ledbetter drilling is 27.9 m @ 4.16 g/t Au (DDH1319) in Lobe 3, which has infilled a gap in known resources, demonstrating continuity of high-grade mineralization. To the northeast, holes DDH1315 and DDH1317 targeted the conversion of Inferred Mineral Resources and returned higher grades than the model predicted, including a result of 18.44 m @ 3.68 g/t Au (DDH1317) (Figure 3).Advanced Drilling Targets – Clydesdale & PiscesThe Clydesdale target is located 100 m northwest of Palomino and approximately 300 m stratigraphically lower at approximately 800 m below surface. Drilling continues at Clydesdale with early-stage exploration results now reporting a second mineralized intercept showing good width and grade of 14.5 m @ 15.81 g/t Au (DDH1305) (refer to VRIFY). The Company has now defined two mineralized intercepts in this area (DDH1282, 6.2 m @ 4.11 g/t Au, previously reported), with additional drilling ongoing to further define the potential of this new mineralized zone.The Pisces target is located along the corridor between the Horseshoe and Palomino deposits at approximately 550 m below surface and close to existing and planned underground infrastructure. Drilling at Pisces is ongoing, with ~6,500 m planned. The work is focused on further understanding the distribution of the high-grade mineralization in the area.2026 Exploration ProgramThere are approximately 34,500 m of drilling planned at Haile for 2026 from both surface and underground. Drilling will continue to focus on resource conversion at Horseshoe Underground, including targeting expansions of the upper, middle and lower zones to the southwest. At Ledbetter Underground, drilling will continue to infill and test extensions to Lobe 3. Clydesdale and Pisces drilling will also continue from surface through the year, with the ability to accelerate the program once the Palomino decline is in place, providing access to new drill locations at shorter distances. Results from recent drilling and ongoing refinement of the geologic model have resulted in a better understanding on the structural controls on mineralization, allowing for the systematic generation of targets to be explored in the coming years.Table 1: Haile drill intersections subsequent to the news release dated September 11, 2025, results update.Drill Hole IDFrom (m)To (m)Interval (m)*Au (g/t)TargetActivityUGD0104294.7311.116.44.11HorseshoeExtensionUGD0107266.4292.726.33.41HorseshoeExtensionAnd305.6349.944.33.72HorseshoeExtensionUGD0108NSRHorseshoeExtensionUGD0112217.9238.720.82.06HorseshoeConversionAnd244.6256.812.224.14HorseshoeConversionUGD0113243.2273.730.513.86HorseshoeConversionUGD0114267.7277.910.21.59HorseshoeConversionUGD0115NSRHorseshoeConversionUGD0116251.6256.24.63.20HorseshoeExtensionUGD0117NSRHorseshoeExtensionUGD0118233.6241.37.71.95HorseshoeExtensionUGD0119151.6170.118.49.62HorseshoeExtensionUGD0120164.2186.121.96.48HorseshoeExtensionIncluding172.8176.53.723.55HorseshoeExtensionUGD0121185.4201.915.530.64HorseshoeExtensionUGD0122197.5220.022.513.42HorseshoeExtensionUGD0123NSRHorseshoeExtensionUGD0124NSRHorseshoeExtensionUGD0125NSRHorseshoeExtensionUGD0126308.0333.825.83.63HorseshoeExtensionIncluding325.6326.40.942.30HorseshoeExtensionDDH1305797.0811.514.515.81ClydesdaleInitial DrillingIncluding797.0801.44.541.60ClydesdaleInitial DrillingDDH1318NSRClydesdaleInitial DrillingDDH1283466.5479.513.02.25Ledbetter 04ConversionAnd494.5511.617.18.20Ledbetter 04ConversionIncluding502.5506.84.316.24Ledbetter 04ConversionDDH1309NSRLedbetter 04ConversionDDH1311485.9491.85.93.66Ledbetter 04ConversionDDH1312
NSR
Ledbetter 04ConversionDDH1313486.6514.527.98.60Ledbetter 04ConversionIncluding486.6490.84.223.11Ledbetter 04ConversionIncluding508.9511.52.615.67Ledbetter 04ConversionDDH1315489.0491.62.69.63Ledbetter 04ConversionAnd498.1501.43.340.45Ledbetter 04ConversionIncluding498.1499.91.873.70Ledbetter 04ConversionDDH1317489.5508.018.43.68Ledbetter 04ConversionDDH1319456.1484.027.94.16Ledbetter 04ConversionDDH1295NSRPiscesExtensionDDH1298NSRPiscesExtensionUGD0109NSRPiscesExtensionUGD0110NSRPiscesExtensionUGD0111NSRPiscesExtensionDDH1307NSRPiscesExtensionDDH1316656.1672.516.42.68Pisces Extension
*Notes: Intervals are down hole core length, true widths have not been determined. "Initial Drilling" intercepts are associated with early-stage exploration drilling, "Extension" drilling intercepts are intercepts outside the current resource model shell directed at defining mineralization to an Inferred Mineral Resource category and "Conversion" drilling intercepts are intercepts converting Inferred Mineral Resources to Indicated Mineral Resources category. NSR = No Significant Result.For further information relating to drill hole data, please refer to the Company's website at https://oceanagold.com/operations/additional-drillhole-data.About OceanaGoldOceanaGold is a global intermediate gold and copper producer committed to safely and responsibly maximizing the generation of Free Cash Flow from our operations and delivering strong returns for our shareholders. We have a portfolio of four operating mines: the wholly-owned Haile Gold Mine in the United States of America; the wholly-owned Macraes and Waihi operations in New Zealand; and the 80%-owned Didipio Mine in the Philippines.For further information please contact:Investor Relations: Rebecca Henare, VP, Investor Relations
Tel: +1 604-678-4095
ir@oceanagold.com Valerie Burns, Manager, Investor Relations
Tel: +1 604-235-0742
ir@oceanagold.comMedia Relations: Louise Burgess, VP, Communications
Tel: +1 604-403-2019
media@oceanagold.comQualified Person StatementThe scientific and technical information in this press release has been reviewed and approved by Mr. Keenan Jennings, a qualified person under National Instrument 43-101 – Standards of Disclosure for Mineral Projects of the Canadian Securities Administrators ("NI 43-101"). Mr. Jennings is the EVP, Chief Exploration Officer of OceanaGold.Quality Assurance and Quality Control ("QA/QC")From July 2017 to 2025, almost all Haile exploration core samples have been prepared at the ALS lab in Tucson, Arizona, and analyzed at the ALS lab in Reno, Nevada, each of which is independent from OceanaGold. Select resource conversion core samples were also prepared and analyzed at the SGS lab in Kershaw, South Carolina in 2025, which is also independent from OceanaGold, with confirmation pulp duplicates sent to the ALS lab in Reno, Nevada. Samples are pulverized from a 250g (ALS) or 450g (SGS) sample to 85% passing 75 mesh. Approximately 225g of pulp sample is used for fire assay. Assays are based on a 30g fire assay aliquot for gold with Atomic Absorption finish. If the gold value from Atomic Absorption is >10g/t, an additional 30g of pulp sample is fire assayed for gold using a gravimetric finish.Some holes are composited and analyzed for carbon, sulphur and multi-elements using LECO and ICP-OES methods. Both ALS and SGS labs used for OceanaGold samples are ISO 17025 certified.Blanks and standards are each inserted every 20th sample. Precision and accuracy of certified reference materials ("CRMs") compared to expected values have been consistently within 5% RSD and often within 3%. Barren marble and sand are inserted as blanks every 20th sample. CRMs from RockLabs and OREAS are inserted every 20th sample (5%). All blanks and CRMs are handled by the OceanaGold Geology Team and are stored in the locked OceanaGold office.All drill hole samples are handled and transported from the drill rigs to the secured Haile Exploration warehouse by OceanaGold personnel or contractors. Access to the property is controlled by locked doors and cameras monitored by OceanaGold security. The main gate requires an electronic employee badge to enter. Samples are packaged at the Haile Exploration warehouse by OceanaGold geologists and geotechnicians. Samples are trucked in sealed plastic barrels by certified couriers with submittal forms that are verified during sample pick-up and delivery to ALS. No sample shipments have been recorded as missing or tampered with.Technical ReportFor further information, please refer to the following NI 43-101 technical report available on the SEDAR+ website at www.sedarplus.ca under the Company's profile or on the Company's website at www.oceanagold.com: "NI 43-101 Technical Report Haile Gold Mine Lancaster County, South Carolina" dated March 27, 2026, with an effective date of December 31, 2025 prepared by D. Carr, Group Head of Metallurgy, G. Hollett, Group Head of Mining Engineering, B. Drury, Underground Engineering Superintendent, J. Moore, Group Head of Resource Development and D. Corley, Principal Resource Development Geologist (OceanaGold), L. Standridge and R. Cook (Call and Nicholas, Inc.), J Newton Janney-Moore and W.L. Kingston (NewFields Mining Design & Technical Services, LLC) and B. Miller (SRK Consulting (U.S.), Inc.). Each of Messrs. Carr, Hollett, Moore and Corley and Ms. Drury is an employee of OceanaGold.Cautionary Statement for Public ReleaseThis news release contains certain "forward-looking statements" and "forward-looking information" (collectively, "forward-looking statements") within the meaning of applicable Canadian and United States securities laws which may include, but are not limited to, statements with respect to: the future exploration activities at Haile and the anticipated benefits therefor; anticipated exploration results and developments at Haile in future periods; the estimation, realization and classification of Mineral Reserves and Mineral Resources at Haile; the potential for Mineral Reserves growth at Horseshoe, Mineral Resources conversion at Ledbetter and Clydesdale as an emerging target area; anticipated advancement of exploration opportunities with further drilling as development of the Palomino decline progresses; anticipated expansion of the exploration opportunity at Ledbetter; estimates of exploration expenditures; timing of the development of new deposits; the timing, cost and outcome of exploration activities; timing and focus of the 2026 exploration and drilling programs at Haile; and geotechnical and operational conditions. All statements in this news release that address events or developments that the Company expects to occur in the future are forward-looking statements. Forward-looking statements are statements that are not historical facts and are generally, although not always, identified by words such as "may", "plans", "expects", "projects", "is expected", "scheduled", "potential", "estimates", "forecasts", "intends", "targets", "aims", "anticipates" or "believes" or variations (including negative variations) of such words and phrases, or may be identified by statements to the effect that certain actions, events or results "may", "could", "would", "should", "might" or "will" be taken, occur or be achieved.Forward-looking statements involve known and unknown risks, uncertainties and other factors which may cause the actual results, performance or achievements of the Company to be materially different from any future results, performance or achievements expressed or implied by the forward-looking statements. Such risks include, among others: the risk of not achieving the Company's production estimates, forecasts or 2026 Guidance; inaccuracy of Mineral Reserves, Mineral Resources and operating and capital cost estimates; the actual results of current and future production, development and/or exploration activities; possible variations of ore grade, metallurgy or recovery rates; changes in mine plans, project parameters or assumptions as plans continue to be refined; delays in, or inability to complete, development or construction or expansion activities or to re-commence or sustain operations as planned; failures or underperformance of plant, equipment, infrastructure or processes; geotechnical risks or events, including open pit wall stability, crown pillar failure, land subsidence and tailings dam failures; scarcity in and disruption of global supply chain and/or increases in prices, including as a result of international conflicts, such as the recent U.S.-Iran conflict; challenges associated with effective water management; environmental, health and safety and climate-related risks; risks related to community acceptance, stakeholder engagement and social licence to operate; competition for mineral properties and other growth opportunities; legal and regulatory challenges to current and future permits, certifications, approvals or licences; adverse judicial, regulatory or governmental decisions; delays in, or inability to obtain, financing or governmental approvals on acceptable terms; changes in laws, regulations, taxation regimes, regulated accounting standards or their interpretation or application; the risks associated with operating in foreign jurisdictions, including political instability, changes in policy or law, civil unrest or conflict; fluctuations in the prices of gold, copper and silver; general business, economic and market conditions (including changes in global, national or regional financial, credit, currency or securities markets); changes or developments in global, national or regional political and social conditions; fluctuations in foreign exchange rates, including the value of the U.S. dollar relative to the Canadian dollar, the New Zealand dollar or the Philippine peso; trade policies and tensions, including tariffs; inflationary pressure; labour availability, retention and turnover; accidents, labour disputes and other operational risks of the mining industry; limitations of insurance coverage or uninsured risks; the conclusions of economic evaluations, studies and models; information technology, artificial intelligence and cybersecurity risks; and those other factors identified and described in more detail in the section entitled "Risk Factors" contained in the Company's most recent Annual Information Form and the Company's other filings with Canadian securities regulators and the U.S. Securities and Exchange Commission (the "SEC"), which are available under the Company's profile on SEDAR+ at sedarplus.ca and sec.gov, respectively, and on the Company's website at oceanagold.com. The list is not exhaustive of the factors that may affect the Company's forward-looking statements.The Company's forward-looking statements are based on the applicable assumptions and factors Management considers reasonable as of the date hereof, based on the information available to Management at such time. These assumptions and factors include, but are not limited to, assumptions and factors related to the Company's ability to carry on current and future operations, including: exploration and development activities; the timing, extent, duration and economic viability of such operations; the accuracy and reliability of estimates, projections, forecasts, studies and assessments; the Company's ability to meet or achieve Guidance, estimates, projections and forecasts; the availability and cost of inputs; the price and market for outputs, including gold, copper and silver; foreign exchange rates; taxation levels; the timely receipt of necessary permits, certifications, approvals or licences; the ability to meet current and future obligations; the ability to obtain timely financing on reasonable terms when required; the current and future social, economic and political conditions; and other assumptions and factors generally associated with the mining industry.The Company's forward-looking statements are based on the opinions and estimates of Management and reflect their current expectations regarding future events and operating performance and speak only as of the date hereof. The Company does not assume any obligation to update forward-looking statements if circumstances or Management's beliefs, expectations or opinions should change other than as required by applicable laws. There can be no assurance that forward-looking statements will prove to be accurate, and actual results, performance or achievements could differ materially from those expressed in, or implied by, these forward-looking statements. Accordingly, no assurance can be given that any events anticipated by the forward-looking statements will transpire or occur, or if any of them do, what benefits or liabilities the Company will derive therefrom. For the reasons set forth above, undue reliance should not be placed on forward-looking statements.Cautionary Statements for United States ReadersThe scientific and technical disclosure in this news release was prepared in accordance with Canadian National Instrument 43-101 - Standards of Disclosure for Mineral Projects ("NI 43-101"), which differs from the scientific and technical disclosure requirements of the SEC that are applicable to domestic United States reporting companies. Any Mineral Reserves and Mineral Resources reported by the Company in accordance with NI 43-101 may not qualify as such under SEC standards, including Subpart 1300 of Regulation S-K under the United States Exchange Act of 1934, as amended. Accordingly, Mineral Resources and Mineral Reserves information and other scientific and technical information contained or referenced in this news release may not be comparable to similar scientific and technical information disclosed by United States public companies subject to the reporting and technical disclosure requirements of the SEC. Historical results or feasibility models presented herein are not guarantees or expectations of future performance. Mineral resources that are not mineral reserves do not have demonstrated economic viability. Due to the uncertainty of measured, indicated or inferred mineral resources, these mineral resources may never be upgraded to proven and probable mineral reserves. Investors are cautioned not to assume that any part of mineral deposits in these categories will ever be converted into reserves or recovered. In addition, United States investors are cautioned not to assume that any part or all of the Company's measured, indicated or inferred mineral resources constitute or will be converted into mineral reserves or are or will be economically or legally mineable without additional work. View original content to download multimedia:https://www.prnewswire.com/news-releases/oceanagold-announces-additional-high-grade-drill-results-at-haile-302769050.htmlSOURCE OceanaGold Corporation Original: OceanaGold Announces Additional High-Grade Drill Results at Haile
US Market News
2月前
OceanaGold Delivers Strong First Quarter with $255M of Free Cash FlowMay 6, 2026 5:00 PM
PR Newswire (Canada) (All financial figures in United States dollars unless otherwise stated) Produced 130,100 ounces of gold and 3,200 tonnes of copper, in line with the full year plan.Delivered record revenue, record operating cash flow, and increased the cash balance by 30%.Progressed growth projects and returned $77 million to shareholders through share repurchases.VANCOUVER, BC, May 6, 2026 /CNW/ - OceanaGold Corporation (TSX: OGC) (NYSE: OGC) ("OceanaGold" or the "Company") reported its operational and financial results for the three months ended March 31, 2026. The consolidated financial statements and Management's Discussion and Analysis ("MD&A") are available at www.oceanagold.com.First Quarter HighlightsSafely and responsibly produced 130,100 ounces of gold and 3,200 tonnes of copper, as per plan.All-In Sustaining Cost ("AISC")† of $2,094 per ounce.Record quarterly revenue of $715 million at a record average realized gold price of $4,894 per ounce.EBITDA Margin† of 58%, net profit1 of $228 million and EPS of $1.01. Record Operating Cash Flow of $382 million, generating strong Free Cash Flow† of $255 million.Cash balance increased by 30% to $620 million. No debt, with revolving credit facility undrawn.Completed $77 million in share repurchases, in line with the $350 million buyback program for 2026.Released updated NI 43-101 technical reports for Haile, Macraes and Didipio, demonstrating a stable production profile and longer mine lives at each of the assets. Confirmed continuity and extension of a newly defined southern high-grade zone at Wharekirauponga, with the portal now constructed and decline development underway.Listed on the New York Stock Exchange ("NYSE") on April 7, 2026.Gerard Bond, President and CEO of OceanaGold, said "We have started 2026 strongly, delivering results broadly in line with our expectations, while continuing to execute on our growth and capital allocation priorities. Record Operating Cash Flow delivered a near-record $255M in Free Cash Flow in the quarter, growing our cash balance by 30% even after returning capital to shareholders through our dividends and buyback programs. Our NYSE listing in April further broadens our investor base, and we released encouraging exploration results at Wharekirauponga that highlight the quality and upside potential of this high-grade orebody. Together, these first quarter achievements demonstrate our focus on execution and position us well to continue delivering on our plans and creating value for shareholders in 2026."† See "Non-IFRS Financial Information"
1 Attributable to the shareholders of the Company.Results Overview
Q1 2026Q4 2025Q1 2025Gold Produced1
Hailekoz41.655.651.6 Macraeskoz51.555.828.4 Waihikoz16.622.216.8 Didipiokoz20.423.820.6Total gold produced1koz130.1157.4117.4Gold Sales
Hailekoz47.350.357.2 Macraeskoz47.953.723.7 Waihikoz17.621.115.9 Didipiokoz22.620.617.8Total Gold saleskoz135.4145.7114.6Average Gold Price$/oz4,8944,2272,858Copper Produced1 - Didipiokt3.23.23.4Copper Sales1 - Didipiokt3.32.93.2Average Copper Price$/lb6.105.354.27Silver Producedkoz130.7136.2162.7Cash Costs†
Haile$/oz1,7791,529715 Macraes$/oz9708851,369 Waihi$/oz1,5561,5841,445 Didipio$/oz748883871Consolidated Cash Costs†$/oz1,2921,207976AISC†
Haile$/oz2,6372,2951,551 Macraes$/oz1,5061,2862,313 Waihi$/oz2,1552,0682,019 Didipio$/oz1,2981,4221,130Consolidated AISC†$/oz2,0941,7611,796Free Cash Flow†$M255.2259.468.8Net profit2$M228.4327.799.7Adjusted net profit†2$M229.5201.7100.7EBITDA†$M416.7543.2192.0Adjusted EBITDA†$M417.8374.0193.0Earnings per share - diluted2$/share$1.01$1.42$0.42Adjusted earnings per share - diluted†2 $/share$1.01$0.88$0.421 Production is reported on a 100% basis as all operations are controlled by OceanaGold.2 Attributable to the shareholders of the Company.
† See "Non-IFRS Financial Information"DividendOceanaGold has declared a $0.09 per share dividend payable in June 2026. Shareholders of record at the close of business in each jurisdiction on May 20, 2026 (the "Record Date") will be entitled to receive payment of the dividend on June 19, 2026. The dividend payment applies to holders of record of the Company's common shares traded on the TSX and the NYSE.Declaration of Dividend
Wednesday May 6, 2026Record Date
Wednesday May 20, 2026Dividend Payment Date
Friday June 19, 2026Dividends are payable in United States dollars. Shareholders in other jurisdictions can elect to participate in Computershare's international payments service if they want to receive dividends in an alternative currency. This dividend qualifies as an 'eligible dividend' for Canadian income tax purposes.Share BuybackIn the first quarter, the Company completed $77 million of share repurchases. In February, the Company announced its intention to apply up to $350 million towards share buybacks in 2026, in addition to a tripling of the dividend.Management UpdateThe Company announces that after 17 years, Liang Tang, EVP General Counsel & Company Secretary, advised of her intent to leave OceanaGold to spend more time with her family. The Company thanks Ms. Tang for her dedication, professionalism, poise, clear-thinking, advice and the many contributions she has made over her long and valued service.Elizabeth Thampy has been appointed as OceanaGold's new EVP General Counsel & Company Secretary. With over a decade of experience in gold mining with other similar sized companies and several years at one of Canada's largest law firms, Ms. Thampy brings a wealth of industry knowledge and a strong track record in securities law, corporate governance, risk management, and mergers & acquisitions. She joined OceanaGold on April 16, 2026.Conference Call and Webcast:Senior management will host a conference call and webcast to discuss the quarterly results on Thursday, May 7, 2026 at 10:00 am EDT (7:00 am PDT). To participate in the conference call, please use one of the following methods:Webcast: https://app.webinar.net/8KkdZq6zb7eToll-free North America: +1 888-510-2154International: +1 437-900-0527If you are unable to attend the call, a recording will be made available on the Company's website.About OceanaGold OceanaGold is a global intermediate gold and copper producer committed to safely and responsibly maximizing the generation of Free Cash Flow from our operations and delivering strong returns for our shareholders. We have a portfolio of four operating mines: the wholly-owned Haile Gold Mine in the United States of America; the wholly-owned Macraes and Waihi operations in New Zealand; and the 80%-owned Didipio Mine in the Philippines.Cautionary Statement for Public Release This news release contains certain "forward-looking statements" and "forward-looking information" (collectively, "forward-looking statements") within the meaning of applicable Canadian and United States securities laws which may include, but are not limited to, statements with respect to: the Company's planned production, cost and capital Guidance for 2026; the future financial and operating performance of the Company and its mining projects and the anticipated benefits therefor; anticipated results and developments in the operations of OceanaGold in future periods; the development, expansion and operation of the Company's mining projects; anticipated production levels and mine lives; the estimation, realization and classification of Mineral Reserves and Mineral Resources; costs of production; estimates of growth capital, sustaining capital, operating and exploration expenditures; costs and timing of the development of new deposits and mines; the timing, cost and outcome of development, construction and expansion activities; costs and timing of future exploration and drilling programs, including the Company's site and regional exploration programs; water management initiatives and strategies and tailings management initiatives at the Company's operations; the adequacy of current financial resources and cash reserves; requirements for additional capital; governmental regulation of mining operations and exploration operations; the timing and receipt of required permits, certifications, approvals, consents and renewals under applicable legislation; the amount of and timing for anticipated purchases under the Normal Course Issuer Bid program; compliance with applicable environmental, social, health and safety and other regulatory requirements; geotechnical and operational conditions; social licence to operate and stakeholder relationships; competition for mineral properties; the availability and terms of financing; foreign operations and political, economic and regulatory conditions in the jurisdictions in which the Company operates; expectations regarding the impacts of the U.S.-Iran international conflict on the Company's operations, including with respect to prices for and delivery costs of certain consumable items; governmental regulation of mining operations and exploration operations; fluctuations in commodity prices, including gold, copper and silver, and foreign exchange rates; the expected inclusion of Waihi and Didipio in the Company's hedging program; anticipated environmental risks; title disputes or claims; changes in laws, taxation and accounting standards; and the timing and possible outcome of pending legal proceedings, regulatory matters and other disputes. All statements in this news release that address events or developments that the Company expects to occur in the future are forward-looking statements. Forward-looking statements are statements that are not historical facts and are generally, although not always, identified by words such as "may", "plans", "expects", "projects", "is expected", "scheduled", "potential", "estimates", "forecasts", "intends", "targets", "aims", "anticipates" or "believes" or variations (including negative variations) of such words and phrases, or may be identified by statements to the effect that certain actions, events or results "may", "could", "would", "should", "might" or "will" be taken, occur or be achieved.Forward-looking statements involve known and unknown risks, uncertainties and other factors which may cause the actual results, performance or achievements of the Company to be materially different from any future results, performance or achievements expressed or implied by the forward-looking statements. Such risks include, among others: the risk of not achieving the Company's production estimates, forecasts or 2026 Guidance; inaccuracy of Mineral Reserves, Mineral Resources and operating and capital cost estimates; the actual results of current and future production, development and/or exploration activities; possible variations of ore grade, metallurgy or recovery rates; changes in mine plans, project parameters or assumptions as plans continue to be refined; delays in, or inability to complete, development or construction or expansion activities or to re-commence or sustain operations as planned; failures or underperformance of plant, equipment, infrastructure or processes; geotechnical risks or events, including open pit wall stability, crown pillar failure, land subsidence and tailings dam failures; scarcity in and disruption of global supply chain and/or increases in prices, including as a result of international conflicts, such as the recent U.S.-Iran conflict; challenges associated with effective water management; environmental, health and safety and climate-related risks; risks related to community acceptance, stakeholder engagement and social licence to operate; competition for mineral properties and other growth opportunities; legal and regulatory challenges to current and future permits, certifications, approvals or licences; adverse judicial, regulatory or governmental decisions; delays in, or inability to obtain, financing or governmental approvals on acceptable terms; changes in laws, regulations, taxation regimes, regulated accounting standards or their interpretation or application; the risks associated with operating in foreign jurisdictions, including political instability, changes in policy or law, civil unrest or conflict; fluctuations in the prices of gold, copper and silver; general business, economic and market conditions (including changes in global, national or regional financial, credit, currency or securities markets); changes or developments in global, national or regional political and social conditions; fluctuations in foreign exchange rates, including the value of the U.S. dollar relative to the Canadian dollar, the New Zealand dollar or the Philippine peso; trade policies and tensions, including tariffs; inflationary pressure; labour availability, retention and turnover; accidents, labour disputes and other operational risks of the mining industry; limitations of insurance coverage or uninsured risks; the conclusions of economic evaluations, studies and models; information technology, artificial intelligence and cybersecurity risks; and those other factors identified and described in more detail in the section entitled "Risk Factors" contained in the Company's most recent Annual Information Form and the Company's other filings with Canadian securities regulators and the U.S. Securities and Exchange Commission, which are available under the Company's profile on SEDAR+ at sedarplus.ca and sec.gov, respectively, and on the Company's website at oceanagold.com. The list is not exhaustive of the factors that may affect the Company's forward-looking statements.The Company's forward-looking statements are based on the applicable assumptions and factors Management considers reasonable as of the date hereof, based on the information available to Management at such time. These assumptions and factors include, but are not limited to, assumptions and factors related to the Company's ability to carry on current and future operations, including: exploration and development activities; the timing, extent, duration and economic viability of such operations; the accuracy and reliability of estimates, projections, forecasts, studies and assessments; the Company's ability to meet or achieve Guidance, estimates, projections and forecasts; the availability and cost of inputs; the price and market for outputs, including gold, copper and silver; foreign exchange rates; taxation levels; the timely receipt of necessary permits, certifications, approvals or licences; the ability to meet current and future obligations; the ability to obtain timely financing on reasonable terms when required; the current and future social, economic and political conditions; and other assumptions and factors generally associated with the mining industry.The Company's forward-looking statements are based on the opinions and estimates of Management and reflect their current expectations regarding future events and operating performance and speak only as of the date hereof. The Company does not assume any obligation to update forward-looking statements if circumstances or Management's beliefs, expectations or opinions should change other than as required by applicable laws. There can be no assurance that forward-looking statements will prove to be accurate, and actual results, performance or achievements could differ materially from those expressed in, or implied by, these forward-looking statements. Accordingly, no assurance can be given that any events anticipated by the forward-looking statements will transpire or occur, or if any of them do, what benefits or liabilities the Company will derive therefrom. For the reasons set forth above, undue reliance should not be placed on forward-looking statements.Non-IFRS Financial InformationAdjusted Net Profit/(Loss) and Adjusted Earnings/(Loss) per shareThese are used by Management to measure the underlying operating performance of the Company. Management believes these measures provide information that is useful to investors because they are important indicators of the strength of the Company's operations and the performance of its core business. Accordingly, such measures are intended to provide additional information and should not be considered in isolation as a substitute for measures of performance prepared in accordance with IFRS. Adjusted Net Profit/(Loss) is calculated as Net Profit/(Loss) less the impact of impairment expenses and reversals, write-downs, foreign exchange (gains)/losses, gain on sale of assets and listing costs.The following table provides a reconciliation of Adjusted Net Profit/(Loss) and Adjusted Earnings/(Loss) per share:$M, except per share amountsQ1 2026Q4 2025Q1 2025Net profit1228.4327.799.7Foreign exchange loss (gain)0.1(1.9)0.8Impairment reversal—(176.2)—NYSE listing costs1.00.9—Write-down of assets—8.00.2Tax expense on impairment reversal—43.2—Adjusted net profit1229.5201.7100.7Weighted average number of common shares - fully diluted 226.6230.2238.3Adjusted earnings per share1.010.880.421 Attributable to the shareholders of the Company.EBITDA, Adjusted EBITDA and Adjusted EBITDA MarginManagement believes that Adjusted EBITDA is a valuable indicator of its ability to generate liquidity by producing operating cash flows to fund working capital needs, service debt obligations and fund capital expenditures. EBITDA is defined as earnings before interest, tax, depreciation and amortization. Adjusted EBITDA is calculated as EBITDA less the impact of impairment expenses and reversals, write-downs, gains/losses on disposal of assets, listing costs, foreign exchange gains/losses and other non-recurring costs. Adjusted EBITDA Margin is calculated as Adjusted EBITDA divided by revenue.The following table provides a reconciliation of EBITDA, Adjusted EBITDA and Adjusted EBITDA Margin:$MQ1 2026Q4 2025Q1 2025Net profit235.4333.8101.2Depreciation and amortization84.081.153.7Net interest (income) expense and finance costs (1.0)—1.8Income tax expense on earnings98.3128.335.3EBITDA416.7543.2192.0Foreign exchange loss (gain)0.1(1.9)0.8Impairment reversal—(176.2)—NYSE listing costs1.00.9—Write-down of assets—8.00.2Adjusted EBITDA417.8374.0193.0Revenue714.5652.4359.9Adjusted EBITDA Margin58 %57 %54 %Cash Costs and AISCCash Costs are a common financial performance measure in the gold mining industry; however, it has no standard meaning under IFRS. Management uses this measure to monitor the performance of the Company's mining operations and its ability to generate positive cash flows, both on an individual site basis and an overall company basis. Cash Costs include mine site operating costs plus indirect taxes and selling cost net of by-product allocations and are then divided by ounces sold. In calculating Cash Costs, the Company includes the value of cash-settled stock-based compensation in the year of vesting. Cash Costs are reduced by copper and silver by-product cost allocations that are considered incidental to the gold production process, thereby allowing Management and other stakeholders to assess the net costs of gold production. The measure is not necessarily indicative of cash flow from operations under IFRS or operating costs presented under IFRS.Management believes that the AISC measure provides additional insight into the costs of producing gold by capturing all of the expenditures required for the discovery, development and sustaining of gold production and allows the Company to assess its ability to support capital expenditures to sustain future production from the generation of operating cash flows, both on an individual site basis and an overall company basis, while maintaining current production levels. Management believes that, in addition to conventional measures prepared in accordance with IFRS, certain investors use this information to evaluate the Company's performance and ability to generate cash flow per ounce sold. AISC is calculated as the sum of Cash Costs, capital expenditures and exploration costs that are sustaining in nature and corporate G&A costs. AISC is divided by ounces sold to arrive at AISC per ounce. The following table provides a reconciliation of consolidated Cash Costs and AISC:$M, except per oz amountsQ1 2026Q4 2025Q1 2025Cost of sales, excl. depreciation and amortization226.8231.3142.9Indirect taxes 9.08.54.8Selling costs 3.73.82.8Non-cash stock-based compensation adjustments2 (9.0)(26.8)(3.4)By-product allocation(55.6)(40.9)(35.3)Total Cash Costs (net) 174.9175.9111.8Sustaining capital and leases40.353.326.8Deferred stripping and capitalized mining45.926.555.3Corporate general & administration319.9(1.6)10.4Onsite exploration and drilling3.20.31.6Total AISC284.2254.4205.9Gold sales (koz)135.4145.7114.6Cash Costs ($/oz)1,2921,207976AISC ($/oz)12,0941,7611,7961Excludes the Additional Government Share related to the FTAA at Didipio of $22.1 million for the first quarter of 2026 and $2.9 million for the fourth quarter of 2025, as it is considered in the nature of an income tax.2Reflects the adjustment in AISC to stock-based compensation settled in cash over the year of vesting. Total Cash Costs include cash settled stock-based expenses of $6.7 million for the first quarter of 2026, $0.9 million for the fourth quarter of 2025 and $0.2 million for the first quarter of 2025.3Corporate general & administration includes $7.4 million in cash settled stock-based compensation for the first quarter of 2026, $3.2 million for the fourth quarter of 2025 and $1.3 million for the first quarter of 2025.The following tables provide a reconciliation of Cash Costs and AISC for each operation:Haile$M, except per oz amountsQ1 2026Q4 2025Q1 2025Cash costs of sales179.883.545.6By-product allocation(1.2)(1.0)(1.9)Inventory adjustments5.4(5.8)(3.0)Freight, treatment and refining charges0.20.10.2Total Cash Costs (net)84.276.840.9Sustaining capital and leases18.723.010.4Deferred stripping and capitalized mining 21.215.236.4Onsite exploration and drilling0.9—0.8Total AISC125.0115.088.5Gold sales (koz)47.350.257.2Cash Costs ($/oz)1,7791,529715AISC ($/oz)2,6372,2951,5511 Reflects the inclusion of cash settled stock-based compensation over the year of vesting.Macraes$M, except per oz amountsQ1 2026Q4 2025Q1 2025Cash costs of sales145.149.839.2By-product allocation(0.1)(0.2)(0.1)Royalties6.77.80.7Inventory adjustments(5.9)(10.5)(7.6)Freight, treatment and refining charges0.60.60.2Total Cash Costs (net)46.447.532.4Sustaining capital and leases8.616.69.4Deferred stripping and capitalized mining 15.83.812.3Onsite exploration and drilling1.21.00.6Total AISC72.068.954.7Gold sales (koz)47.953.723.7Cash Costs ($/oz)9708851,369AISC ($/oz)1,5061,2862,3131 Reflects the inclusion of cash settled stock-based compensation over the year of vesting.Waihi $M, except per oz amountsQ1 2026Q4 2025Q1 2025Cash costs of sales134.240.226.8By-product allocation(6.3)(4.1)(2.1)Royalties2.83.40.5Inventory adjustments(3.4)(6.2)(2.3)Add: Freight, treatment and refining charges 0.10.10.1Total Cash Costs (net)27.433.423.0Sustaining capital and leases4.96.84.3Deferred stripping and capitalized mining4.73.44.7Onsite exploration and drilling1.1(0.1)0.2Total AISC38.143.532.2Gold sales (koz)17.621.115.9Cash Costs ($/oz)1,5561,5841,445AISC ($/oz)2,1552,0682,0191 Reflects the inclusion of cash settled stock-based compensation over the year of vesting.Didipio$M, except per oz amountsQ1 2026Q4 2025Q1 2025Cash costs of sales141.142.932.1By-product allocation(48.0)(35.6)(31.2)Royalties3.52.51.6Indirect taxes8.36.64.7Inventory adjustments7.8(2.9)4.5Freight, treatment and refining charges4.24.73.8Total Cash Costs (net)16.918.215.5Sustaining capital and leases8.16.92.7Deferred stripping and capitalized mining 4.24.11.9General & administration20.10.70.1Onsite exploration and drilling—(0.3)—Total AISC29.329.620.2Gold sales (koz)22.620.617.8Cash Costs ($/oz)748883871AISC1 ($/oz)1,2981,4221,1301Beginning in the first quarter of 2025, Didipio's AISC calculation includes local corporate G&A costs.2Excludes the Additional Government Share related to the FTAA at Didipio of $22.1 million and $2.9 million for the first quarter of 2026 and fourth quarter of 2025, respectively, as it is considered in the nature of an income tax. Net Cash/(Debt)Net Cash/(Debt) has been calculated as total debt plus cash and cash equivalents. Management believes this is a useful indicator to be used in conjunction with other liquidity and leverage ratios to assess the Company's financial health.The following table provides a reconciliation of Net Cash/(Debt):$MMarch 31, 2026December 31,
2025Amounts drawn under the revolving credit facility ——Total debt——Cash and cash equivalents620.1476.5Net Cash620.1476.5Operating Cash Flow before working capital movementsOperating Cash Flow before working capital movements is calculated as the cash flows provided by operating activities adjusted for changes in working capital. The following table provides a reconciliation of Operating Cash Flow before working capital movements:$M, except per share amountsQ1 2026Q4 2025Q1 2025Cash provided by operating activities381.5358.2171.6Changes in working capital(46.9)(79.6)25.2Cash flows provided by operating activities before changes in working
capital334.6278.6196.8Free Cash Flow Free Cash Flow is calculated as cash flows from operating activities, less cash flow used in investing activities. Management believes Free Cash Flow is a useful indicator of the Company's ability to generate cash flow and operate net of all expenditures, prior to any financing cash flows. The following table provides a reconciliation of Free Cash Flow:$M, except per share amountsQ1 2026Q4 2025Q1 2025Cash flows provided by Operating Activities 381.5358.2171.6Cash flows used in Investing Activities(126.3)(98.8)(102.8)Free Cash Flow255.2259.468.8 View original content to download multimedia:https://www.prnewswire.com/news-releases/oceanagold-delivers-strong-first-quarter-with-255m-of-free-cash-flow-302764707.htmlSOURCE OceanaGold Corporation Original: OceanaGold Delivers Strong First Quarter with $255M of Free Cash Flow
 Hot Features


 Renee
3月前
Renee
3月前
 vrekke
6年前
vrekke
6年前
 1center
9年前
1center
9年前
 Sage7243
9年前
Sage7243
9年前
 stocktrademan
11年前
stocktrademan
11年前

 メールアドレスで登録


