 CA Market News
2月前
CA Market News
2月前
Thomson Reuters Reports First-Quarter 2026 ResultsMay 5, 2026 6:30 AM
PR Newswire (US) TORONTO, May 5, 2026 /PRNewswire/ -- Thomson Reuters (TSX/Nasdaq: TRI) today reported results for the first quarter ended March 31, 2026: Strong revenue growth in the first quarterTotal company revenues up 10% / organic revenues up 8%Organic revenues up 9% for the "Big 3" segments (Legal Professionals, Corporates and Tax, Audit & Accounting Professionals)Maintained full-year 2026 outlook for organic revenue growth, adjusted EBITDA margin and free cash flowIncreased annualized common share dividend by 10% to $2.62, announced February 2026Completed $605 million return of capital transaction on May 4; and reduced share count by approximately 6.5 million shares by way of share consolidation transactionRepurchased $262 million, or 2.5 million common shares under the $600 million share repurchase program announced on February 25, 2026"We have delivered an encouraging start to 2026," said Steve Hasker, President and CEO of Thomson Reuters. "Our positive momentum reflects the trust professionals place in Thomson Reuters in the moments that matter most. Across law, tax, audit and compliance, professionals accountable for high-stakes outcomes are choosing our AI products, built to the standards their work demands - grounded in authoritative content, designed and tested by our domain experts, and created to produce results that can be verified and audited under real-world scrutiny. We call this 'fiduciary-grade AI.'"Consolidated Financial Highlights - Three Months Ended March 31
Three months ended March 31,
(Millions of U.S. dollars, except for EPS)
(unaudited)
IFRS Financial Measures(1)
2026
2025
Change
Revenues
$2,087
$1,900
10 %
Operating profit
639
563
14 %
Diluted earnings per share (EPS)
$1.03
$0.96
7 %
Net cash provided by operating activities
$505
$445
13 %
Non-IFRS Financial Measures(1)
2026
2025
Change
Change at
Constant
Currency
Revenue growth in constant currency
8 %
Organic revenue growth
8 %
Adjusted EBITDA
$881
$809
9 %
9 %
Adjusted EBITDA margin
42.2 %
42.3 %
-10bp
40bp
Adjusted EPS
$1.23
$1.12
10 %
10 %
Free cash flow
$332
$277
19 %
(1) In addition to results reported in accordance with International Financial Reporting Standards (IFRS), the company uses certain non-
IFRS financial measures as supplemental indicators of its operating performance and financial position. See the "Non-IFRS Financial
Measures" section and the tables appended to this news release for additional information on these and other non-IFRS financial
measures, including how they are defined and reconciled to the most directly comparable IFRS measures.
Revenues increased 10% due to 10% growth in recurring revenues (77% of total revenues) and 15% growth in transactions revenues, partly offset by a 4% decline in Global Print. Total company revenue growth benefited approximately 1% from foreign currency and 1% from net acquisitions and disposals. Organic revenues increased 8% reflecting 8% growth in recurring revenues, 10% growth in transactions revenues and a 5% decline in Global Print.The company's "Big 3" segments reported organic revenue growth of 9% and collectively comprised 85% of total revenues.Operating profit increased 14% primarily due to net impact of higher revenues and operating expenses. Adjusted EBITDA increased 9% primarily due to the same factors that impacted operating profit. The related margin decreased to 42.2% from 42.3% in the prior-year period. Foreign currency negatively impacted the year-over-year change in adjusted EBITDA margin by 50 basis points.Diluted EPS increased to $1.03 per share compared to $0.96 per share in the prior-year period as higher operating profit was partly offset by lower results from discontinued operations and higher net interest expense. Diluted EPS also benefited from a reduction in weighted-average common shares outstanding due to share repurchases. Adjusted EPS, which excludes discontinued operations, as well as other adjustments, increased to $1.23 per share compared to $1.12 per share in the prior-year period, primarily due to higher adjusted EBITDA partly offset by higher net interest expense. Adjusted EPS also benefited from a reduction in weighted-average common shares.Net cash provided by operating activities increased by $60 million primarily due to higher cash benefits from the net impact of higher revenues and operating expenses. Free cash flow increased by $55 million primarily due to the increase in net cash provided by operating activities. Highlights by Customer Segment – Three Months Ended March 31
(Millions of U.S. dollars)
(unaudited)
Three months ended
March 31,
Change
2026
2025(2)
TotalConstant
Currency(1)
Organic(1)(3)
Revenues
Legal Professionals
$756
$688
10 %
8 %
9 %
Corporates
608
548
11 %
9 %
9 %
Tax, Audit & Accounting Professionals
410
358
15 %
14 %
10 %
"Big 3" Segments Combined(1)
1,774
1,594
11 %
10 %
9 %
Reuters
212
196
8 %
7 %
6 %
Global Print
112
116
-4 %
-5 %
-5 %
Eliminations/Rounding
(11)
(6)
Total Revenues
$2,087
$1,900
10 %
8 %
8 %
Adjusted EBITDA(1)
Legal Professionals
$365
$336
9 %
8 %
Corporates
243
215
13 %
13 %
Tax, Audit & Accounting Professionals
221
208
6 %
6 %
"Big 3" Segments Combined(1)
829
759
9 %
9 %
Reuters
34
39
-13 %
-4 %
Global Print
43
44
-2 %
-3 %
Corporate costs
(25)
(33)
n/a
n/a
Total Adjusted EBITDA
$881
$809
9 %
9 %
Adjusted EBITDA Margin(1)
Legal Professionals
48.3 %
48.7 %
-40bp
-30bp
Corporates
40.0 %
39.3 %
70bp
130bp
Tax, Audit & Accounting Professionals
53.8 %
56.6 %
-280bp
-240bp
"Big 3" Segments Combined(1)
46.7 %
47.3 %
-60bp
-20bp
Reuters
16.1 %
20.0 %
-390bp
-190bp
Global Print
38.6 %
37.8 %
80bp
80bp
Total Adjusted EBITDA Margin
42.2 %
42.3 %
-10bp
40bp
(1) See the "Non-IFRS Financial Measures" section and the tables appended to this news release for additional information on these and
other non-IFRS financial measures. To compute segment and consolidated adjusted EBITDA margin, the company excludes fair value
adjustments related to acquired deferred revenue.
(2) For comparative purposes, 2025 segment results have been revised to reflect the current period presentation. For additional
information, including a summary of how the changes impacted results for the first-quarter of 2025, see the "Revision to Prior-Year
Segment Results" section of this news release.
(3) Computed for revenue growth only.
n/a: not applicable
Unless otherwise noted, all revenue growth comparisons by customer segment in this news release are at constant currency (which excludes the impact of foreign currency) as the company believes this provides the best basis to measure performance.Legal ProfessionalsRevenues increased 8% at constant currency. Organic revenue growth was 9%.Recurring revenues increased 9% (98% of total, all organic). Organic revenue growth was primarily driven by Westlaw and CoCounsel.Transactions revenues decreased 2% (2% of total, all organic).Adjusted EBITDA increased 9% to $365 million.The margin decreased to 48.3% from 48.7%, primarily driven by higher revenues offset by higher technology and other costs, and to a lesser extent, a negative impact from foreign currency.Corporates Revenues increased 9% at constant currency, all organic.Recurring revenues increased 8% (74% of total, all organic). Organic revenue growth was primarily driven by Westlaw, CoCounsel, Practical Law, Pagero, CLEAR and the segment's international businesses.Transactions revenues increased 12% (26% of total, all organic). Organic revenue growth was primarily driven by Confirmation, Pagero, Indirect Tax and the segment's international businesses.Adjusted EBITDA increased 13% to $243 million.The margin increased to 40.0% from 39.3% driven by higher operating leverage. Foreign currency negatively impacted the year-over-year change in adjusted EBITDA margin by 60 basis points.Tax, Audit & Accounting Professionals Revenues increased 14% at constant currency, including the acquisition impact of SafeSend which was reflected in transactions revenues. Organic revenue growth was 10%.Recurring revenues increased 10% (56% of total, all organic). Organic revenue growth was primarily driven by tax and audit products, including CoCounsel, as well as the segment's Latin America business.Transactions revenues increased 18% (44% of total, increased 11% organic). Organic revenue growth was primarily driven by SafeSend, SurePrep, UltraTax and Confirmation.Adjusted EBITDA increased 6% to $221 million.The margin decreased to 53.8% from 56.6% primarily due to higher technology and other costs. Foreign currency negatively impacted the year-over-year change in adjusted EBITDA margin by 40 basis points.The Tax, Audit & Accounting Professionals segment is the company's most seasonal business with approximately 60% of full-year revenues typically generated in the first and fourth quarters. As a result, the margin performance of this segment has been generally higher in the first and fourth quarters as costs are typically incurred in a more linear fashion throughout the year.ReutersRevenues increased 7% at constant currency (increased 6% organic), primarily due to higher Agency revenues and a contractual price increase from the company's news agreement with the Data & Analytics business of London Stock Exchange Group.Adjusted EBITDA decreased 13% to $34 million and the margin decreased to 16.1% from 20.0%, primarily due to foreign currency, which negatively impacted the year-over-year change in adjusted EBITDA margin by 200 basis points, as well as higher editorial and other costs.Global Print Revenues decreased 5% at constant currency, all organic, driven by lower shipment volumes.Adjusted EBITDA decreased 2% to $43 million, and the margin increased to 38.6% from 37.8% reflecting lower expenses.Corporate CostsCorporate costs were $25 million compared to $33 million in the prior-year period, which included a corporate charge that did not repeat.2026 OutlookThe company maintained its 2026 full-year outlook announced on February 5, 2026 for all metrics, except for net interest expense which is expected to be in the $180 - $190 million range compared to the $150 - $160 million range in the company's February 2026 outlook. The increase reflects the impact of the $1.2 billion share repurchase program and return of capital and share consolidation transactions, as announced on February 25, 2026, on the company's net debt position.The company's outlook for 2026 in the table below assumes constant currency rates and incorporates the recent Noetica acquisition, but excludes the impact of any future acquisitions or dispositions that may occur during the remainder of the year. Thomson Reuters believes that this type of guidance provides useful insight into the anticipated performance of its businesses.The company expects its second-quarter 2026 organic revenue growth to be in a range of 7% - 8% and its adjusted EBITDA margin to be approximately 38%.The company's 2026 outlook is forward-looking information that is subject to risks and uncertainties (see "Special Note Regarding Forward-Looking Statements, Material Risks and Material Assumptions"). In particular, the company continues to operate in an uncertain macroeconomic environment, reflecting ongoing geopolitical risk, uneven economic growth, and an evolving interest rate and inflationary backdrop. Any worsening of the global economic or business environment, among other factors, could impact the company's ability to achieve its outlook.Reported Full-Year 2025 Results and Full-Year 2026 OutlookTotal Thomson ReutersFY 2025ReportedFY 2026Outlook2/5/2026FY 2026Outlook5/5/2026Total Revenue Growth3%(2)7.5% - 8.0%UnchangedOrganic Revenue Growth(1)7 %7.5% - 8.0%UnchangedAdjusted EBITDA Margin(1)39.2 %+100bps vs 2025UnchangedCorporate Costs$118 million$115 - $125 millionUnchangedFree Cash Flow(1)$1.95 billion~ $2.1 billionUnchangedAccrued Capex as % of Revenues(1)8.2 %~ 8.0%UnchangedDepreciation & Amortization of Software Depreciation & Amortization of Internally Developed Software Amortization of Acquired Software$832 million$626 million$206 million$890- $910 million$680 - $690 million$210 - $220 millionUnchangedUnchangedUnchangedNet Interest Expense$143 million$150 - $160 million$180 - $190 millionEffective Tax Rate on Adjusted Earnings(1)18.5 %~ 19%Unchanged"Big 3" Segments(1)FY 2025ReportedFY 2026Outlook2/5/2026FY 2026Outlook5/5/2026Total Revenue Growth 4%(2)~ 9.5%UnchangedOrganic Revenue Growth 9 %~ 9.5%UnchangedAdjusted EBITDA Margin 43.6 %+100bps vs 2025Unchanged
(1)Non-IFRS financial measures. See the "Non-IFRS Financial Measures" section below as well as the tables appended to this news release for more information.(2)Total revenue growth reflects the impact of the disposals of FindLaw and other non-core businesses in December 2024.The information in this section is forward-looking. Actual results, which will include the impact of currency, future acquisitions and dispositions completed during 2026, and macroeconomic events outside of the company's control may differ materially from the company's 2026 outlook. The information in this section should also be read in conjunction with the section below entitled "Special Note Regarding Forward-Looking Statements, Material Risks and Material Assumptions." Return of Capital and Share Consolidation On May 4, 2026, the company returned $605 million to its shareholders and reduced its common shares outstanding by approximately 6.5 million, in accordance with its previously announced return of capital and share consolidation transactions. The transactions consisted of a special cash distribution of $1.435518 per participating common share and a share consolidation, or "reverse stock split", which reduced the number of outstanding common shares at a ratio of 1 pre-consolidated share for 0.984560 post-consolidated shares, which was proportional to the special cash distribution.Share Repurchases - Update on $600 Million Share Repurchase Program In February 2026, the company announced its plan to repurchase up to $600 million of additional common shares under an amended Normal Course Issuer Bid that was approved by the TSX. The company repurchased 2.5 million of its common shares for a total spend of $262 million.As of May 4, 2026, Thomson Reuters had approximately 436.5 million common shares outstanding.AcquisitionIn February 2026, the company acquired Noetica, Inc., a New York-based AI-native start-up that transforms transaction-deal data into structured market intelligence for deal professionals. This business will be primarily reported in the Legal Professionals segment.Dividends In February 2026, the company announced a 10% or $0.24 per share annualized increase in the dividend to $2.62 per common share, representing the 33rd consecutive year of dividend increases and the fifth consecutive 10% increase. A quarterly dividend of $0.655 per share is payable on June 10, 2026 to common shareholders of record as of May 20, 2026.Thomson Reuters
Thomson Reuters (TSX/Nasdaq: TRI) informs the way forward by bringing together the trusted content and technology that people and organizations need to make the right decisions. The company serves professionals across legal, tax, audit, accounting, compliance, government, and media. Its products combine highly specialized software and insights to empower professionals with the data, intelligence, and solutions needed to make informed decisions, and to help institutions in their pursuit of justice, truth and transparency. Reuters, part of Thomson Reuters, is a world leading provider of trusted journalism and news. For more information, visit thomsonreuters.com.NON-IFRS FINANCIAL MEASURESThomson Reuters prepares its financial statements in accordance with International Financial Reporting Standards (IFRS), as issued by the International Accounting Standards Board (IASB). This news release includes certain non-IFRS financial measures, which include ratios that incorporate one or more non-IFRS financial measures, such as adjusted EBITDA (other than at the customer segment level) and the related margin, free cash flow, adjusted earnings and the effective tax rate on adjusted earnings, adjusted EPS, accrued capital expenditures expressed as a percentage of revenues, net debt and leverage ratio of net debt to adjusted EBITDA, selected measures excluding the impact of foreign currency, changes in revenues computed on an organic basis as well as all financial measures for the "Big 3" segments. Thomson Reuters uses these non-IFRS financial measures as supplemental indicators of its operating performance and financial position as well as for internal planning purposes and the company's business outlook. Additionally, Thomson Reuters uses non-IFRS measures as the basis for management incentive programs. These measures do not have any standardized meanings prescribed by IFRS and therefore are unlikely to be comparable to the calculation of similar measures used by other companies and should not be viewed as alternatives to measures of financial performance calculated in accordance with IFRS. Non-IFRS financial measures are defined and reconciled to the most directly comparable IFRS measures in the appended tables. The company's outlook contains various non-IFRS financial measures. The company believes that providing reconciliations of forward-looking non-IFRS financial measures in its outlook would be potentially misleading and not practical due to the difficulty of projecting items that are not reflective of ongoing operations in any future period. The magnitude of these items may be significant. Consequently, for purposes of its outlook only, the company is unable to reconcile these non-IFRS measures to the most directly comparable IFRS measures because it cannot predict, with reasonable certainty, the impacts of changes in foreign exchange rates which impact (i) the translation of its results reported at average foreign currency rates for the year, and (ii) other finance income or expense related to intercompany financing arrangements. Additionally, the company cannot reasonably predict the occurrence or amount of other operating gains and losses that generally arise from business transactions that the company does not currently anticipate.ROUNDINGOther than EPS, the company reports its results in millions of U.S. dollars, but computes percentage changes and margins using whole dollars to be more precise. As a result, percentages and margins calculated from reported amounts may differ from those presented, and growth components may not total due to rounding.REVISION TO PRIOR-YEAR SEGMENT RESULTSEffective January 1, 2026, the company made changes to its segment reporting to reflect how it currently manages its segments. The changes reflect the transfer of certain customers and their related revenues and expenses among the company's Legal Professionals, Corporates and Tax, Audit & Accounting Professionals segments. These changes impact the financial results of the company's segments, but do not change its consolidated financial results. The following summarizes the changes to the applicable segment's first-quarter 2025 reported amounts:Legal Professionals revenues decreased $5 million to $688 million, adjusted EBITDA was unchanged at $336 million and adjusted EBITDA margin increased 30 basis points to 48.7%;Corporates revenues increased $7 million to $548 million, adjusted EBITDA increased $2 million to $215 million and adjusted EBITDA margin decreased 10 basis points to 39.3%; andTax, Audit & Accounting Professionals revenues decreased $2 million to $358 million, adjusted EBITDA decreased $2 million to $208 million and adjusted EBITDA margin decreased 10 basis points to 56.6%.SPECIAL NOTE REGARDING FORWARD-LOOKING STATEMENTS, MATERIAL RISKS AND MATERIAL ASSUMPTIONSCertain statements in this news release, including, but not limited to, statements in Mr. Hasker's comments and the "2026 Outlook" section, are forward-looking. The words "will", "expect", "believe", "target", "estimate", "could", "should", "intend", "predict", "project" and similar expressions identify forward-looking statements. While the company believes that it has a reasonable basis for making forward-looking statements in this news release, they are not a guarantee of future performance or outcomes and there is no assurance that any of the other events described in any forward-looking statement will materialize. Forward-looking statements are subject to a number of risks, uncertainties and assumptions that could cause actual results or events to differ materially from current expectations. Many of these risks, uncertainties and assumptions are beyond the company's control and the effects of them can be difficult to predict.Some of the material risk factors that could cause actual results or events to differ materially from those expressed in or implied by forward-looking statements in this news release include, but are not limited to, those discussed on pages 19-32 in the "Risk Factors" section of the company's 2025 annual report. These and other risk factors are discussed in materials that Thomson Reuters from time-to-time files with, or furnishes to, the Canadian securities regulatory authorities and the U.S. Securities and Exchange Commission (SEC). Thomson Reuters' annual and quarterly reports are also available in the "Investor Relations" section of thomsonreuters.com.The company's 2026 business outlook is based on information currently available to the company and is based on various external and internal assumptions made by the company in light of its experience and perception of historical trends, current conditions and expected future developments, as well as other factors that the company believes are appropriate under the circumstances. Material assumptions and material risks may cause actual performance to differ from the company's expectations underlying its 2026 business outlook. In particular, the global economy has experienced substantial disruption due to concerns regarding economic effects associated with the macroeconomic backdrop and ongoing geopolitical risks. The company's 2026 business outlook assumes that uncertain macroeconomic and geopolitical conditions will continue to disrupt the economy and cause periods of volatility, however, these conditions may last substantially longer than expected and any worsening of the global economic or business environment could impact the company's ability to achieve its outlook and affect its results and other expectations. For a discussion of material assumptions and material risks related to the company's 2026 outlook see pages 61-62 of the company's 2025 annual report. The company's annual report was filed with, or furnished to, the Canadian securities regulatory authorities and the U.S. SEC and are also available in the "Investor Relations" section of thomsonreuters.com. The company has provided an outlook for the purpose of presenting information about current expectations for the period presented. This information may not be appropriate for other purposes. You are cautioned not to place undue reliance on forward-looking statements which reflect expectations only as of the date of this news release. Except as may be required by applicable law, Thomson Reuters disclaims any obligation to update or revise any forward-looking statements. CONTACTSMEDIASamina AnsariDirector, Corporate Affairs+1 44 778 852 9542samina.ansari@thomsonreuters.com INVESTORSGary Bisbee, CFAHead of Investor Relations+1 646 540 3249gary.bisbee@thomsonreuters.com Thomson Reuters will webcast a discussion of its first-quarter 2026 results and its 2026 business outlook today beginning at 9:00 a.m. Eastern Daylight Time (EDT). You can access the webcast by visiting ir.thomsonreuters.com. An archive of the webcast will be available following the presentation. Thomson Reuters CorporationConsolidated Income Statement(millions of U.S. dollars, except per share data)(unaudited)
Three Months Ended
March 31,
2026
2025CONTINUING OPERATIONS
Revenues$2,087
$1,900Operating expenses(1,203)
(1,108)Depreciation(28)
(27)Amortization of software(193)
(174)Amortization of other identifiable intangible assets(24)
(25)Other operating losses, net-
(3)Operating profit639
563Finance costs, net:
Net interest expense(39)
(30) Other finance income (costs)9
(10)Income before tax and equity method investments609
523Share of post-tax losses in equity method investments(7)
(6)Tax expense(125)
(92)Earnings from continuing operations477
425(Loss) earnings from discontinued operations, net of tax (18)
9Net earnings$459
$434Earnings attributable to common shareholders$459
$434
Earnings per share:
Basic and diluted earnings (loss) per share:
From continuing operations$1.07
$0.94 From discontinued operations(0.04)
0.02Basic and diluted earnings per share$1.03
$0.96
Basic weighted-average common shares444,561,933
450,289,884Diluted weighted-average common shares444,657,277
450,829,350 Thomson Reuters CorporationConsolidated Statement of Financial Position(millions of U.S. dollars)(unaudited)
March 31,
December 31,
2026
2025Assets
Cash and cash equivalents$400
$511Trade and other receivables1,184
1,143Other financial assets89
94Prepaid expenses and other current assets 460
480Current assets2,133
2,228
Property and equipment, net341
361Software, net1,697
1,645Other identifiable intangible assets, net3,077
3,102Goodwill8,056
7,913Equity method investments193
202Other financial assets460
466Other non-current assets686
680Deferred tax1,301
1,343Total assets$17,944
$17,940
Liabilities and equity
Liabilities
Current indebtedness$1,120
$795Payables, accruals and provisions934
1,090Current tax liabilities204
224Deferred revenue1,162
1,251Other financial liabilities109
108Current liabilities3,529
3,468
Long-term indebtedness1,328
1,328Provisions and other non-current liabilities662
656Other financial liabilities229
210Deferred tax384
364Total liabilities6,132
6,026
Equity
Capital3,613
3,597Retained earnings9,150
9,220Accumulated other comprehensive loss(951)
(903)Total equity11,812
11,914Total liabilities and equity$17,944
$17,940 Thomson Reuters CorporationConsolidated Statement of Cash Flow(millions of U.S. dollars)(unaudited)
Three Months Ended
March 31,
2026
2025Cash provided by (used in):
Operating activities
Earnings from continuing operations$477
$425Adjustments for:
Depreciation28
27Amortization of software193
174Amortization of other identifiable intangible assets24
25Share of post-tax losses in equity method investments7
6Deferred tax36
19Other46
64Changes in working capital and other items(305)
(293)Operating cash flows from continuing operations506
447Operating cash flows from discontinued operations(1)
(2)Net cash provided by operating activities505
445Investing activities
Acquisitions, net of cash acquired(212)
(606)Proceeds related to disposals of businesses and investments 1
-Capital expenditures(156)
(151)Other investing activities-
1Net cash used in investing activities(367)
(756)Financing activities
Net borrowings under short-term loan facilities322
-Payments of lease principal(16)
(17)Repurchases of common shares(262)
-Dividends paid on preference shares(1)
(1)Dividends paid on common shares(280)
(259)Other financing activities(11)
(11)Net cash used in financing activities(248)
(288)Translation adjustments(1)
2Decrease in cash and cash equivalents(111)
(597)Cash and cash equivalents at beginning of period511
1,968Cash and cash equivalents at end of period$400
$1,371
Thomson Reuters CorporationReconciliation of Earnings from Continuing Operations to Adjusted EBITDA(1)(millions of U.S. dollars)(unaudited)
Three months ended
March 31,
Year ended
December 31,
20262025
2025Earnings from continuing operations$477$425
$1,483Adjustments to remove:
Tax expense12592
423Other finance (income) costs(9)10
55Net interest expense3930
143Amortization of other identifiable intangible assets2425
98Amortization of software193174
721Depreciation2827
111EBITDA$877$783
$3,034Adjustments to remove:
Share of post-tax losses in equity method investments76
28Other operating losses (gains), net-3
(164)Fair value adjustments*(3)17
38Adjusted EBITDA(1)$881$809
$2,936Adjusted EBITDA margin(1)42.2 %42.3 %
39.2 %
* Fair value adjustments primarily represent gains or losses due to changes in foreign currency exchange rates on intercompany balances that arise in the ordinary course of business, which are a component of operating expenses, as well as adjustments related to acquired deferred revenue.
Thomson Reuters CorporationReconciliation of Net Cash Provided By Operating Activities to Free Cash Flow(1)(millions of U.S. dollars)(unaudited)
Three months ended
March 31,
Year ended
December 31,
20262025
2025Net cash provided by operating activities$505$445
$2,651Capital expenditures(156)(151)
(634)Other investing activities-1
1Payments of lease principal(16)(17)
(64)Dividends paid on preference shares(1)(1)
(4)Free cash flow(1)$332$277
$1,950
Thomson Reuters CorporationReconciliation of Capital Expenditures to Accrued Capital Expenditures(1)(millions of U.S. dollars)(unaudited)
Year ended
December 31,
2025Capital expenditures
$634Remove: IFRS adjustment to cash basis
(18)Accrued capital expenditures(1)
$616Accrued capital expenditures as a percentage of revenues(1)
8.2 %
(1) Refer to page 18 for additional information on non-IFRS financial measures. Thomson Reuters CorporationReconciliation of Net Earnings to Adjusted Earnings(1)Reconciliation of Total Change in Adjusted EPS to Change in Constant Currency(1)(millions of U.S. dollars, except for share and per share data)(unaudited)
Three months ended
March 31,
Year ended
December 31,
20262025
2025Net earnings$459$434
$1,502Adjustments to remove:
Fair value adjustments*(3)17
38Amortization of acquired software5649
206Amortization of other identifiable intangible assets2425
98Other operating losses (gains), net-3
(164)Other finance (income) costs(9)10
55Share of post-tax losses in equity method investments76
28Tax on above items(1)(14)(24)
(35)Tax items impacting comparability(1)(1)1
57Loss (earnings) from discontinued operations, net of tax18(9)
(19)Interim period effective tax rate normalization(1)11(5)
-Dividends declared on preference shares(1)(1)
(4)Adjusted earnings(1)$547$506
$1,762Adjusted EPS(1)$1.23$1.12
Total change10 %
Foreign currency0 %
Constant currency10 %
Diluted weighted-average common shares (millions)444.7450.8
Reconciliation of Full-Year Effective Tax Rate on Adjusted Earnings(1)
Year ended
December 31,
2025Adjusted earnings
$1,762Plus: Dividends declared on preference shares
4Plus: Tax expense on adjusted earnings
401Pre-tax adjusted earnings
$2,167
IFRS tax expense
$423Remove tax related to:
Amortization of acquired software
46Amortization of other identifiable intangible assets
23Share of post-tax losses in equity method investments
2Other finance costs
2Other operating gains, net
(43)Other items
5Subtotal - Remove tax benefit on pre-tax items removed from adjusted earnings
35Remove: Tax items impacting comparability
(57)Total - Remove all items impacting comparability
(22)Tax expense on adjusted earnings
$401Effective tax rate on adjusted earnings
18.5 %
*Fair value adjustments primarily represent gains or losses due to changes in foreign currency exchange rates on intercompany balances that arise in the ordinary course of business, which are a component of operating expenses, as well as adjustments related to acquired deferred revenue.
(1) Refer to page 18 for additional information on non-IFRS financial measures.
Thomson Reuters CorporationReconciliation of Changes in Revenues to Changes in Revenues on a Constant Currency(1) and Organic Basis(1)(millions of U.S. dollars)(unaudited)
Three months ended
March 31,Change
2026
2025
TotalForeign
Currency
SUBTOTAL
Constant
CurrencyNet
Acquisitions/
(Disposals)
OrganicTotal Revenues
Legal Professionals
$756
$688
10 %
1 %
8 %
0 %
9 %Corporates
608
548
11 %
2 %
9 %
0 %
9 %Tax, Audit & Accounting Professionals
410
358
15 %
1 %
14 %
3 %
10 %"Big 3" Segments Combined(1)
1,774
1,594
11 %
1 %
10 %
1 %
9 %Reuters
212
196
8 %
1 %
7 %
1 %
6 %Global Print
112
116
-4 %
1 %
-5 %
0 %
-5 %Eliminations/Rounding
(11)
(6)
Total Revenues
$2,087
$1,900
10 %
1 %
8 %
1 %
8 %
Recurring Revenues
Legal Professionals
$739
$670
10 %
1 %
9 %
0 %
9 %Corporates
449
407
10 %
2 %
8 %
0 %
8 %Tax, Audit & Accounting Professionals
229
205
12 %
2 %
10 %
0 %
10 %"Big 3" Segments Combined(1)
1,417
1,282
10 %
2 %
9 %
0 %
9 %Reuters
186
175
6 %
1 %
5 %
1 %
5 %Eliminations/Rounding
(8)
(6)
Total Recurring Revenues
$1,595
$1,451
10 %
2 %
8 %
0 %
8 %
Transactions Revenues
Legal Professionals
$17
$18
-1 %
1 %
-2 %
0 %
-2 %Corporates
159
141
13 %
1 %
12 %
0 %
12 %Tax, Audit & Accounting Professionals
181
153
18 %
0 %
18 %
8 %
11 %"Big 3" Segments Combined(1)
357
312
15 %
1 %
14 %
4 %
11 %Reuters
26
21
22 %
0 %
21 %
3 %
18 %Eliminations/Rounding
(3)
-
Total Transactions Revenues
380
333
15 %
1 %
14 %
4 %
10 %
Year ended
December 31,
Change
2025
2024
TotalForeign
Currency
SUBTOTAL
Constant
CurrencyNet
Acquisitions/
(Disposals)
OrganicTotal Revenues
Legal Professionals
$2,843
$2,902
-2 %
0 %
-2 %
-10 %
8 %Corporates
2,023
1,875
8 %
0 %
7 %
-1 %
9 %Tax, Audit & Accounting Professionals
1,291
1,154
12 %
-1 %
13 %
3 %
11 %"Big 3" Segments Combined(1)
6,157
5,931
4 %
0 %
4 %
-5 %
9 %Reuters
853
832
3 %
1 %
2 %
1 %
1 %Global Print
490
519
-6 %
0 %
-5 %
0 %
-5 %Eliminations/Rounding
(24)
(24)
Total Revenues
$7,476
$7,258
3 %
0 %
3 %
-4 %
7 %
Growth percentages are computed using whole dollars. As a result, percentages calculated from reported amounts may differ from those presented, and growth components may not total due to rounding.
(1) Refer to page 18 for additional information on non-IFRS financial measures.
Thomson Reuters CorporationReconciliation of Changes in Adjusted EBITDA (1) and Related Margin(1) to Changes on a Constant Currency Basis(1)(millions of U.S. dollars)(unaudited)
Three months ended
March 31,Change
2026
2025
TotalForeign
Currency
Constant
CurrencyAdjusted EBITDA(1)
Legal Professionals
$365
$336
9 %
1 %
8 %Corporates
243
215
13 %
0 %
13 %Tax, Audit & Accounting Professionals
221
208
6 %
0 %
6 %"Big 3" Segments Combined(1)
829
759
9 %
1 %
9 %Reuters
34
39
-13 %
-9 %
-4 %Global Print
43
44
-2 %
1 %
-3 %Corporate costs
(25)
(33)
n/a
n/a
n/aTotal Adjusted EBITDA
$881
$809
9 %
0 %
9 %
Adjusted EBITDA Margin(1)
Legal Professionals
48.3 %
48.7 %
-40bp
-10bp
-30bpCorporates
40.0 %
39.3 %
70bp
-60bp
130bpTax, Audit & Accounting Professionals
53.8 %
56.6 %
-280bp
-40bp
-240bp"Big 3" Segments Combined(1)
46.7 %
47.3 %
-60bp
-40bp
-20bpReuters
16.1 %
20.0 %
-390bp
-200bp
-190bpGlobal Print
38.6 %
37.8 %
80bp
0bp
80bpTotal Adjusted EBITDA Margin
42.2 %
42.3 %
-10bp
-50bp
40bpReconciliation of adjusted EBITDA margin(1)To compute segment and consolidated adjusted EBITDA margin, the company excludes fair value adjustments related to acquired deferred revenue from its IFRS revenues. The charts below reconcile IFRS revenues to revenues used in the calculation of adjusted EBITDA margin, which excludes fair value adjustments related to acquired deferred revenue.(millions of U.S. dollars)
(unaudited)
Three months ended March 31, 2026 IFRS
revenues
Remove fair
value
adjustments
to acquired
deferred
revenue
Revenues
excluding
fair value
adjustments
to acquired
deferred
revenue
Adjusted
EBITDA
Adjusted
EBITDA
MarginLegal Professionals$756
-
$756
$365
48.3 %Corporates608
-
608
243
40.0 %Tax, Audit & Accounting Professionals410
-
410
221
53.8 %"Big 3" Segments Combined(1)1,774
-
1,774
829
46.7 %Reuters212
-
212
34
16.1 %Global Print112
-
112
43
38.6 %Eliminations/Rounding(11)
-
(11)
-
n/aCorporate costs-
-
-
(25)
n/aConsolidated totals$2,087
-
$2,087
$881
42.2 %
Three months ended March 31, 2025
Legal Professionals$688
-
$688
$336
48.7 %Corporates548
-
548
215
39.3 %Tax, Audit & Accounting Professionals358
$10
368
208
56.6 %"Big 3" Segments Combined(1)1,594
10
1,604
759
47.3 %Reuters196
-
196
39
20.0 %Global Print116
-
116
44
37.8 %Eliminations/Rounding(6)
-
(6)
-
n/aCorporate costs-
-
-
(33)
n/aConsolidated totals$1,900
$10
$1,910
$809
42.3 %
n/a: not applicableMargins are computed using whole dollars, as a result, margins calculated from reported amounts may differ from those presented due to rounding.(1) Refer to page 18 for additional information on non-IFRS financial measures.
Thomson Reuters Corporation"Big 3" Segments and Consolidated Adjusted EBITDA(1) and the Related Margins(1)(millions of U.S. dollars)(unaudited)
Year ended
December 31,
2025
Adjusted EBITDA(1)
Legal Professionals
$1,354
Corporates
727
Tax, Audit & Accounting Professionals
614
"Big 3" Segments Combined(1)
2,695
Reuters
174
Global Print
185
Corporate costs
(118)
Total Adjusted EBITDA
$2,936
"Big 3" Segments Combined(1)
Adjusted EBITDA
$2,695
Revenues, excluding $20 million of fair value adjustments to acquired deferred revenue
$6,177
Adjusted EBITDA margin
43.6 %
Consolidated(1)
Adjusted EBITDA
$2,936
Revenues, excluding $20 million of fair value adjustments to acquired deferred revenue
$7,496
Adjusted EBITDA margin
39.2 %
Thomson Reuters CorporationReconciliation of Net Debt(1) and Leverage Ratio of Net Debt to Adjusted EBITDA(1)(millions of U.S. dollars)(unaudited)
March 31,
December 31,
2026
2025Current indebtedness
$1,120
$795Long-term indebtedness
1,328
1,328Total debt
2,448
2,123Swaps
17
16Total debt after swaps
2,465
2,139Remove fair value adjustments for hedges
(3)
(2)Total debt after hedging arrangements
2,462
2,137Collateral assets
(1)
(7)Remove transaction costs, premiums or discounts, included in the carrying value of debt27
28Add: Lease liabilities (current and non-current)
234
249Less: Cash and cash equivalents
(400)
(511)Net debt
$2,322
$1,896Leverage ratio of net debt to adjusted EBITDA
Adjusted EBITDA
$3,008
$2,936Net debt/adjusted EBITDA
0.8:1
0.6:1
(1) Refer to page 18 for additional information on non-IFRS financial measures. Non-IFRS Financial MeasuresDefinitionWhy Useful to the Company and InvestorsAdjusted EBITDA and the related marginRepresents earnings or losses from continuing operations before tax expense or benefit, net interest expense, other finance costs or income, depreciation, amortization of software and other identifiable intangible assets, Thomson Reuters share of post-tax earnings or losses in equity method investments, other operating gains and losses, certain asset impairment charges and fair value adjustments, including those related to acquired deferred revenue. The related margin is adjusted EBITDA expressed as a percentage of revenues. For purposes of this calculation, revenues are before fair value adjustments to acquired deferred revenue.Provides a consistent basis to evaluate operating profitability and performance trends by excluding items that the company does not consider to be controllable activities for this purpose. Also, represents a measure commonly reported and widely used by investors as a valuation metric, as well as to assess the company's ability to incur and service debt.Adjusted earnings and adjusted EPS Net earnings or loss including dividends declared on preference shares but excluding the post-tax impacts of fair value adjustments, including those related to acquired deferred revenue, amortization of acquired intangible assets (attributable to other identifiable intangible assets and acquired software), other operating gains and losses, certain asset impairment charges, other finance costs or income, Thomson Reuters share of post-tax earnings or losses in equity method investments, discontinued operations and other items affecting comparability. Acquired intangible assets contribute to the generation of revenues from acquired companies, which are included in the company's computation of adjusted earnings. The post-tax amount of each item is excluded from adjusted earnings based on the specific tax rules and tax rates associated with the nature and jurisdiction of each item. Adjusted EPS is calculated from adjusted earnings using diluted weighted-average shares and does not represent actual earnings or loss per share attributable to shareholders. Provides a more comparable basis to analyze earnings. These measures are commonly used by shareholders to measure performance.Effective tax rate on adjusted earningsAdjusted tax expense divided by pre-tax adjusted earnings. Adjusted tax expense is computed as income tax expense or benefit plus or minus the income tax impacts of all items impacting adjusted earnings (as described above), and other tax items impacting comparability. In interim periods, the company also makes an adjustment to reflect income taxes based on the estimated full-year effective tax rate. Earnings or losses for interim periods under IFRS reflect income taxes based on the estimated effective tax rates of each of the jurisdictions in which Thomson Reuters operates. The non-IFRS adjustment reallocates estimated full-year income taxes between interim periods but has no effect on full-year income taxes. Provides a basis to analyze the effective tax rate associated with adjusted earnings. The company's effective tax rate computed in accordance with IFRS may be more volatile by quarter because the geographical mix of pre-tax profits and losses in interim periods may be different from that for the full year. Therefore, the company believes that using the expected full-year effective tax rate provides more comparability among interim periods. Free cash flowNet cash provided by operating activities and other investing activities, less capital expenditures, payments of lease principal and dividends paid on the company's preference shares. Helps assess the company's ability, over the long term, to create value for its shareholders as it represents cash available to repay debt, pay common dividends, fund share repurchases and acquisitions.Changes before the impact of foreign currency or at constant currencyThe changes in revenues, adjusted EBITDA and the related margin, and adjusted EPS before currency (at constant currency or excluding the effects of currency) are determined by converting the current and equivalent prior period's local currency results using the same foreign currency exchange rate.Provides better comparability of business trends from period to period.Changes in revenues computed on an organic basisRepresent changes in revenues of the company's existing businesses at constant currency. The metric excludes the distortive impacts of acquisitions and dispositions from not owning the business in both comparable periods. Provides further insight into the performance of the company's existing businesses by excluding distortive impacts and serves as a better measure of the company's ability to grow its business over the long term.Accrued capital expenditures as a percentage of revenuesAccrued capital expenditures divided by revenues, where accrued capital expenditures include amounts that remain unpaid at the end of the reporting period. For purposes of this calculation, revenues are before fair value adjustments to acquired deferred revenue.Reflects the basis on which the company manages capital expenditures for internal planning purposes. "Big 3" segments The company's combined Legal Professionals, Corporates and Tax, Audit & Accounting Professionals segments. All measures reported for the "Big 3" segments are non-IFRS financial measures.The "Big 3" segments comprised approximately 80% of revenues and represent the core of the company's business information service product offerings. Net debt and leverage ratio of net debt to adjusted EBITDANet debt is total debt, plus related hedging instruments and collateral balances, along with lease liabilities, excluding unamortized transaction costs and any premiums or discounts on debt, minus cash and cash equivalents. We exclude specific hedging components to reflect the net cash outflow upon debt maturity. Net debt to adjusted EBITDA is net debt divided by adjusted EBITDA for the previous twelve-month period ending with the current fiscal quarter.Provides a commonly used measure of a company's leverage and its ability to pay its debt. Given that the company hedges some of its debt to manage risk, the company includes hedging instruments as it believes it provides a better measure of the total obligation associated with its outstanding debt. Since the company plans to hold its debt and related hedges until maturity, the net debt calculation is adjusted to reflect the net cash outflow at maturity, after deducting cash and cash equivalents. The company's non-IFRS measure is aligned with the calculation of its internal target leverage ratio and is more conservative than the maximum ratio allowed under the contractual covenants in its credit facility.Please refer to reconciliations for the most directly comparable IFRS financial measures. View original content to download multimedia:https://www.prnewswire.com/news-releases/thomson-reuters-reports-first-quarter-2026-results-302762542.htmlSOURCE Thomson Reuters Original: Thomson Reuters Reports First-Quarter 2026 Results
CA Market News
4月前
One Million Professionals Turn to CoCounsel as Thomson Reuters Scales AI for Regulated IndustriesFebruary 24, 2026 8:00 AM
PR Newswire (US)
Milestone Signals Shift from AI Pilots to Production Systems and Previews the Next Generation of CoCounsel LegalTORONTO, Feb. 24, 2026 /PRNewswire/ -- Thomson Reuters (TSX/Nasdaq: TRI), a global content and technology company, today announced one million professionals have chosen CoCounsel, the company's professional-grade AI technology, across 107 countries and territories. The milestone reflects a broader transition underway across high-stakes industries including legal, risk, compliance, tax, accounting, audit and global trade professionals. AI is moving from experimentation to production. Rather than standalone tools, firms are embedding AI directly into daily workflows where accuracy, sourcing, and data protection are essential.
General-purpose AI can generate plausible answers. Regulated professionals, however, need AI that withstands review in courtrooms, audits, and regulatory proceedings.These systems need to retrieve authoritative sources, verify citations, and apply jurisdiction-specific rules.CoCounsel fulfills those requirements, powering intelligent capabilities across the company's portfolio—including CoCounsel Legal, CoCounsel Tax and Audit, and ONESOURCE+. It integrates into the tools professionals already use, analyzes licensed content refined over 175 years, incorporates expert-developed validation logic, and delivers structured, citation-backed outputs. Customer data remains protected and is not repurposed to train third-party models. More than 4,500 Thomson Reuters subject matter experts contribute to the validation and continuous refinement of CoCounsel's outputs across legal, tax, and compliance domains."Professionals are not deciding whether to use AI anymore. They are deciding which AI they trust when their reputation and their clients' data are on the line," said Steve Hasker, President and Chief Executive Officer, Thomson Reuters. "CoCounsel is built for moments when being almost right is not good enough. It is grounded in decades of authoritative content, validated by domain experts, and backed by a clear commitment that customer data remains theirs. That is why one million professionals rely on CoCounsel.""When the work matters, the AI must be professional grade. Professionals need systems that can complete sophisticated work within the standards they are accountable to every day. That's the gap between CoCounsel and everything else," added David Wong, Chief Product Officer, Thomson Reuters. "One million CoCounsel users across 100+ countries and territories reflects a shared global consensus."Built for Regulated Work
CoCounsel's adoption reflects design decisions tailored to professional environments:Licensed, authoritative content. Outputs are grounded in editorially enhanced legal and tax sources, not scraped public data.Expert validation. Domain specialists shape workflow logic and quality standards in areas where errors carry consequences.Workflow integration. CoCounsel operates inside research, drafting, and compliance platforms enabling task execution within established professional systems.Data boundaries by design. Thomson Reuters does not repurpose customer inputs to train third-party models or generate outputs for other users.Multi-model architecture with governance. Thomson Reuters works with leading frontier models, including Anthropic's Claude, OpenAI's GPT and Google's Gemini, alongside proprietary AI technology and structured datasets to maintain performance control and system-level oversight.From Tool to Execution Layer
In legal, tax, audit, and compliance workflows, AI must retrieve relevant authority, analyze structured and unstructured information, apply jurisdictional rules, and generate outputs that stand under review. That requires vertically integrated systems.CoCounsel functions as an execution layer embedded within professional platforms, combining foundation models, proprietary AI engineering, proprietary content, and domain expertise to complete multi-step workflows end to end.The next generation of CoCounsel Legal, entering beta soon, is designed around conversational task execution. Soon, legal professionals within law firms and corporations, will be able to describe an objective as they would brief a colleague. CoCounsel will build a plan, retrieve authority from Westlaw and Practical Law, search relevant user documents and precedent, analyze the material, verify that citations remain in good law, and deliver structured work product within a single system. Additional next-generation capabilities within CoCounsel Tax and ONESOURCE+ are planned for later in 2026.As AI becomes embedded in professional systems, the defining question is not how quickly it can produce text, but whether it can support work that carries legal or financial consequences.With one million professionals relying on CoCounsel, Thomson Reuters is not participating in the AI race. It is defining how AI operates in the world's highest-stakes work.About Thomson Reuters
Thomson Reuters (TSX/Nasdaq: TRI) informs the way forward by bringing together the trusted content and technology that people and organizations need to make the right decisions. The company serves professionals across legal, tax, audit, accounting, compliance, government, and media. Its products combine highly specialized software and insights to empower professionals with the data, intelligence, and solutions needed to make informed decisions, and to help institutions in their pursuit of justice, truth, and transparency. Reuters, part of Thomson Reuters, is a world-leading provider of trusted journalism and news. For more information, visit thomsonreuters.com/cocounsel. Media contact
Ali Hughes, Director, Technology and Innovation Communications
Ali.Hughes@tr.com Notes to Editors Product scope: CoCounsel is the AI technology underpinning generative and agentic capabilities across Thomson Reuters legal, tax, accounting, audit, risk, compliance, and corporate solutions. Recent product update: Over the past year, Thomson Reuters has launched dozens of CoCounsel-powered capabilities across research, drafting, analysis, compliance, and workflow automation, including Deep Research and Ready to Review. Model Strategy: Thomson Reuters works with leading model providers and is developing a proprietary large language model designed specifically for professional and regulated use cases. Investment: Thomson Reuters continues to invest significant capital in AI development and acquisitions, reinforcing long-term commitment to professional-grade AI without raising external capital.
View original content to download multimedia:https://www.prnewswire.com/news-releases/one-million-professionals-turn-to-cocounsel-as-thomson-reuters-scales-ai-for-regulated-industries-302694903.htmlSOURCE Thomson Reuters
Original: One Million Professionals Turn to CoCounsel as Thomson Reuters Scales AI for Regulated Industries
CA Market News
5月前
Thomson Reuters Reports Fourth-Quarter and Full-Year 2025 ResultsFebruary 5, 2026 6:30 AM
PR Newswire (US)
TORONTO, Feb. 5, 2026 /PRNewswire/ -- Thomson Reuters (TSX/Nasdaq: TRI) today reported results for the fourth quarter and full year ended December 31, 2025:
Solid revenue momentum continued in the fourth quarter and full year 2025Full-year total company revenues up 3% / organic revenues up 7%Fourth-quarter total company revenues up 5% / organic revenues up 7%Organic revenues up 9% for the "Big 3" segments (Legal Professionals, Corporates and Tax, Audit & Accounting Professionals) in the fourth quarter and full yearMet full-year 2025 outlook for organic revenue growth and adjusted EBITDA margin for total company and "Big 3"; Met free cash flow outlookFull-year 2026 outlook anticipates organic revenue growth of approximately 7.5% - 8.0% and adjusted EBITDA margin expansion of approximately 100 basis points from 39.2% in 2025Increased annualized dividend by 10% to $2.62 per common share (33rd consecutive annual increase)"Our fourth-quarter results capped a year of important progress for Thomson Reuters," said Steve Hasker, President and CEO of Thomson Reuters. "We are seeing tangible benefits from our continued investments in AI, accelerating our pace of product innovation and leveraging technology to reimagine how we work. As we move into 2026, we will continue to scale our agentic capabilities to deliver greater speed, clarity, and confidence for our customers – further demonstrating the value of professional-grade tools built on quality content and deep subject-matter expertise." Hasker added, "We remain focused on allocating capital to drive long-term shareholder value creation. Last year we executed several strategic acquisitions and continued to return capital to shareholders, enabling us to enter this year with a stronger and more strategically aligned portfolio with improved growth prospects."Consolidated Financial Highlights - Three Months Ended December 31
Three months ended December 31,
(Millions of U.S. dollars, except for EPS)
(unaudited)
IFRS Financial Measures(1)
2025
2024
Change
Revenues
$2,009
$1,909
5 %
Operating profit
$540
$722
-25 %
Diluted earnings per share (EPS)
$0.74
$1.30
-43 %
Net cash provided by operating activities
$756
$564
35 %
Non-IFRS Financial Measures(1)
2025
2024
Change
Change at
Constant
Currency
Revenue growth in constant currency
5 %
Organic revenue growth
7 %
Adjusted EBITDA
$777
$718
8 %
8 %
Adjusted EBITDA margin
38.7 %
37.6 %
110bp
140bp
Adjusted EPS
$1.07
$1.01
6 %
7 %
Free cash flow
$581
$425
38 %
(1) In addition to results reported in accordance with International Financial Reporting Standards (IFRS), the company uses certain non-
IFRS financial measures as supplemental indicators of its operating performance and financial position. See the "Non-IFRS Financial
Measures" section and the tables appended to this news release for additional information on these and other non-IFRS financial
measures, including how they are defined and reconciled to the most directly comparable IFRS measures.
Revenues increased 5% due to 6% growth in recurring revenues (84% of total revenues) and 11% growth in transactions revenues, partly offset by a 6% decline in Global Print. Total company revenue growth was negatively impacted by net acquisitions and disposals of 3%. Foreign currency had a slightly positive impact on revenue growth. Organic revenues increased 7% reflecting 9% growth in recurring revenues, 8% growth in transactions revenues and a 6% decline in Global Print.The company's "Big 3" segments reported organic revenue growth of 9% and collectively comprised 82% of total revenues.Operating profit decreased 25% primarily due to other operating gains in the prior-year period substantially related to the sale of FindLaw, as well as higher amortization of software in the current period. These items more than offset the net impact of higher revenues and operating expenses. Adjusted EBITDA, which excludes other operating gains, amortization of software, as well as other adjustments, increased 8% and the related margin increased to 38.7% from 37.6% in the prior-year period, primarily due to higher operating leverage. Foreign currency negatively impacted the year-over-year change in adjusted EBITDA margin by 30 basis points.Diluted EPS decreased to $0.74 per share compared to $1.30 per share in the prior-year period primarily due to lower operating profit. Additionally, the prior-year period also included currency benefits reflected in other finance costs or income. Adjusted EPS, which excludes net other operating gains, other finance costs or income, as well as other adjustments, increased to $1.07 per share compared to $1.01 per share in the prior-year period, primarily due to higher adjusted EBITDA, partly offset by higher amortization of internally developed software and interest expense. Net cash provided by operating activities increased by $192 million as higher cash benefits from the net impact of higher revenues and operating expenses and certain component changes in working capital were partly offset by higher income tax payments. Free cash flow increased by $156 million as higher net cash provided by operating activities was partly offset by lower cash flows from other investing activities, which included a cash flow benefit in the prior-year period. Highlights by Customer Segment – Three Months Ended December 31
(Millions of U.S. dollars)
(unaudited)
Three months ended
December 31,
Change
2025
2024
TotalConstant
Currency(1)
Organic(1)(2)
Revenues
Legal Professionals
$738
$729
1 %
1 %
9 %
Corporates
496
458
8 %
7 %
9 %
Tax, Audit & Accounting Professionals
414
366
13 %
13 %
11 %
"Big 3" Segments Combined(1)
1,648
1,553
6 %
5 %
9 %
Reuters
232
218
7 %
6 %
5 %
Global Print
136
144
-6 %
-6 %
-6 %
Eliminations/Rounding
(7)
(6)
Total Revenues
$2,009
$1,909
5 %
5 %
7 %
Adjusted EBITDA(1)
Legal Professionals
$327
$299
9 %
9 %
Corporates
160
153
4 %
4 %
Tax, Audit & Accounting Professionals
222
196
14 %
13 %
"Big 3" Segments Combined(1)
709
648
9 %
9 %
Reuters
48
45
7 %
12 %
Global Print
54
55
-2 %
-2 %
Corporate costs
(34)
(30)
n/a
n/a
Total Adjusted EBITDA
$777
$718
8 %
8 %
Adjusted EBITDA Margin(1)
Legal Professionals
44.3 %
41.0 %
330bp
350bp
Corporates
32.2 %
33.5 %
-130bp
-70bp
Tax, Audit & Accounting Professionals
53.6 %
53.4 %
20bp
0bp
"Big 3" Segments Combined(1)
43.0 %
41.7 %
130bp
150bp
Reuters
21.0 %
20.8 %
20bp
140bp
Global Print
39.6 %
38.2 %
140bp
160bp
Total Adjusted EBITDA Margin
38.7 %
37.6 %
110bp
140bp
(1) See the "Non-IFRS Financial Measures" section and the tables appended to this news release for additional information on these and
other non-IFRS financial measures. To compute segment and consolidated adjusted EBITDA margin, the company excludes fair value
adjustments related to acquired deferred revenue.
(2) Computed for revenue growth only.
n/a: not applicable
Unless otherwise noted, all revenue growth comparisons by customer segment in this news release are at constant currency (which excludes the impact of foreign currency) as the company believes this provides the best basis to measure performance. Legal Professionals Revenues increased 1% despite the disposal of FindLaw in the prior-year period, which negatively impacted recurring and transactions revenue growth. Organic revenue growth was 9%.Recurring revenues increased 1% (97% of total, increased 8% organic). Organic revenue growth was primarily driven by Westlaw, CoCounsel and Practical Law.Transactions revenues were essentially unchanged (3% of total, increased 28% organic).Adjusted EBITDA increased 9% to $327 million.The margin increased to 44.3% from 41.0% primarily reflecting higher operating leverage as well as the disposal of the lower margin FindLaw business in the prior-year period.Corporates Revenues increased 7% despite a negative impact from the sale of certain non-core businesses. Organic revenues increased 9%.Recurring revenues increased 7% (88% of total, increased 9% organic). Organic revenue growth was primarily driven by Indirect Tax, Direct Tax, Westlaw, Practical Law, Pagero and the segment's international businesses.Transactions revenues increased 7% (12% of total, all organic). Organic revenue growth was primarily driven by increases in Indirect Tax, Global Trade and the segment's international businesses.Adjusted EBITDA increased 4% to $160 million and the margin decreased to 32.2% from 33.5%. Foreign currency negatively impacted the year-over-year change in adjusted EBITDA margin by 60 basis points.Tax, Audit & Accounting Professionals Revenues increased 13%, including the acquisition impact of SafeSend which was reflected in transactions revenues. Organic revenue growth was 11%.Recurring revenues increased 12% (86% of total, all organic). Organic revenue growth was primarily driven by UltraTax, CoCounsel and the segment's Latin America business.Transactions revenues increased 19% (14% of total, increased 3% organic). Organic revenue growth was primarily driven by SafeSend and the segment's international businesses.Adjusted EBITDA increased 14% to $222 million and the margin increased to 53.6% from 53.4%. The Tax, Audit & Accounting Professionals segment is the company's most seasonal business with approximately 60% of full-year revenues typically generated in the first and fourth quarters. As a result, the margin performance of this segment has been generally higher in the first and fourth quarters as costs are typically incurred in a more linear fashion throughout the year.ReutersRevenues increased 6% (5% organic), primarily due to higher generative AI related transactional content licensing revenue in the Agency business, as well as a contractual price increase from the company's news agreement with the Data & Analytics business of London Stock Exchange Group (LSEG).Adjusted EBITDA increased 7% to $48 million and the margin increased to 21.0% from 20.8%.Global Print Revenues decreased 6%, all organic, driven by lower shipment volumes.Adjusted EBITDA decreased 2% to $54 million, and the margin increased to 39.6% from 38.2% reflecting lower expenses.Corporate CostsCorporate costs were $34 million compared to $30 million in the prior-year period.Consolidated Financial Highlights – Year Ended December 31
Year ended December 31,
(Millions of U.S. dollars, except for EPS)
(unaudited)
IFRS Financial Measures(1)
2025
2024
Change
Revenues
$7,476
$7,258
3 %
Operating profit
$2,132
$2,109
1 %
Diluted EPS
$3.33
$4.89
-32 %
Net cash provided by operating activities
$2,651
$2,457
8 %
Non-IFRS Financial Measures(1)
2025
2024
Change
Change at
Constant
Currency
Revenue growth in constant currency
3 %
Organic revenue growth
7 %
Adjusted EBITDA
$2,936
$2,779
6 %
5 %
Adjusted EBITDA margin
39.2 %
38.2 %
100bp
80bp
Adjusted EPS
$3.92
$3.77
4 %
4 %
Free cash flow
$1,950
$1,828
7 %
(1) In addition to results reported in accordance with IFRS, the company uses certain non-IFRS financial measures as supplemental
indicators of its operating performance and financial position. See the "Non-IFRS Financial Measures" section and the tables appended to
this news release for additional information on these and other non-IFRS financial measures, including how they are defined and
reconciled to the most directly comparable IFRS measures.
Revenues increased 3% due to 3% growth in recurring revenues (81% of total revenues) and 5% growth in transactions revenues, partly offset by a 6% decline in Global Print. Total company revenue growth was negatively impacted by net acquisitions and disposals of 4%. Foreign currency had no impact on revenue growth. Organic revenues increased 7% reflecting 9% growth in recurring revenues, 4% growth in transactions revenues and a 5% decline in Global Print.The company's "Big 3" segments reported organic revenue growth of 9% and collectively comprised 82% of total revenues.Operating profit increased 1% primarily driven by the net impact of higher revenues and operating expenses, partially offset by higher amortization of software. Adjusted EBITDA, which excludes amortization of software, as well as other adjustments, increased 6% and the related margin increased to 39.2% from 38.2%, primarily due to higher operating leverage. Foreign currency contributed 20 basis points to the year-over-year change in adjusted EBITDA margin.Diluted EPS decreased to $3.33 per share compared to $4.89 per share in the prior year primarily because the prior-year period included a $468 million or a $1.04 per share non-cash tax benefit related to tax legislation enacted in Canada.Adjusted EPS, which excludes the non-cash tax benefit, as well as other adjustments, increased to $3.92 per share compared to $3.77 per share in the prior year, primarily due to higher adjusted EBITDA, partly offset by higher amortization of internally developed software, income tax expense and interest expense. Net cash provided by operating activities increased by $194 million as higher cash benefits from the net impact of higher revenues and operating expenses and certain component changes in working capital were partly offset by higher income tax payments.Free cash flow increased by $122 million as higher net cash provided by operating activities was partly offset by higher capital expenditures and lower cash flows from other investing activities.Highlights by Customer Segment – Year Ended December 31
(Millions of U.S. dollars)
(unaudited)
Year ended
December 31,
Change
2025
2024
TotalConstant
Currency(1)
Organic(1)(2)
Revenues
Legal Professionals
$2,868
$2,922
-2 %
-2 %
8 %
Corporates
1,987
1,844
8 %
7 %
9 %
Tax, Audit & Accounting Professionals
1,302
1,165
12 %
13 %
11 %
"Big 3" Segments Combined(1)
6,157
5,931
4 %
4 %
9 %
Reuters
853
832
3 %
2 %
1 %
Global Print
490
519
-6 %
-5 %
-5 %
Eliminations/Rounding
(24)
(24)
Total Revenues
$7,476
$7,258
3 %
3 %
7 %
Adjusted EBITDA(1)
Legal Professionals
$1,356
$1,302
4 %
3 %
Corporates
716
671
7 %
6 %
Tax, Audit & Accounting Professionals
623
527
18 %
19 %
"Big 3" Segments Combined(1)
2,695
2,500
8 %
7 %
Reuters
174
196
-11 %
-11 %
Global Print
185
188
-2 %
-2 %
Corporate costs
(118)
(105)
n/a
n/a
Total Adjusted EBITDA
$2,936
$2,779
6 %
5 %
Adjusted EBITDA Margin(1)
Legal Professionals
47.3 %
44.6 %
270bp
250bp
Corporates
36.0 %
36.3 %
-30bp
-30bp
Tax, Audit & Accounting Professionals
47.1 %
45.2 %
190bp
150bp
"Big 3" Segments Combined(1)
43.6 %
42.1 %
150bp
130bp
Reuters
20.4 %
23.6 %
-320bp
-290bp
Global Print
37.7 %
36.2 %
150bp
120bp
Total Adjusted EBITDA Margin
39.2 %
38.2 %
100bp
80bp
(1) See the "Non-IFRS Financial Measures" section and the tables appended to this news release for additional information on these and
other non-IFRS financial measures. To compute segment and consolidated adjusted EBITDA margin, the company excludes fair value
adjustments related to acquired deferred revenue.
(2) Computed for revenue growth only.
n/a: not applicable
2026 Outlook The company's outlook for 2026 in the table below assumes constant currency rates and does not factor in the impact of any future acquisitions or dispositions that may occur during the year. Thomson Reuters believes that this type of guidance provides useful insight into the anticipated performance of its businesses.The company expects its first-quarter 2026 organic revenue growth to be approximately 7% and its adjusted EBITDA margin to be approximately 42%.The company's 2026 outlook is forward-looking information that is subject to risks and uncertainties (see "Special Note Regarding Forward-Looking Statements, Material Risks and Material Assumptions"). In particular, the company continues to operate in an uncertain macroeconomic environment, reflecting ongoing geopolitical risk, uneven economic growth and an evolving interest rate and inflationary backdrop. Any worsening of the global economic or business environment, among other factors, could impact the company's ability to achieve its outlook.Reported Full-Year 2025 Results and Full-Year 2026 OutlookTotal Thomson ReutersFY 2025ReportedFY 2026OutlookTotal Revenue Growth3%(2)7.5% - 8.0%Organic Revenue Growth(1)7 %7.5% - 8.0%Adjusted EBITDA Margin(1)39.2 %+100bps vs 2025Corporate Costs$118 million$115 - $125 millionFree Cash Flow(1)$1.95 billion~ $2.1 billionAccrued Capex as % of Revenues(1)8.2 %~ 8.0%Depreciation & Amortization of Software Depreciation & Amortization of Internally Developed Software Amortization of Acquired Software$832 million$626 million$206 million$890- $910 million$680 - $690 million$210 - $220 millionNet Interest Expense$143 million$150 - $160 millionEffective Tax Rate on Adjusted Earnings(1)18.5 %~ 19%"Big 3" Segments(1)FY 2025ReportedFY 2026OutlookTotal Revenue Growth 4%(2)~ 9.5%Organic Revenue Growth 9 %~ 9.5%Adjusted EBITDA Margin 43.6 %+100bps vs 2025
(1)Non-IFRS financial measures. See the "Non-IFRS Financial Measures" section below as well as the tables appended to this news release for more information.(2)Total revenue growth reflects the impact of the disposals of FindLaw and other non-core businesses in December 2024.The information in this section is forward-looking. Actual results, which will include the impact of currency, future acquisitions and dispositions completed during 2026, and macroeconomic events outside of the company's control may differ materially from the company's 2026 outlook. The information in this section should also be read in conjunction with the section below entitled "Special Note Regarding Forward-Looking Statements, Material Risks and Material Assumptions." The company's 2026 outlook is also based on certain assumptions described in the cross-referenced section, which the company believes are reasonable in the circumstances, and is subject to a number of risks, including those specifically identified in the cross-referenced section and those facing the company generally.Segment Name Changes As reflected in this earnings release, the company changed the names of its Tax & Accounting Professionals segment to Tax, Audit & Accounting Professionals and its Reuters News segment to Reuters to reflect the broader scope of the activities in each of the respective segments. These name changes did not change the segments' composition or the measurement of the segments' results as previously or currently reported.Dividends and Common Shares OutstandingThe company announced today that its Board of Directors approved a 10% or $0.24 per share annualized increase in the dividend to $2.62 per common share, representing the 33rd consecutive year of dividend increases and the fifth consecutive 10% increase. A quarterly dividend of $0.655 per share is payable on March 10, 2026 to common shareholders of record as of February 17, 2026.Thomson Reuters had approximately 445.0 million common shares outstanding as of February 3, 2026.$1.0 Billion Share Repurchase Program In August 2025, the company announced its plan to repurchase up to $1.0 billion of its common shares under a Normal Course Issuer Bid that was approved by the Toronto Stock Exchange (TSX). In late October 2025, the company completed the program by repurchasing 6.0 million of its common shares.Thomson Reuters
Thomson Reuters (TSX/Nasdaq: TRI) informs the way forward by bringing together the trusted content and technology that people and organizations need to make the right decisions. The company serves professionals across legal, tax, audit, accounting, compliance, government, and media. Its products combine highly specialized software and insights to empower professionals with the data, intelligence, and solutions needed to make informed decisions, and to help institutions in their pursuit of justice, truth and transparency. Reuters, part of Thomson Reuters, is a world leading provider of trusted journalism and news. For more information, visit tr.com.NON-IFRS FINANCIAL MEASURESThomson Reuters prepares its financial statements in accordance with International Financial Reporting Standards (IFRS), as issued by the International Accounting Standards Board (IASB). This news release includes certain non-IFRS financial measures, which include ratios that incorporate one or more non-IFRS financial measures, such as adjusted EBITDA (other than at the customer segment level) and the related margin, free cash flow, adjusted earnings and the effective tax rate on adjusted earnings, adjusted EPS, accrued capital expenditures expressed as a percentage of revenues, net debt and leverage ratio of net debt to adjusted EBITDA, selected measures excluding the impact of foreign currency, changes in revenues computed on an organic basis as well as all financial measures for the "Big 3" segments. The company modified its definition of net debt to account for interest rate swap arrangements entered into during the third quarter of 2025. The change did not have a material impact on its calculation of net debt.Thomson Reuters uses these non-IFRS financial measures as supplemental indicators of its operating performance and financial position as well as for internal planning purposes and the company's business outlook. Additionally, Thomson Reuters uses non-IFRS measures as the basis for management incentive programs. These measures do not have any standardized meanings prescribed by IFRS and therefore are unlikely to be comparable to the calculation of similar measures used by other companies and should not be viewed as alternatives to measures of financial performance calculated in accordance with IFRS. Non-IFRS financial measures are defined and reconciled to the most directly comparable IFRS measures in the appended tables. The company's outlook contains various non-IFRS financial measures. The company believes that providing reconciliations of forward-looking non-IFRS financial measures in its outlook would be potentially misleading and not practical due to the difficulty of projecting items that are not reflective of ongoing operations in any future period. The magnitude of these items may be significant. Consequently, for purposes of its outlook only, the company is unable to reconcile these non-IFRS measures to the most directly comparable IFRS measures because it cannot predict, with reasonable certainty, the impacts of changes in foreign exchange rates which impact (i) the translation of its results reported at average foreign currency rates for the year, and (ii) other finance income or expense related to intercompany financing arrangements. Additionally, the company cannot reasonably predict the occurrence or amount of other operating gains and losses that generally arise from business transactions that the company does not currently anticipate.ROUNDINGOther than EPS, the company reports its results in millions of U.S. dollars, but computes percentage changes and margins using whole dollars to be more precise. As a result, percentages and margins calculated from reported amounts may differ from those presented, and growth components may not total due to rounding. SPECIAL NOTE REGARDING FORWARD-LOOKING STATEMENTS, MATERIAL RISKS AND MATERIAL ASSUMPTIONSCertain statements in this news release, including, but not limited to, statements in Mr. Hasker's comments and the "2026 Outlook" section, are forward-looking. The words "will", "expect", "believe", "target", "estimate", "could", "should", "intend", "predict", "project" and similar expressions identify forward-looking statements. While the company believes that it has a reasonable basis for making forward-looking statements in this news release, they are not a guarantee of future performance or outcomes and there is no assurance that any of the other events described in any forward-looking statement will materialize. Forward-looking statements are subject to a number of risks, uncertainties and assumptions that could cause actual results or events to differ materially from current expectations. Many of these risks, uncertainties and assumptions are beyond the company's control and the effects of them can be difficult to predict.Some of the material risk factors that could cause actual results or events to differ materially from those expressed in or implied by forward-looking statements in this news release include, but are not limited to, those discussed on pages 16-27 in the "Risk Factors" section of the company's 2024 annual report. These and other risk factors are discussed in materials that Thomson Reuters from time-to-time files with, or furnishes to, the Canadian securities regulatory authorities and the U.S. Securities and Exchange Commission (SEC). Thomson Reuters' annual and quarterly reports are also available in the "Investor Relations" section of tr.com.The company's business 2026 outlook is based on information currently available to the company and is based on various external and internal assumptions made by the company in light of its experience and perception of historical trends, current conditions and expected future developments, as well as other factors that the company believes are appropriate under the circumstances. Material assumptions and material risks may cause actual performance to differ from the company's expectations underlying its business outlook. In particular, the global economy has experienced substantial disruption due to concerns regarding economic effects associated with the macroeconomic backdrop and ongoing geopolitical risks. The company's business outlook assumes that uncertain macroeconomic and geopolitical conditions will continue to disrupt the economy and cause periods of volatility, however, these conditions may last substantially longer than expected and any worsening of the global economic or business environment could impact the company's ability to achieve its outlook and affect its results and other expectations. Material assumptions related to the company's revenue outlook are that uncertain macroeconomic and geopolitical conditions will continue to disrupt the economy and cause periods of volatility; there will be a continued need for trusted products and services that help customers navigate evolving and complex legal, tax, audit, accounting, regulatory, geopolitical and commercial changes, developments and environments, and for cloud-based digital tools that drive productivity; Thomson Reuters will have a continued ability to deliver innovative products that meet evolving customer demands; the company will acquire new customers through expanded and improved digital platforms, simplification of the product portfolio and through other sales initiatives; and the company will improve customer retention through commercial simplification efforts and customer service improvements. Material assumptions related to the company's adjusted EBITDA margin outlook are its ability to achieve revenue growth targets; the company's business mix continues to shift to higher-growth product offerings; and integration expenses associated with recent acquisitions will reduce margins. Material assumptions related to the company's free cash flow outlook are its ability to achieve its revenue and adjusted EBITDA margin targets; and accrued capital expenditures approximate the percentage of revenues as set forth in the company's outlook. Material assumptions related to the company's effective tax rate on adjusted earnings outlook are its ability to achieve its adjusted EBITDA target; the mix of taxing jurisdictions where the company recognized pre-tax profit or losses in 2025 does not significantly change; no unexpected changes in tax laws or treaties within the jurisdictions where the company operates; no significant charges or benefits from the finalization of prior tax years; depreciation and amortization of internally developed software as set forth in the company's outlook; and net interest expense as set forth in the company's outlook. Material risks related to the company's revenue outlook are that ongoing geopolitical instability and uncertainty regarding interest rates and inflation, continue to impact the global economy. The severity and duration of any one, or a combination, of these conditions could impact the global economy and lead to lower demand for our products and services (beyond our assumption that these disruptions will cause periods of volatility); uncertainty in the legal regulatory regime relating to artificial intelligence (AI) has made it difficult for the company to predict the risks associated with the use of AI in its businesses and products. Future legislation may make it harder for the company to conduct its business using AI, lead to regulatory fines or penalties, require it to change its product offerings or business practices or prevent or limit its use of AI; demand for the company's products and services could be reduced by changes in customer buying patterns or in its inability to execute on key product design or customer support initiatives; competitive pricing actions and product innovation could impact the company's revenues; and the company's sales, commercial simplification and product initiatives may be insufficient to retain customers or generate new sales. Material risks related to the company's adjusted EBITDA margin outlook are the same as the risks above related to the revenue outlook; higher than expected inflation may lead to greater than anticipated increase in labor costs, third-party supplier costs and costs of print materials; and acquisition and disposal activity may dilute the company's adjusted EBITDA margin. Material risks related to the company's free cash flow outlook are the same as the risks above related to the revenue and adjusted EBITDA margin targets; a weaker macroeconomic environment could negatively impact working capital performance, including the ability of the company's customers to pay; capital expenditures may be higher than currently expected; and the timing and amount of tax payments to governments may differ from the company's expectations. Material risks related to the company's effective tax rate on adjusted earnings outlook are the same as the risks above related to adjusted EBITDA; a material change in the geographical mix of the company's pre-tax profits and losses; a material change in current tax laws or treaties to which the company is subject, and did not expect; resolution of tax audits may cause material changes to assessments of uncertain tax positions as compared to current estimates; and depreciation and amortization of internally developed software as well as net interest expense may be significantly higher or lower than expected. The company has provided an outlook for the purpose of presenting information about current expectations for the period presented. This information may not be appropriate for other purposes. You are cautioned not to place undue reliance on forward-looking statements which reflect expectations only as of the date of this news release. Except as may be required by applicable law, Thomson Reuters disclaims any obligation to update or revise any forward-looking statements. CONTACTS MEDIASamina AnsariDirector, Corporate Affairs+1 44 778 852 9542samina.ansari@tr.com INVESTORSGary Bisbee, CFAHead of Investor Relations+1 646 540 3249gary.bisbee@tr.comThomson Reuters will webcast a discussion of its fourth-quarter and full-year 2025 results and its 2026 business outlook today beginning at 8:30 a.m. Eastern Standard Time (EST). You can access the webcast by visiting ir.tr.com. An archive of the webcast will be available following the presentation. Thomson Reuters CorporationConsolidated Income Statement(millions of U.S. dollars, except per share data)(unaudited)
Three Months Ended
December 31,
Year Ended
December 31,
2025
2024
2025
2024CONTINUING OPERATIONS
Revenues$2,009
$1,909
$7,476
$7,258Operating expenses(1,231)
(1,183)
(4,578)
(4,471)Depreciation(28)
(26)
(111)
(113)Amortization of software(187)
(160)
(721)
(618)Amortization of other identifiable intangible assets(25)
(22)
(98)
(91)Other operating gains, net2
204
164
144Operating profit540
722
2,132
2,109Finance costs, net:
Net interest expense(40)
(28)
(143)
(125) Other finance (costs) income(4)
53
(55)
45Income before tax and equity method investments496
747
1,934
2,029Share of post-tax (losses) earnings in equity method investments(5)
(5)
(28)
40Tax (expense) benefit(158)
(135)
(423)
123Earnings from continuing operations333
607
1,483
2,192(Loss) earnings from discontinued operations, net of tax(1)
(20)
19
15Net earnings$332
$587
$1,502
$2,207Earnings (loss) attributable to:
Common shareholders$332
$587
$1,502
$2,210 Non-controlling interests-
-
-
(3)
Earnings per share:
Basic earnings (loss) per share:
From continuing operations$0.75
$1.35
$3.29
$4.86 From discontinued operations(0.01)
(0.05)
0.05
0.03Basic earnings per share$0.74
$1.30
$3.34
$4.89Diluted earnings (loss) per share:
From continuing operations$0.75
$1.34
$3.29
$4.85 From discontinued operations(0.01)
(0.04)
0.04
0.04Diluted earnings per share$0.74
$1.30
$3.33
$4.89
Basic weighted-average common shares445,215,119
450,077,127
448,971,715
450,609,712Diluted weighted-average common shares445,597,771
450,600,114
449,532,466
451,239,490 Thomson Reuters CorporationConsolidated Statement of Financial Position(millions of U.S. dollars)(unaudited)
December 31,
December 31,
2025
2024Assets
Cash and cash equivalents
$511
$1,968Trade and other receivables
1,143
1,087Other financial assets
94
35Prepaid expenses and other current assets
480
400Current assets
2,228
3,490
Property and equipment, net
361
386Software, net
1,645
1,453Other identifiable intangible assets, net
3,102
3,134Goodwill
7,913
7,262Equity method investments
202
269Other financial assets
466
442Other non-current assets
680
625Deferred tax
1,343
1,376Total assets
$17,940
$18,437
Liabilities and equity
Liabilities
Current indebtedness
$795
$973Payables, accruals and provisions
1,090
1,091Current tax liabilities
224
197Deferred revenue
1,251
1,062Other financial liabilities
108
113Current liabilities
3,468
3,436
Long-term indebtedness
1,328
1,847Provisions and other non-current liabilities
656
675Other financial liabilities
210
232Deferred tax
364
241Total liabilities
6,026
6,431
Equity
Capital
3,597
3,498Retained earnings
9,220
9,699Accumulated other comprehensive loss
(903)
(1,191)Total equity
11,914
12,006Total liabilities and equity
$17,940
$18,437 Thomson Reuters CorporationConsolidated Statement of Cash Flow(millions of U.S. dollars)(unaudited)
Three Months Ended
December 31,
Year Ended
December 31,
2025
2024
2025
2024Cash provided by (used in):
Operating activities
Earnings from continuing operations$333
$607
$1,483
$2,192Adjustments for:
Depreciation28
26
111
113 Amortization of software187
160
721
618 Amortization of other identifiable intangible assets25
22
98
91 Share of post-tax losses (earnings) in equity method investments5
5
28
(40) Net gains on disposals of businesses and investments(1)
(195)
(165)
(192) Deferred tax9
47
60
(640) Other49
(22)
272
151Changes in working capital and other items122
(76)
43
176Operating cash flows from continuing operations757
574
2,651
2,469Operating cash flows from discontinued operations(1)
(10)
-
(12)Net cash provided by operating activities756
564
2,651
2,457Investing activities
Acquisitions, net of cash acquired(20)
(130)
(843)
(622)Proceeds related to disposals of businesses and investments2
297
254
326Proceeds from sales of LSEG shares-
-
-
1,854Capital expenditures(158)
(161)
(634)
(607)Other investing activities-
40
1
46Taxes paid on sales of LSEG shares and disposals(29)
(115)
(62)
(317)Net cash (used in) provided by investing activities(205)
(69)
(1,284)
680Financing activities
Repayments of debt-
-
(999)
(290)Net (repayments) borrowings under short-term loan facilities(49)
-
290
(139)Payments of lease principal(16)
(17)
(64)
(63)Repurchases of common shares(330)
-
(1,000)
(639)Dividends paid on preference shares(1)
(1)
(4)
(5)Dividends paid on common shares(256)
(236)
(1,035)
(944)Purchase of non-controlling interests-
-
-
(384)Other financing activities(6)
2
(16)
5Net cash used in financing activities(658)
(252)
(2,828)
(2,459)Translation adjustments-
(6)
4
(8)(Decrease) increase in cash and cash equivalents(107)
237
(1,457)
670Cash and cash equivalents at beginning of period618
1,731
1,968
1,298Cash and cash equivalents at end of period$511
$1,968
$511
$1,968 Thomson Reuters CorporationReconciliation of Earnings from Continuing Operations to Adjusted EBITDA(1)(millions of U.S. dollars)(unaudited)
Three months ended
December 31,
Year ended
December 31,
20252024
20252024Earnings from continuing operations$333$607
$1,483$2,192Adjustments to remove:
Tax expense (benefit)158135
423(123) Other finance costs (income)4(53)
55(45) Net interest expense4028
143125 Amortization of other identifiable intangible assets2522
9891 Amortization of software187160
721618 Depreciation2826
111113EBITDA$775$925
$3,034$2,971Adjustments to remove:
Share of post-tax losses (earnings) in equity method investments55
28(40) Other operating gains, net(2)(204)
(164)(144) Fair value adjustments*(1)(8)
38(8)Adjusted EBITDA(1)$777$718
$2,936$2,779Adjusted EBITDA margin(1)38.7 %37.6 %
39.2 %38.2 %
* Fair value adjustments primarily represent gains or losses due to changes in foreign currency exchange rates on intercompany balances that arise in the ordinary course of business, which are a component of operating expenses, as well as adjustments related to acquired deferred revenue. Thomson Reuters CorporationReconciliation of Net Cash Provided By Operating Activities to Free Cash Flow(1)(millions of U.S. dollars)(unaudited)
Three months ended
December 31,
Year ended
December 31,
20252024
20252024Net cash provided by operating activities$756$564
$2,651$2,457Capital expenditures(158)(161)
(634)(607)Other investing activities-40
146Payments of lease principal(16)(17)
(64)(63)Dividends paid on preference shares(1)(1)
(4)(5)Free cash flow(1)$581$425
$1,950$1,828 Thomson Reuters CorporationReconciliation of Capital Expenditures to Accrued Capital Expenditures(1)(millions of U.S. dollars)(unaudited)
Year ended
December 31,
2025Capital expenditures
$634Remove: IFRS adjustment to cash basis
(18)Accrued capital expenditures(1)
$616Accrued capital expenditures as a percentage of revenues(1)
8.2 %
(1) Refer to page 21 for additional information on non-IFRS financial measures. Thomson Reuters CorporationReconciliation of Net Earnings to Adjusted Earnings(1)Reconciliation of Total Change in Adjusted EPS to Change in Constant Currency(1)(millions of U.S. dollars, except for share and per share data)(unaudited)
Three months ended
December 31,
Year ended
December 31,
20252024
20252024Net earnings$332$587
$1,502$2,207Adjustments to remove:
Fair value adjustments*(1)(8)
38(8) Amortization of acquired software5338
206147 Amortization of other identifiable intangible assets2522
9891 Other operating gains, net(2)(204)
(164)(144) Other finance costs (income)4(53)
55(45) Share of post-tax losses (earnings) in equity method investments55
28(40) Tax on above items(1)(5)36
(35)(9) Tax items impacting comparability(1)665
57(478) Loss (earnings) from discontinued operations, net of tax120
(19)(15)Interim period effective tax rate normalization(1)27
--Dividends declared on preference shares(1)(1)
(4)(5)Adjusted earnings(1)(2)$479$454
$1,762$1,701Adjusted EPS(1)(2)$1.07$1.01
$3.92$3.77Total change6 %
4 %
Foreign currency-1 %
0 %
Constant currency7 %
4 %
Diluted weighted-average common shares (millions)445.6450.6
449.5451.2 Reconciliation of Effective Tax Rate on Adjusted Earnings(1)
Year ended
December 31,
2025Adjusted earnings
$1,762Plus: Dividends declared on preference shares
4Plus: Tax expense on adjusted earnings
401Pre-tax adjusted earnings
$2,167
IFRS tax expense
$423Remove tax related to:
Amortization of acquired software
46 Amortization of other identifiable intangible assets
23 Share of post-tax losses in equity method investments
2 Other finance costs
2 Other operating gains, net
(43) Other items
5Subtotal - Remove tax benefit on pre-tax items removed from adjusted earnings
35Remove: Tax items impacting comparability
(57)Total - Remove all items impacting comparability
(22)Tax expense on adjusted earnings
$401Effective tax rate on adjusted earnings
18.5 %
*Fair value adjustments primarily represent gains or losses due to changes in foreign currency exchange rates on intercompany balances that arise in the ordinary course of business, which are a component of operating expenses, as well as adjustments related to acquired deferred revenue.
(1)Refer to page 21 for additional information on non-IFRS financial measures.(2)The adjusted earnings impact of non-controlling interests, which was applicable to the year-ended December 31, 2024, was not material. Thomson Reuters CorporationReconciliation of Changes in Revenues to Changes in Revenues on a Constant Currency(1) and Organic Basis(1)(millions of U.S. dollars)(unaudited)
Three months ended
December 31,Change
2025
2024
TotalForeign
Currency
SUBTOTAL
Constant
CurrencyNet
Acquisitions/
(Disposals)
OrganicTotal Revenues
Legal Professionals
$738
$729
1 %
0 %
1 %
-8 %
9 %Corporates
496
458
8 %
1 %
7 %
-2 %
9 %Tax, Audit & Accounting Professionals
414
366
13 %
0 %
13 %
2 %
11 %"Big 3" Segments Combined(1)
1,648
1,553
6 %
1 %
5 %
-4 %
9 %Reuters
232
218
7 %
1 %
6 %
1 %
5 %Global Print
136
144
-6 %
0 %
-6 %
0 %
-6 %Eliminations/Rounding
(7)
(6)
Total Revenues
$2,009
$1,909
5 %
1 %
5 %
-3 %
7 %
Recurring Revenues
Legal Professionals
$716
$707
1 %
0 %
1 %
-7 %
8 %Corporates
434
401
8 %
1 %
7 %
-2 %
9 %Tax, Audit & Accounting Professionals
357
319
12 %
0 %
12 %
0 %
12 %"Big 3" Segments Combined(1)
1,507
1,427
6 %
1 %
5 %
-4 %
9 %Reuters
183
173
6 %
1 %
5 %
1 %
4 %Eliminations/Rounding
(7)
(6)
Total Recurring Revenues
$1,683
$1,594
6 %
1 %
5 %
-4 %
9 %
Transactions Revenues
Legal Professionals
$22
$22
0 %
-1 %
0 %
-28 %
28 %Corporates
62
57
9 %
2 %
7 %
0 %
7 %Tax, Audit & Accounting Professionals
57
47
20 %
1 %
19 %
16 %
3 %"Big 3" Segments Combined(1)
141
126
11 %
1 %
10 %
2 %
8 %Reuters
49
45
10 %
1 %
9 %
2 %
8 %Total Transactions Revenues
$190
$171
11 %
1 %
10 %
2 %
8 %
Growth percentages are computed using whole dollars. As a result, percentages calculated from reported amounts may differ from those presented, and growth components may not total due to rounding.
(1)Refer to page 21 for additional information on non-IFRS financial measures. Thomson Reuters CorporationReconciliation of Changes in Revenues to Changes in Revenues on a Constant Currency(1) and Organic Basis(1)(millions of U.S. dollars)(unaudited)
Year ended
December 31,Change
2025
2024
TotalForeign
Currency
SUBTOTAL
Constant
CurrencyNet
Acquisitions/
(Disposals)
OrganicTotal Revenues
Legal Professionals
$2,868
$2,922
-2 %
0 %
-2 %
-10 %
8 %Corporates
1,987
1,844
8 %
0 %
7 %
-1 %
9 %Tax, Audit & Accounting Professionals
1,302
1,165
12 %
-1 %
13 %
3 %
11 %"Big 3" Segments Combined(1)
6,157
5,931
4 %
0 %
4 %
-5 %
9 %Reuters
853
832
3 %
1 %
2 %
1 %
1 %Global Print
490
519
-6 %
0 %
-5 %
0 %
-5 %Eliminations/Rounding
(24)
(24)
Total Revenues
$7,476
$7,258
3 %
0 %
3 %
-4 %
7 %
Recurring Revenues
Legal Professionals
$2,789
$2,828
-1 %
0 %
-1 %
-10 %
9 %Corporates
1,670
1,543
8 %
0 %
8 %
-2 %
9 %Tax, Audit & Accounting Professionals
937
867
8 %
-2 %
10 %
0 %
10 %"Big 3" Segments Combined(1)
5,396
5,238
3 %
0 %
3 %
-6 %
9 %Reuters
712
668
7 %
1 %
6 %
1 %
5 %Eliminations/Rounding
(24)
(24)
Total Recurring Revenues
$6,084
$5,882
3 %
0 %
3 %
-5 %
9 %
Transactions Revenues
Legal Professionals
$79
$94
-16 %
1 %
-17 %
-21 %
4 %Corporates
317
301
5 %
0 %
5 %
0 %
5 %Tax, Audit & Accounting Professionals
365
298
22 %
0 %
23 %
10 %
12 %"Big 3" Segments Combined(1)
761
693
10 %
0 %
10 %
1 %
9 %Reuters
141
164
-14 %
1 %
-15 %
0 %
-16 %Total Transactions Revenues
$902
$857
5 %
0 %
5 %
1 %
4 %
Growth percentages are computed using whole dollars. As a result, percentages calculated from reported amounts may differ from those presented, and growth components may not total due to rounding.
(1)Refer to page 21 for additional information on non-IFRS financial measures. Thomson Reuters CorporationReconciliation of Changes in Adjusted EBITDA (1) and Related Margin(1) to Changes on a Constant Currency Basis(1)(millions of U.S. dollars)(unaudited)
Three months ended
December 31,Change
2025
2024
TotalForeign
Currency
Constant
CurrencyAdjusted EBITDA(1)
Legal Professionals
$327
$299
9 %
0 %
9 %Corporates
160
153
4 %
0 %
4 %Tax, Audit & Accounting Professionals
222
196
14 %
1 %
13 %"Big 3" Segments Combined(1)
709
648
9 %
0 %
9 %Reuters
48
45
7 %
-5 %
12 %Global Print
54
55
-2 %
0 %
-2 %Corporate costs
(34)
(30)
n/a
n/a
n/aTotal Adjusted EBITDA
$777
$718
8 %
0 %
8 %
Adjusted EBITDA Margin(1)
Legal Professionals
44.3 %
41.0 %
330bp
-20bp
350bpCorporates
32.2 %
33.5 %
-130bp
-60bp
-70bpTax, Audit & Accounting Professionals
53.6 %
53.4 %
20bp
20bp
0bp"Big 3" Segments Combined(1)
43.0 %
41.7 %
130bp
-20bp
150bpReuters
21.0 %
20.8 %
20bp
-120bp
140bpGlobal Print
39.6 %
38.2 %
140bp
-20bp
160bpTotal Adjusted EBITDA Margin
38.7 %
37.6 %
110bp
-30bp
140bp Thomson Reuters CorporationReconciliation of Changes in Adjusted EBITDA (1) and Related Margin(1) to Changes on a Constant Currency Basis(1)(millions of U.S. dollars)(unaudited)
Year ended
December 31,Change
2025
2024
TotalForeign
Currency
Constant
CurrencyAdjusted EBITDA(1)
Legal Professionals
$1,356
$1,302
4 %
1 %
3 %Corporates
716
671
7 %
0 %
6 %Tax, Audit & Accounting Professionals
623
527
18 %
0 %
19 %"Big 3" Segments Combined(1)
2,695
2,500
8 %
0 %
7 %Reuters
174
196
-11 %
-1 %
-11 %Global Print
185
188
-2 %
1 %
-2 %Corporate costs
(118)
(105)
n/a
n/a
n/aTotal Adjusted EBITDA
$2,936
$2,779
6 %
0 %
5 %
Adjusted EBITDA Margin(1)
Legal Professionals
47.3 %
44.6 %
270bp
20bp
250bpCorporates
36.0 %
36.3 %
-30bp
0bp
-30bpTax, Audit & Accounting Professionals
47.1 %
45.2 %
190bp
40bp
150bp"Big 3" Segments Combined(1)
43.6 %
42.1 %
150bp
20bp
130bpReuters
20.4 %
23.6 %
-320bp
-30bp
-290bpGlobal Print
37.7 %
36.2 %
150bp
30bp
120bpTotal Adjusted EBITDA Margin
39.2 %
38.2 %
100bp
20bp
80bp
n/a: not applicableGrowth percentages and margins are computed using whole dollars. As a result, percentages and margins calculated from reported amounts may differ from those presented, and growth components may not total due to rounding.(1)Refer to page 21 for additional information on non-IFRS financial measures.Reconciliation of adjusted EBITDA margin(1)To compute segment and consolidated adjusted EBITDA margin, the company excludes fair value adjustments related to acquired deferred revenue from its IFRS revenues. The charts below reconcile IFRS revenues to revenues used in the calculation of adjusted EBITDA margin, which excludes fair value adjustments related to acquired deferred revenue.
Three months ended December 31, 2025(millions of U.S. dollars)
(unaudited)IFRS
revenues
Remove fair
value
adjustments
to acquired
deferred
revenue
Revenues
excluding
fair value
adjustments
to acquired
deferred
revenue
Adjusted
EBITDA
Adjusted
EBITDA
MarginLegal Professionals$738
-
$738
$327
44.3 %Corporates496
-
496
160
32.2 %Tax, Audit & Accounting Professionals414
-
414
222
53.6 %"Big 3" Segments Combined(1)1,648
-
1,648
709
43.0 %Reuters232
-
232
48
21.0 %Global Print136
-
136
54
39.6 %Eliminations/Rounding(7)
-
(7)
-
n/aCorporate costs-
-
-
(34)
n/aConsolidated totals$2,009
-
$2,009
$777
38.7 %
Year ended December 31, 2025(millions of U.S. dollars)
(unaudited)IFRS
revenues
Remove fair
value
adjustments
to acquired
deferred
revenue
Revenues
excluding
fair value
adjustments
to acquired
deferred
revenue
Adjusted
EBITDA
Adjusted
EBITDA
MarginLegal Professionals$2,868
-
$2,868
$1,356
47.3 %Corporates1,987
-
1,987
716
36.0 %Tax, Audit & Accounting Professionals1,302
$20
1,322
623
47.1 %"Big 3" Segments Combined(1)6,157
20
6,177
2,695
43.6 %Reuters853
-
853
174
20.4 %Global Print490
-
490
185
37.7 %Eliminations/Rounding(24)
-
(24)
-
n/aCorporate costs-
-
-
(118)
n/aConsolidated totals$7,476
$20
$7,496
$2,936
39.2 %
Three months ended December 31, 2024(millions of U.S. dollars)
(unaudited)IFRS
revenues
Remove fair
value
adjustments
to acquired
deferred
revenue
Revenues
excluding
fair value
adjustments
to acquired
deferred
revenue
Adjusted
EBITDA
Adjusted
EBITDA
MarginLegal Professionals$729
-
$729
$299
41.0 %Corporates458
$1
459
153
33.5 %Tax, Audit & Accounting Professionals366
-
366
196
53.4 %"Big 3" Segments Combined(1)1,553
1
1,554
648
41.7 %Reuters218
-
218
45
20.8 %Global Print144
-
144
55
38.2 %Eliminations/Rounding(6)
-
(6)
-
n/aCorporate costs-
-
-
(30)
n/aConsolidated totals$1,909
$1
$1,910
$718
37.6 %
n/a: not applicableMargins are computed using whole dollars, as a result, margins calculated from reported amounts may differ from those presented due to rounding.(1)Refer to page 21 for additional information on non-IFRS financial measures. Reconciliation of adjusted EBITDA margin(1)
Year ended December 31, 2024(millions of U.S. dollars)
(unaudited)IFRS
revenues
Remove fair
value
adjustments
to acquired
deferred
revenue
Revenues
excluding
fair value
adjustments
to acquired
deferred
revenue
Adjusted
EBITDA
Adjusted
EBITDA
MarginLegal Professionals$2,922
$1
$2,923
$1,302
44.6 %Corporates1,844
6
1,850
671
36.3 %Tax, Audit & Accounting Professionals1,165
-
1,165
527
45.2 %"Big 3" Segments Combined(1)5,931
7
5,938
2,500
42.1 %Reuters832
2
834
196
23.6 %Global Print519
-
519
188
36.2 %Eliminations/Rounding(24)
-
(24)
-
n/aCorporate costs-
-
-
(105)
n/aConsolidated totals$7,258
$9
$7,267
$2,779
38.2 %
n/a: not applicable
Margins are computed using whole dollars, as a result, margins calculated from reported amounts may differ from those presented due to rounding. Thomson Reuters CorporationReconciliation of Net Debt(1) and Leverage Ratio of Net Debt to Adjusted EBITDA(1)(millions of U.S. dollars)(unaudited)
December 31,
December 31,
2025
2024Current indebtedness
$795
$973Long-term indebtedness
1,328
1,847Total debt
2,123
2,820Swaps
16
21Total debt after swaps
2,139
2,841Remove fair value adjustments for hedges
(2)
5Total debt after hedging arrangements
2,137
2,846Collateral assets
(7)
-Remove transaction costs, premiums or discounts, included in the carrying value of debt28
22Add: Lease liabilities (current and non-current)
249
256Less: Cash and cash equivalents
(511)
(1,968)Net debt
$1,896
$1,156Leverage ratio of net debt to adjusted EBITDA
Adjusted EBITDA
$2,936
$2,779Net debt/adjusted EBITDA
0.6:1
0.4:1
(1)Refer to page 21 for additional information on non-IFRS financial measures. Non-IFRS
Financial
MeasuresDefinitionWhy Useful to the Company and InvestorsAdjusted EBITDA and the related marginRepresents earnings or losses from continuing operations before tax expense or benefit, net interest expense, other finance costs or income, depreciation, amortization of software and other identifiable intangible assets, Thomson Reuters share of post-tax earnings or losses in equity method investments, other operating gains and losses, certain asset impairment charges and fair value adjustments, including those related to acquired deferred revenue. The related margin is adjusted EBITDA expressed as a percentage of revenues. For purposes of this calculation, revenues are before fair value adjustments to acquired deferred revenue.Provides a consistent basis to evaluate operating profitability and performance trends by excluding items that the company does not consider to be controllable activities for this purpose. Also, represents a measure commonly reported and widely used by investors as a valuation metric, as well as to assess the company's ability to incur and service debt.Adjusted earnings and adjusted EPS Net earnings or loss including dividends declared on preference shares but excluding the post-tax impacts of fair value adjustments, including those related to acquired deferred revenue, amortization of acquired intangible assets (attributable to other identifiable intangible assets and acquired software), other operating gains and losses, certain asset impairment charges, other finance costs or income, Thomson Reuters share of post-tax earnings or losses in equity method investments, discontinued operations and other items affecting comparability. Acquired intangible assets contribute to the generation of revenues from acquired companies, which are included in the company's computation of adjusted earnings. The post-tax amount of each item is excluded from adjusted earnings based on the specific tax rules and tax rates associated with the nature and jurisdiction of each item. Adjusted EPS is calculated from adjusted earnings using diluted weighted-average shares and does not represent actual earnings or loss per share attributable to shareholders. Provides a more comparable basis to analyze earnings. These measures are commonly used by shareholders to measure performance. Effective tax rate on adjusted earningsAdjusted tax expense divided by pre-tax adjusted earnings. Adjusted tax expense is computed as income tax expense or benefit plus or minus the income tax impacts of all items impacting adjusted earnings (as described above), and other tax items impacting comparability. In interim periods, the company also makes an adjustment to reflect income taxes based on the estimated full-year effective tax rate. Earnings or losses for interim periods under IFRS reflect income taxes based on the estimated effective tax rates of each of the jurisdictions in which Thomson Reuters operates. The non-IFRS adjustment reallocates estimated full-year income taxes between interim periods but has no effect on full-year income taxes. Provides a basis to analyze the effective tax rate associated with adjusted earnings. The company's effective tax rate computed in accordance with IFRS may be more volatile by quarter because the geographical mix of pre-tax profits and losses in interim periods may be different from that for the full year. Therefore, the company believes that using the expected full-year effective tax rate provides more comparability among interim periods. Free cash flowNet cash provided by operating activities and other investing activities, less capital expenditures, payments of lease principal and dividends paid on the company's preference shares. Helps assess the company's ability, over the long term, to create value for its shareholders as it represents cash available to repay debt, pay common dividends, fund share repurchases and acquisitions.Changes before the impact of foreign currency or at constant currencyThe changes in revenues, adjusted EBITDA and the related margin, and adjusted EPS before currency (at constant currency or excluding the effects of currency) are determined by converting the current and equivalent prior period's local currency results using the same foreign currency exchange rate.Provides better comparability of business trends from period to period.Changes in revenues computed on an organic basisRepresent changes in revenues of the company's existing businesses at constant currency. The metric excludes the distortive impacts of acquisitions and dispositions from not owning the business in both comparable periods. Provides further insight into the performance of the company's existing businesses by excluding distortive impacts and serves as a better measure of the company's ability to grow its business over the long term.Accrued capital expenditures as a percentage of revenuesAccrued capital expenditures divided by revenues, where accrued capital expenditures include amounts that remain unpaid at the end of the reporting period. For purposes of this calculation, revenues are before fair value adjustments to acquired deferred revenue.Reflects the basis on which the company manages capital expenditures for internal planning purposes. "Big 3" segments The company's combined Legal Professionals, Corporates and Tax, Audit & Accounting Professionals segments. All measures reported for the "Big 3" segments are non-IFRS financial measures.The "Big 3" segments comprised approximately 80% of revenues and represent the core of the company's business information service product offerings. Net debt and leverage ratio of net debt to adjusted EBITDANet debt is total debt, plus related hedging instruments and collateral balances, along with lease liabilities, excluding unamortized transaction costs and any premiums or discounts on debt, minus cash and cash equivalents. We exclude specific hedging components to reflect the net cash outflow upon debt maturity. Net debt to adjusted EBITDA is net debt divided by adjusted EBITDA for the previous twelve-month period ending with the current fiscal quarter. Provides a commonly used measure of a company's leverage and its ability to pay its debt. Given that the company hedges some of its debt to manage risk, the company includes hedging instruments as it believes it provides a better measure of the total obligation associated with its outstanding debt. Since the company plans to hold its debt and related hedges until maturity, the net debt calculation is adjusted to reflect the net cash outflow at maturity, after deducting cash and cash equivalents. The company's non-IFRS measure is aligned with the calculation of its internal target leverage ratio and is more conservative than the maximum ratio allowed under the contractual covenants in its credit facility.
Please refer to reconciliations for the most directly comparable IFRS financial measures.
View original content to download multimedia:https://www.prnewswire.com/news-releases/thomson-reuters-reports-fourth-quarter-and-full-year-2025-results-302680103.htmlSOURCE Thomson Reuters
Original: Thomson Reuters Reports Fourth-Quarter and Full-Year 2025 Results
 Hot Features

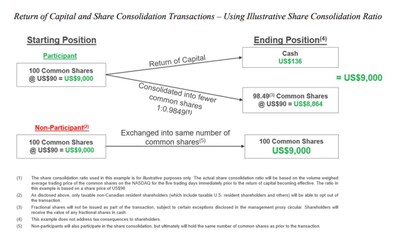
 US Market News
4月前
US Market News
4月前
 iHub News
5月前
iHub News
5月前
 nowwhat2
9月前
nowwhat2
9月前
 Monksdream
1年前
Monksdream
1年前
 BottomBounce
1年前
BottomBounce
1年前
 tw0122
7年前
tw0122
7年前

 メールアドレスで登録


