 US Market News
2週前
US Market News
2週前
REMAX MAY 2026 NATIONAL HOUSING REPORTJune 17, 2026 8:00 AM
PR Newswire (US) Home Sales Rose for Fourth Straight Month as New Listings SlowDENVER, June 17, 2026 /PRNewswire/ -- U.S. home sales rose for the fourth consecutive month in May, increasing 7.9% from April, yet remained slightly below last year's level. Sales dipped 0.5% year over year, reflecting ongoing supply constraints as the number of new listings continued to slow. Across the 51 metro areas surveyed, overall inventory increased 8.4% from April and 2.0% from May 2025. The annual gain marks the 29th consecutive month of year-over-year inventory growth dating back to January 2024. However, growth has moderated in recent months, with single-digit increases replacing the double-digit gains seen throughout 2025.New listings declined 3.3% from April and fell 8.4% year over year, extending a seven-month streak of annual decreases dating to November 2025. The pullback in new listings is contributing to the slower pace of overall inventory expansion.The median sales price in May rose 1.1%, or $5,000 from April, to $450,000, up 1.4% or $6,000 from one year ago."The housing market was finding its footing this spring, with steady month-over-month sales gains showing that buyers are still engaged," said Chris Lim, REMAX President and Chief Growth Officer. "At the same time, the slowdown in new listings limited inventory growth. That's keeping conditions competitive in many markets, even as price growth remains relatively moderate. For buyers and sellers alike, this is a market where timing and expert guidance matter more than ever."Other metrics of note:Days on market: Homes sold in an average of 42 days, three days fewer than in April but two days longer than one year ago.Months' supply of inventory: 2.5 months, up from 2.3 in April and unchanged from May 2025.Close-to-list price ratio: 99%, unchanged from both last month and one year ago.Highlights and local market results for May include:New Listings
In the 51 metro areas surveyed in May 2026, the number of newly listed homes was down an average of 8.4% compared to May 2025 and down 3.3% compared to April 2026. The markets with the biggest decrease and increase in year-over-year new listings percentage were:New Listings:
5 Markets with the Biggest YoY DecreaseMarketMay 2026May 2025Year-over-Year % ChangeDover, DE274452-39.4 %Washington, DC9,82614,531-32.4 %Baltimore, MD4,3606,412-32.0 %Trenton, NJ523744-29.7 %Philadelphia, PA8,46911,876-28.7 %New Listings:
5 Markets with the Biggest YoY IncreaseMarketMay 2026May 2025Year-over-Year % ChangeMinneapolis, MN7,9267,073+12.1 %Cincinnati, OH3,5923,302+8.8 %Chicago, IL15,47514,847+4.2 %Richmond, VA2,3502,267+3.7 %Anchorage, AK764739+3.4 %Closed Transactions
Of the 51 metro areas surveyed in May 2026, the overall number of home sales was down an average of 0.5% compared to May 2025 and up 7.9% compared to April 2026. The markets with the biggest decrease and increase in year-over-year sales percentage were:Closed Transactions:
5 Markets with the Biggest YoY DecreaseMarketMay 2026May 2025Year-over-Year % ChangeProvidence, RI1,0321,203-14.2 %Hartford, CT9011,023-11.9 %New York, NY8,1338,963-9.3 %Houston, TX8,0398,777-8.4 %Burlington, VT202218-7.3 %Closed Transactions:
5 Markets with the Biggest YoY IncreaseMarketMay 2026May 2025Year-over-Year % ChangeManchester, NH416352+18.2 %Omaha, NE1,3301,223+8.7 %Washington, DC7,0476,505+8.3 %Miami, FL6,6376,160+7.7 %New Orleans, LA1,1061,033+7.1 %Median Sales Price – Median of 51 metro area prices
In May 2026, the median of all 51 metro area sales prices was $450,000, up 1.4% from May 2025 and up 1.1% compared to April 2026. The markets with the biggest increase and decrease in year-over-year median sales price were:Median Sales Price:
5 Markets with the Biggest YoY IncreaseMarketMay 2026May 2025Year-over-Year % ChangeDover, DE$367,450$339,950+8.1 %St. Louis, MO$307,250$288,250+6.6 %Hartford, CT$410,000$385,000+6.5 %Omaha, NE$340,000$320,000+6.3 %Manchester, NH$520,000$490,000+6.1 %Median Sales Price:
5 Markets with the Biggest YoY DecreaseMarketMay 2026May 2025Year-over-Year % ChangeOrlando, FL$405,000$414,990-2.4 %Honolulu, HI$740,000$750,000-1.3 %Boston, MA$730,000$739,785-1.3 %San Antonio, TX$310,950$315,000-1.3 %Fayetteville, AR$370,000$374,650-1.2 %Close-to-List Price Ratio – Average of 51 metro area prices
In May 2026, the average close-to-list price ratio of all 51 metro areas in the report was 99%, the same as May 2025 and April 2026. The close-to-list price ratio is calculated by the average value of the sales price divided by the list price for each transaction. When the number is above 100%, the home closed for more than the list price. If it's less than 100%, the home sold for less than the list price. The metro areas with the highest and lowest close-to-list price ratios were:Close-to-List Price Ratio:
5 Markets with the Highest Close-to-List Price RatioMarketMay 2026May 2025Year-over-Year Difference*San Francisco, CA107.0 %103.7 %+3.3 ppHartford, CT104.9 %104.9 %+0.0 ppRichmond, VA102.2 %101.3 %+0.8 ppManchester, NH101.7 %102.3 %-0.6 ppNew York, NY101.7 %101.6 %+0.1 pp*Difference displayed as change in percentage pointsClose-to-List Price Ratio:
5 Markets with the Lowest Close-to-List Price RatioMarketMay 2026May 2025Year-over-Year Difference*Miami, FL94.1 %93.0 %+1.1 ppBozeman, MT96.3 %95.8 %+0.6 ppTampa, FL96.7 %96.7 %0.0 ppNew Orleans, LA96.8 %96.5 %+0.3 ppHouston, TX97.0 %97.4 %-0.4 pp*Difference displayed as change in percentage pointsDays on Market – Average of 51 metro areas
The average days on market for homes sold in May 2026 was 42, up two days compared to the average in May 2025 (40 days) and down three days compared to April 2026 (45 days). Days on market is the number of days between when a home is first listed in an MLS, and a sales contract is signed. The metro areas with the highest and lowest days on market averages were:Days on Market:
5 Markets with the Highest Days on MarketMarketMay 2026May 2025Year-over-Year % ChangeSan Antonio, TX8376+8.6 %Miami, FL7874+5.1 %Phoenix, AZ7168+4.5 %Tampa, FL7060+15.8 %Orlando, FL6365-2.5 %Days on Market:
5 Markets with the Lowest Days on MarketMarketMay 2026May 2025Year-over-Year % ChangeManchester, NH1513+11.2 %Hartford, CT1719-7.6 %Omaha, NE2123-8.7 %Cincinnati, OH2228-20.4 %Anchorage, AK2320+14.3 %Months' Supply of Inventory – Average of 51 metro areas
The number of homes for sale in May 2026 was up 2.0% from May 2025 and up 8.4% from April 2026. Based on the rate of home sales in May 2026, the months' supply of inventory was 2.5, the same as May 2025 and up from 2.3 in April 2026. The markets with the highest and lowest months' supply of inventory were:Months' Supply of Inventory:
5 Markets with the Highest Months' Supply of InventoryMarketMay 2026May 2025Year-over-Year % ChangeMiami, FL5.47.0-22.4 %New Orleans, LA4.93.6+35.2 %San Antonio, TX4.95.4-10.0 %Houston, TX4.34.1+5.1 %Bozeman, MT4.24.2+1.8 %Months' Supply of Inventory:
5 Markets with the Lowest Months' Supply of InventoryMarketMay 2026May 2025Year-over-Year % ChangeHartford, CT0.80.9-11.7 %Manchester, NH1.01.0+7.4 %Albuquerque, NM1.11.2-10.4 %Cleveland, OH1.31.3-3.2 %Anchorage, AK1.31.5-17.8 %About the REMAX Network
As one of the leading global real estate franchisors, RE/MAX, LLC is a subsidiary of RE/MAX Holdings (NYSE: RMAX) with more than 145,000 agents in nearly 8,500 offices and a presence in more than 120 countries and territories. Nobody in the world sells more real estate than REMAX, as measured by residential transaction sides. REMAX was founded in 1973 by Dave and Gail Liniger, with an innovative, entrepreneurial culture affording its agents and franchisees the flexibility to operate their businesses with great independence. REMAX agents have lived, worked and served in their local communities for decades, raising millions of dollars every year for Children's Miracle Network Hospitals® and other charities. To learn more about REMAX, to search home listings or find an agent in your community, please visit www.remax.com. For the latest news about REMAX, please visit news.remax.com.Report Details
The REMAX National Housing Report is distributed mid-month. The Report is based on MLS data for the stated month in 51 metropolitan areas, includes single-family residential property types, and is not annualized. For maximum representation, most of the largest metro areas in the country are represented, and an attempt is made to include at least one metro area in almost every state. Metro areas are defined by the Core Based Statistical Areas (CBSAs) established by the U.S. Office of Management and Budget.Definitions
Closed Transactions are the total number of closed residential transactions during the given month. Months' Supply of Inventory is the total number of residential properties listed for sale at the end of the month (current inventory) divided by the number of sales contracts signed (pending listings) during the month. Where "pending" data is unavailable, an inferred pending status is calculated using closed transactions. Days on Market is the average number of days that pass from the time a property is listed until the property goes under contract. Median Sales Price for a metro area is the median sales price for closed transactions in that metro area. The nationwide Median Sales Price is calculated at the nationwide aggregate level using all sale prices from the included metro areas. The Close-to-List Price Ratio is the average value of the sales price divided by the list price for each closed transaction.MLS data is provided by Constellation. While MLS data is believed to be reliable, it cannot be guaranteed. MLS data is constantly being updated, making any analysis a snapshot at a particular time. Every month, the previous period's data is updated to ensure accuracy over time. Raw data remains the intellectual property of each local MLS organization. View original content to download multimedia:https://www.prnewswire.com/news-releases/remax-may-2026-national-housing-report-302802728.htmlSOURCE RE/MAX, LLC Original: REMAX MAY 2026 NATIONAL HOUSING REPORT
US Market News
1月前
REMAX APRIL 2026 NATIONAL HOUSING REPORTMay 19, 2026 4:38 PM
PR Newswire (US) New listings outpaced home sales in April as inventory increasedDENVER , May 19, 2026 /PRNewswire/ -- Home sales increased in April, but the number of new listings outpaced demand, creating more available inventory and continuing a shift toward a more balanced housing market. Typical for the spring selling season, April home sales grew 7.6% over March, while new listings increased 10.5% during the month. Across the 51 metro areas surveyed, year-over-year activity was largely unchanged, with sales up just 0.1% and new listings down 1.3%.The number of homes for sale grew 4.5% over March 2026 and 2.0% year over year. The median sales price increased 1.5% to $445,000 – the 34th consecutive month of year-over-year price appreciation."April's housing data shows a market that's continuing to find its balance," said REMAX® President and Chief Growth Officer Chris Lim. "More homes came onto the market faster than buyers were purchasing, which means buyers had more choices than they've had in a while. At the same time, prices were stable. Overall, it's a steadier, less competitive environment than we've seen recently, and that's giving both buyers and sellers a better chance to make confident decisions."Baltimore, Maryland, ranked among the top five metro areas for the largest year-over-year decline in new listings, down 23.4%. Month over month, however, the market landed closer to the national average, with listings rising 12.5%.Ricky Cantore, a sales associate with REMAX Advantage Realty in Columbia, Maryland, said that while rising inventory is beginning to create more opportunities for buyers, conditions remain uneven across neighborhoods and still favors sellers in certain areas."We're seeing more homes come onto the market in certain areas, but overall inventory is still relatively tight, and conditions can vary dramatically from one neighborhood to the next," said Cantore. "In some cases, well-prepared homes are still getting 20 or more offers and selling well above asking, while others are sitting longer if they're not priced right. It's more balanced than it's been in recent years, but buyers still need to be well-prepared and ready to act quickly — and sellers who adjust their pricing early are ultimately positioning themselves for the strongest results."Other metrics of note:Days on market: Homes took an average of 45 days to sell, five days less than in March but four days longer than a year ago.Months' supply of inventory: Inventory totaled 2.3 months, identical to March but lower than the 2.4 months in April 2025.Close-to-list price ratio: Buyers paid 99% of the asking price in April, unchanged from last month and the same as April 2025.Highlights and local market results for April include:New Listings
In the 51 metro areas surveyed in April 2026, the number of newly listed homes was down 1.3% compared to April 2025, and up 10.5% compared to March 2026. The markets with the biggest decrease in year-over-year new listings percentage were Dover, DE at -33.0%, Trenton, NJ at -28.3% and Baltimore, MD at -23.4%. The markets with the biggest year-over-year increase in new listings percentage were Indianapolis, IN at +17.8%, Pittsburgh, PA at +15.4% and Seattle, WA at +14.5%.New Listings:
5 Markets with the Biggest YoY DecreaseMarketApr 2026Apr 2025Year-over-Year
% ChangeDover, DE272406-33.0 %Trenton, NJ502700-28.3 %Baltimore, MD4,4955,870-23.4 %Washington, DC10,78613,362-19.3 %Philadelphia, PA8,87510,859-18.3 %Closed Transactions
Of the 51 metro areas surveyed in April 2026, the overall number of home sales was up 0.1% compared to April 2025, and up 7.6% compared to March 2026. The markets with the biggest increase in year-over-year sales percentage were Burlington, VT at +17.4%, Omaha, NE at +12.9% and Salt Lake City, UT at +12.0%. The markets with the biggest decrease in year-over-year sales percentages were Hartford, CT at -11.8%, Honolulu, HI at -8.4% and Providence, RI at -8.2%.Closed Transactions:
5 Markets with the Biggest YoY IncreaseMarketApr 2026Apr 2025Year-over-Year
% ChangeBurlington, VT189161+17.4 %Omaha, NE1,091966+12.9 %Salt Lake City, UT1,2741,137+12.0 %New Orleans, LA1,026924+11.0 %Richmond, VA1,6421,501+9.4 %Median Sales Price – Median of 51 metro area prices
In April 2026, the median of all 51 metro area sales prices was $445,000, up 1.5% from April 2025 and up 1.4% compared to March 2026. The markets with the biggest year-over-year increase in median sales price were Providence, RI at +8.5%, Pittsburgh, PA at +8.4% and Kansas City, MO at +7.6%. The markets with the biggest year-over-year decrease in median sales price were Burlington, VT at -7.2%, Bozeman, MT at -2.3% and Houston, TX, Minneapolis, MN and Seattle, WA tied at -2.0%.Median Sales Price:
5 Markets with the Biggest YoY IncreaseMarketApr 2026Apr 2025Year-over-Year
% ChangeProvidence, RI$509,900$470,000+8.5 %Pittsburgh, PA$270,000$249,000+8.4 %Kansas City, MO$355,000$330,000+7.6 %Cleveland, OH$262,250$244,000+7.5 %Manchester, NH$515,000$480,000+7.3 %Close-to-List Price Ratio – Average of 51 metro area prices
In April 2026, the average close-to-list price ratio of all 51 metro areas in the report was 99%, the same as April 2025 and March 2026. The close-to-list price ratio is calculated by the average value of the sales price divided by the list price for each transaction. When the number is above 100%, the home closed for more than the list price. If it's less than 100%, the home sold for less than the list price. The metro areas with highest close-to-list price ratios were San Francisco, CA at 107.3%, Hartford, CT at 104.0% and Richmond, VA at 101.5%. The metro areas with the lowest close-to-list price ratio were Miami, FL at 93.9%, Tampa, FL at 96.6% and Houston, TX at 96.9%.Close-to-List Price Ratio:
5 Markets with the Highest Close-to-List Price RatioMarketApr 2026Apr 2025Year-over-Year
Difference*San Francisco, CA107.3 %104.5 %+2.7 ppHartford, CT104.0 %104.9 %-0.9 ppRichmond, VA101.5 %101.6 %-0.2 ppNew York, NY100.7 %101.2 %-0.5 ppManchester, NH100.7 %102.8 %-2.1 pp*Difference displayed as change in percentage pointsDays on Market – Average of 51 metro areas
The average days on market for homes sold in April 2026 was 45, up four days compared to the average in April 2025 and down five days compared to March 2026. Days on market is the number of days between when a home is first listed in an MLS and a sales contract is signed. The metro areas with the highest days on market averages were San Antonio, TX at 84 (+7.5%), Miami, FL at 78 (+1.7%) and Phoenix, AZ at 72 (+9.7%). The markets with the lowest days on market averages were Manchester, NH at 14 (-6.6%), Hartford, CT at 17 (-8.0%) and Richmond, VA at 24 (-2.1%).Days on Market:
5 Markets with the Highest Days on MarketMarketApr 2026Apr 2025Year-over-Year
% ChangeSan Antonio, TX8478+7.5 %Miami, FL7877+1.7 %Phoenix, AZ7265+9.7 %Tampa, FL6958+18.4 %Orlando, FL6866+3.3 %Months' Supply of Inventory – Average of 51 metro areas
The number of homes for sale in April 2026 was up 2.0% from April 2025 and up 4.5% from March 2026. Based on the rate of home sales in April 2026, the months' supply of inventory was 2.3, down from 2.4 from April 2025, and the same as March 2026. In April 2026, the markets with the highest months' supply of inventory were Miami, FL at 5.4 (-22.4%), New Orleans, LA at 4.7 (+25.9%) and San Antonio, TX at 4.6 (+2.9%). The markets with the lowest months' supply of inventory were Hartford, CT at 0.8 (-0.9%), Manchester, NH at 0.9 (+7.6%) and Albuquerque, NM at 1.0 (-12.4%).Months' Supply of Inventory:
5 Markets with the Highest Months' Supply of InventoryMarketApr 2026Apr 2025Year-over-Year
% ChangeMiami, FL5.46.9-22.4 %New Orleans, LA4.73.8+25.9 %San Antonio, TX4.64.5+2.9 %Houston, TX4.03.9+3.0 %Orlando, FL3.53.9-9.4 %About the REMAX Network
As one of the leading global real estate franchisors, RE/MAX, LLC is a subsidiary of RE/MAX Holdings (NYSE: RMAX) with more than 145,000 agents in nearly 8,500 offices and a presence in more than 120 countries and territories. Nobody in the world sells more real estate than REMAX, as measured by residential transaction sides. REMAX was founded in 1973 by Dave and Gail Liniger, with an innovative, entrepreneurial culture affording its agents and franchisees the flexibility to operate their businesses with great independence. REMAX agents have lived, worked and served in their local communities for decades, raising millions of dollars every year for Children's Miracle Network Hospitals® and other charities. To learn more about REMAX, to search home listings or find an agent in your community, please visit www.remax.com. For the latest news about REMAX, please visit news.remax.com.Report Details
The REMAX National Housing Report is distributed mid-month. The Report is based on MLS data for the stated month in 51 metropolitan areas, includes single-family residential property types, and is not annualized. For maximum representation, most of the largest metro areas in the country are represented, and an attempt is made to include at least one metro area in almost every state. Metro areas are defined by the Core Based Statistical Areas (CBSAs) established by the U.S. Office of Management and Budget.Definitions
Closed Transactions are the total number of closed residential transactions during the given month. Months' Supply of Inventory is the total number of residential properties listed for sale at the end of the month (current inventory) divided by the number of sales contracts signed (pending listings) during the month. Where "pending" data is unavailable, an inferred pending status is calculated using closed transactions. Days on Market is the average number of days that pass from the time a property is listed until the property goes under contract. Median Sales Price for a metro area is the median sales price for closed transactions in that metro area. The nationwide Median Sales Price is calculated at the nationwide aggregate level using all sale prices from the included metro areas. The Close-to-List Price Ratio is the average value of the sales price divided by the list price for each closed transaction.MLS data is provided by Constellation. While MLS data is believed to be reliable, it cannot be guaranteed. MLS data is constantly being updated, making any analysis a snapshot at a particular time. Every month, the previous period's data is updated to ensure accuracy over time. Raw data remains the intellectual property of each local MLS organization. View original content to download multimedia:https://www.prnewswire.com/news-releases/remax-april-2026-national-housing-report-302776805.htmlSOURCE RE/MAX, LLC Original: REMAX APRIL 2026 NATIONAL HOUSING REPORT
US Market News
2月前
RE/MAX HOLDINGS, INC. REPORTS FIRST QUARTER 2026 RESULTSMay 8, 2026 6:50 AM
PR Newswire (US) Total First Quarter Revenue of $70.2 Million, Adjusted EBITDA of $15.6 MillionDENVER, May 8, 2026 /PRNewswire/ -- First Quarter 2026 Highlights
(Compared to first quarter 2025 unless otherwise noted)Total Revenue decreased 5.7% to $70.2 millionRevenue excluding the Marketing Funds1 decreased 4.0% to $53.4 million, driven by a negative organic revenue growth2 of 4.7% partially offset by growth from foreign currency movements of 0.7%Net income (loss) attributable to RE/MAX Holdings, Inc. of ($9.7) million and income per diluted share (GAAP EPS) of (0.48)Adjusted EBITDA3 decreased 19.3% to $15.6 million, Adjusted EBITDA margin3 of 22.2% and Adjusted earnings per diluted share (Adjusted EPS3) of $0.16Total agent count increased 2.1% to 149,192 agentsU.S. and Canada combined agent count decreased 2.3% to 73,292 agentsTransaction with The Real Brokerage Inc.On April 26, 2026, RE/MAX Holdings, Inc. (the "Company" or "RE/MAX Holdings") (NYSE: RMAX) entered into a definitive Arrangement Agreement and Plan of Merger (the "Merger Agreement") with The Real Brokerage Inc. ("Real"), under which Real will acquire RE/MAX Holdings to create a leading technology-enabled global real estate platform named Real REMAX Group (the "Merger"). Under the terms of the Merger Agreement, RE/MAX Holdings shareholders will have the right to elect to receive 5.154 shares of Real REMAX Group or $13.80 in cash for each RE/MAX Holdings share, subject to proration such that the aggregate cash proceeds to RE/MAX Holdings shareholders in the transaction will be no less than $60 million and no greater than $80 million. Real shareholders will receive 1 share of Real REMAX Group for each Real share.5 The transaction is expected to close in the second half of 2026, subject to customary closing conditions, including stockholder approvals and regulatory approvals.In light of the proposed merger, the Company is not hosting a quarterly earnings call and does not expect to do so for future quarters. In addition, the Company does not intend to provide quarterly or annual guidance while the transaction is pending.For additional information regarding the Merger, see the Company's Current Report on Form 8-K filed with the SEC on April 28, 2026.First Quarter 2026 Operating ResultsAgent CountThe following table compares agent count as of March 31, 2026 and 2025:
As of March 31,
Change
2026
2025
#
%U.S.
47,443
49,854
(2,411)
(4.8)Canada
25,849
25,156
693
2.8Subtotal
73,292
75,010
(1,718)
(2.3)Outside the U.S. & Canada
75,900
71,116
4,784
6.7Total
149,192
146,126
3,066
2.1RevenueRE/MAX Holdings generated revenue of $70.2 million in the first quarter of 2026, a decrease of $4.2 million, or 5.7%, compared to $74.5 million in the first quarter of 2025. Revenue excluding the Marketing Funds was $53.4 million in the first quarter of 2026, a decrease of $2.2 million, or 4.0%, versus the same period in 2025. The decrease in Revenue excluding the Marketing Funds was attributable to a decline in organic revenue of 4.7%, partially offset by foreign currency movements of 0.7%. The decline in organic revenue was driven mainly by modifications to the Company's standard fee models, including the Aspire and Ascend programs and a decrease in U.S. agent count; partially offset by an increase in Broker fees primarily from incentives related to modifications to the Company's standard fee models, including Aspire and Ascend.Recurring revenue streams, which consist of continuing franchise fees and annual dues, decreased $3.8 million, or 10.2%, compared to the first quarter of 2025 and accounted for 62.5% of Revenue excluding the Marketing Funds in the first quarter of 2026 compared to 66.8% in the prior-year period.Operating ExpensesTotal operating expenses were $78.1 million for the first quarter of 2026, an increase of $9.0 million, or 13.0%, compared to $69.1 million in the first quarter of 2025. First quarter 2026 total operating expenses increased primarily due to Settlement charges, and an increase in Selling, operating and administrative expenses, partially offset by a decrease in Marketing Funds expenses, and Depreciation and amortization expenses.Selling, operating and administrative expenses were $46.8 million in the first quarter of 2026, an increase of $3.8 million, or 8.8%, compared to the first quarter of 2025 and represented 87.7% of Revenue excluding the Marketing Funds, compared to 77.4% in the prior-year period. First quarter 2026 Selling, operating and administrative expenses increased primarily due to an increase in transaction costs related to the Merger, an increase in expenses from our annual REMAX agent convention, higher investments in technology, partially offset by a decrease in personnel related expenses.Net Income (loss) and GAAP EPSNet loss attributable to RE/MAX Holdings was ($9.7) million for the first quarter of 2026 compared to net loss of ($2.0) million for the first quarter of 2025. Reported basic and diluted GAAP earnings per share were ($0.48) each for the first quarter of 2026 compared to basic and diluted GAAP earnings per share were ($0.10) each for the first quarter of 2025.Adjusted EBITDA and Adjusted EPSAdjusted EBITDA was $15.6 million for the first quarter of 2026, a decrease of $3.7 million, or 19.3%, compared to the first quarter of 2025. First quarter 2026 Adjusted EBITDA decreased due to lower revenue driven by modifications to the Company's standard fee models, including the Aspire and Ascend programs and a reduction in U.S. agent count, increases to events-related expenses, and investments in technology; partially offset by certain lower personnel-related expenses. Adjusted EBITDA margin was 22.2% in the first quarter of 2026, compared to 25.9% in the first quarter of 2025.Adjusted basic and diluted EPS were $0.16 each for the first quarter of 2026 compared to Adjusted basic and diluted EPS of $0.24 each for the first quarter of 2025. The ownership structure used to calculate Adjusted basic and diluted EPS for the quarter ended March 31, 2026, assumes RE/MAX Holdings owned 100% of RMCO, LLC ("RMCO"). The weighted average ownership RE/MAX Holdings had in RMCO was 62.0% for the quarter ended March 31, 2026.Balance Sheet As of March 31, 2026, the Company had cash and cash equivalents of $107.1 million, a decrease of $11.6 million from December 31, 2025. As of March 31, 2026, the Company had $436.0 million of outstanding debt, net of an unamortized debt discount and issuance costs, compared to $436.8 million as of December 31, 2025.Basis of PresentationUnless otherwise noted, the results presented in this press release are consolidated and exclude adjustments attributable to the non-controlling interest.Footnotes:1Revenue excluding the Marketing Funds is a non-GAAP measure of financial performance that differs from U.S. Generally Accepted Accounting Principles ("U.S. GAAP") and a reconciliation to the most directly comparable U.S. GAAP measure is as follows (in thousands):
Three Months Ended
March 31,
2026
2025Revenue excluding the Marketing Funds:
Total revenue
$70,228
$74,467Less: Marketing Funds fees
16,866
18,864Revenue excluding the Marketing Funds
$53,362
$55,6032The Company defines organic revenue growth as revenue growth from continuing operations excluding (i) revenue from Marketing Funds, (ii) revenue from acquisitions, and (iii) the impact of foreign currency movements. The Company defines revenue from acquisitions as the revenue generated from the date of an acquisition to its second anniversary (excluding Marketing Funds revenue related to acquisitions where applicable).3Adjusted EBITDA, Adjusted EBITDA margin and Adjusted EPS are non-GAAP measures. These terms are defined at the end of this release. Please see Tables 5 and 6 appearing later in this release for reconciliations of these non-GAAP measures to the most directly comparable GAAP measures.4To be adjusted to reflect 10-for-1 share consolidation of Real shares immediately prior to closing.5Following a 10-for-1 consolidation of Real's shares.About RE/MAX Holdings, Inc.RE/MAX Holdings, Inc. (NYSE: RMAX) is one of the world's leading franchisors in the real estate industry, franchising real estate brokerages globally under the REMAX® brand, and mortgage brokerages within the U.S. under the Motto® Mortgage brand. REMAX was founded in 1973 by Dave and Gail Liniger, with an innovative, entrepreneurial culture affording its agents and franchisees the flexibility to operate their businesses with great independence. Now with more than 145,000 agents in nearly 8,500 offices and a presence in more than 120 countries and territories, nobody in the world sells more real estate than REMAX, as measured by total residential transaction sides. Dedicated to innovation and change in the real estate industry, RE/MAX Holdings launched Motto Franchising, LLC, a ground-breaking mortgage brokerage franchisor, in 2016. Motto Mortgage, the first and only national mortgage brokerage franchise brand in the U.S., has offices across more than 40 states.Forward-Looking StatementsThis press release includes "forward-looking statements" within the meaning of the "safe harbor" provisions of the United States Private Securities Litigation Reform Act of 1995. Forward-looking statements are often identified by the use of words such as "believe," "intend," "expect," "estimate," "plan," "outlook," "project," "anticipate," "may," "will," "would" and other similar words and expressions that predict or indicate future events or trends that are not statements of historical matters. Forward-looking statements include statements related to agent count; Motto open offices; franchise sales; revenue; the Company's statements regarding the proposed merger transaction and anticipated benefits of the Merger including the Company's expectations of no longer providing guidance or conducting quarterly earnings calls while the merger transaction is pending; housing and mortgage market conditions; the Company's commitment to innovation and delivering an elevated experience; enhancing our value proposition; our profitability and margin performance exceeding expectations; our new Marketing Studio (formerly known as "Marketing as a Service (MaaS)") platform and economic models and the impact thereof; our strengthened leadership team; the completion of the Merger and the expected timeline; and the ability to satisfy all closing conditions, including the receipt of required approvals for the Merger. Forward-looking statements should not be read as a guarantee of future performance or results and will not necessarily accurately indicate the times at which such performance or results may be achieved. Forward-looking statements are based on information available at the time those statements are made and/or management's good faith belief as of that time with respect to future events and are subject to risks and uncertainties that could cause actual performance or results to differ materially from those expressed in or suggested by the forward-looking statements. These risks and uncertainties include, without limitation, (1) changes in the real estate market or interest rates and availability of financing, (2) changes in business and economic activity in general, including enacted and proposed tariffs and other trade policies which could impact the global economy, (3) the Company's ability to attract and retain quality franchisees, (4) the Company's franchisees' ability to recruit and retain real estate agents and mortgage loan originators, (5) changes in laws and regulations, (6) the Company's ability to enhance, market, and protect its brands, (7) the Company's ability to implement its technology initiatives, (8) risks related to recent changes in the Company's leadership team, (9) fluctuations in foreign currency exchange rates, (10) the nature and amount of the exclusion of charges in future periods when determining Adjusted EBITDA is subject to uncertainty and may not be similar to such charges in prior periods, (11) Real's and RE/MAX Holdings' ability to consummate the Merger on the expected timeline or at all, (12) Real's and RE/MAX Holdings' ability to obtain the necessary regulatory approvals in a timely manner and the risk that such approvals are not obtained or are obtained subject to conditions that are not anticipated, (13) Real's or RE/MAX Holdings' ability to obtain approval of their shareholders, (14) the risk that a condition of closing of the Merger may not be satisfied or that the closing of the Merger might otherwise not occur, (15) the occurrence of any event, change or other circumstance or condition that could give rise to the termination of the merger agreement, including in circumstances requiring Real or RE/MAX Holdings to pay a termination fee, (16) the diversion of management time on Merger-related issues; risks related to disruption from the Merger, including disruption of management time from current plans and ongoing business operations due to the Merger and integration matters, (17) the risk that the Merger and its announcement could have an adverse effect on Real's and RE/MAX Holdings' ability to retain agents, franchisees and personnel or that there could be potential adverse reactions or changes to business relationships resulting from the announcement or completion of the Merger, (18) unexpected costs, charges or expenses resulting from the Merger, (19) potential litigation relating to the Merger that could be instituted against the parties to the merger agreement or their respective directors, managers or officers, including the effects of any outcomes related thereto, (20) the ability of the combined company to achieve the synergies and other anticipated benefits expected from the Merger or such synergies and other anticipated benefits taking longer to realize than anticipated, (21) the ability of the combined company to achieve the expected leverage or such leverage taking longer to realize than anticipated, (22) Real's ability to integrate RE/MAX Holdings promptly and effectively, (23) anticipated tax treatment, unforeseen liabilities, future capital expenditures, economic performance, future prospects and business and management strategies for the management, expansion and growth of the combined company's operations, (24) certain restrictions during the pendency of the Merger that may impact Real's or RE/MAX Holdings' ability to pursue certain business opportunities or strategic transactions or otherwise operate their respective businesses, and (25) other risk factors detailed from time to time in Real's and RE/MAX Holdings' reports filed with the SEC and Real's reports filed with Canadian securities regulators, including Real's annual report on Form 40-F, current reports on Form 6-K and other documents filed with the SEC, and RE/MAX Holdings' annual report on Form 10-K, quarterly reports on Form 10-Q, current reports on Form 8-K and other documents filed with the SEC and Real's audited annual financial statements and annual management's discussion and analysis for the financial year ended December 31, 2025 and Annual Information Form dated March 4, 2026 filed with Canadian securities regulators, including documents that will be filed with the SEC and Canadian securities regulators in connection with the Merger.These risks, as well as other risks associated with the Merger, will be more fully discussed in the proxy statement/prospectus that will be included in the Registration Statement and the Real management information circular that will each be filed with the SEC and Canadian securities regulators, as applicable, in connection with the Merger. While the list of factors presented here is, and the list of factors to be presented in the Registration Statement will be, considered representative, no such list should be considered to be a complete statement of all potential risks and uncertainties. Unlisted factors may present significant additional obstacles to the realization of forward-looking statements/forward-looking information. You should not place undue reliance on any of these forward-looking statements/forward-looking information as they are not guarantees of future performance or outcomes; actual performance and outcomes, including, without limitation, Real's or RE/MAX Holdings' actual results of operations, financial condition and liquidity, and the development of new markets or market segments in which Real or RE/MAX Holdings operate, may differ materially from those made in or suggested by the forward-looking statements/forward-looking information contained in this press release. Neither Real nor RE/MAX Holdings assumes any obligation to publicly provide revisions or updates to any forward-looking statements/forward-looking information, whether as a result of new information, future developments or otherwise, should circumstances change, except as otherwise required by securities and other applicable laws. Neither future distribution of this press release nor the continued availability of this press release in archive form on Real's or RE/MAX Holdings' website should be deemed to constitute an update or re-affirmation of these statements as of any future date.Important Information and Where to Find ItIn connection with the Merger, Real and RE/MAX Holdings will file relevant materials with the SEC and Canadian securities regulators, as applicable, including a management information circular of Real and a registration statement on Form S-4 (the "Registration Statement") that will include a proxy statement of RE/MAX Holdings and prospectus of Real REMAX Group. Real's management information circular will be mailed to securityholders of Real and the proxy statement/prospectus will be mailed to shareholders of each of RE/MAX Holdings and Real, in each case seeking their respective approval of the Merger and other related matters. This press release is not a substitute for the Registration Statement, the proxy statement/prospectus, the Real management information circular or any other document that Real or RE/MAX Holdings (as applicable) may file with the SEC and Canadian securities regulators, as applicable, in connection with the Merger.BEFORE MAKING ANY VOTING OR INVESTMENT DECISION, INVESTORS AND SECURITY HOLDERS OF REAL AND RE/MAX HOLDINGS ARE URGED TO READ THE REGISTRATION STATEMENT, THE REAL MANAGEMENT CIRCULAR, THE PROXY STATEMENT/PROSPECTUS AND ANY OTHER RELEVANT DOCUMENTS THAT ARE FILED OR WILL BE FILED WITH THE SEC AND CANADIAN SECURITIES REGULATORS, AS APPLICABLE, AS WELL AS ANY AMENDMENTS OR SUPPLEMENTS TO THESE DOCUMENTS, CAREFULLY AND IN THEIR ENTIRETY WHEN THEY BECOME AVAILABLE BECAUSE THEY CONTAIN OR WILL CONTAIN IMPORTANT INFORMATION ABOUT THE MERGER AND RELATED MATTERS.Investors and security holders may obtain free copies of the Registration Statement, the Real management information circular and the proxy statement/prospectus (when they become available), as well as other filings containing important information about Real or RE/MAX Holdings, without charge at the SEC's Internet website (http://www.sec.gov) and under Real's profile on SEDAR+ at www.sedarplus.ca, as applicable. Copies of the documents filed with the SEC and the Canadian securities regulators by Real will be available free of charge on Real's internet website at https://investors.onereal.com or by contacting Real's investor relations contact at investors@therealbrokerage.com. Copies of the documents filed with the SEC by RE/MAX Holdings will be available free of charge on RE/MAX Holdings' internet website at https://investors.remaxholdings.com or by contacting RE/MAX Holdings' investor relations contact at investorrelations@remax.com. The information included on, or accessible through, Real's website or RE/MAX Holdings' website is not incorporated by reference into this press release or Real's and RE/MAX Holdings' respective filings with the SEC and Canadian securities regulators, as applicable.Participants in the SolicitationReal, RE/MAX Holdings, their respective directors and certain of their respective executive officers may be deemed to be participants in the solicitation of proxies in respect of the Merger. Information about the directors and executive officers of Real is set forth in its management information circular for its 2026 annual meeting of shareholders, which was filed with the Canadian securities regulators on April 24, 2026 (the "Real Annual Meeting Circular") and in its Form 6-K, which was filed with the SEC on April 24, 2026. Please refer to the sections captioned "Election of Directors," "Statement of Corporate Governance Practices," and "Compensation Discussion and Analysis" in the Real Annual Meeting Circular. To the extent holdings of such participants in Real's securities have changed since the amounts described in the Real Annual Meeting Circular, such changes have been reflected on a Notice of Proposed Sale of Securities pursuant to Rule 144 under the U.S. Securities Act on Form 144 filed with the SEC and in insider reports filed with the Canadian securities regulators on SEDI at wwww.sedi.ca. Information about the directors and executive officers of RE/MAX Holdings is set forth in its proxy statement for its 2025 annual meeting of stockholders, which was filed with the SEC on April 3, 2025 (the "RE/MAX Holdings Annual Meeting Proxy Statement") and in its Form 8-K, which was filed with the SEC on May 20, 2025. Please refer to the sections captioned "Corporate Governance," "Director Compensation," "Information about Executive Officers," "Compensation Discussion and Analysis," "Stock Ownership of Certain Beneficial Owners and Management," and "Certain Relationships and Related Party Transactions" in the RE/MAX Holdings Annual Meeting Proxy Statement. To the extent holdings of such participants in RE/MAX Holdings' securities have changed since the amounts described in the RE/MAX Holdings Annual Meeting Proxy Statement, such changes have been reflected on Initial Statements of Beneficial Ownership on Form 3 or Statements of Change in Ownership on Form 4 filed with the SEC, which are available at https://www.sec.gov/edgar/browse/?CIK=1581091&owner=exclude under the tab "Ownership Disclosures." These documents can be obtained free of charge from the sources indicated above. Additional information regarding the participants in the proxy solicitations and a description of their direct or indirect interests, by security holdings or otherwise, will be contained in the Registration Statement, the Real management circular and the proxy statement/prospectus and the other relevant materials filed with the SEC and Canadian securities regulators, as applicable, when they become available.No Offer or Solicitation This press release is for informational purposes only and is not intended to, and shall not, constitute an offer to sell or the solicitation of an offer to buy any securities or a solicitation of any vote or approval, nor shall there be any offer, solicitation or sale of securities in any jurisdiction in which such offer, solicitation or sale would be unlawful prior to registration or qualification under the securities laws of any such jurisdiction. No offering of securities shall be made except by means of a prospectus meeting the requirements of Section 10 of the U.S. Securities Act and otherwise in accordance with applicable Canadian securities laws.
TABLE 1RE/MAX Holdings, Inc.Consolidated Statements of Income (Loss)(In thousands, except share and per share amounts)(Unaudited)
Three Months Ended
March 31,
2026
2025Revenue:
Continuing franchise fees
$25,791
$29,351Annual dues
7,558
7,789Broker fees
12,611
11,431Marketing Funds fees
16,866
18,864Franchise sales and other revenue
7,402
7,032Total revenue
70,228
74,467Operating expenses:
Selling, operating and administrative expenses
46,811
43,028Marketing Funds expenses
16,866
18,864Depreciation and amortization
5,875
6,589Settlement and impairment charges
8,500
619Total operating expenses
78,052
69,100Operating income (loss)
(7,824)
5,367Other expenses, net:
Interest expense
(7,158)
(7,924)Interest income
874
908Foreign currency transaction gains (losses)
16
283Total other expenses, net
(6,268)
(6,733)Income (loss) before provision for income taxes
(14,092)
(1,366)Provision for income taxes
(1,617)
(1,870)Net income (loss)
$(15,709)
$(3,236)Less: net income (loss) attributable to non-controlling interest
(5,968)
(1,278)Net income (loss) attributable to RE/MAX Holdings, Inc.
$(9,741)
$(1,958)
Net income (loss) attributable to RE/MAX Holdings, Inc. per share
of Class A common stock
Basic
$(0.48)
$(0.10)Diluted
$(0.48)
$(0.10)Weighted average shares of Class A common stock outstanding
Basic
20,491,629
19,292,210Diluted
20,491,629
19,292,210 TABLE 2 RE/MAX Holdings, Inc.Consolidated Balance Sheets (In thousands, except share and per share amounts)(Unaudited)
March 31,
December 31,
2026
2025Assets
Current assets:
Cash and cash equivalents
$107,126
$118,736Restricted cash
75,496
74,332Accounts and notes receivable, net of allowances
28,241
26,944Income taxes receivable
7,937
8,188Other current assets
14,089
11,940Total current assets
232,889
240,140Property and equipment, net of accumulated depreciation
5,674
5,996Operating lease right of use assets
11,749
12,608Franchise agreements, net
63,235
67,080Other intangible assets, net
11,543
10,774Goodwill
238,854
239,572Other assets, net of current portion
8,401
6,305Total assets
$572,345
$582,475Liabilities and stockholders' equity (deficit)
Current liabilities:
Accounts payable
$6,814
$3,986Accrued liabilities
106,661
100,927Income taxes payable
386
105Deferred revenue
20,112
21,391Debt
4,600
4,600Payable pursuant to tax receivable agreements
219
1,542Operating lease liabilities
9,451
9,217Total current liabilities
148,243
141,768Debt, net of current portion
431,362
432,151Deferred tax liabilities
8,039
8,193Deferred revenue, net of current portion
12,410
12,859Operating lease liabilities, net of current portion
11,508
13,514Other liabilities, net of current portion
2,441
2,978Total liabilities
614,003
611,463Commitments and contingencies
Stockholders' equity (deficit):
Class A common stock, par value $.0001 per share, 180,000,000 shares authorized; 21,232,815 and 20,095,180 shares issued and outstanding as of March 31, 2026 and December 31, 2025, respectively
2
2Class B common stock, par value $.0001 per share, 1,000 shares authorized; 1 share issued and outstanding as of March 31, 2026 and December 31, 2025, respectively
—
—Additional paid-in capital
582,658
578,429Accumulated deficit
(135,915)
(126,072)Accumulated other comprehensive income (deficit), net of tax
(598)
54Total stockholders' equity attributable to RE/MAX Holdings, Inc.
446,147
452,413Non-controlling interest
(487,805)
(481,401)Total stockholders' equity (deficit)
(41,658)
(28,988)Total liabilities and stockholders' equity (deficit)
$572,345
$582,475
TABLE 3RE/MAX Holdings, Inc.Consolidated Statements of Cash Flows(In thousands)(Unaudited)
Three Months Ended
March 31,
2026
2025Cash flows from operating activities:
Net income (loss)
$(15,709)
$(3,236)Adjustments to reconcile net income (loss) to operating cash flows:
Depreciation and amortization
5,875
6,589Equity-based compensation expense
5,316
6,346Bad debt expense
1,144
1,592Deferred income tax expense (benefit)
(78)
223Fair value adjustments to contingent consideration
67
116Settlement and impairment charges
8,500
619Debt charges
234
212Other, net
406
243Changes in operating assets and liabilities
(7,599)
(7,043)Net cash (used in) provided by operating activities
(1,844)
5,661Cash flows from investing activities:
Purchases of property, equipment and capitalization of software
(2,421)
(1,691)Net cash used in investing activities
(2,421)
(1,691)Cash flows from financing activities:
Payments on debt
(1,150)
(1,150)Dividends and dividend equivalents paid to Class A common stockholders
(103)
(324)Payments related to tax withholding for share-based compensation
(3,563)
(4,237)Payment of contingent consideration
(742)
(791)Other financing
(36)
(29)Net cash used in financing activities
(5,594)
(6,531)Effect of exchange rate changes on cash
(587)
180Net decrease in cash, cash equivalents and restricted cash
(10,446)
(2,381)Cash, cash equivalents and restricted cash, beginning of period
193,068
169,287Cash, cash equivalents and restricted cash, end of period
$182,622
$166,906
TABLE 4RE/MAX Holdings, Inc.Agent Count(Unaudited)
As of
March 31,
December 31,
September 30,
June 30,
March 31,
December 31,
September 30,
June 30,
March 31,
2026
2025
2025
2025
2025
2024
2024
2024
2024Agent Count:
U.S.
Company-Owned Regions
41,468
41,998
42,935
43,363
43,543
44,911
46,283
46,780
47,302Independent Regions
5,975
6,167
6,243
6,306
6,311
6,375
6,525
6,626
6,617U.S. Total
47,443
48,165
49,178
49,669
49,854
51,286
52,808
53,406
53,919Canada
Company-Owned Regions
20,780
19,803
20,045
20,060
20,227
20,311
20,515
20,347
20,151Independent Regions
5,069
5,009
4,975
4,906
4,929
4,860
4,878
4,846
4,885Canada Total
25,849
24,812
25,020
24,966
25,156
25,171
25,393
25,193
25,036U.S. and Canada Total
73,292
72,977
74,198
74,635
75,010
76,457
78,201
78,599
78,955Outside U.S. and Canada
Independent Regions
75,900
75,683
73,349
72,438
71,116
70,170
67,282
64,943
64,332Outside U.S. and Canada Total
75,900
75,683
73,349
72,438
71,116
70,170
67,282
64,943
64,332Total
149,192
148,660
147,547
147,073
146,126
146,627
145,483
143,542
143,287 TABLE 5RE/MAX Holdings, Inc. Adjusted EBITDA Reconciliation to Net Income (Loss) (In thousands, except percentages)(Unaudited)
Three Months Ended
March 31,
2026
2025
Net income (loss)
$(15,709)
$(3,236)
Depreciation and amortization
5,875
6,589
Interest expense
7,158
7,924
Interest income
(874)
(908)
Provision for income taxes
1,617
1,870
EBITDA
(1,933)
12,239
Settlement and impairment charges (1)
8,500
619
Equity-based compensation expense
5,316
6,346
Merger transaction costs (2)
2,831
—
Fair value adjustments to contingent consideration (3)
67
116
Other adjustments (4)
776
(33)
Adjusted EBITDA (5)
$15,557
$19,287
Adjusted EBITDA Margin (5)
22.2%
25.9%(1)For the three months ended March 31, 2026, represents the settlement of an industry class-action lawsuit. During the three months ended March 31, 2025, represents the settlement of an immaterial legal matter and an impairment recognized on an office lease in Canada.(2)Represents transaction-related expenses incurred in connection with the pending Merger which primarily consist of legal, advisory, and other professional service fees.(3)Fair value adjustments to contingent consideration include amounts recognized for changes in the estimated fair value of the contingent consideration liabilities.(4)Other adjustments are primarily losses on disposal of assets for the three months ended March 31, 2026.(5)Non-GAAP measure. See the end of this press release for definitions of non-GAAP measures.
TABLE 6RE/MAX Holdings, Inc. Adjusted Net Income (Loss) and Adjusted Earnings per Share (In thousands, except share and per share amounts)(Unaudited)
Three Months Ended
March 31,
2026
2025Net income (loss)
$(15,709)
$(3,236)Amortization of acquired intangible assets
3,844
4,384Provision for income taxes
1,617
1,870Add-backs:
Settlement and impairment charges (1)
8,500
619Equity-based compensation expense
5,316
6,346Merger transaction costs (2)
2,831
—Fair value adjustments to contingent consideration (3)
67
116Other adjustments (4)
776
(33)Adjusted pre-tax net income
7,242
10,066Less: Provision for income taxes at 25% (5)
(1,811)
(2,517)Adjusted net income (6)
$5,431
$7,549
Total basic pro forma shares outstanding
33,051,229
31,851,810Total diluted pro forma shares outstanding
33,051,229
31,851,810
Adjusted net income basic earnings per share (6)
$0.16
$0.24Adjusted net income diluted earnings per share (6)
$0.16
$0.24(1)For the three months ended March 31, 2026, represents the settlement of an industry class-action lawsuit. During the three months ended March 31, 2025, represents the settlement of an immaterial legal matter and an impairment recognized on an office lease in Canada.(2)Represents transaction-related expenses incurred in connection with the pending Merger which primarily consist of legal, advisory, and other professional service fees.(3)Fair value adjustments to contingent consideration include amounts recognized for changes in the estimated fair value of the contingent consideration liabilities.(4)Other adjustments are primarily losses on disposal of assets for the three months ended March 31, 2026.(5)The long-term tax rate assumes the exchange of all outstanding non-controlling interest partnership units for Class A Common Stock that (a) removes the impact of unusual, non-recurring tax matters and (b) does not estimate the residual impacts to foreign taxes of additional step-ups in tax basis from an exchange because that is dependent on stock prices at the time of such exchange and the calculation is impracticable.(6)Non-GAAP measure. See the end of this press release for definitions of non-GAAP measures. TABLE 7RE/MAX Holdings, Inc. Pro Forma Shares Outstanding(Unaudited)
Three Months Ended
March 31,
2026
2025Total basic weighted average shares outstanding:
Weighted average shares of Class A common stock outstanding
20,491,629
19,292,210Remaining equivalent weighted average shares of stock outstanding on a pro forma basis assuming RE/MAX Holdings owned 100% of RMCO
12,559,600
12,559,600Total basic pro forma weighted average shares outstanding
33,051,229
31,851,810
Total diluted weighted average shares outstanding:
Weighted average shares of Class A common stock outstanding
20,491,629
19,292,210Remaining equivalent weighted average shares of stock outstanding on a pro forma basis assuming RE/MAX Holdings owned 100% of RMCO
12,559,600
12,559,600Dilutive effect of unvested restricted stock units (1)
—
—Total diluted pro forma weighted average shares outstanding
33,051,229
31,851,810(1)In accordance with the treasury stock method. TABLE 8RE/MAX Holdings, Inc. Adjusted Free Cash Flow & Unencumbered Cash(Unaudited)
Three Months Ended
March 31,
2026
2025Cash flow from operations
$(1,844)
$5,661Less: Purchases of property, equipment and capitalization of software
(2,421)
(1,691)(Increases) decreases in restricted cash of the Marketing Funds (1)
(1,164)
(5,131)Adjusted free cash flow (2)
(5,429)
(1,161)
Adjusted free cash flow (2)
(5,429)
(1,161)Less: Tax/Other non-dividend distributions to RIHI
—
—Adjusted free cash flow after tax/non-dividend distributions to RIHI (2)
(5,429)
(1,161)
Adjusted free cash flow after tax/non-dividend distributions to RIHI (2)
(5,429)
(1,161)Less: Debt principal payments
(1,150)
(1,150)Unencumbered cash generated (2)
$(6,579)
$(2,311)
Summary
Cash flow from operations
$(1,844)
$5,661Adjusted free cash flow (2)
$(5,429)
$(1,161)Adjusted free cash flow after tax/non-dividend distributions to RIHI (2)
$(5,429)
$(1,161)Unencumbered cash generated (2)
$(6,579)
$(2,311)
Adjusted EBITDA (2)
$15,557
$19,287Adjusted free cash flow as % of Adjusted EBITDA (2)
(34.9) %
(6.0) %Adjusted free cash flow less distributions to RIHI as % of Adjusted EBITDA (2)
(34.9) %
(6.0) %Unencumbered cash generated as % of Adjusted EBITDA (2)
(42.3) %
(12.0) %(1)This line reflects any subsequent changes in the restricted cash balance (which under GAAP reflects as either (a) an increase or decrease in cash flow from operations or (b) an incremental amount of purchases of property and equipment and capitalization of developed software) to remove the impact of changes in restricted cash in determining adjusted free cash flow.(2)Non-GAAP measure. See the end of this press release for definitions of non-GAAP measures.Non-GAAP Financial Measures The SEC has adopted rules to regulate the use in filings with the SEC and in public disclosures of financial measures that are not in accordance with U.S. GAAP, such as Revenue excluding the Marketing Funds, Adjusted EBITDA and the ratios related thereto, Adjusted net income (loss), Adjusted basic and diluted earnings per share (Adjusted EPS) and adjusted free cash flow. These measures are derived based on methodologies other than in accordance with U.S. GAAP.Revenue excluding the Marketing Funds is calculated directly from our consolidated financial statements as Total revenue less Marketing Funds fees.The Company defines Adjusted EBITDA as EBITDA (consolidated net income before depreciation and amortization, interest expense, interest income and the provision for income taxes, each of which is presented in the unaudited consolidated financial statements included earlier in this press release), adjusted for the impact of the following items that are either non-cash or that the Company does not consider representative of its ongoing operating performance: loss or gain on sale or disposition of assets, settlement and impairment charges, equity-based compensation expense, acquisition-related expense, gain on reduction in tax receivable agreement liability, expense or income related to changes in the estimated fair value measurement of contingent consideration, restructuring charges and other non-recurring items. Adjusted EBITDA margin represents Adjusted EBITDA as a percentage of revenue.Because Adjusted EBITDA and Adjusted EBITDA margin omit certain non-cash items and other non-recurring cash charges or other items, the Company believes that each measure is less susceptible to variances that affect its operating performance resulting from depreciation, amortization and other non-cash and non-recurring cash charges or other items. The Company presents Adjusted EBITDA and the related Adjusted EBITDA margin because the Company believes they are useful as supplemental measures in evaluating the performance of its operating businesses and provides greater transparency into the Company's results of operations. The Company's management uses Adjusted EBITDA and Adjusted EBITDA margin as factors in evaluating the performance of the business.Adjusted EBITDA and Adjusted EBITDA margin have limitations as analytical tools, and you should not consider these measures in isolation or as a substitute for analyzing the Company's results as reported under U.S. GAAP. Some of these limitations are:these measures do not reflect changes in, or cash requirements for, the Company's working capital needs;these measures do not reflect the Company's interest expense, or the cash requirements necessary to service interest or principal payments on its debt;these measures do not reflect the Company's income tax expense or the cash requirements to pay its taxes;these measures do not reflect the cash requirements to pay dividends to stockholders of the Company's Class A common stock and tax and other cash distributions to its non-controlling unitholders;these measures do not reflect the cash requirements pursuant to the tax receivable agreements;these measures do not reflect the cash requirements for share repurchases;these measures do not reflect the cash requirements for the settlements of certain industry class-action lawsuits and other legal settlements;although depreciation and amortization are non-cash charges, the assets being depreciated and amortized will often require replacement in the future, and these measures do not reflect any cash requirements for such replacements;although equity-based compensation is a non-cash charge, the issuance of equity-based awards may have a dilutive impact on earnings per share; andother companies may calculate these measures differently so similarly named measures may not be comparable.Adjusted net income (loss) is calculated as Net income (loss) attributable to RE/MAX Holdings, assuming the full exchange of all outstanding non-controlling interests for shares of Class A common stock as of the beginning of the period (and the related increase to the provision for income taxes after such exchange), plus primarily non-cash items and other items that management does not consider to be useful in assessing the Company's operating performance (e.g., amortization of acquired intangible assets, gain on sale or disposition of assets, non-cash impairment charges, acquisition-related expense, restructuring charges and equity-based compensation expense). Adjusted basic and diluted earnings per share (Adjusted EPS) are calculated as Adjusted net income (loss) (as defined above) divided by pro forma (assuming the full exchange of all outstanding non-controlling interests) basic and diluted weighted average shares, as applicable.When used in conjunction with GAAP financial measures, Adjusted net income (loss) and Adjusted EPS are supplemental measures of operating performance that management believes are useful measures to evaluate the Company's performance relative to the performance of its competitors as well as performance period over period. By assuming the full exchange of all outstanding non-controlling interests, management believes these measures:facilitate comparisons with other companies that do not have a low effective tax rate driven by a non-controlling interest on a pass-through entity;facilitate period over period comparisons because they eliminate the effect of changes in Net income attributable to RE/MAX Holdings, Inc. driven by increases in its ownership of RMCO, LLC, which are unrelated to the Company's operating performance; andeliminate primarily non-cash and other items that management does not consider to be useful in assessing the Company's operating performance.Adjusted free cash flow is calculated as cash flows from operations less capital expenditures and any changes in restricted cash of the Marketing Funds, all as reported under GAAP, and quantifies how much cash a company has to pursue opportunities that enhance shareholder value. The restricted cash of the Marketing Funds is limited in use for the benefit of franchisees and any impact to adjusted free cash flow is removed. The Company believes adjusted free cash flow is useful to investors as a supplemental measure as it calculates the cash flow available for working capital needs, re-investment opportunities, potential Independent Region and strategic acquisitions, dividend payments or other strategic uses of cash.Adjusted free cash flow after tax and non-dividend distributions to RIHI, Inc. ("RIHI"), an entity majority owned and controlled by David Liniger, our Chairman and Co-Founder, and by Gail Liniger, our Vice Chair Emerita and Co-Founder, is calculated as adjusted free cash flow less tax and other non-dividend distributions paid to RIHI (the non-controlling interest holder) to enable RIHI to satisfy its income tax obligations. Similar payments would be made by the Company directly to federal and state taxing authorities as a component of the Company's consolidated provision for income taxes if a full exchange of non-controlling interests occurred in the future. As a result and given the significance of the Company's ongoing tax and non-dividend distribution obligations to its non-controlling interest, adjusted free cash flow after tax and non-dividend distributions, when used in conjunction with GAAP financial measures, provides a meaningful view of cash flow available to the Company to pursue opportunities that enhance shareholder value.Unencumbered cash generated is calculated as adjusted free cash flow after tax and non-dividend distributions to RIHI less quarterly debt principal payments less annual excess cash flow payment on debt, as applicable. Given the significance of the Company's excess cash flow payment on debt, when applicable, unencumbered cash generated, when used in conjunction with GAAP financial measures, provides a meaningful view of the cash flow available to the Company to pursue opportunities that enhance shareholder value after considering its debt service obligations. View original content to download multimedia:https://www.prnewswire.com/news-releases/remax-holdings-inc-reports-first-quarter-2026-results-302766572.htmlSOURCE RE/MAX Holdings, Inc. Original: RE/MAX HOLDINGS, INC. REPORTS FIRST QUARTER 2026 RESULTS
US Market News
3月前
REMAX NATIONAL HOUSING REPORT FOR FEBRUARY 2026March 16, 2026 4:38 PM
PR Newswire (US)
February Listings Sell Faster Ahead of Spring, Inventory Holds SteadyDENVER, March 16, 2026 /PRNewswire/ -- A harbinger of spring, February was a transitional period and experienced modest activity – most notably with homes selling faster. According to data from the 50 metro areas surveyed, after nine months in which days on market grew from 40 to 62, February days on market dropped to 57. That was six fewer days than in January but still six days more than in February 2025.
February saw 11.1% more closings than January, picking up speed heading into March, when home sales typically post the year's largest monthly increase. February's sales were 3.2% lower than a year ago, while new listings dropped 4.4% month over month and trailed February 2025 by 6.8%. Inventory remained unchanged from January and finished 7.3% higher than a year ago.Other metrics of note include:Months' supply of inventory was 2.9, down from 3.1 in January but up from 2.7 in February 2025.Buyers paid 98% of the asking price in February, unchanged from January and down from 99% year over year.The median sales price of $428,000 was up 0.8% from January and up 0.8% year over year."With spring on the horizon, we started to see the market regain some momentum, particularly in how quickly homes are selling," said Chris Lim, President of REMAX. "For consumers, that means timing, pricing and strategy are becoming increasingly important – and working with an experienced REMAX agent can make all the difference in navigating those decisions."Manchester, NH is showing signs of spring momentum with tight inventory, homes selling in about three weeks and many closing at or above list price. While new listings rose in February, Joe Beauchemin, Broker/Owner of REMAX Synergy in Bedford, NH said demand remains strong and agrees – timing is critical."In a market like Manchester, pricing must be precise. When sellers price their home correctly, it often creates stronger demand and can lead to offers above list price. For buyers, hesitation can be costly. If you see the right home and don't step up quickly, it may be gone by the end of the weekend. That's why it's so important to work with an agent who understands whether a list price is a starting point for the market to build on or overpriced and unrealistic from the start."Highlights and local market results for February include:New Listings
In the 50 metro areas surveyed in February 2026, the number of newly listed homes was down 6.8% compared to February 2025, and down 4.4% compared to January 2026. The markets with the biggest decrease in year-over-year new listings percentage were Trenton, NJ at -43.5%, Philadelphia, PA at -38.2% and Dover, DE at -37.5%. The markets with the biggest year-over-year increase in new listings percentage were Bozeman, MT at +30.9%, Fayetteville, AR at +30.6% and Manchester, NH at +21.3%.New Listings:
5 Markets with the Biggest YoY DecreaseMarketFeb 2026Feb 2025Year-over-Year %
ChangeTrenton, NJ244432-43.5 %Philadelphia, PA4,8607,866-38.2 %Dover, DE203325-37.5 %Baltimore, MD2,5984,140-37.2 %Providence, RI7691,084-29.1 %Closed Transactions
Of the 50 metro areas surveyed in February 2026, the overall number of home sales was down 3.2% compared to February 2025, and up 11.1% compared to January 2026. The markets with the biggest decrease in year-over-year sales percentage were Dover, DE at -26.2%, Providence, RI at -22.4% and Pittsburgh, PA at -10.5%. The markets with the biggest increase in year-over-year sales percentages were Kansas City, MO at +14.6%, Richmond, VA at +10.7% and Tulsa, OK at +10.6%.Closed Transactions:
5 Markets with the Biggest YoY DecreaseMarketFeb 2026Feb 2025Year-over-Year
% ChangeDover, DE107145-26.2 %Providence, RI628809-22.4 %Pittsburgh, PA1,2051,346-10.5 %Boston, MA1,8542,065-10.2 %Minneapolis, MN2,2282,462-9.5 %Median Sales Price – Median of 50 metro area prices
In February 2026, the median of all 50 metro area sales prices was $428,000 up 0.8% from February 2025, and up 0.8% compared to January 2026. The markets with the biggest year-over-year increase in median sales price were Trenton, NJ at +14.3%, Anchorage, AK at +7.3% and St. Louis, MO at +7.1%. The markets with the biggest year-over-year decrease in median sales price were Boston, MA at -4.4%, Denver, CO at -4.0% and Bozeman, MT at -2.9%.Median Sales Price:
5 Markets with the Biggest YoY IncreaseMarketFeb 2026Feb 2025Year-over-Year
% ChangeTrenton, NJ$480,000$420,000+14.3 %Anchorage, AK$418,000$389,500+7.3 %St. Louis, MO$269,900$252,000+7.1 %Manchester, NH$490,000$460,000+6.5 %Cleveland, OH$239,000$225,000+6.2 %Close-to-List Price Ratio – Average of 50 metro area prices
In February 2026, the average close-to-list price ratio of all 50 metro areas in the report was 98%, down from 99% in February 2025 and the same as January 2026. The close-to-list price ratio is calculated by the average value of the sales price divided by the list price for each transaction. When the number is above 100%, the home closed for more than the list price. If it's less than 100%, the home sold for less than the list price. The metro areas with highest close-to-list price ratios were San Francisco, CA at 105.1%, Hartford, CT at 101.9% and Manchester, NH at 100.8%. The metro areas with the lowest close-to-list price ratio were Miami, FL at 93.9%, Houston, TX at 96.0% and New Orleans, LA at 96.2%.Close-to-List Price Ratio:
5 Markets with the Highest Close-to-List Price RatioMarketFeb 2026Feb 2025Year-over-Year
Difference*San Francisco, CA105.1 %104.4 %+0.7 ppHartford, CT101.9 %102.3 %-0.3 ppManchester, NH100.8 %101.0 %-0.3 ppRichmond, VA99.9 %100.1 %-0.2 ppBaltimore, MD99.7 %100.0 %-0.2 pp*Difference displayed as change in percentage pointsDays on Market – Average of 50 metro areas
The average days on market for homes sold in February 2026 was 57, up six days compared to the average in February 2025 (51) and down six days compared to January 2026 (63). Days on market is the number of days between when a home is first listed in an MLS and a sales contract is signed. The metro areas with the biggest year-over-year decrease for days on market averages Bozeman, MT at -27.1% (83 days), Fayetteville, AR at -11.5% (75 days) and Manchester, NH at -11.3% (21 days). The markets with the biggest year-over-year increase for days on market averages were Burlington, VT at +48.7% (53 days), Anchorage, AK at +34.9% (47 days) and Raleigh, NC at +30.7% (68 days).Days on Market:
5 Markets with the Biggest YoY DecreaseMarketFeb 2026Feb 2025Year-over-Year
% ChangeBozeman, MT83113-27.1 %Fayetteville, AR7584-11.5 %Manchester, NH2124-11.3 %Chicago, IL3538-6.8 %Coeur d'Alene, ID7679-4.3 %Months' Supply of Inventory – Average of 50 metro areas
The number of homes for sale in February 2026 was up 7.3% from February 2025 and flat compared to January 2026. Based on the rate of home sales in February 2026, the months' supply of inventory was 2.9, up from 2.7 from February 2025, and down from 3.1 in January 2026. In February 2026, the markets with the highest months' supply of inventory were New Orleans, LA at 6.3, Miami, FL at 6.1 and Honolulu, HI at 5.4. The markets with the lowest months' supply of inventory were Manchester, NH at 1.1, Hartford, CT at 1.3 and Seattle, WA at 1.4.Months' Supply of Inventory:
5 Markets with the Highest Months' Supply of InventoryMarketFeb 2026Feb 2025Year-over-Year
% ChangeNew Orleans, LA6.34.4+44.0 %Miami, FL6.16.8-9.1 %Honolulu, HI5.45.4+0.0 %San Antonio, TX5.05.4-8.0 %Houston, TX4.74.3+10.2 %About the REMAX Network
As one of the leading global real estate franchisors, RE/MAX, LLC is a subsidiary of RE/MAX Holdings (NYSE: RMAX) with more than 145,000 agents in over 8,500 offices and a presence in more than 120 countries and territories. Nobody in the world sells more real estate than REMAX, as measured by residential transaction sides. REMAX was founded in 1973 by Dave and Gail Liniger, with an innovative, entrepreneurial culture affording its agents and franchisees the flexibility to operate their businesses with great independence. REMAX agents have lived, worked and served in their local communities for decades, raising millions of dollars every year for Children's Miracle Network Hospitals® and other charities. To learn more about REMAX, to search home listings or find an agent in your community, please visit www.remax.com. For the latest news about REMAX, please visit news.remax.com.Report Details
The REMAX National Housing Report is distributed monthly on or about the 15th. The Report is based on MLS data for the stated month in 50 metropolitan areas, includes single-family residential property types, and is not annualized. For maximum representation, most of the largest metro areas in the country are represented, and an attempt is made to include at least one metro area in almost every state. Metro areas are defined by the Core Based Statistical Areas (CBSAs) established by the U.S. Office of Management and Budget.Definitions
Closed Transactions are the total number of closed residential transactions during the given month. Months' Supply of Inventory is the total number of residential properties listed for sale at the end of the month (current inventory) divided by the number of sales contracts signed (pending listings) during the month. Where "pending" data is unavailable, an inferred pending status is calculated using closed transactions. Days on Market is the average number of days that pass from the time a property is listed until the property goes under contract. Median Sales Price for a metro area is the median sales price for closed transactions in that metro area. The nationwide Median Sales Price is calculated at the nationwide aggregate level using all sale prices from the included metro areas. The Close-to-List Price Ratio is the average value of the sales price divided by the list price for each closed transaction.MLS data is provided by Constellation. While MLS data is believed to be reliable, it cannot be guaranteed. MLS data is constantly being updated, making any analysis a snapshot at a particular time. Every month, the previous period's data is updated to ensure accuracy over time. Raw data remains the intellectual property of each local MLS organization.
View original content to download multimedia:https://www.prnewswire.com/news-releases/remax-national-housing-report-for-february-2026-302714996.htmlSOURCE RE/MAX, LLC
Original: REMAX NATIONAL HOUSING REPORT FOR FEBRUARY 2026
US Market News
4月前
RE/MAX HOLDINGS, INC. REPORTS FOURTH QUARTER AND FULL YEAR 2025 RESULTSFebruary 19, 2026 4:15 PM
PR Newswire (US)
Total Fourth Quarter Revenue of $71.1 Million, Adjusted EBITDA of $22.4 MillionDENVER, Feb. 19, 2026 /PRNewswire/ --
Fourth Quarter 2025 Highlights
(Compared to fourth quarter 2024 unless otherwise noted)Total Revenue decreased 1.8% to $71.1 millionRevenue excluding the Marketing Funds1 decreased 0.4% to $53.6 million, driven by a negative 0.4% organic revenue growth2 and flat foreign currency movementsNet income attributable to RE/MAX Holdings, Inc. of $1.4 million and income per diluted share (GAAP EPS) of $0.07Adjusted EBITDA3 decreased 4.0% to $22.4 million, Adjusted EBITDA margin3 of 31.5% and Adjusted earnings per diluted share (Adjusted EPS3) of $0.30Total agent count increased 1.4% to 148,660 agentsU.S. and Canada combined agent count decreased 4.6% to 72,977 agentsFull-Year 2025 Highlights
(Compared to full year 2024 unless otherwise noted)Total Revenue decreased 5.2% to $291.6 millionRevenue excluding the Marketing Funds1 decreased 4.3% to $218.8 million, driven by negative 3.9% organic growth2 and adverse foreign currency movements of 0.4%Net income attributable to RE/MAX Holdings, Inc. of $8.2 million and earnings per diluted share (GAAP EPS) of $0.40Adjusted EBITDA3 decreased 4.1% to $93.7 million, Adjusted EBITDA margin3 of 32.1% and Adjusted earnings per diluted share (Adjusted EPS3) of $1.30RE/MAX Holdings, Inc. (the "Company" or "RE/MAX Holdings") (NYSE: RMAX), parent company of REMAX, one of the world's leading franchisors of real estate brokerage services, and Motto Mortgage ("Motto"), the first and only national mortgage brokerage franchise brand in the U.S., today announced operating results for the quarter and year ended December 31, 2025. "Our strategy is working and is beginning to yield results even though 2025 marked the third consecutive year of a historically tough housing market in the United States and Canada. We exited 2025 with strong momentum across both of our networks, driven by record global agent count growth, our best fourth quarter U.S. agent performance since 2021, and a renewed excitement for the REMAX brand given enhancements to our overall value proposition. In January we also saw the largest conversion in our history as nearly 1,200 agents led by visionary entrepreneurs chose to join our market-leading brand in Canada, an exciting start to the year," said Erik Carlson, Chief Executive Officer.Carlson continued, "Engagement throughout REMAX reflects growing enthusiasm for the recent strategic investments in our brand, including our Marketing as a Service and Lead Concierge platforms, reinforcing our confidence as we enter the year ahead. At the same time, we continue to operate the business with discipline, with fourth quarter profit and margin performance at the high end of our expectations. As signs of modest improvement in home sales activity are starting to emerge, we believe our networks are well positioned to capitalize on a recovering market, and we will continue to be laser focused on supporting our networks to win more business, in less time, and more profitably."Fourth Quarter 2025 Operating ResultsAgent CountThe following table compares agent count as of December 31, 2025 and 2024:
As of December 31,
Change
2025
2024
#
%U.S.
48,165
51,286
(3,121)
(6.1)Canada
24,812
25,171
(359)
(1.4)Subtotal
72,977
76,457
(3,480)
(4.6)Outside the U.S. & Canada
75,683
70,170
5,513
7.9Total
148,660
146,627
2,033
1.4RevenueRE/MAX Holdings generated revenue of $71.1 million in the fourth quarter of 2025, a decrease of $1.3 million, or 1.8%, compared to $72.5 million in the fourth quarter of 2024. Revenue excluding the Marketing Funds was $53.6 million in the fourth quarter of 2025, a decrease of $0.2 million, or 0.4%, versus the same period in 2024. The decrease in Revenue excluding the Marketing Funds was attributable to a decline in organic revenue of 0.4%. The decline in organic revenue was driven mainly by a reduction in U.S. agent count and recently introduced incentives related to modifications to the Company's standard fee models, including Aspire, partially offset by an increase in Broker fees due to: (1) the impact of recognizing Broker fees ratably throughout the year in the U.S. and Canada for capped programs like Aspire; (2) an increase in Broker Fees related to modifications to the Company's standard fee models, including Aspire, which resulted in an offsetting decrease to Continuing franchise fees and to a lesser extent Marketing Funds fees; and (3) higher average home sales prices in the U.S., an increase in revenue from marketing as a service ("MaaS") and an increase from advertising revenue on the Company's flagship websites.Recurring revenue streams, which consist of continuing franchise fees and annual dues, decreased $3.2 million, or 8.5%, compared to the fourth quarter of 2024 and accounted for 64.3% of Revenue excluding the Marketing Funds in the fourth quarter of 2025 compared to 69.9% in the prior-year period.Operating ExpensesTotal operating expenses were $61.8 million for the fourth quarter of 2025, a decrease of $6.4 million, or 9.4%, compared to $68.2 million in the fourth quarter of 2024. Fourth quarter 2025 total operating expenses decreased primarily due to lower Settlement and impairment charges, Marketing Funds expenses, and Depreciation and amortization expenses, partially offset by higher Selling, operating and administrative expenses.Selling, operating and administrative expenses were $37.3 million in the fourth quarter of 2025, an increase of $1.6 million, or 4.4%, compared to the fourth quarter of 2024 and represented 69.7% of Revenue excluding the Marketing Funds, compared to 66.5% in the prior-year period. Fourth quarter 2025 Selling, operating and administrative expenses increased primarily due to losses on sale and disposal of assets, increase in expenses from timing of other events, partially offset by a reduction in certain personnel-related expenses.Net Income and GAAP EPSNet income attributable to RE/MAX Holdings was $1.4 million for the fourth quarter of 2025 compared to net income of $5.8 million for the fourth quarter of 2024. Reported basic and diluted GAAP earnings per share were $0.07 each for the fourth quarter of 2025 compared to basic and diluted GAAP earnings per share were $0.31 and $0.29, respectively, for the fourth quarter of 2024.Adjusted EBITDA and Adjusted EPSAdjusted EBITDA was $22.4 million for the fourth quarter of 2025, a decrease of $0.9 million, or 4.0%, compared to the fourth quarter of 2024. Fourth quarter 2025 Adjusted EBITDA decreased due to an increase in certain personnel-related expenses and lower revenue, partially offset by a decrease in bad debt expense. Adjusted EBITDA margin was 31.5% in the fourth quarter of 2025, compared to 32.2% in the fourth quarter of 2024.Adjusted basic and diluted EPS were $0.31 and $0.30 respectively for the fourth quarter of 2025 compared to Adjusted basic and diluted EPS of $0.32 and $0.30, respectively for the fourth quarter of 2024. The ownership structure used to calculate Adjusted basic and diluted EPS for the quarter ended December 31, 2025, assumes RE/MAX Holdings owned 100% of RMCO, LLC ("RMCO"). The weighted average ownership RE/MAX Holdings had in RMCO was 61.5% for the quarter ended December 31, 2025.Balance Sheet As of December 31, 2025, the Company had cash and cash equivalents of $118.7 million, an increase of $22.1 million from December 31, 2024. As of December 31, 2025, the Company had $436.8 million of outstanding debt, net of an unamortized debt discount and issuance costs, compared to $440.8 million as of December 31, 2024.Share Repurchases and RetirementAs previously disclosed, in January 2022 the Company's Board of Directors authorized a common stock repurchase program of up to $100 million. During the three months ending December 31, 2025, the Company did not repurchase any shares. As of December 31, 2025, $62.5 million remained available under the share repurchase program.OutlookThe Company's first quarter and full year 2026 Outlook assumes no further currency movements, acquisitions, or divestitures.For the first quarter of 2026, RE/MAX Holdings expects:Agent count to increase 1.50% to 2.50% over first quarter 2025;Revenue in a range of $69.0 million to $74.0 million (including revenue from the Marketing Funds in a range of $16.0 million to $18.0 million); andAdjusted EBITDA in a range of $14.0 million to $17.0 million.For the full year 2026, the Company now expects:Agent count in a range from 1.50% to positive 3.50% over full year 2025Revenue in a range of $285.0 million to $305.0 million (including revenue from the Marketing Funds in a range of $66.0 million to $70.0 million), andAdjusted EBITDA in a range of $90.0 million to $100.0 million.Webcast and Conference CallThe Company will host a conference call for interested parties on Friday, February 20, 2026, beginning at 8:30 a.m. Eastern Time. Interested parties can register in advance for the conference call using the following link: https://events.q4inc.com/attendee/808192655. Interested parties also can access a live webcast through the Investor Relations section of the Company's website at http://investors.remaxholdings.com. Please dial in or join the webcast 10 minutes before the start of the conference call. An archive of the webcast will be available on the Company's website for a limited time as well.Basis of PresentationUnless otherwise noted, the results presented in this press release are consolidated and exclude adjustments attributable to the non-controlling interest.Footnotes:1Revenue excluding the Marketing Funds is a non-GAAP measure of financial performance that differs from U.S. Generally Accepted Accounting Principles ("U.S. GAAP") and a reconciliation to the most directly comparable U.S. GAAP measure is as follows (in thousands):
Three Months Ended
Year Ended
December 31,
December 31,
2025
2024
2025
2024Revenue excluding the Marketing Funds:
Total revenue
$71,137
$72,467
$291,601
$307,685Less: Marketing Funds fees
17,556
18,652
72,835
78,983Revenue excluding the Marketing Funds
$53,581
$53,815
$218,766
$228,7022The Company defines organic revenue growth as revenue growth from continuing operations excluding (i) revenue from Marketing Funds, (ii) revenue from acquisitions, and (iii) the impact of foreign currency movements. The Company defines revenue from acquisitions as the revenue generated from the date of an acquisition to its second anniversary (excluding Marketing Funds revenue related to acquisitions where applicable).3Adjusted EBITDA, Adjusted EBITDA margin and Adjusted EPS are non-GAAP measures. These terms are defined at the end of this release. Please see Tables 5 and 6 appearing later in this release for reconciliations of these non-GAAP measures to the most directly comparable GAAP measures.About RE/MAX Holdings, Inc.RE/MAX Holdings, Inc. (NYSE: RMAX) is one of the world's leading franchisors in the real estate industry, franchising real estate brokerages globally under the REMAX® brand, and mortgage brokerages within the U.S. under the Motto® Mortgage brand. REMAX was founded in 1973 by Dave and Gail Liniger, with an innovative, entrepreneurial culture affording its agents and franchisees the flexibility to operate their businesses with great independence. Now with more than 145,000 agents in over 8,500 offices and a presence in more than 120 countries and territories, nobody in the world sells more real estate than REMAX, as measured by total residential transaction sides. Dedicated to innovation and change in the real estate industry, RE/MAX Holdings launched Motto Franchising, LLC, a ground-breaking mortgage brokerage franchisor, in 2016. Motto Mortgage, the first and only national mortgage brokerage franchise brand in the U.S., has offices across more than 40 states.Forward-Looking Statements This press release includes "forward-looking statements" within the meaning of the "safe harbor" provisions of the United States Private Securities Litigation Reform Act of 1995. Forward-looking statements are often identified by the use of words such as "believe," "intend," "expect," "estimate," "plan," "outlook," "project," "anticipate," "may," "will," "would" and other similar words and expressions that predict or indicate future events or trends that are not statements of historical matters. Forward-looking statements include statements related to agent count; Motto open offices; franchise sales; revenue; the Company's outlook for the first quarter and full year 2026; non-GAAP financial measures; housing and mortgage market conditions; the Company's commitment to innovation and delivering an elevated experience; enhancing our value proposition; our profitability and margin performance exceeding expectations; our new MaaS platform and economic models and the impact thereof; and our strengthened leadership team. Forward-looking statements should not be read as a guarantee of future performance or results and will not necessarily accurately indicate the times at which such performance or results may be achieved. Forward-looking statements are based on information available at the time those statements are made and/or management's good faith belief as of that time with respect to future events and are subject to risks and uncertainties that could cause actual performance or results to differ materially from those expressed in or suggested by the forward-looking statements. These risks and uncertainties include, without limitation, (1) changes in the real estate market or interest rates and availability of financing, (2) changes in business and economic activity in general, including enacted and proposed tariffs and other trade policies which could impact the global economy, (3) the Company's ability to attract and retain quality franchisees, (4) the Company's franchisees' ability to recruit and retain real estate agents and mortgage loan originators, (5) changes in laws and regulations, (6) the Company's ability to enhance, market, and protect its brands, (7) the Company's ability to implement its technology initiatives, (8) risks related to recent changes in the Company's leadership team, (9) fluctuations in foreign currency exchange rates, (10) the nature and amount of the exclusion of charges in future periods when determining Adjusted EBITDA is subject to uncertainty and may not be similar to such charges in prior periods, and (11) those risks and uncertainties described in the sections entitled "Risk Factors" and "Management's Discussion and Analysis of Financial Condition and Results of Operations" in the most recent Annual Report on Form 10-K and Quarterly Reports on Form 10-Q filed with the Securities and Exchange Commission ("SEC") and similar disclosures in subsequent periodic and current reports filed with the SEC, which are available on the investor relations page of the Company's website at www.remaxholdings.com and on the SEC website at www.sec.gov. Readers are cautioned not to place undue reliance on forward-looking statements, which speak only as of the date on which they are made. Except as required by law, the Company does not intend, and undertakes no obligation, to update this information to reflect future events or circumstances.TABLE 1RE/MAX Holdings, Inc.Consolidated Statements of Income (Loss)(In thousands, except share and per share amounts)(Unaudited)
Three Months Ended
Year Ended
December 31,
December 31,
2025
2024
2025
2024Revenue:
Continuing franchise fees
$27,077
$29,788
$112,865
$122,011Annual dues
7,361
7,843
30,462
32,188Broker fees
13,907
11,657
53,691
51,816Marketing Funds fees
17,556
18,652
72,835
78,983Franchise sales and other revenue
5,236
4,527
21,748
22,687Total revenue
71,137
72,467
291,601
307,685Operating expenses:
Selling, operating and administrative expenses
37,333
35,770
146,702
152,258Marketing Funds expenses
17,556
18,652
72,835
78,983Depreciation and amortization
6,215
7,072
25,848
29,561Settlement and impairment charges
—
5,483
(1,542)
5,483Change in estimated tax receivable agreement liability
715
1,219
715
1,219Total operating expenses
61,819
68,196
244,558
267,504Operating income (loss)
9,318
4,271
47,043
40,181Other expenses, net:
Interest expense
(7,740)
(8,562)
(31,700)
(36,258)Interest income
933
903
3,580
3,738Foreign currency transaction gains (losses)
371
(893)
705
(1,461)Total other expenses, net
(6,436)
(8,552)
(27,415)
(33,981)Income (loss) before provision for income taxes
2,882
(4,281)
19,628
6,200Provision for income taxes
(373)
8,361
(6,195)
1,877Net income (loss)
$2,509
$4,080
$13,433
$8,077Less: net income (loss) attributable to non-controlling interest
1,069
(1,725)
5,280
954Net income (loss) attributable to RE/MAX Holdings, Inc.
$1,440
$5,805
$8,153
$7,123
Net income (loss) attributable to RE/MAX Holdings, Inc. per share
of Class A common stock
Basic
$0.07
$0.31
$0.41
$0.38Diluted
$0.07
$0.29
$0.40
$0.37Weighted average shares of Class A common stock outstanding
Basic
20,078,818
18,921,229
19,845,469
18,780,200Diluted
20,904,332
19,985,471
20,400,048
19,293,827 TABLE 2 RE/MAX Holdings, Inc.Consolidated Balance Sheets(In thousands, except share and per share amounts)(Unaudited)
December 31,
2025
2024Assets
Current assets:
Cash and cash equivalents
$118,736
$96,619Restricted cash
74,332
72,668Accounts and notes receivable, net of allowances
26,944
27,807Income taxes receivable
8,188
7,592Other current assets
11,940
13,825Total current assets
240,140
218,511Property and equipment, net of accumulated depreciation
5,996
7,578Operating lease right of use assets
12,608
17,778Franchise agreements, net
67,080
81,186Other intangible assets, net
10,774
13,382Goodwill
239,572
237,239Income taxes receivable, net of current portion
—
355Other assets, net of current portion
6,305
5,565Total assets
$582,475
$581,594Liabilities and stockholders' equity (deficit)
Current liabilities:
Accounts payable
$3,986
$5,761Accrued liabilities
100,927
110,859Income taxes payable
105
541Deferred revenue
21,391
22,848Debt
4,600
4,600Payable pursuant to tax receivable agreements
1,542
1,537Operating lease liabilities
9,217
8,556Total current liabilities
141,768
154,702Debt, net of current portion
432,151
436,243Deferred tax liabilities
8,193
8,448Deferred revenue, net of current portion
12,859
14,778Operating lease liabilities, net of current portion
13,514
22,669Other liabilities, net of current portion
2,978
3,148Total liabilities
611,463
639,988Commitments and contingencies
Stockholders' equity (deficit):
Class A common stock, par value $.0001 per share, 180,000,000 shares authorized; 20,095,180
and 18,971,435 shares issued and outstanding as of December 31, 2025 and 2024, respectively
2
2Class B common stock, par value $.0001 per share, 1,000 shares authorized; 1 share issued
and outstanding as of December 31, 2025 and 2024, respectively
—
—Additional paid-in capital
578,429
565,072Accumulated deficit
(126,072)
(133,727)Accumulated other comprehensive income (deficit), net of tax
54
(1,864)Total stockholders' equity attributable to RE/MAX Holdings, Inc.
452,413
429,483Non-controlling interest
(481,401)
(487,877)Total stockholders' equity (deficit)
(28,988)
(58,394)Total liabilities and stockholders' equity (deficit)
$582,475
$581,594
TABLE 3RE/MAX Holdings, Inc.Consolidated Statements of Cash Flows(In thousands)(Unaudited)
Year Ended December 31,
2025
2024
2023Cash flows from operating activities:
Net income (loss)
$13,433
$8,077
$(98,486)Adjustments to reconcile net income (loss) to operating cash flows:
Depreciation and amortization
25,848
29,561
32,414Equity-based compensation expense
16,627
18,855
19,536Bad debt expense
3,278
1,359
6,784Deferred income tax expense (benefit)
(455)
(2,102)
49,387Fair value adjustments to contingent consideration
(109)
(225)
(533)Non-cash settlement and impairment charges
401
5,483
73,783Net settlement payments
(5,581)
—
—Non-cash debt charges
880
863
860Payment of contingent consideration in excess of acquisition date fair value
—
(360)
—Change in estimated tax receivable agreement liability
763
1,219
(25,298)Other, net
1,134
(30)
468Changes in operating assets and liabilities
Accounts and notes receivable, net of allowances
(3,941)
7,505
(8,442)Payments pursuant to tax receivable agreements
(757)
(504)
(440)Income taxes receivable/payable
(314)
(6,505)
298Deferred revenue, current and noncurrent
(3,516)
(2,870)
(5,432)Other assets and liabilities
(6,813)
(674)
(16,635)Net cash provided by operating activities
40,878
59,652
28,264Cash flows from investing activities:
Purchases of property, equipment and capitalization of software
(7,374)
(6,622)
(6,419)Other
(408)
746
776Net cash used in investing activities
(7,782)
(5,876)
(5,643)Cash flows from financing activities:
Payments on debt
(4,600)
(4,600)
(4,600)Debt amendment costs
(245)
—
—Distributions paid to non-controlling unitholders
—
—
(8,655)Dividends and dividend equivalents paid to Class A common stockholders
(498)
(599)
(13,553)Payments related to tax withholding for share-based compensation
(4,589)
(3,075)
(4,367)Common shares repurchased
—
—
(3,408)Payment of contingent consideration
(791)
—
(1,234)Other financing
(27)
1
—Net cash used in financing activities
(10,750)
(8,273)
(35,817)Effect of exchange rate changes on cash
1,435
(1,979)
831Net decrease in cash, cash equivalents and restricted cash
23,781
43,524
(12,365)Cash, cash equivalents and restricted cash, beginning of period
169,287
125,763
138,128Cash, cash equivalents and restricted cash, end of period
$193,068
$169,287
$125,763 TABLE 4RE/MAX Holdings, Inc.Agent Count(Unaudited)
As of
December 31,
September 30,
June 30,
March 31,
December 31,
September 30,
June 30,
March 31,
December 31,
2025
2025
2025
2025
2024
2024
2024
2024
2023Agent Count:
U.S.
Company-Owned Regions
41,998
42,935
43,363
43,543
44,911
46,283
46,780
47,302
48,401Independent Regions
6,167
6,243
6,306
6,311
6,375
6,525
6,626
6,617
6,730U.S. Total
48,165
49,178
49,669
49,854
51,286
52,808
53,406
53,919
55,131Canada
Company-Owned Regions
19,803
20,045
20,060
20,227
20,311
20,515
20,347
20,151
20,270Independent Regions
5,009
4,975
4,906
4,929
4,860
4,878
4,846
4,885
4,898Canada Total
24,812
25,020
24,966
25,156
25,171
25,393
25,193
25,036
25,168U.S. and Canada Total
72,977
74,198
74,635
75,010
76,457
78,201
78,599
78,955
80,299Outside U.S. and Canada
Independent Regions
75,683
73,349
72,438
71,116
70,170
67,282
64,943
64,332
64,536Outside U.S. and Canada Total
75,683
73,349
72,438
71,116
70,170
67,282
64,943
64,332
64,536Total
148,660
147,547
147,073
146,126
146,627
145,483
143,542
143,287
144,835 TABLE 5RE/MAX Holdings, Inc.Adjusted EBITDA Reconciliation to Net Income (Loss)(In thousands, except percentages)(Unaudited)
Three Months Ended
Year Ended
December 31,
December 31,
2025
2024
2025
2024
Net income (loss)
$2,509
$4,080
$13,433
$8,077
Depreciation and amortization
6,215
7,072
25,848
29,561
Interest expense
7,740
8,562
31,700
36,258
Interest income
(933)
(903)
(3,580)
(3,738)
Provision for income taxes
373
(8,361)
6,195
(1,877)
EBITDA
15,904
10,450
73,596
68,281
Settlement and impairment charges (1)
—
5,483
(1,542)
5,483
Equity-based compensation expense
4,314
4,412
16,627
18,855
Fair value adjustments to contingent consideration (2)
(25)
75
(109)
(225)
Restructuring charges (3)
(200)
1,286
2,536
1,227
Change in estimated tax receivable agreement liability (4)
715
1,219
715
1,219
Other adjustments (5)
1,692
416
1,898
2,860
Adjusted EBITDA (6)
$22,400
$23,341
$93,721
$97,700
Adjusted EBITDA Margin (6)
31.5%
32.2%
32.1%
31.8%
(1)During 2025, the Company recorded a cost recovery in connection with a previous settlement, that was received in the fourth quarter of 2025 from an escrow fund from a prior acquisition. This was partially offset by the settlement of an immaterial legal matter and an impairment recognized on an office lease in Canada. During 2024, represents the settlements of certain industry class-action lawsuits and other legal settlements.(2)Fair value adjustments to contingent consideration include amounts recognized for changes in the estimated fair value of the contingent consideration liabilities.(3)During 2025 and 2024, the Company restructured its support services to further enhance the overall customer experience.(4)Change in estimated tax receivable agreement liability is the result of a valuation allowance on deferred tax assets.(5)Other adjustments are primarily made up of losses on disposal of assets in 2025 and employee retention related expenses from the Company's CEO transition in 2024.(6)Non-GAAP measure. See the end of this press release for definitions of non-GAAP measures. TABLE 6RE/MAX Holdings, Inc.Adjusted Net Income (Loss) and Adjusted Earnings per Share(In thousands, except share and per share amounts)(Unaudited)
Three Months Ended
Year Ended
December 31,
December 31,
2025
2024
2025
2024Net income (loss)
$2,509
$4,080
$13,433
$8,077Amortization of acquired intangible assets
4,217
4,621
17,440
19,706Provision for income taxes
373
(8,361)
6,195
(1,877)Add-backs:
Settlement and impairment charges (1)
—
5,483
(1,542)
5,483Equity-based compensation expense
4,314
4,412
16,627
18,855Fair value adjustments to contingent consideration (2)
(25)
75
(109)
(225)Restructuring charges (3)
(200)
1,286
2,536
1,227Change in estimated tax receivable agreement liability (4)
715
1,219
715
1,219Other adjustments (5)
1,692
416
1,898
2,860Adjusted pre-tax net income
13,595
13,231
57,193
55,325Less: Provision for income taxes at 25% (6)
(3,398)
(3,307)
(14,298)
(13,831)Adjusted net income (7)
$10,197
$9,924
$42,895
$41,494
Total basic pro forma shares outstanding
32,638,418
31,480,829
32,405,069
31,339,800Total diluted pro forma shares outstanding
33,463,932
32,545,071
32,959,648
31,853,427
Adjusted net income basic earnings per share (7)
$0.31
$0.32
$1.32
$1.32Adjusted net income diluted earnings per share (7)
$0.30
$0.30
$1.30
$1.30
(1)During 2025, the Company recorded a cost recovery in connection with a previous settlement, that was received in the fourth quarter of 2025 from an escrow fund from a prior acquisition. This was partially offset by the settlement of an immaterial legal matter and an impairment recognized on an office lease in Canada. During 2024, represents the settlements of certain industry class-action lawsuits and other legal settlements.(2)Fair value adjustments to contingent consideration include amounts recognized for changes in the estimated fair value of the contingent consideration liabilities.(3)During 2025 and 2024, the Company restructured its support services to further enhance the overall customer experience.(4)Change in estimated tax receivable agreement liability is the result of a valuation allowance on deferred tax assets.(5)Other adjustments are primarily made up of losses on disposal of assets in 2025 and employee retention related expenses from the Company's CEO transition in 2024.(6)The long-term tax rate assumes the exchange of all outstanding non-controlling interest partnership units for Class A Common Stock that (a) removes the impact of unusual, non-recurring tax matters and (b) does not estimate the residual impacts to foreign taxes of additional step-ups in tax basis from an exchange because that is dependent on stock prices at the time of such exchange and the calculation is impracticable.(7)Non-GAAP measure. See the end of this press release for definitions of non-GAAP measures. TABLE 7RE/MAX Holdings, Inc.Pro Forma Shares Outstanding(Unaudited)
Three Months Ended
Year Ended
December 31,
December 31,
2025
2024
2025
2024Total basic weighted average shares outstanding:
Weighted average shares of Class A common stock outstanding
20,078,818
18,921,229
19,845,469
18,780,200Remaining equivalent weighted average shares of stock
outstanding on a pro forma basis assuming RE/MAX Holdings
owned 100% of RMCO
12,559,600
12,559,600
12,559,600
12,559,600Total basic pro forma weighted average shares outstanding
32,638,418
31,480,829
32,405,069
31,339,800
Total diluted weighted average shares outstanding:
Weighted average shares of Class A common stock outstanding
20,078,818
18,921,229
19,845,469
18,780,200Remaining equivalent weighted average shares of stock
outstanding on a pro forma basis assuming RE/MAX Holdings
owned 100% of RMCO
12,559,600
12,559,600
12,559,600
12,559,600Dilutive effect of unvested restricted stock units (1)
825,514
1,064,242
554,579
513,627Total diluted pro forma weighted average shares outstanding
33,463,932
32,545,071
32,959,648
31,853,427
(1)In accordance with the treasury stock method. TABLE 8RE/MAX Holdings, Inc.Adjusted Free Cash Flow & Unencumbered Cash(Unaudited)
Year Ended
December 31,
2025
2024Cash flow from operations
$40,878
$59,652Less: Purchases of property, equipment and capitalization of software
(7,374)
(6,622)(Increases) decreases in restricted cash of the Marketing Funds (1)
(1,664)
(2,028)Adjusted free cash flow (2)
31,840
51,002
Adjusted free cash flow (2)
31,840
51,002Less: Tax/Other non-dividend distributions to RIHI
—
—Adjusted free cash flow after tax/non-dividend distributions to RIHI (2)
31,840
51,002
Adjusted free cash flow after tax/non-dividend distributions to RIHI (2)
31,840
51,002Less: Debt principal payments
(4,600)
(4,600)Unencumbered cash generated (2)
$27,240
$46,402
Summary
Cash flow from operations
$40,878
$59,652Adjusted free cash flow (2)
$31,840
$51,002Adjusted free cash flow after tax/non-dividend distributions to RIHI (2)
$31,840
$51,002Unencumbered cash generated (2)
$27,240
$46,402
Adjusted EBITDA (2)
$93,721
$97,700Adjusted free cash flow as % of Adjusted EBITDA (2)
34.0 %
52.2 %Adjusted free cash flow less distributions to RIHI as % of Adjusted EBITDA (2)
34.0 %
52.2 %Unencumbered cash generated as % of Adjusted EBITDA (2)
29.1 %
47.5 %
(1)This line reflects any subsequent changes in the restricted cash balance (which under GAAP reflects as either (a) an increase or decrease in cash flow from operations or (b) an incremental amount of purchases of property and equipment and capitalization of developed software) to remove the impact of changes in restricted cash in determining adjusted free cash flow.(2)Non-GAAP measure. See the end of this press release for definitions of non-GAAP measures.Non-GAAP Financial Measures The SEC has adopted rules to regulate the use in filings with the SEC and in public disclosures of financial measures that are not in accordance with U.S. GAAP, such as Revenue excluding the Marketing Funds, Adjusted EBITDA and the ratios related thereto, Adjusted net income (loss), Adjusted basic and diluted earnings per share (Adjusted EPS) and adjusted free cash flow. These measures are derived based on methodologies other than in accordance with U.S. GAAP.Revenue excluding the Marketing Funds is calculated directly from our consolidated financial statements as Total revenue less Marketing Funds fees.The Company defines Adjusted EBITDA as EBITDA (consolidated net income before depreciation and amortization, interest expense, interest income and the provision for income taxes, each of which is presented in the unaudited consolidated financial statements included earlier in this press release), adjusted for the impact of the following items that are either non-cash or that the Company does not consider representative of its ongoing operating performance: loss or gain on sale or disposition of assets, settlement and impairment charges, equity-based compensation expense, acquisition-related expense, gain on reduction in tax receivable agreement liability, expense or income related to changes in the estimated fair value measurement of contingent consideration, restructuring charges and other non-recurring items. Adjusted EBITDA margin represents Adjusted EBITDA as a percentage of revenue.Because Adjusted EBITDA and Adjusted EBITDA margin omit certain non-cash items and other non-recurring cash charges or other items, the Company believes that each measure is less susceptible to variances that affect its operating performance resulting from depreciation, amortization and other non-cash and non-recurring cash charges or other items. The Company presents Adjusted EBITDA and the related Adjusted EBITDA margin because the Company believes they are useful as supplemental measures in evaluating the performance of its operating businesses and provides greater transparency into the Company's results of operations. The Company's management uses Adjusted EBITDA and Adjusted EBITDA margin as factors in evaluating the performance of the business.Adjusted EBITDA and Adjusted EBITDA margin have limitations as analytical tools, and you should not consider these measures in isolation or as a substitute for analyzing the Company's results as reported under U.S. GAAP. Some of these limitations are:these measures do not reflect changes in, or cash requirements for, the Company's working capital needs;these measures do not reflect the Company's interest expense, or the cash requirements necessary to service interest or principal payments on its debt;these measures do not reflect the Company's income tax expense or the cash requirements to pay its taxes;these measures do not reflect the cash requirements to pay dividends to stockholders of the Company's Class A common stock and tax and other cash distributions to its non-controlling unitholders;these measures do not reflect the cash requirements pursuant to the tax receivable agreements;these measures do not reflect the cash requirements for share repurchases;these measures do not reflect the cash requirements for the settlements of certain industry class-action lawsuits and other legal settlements;although depreciation and amortization are non-cash charges, the assets being depreciated and amortized will often require replacement in the future, and these measures do not reflect any cash requirements for such replacements;although equity-based compensation is a non-cash charge, the issuance of equity-based awards may have a dilutive impact on earnings per share; andother companies may calculate these measures differently so similarly named measures may not be comparable.The Company's Adjusted EBITDA guidance does not include certain charges and costs. The adjustments to EBITDA in future periods are generally expected to be similar to the kinds of charges and costs excluded from Adjusted EBITDA in prior quarters, such as gain or loss on sale or disposition of assets, settlement and impairment charges, equity-based compensation expense, acquisition-related expense, gains or losses from changes in the tax receivable agreement liability, expense or income related to changes in the fair value measurement of contingent consideration, restructuring charges and other non-recurring items. The exclusion of these charges and costs in future periods will have a significant impact on the Company's Adjusted EBITDA. The Company is not able to provide a reconciliation of the Company's non-GAAP financial guidance to the corresponding U.S. GAAP measures without unreasonable effort because of the uncertainty and variability of the nature and amount of these future charges and costs.Adjusted net income (loss) is calculated as Net income (loss) attributable to RE/MAX Holdings, assuming the full exchange of all outstanding non-controlling interests for shares of Class A common stock as of the beginning of the period (and the related increase to the provision for income taxes after such exchange), plus primarily non-cash items and other items that management does not consider to be useful in assessing the Company's operating performance (e.g., amortization of acquired intangible assets, gain on sale or disposition of assets, non-cash impairment charges, acquisition-related expense, restructuring charges and equity-based compensation expense). Adjusted basic and diluted earnings per share (Adjusted EPS) are calculated as Adjusted net income (loss) (as defined above) divided by pro forma (assuming the full exchange of all outstanding non-controlling interests) basic and diluted weighted average shares, as applicable.When used in conjunction with GAAP financial measures, Adjusted net income (loss) and Adjusted EPS are supplemental measures of operating performance that management believes are useful measures to evaluate the Company's performance relative to the performance of its competitors as well as performance period over period. By assuming the full exchange of all outstanding non-controlling interests, management believes these measures:facilitate comparisons with other companies that do not have a low effective tax rate driven by a non-controlling interest on a pass-through entity;facilitate period over period comparisons because they eliminate the effect of changes in Net income attributable to RE/MAX Holdings, Inc. driven by increases in its ownership of RMCO, LLC, which are unrelated to the Company's operating performance; andeliminate primarily non-cash and other items that management does not consider to be useful in assessing the Company's operating performance.Adjusted free cash flow is calculated as cash flows from operations less capital expenditures and any changes in restricted cash of the Marketing Funds, all as reported under GAAP, and quantifies how much cash a company has to pursue opportunities that enhance shareholder value. The restricted cash of the Marketing Funds is limited in use for the benefit of franchisees and any impact to adjusted free cash flow is removed. The Company believes adjusted free cash flow is useful to investors as a supplemental measure as it calculates the cash flow available for working capital needs, re-investment opportunities, potential Independent Region and strategic acquisitions, dividend payments or other strategic uses of cash.Adjusted free cash flow after tax and non-dividend distributions to RIHI, Inc. ("RIHI"), an entity majority owned and controlled by David Liniger, our Chairman and Co-Founder, and by Gail Liniger, our Vice Chair Emerita and Co-Founder, is calculated as adjusted free cash flow less tax and other non-dividend distributions paid to RIHI (the non-controlling interest holder) to enable RIHI to satisfy its income tax obligations. Similar payments would be made by the Company directly to federal and state taxing authorities as a component of the Company's consolidated provision for income taxes if a full exchange of non-controlling interests occurred in the future. As a result and given the significance of the Company's ongoing tax and non-dividend distribution obligations to its non-controlling interest, adjusted free cash flow after tax and non-dividend distributions, when used in conjunction with GAAP financial measures, provides a meaningful view of cash flow available to the Company to pursue opportunities that enhance shareholder value.Unencumbered cash generated is calculated as adjusted free cash flow after tax and non-dividend distributions to RIHI less quarterly debt principal payments less annual excess cash flow payment on debt, as applicable. Given the significance of the Company's excess cash flow payment on debt, when applicable, unencumbered cash generated, when used in conjunction with GAAP financial measures, provides a meaningful view of the cash flow available to the Company to pursue opportunities that enhance shareholder value after considering its debt service obligations.
View original content to download multimedia:https://www.prnewswire.com/news-releases/remax-holdings-inc-reports-fourth-quarter-and-full-year-2025-results-302692961.htmlSOURCE RE/MAX Holdings, Inc.
Original: RE/MAX HOLDINGS, INC. REPORTS FOURTH QUARTER AND FULL YEAR 2025 RESULTS
US Market News
4月前
REMAX NATIONAL HOUSING REPORT FOR JANUARY 2026February 17, 2026 4:24 PM
PR Newswire (US)
January Resets Housing Market with Surge in New Listings and Seasonal Dip in SalesDENVER, Feb. 17, 2026 /PRNewswire/ -- January experienced the U.S. housing market's typical annual reset, delivering the lowest sales of the last 12 months alongside the largest month-to-month increase in new listings.
Home sales fell 32.0% from December – and 6.0% from January 2025 – while new listings jumped 61.8% month over month and finished 3.8% below last year. Across the 52 metro areas surveyed, inventory was essentially unchanged from December (-0.1%) but was 10.9% higher year over year, marking the 25th consecutive month of year-over-year increases.Compared to the four previous Januaries, last month posted:Most days on market at 62 days, up from 61 in December and 56 a year ago. (Past Januaries: 2024: 47 days, 2023: 51 days, and 2022: 36 days.)One of the highest number of months' supply of inventory at 3.1 months, down from 3.5 in December but above 2.8 a year ago. (Past Januaries: 2024: 2.1 months, 2023: 2.0 months and 2022: 1.1 months.)The median sales price of $425,000 was 2.0% lower than December and 1.0% higher year over year. Buyers paid an average of 98% of the asking price, unchanged from both December 2025 and January 2025."In a month that is traditionally slow, inventory was higher than it was a year ago, and new listings came to market, giving buyers more options," said REMAX CEO Erik Carlson. "Even as sales adjusted seasonally, the fundamentals point to a market that continues moving toward balance. With the guidance of an experienced professional, consumers can make smart, strategic decisions in today's environment – and that's a good place to be as we head further into 2026."Among the 52 metro areas surveyed, Denver, Colorado, experienced both an increase in new listings (up 4.8% year over year and 155.4% month over month) and a decline in closed transactions (down 14.0% from a year ago and down 36.0% from last month) – a combination that shows a shift in local activity.Christine Dupont-Patz, Broker Associate/Co-owner of REMAX of Cherry Creek in Denver, said some of the swings reflect seasonal and cultural patterns. "Many of the January listings weren't truly 'new' – some sellers simply took their homes off the market during the holidays for a refresh or a break from showings. And in Denver, buyer activity tends to pick up after the NFL Denver Broncos' season ends. Their winning streak gave some people a reason to pause their home search. Now, with our unusually warm winter, we're expecting an early spring market with increased activity."Highlights and local market results for January include:New Listings
In the 52 metro areas surveyed in January 2026, the number of newly listed homes was down 3.8% compared to January 2025, and up 61.8% compared to December 2025. The markets with the biggest decrease in year-over-year new listings percentage were Dover, DE at -42.4%, Philadelphia, PA at -33.0% and Baltimore, MD at -28.2%. The markets with the biggest year-over-year increase in new listings percentage were Kansas City, MO at +19.4%, Birmingham, AL at +16.3%, and Cincinnati, OH at +11.3%.New Listings:
5 Markets with the Biggest YoY DecreaseMarketJan 2026 Jan 2025 Year-over-Year
% ChangeDover, DE190330-42.4 %Philadelphia, PA 5,1517,684-33.0 %Baltimore, MD2,8553,975-28.2 %Trenton, NJ316427-26.0 %Washington, DC5,9667,986-25.3 %Closed Transactions
Of the 52 metro areas surveyed in January 2026, the overall number of home sales was down 6.0% compared to January 2025, and down 32.0% compared to December 2025. The markets with the biggest decrease in year-over-year sales percentage were Minneapolis, MN at -16.4%, Hartford, CT at -14.8% and Denver, CO at -14.0%. The markets with the biggest increase in year-over-year sales percentages were Wichita, KS at +24.7%, New Orleans, LA at +23.7%, and Manchester, NH at +15.5%.Closed Transactions:
5 Markets with the Biggest YoY DecreaseMarketJan 2026 Jan 2025 Year-over-Year
% ChangeMinneapolis, MN 2,0202,415-16.4 %Hartford, CT660775-14.8 %Denver, CO2,0022,329-14.0 %Cleveland, OH1,1381,312-13.3 %San Antonio, TX1,7181,976-13.1 %Median Sales Price – Median of 52 metro area prices
In January 2026, the median of all 52 metro area sales prices was $425,000 up 1.0% from January 2025, and down 2.0% compared to December 2025. The markets with the biggest year-over-year increase in median sales price were Milwaukee, WI at +12.7%, Trenton, NJ at +10.0%, and Philadelphia, PA at +8.6%. The markets with the biggest year-over-year decrease in median sales price were Bozeman, MT at -8.5%, Seattle, WA at -5.6%, and Raleigh, NC at -5.5%.Median Sales Price:
5 Markets with the Biggest YoY IncreaseMarketJan 2026 Jan 2025 Year-over-Year
% ChangeMilwaukee, WI$355,000$314,900+12.7 %Trenton, NJ$450,000$409,000+10.0 %Philadelphia, PA $380,000$350,000+8.6 %Cleveland, OH$230,000$214,500+7.2 %Providence, RI$490,000$459,450+6.6 %Close-to-List Price Ratio – Average of 52 metro area prices
In January 2026, the average close-to-list price ratio of all 52 metro areas in the report was 98%, the same as January 2025 and December 2025. The close-to-list price ratio is calculated by the average value of the sales price divided by the list price for each transaction. When the number is above 100%, the home closed for more than the list price. If it's less than 100%, the home sold for less than the list price. The metro areas with highest close-to-list price ratios were San Francisco, CA at 101.3%, Hartford, CT at 101.0%, and Manchester, NH at 100.7%. The metro areas with the lowest close-to-list price ratio were Miami, FL at 93.3%, Houston, TX at 95.9%, and New Orleans, LA at 96.0%.Close-to-List Price Ratio:
5 Markets with the Highest Close-to-List Price RatioMarketJan 2026 Jan 2025 Year-over-Year
Difference*San Francisco, CA 101.3 %100.9 %+0.4 ppHartford, CT101.0 %101.2 %-0.2 ppManchester, NH100.7 %100.0 %+0.8 ppBurlington, VT100.4 %99.4 %+1.0 ppTrenton, NJ99.7 %99.3 %+0.3 pp*Difference displayed as change in percentage pointsDays on Market – Average of 52 metro areas
The average days on market for homes sold in January 2026 was 62, up six days compared to the average in January 2025 (56) and up one day compared to December 2025 (61). Days on market is the number of days between when a home is first listed in an MLS and a sales contract is signed. The metro areas with the biggest year-over-year increase for days on market averages were Dover, DE at +28.4% (60 days), Washington, DC at +27.7% (48 days), and Manchester, NH at +26.1% (31 days). The markets with the biggest year-over-year decrease for days on market averages were Fayetteville, AR at -13.8% (73 days), Burlington, VT at -8.6% (50 days), and Cincinnati, OH at -3.2% (45 days).Days on Market:
5 Markets with the Biggest YoY IncreaseMarketJan 2026 Jan 2025 Year-over-Year
% ChangeDover, DE6047+28.4 %Washington, DC 4838+27.7 %Manchester, NH3125+26.1 %Charlotte, NC7055+25.8 %Trenton, NJ5343+23.3 %Months' Supply of Inventory – Average of 52 metro areas
The number of homes for sale in January 2026 was up 10.9% from January 2025, and down 0.1% from December 2025. Based on the rate of home sales in January 2026, the months' supply of inventory was 3.1, up from 2.8 from January 2025, and down from 3.5 in December 2025. In January 2026, the markets with the highest months' supply of inventory were Miami, FL at 7.0, San Antonio, TX at 5.9, and New Orleans, LA at 5.6. The markets with the lowest months' supply of inventory were Manchester, NH at 1.2, Hartford, CT and Albuquerque, NM tied at 1.4, and Seattle, WA at 1.5.Months' Supply of Inventory:
5 Markets with the Highest Months' Supply of Inventory MarketJan 2026 Jan 2025 Year-over-Year
% ChangeMiami, FL7.07.2-2.3 %San Antonio, TX5.95.0+18.3 %New Orleans, LA5.65.4+5.0 %Honolulu, HI5.35.4-1.5 %Houston, TX5.24.6+11.6 %About the REMAX Network
As one of the leading global real estate franchisors, RE/MAX, LLC is a subsidiary of RE/MAX Holdings (NYSE: RMAX) with more than 145,000 agents in over 8,500 offices and a presence in more than 120 countries and territories. Nobody in the world sells more real estate than REMAX, as measured by residential transaction sides. REMAX was founded in 1973 by Dave and Gail Liniger, with an innovative, entrepreneurial culture affording its agents and franchisees the flexibility to operate their businesses with great independence. REMAX agents have lived, worked and served in their local communities for decades, raising millions of dollars every year for Children's Miracle Network Hospitals® and other charities. To learn more about REMAX, to search home listings or find an agent in your community, please visit www.remax.com. For the latest news about REMAX, please visit news.remax.com.Report Details
The REMAX National Housing Report is distributed monthly on or about the 15th. The Report is based on MLS data for the stated month in 52 metropolitan areas, includes single-family residential property types, and is not annualized. For maximum representation, most of the largest metro areas in the country are represented, and an attempt is made to include at least one metro area in almost every state. Metro areas are defined by the Core Based Statistical Areas (CBSAs) established by the U.S. Office of Management and Budget.Definitions
Closed Transactions are the total number of closed residential transactions during the given month. Months' Supply of Inventory is the total number of residential properties listed for sale at the end of the month (current inventory) divided by the number of sales contracts signed (pending listings) during the month. Where "pending" data is unavailable, an inferred pending status is calculated using closed transactions. Days on Market is the average number of days that pass from the time a property is listed until the property goes under contract. Median Sales Price for a metro area is the median sales price for closed transactions in that metro area. The nationwide Median Sales Price is calculated at the nationwide aggregate level using all sale prices from the included metro areas. The Close-to-List Price Ratio is the average value of the sales price divided by the list price for each closed transaction.MLS data is provided by Constellation. While MLS data is believed to be reliable, it cannot be guaranteed. MLS data is constantly being updated, making any analysis a snapshot at a particular time. Every month, the previous period's data is updated to ensure accuracy over time. Raw data remains the intellectual property of each local MLS organization.
View original content to download multimedia:https://www.prnewswire.com/news-releases/remax-national-housing-report-for-january-2026-302689939.htmlSOURCE RE/MAX, LLC
Original: REMAX NATIONAL HOUSING REPORT FOR JANUARY 2026
 Hot Features


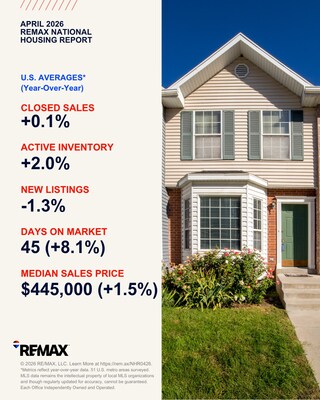

 RealGenius
10年前
RealGenius
10年前

 メールアドレスで登録


