LANDSTAR SYSTEM INC 021-238 false 0000853816 0000853816 2024-07-30 2024-07-30
UNITED STATES
SECURITIES AND EXCHANGE COMMISSION
Washington, D.C. 20549
FORM 8-K
Current Report
Pursuant to Section 13 or 15(d)
of the Securities Exchange Act of 1934
Date of Report (Date of earliest event reported) July 30, 2024

LANDSTAR SYSTEM, INC.
(Exact name of registrant as specified in its charter)
|
|
|
|
|
| Delaware |
|
021238 |
|
06-1313069 |
| (State or other jurisdiction of incorporation) |
|
(Commission File Number) |
|
(I.R.S. Employer Identification No.) |
|
|
|
| 13410 Sutton Park Drive South, Jacksonville, Florida |
|
32224 |
| (Address of principal executive offices) |
|
(Zip Code) |
(904) 398-9400
(Registrant’s telephone number, including area code)
N/A
(Former name or former address, if changed since last report)
Check the appropriate box below if the Form 8-K filing is intended to simultaneously satisfy the filing obligation of the registrant under any of the following provisions:
| ☐ |
Written communications pursuant to Rule 425 under the Securities Act (17 CFR 230.425) |
| ☐ |
Soliciting material pursuant to Rule 14a-12 under the Exchange Act (17 CFR 240.14a-12) |
| ☐ |
Pre-commencement communications pursuant to Rule 14d-2(b) under the Exchange Act (17 CFR 240.14d-2(b)) |
| ☐ |
Pre-commencement communications pursuant to Rule 13e-4(c) under the Exchange Act (17 CFR 240.13e-4(c)) |
Securities registered pursuant to Section 12(b) of the Act:
|
|
|
|
|
| Title of each class |
|
Trading
Symbol(s) |
|
Name of each exchange on which registered |
| Common Stock |
|
LSTR |
|
NASDAQ |
Indicate by check mark whether the registrant is an emerging growth company as defined in Rule 405 of the Securities Act of 1933 (§230.405 of this chapter) or Rule 12b-2 of the Securities Exchange Act of 1934 (§240.12b-2 of this chapter).
Emerging growth company ☐
If an emerging growth company, indicate by check mark if the registrant has elected not to use the extended transition period for complying with any new or revised financial accounting standards provided pursuant to Section 13(a) of the Exchange Act. ☐
| Item 2.02 |
Results of Operations and Financial Condition |
On July 30, 2024, Landstar System, Inc. (“Landstar” or the “Company”) issued a press release announcing results for the second quarter of fiscal 2024. A copy of the press release is attached hereto as Exhibit 99.1.
The information contained in Item 7.01 concerning the presentation to Landstar investors is hereby incorporated into this Item 2.02 by reference.
The information furnished under Item 2.02 of this Current Report on Form 8-K, including Exhibit 99.1 hereto, shall not be deemed “filed” for purposes of Section 18 of the Securities Exchange Act of 1934, nor shall it be deemed incorporated by reference in any filing under the Securities Act of 1933.
| Item 7.01 |
Regulation FD Disclosure |
A slide presentation, dated July 30, 2024, is attached hereto as Exhibit 99.2 and is incorporated herein by reference. The slide presentation provides information that may be referred to by the Company on its conference call with investors scheduled to occur on July 30, 2024 in connection with the Company’s release of results for the second quarter of fiscal 2024.
The information furnished under Item 7.01 of this Current Report on Form 8-K, including Exhibit 99.2 hereto, shall not be deemed “filed” for purposes of Section 18 of the Securities Exchange Act of 1934, nor shall it be deemed incorporated by reference in any filing under the Securities Act of 1933.
| Item 9.01 |
Financial Statements and Exhibits |
SIGNATURES
Pursuant to the requirements of the Securities Exchange Act of 1934, the Registrant has duly caused this report to be signed on its behalf by the undersigned hereunto duly authorized.
|
|
|
|
|
|
|
|
|
|
|
LANDSTAR SYSTEM, INC. |
|
|
|
|
| Date: July 30, 2024 |
|
|
|
By: |
|
/s/ James P. Todd |
|
|
|
|
Name: |
|
James P. Todd |
|
|
|
|
Title: |
|
Vice President, Chief Financial Officer and Assistant Secretary |
Exhibit 99.1

|
|
|
| For Immediate Release |
|
July 30, 2024 |
LANDSTAR SYSTEM REPORTS SECOND QUARTER
REVENUE OF $1.225B AND EARNINGS PER SHARE OF $1.48
AND ANNOUNCES 9% INCREASE TO QUARTERLY DIVIDEND
Jacksonville, FL—Landstar System, Inc. (NASDAQ: LSTR) (“Landstar” or the “Company”) today reported basic and diluted earnings per
share (“EPS”) of $1.48 in the 2024 second quarter on revenue of $1.225 billion. “The Landstar network of independent business owners performed admirably in a challenging freight transportation environment,” said Landstar
President and Chief Executive Officer Frank Lonegro. “During the second quarter, we were encouraged to see our first sequential quarter-to-quarter revenue increase
since the 2022 second quarter. Revenue in the 2024 second quarter grew 5% sequentially following seven quarters of sequential revenue declines. As we look to build on that momentum, we continue to invest in leading-edge technology and new trailing
equipment. We are particularly proud of the efforts of the thousands of BCOs, agents and employees in our network, who work each day to improve our safety performance and deliver great service to our customers.”
Landstar continues to return meaningful amounts of capital to stockholders through the Company’s stock purchase program and dividends. During the 2024
second quarter, Landstar purchased approximately 316,000 shares of its common stock at an aggregate cost of $57.0 million. The Company is currently authorized to purchase up to an additional 2,684,000 shares of the Company’s common stock
under its longstanding share purchase program. Landstar also announced today that its Board of Directors declared a quarterly dividend of $0.36 per share payable on September 10, 2024, to stockholders of record as of the close of business on
August 20, 2024. This quarterly dividend includes a $0.03 per share increase, or 9%, over the amount of the Company’s regular quarterly dividend declared following each of the prior four quarters.
LANDSTAR SYSTEM/2
|
|
|
|
|
|
|
|
|
| |
|
2Q 2024 |
|
|
2Q 2023 |
|
| Revenue |
|
$ |
1,225,005 |
|
|
$ |
1,373,857 |
|
| Gross profit |
|
$ |
119,996 |
|
|
$ |
139,706 |
|
| Variable contribution |
|
$ |
175,131 |
|
|
$ |
198,182 |
|
| Operating income |
|
$ |
68,059 |
|
|
$ |
87,950 |
|
| Basic and diluted earnings per share |
|
$ |
1.48 |
|
|
$ |
1.85 |
|
| (1) |
Dollars above in thousands, except per share amounts |
| (2) |
Please refer to the Consolidated Statements of Income and Reconciliation of Gross Profit to Variable
Contribution included below |
Total revenue was $1,225 million in the 2024 second quarter, compared to $1,374 million in the
2023 second quarter. Truck transportation revenue hauled by independent business capacity owners (“BCOs”) and truck brokerage carriers in the 2024 second quarter was $1,106 million, or 90% of revenue, compared to $1,247 million,
or 91% of revenue, in the 2023 second quarter. Truckload transportation revenue hauled via van equipment in the 2024 second quarter was $619 million, compared to $703 million in the 2023 second quarter. Truckload transportation revenue
hauled via unsided/platform equipment in the 2024 second quarter was $381 million, compared to $395 million in the 2023 second quarter. Revenue from other truck transportation, which is largely related to power-only services, in the 2024
second quarter was $78 million, compared to $118 million in the 2023 second quarter. Revenue hauled by rail, air and ocean cargo carriers was $94 million, or 8% of revenue, in the 2024 second quarter, compared to
$101 million, or 7% of revenue, in the 2023 second quarter.
The number of loads hauled via truck declined 8.9% in the 2024 second quarter as
compared to the 2023 second quarter, at the low end of the Company’s guidance included in its 2024 first quarter earnings release slide presentation, dated April 25, 2024. Truck revenue per load declined 2.6% in the 2024 second quarter as
compared to the 2023 second quarter, slightly below the mid-point of the Company’s previously provided guidance.
Gross profit in the 2024 second quarter was $120 million and variable contribution (defined as revenue less the cost of purchased transportation and
commissions to agents) in the 2024 second quarter was $175 million. Gross profit in the 2023 second quarter was $140 million and variable contribution in the 2023 second quarter was $198 million. Reconciliations of gross profit to
variable contribution and gross profit margin to variable contribution margin for the 2024 and 2023 second quarters and year-to-date periods are provided in the
Company’s accompanying financial disclosures.
LANDSTAR SYSTEM/3
The Company’s balance sheet continues to be very strong, with cash and short-term investments of
approximately $504 million as of June 29, 2024. Trailing twelve-month return on average shareholders’ equity was 22%, and return on invested capital, representing net income divided by the sum of average
equity plus average debt, was 20%.
Landstar will provide a live webcast of its quarterly earnings conference call this evening at 5:00 p.m. ET. To
access the webcast, visit www.investor.landstar.com; click on “Webcasts,” then click on “Landstar’s Second Quarter 2024 Earnings Release Conference Call.” A slide presentation to accompany the webcast presentation is also
available on Landstar’s investor relations website at https://investor.landstar.com/.
Contact:
Jim Todd
Chief Financial Officer
904-398-9400
About Landstar:
Landstar System, Inc., is a
technology-enabled, asset-light provider of integrated transportation management solutions delivering safe, specialized transportation services to a broad range of customers utilizing a network of agents, third-party capacity providers and
employees. Landstar transportation services companies are certified to ISO 9001:2015 quality management system standards and RC14001:2015 environmental, health, safety and security management system standards. Landstar System, Inc. is headquartered
in Jacksonville, Florida. Its common stock trades on The NASDAQ Stock Market® under the symbol LSTR.
LANDSTAR SYSTEM/4
Non-GAAP Financial Measures:
In this earnings release and accompanying financial disclosures, the Company provides the following information that may be deemed a non-GAAP financial measure: variable contribution and variable contribution margin. The Company believes variable contribution and variable contribution margin are useful measures of the variable costs that we incur
at a shipment-by-shipment level attributable to our transportation network of third-party capacity providers and independent agents in order to provide services to our
customers. The Company also believes that it is appropriate to present each of the financial measures that may be deemed a non-GAAP financial measure, as referred to above, for the following reasons:
(1) disclosure of these matters will allow investors to better understand the underlying trends in the Company’s financial condition and results of operations; (2) this information will facilitate comparisons by investors of the
Company’s results as compared to the results of peer companies; and (3) management considers this financial information in its decision making.
Forward Looking Statements Disclaimer:
The
following is a “safe harbor” statement under the Private Securities Litigation Reform Act of 1995. Statements contained in this press release that are not based on historical facts are “forward-looking statements.” This press
release contains forward-looking statements, such as statements which relate to Landstar’s business objectives, plans, strategies and expectations. Terms such as “anticipates,” “believes,” “estimates,”
“intention,” “expects,” “plans,” “predicts,” “may,” “should,” “could,” “will,” the negative thereof and similar expressions are intended to identify forward-looking
statements. Such statements are by nature subject to uncertainties and risks, including but not limited to: an increase in the frequency or severity of accidents or other claims; unfavorable development of existing accident claims; dependence on
third party insurance companies; dependence on independent commission sales agents; dependence on third party capacity providers; the impact of the Russian conflict with Ukraine on the operations of certain independent commission sales agents,
including the Company’s largest such agent by revenue in the 2023 fiscal year; decreased demand for transportation services; U.S. trade relationships; substantial industry competition; disruptions or failures in the Company’s computer
systems; cyber and other information security incidents; dependence on key vendors; potential changes in taxes; status of independent contractors; regulatory and legislative changes; regulations focused on diesel emissions and other air quality
matters; regulations requiring the purchase and use of zero-emission vehicles; intellectual property; and other operational, financial or legal risks or
LANDSTAR SYSTEM/5
uncertainties detailed in Landstar’s Form 10-K for the 2023 fiscal year, described in Item 1A Risk Factors, and in other SEC filings from time to
time. These risks and uncertainties could cause actual results or events to differ materially from historical results or those anticipated. Investors should not place undue reliance on such forward-looking statements, and the Company undertakes no
obligation to publicly update or revise any forward-looking statements.
LANDSTAR SYSTEM/6
Landstar System, Inc. and Subsidiary
Consolidated Statements of Income
(Dollars in thousands, except per share amounts)
(Unaudited)
|
|
|
|
|
|
|
|
|
|
|
|
|
|
|
|
|
| |
|
Twenty-Six Weeks Ended |
|
|
Thirteen Weeks Ended |
|
| |
|
June 29, |
|
|
July 1, |
|
|
June 29, |
|
|
July 1, |
|
| |
|
2024 |
|
|
2023 |
|
|
2024 |
|
|
2023 |
|
| Revenue |
|
$ |
2,396,048 |
|
|
$ |
2,809,532 |
|
|
$ |
1,225,005 |
|
|
$ |
1,373,857 |
|
| Investment income |
|
|
7,066 |
|
|
|
3,852 |
|
|
|
3,654 |
|
|
|
2,484 |
|
| Costs and expenses: |
|
|
|
|
|
|
|
|
|
|
|
|
|
|
|
|
| Purchased transportation |
|
|
1,855,579 |
|
|
|
2,154,491 |
|
|
|
950,058 |
|
|
|
1,053,197 |
|
| Commissions to agents |
|
|
197,098 |
|
|
|
248,153 |
|
|
|
99,816 |
|
|
|
122,478 |
|
| Other operating costs, net of gains on asset sales/dispositions |
|
|
28,994 |
|
|
|
25,840 |
|
|
|
14,135 |
|
|
|
13,462 |
|
| Insurance and claims |
|
|
53,432 |
|
|
|
57,431 |
|
|
|
27,164 |
|
|
|
29,784 |
|
| Selling, general and administrative |
|
|
111,361 |
|
|
|
108,096 |
|
|
|
54,939 |
|
|
|
54,529 |
|
| Depreciation and amortization |
|
|
28,630 |
|
|
|
30,139 |
|
|
|
14,488 |
|
|
|
14,941 |
|
|
|
|
|
|
|
|
|
|
|
|
|
|
|
|
|
|
| Total costs and expenses |
|
|
2,275,094 |
|
|
|
2,624,150 |
|
|
|
1,160,600 |
|
|
|
1,288,391 |
|
|
|
|
|
|
|
|
|
|
|
|
|
|
|
|
|
|
| Operating income |
|
|
128,020 |
|
|
|
189,234 |
|
|
|
68,059 |
|
|
|
87,950 |
|
| Interest and debt (income) expense |
|
|
(3,286 |
) |
|
|
(1,033 |
) |
|
|
(1,675 |
) |
|
|
(307 |
) |
|
|
|
|
|
|
|
|
|
|
|
|
|
|
|
|
|
| Income before income taxes |
|
|
131,306 |
|
|
|
190,267 |
|
|
|
69,734 |
|
|
|
88,257 |
|
| Income taxes |
|
|
31,586 |
|
|
|
45,513 |
|
|
|
17,110 |
|
|
|
21,698 |
|
|
|
|
|
|
|
|
|
|
|
|
|
|
|
|
|
|
| Net income |
|
$ |
99,720 |
|
|
$ |
144,754 |
|
|
$ |
52,624 |
|
|
$ |
66,559 |
|
|
|
|
|
|
|
|
|
|
|
|
|
|
|
|
|
|
| Basic and diluted earnings per share |
|
$ |
2.79 |
|
|
$ |
4.03 |
|
|
$ |
1.48 |
|
|
$ |
1.85 |
|
|
|
|
|
|
|
|
|
|
|
|
|
|
|
|
|
|
| Average basic and diluted shares outstanding |
|
|
35,702,000 |
|
|
|
35,962,000 |
|
|
|
35,654,000 |
|
|
|
35,941,000 |
|
|
|
|
|
|
|
|
|
|
|
|
|
|
|
|
|
|
| Dividends per common share |
|
$ |
0.66 |
|
|
$ |
0.60 |
|
|
$ |
0.33 |
|
|
$ |
0.30 |
|
|
|
|
|
|
|
|
|
|
|
|
|
|
|
|
|
|
LANDSTAR SYSTEM/7
Landstar System, Inc. and Subsidiary
Consolidated Balance Sheets
(Dollars in thousands, except per share amounts)
(Unaudited)
|
|
|
|
|
|
|
|
|
| |
|
June 29, |
|
|
December 30, |
|
| |
|
2024 |
|
|
2023 |
|
| ASSETS |
|
|
|
|
|
|
|
|
| Current assets: |
|
|
|
|
|
|
|
|
| Cash and cash equivalents |
|
$ |
438,062 |
|
|
$ |
481,043 |
|
| Short-term investments |
|
|
65,959 |
|
|
|
59,661 |
|
| Trade accounts receivable, less allowance of $11,697 and $11,738 |
|
|
724,479 |
|
|
|
743,762 |
|
| Other receivables, including advances to independent contractors, less allowance of $15,974 and
$14,010 |
|
|
42,117 |
|
|
|
43,339 |
|
| Other current assets |
|
|
44,568 |
|
|
|
24,936 |
|
|
|
|
|
|
|
|
|
|
| Total current assets |
|
|
1,315,185 |
|
|
|
1,352,741 |
|
|
|
|
|
|
|
|
|
|
| Operating property, less accumulated depreciation and amortization of $449,364 and
$436,682 |
|
|
285,995 |
|
|
|
284,300 |
|
| Goodwill |
|
|
41,607 |
|
|
|
42,275 |
|
| Other assets |
|
|
112,417 |
|
|
|
122,530 |
|
|
|
|
|
|
|
|
|
|
| Total assets |
|
$ |
1,755,204 |
|
|
$ |
1,801,846 |
|
|
|
|
|
|
|
|
|
|
| LIABILITIES AND SHAREHOLDERS’ EQUITY |
|
|
|
|
|
|
|
|
| Current liabilities: |
|
|
|
|
|
|
|
|
| Cash overdraft |
|
$ |
58,358 |
|
|
$ |
61,541 |
|
| Accounts payable |
|
|
401,535 |
|
|
|
395,980 |
|
| Current maturities of long-term debt |
|
|
27,980 |
|
|
|
27,876 |
|
| Insurance claims |
|
|
42,677 |
|
|
|
41,825 |
|
| Dividends payable |
|
|
— |
|
|
|
71,433 |
|
| Other current liabilities |
|
|
75,168 |
|
|
|
76,569 |
|
|
|
|
|
|
|
|
|
|
| Total current liabilities |
|
|
605,718 |
|
|
|
675,224 |
|
|
|
|
|
|
|
|
|
|
| Long-term debt, excluding current maturities |
|
|
45,397 |
|
|
|
43,264 |
|
| Insurance claims |
|
|
59,862 |
|
|
|
58,922 |
|
| Deferred income taxes and other non-current
liabilities |
|
|
43,415 |
|
|
|
40,513 |
|
| Shareholders’ equity: |
|
|
|
|
|
|
|
|
| Common stock, $0.01 par value, authorized 160,000,000 shares, issued 68,553,927 and
68,497,324 |
|
|
686 |
|
|
|
685 |
|
| Additional paid-in capital |
|
|
256,084 |
|
|
|
254,642 |
|
| Retained earnings |
|
|
2,859,786 |
|
|
|
2,783,645 |
|
| Cost of 33,102,276 and 32,780,651 shares of common stock in treasury |
|
|
(2,106,266 |
) |
|
|
(2,048,184 |
) |
| Accumulated other comprehensive loss |
|
|
(9,478 |
) |
|
|
(6,865 |
) |
|
|
|
|
|
|
|
|
|
| Total shareholders’ equity |
|
|
1,000,812 |
|
|
|
983,923 |
|
|
|
|
|
|
|
|
|
|
| Total liabilities and shareholders’ equity |
|
$ |
1,755,204 |
|
|
$ |
1,801,846 |
|
|
|
|
|
|
|
|
|
|
LANDSTAR SYSTEM/8
Landstar System, Inc. and Subsidiary
Supplemental Information
(Unaudited)
|
|
|
|
|
|
|
|
|
|
|
|
|
|
|
|
|
| |
|
Twenty-Six Weeks Ended |
|
|
Thirteen Weeks Ended |
|
| |
|
June 29, |
|
|
July 1, |
|
|
June 29, |
|
|
July 1, |
|
| |
|
2024 |
|
|
2023 |
|
|
2024 |
|
|
2023 |
|
| Revenue generated through (in thousands): |
|
|
|
|
|
|
|
|
|
|
|
|
|
|
|
|
| Truck transportation |
|
|
|
|
|
|
|
|
|
|
|
|
|
|
|
|
| Truckload: |
|
|
|
|
|
|
|
|
|
|
|
|
|
|
|
|
| Van equipment |
|
$ |
1,247,244 |
|
|
$ |
1,458,124 |
|
|
$ |
618,940 |
|
|
$ |
703,041 |
|
| Unsided/platform equipment |
|
|
723,995 |
|
|
|
772,336 |
|
|
|
380,950 |
|
|
|
394,772 |
|
| Less-than-truckload |
|
|
53,707 |
|
|
|
62,673 |
|
|
|
28,090 |
|
|
|
31,115 |
|
| Other truck transportation (1) |
|
|
149,675 |
|
|
|
277,520 |
|
|
|
77,709 |
|
|
|
118,017 |
|
|
|
|
|
|
|
|
|
|
|
|
|
|
|
|
|
|
| Total truck transportation |
|
|
2,174,621 |
|
|
|
2,570,653 |
|
|
|
1,105,689 |
|
|
|
1,246,945 |
|
| Rail intermodal |
|
|
45,002 |
|
|
|
50,889 |
|
|
|
22,307 |
|
|
|
25,232 |
|
| Ocean and air cargo carriers |
|
|
125,380 |
|
|
|
136,534 |
|
|
|
71,306 |
|
|
|
75,441 |
|
| Other (2) |
|
|
51,045 |
|
|
|
51,456 |
|
|
|
25,703 |
|
|
|
26,239 |
|
|
|
|
|
|
|
|
|
|
|
|
|
|
|
|
|
|
|
|
$ |
2,396,048 |
|
|
$ |
2,809,532 |
|
|
$ |
1,225,005 |
|
|
$ |
1,373,857 |
|
|
|
|
|
|
|
|
|
|
|
|
|
|
|
|
|
|
| Revenue on loads hauled via BCO Independent Contractors (3) included in total truck transportation |
|
$ |
918,071 |
|
|
$ |
1,034,881 |
|
|
$ |
465,510 |
|
|
$ |
515,355 |
|
| Number of loads: |
|
|
|
|
|
|
|
|
|
|
|
|
|
|
|
|
| Truck transportation |
|
|
|
|
|
|
|
|
|
|
|
|
|
|
|
|
| Truckload: |
|
|
|
|
|
|
|
|
|
|
|
|
|
|
|
|
| Van equipment |
|
|
599,973 |
|
|
|
655,036 |
|
|
|
300,959 |
|
|
|
323,082 |
|
| Unsided/platform equipment |
|
|
244,407 |
|
|
|
263,185 |
|
|
|
126,460 |
|
|
|
135,613 |
|
| Less-than-truckload |
|
|
82,850 |
|
|
|
93,066 |
|
|
|
42,617 |
|
|
|
46,874 |
|
| Other truck transportation (1) |
|
|
71,440 |
|
|
|
110,373 |
|
|
|
37,914 |
|
|
|
52,311 |
|
|
|
|
|
|
|
|
|
|
|
|
|
|
|
|
|
|
| Total truck transportation |
|
|
998,670 |
|
|
|
1,121,660 |
|
|
|
507,950 |
|
|
|
557,880 |
|
| Rail intermodal |
|
|
14,380 |
|
|
|
15,390 |
|
|
|
7,230 |
|
|
|
7,630 |
|
| Ocean and air cargo carriers |
|
|
17,240 |
|
|
|
16,750 |
|
|
|
8,520 |
|
|
|
8,310 |
|
|
|
|
|
|
|
|
|
|
|
|
|
|
|
|
|
|
|
|
|
1,030,290 |
|
|
|
1,153,800 |
|
|
|
523,700 |
|
|
|
573,820 |
|
|
|
|
|
|
|
|
|
|
|
|
|
|
|
|
|
|
| Loads hauled via BCO Independent Contractors (3)
included in total truck transportation |
|
|
422,300 |
|
|
|
463,910 |
|
|
|
213,560 |
|
|
|
231,360 |
|
| Revenue per load: |
|
|
|
|
|
|
|
|
|
|
|
|
|
|
|
|
| Truck transportation |
|
|
|
|
|
|
|
|
|
|
|
|
|
|
|
|
| Truckload: |
|
|
|
|
|
|
|
|
|
|
|
|
|
|
|
|
| Van equipment |
|
$ |
2,079 |
|
|
$ |
2,226 |
|
|
$ |
2,057 |
|
|
$ |
2,176 |
|
| Unsided/platform equipment |
|
|
2,962 |
|
|
|
2,935 |
|
|
|
3,012 |
|
|
|
2,911 |
|
| Less-than-truckload |
|
|
648 |
|
|
|
673 |
|
|
|
659 |
|
|
|
664 |
|
| Other truck transportation (1) |
|
|
2,095 |
|
|
|
2,514 |
|
|
|
2,050 |
|
|
|
2,256 |
|
| Total truck transportation |
|
|
2,178 |
|
|
|
2,292 |
|
|
|
2,177 |
|
|
|
2,235 |
|
| Rail intermodal |
|
|
3,129 |
|
|
|
3,307 |
|
|
|
3,085 |
|
|
|
3,307 |
|
| Ocean and air cargo carriers |
|
|
7,273 |
|
|
|
8,151 |
|
|
|
8,369 |
|
|
|
9,078 |
|
| Revenue per load on loads hauled via BCO Independent Contractors (3) |
|
$ |
2,174 |
|
|
$ |
2,231 |
|
|
$ |
2,180 |
|
|
$ |
2,228 |
|
| Revenue by capacity type (as a % of total revenue): |
|
|
|
|
|
|
|
|
|
|
|
|
|
|
|
|
| Truck capacity providers: |
|
|
|
|
|
|
|
|
|
|
|
|
|
|
|
|
| BCO Independent Contractors (3) |
|
|
38 |
% |
|
|
37 |
% |
|
|
38 |
% |
|
|
38 |
% |
| Truck Brokerage Carriers |
|
|
52 |
% |
|
|
55 |
% |
|
|
52 |
% |
|
|
53 |
% |
| Rail intermodal |
|
|
2 |
% |
|
|
2 |
% |
|
|
2 |
% |
|
|
2 |
% |
| Ocean and air cargo carriers |
|
|
5 |
% |
|
|
5 |
% |
|
|
6 |
% |
|
|
5 |
% |
| Other |
|
|
2 |
% |
|
|
2 |
% |
|
|
2 |
% |
|
|
2 |
% |
|
|
|
|
|
| |
|
|
|
|
|
|
|
June 29, |
|
|
July 1, |
|
| |
|
|
|
|
|
|
|
2024 |
|
|
2023 |
|
| Truck Capacity Providers |
|
|
|
|
|
|
|
|
|
|
|
|
|
|
|
|
| BCO Independent Contractors (3) |
|
|
|
|
|
|
|
|
|
|
8,385 |
|
|
|
9,748 |
|
|
|
|
|
|
|
|
|
|
|
|
|
|
|
|
|
|
| Truck Brokerage Carriers: |
|
|
|
|
|
|
|
|
|
|
|
|
|
|
|
|
| Approved and active (4) |
|
|
|
|
|
|
|
|
|
|
45,382 |
|
|
|
58,303 |
|
| Other approved |
|
|
|
|
|
|
|
|
|
|
25,450 |
|
|
|
29,503 |
|
|
|
|
|
|
|
|
|
|
|
|
|
|
|
|
|
|
|
|
|
|
|
|
|
|
|
|
|
70,832 |
|
|
|
87,806 |
|
|
|
|
|
|
|
|
|
|
|
|
|
|
|
|
|
|
| Total available truck capacity providers |
|
|
|
|
|
|
|
|
|
|
79,217 |
|
|
|
97,554 |
|
|
|
|
|
|
|
|
|
|
|
|
|
|
|
|
|
|
| Trucks provided by BCO Independent Contractors
(3) |
|
|
|
|
|
|
|
|
|
|
9,180 |
|
|
|
10,548 |
|
| (1) |
Includes power-only, expedited, straight truck, cargo van, and miscellaneous other truck transportation revenue
generated by the transportation logistics segment. Power-only refers to shipments where the Company furnishes a power unit and an operator but not trailing equipment, which is typically provided by the shipper or consignee. |
| (2) |
Includes primarily reinsurance premium revenue generated by the insurance segment and intra-Mexico
transportation services revenue generated by Landstar Metro. |
| (3) |
BCO Independent Contractors are independent contractors who provide truck capacity to the Company under
exclusive lease arrangements. |
| (4) |
Active refers to Truck Brokerage Carriers who moved at least one load in the 180 days immediately preceding the
fiscal quarter end. |
LANDSTAR SYSTEM/9
Landstar System, Inc. and Subsidiary
Reconciliation of Gross Profit to Variable Contribution
(Dollars in thousands)
(Unaudited)
|
|
|
|
|
|
|
|
|
|
|
|
|
|
|
|
|
| |
|
Twenty-Six Weeks Ended |
|
|
Thirteen Weeks Ended |
|
| |
|
June 29, 2024 |
|
|
July 1, 2023 |
|
|
June 29, 2024 |
|
|
July 1, 2023 |
|
| Revenue |
|
$ |
2,396,048 |
|
|
$ |
2,809,532 |
|
|
$ |
1,225,005 |
|
|
$ |
1,373,857 |
|
| Costs of revenue: |
|
|
|
|
|
|
|
|
|
|
|
|
|
|
|
|
| Purchased transportation |
|
|
1,855,579 |
|
|
|
2,154,491 |
|
|
|
950,058 |
|
|
|
1,053,197 |
|
| Commissions to agents |
|
|
197,098 |
|
|
|
248,153 |
|
|
|
99,816 |
|
|
|
122,478 |
|
|
|
|
|
|
|
|
|
|
|
|
|
|
|
|
|
|
| Variable costs of revenue |
|
|
2,052,677 |
|
|
|
2,402,644 |
|
|
|
1,049,874 |
|
|
|
1,175,675 |
|
| Trailing equipment depreciation |
|
|
13,834 |
|
|
|
16,519 |
|
|
|
6,937 |
|
|
|
8,150 |
|
| Information technology costs (1) |
|
|
11,986 |
|
|
|
13,493 |
|
|
|
6,182 |
|
|
|
6,742 |
|
| Insurance-related costs (2) |
|
|
54,659 |
|
|
|
58,382 |
|
|
|
27,881 |
|
|
|
30,122 |
|
| Other operating costs |
|
|
28,994 |
|
|
|
25,840 |
|
|
|
14,135 |
|
|
|
13,462 |
|
|
|
|
|
|
|
|
|
|
|
|
|
|
|
|
|
|
| Other costs of revenue |
|
|
109,473 |
|
|
|
114,234 |
|
|
|
55,135 |
|
|
|
58,476 |
|
|
|
|
|
|
|
|
|
|
|
|
|
|
|
|
|
|
| Total costs of revenue |
|
|
2,162,150 |
|
|
|
2,516,878 |
|
|
|
1,105,009 |
|
|
|
1,234,151 |
|
|
|
|
|
|
|
|
|
|
|
|
|
|
|
|
|
|
| Gross profit |
|
$ |
233,898 |
|
|
$ |
292,654 |
|
|
$ |
119,996 |
|
|
$ |
139,706 |
|
|
|
|
|
|
|
|
|
|
|
|
|
|
|
|
|
|
| Gross profit margin |
|
|
9.8 |
% |
|
|
10.4 |
% |
|
|
9.8 |
% |
|
|
10.2 |
% |
| Plus: other costs of revenue |
|
|
109,473 |
|
|
|
114,234 |
|
|
|
55,135 |
|
|
|
58,476 |
|
|
|
|
|
|
|
|
|
|
|
|
|
|
|
|
|
|
| Variable contribution |
|
$ |
343,371 |
|
|
$ |
406,888 |
|
|
$ |
175,131 |
|
|
$ |
198,182 |
|
|
|
|
|
|
|
|
|
|
|
|
|
|
|
|
|
|
| Variable contribution margin |
|
|
14.3 |
% |
|
|
14.5 |
% |
|
|
14.3 |
% |
|
|
14.4 |
% |
| (1) |
Includes costs of revenue incurred related to internally developed software including ASC 350-40 amortization, implementation costs, hosting costs and other support costs utilized to support the Company’s independent commission sales agents, third party capacity providers, and customers, included as
a portion of depreciation and amortization and of selling, general and administrative in the Company’s Consolidated Statements of Income. |
| (2) |
Primarily includes (i) insurance premiums paid for commercial auto liability, general liability, cargo and
other lines of coverage related to the transportation of freight; (ii) the related cost of claims incurred under those programs; and (iii) brokerage commissions and other fees incurred relating to the administration of insurance programs available
to BCO Independent Contractors that are reinsured by the Company, which are included in selling, general and administrative in the Company’s Consolidated Statements of Income. |

Exhibit 99.2 Landstar System, Inc. 2Q 2024 Earnings Conference Call
Date

2Q 2024 Forward-Looking Statements Disclaimer The following is a
“safe harbor” statement under the Private Securities Litigation Reform Act of 1995. Statements made in this slide presentation that are not based on historical facts are “forward-looking statements.” This presentation may
make certain statements containing forward-looking statements, such as statements which relate to Landstar’s business objectives, plans, strategies and expectations. Such statements are by nature subject to uncertainties and risks, including
but not limited to: the operational, financial or legal risks or uncertainties detailed in Landstar’s Form 10-K for the 2023 fiscal year, described in the section Risk Factors, and other SEC filings from time to time. These risks and
uncertainties could cause actual results or events to differ materially from historical results or those anticipated. Investors should not place undue reliance on such forward-looking statements, and the Company undertakes no obligation to publicly
update or revise any forward-looking statements. 2
2Q 2024 Non-GAAP Financial Measures In this slide presentation, the
Company provides the following information that may be deemed a non-GAAP financial measure: variable contribution, variable contribution margin and operating income as a percentage of variable contribution. Management believes variable contribution
and variable contribution margin are useful measures of the variable costs that we incur at a shipment- by-shipment level attributable to our transportation network of third-party capacity providers and independent agents in order to provide
services to our customers. Management believes that operating income as a percentage of variable contribution is a useful measure as: (i) variable costs of revenue for a significant portion of the Company’s business are highly influenced by
short-term market-based trends in the freight transportation industry, whereas other costs, including other costs of revenue, are much less impacted by short-term freight market trends; and (ii) this measure is meaningful to investors’
evaluations of the Company’s management of costs attributable to operations other than the purely variable costs associated with purchased transportation and commissions to agents that the Company incurs to provide services to our customers.
Management also believes that it is appropriate to present each of the financial measures that may be deemed a non-GAAP financial measure, as referred to above, for the following reasons: (1) disclosure of these matters will allow investors to
better understand the underlying trends in the Company’s financial condition and results of operations; (2) this information will facilitate comparisons by investors of the Company’s results as compared to the results of peer companies;
and (3) management considers this financial information in its decision making. A tabulation of the expenses identified as costs of revenue as well as a reconciliation of gross profit to variable contribution and gross profit margin to variable
contribution margin for the 2024 and 2023 second quarters and year-to-date periods is included in this slide presentation within the Appendix. 3
2Q 2024 Executive Summary Frank Lonegro Chief Executive Officer
4
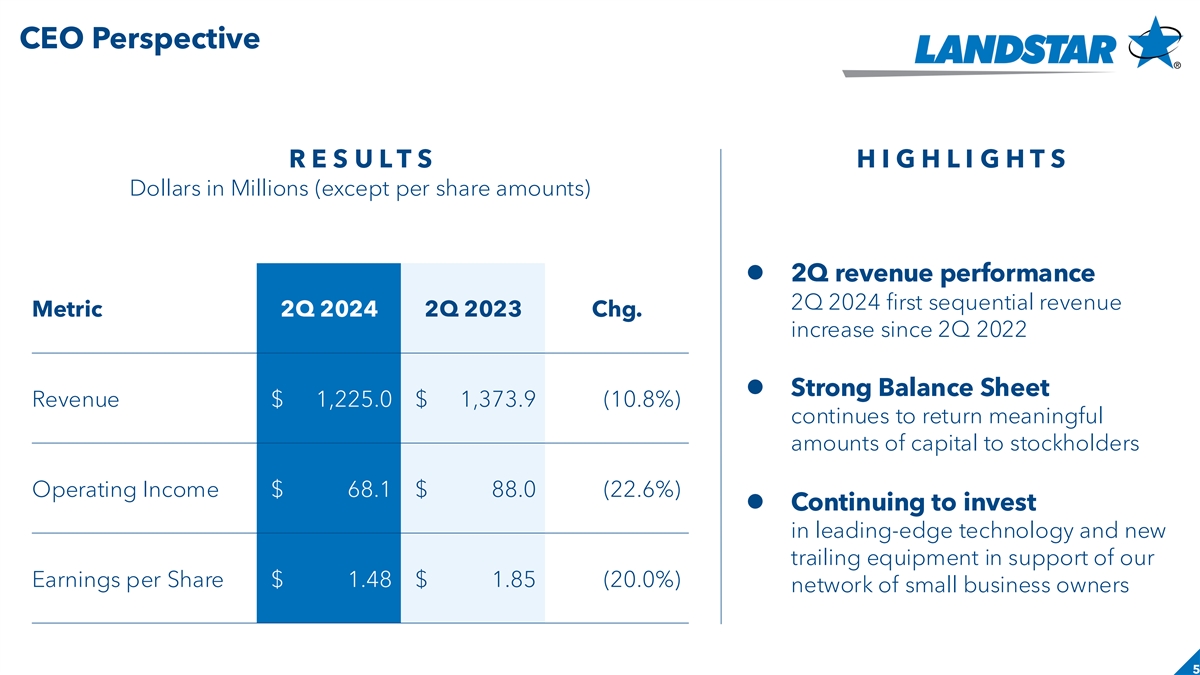
CEO Perspective Slide header R E S U L T S H I G H L I G H T S Dollars
in Millions (except per share amounts) ⚫ 2Q revenue performance 2Q 2024 first sequential revenue Metric 2Q 2024 2Q 2023 Chg. increase since 2Q 2022 ⚫ Strong Balance Sheet Revenue $ 1,225.0 $ 1,373.9 (10.8%) continues to return meaningful
amounts of capital to stockholders Operating Income $ 68.1 $ 88.0 (22.6%) ⚫ Continuing to invest in leading-edge technology and new trailing equipment in support of our Earnings per Share $ 1.48 $ 1.85 (20.0%) network of small business owners
5
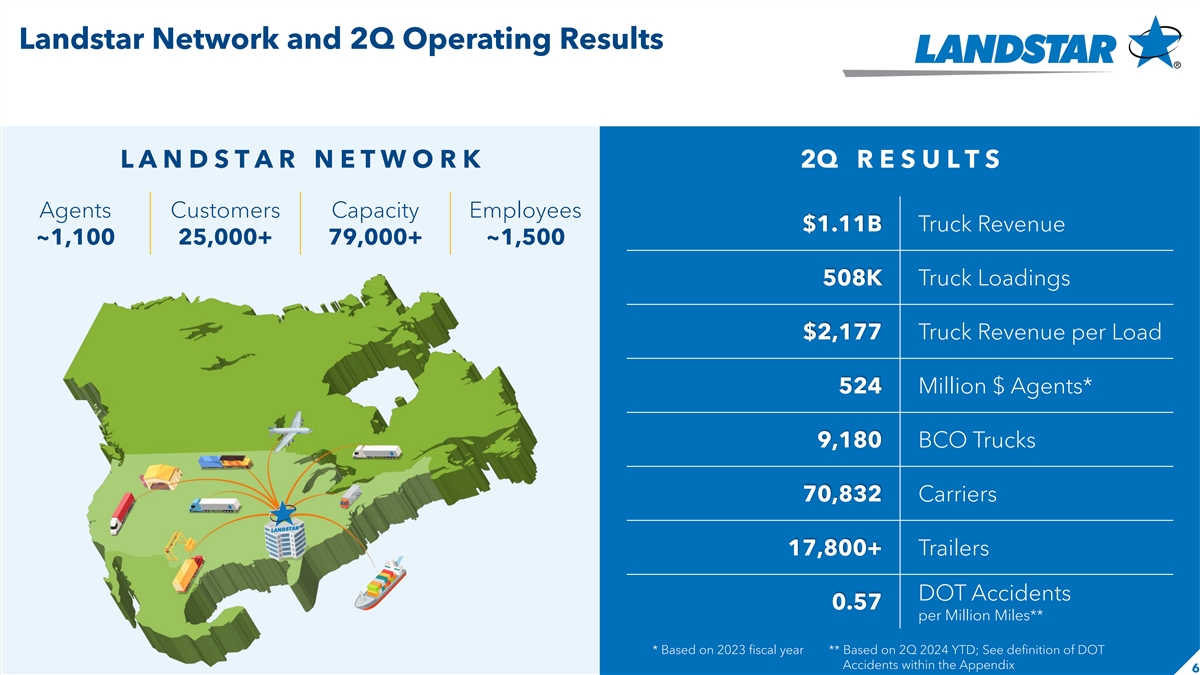
Landstar Network and 2Q Operating Results L A N D S T A R N E T W O R K
2Q R E S U L T S Agents Customers Capacity Employees $1.11B Truck Revenue ~1,100 25,000+ 79,000+ ~1,500 508K Truck Loadings $2,177 Truck Revenue per Load 524 Million $ Agents* 9,180 BCO Trucks 70,832 Carriers 17,800+ Trailers DOT Accidents 0.57 per
Million Miles** * Based on 2023 fiscal year ** Based on 2Q 2024 YTD; See definition of DOT Accidents within the Appendix 6
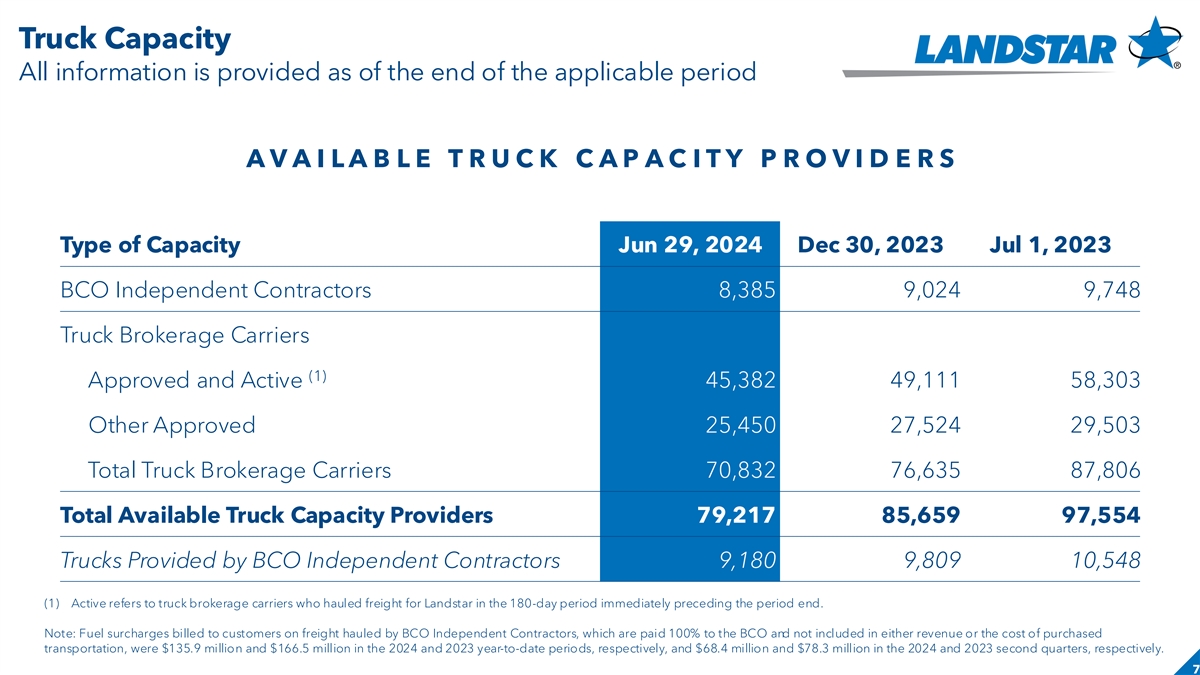
Truck Capacity All information is provided as of the end of the
applicable period A V A I L A B L E T R U C K C A P A C I T Y P R O V I D E R S Type of Capacity Jun 29, 2024 Dec 30, 2023 Jul 1, 2023 BCO Independent Contractors 8,385 9,024 9,748 Truck Brokerage Carriers (1) Approved and Active 45,382 49,111
58,303 Other Approved 25,450 27,524 29,503 Total Truck Brokerage Carriers 70,832 76,635 87,806 Total Available Truck Capacity Providers 79,217 85,659 97,554 Trucks Provided by BCO Independent Contractors 9,180 9,809 10,548 (1) Active refers to truck
brokerage carriers who hauled freight for Landstar in the 180-day period immediately preceding the period end. Note: Fuel surcharges billed to customers on freight hauled by BCO Independent Contractors, which are paid 100% to the BCO and not
included in either revenue or the cost of purchased transportation, were $135.9 million and $166.5 million in the 2024 and 2023 year-to-date periods, respectively, and $68.4 million and $78.3 million in the 2024 and 2023 second quarters,
respectively. 7
2Q 2024 Financial Results Jim Todd Chief Financial Officer 8
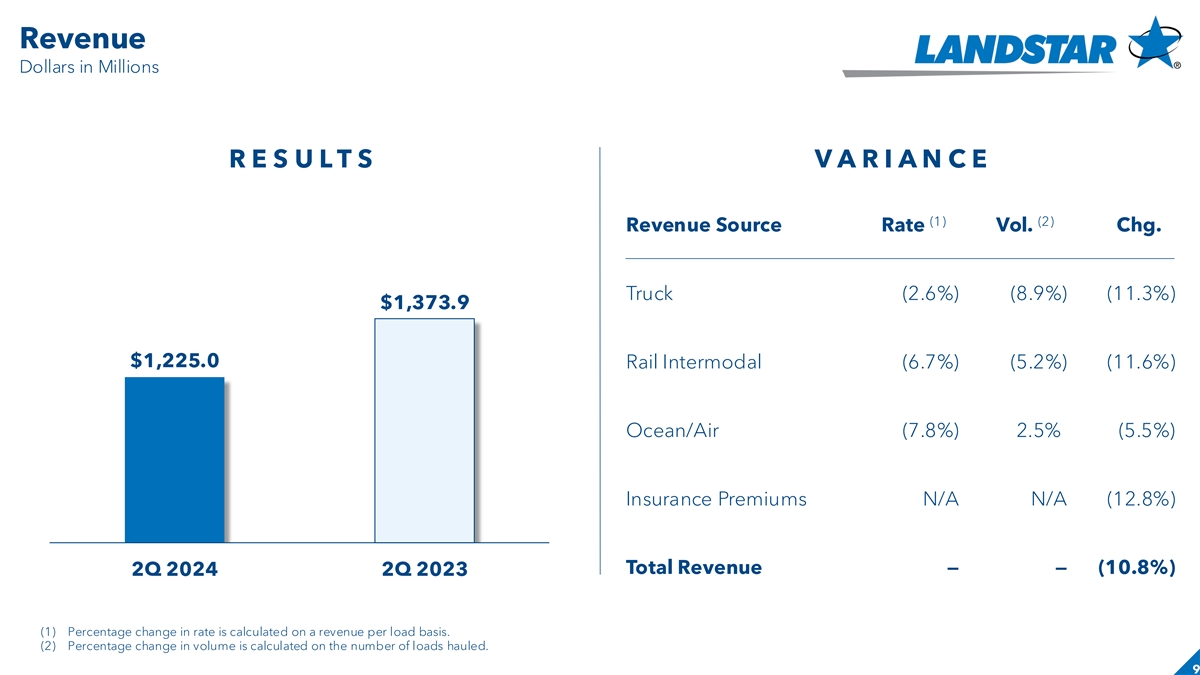
Revenue Slide header Dollars in Millions R E S U L T S V A R I A N C E
(1) (2) Revenue Source Rate Vol. Chg. Truck (2.6%) (8.9%) (11.3%) $1,373.9 $1,225.0 Rail Intermodal (6.7%) (5.2%) (11.6%) Ocean/Air (7.8%) 2.5%) (5.5%) Insurance Premiums N/A N/A (12.8%) Total Revenue—— (10.8%) 2Q 2024 2Q 2023 (1)
Percentage change in rate is calculated on a revenue per load basis. (2) Percentage change in volume is calculated on the number of loads hauled. 9
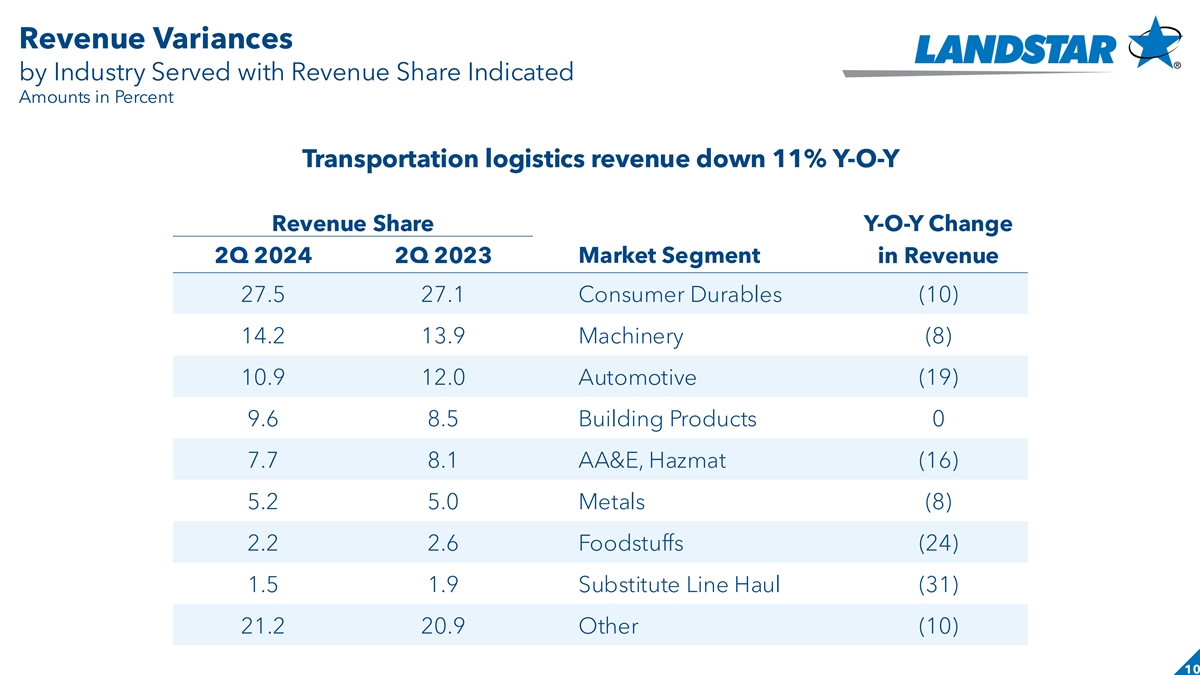
Revenue Variances by Industry Served with Revenue Share Indicated
Amounts in Percent Transportation logistics revenue down 11% Y-O-Y Revenue Share Y-O-Y Change Market Segment 2Q 2024 2Q 2023 in Revenue 27.5 27.1 Consumer Durables (10) 14.2 13.9 Machinery (8) 10.9 12.0 Automotive (19) 9.6 8.5 Building Products 0
7.7 8.1 AA&E, Hazmat (16) 5.2 5.0 Metals (8) 2.2 2.6 Foodstuffs (24) 1.5 1.9 Substitute Line Haul (31) 21.2 20.9 Other (10) 10
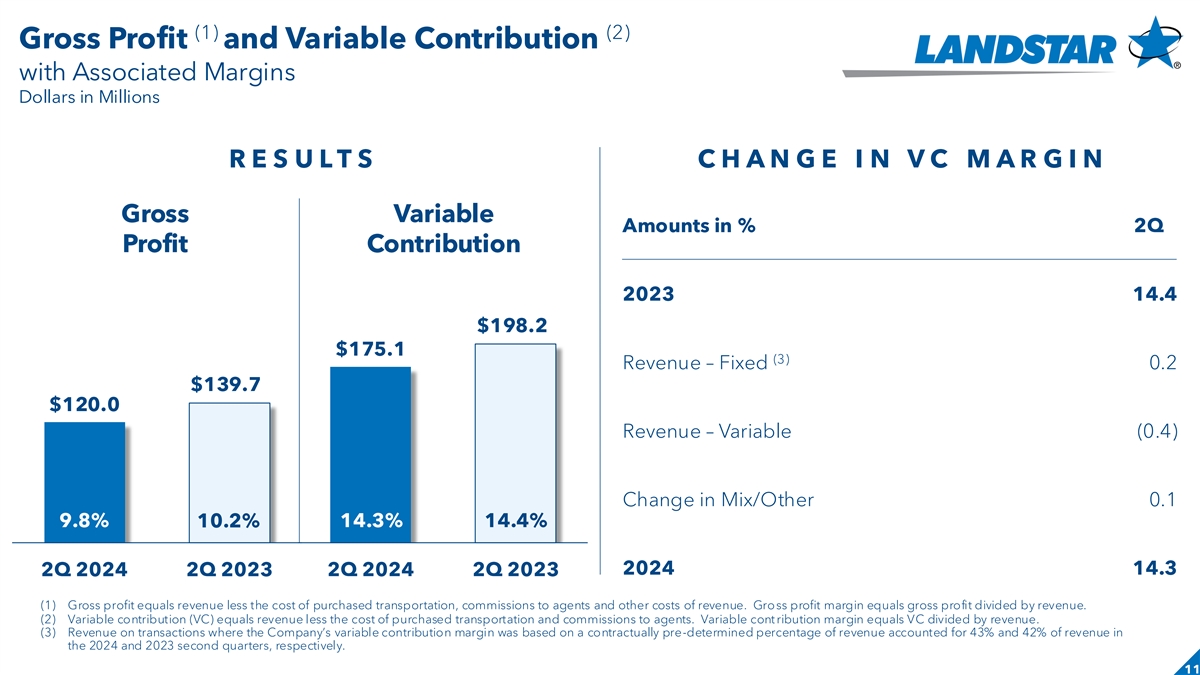
(1) (2) Gross Profit and Variable Contribution with Associated Margins
Dollars in Millions R E S U L T S C H A N G E I N V C M A R G I N Gross Variable Amounts in % 2Q Profit Contribution 2023 14.4 $198.2 $175.1 (3) Revenue – Fixed 0.2 $139.7 $120.0 Revenue – Variable (0.4) Change in Mix/Other 0.1 9.8%
10.2% 14.3% 14.4% 2024 14.3 2Q 2024 2Q 2023 2Q 2024 2Q 2023 (1) Gross profit equals revenue less the cost of purchased transportation, commissions to agents and other costs of revenue. Gross profit margin equals gross profit divided by revenue. (2)
Variable contribution (VC) equals revenue less the cost of purchased transportation and commissions to agents. Variable cont ribution margin equals VC divided by revenue. (3) Revenue on transactions where the Company’s variable contribution
margin was based on a contractually pre-determined percentage of revenue accounted for 43% and 42% of revenue in the 2024 and 2023 second quarters, respectively. 11
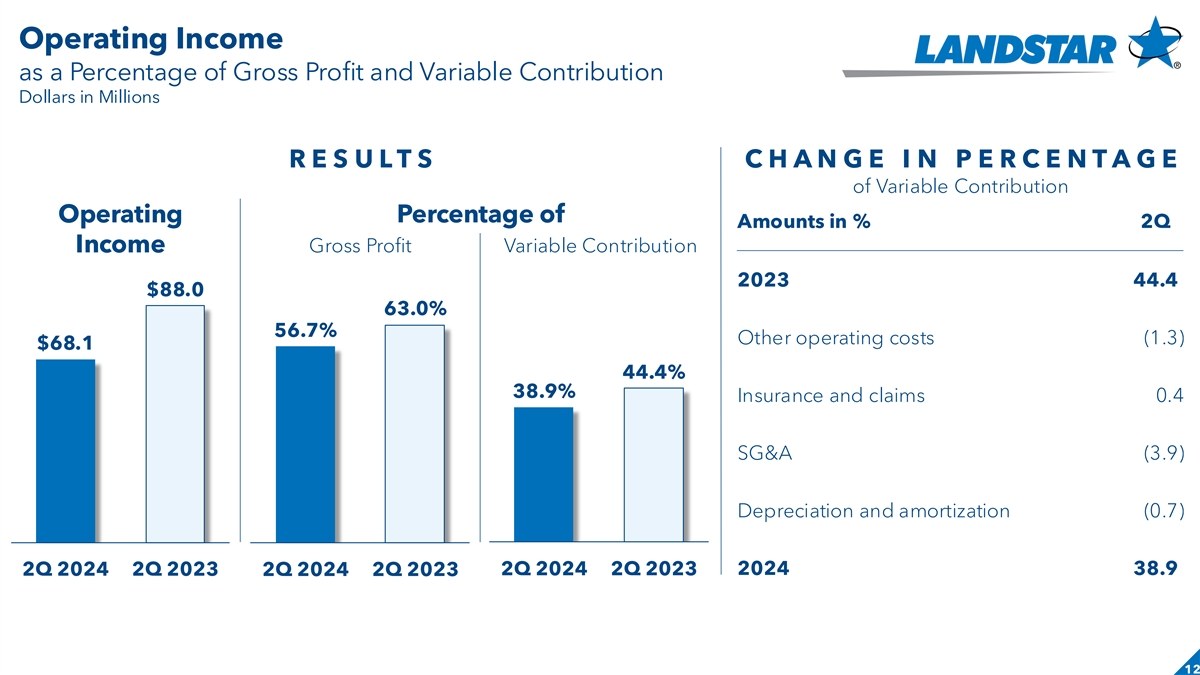
Operating Income Slide header as a Percentage of Gross Profit and
Variable Contribution Dollars in Millions R E S U L T S C H A N G E I N P E R C E N T A G E of Variable Contribution Operating Percentage of Amounts in % 2Q Income Gross Profit Variable Contribution 2023 44.4) $88.0 63.0% 56.7% Other operating costs
(1.3) $68.1 44.4% 38.9% Insurance and claims 0.4 SG&A (3.9) Depreciation and amortization (0.7) 2Q 2024 2Q 2023 2024 38.9) 2Q 2024 2Q 2023 2Q 2024 2Q 2023 12
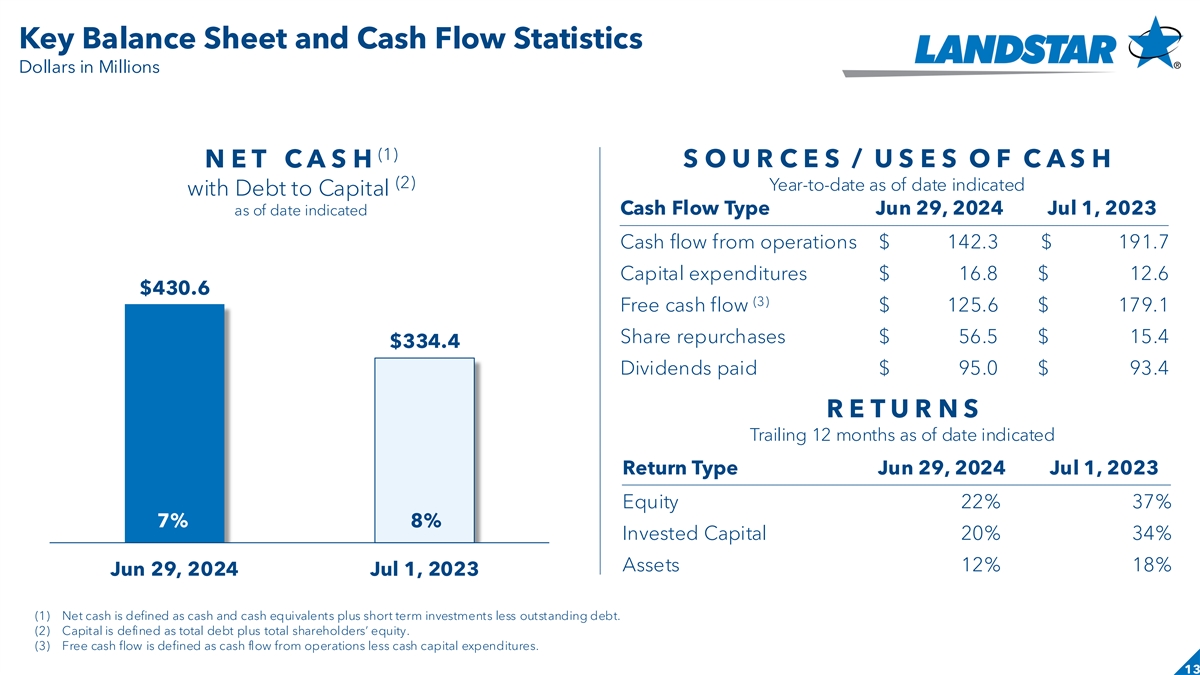
Key Balance Sheet and Cash Flow Statistics Dollars in Millions (1) N E
T C A S H S O U R C E S / U S E S O F C A S H (2) Year-to-date as of date indicated with Debt to Capital as of date indicated Cash Flow Type Jun 29, 2024 Jul 1, 2023 Cash flow from operations $ 142.3 $ 191.7 Capital expenditures $ 16.8 $ 12.6 $430.6
(3) Free cash flow $ 125.6 $ 179.1 Share repurchases $ 56.5 $ 15.4 $334.4 Dividends paid $ 95.0 $ 93.4 R E T U R N S Trailing 12 months as of date indicated Return Type Jun 29, 2024 Jul 1, 2023 Equity 22% 37% 7% 8% Invested Capital 20% 34% Assets
12% 18% Jun 29, 2024 Jul 1, 2023 (1) Net cash is defined as cash and cash equivalents plus short term investments less outstanding debt. (2) Capital is defined as total debt plus total shareholders’ equity. (3) Free cash flow is defined as
cash flow from operations less cash capital expenditures. 13
2Q 2024 3Q Guidance & Closing Remarks Frank Lonegro Chief Executive
Officer 14
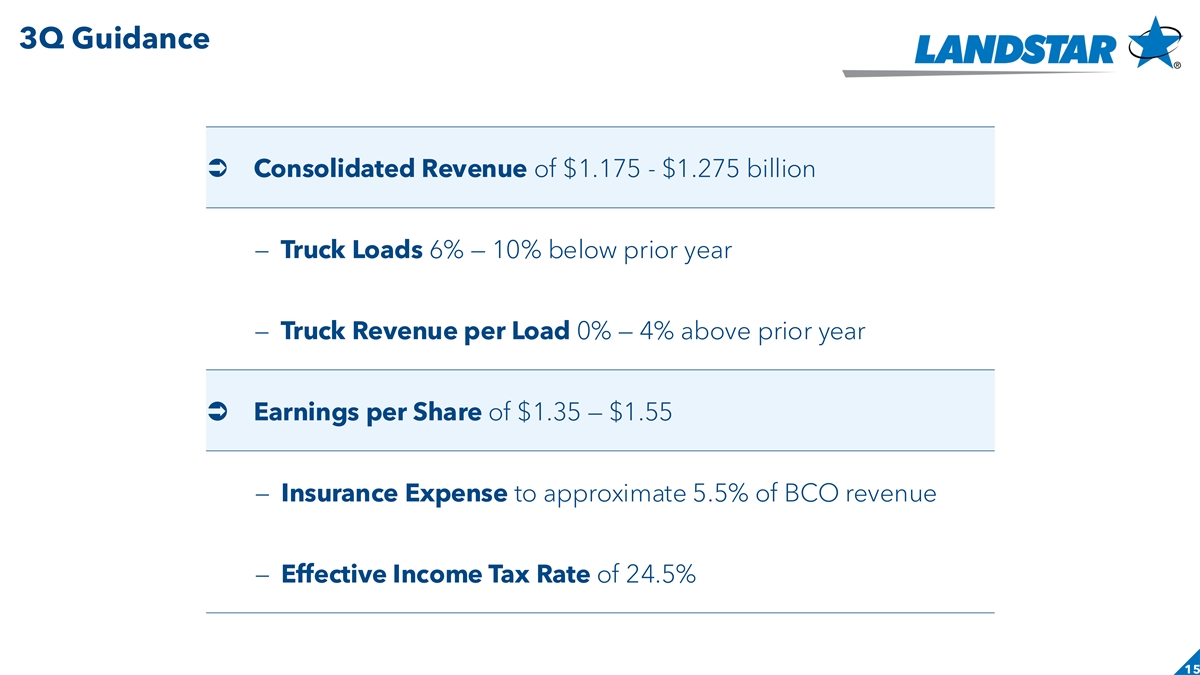
3Q Guidance Slide header Ü Consolidated Revenue of $1.175 - $1.275
billion – Truck Loads 6% — 10% below prior year – Truck Revenue per Load 0% — 4% above prior year Ü Earnings per Share of $1.35 — $1.55 – Insurance Expense to approximate 5.5% of BCO revenue – Effective
Income Tax Rate of 24.5% 15
2Q 2024 Appendix 16
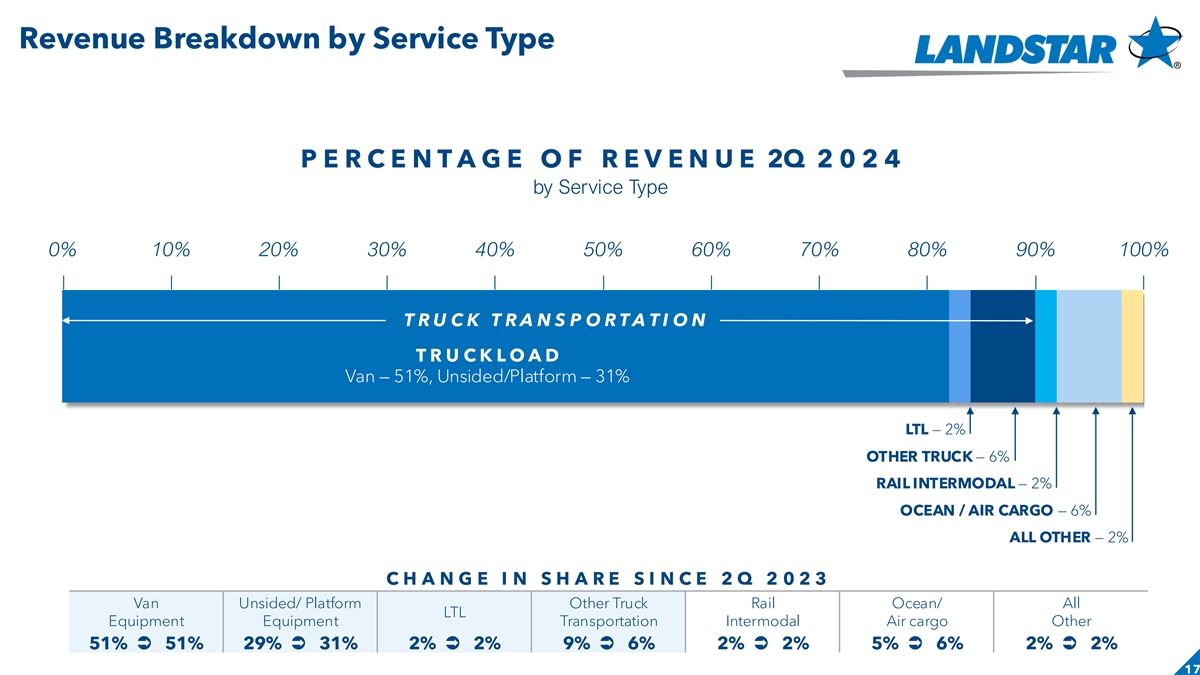
Revenue Breakdown by Service Type P E R C E N T A G E O F R E V E N U E
2Q 2 0 2 4 by Service Type 0% 10% 20% 30% 40% 50% 60% 70% 80% 90% 100% T R U C K T R A N S P O R T A T I O N T R U C K L O A D Van — 51%, Unsided/Platform — 31% LTL — 2% OTHER TRUCK — 6% RAIL INTERMODAL — 2% OCEAN / AIR
CARGO — 6% ALL OTHER — 2% C H A N G E I N S H A R E S I N C E 2 Q 2 0 2 3 Van Unsided/ Platform Other Truck Rail Ocean/ All LTL Equipment Equipment Transportation Intermodal Air cargo Other 51% Ü 51% 29% Ü 31% 2% Ü 2% 9%
Ü 6% 2% Ü 2% 5% Ü 6% 2% Ü 2% 17
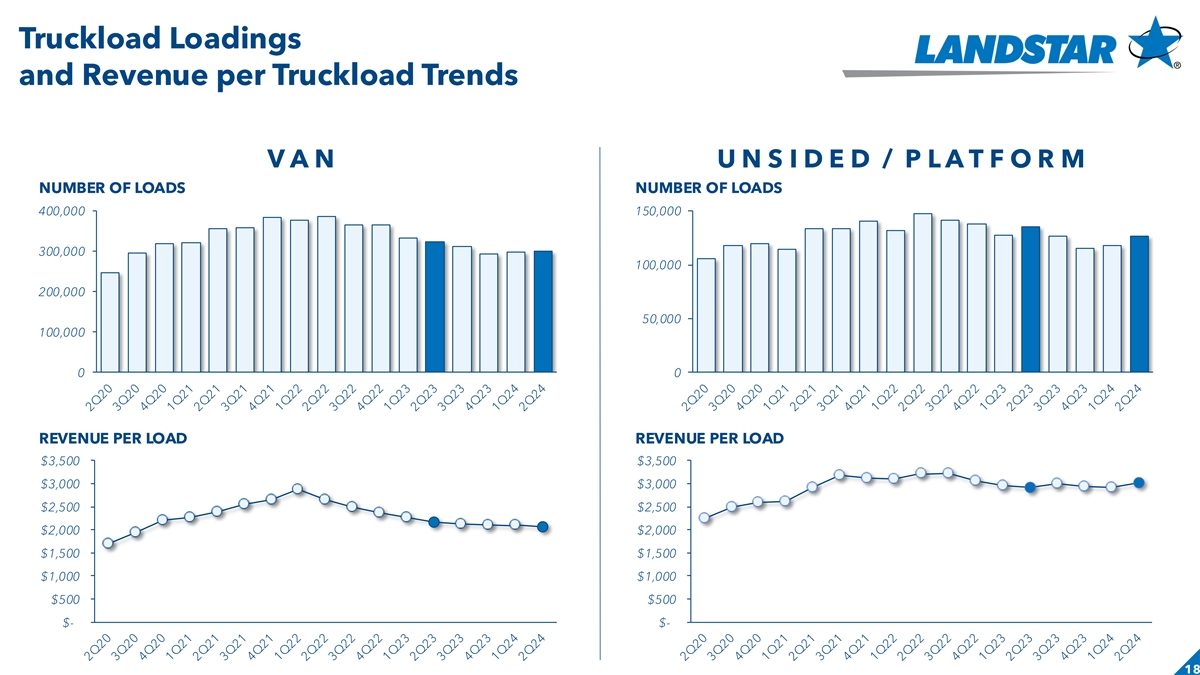
Truckload Loadings and Revenue per Truckload Trends V A N U N S I D E D
/ P L A T F O R M NUMBER OF LOADS NUMBER OF LOADS 400,000 150,000 300,000 100,000 200,000 50,000 100,000 0 0 REVENUE PER LOAD REVENUE PER LOAD $3,500 $3,500 $3,000 $3,000 $2,500 $2,500 $2,000 $2,000 $1,500 $1,500 $1,000 $1,000 $500 $500 $- $-
18
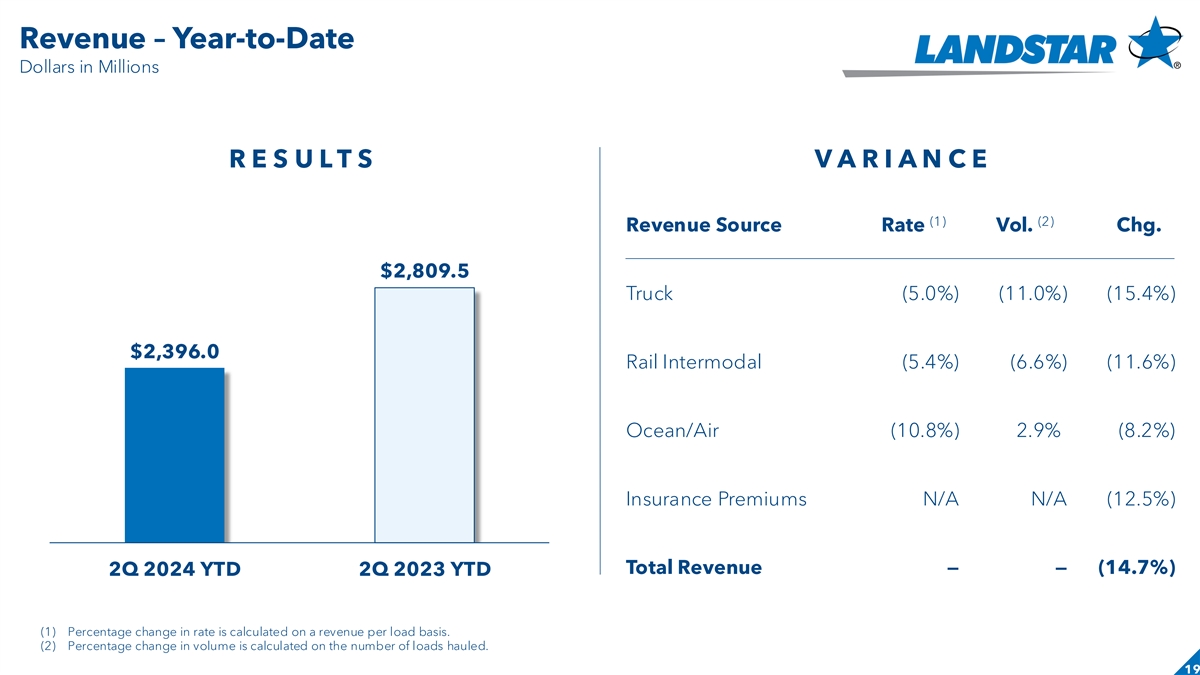
Revenue – Year-to-Date Slide header Dollars in Millions R E S U L
T S V A R I A N C E (1) (2) Revenue Source Rate Vol. Chg. $2,809.5 Truck (5.0%) (11.0%) (15.4%) $2,396.0 Rail Intermodal (5.4%) (6.6%) (11.6%) Ocean/Air (10.8%) 2.9%) (8.2%) Insurance Premiums N/A N/A (12.5%) Total Revenue—— (14.7%) 2Q
2024 YTD 2Q 2023 YTD (1) Percentage change in rate is calculated on a revenue per load basis. (2) Percentage change in volume is calculated on the number of loads hauled. 19
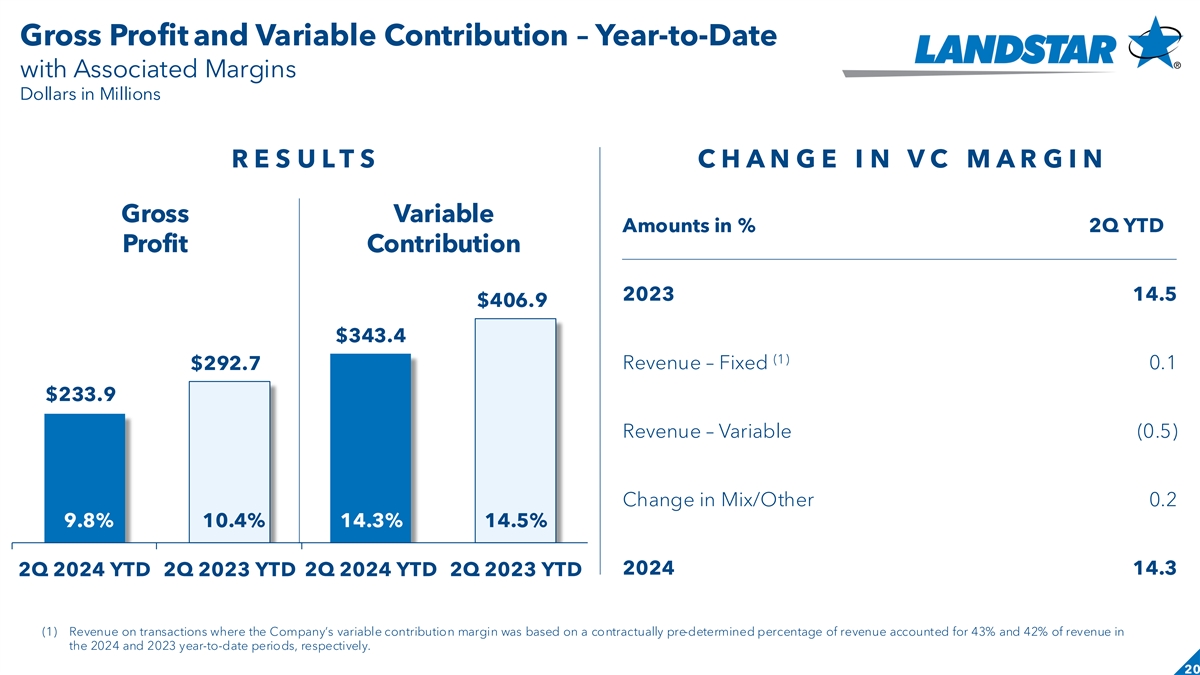
Gross Profit and Variable Contribution – Year-to-Date with
Associated Margins Dollars in Millions R E S U L T S C H A N G E I N V C M A R G I N Gross Variable Amounts in % 2Q YTD Profit Contribution 2023 14.5 $406.9 $343.4 (1) $292.7 Revenue – Fixed 0.1 $233.9 Revenue – Variable (0.5) Change in
Mix/Other 0.2 9.8% 10.4% 14.3% 14.5% 2024 14.3 2Q 2024 YTD 2Q 2023 YTD 2Q 2024 YTD 2Q 2023 YTD (1) Revenue on transactions where the Company’s variable contribution margin was based on a contractually pre-determined percentage of revenue
accounted for 43% and 42% of revenue in the 2024 and 2023 year-to-date periods, respectively. 20
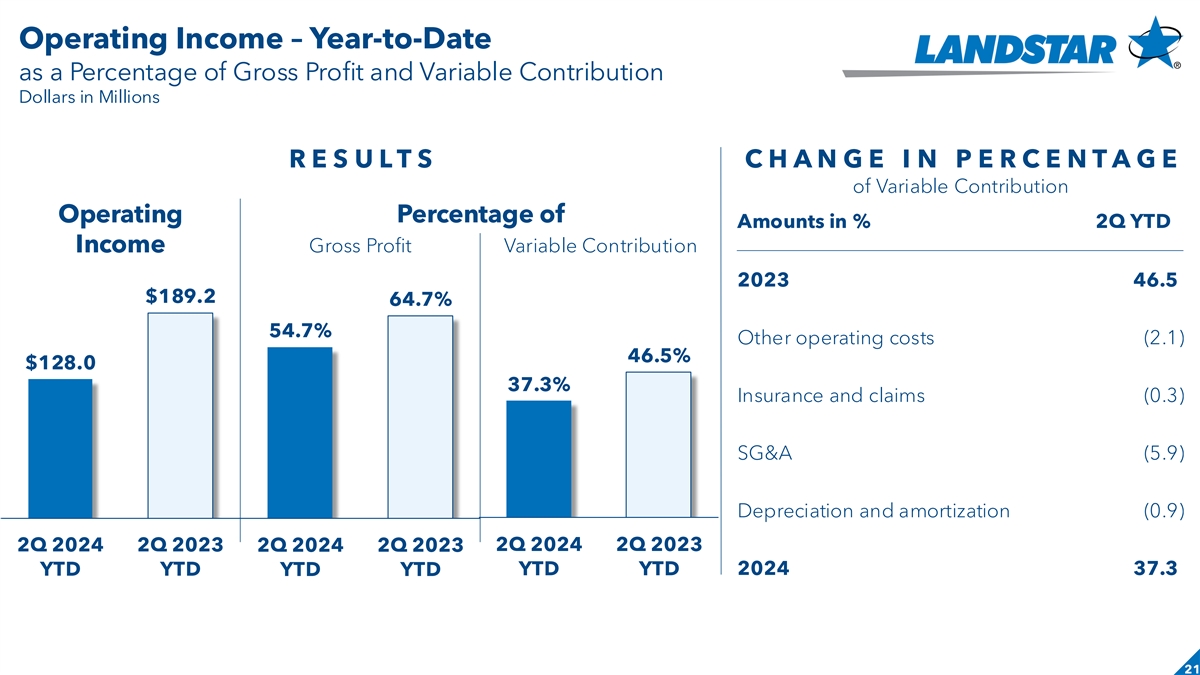
Operating Income – Year-to-Date Slide header as a Percentage of
Gross Profit and Variable Contribution Dollars in Millions R E S U L T S C H A N G E I N P E R C E N T A G E of Variable Contribution Operating Percentage of Amounts in % 2Q YTD Income Gross Profit Variable Contribution 2023 46.5) $189.2 64.7% 54.7%
Other operating costs (2.1) 46.5% $128.0 37.3% Insurance and claims (0.3) SG&A (5.9) Depreciation and amortization (0.9) 2Q 2024 2Q 2023 2Q 2024 2Q 2023 2Q 2024 2Q 2023 YTD YTD 2024 37.3) YTD YTD YTD YTD 21
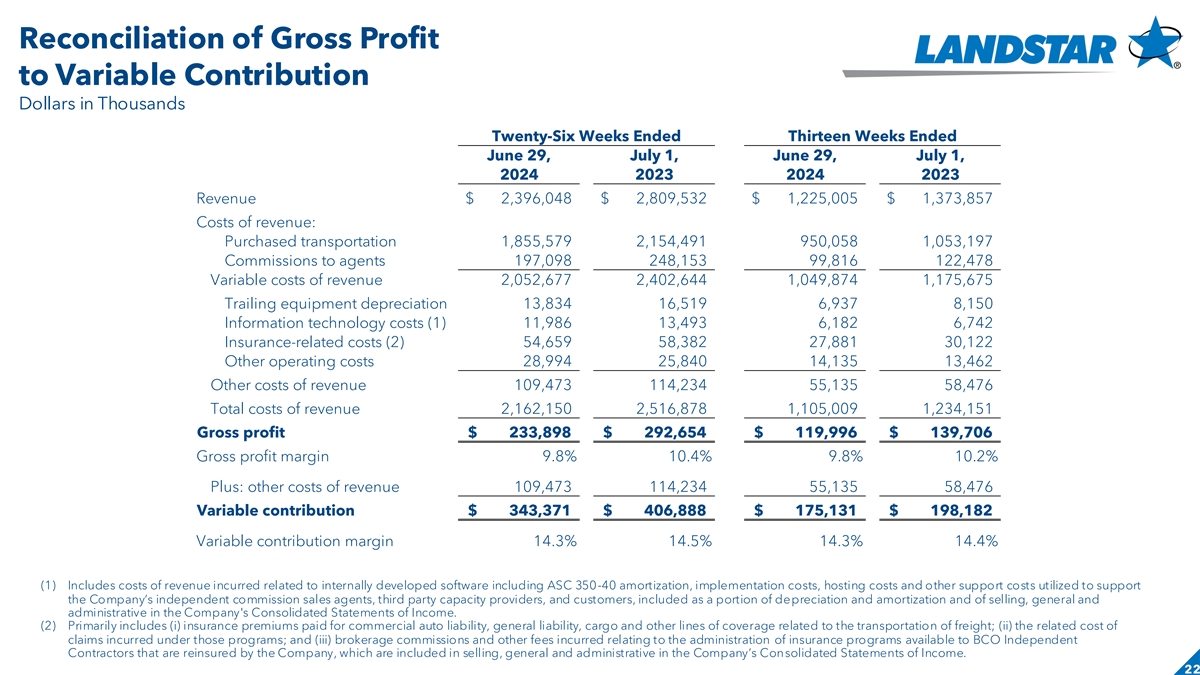
Reconciliation of Gross Profit to Variable Contribution Dollars in
Thousands Twenty-Six Weeks Ended Thirteen Weeks Ended June 29, July 1, June 29, July 1, 2024 2023 2024 2023 Revenue $ 2,396,048 $ 2,809,532 $ 1,225,005 $ 1,373,857 Costs of revenue: Purchased transportation 1,855,579 2,154,491 950,058 1,053,197
Commissions to agents 197,098 248,153 99,816 122,478 Variable costs of revenue 2,052,677 2 ,402,644 1 ,049,874 1,175,675 Trailing equipment depreciation 13,834 16,519 6,937 8,150 Information technology costs (1) 11,986 13,493 6,182 6,742
Insurance-related costs (2) 54,659 58,382 27,881 30,122 Other operating costs 28,994 25,840 14,135 13,462 Other costs of revenue 109,473 114,234 55,135 58,476 Total costs of revenue 2,162,150 2,516,878 1,105,009 1,234,151 Gross profit $ 2 33,898 $ 2
92,654 $ 1 19,996 $ 1 39,706 Gross profit margin 9.8% 10.4% 9.8% 10.2% Plus: other costs of revenue 109,473 114,234 55,135 58,476 Variable contribution $ 343,371 $ 406,888 $ 1 75,131 $ 198,182 Variable contribution margin 14.3% 14.5% 14.3% 14.4% (1)
Includes costs of revenue incurred related to internally developed software including ASC 350-40 amortization, implementation costs, hosting costs and other support costs utilized to support the Company’s independent commission sales agents,
third party capacity providers, and customers, included as a portion of depreciation and amortization and of selling, general and administrative in the Company's Consolidated Statements of Income. (2) Primarily includes (i) insurance premiums paid
for commercial auto liability, general liability, cargo and other lines of coverage related to the transportation of freight; (ii) the related cost of claims incurred under those programs; and (iii) brokerage commissions and other fees incurred
relating to the administration of insurance programs available to BCO Independent Contractors that are reinsured by the Company, which are included in selling, general and administrative in the Company’s Consolidated Statements of Income.
22
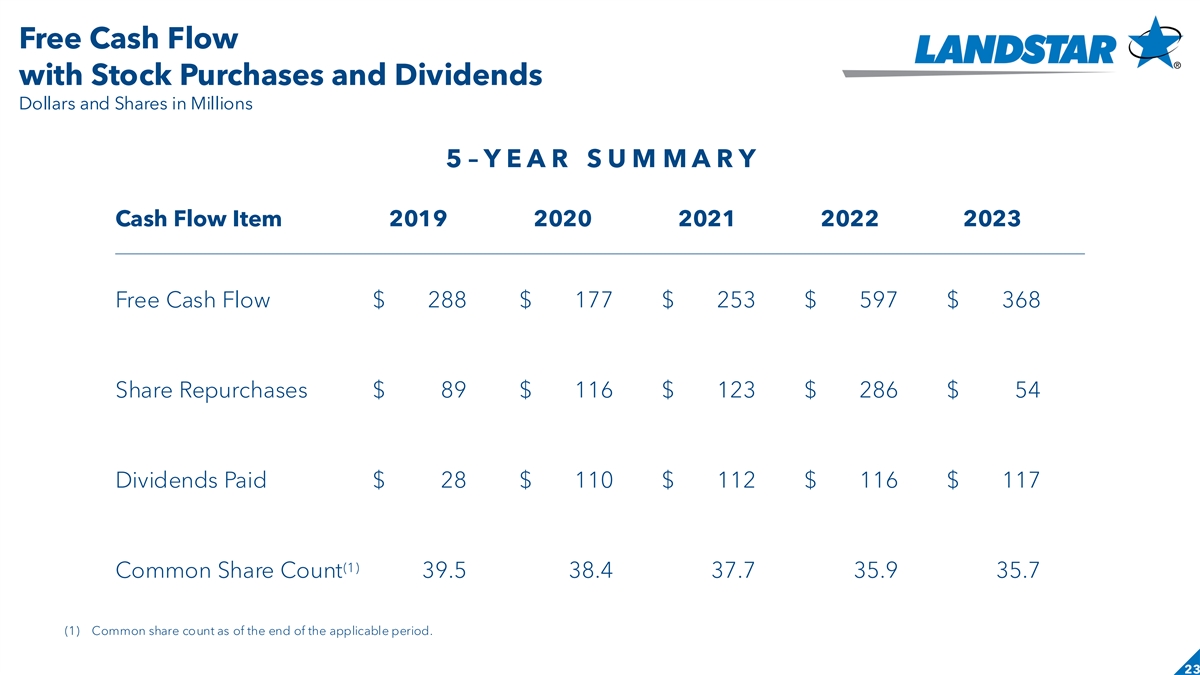
Free Cash Flow with Stock Purchases and Dividends Dollars and Shares in
Millions 5 – Y E A R S U M M A R Y Cash Flow Item 2019 2020 2021 2022 2023 Free Cash Flow $ 288 $ 177 $ 253 $ 597 $ 368 Share Repurchases $ 89 $ 116 $ 123 $ 286 $ 54 Dividends Paid $ 28 $ 110 $ 112 $ 116 $ 117 (1) Common Share Count 39.5 38.4
37.7 35.9 35.7 (1) Common share count as of the end of the applicable period. 23
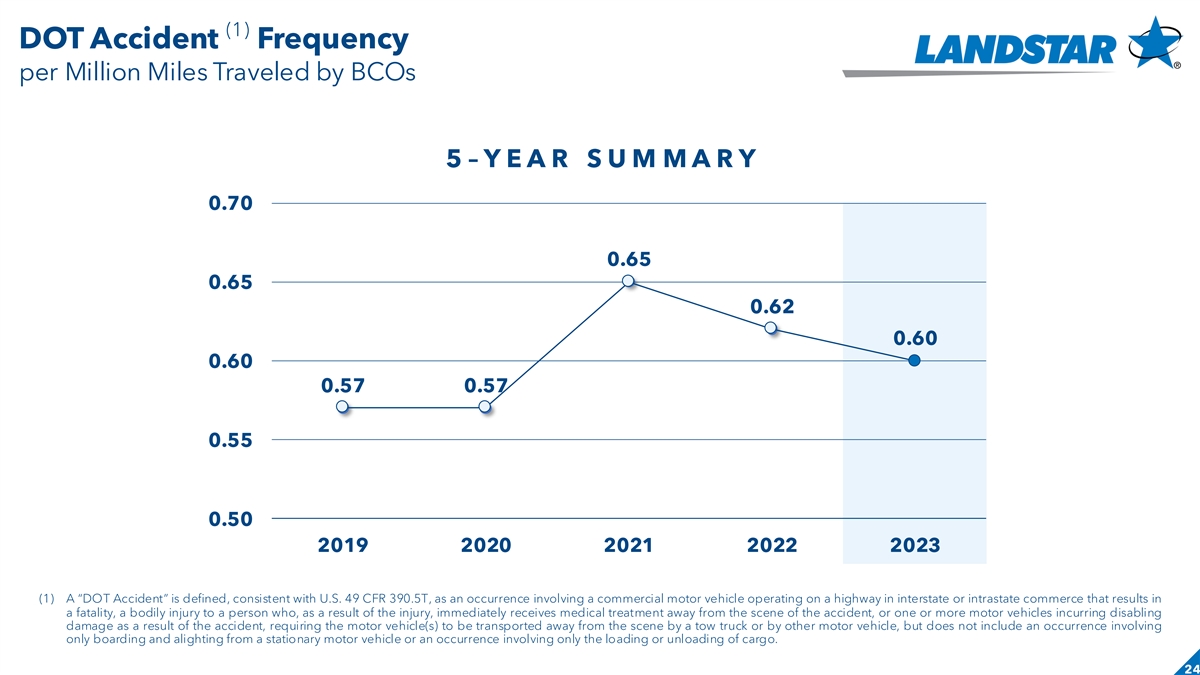
(1) DOT Accident Frequency per Million Miles Traveled by BCOs 5 –
Y E A R S U M M A R Y 0.70 0.65 0.65 0.62 0.60 0.60 0.57 0.57 0.55 0.50 2019 2020 2021 2022 2023 (1) A “DOT Accident” is defined, consistent with U.S. 49 CFR 390.5T, as an occurrence involving a commercial motor vehicle operating on a
highway in interstate or intrastate commerce that results in a fatality, a bodily injury to a person who, as a result of the injury, immediately receives medical treatment away from the scene of the accident, or one or more motor vehicles incurring
disabling damage as a result of the accident, requiring the motor vehicle(s) to be transported away from the scene by a tow truck or by other motor vehicle, but does not include an occurrence involving only boarding and alighting from a stationary
motor vehicle or an occurrence involving only the loading or unloading of cargo. 24

Landstar System, Inc. 2Q 2024 Earnings Conference Call Date
v3.24.2
| X |
- DefinitionBoolean flag that is true when the XBRL content amends previously-filed or accepted submission.
| Name: |
dei_AmendmentFlag |
| Namespace Prefix: |
dei_ |
| Data Type: |
xbrli:booleanItemType |
| Balance Type: |
na |
| Period Type: |
duration |
|
| X |
- DefinitionFor the EDGAR submission types of Form 8-K: the date of the report, the date of the earliest event reported; for the EDGAR submission types of Form N-1A: the filing date; for all other submission types: the end of the reporting or transition period. The format of the date is YYYY-MM-DD.
| Name: |
dei_DocumentPeriodEndDate |
| Namespace Prefix: |
dei_ |
| Data Type: |
xbrli:dateItemType |
| Balance Type: |
na |
| Period Type: |
duration |
|
| X |
- DefinitionThe type of document being provided (such as 10-K, 10-Q, 485BPOS, etc). The document type is limited to the same value as the supporting SEC submission type, or the word 'Other'.
| Name: |
dei_DocumentType |
| Namespace Prefix: |
dei_ |
| Data Type: |
dei:submissionTypeItemType |
| Balance Type: |
na |
| Period Type: |
duration |
|
| X |
- DefinitionAddress Line 1 such as Attn, Building Name, Street Name
| Name: |
dei_EntityAddressAddressLine1 |
| Namespace Prefix: |
dei_ |
| Data Type: |
xbrli:normalizedStringItemType |
| Balance Type: |
na |
| Period Type: |
duration |
|
| X |
- Definition
+ References
+ Details
| Name: |
dei_EntityAddressCityOrTown |
| Namespace Prefix: |
dei_ |
| Data Type: |
xbrli:normalizedStringItemType |
| Balance Type: |
na |
| Period Type: |
duration |
|
| X |
- DefinitionCode for the postal or zip code
| Name: |
dei_EntityAddressPostalZipCode |
| Namespace Prefix: |
dei_ |
| Data Type: |
xbrli:normalizedStringItemType |
| Balance Type: |
na |
| Period Type: |
duration |
|
| X |
- DefinitionName of the state or province.
| Name: |
dei_EntityAddressStateOrProvince |
| Namespace Prefix: |
dei_ |
| Data Type: |
dei:stateOrProvinceItemType |
| Balance Type: |
na |
| Period Type: |
duration |
|
| X |
- DefinitionA unique 10-digit SEC-issued value to identify entities that have filed disclosures with the SEC. It is commonly abbreviated as CIK. Reference 1: http://www.xbrl.org/2003/role/presentationRef
-Publisher SEC
-Name Exchange Act
-Number 240
-Section 12
-Subsection b-2
| Name: |
dei_EntityCentralIndexKey |
| Namespace Prefix: |
dei_ |
| Data Type: |
dei:centralIndexKeyItemType |
| Balance Type: |
na |
| Period Type: |
duration |
|
| X |
- DefinitionIndicate if registrant meets the emerging growth company criteria. Reference 1: http://www.xbrl.org/2003/role/presentationRef
-Publisher SEC
-Name Exchange Act
-Number 240
-Section 12
-Subsection b-2
| Name: |
dei_EntityEmergingGrowthCompany |
| Namespace Prefix: |
dei_ |
| Data Type: |
xbrli:booleanItemType |
| Balance Type: |
na |
| Period Type: |
duration |
|
| X |
- DefinitionCommission file number. The field allows up to 17 characters. The prefix may contain 1-3 digits, the sequence number may contain 1-8 digits, the optional suffix may contain 1-4 characters, and the fields are separated with a hyphen.
| Name: |
dei_EntityFileNumber |
| Namespace Prefix: |
dei_ |
| Data Type: |
dei:fileNumberItemType |
| Balance Type: |
na |
| Period Type: |
duration |
|
| X |
- DefinitionTwo-character EDGAR code representing the state or country of incorporation.
| Name: |
dei_EntityIncorporationStateCountryCode |
| Namespace Prefix: |
dei_ |
| Data Type: |
dei:edgarStateCountryItemType |
| Balance Type: |
na |
| Period Type: |
duration |
|
| X |
- DefinitionThe exact name of the entity filing the report as specified in its charter, which is required by forms filed with the SEC. Reference 1: http://www.xbrl.org/2003/role/presentationRef
-Publisher SEC
-Name Exchange Act
-Number 240
-Section 12
-Subsection b-2
| Name: |
dei_EntityRegistrantName |
| Namespace Prefix: |
dei_ |
| Data Type: |
xbrli:normalizedStringItemType |
| Balance Type: |
na |
| Period Type: |
duration |
|
| X |
- DefinitionThe Tax Identification Number (TIN), also known as an Employer Identification Number (EIN), is a unique 9-digit value assigned by the IRS. Reference 1: http://www.xbrl.org/2003/role/presentationRef
-Publisher SEC
-Name Exchange Act
-Number 240
-Section 12
-Subsection b-2
| Name: |
dei_EntityTaxIdentificationNumber |
| Namespace Prefix: |
dei_ |
| Data Type: |
dei:employerIdItemType |
| Balance Type: |
na |
| Period Type: |
duration |
|
| X |
- DefinitionLocal phone number for entity.
| Name: |
dei_LocalPhoneNumber |
| Namespace Prefix: |
dei_ |
| Data Type: |
xbrli:normalizedStringItemType |
| Balance Type: |
na |
| Period Type: |
duration |
|
| X |
- DefinitionBoolean flag that is true when the Form 8-K filing is intended to satisfy the filing obligation of the registrant as pre-commencement communications pursuant to Rule 13e-4(c) under the Exchange Act. Reference 1: http://www.xbrl.org/2003/role/presentationRef
-Publisher SEC
-Name Exchange Act
-Number 240
-Section 13e
-Subsection 4c
| Name: |
dei_PreCommencementIssuerTenderOffer |
| Namespace Prefix: |
dei_ |
| Data Type: |
xbrli:booleanItemType |
| Balance Type: |
na |
| Period Type: |
duration |
|
| X |
- DefinitionBoolean flag that is true when the Form 8-K filing is intended to satisfy the filing obligation of the registrant as pre-commencement communications pursuant to Rule 14d-2(b) under the Exchange Act. Reference 1: http://www.xbrl.org/2003/role/presentationRef
-Publisher SEC
-Name Exchange Act
-Number 240
-Section 14d
-Subsection 2b
| Name: |
dei_PreCommencementTenderOffer |
| Namespace Prefix: |
dei_ |
| Data Type: |
xbrli:booleanItemType |
| Balance Type: |
na |
| Period Type: |
duration |
|
| X |
- DefinitionTitle of a 12(b) registered security. Reference 1: http://www.xbrl.org/2003/role/presentationRef
-Publisher SEC
-Name Exchange Act
-Number 240
-Section 12
-Subsection b
| Name: |
dei_Security12bTitle |
| Namespace Prefix: |
dei_ |
| Data Type: |
dei:securityTitleItemType |
| Balance Type: |
na |
| Period Type: |
duration |
|
| X |
- DefinitionName of the Exchange on which a security is registered. Reference 1: http://www.xbrl.org/2003/role/presentationRef
-Publisher SEC
-Name Exchange Act
-Number 240
-Section 12
-Subsection d1-1
| Name: |
dei_SecurityExchangeName |
| Namespace Prefix: |
dei_ |
| Data Type: |
dei:edgarExchangeCodeItemType |
| Balance Type: |
na |
| Period Type: |
duration |
|
| X |
- DefinitionBoolean flag that is true when the Form 8-K filing is intended to satisfy the filing obligation of the registrant as soliciting material pursuant to Rule 14a-12 under the Exchange Act. Reference 1: http://www.xbrl.org/2003/role/presentationRef
-Publisher SEC
-Name Exchange Act
-Section 14a
-Number 240
-Subsection 12
| Name: |
dei_SolicitingMaterial |
| Namespace Prefix: |
dei_ |
| Data Type: |
xbrli:booleanItemType |
| Balance Type: |
na |
| Period Type: |
duration |
|
| X |
- DefinitionTrading symbol of an instrument as listed on an exchange.
| Name: |
dei_TradingSymbol |
| Namespace Prefix: |
dei_ |
| Data Type: |
dei:tradingSymbolItemType |
| Balance Type: |
na |
| Period Type: |
duration |
|
| X |
- DefinitionBoolean flag that is true when the Form 8-K filing is intended to satisfy the filing obligation of the registrant as written communications pursuant to Rule 425 under the Securities Act. Reference 1: http://www.xbrl.org/2003/role/presentationRef
-Publisher SEC
-Name Securities Act
-Number 230
-Section 425
| Name: |
dei_WrittenCommunications |
| Namespace Prefix: |
dei_ |
| Data Type: |
xbrli:booleanItemType |
| Balance Type: |
na |
| Period Type: |
duration |
|
Landstar System (NASDAQ:LSTR)
過去 株価チャート
から 3 2025 まで 4 2025

Landstar System (NASDAQ:LSTR)
過去 株価チャート
から 4 2024 まで 4 2025

