 US Market News
1月前
US Market News
1月前
Deere Reports Second Quarter Net Income of $1.773 BillionMay 21, 2026 6:20 AM
PR Newswire (US) Strong execution across segments drives solid performance, reflecting portfolio strength.Net income guidance maintained, reinforcing confidence amid market volatility.Investment in new products and technology supports long-term growth and value creation.MOLINE, Ill., May 21, 2026 /PRNewswire/ -- Deere & Company (NYSE: DE) reported net income of $1.773 billion for the second quarter ended May 3, 2026, or $6.55 per share, compared with net income of $1.804 billion, or $6.64 per share, for the quarter ended April 27, 2025. For the first six months of the year, net income attributable to Deere & Company was $2.429 billion, or $8.97 per share, compared with $2.673 billion, or $9.82 per share, for the same period last year.Worldwide net sales and revenues increased 5 percent, to $13.369 billion, for the second quarter of 2026 and rose 8 percent, to $22.981 billion, for six months. Net sales were $11.778 billion for the quarter and $19.779 billion for six months, compared with $11.171 billion and $17.980 billion last year, respectively."Our performance in the current market environment demonstrates the strength of our diversified portfolio. This is particularly reflected in the strong outcomes achieved by our Small Ag and Construction & Forestry divisions during this year," stated John May, chairman and CEO of John Deere. "As we address ongoing challenges within global agricultural markets, our comprehensive portfolio continues to drive market share expansion and support our targets for sustained growth."Company Outlook & SummaryNet income attributable to Deere & Company for fiscal 2026 is forecasted to be in a range of $4.5 billion to $5.0 billion."While our customers face ongoing challenges, John Deere remains firmly committed to supporting their success through disciplined operations and resilience," said May. "By continuing to invest in innovation through the cycle and leveraging the strength of our dealer network, we are well positioned to deliver increasing value for customers and shareholders as market conditions improve."Deere & Company
Second Quarter
Year to Date
$ in millions, except per share amounts
2026
2025
% Change
2026
2025
% Change
Net sales and revenues
$13,369
$12,763
5 %
$22,981
$21,272
8 %
Net income
$1,773
$1,804
-2 %
$2,429
$2,673
-9 %
Fully diluted EPS
$6.55
$6.64
$8.97
$9.82
The prior period year to date results presented were affected by special items. See Note 2 of the financial statements for further details. On February 20, 2026, the Supreme Court of the United States issued a decision invalidating tariffs imposed pursuant to the International Emergency Economic Powers Act (IEEPA). The company recorded a recovery of $272 million for refund claims related to IEEPA tariffs which have been filed and accepted by the U.S. Customs and Border Protection. The tariff impact for each segment is primarily included in the "Production Costs" category below.Production & Precision Agriculture
Second Quarter
$ in millions
2026
2025
% Change
Net sales
$4,503
$5,230
-14 %
Operating profit
$706
$1,148
-39 %
Operating margin
15.7 %
22.0 %
Production & Precision Agriculture sales decreased for the quarter as a result of lower shipment volumes, partially offset by the positive effects of foreign currency translation. Operating profit decreased primarily due to lower shipment volumes and higher production costs, partially offset by the favorable effects of foreign currency exchange.Small Agriculture & Turf
Second Quarter
$ in millions
2026
2025
% Change
Net sales
$3,485
$2,994
16 %
Operating profit
$719
$574
25 %
Operating margin
20.6 %
19.2 %
Small Agriculture & Turf sales increased for the quarter as a result of higher shipment volumes and the positive effects of foreign currency translation. Operating profit increased primarily due to higher shipment volumes and favorable price realization.Construction & Forestry
Second Quarter
$ in millions
2026
2025
% Change
Net sales
$3,790
$2,947
29 %
Operating profit
$561
$379
48 %
Operating margin
14.8 %
12.9 %
Construction & Forestry sales increased for the quarter primarily as a result of higher shipment volumes and the positive effects of foreign currency translation. Operating profit increased primarily due to higher shipment volumes and favorable price realization, partially offset by higher production costs.Financial Services
Second Quarter
$ in millions
2026
2025
% Change
Net income
$190
$161
18 %
Financial Services net income increased primarily due to favorable financing spreads and favorable derivative valuation adjustments, partially offset by the impact of a lower average portfolio.Industry Outlook for Fiscal 2026
Agriculture & Turf
U.S. & Canada:
Large Ag
Down 15 to 20%
Small Ag & Turf
Flat to up 5%
Europe
Flat to up 5%
South America (Tractors & Combines)
Down ~15%
Asia
Flat
Construction & Forestry
U.S. & Canada:
Construction Equipment
Up ~5%
Compact Construction Equipment
Up ~5%
Global Forestry
Down ~5%
Global Roadbuilding
Up ~10%
Deere Segment Outlook for Fiscal 2026
Currency
Price
$ in millions
Net Sales
Translation
Realization
Production & Precision Ag
Down 5 to 10%
+3.0 %
~ +1.0%
Small Ag & Turf
Up ~15%
+1.0 %
~ +1.5%
Construction & Forestry
Up ~20%
+2.0 %
~ +2.5%
Financial Services
Net Income
~ $860
FORWARD-LOOKING STATEMENTSCertain statements contained herein, including in the sections entitled "Company Outlook & Summary," "Industry Outlook for Fiscal 2026," "Deere Segment Outlook for Fiscal 2026," and "Condensed Notes to Interim Consolidated Financial Statements" relating to future events, expectations, and trends constitute "forward-looking statements" as defined in the Private Securities Litigation Reform Act of 1995 and involve factors that are subject to change, assumptions, risks, and uncertainties that could cause actual results to differ materially. Some of these risks and uncertainties could affect all lines of the company's operations generally while others could more heavily affect a particular line of business.Forward-looking statements are based on currently available information and current assumptions, expectations, and projections about future events and should not be relied upon. Except as required by law, the company expressly disclaims any obligation to update or revise its forward-looking statements. Many factors, risks, and uncertainties could cause actual results to differ materially from these forward-looking statements. Among these factors are risks related to:the agricultural business cycle, which can be unpredictable and is affected by factors such as farm income, international trade, world grain stocks, crop yields, available farm acres, soil conditions, prices for commodities and livestock, input costs including the availability and price of fertilizer, government farm programs, and availability of transport for cropsmacroeconomic conditions, including unemployment, inflation, interest rate volatility, energy price increases resulting from geopolitical conflicts, changes in consumer practices due to slower economic growth or a recession, regional or global liquidity constraintsthe uncertainty of government policies and actions with respect to the global trade environment including increased and contested tariffs announced by the U.S. government and retaliatory trade regulationspolitical, economic, and social instability in the geographies in which the company operatesworldwide demand for food and different forms of renewable energy impacting the price of farm commodities and consequently the demand for the company's equipmentrationalization, restructuring, relocation, expansion, and/or reconfiguration of manufacturing and warehouse facilitiesaccurately forecasting customer demand for products and services, and adequately managing inventoryuncertainty of the company's ability to sell products domestically or internationally, manage increased costs of production, absorb or pass on increased expenses, and accurately predict financial results and industry trendsavailability and price of raw materials, components, and whole goodsdelays or disruptions in the company's supply chain, including those arising from geopolitical conflictschanges in climate patterns, unfavorable weather events, and natural disasterssuppliers' and manufacturers' business practices and compliance with applicable laws such as human rights, safety, environmental, and fair wageshigher interest rates and currency fluctuations which could adversely affect the U.S. dollar, customer confidence, access to capital, and demand for the company's products and solutionsthe ability to attract, develop, engage, and retain qualified employeesthe company's ability to adapt in highly competitive markets, including understanding and meeting customers' changing expectations for products and solutions, including delivery and utilization of precision technologythe ability to execute business strategies, including the company's Smart Industrial Operating Model and refined Leap Ambitionsdealer practices and their ability to manage new and used inventory, distribute the company's products, and to provide support and service for precision technology solutionsthe ability to realize anticipated benefits of acquisitions and joint ventures, including challenges with successfully integrating operations and internal control processesnegative claims or publicity that damage the company's reputation or brandthe impact of workforce reductions on company culture, employee retention and morale, and institutional knowledgelabor relations and contracts, including work stoppages and other disruptionssecurity breaches, cybersecurity attacks, technology failures, and other disruptions to the company's information technology infrastructure and productsleveraging artificial intelligence and machine learning within the company's business processeschanges to existing laws and regulations, including the implementation of new, more stringent laws, as well as compliance with a variety of U.S., foreign, and international laws, regulations, and policies relating to, but not limited to the following: advertising, anti-bribery and anti-corruption, anti-money laundering, antitrust, consumer finance, cybersecurity, data privacy, encryption, environmental (including climate change and engine emissions), farming, foreign exchange controls and cash repatriation restrictions, foreign ownership and investment, health and safety, human rights, import / export and trade, labor and employment, product liability, tariffs, tax, telematics, and telecommunicationsgovernmental and other actions designed to address climate change in connection with a transition to a lower-carbon economywarranty claims, post-sales repairs or recalls, product liability litigation, and regulatory investigations because of the deficient operation of the company's productsinvestigations, claims, lawsuits, or other legal proceedings, including the lawsuit filed by the Federal Trade Commission (FTC) and the Attorneys General of the States of Arizona, Illinois, Michigan, Minnesota, and Wisconsin alleging that the company unlawfully withheld self-repair capabilities from farmers and independent repair providersloss of or challenges to intellectual property rightsFurther information concerning the company or its businesses, including factors that could materially affect the company's financial results, is included in the company's filings with the SEC (including, but not limited to, the factors discussed in Item 1A. "Risk Factors" of the company's most recent Annual Report on Form 10-K and subsequent Quarterly Report on Form 10-Q). There also may be other factors that the company cannot anticipate or that are not described herein because the company does not currently perceive them to be material.DEERE & COMPANY
SECOND QUARTER 2026 PRESS RELEASE
(In millions of dollars) Unaudited
Three Months Ended
Six Months Ended
May 3
April 27
%
May 3
April 27
%
2026
2025
Change
2026
2025
Change
Net sales and revenues:
Production & Precision Ag net sales
$4,503
$5,230
-14
$7,666
$8,297
-8
Small Ag & Turf net sales
3,485
2,994
+16
5,653
4,742
+19
Construction & Forestry net sales
3,790
2,947
+29
6,460
4,941
+31
Financial Services revenues
1,366
1,385
-1
2,751
2,856
-4
Other revenues
225
207
+9
451
436
+3
Total net sales and revenues
$13,369
$12,763
+5
$22,981
$21,272
+8
Operating profit: *
Production & Precision Ag
$706
$1,148
-39
$845
$1,486
-43
Small Ag & Turf
719
574
+25
916
698
+31
Construction & Forestry
561
379
+48
698
444
+57
Financial Services
251
207
+21
552
473
+17
Total operating profit
2,237
2,308
-3
3,011
3,101
-3
Reconciling items **
54
35
+54
132
138
-4
Income taxes
(518)
(539)
-4
(714)
(566)
+26
Net income attributable to Deere & Company
$1,773
$1,804
-2
$2,429
$2,673
-9
*Operating profit is income from continuing operations before corporate expenses, certain external interest expenses, certain foreign exchange gains and losses, and income taxes. Operating profit of Financial Services includes the effect of interest expense and foreign exchange gains and losses.
**Reconciling items are primarily corporate expenses, certain interest income and expenses, certain foreign exchange gains and losses, pension and postretirement benefit costs excluding the service cost component, and net income attributable to noncontrolling interests. DEERE & COMPANY
STATEMENTS OF CONSOLIDATED INCOME
For the Three and Six Months Ended May 3, 2026 and April 27, 2025
(In millions of dollars and shares except per share amounts) Unaudited
Three Months Ended
Six Months Ended
2026
2025
2026
2025
Net Sales and Revenues
Net sales
$11,778
$11,171
$19,779
$17,980
Finance and interest income
1,314
1,354
2,658
2,807
Other income
277
238
544
485
Total
13,369
12,763
22,981
21,272
Costs and Expenses
Cost of sales
8,266
7,609
14,547
12,646
Research and development expenses
583
549
1,137
1,075
Selling, administrative and general expenses
1,209
1,197
2,181
2,169
Interest expense
712
784
1,431
1,614
Other operating expenses
306
287
556
536
Total
11,076
10,426
19,852
18,040
Income of Consolidated Group before Income Taxes
2,293
2,337
3,129
3,232
Provision for income taxes
518
539
714
566
Income of Consolidated Group
1,775
1,798
2,415
2,666
Equity in income (loss) of unconsolidated affiliates
(5)
3
10
1
Net Income
1,770
1,801
2,425
2,667
Less: Net loss attributable to noncontrolling interests
(3)
(3)
(4)
(6)
Net Income Attributable to Deere & Company
$1,773
$1,804
$2,429
$2,673
Per Share Data
Basic
$6.57
$6.65
$8.99
$9.85
Diluted
6.55
6.64
8.97
9.82
Dividends declared
1.62
1.62
3.24
3.24
Dividends paid
1.62
1.62
3.24
3.09
Average Shares Outstanding
Basic
270.1
271.1
270.2
271.3
Diluted
270.8
271.8
270.9
272.1
See Condensed Notes to Interim Consolidated Financial Statements. DEERE & COMPANYCONDENSED CONSOLIDATED BALANCE SHEETS(In millions of dollars) Unaudited
May 3
November 2
April 27
2026
2025
2025Assets
Cash and cash equivalents
$7,905
$8,276
$7,991Marketable securities
1,430
1,411
1,272Trade accounts and notes receivable – net
7,571
5,317
6,748Financing receivables – net
42,916
44,575
43,029Financing receivables securitized – net
6,100
6,831
7,765Other receivables
2,582
2,403
2,975Equipment on operating leases – net
7,514
7,600
7,336Inventories
8,188
7,406
7,870Property and equipment – net
8,035
8,079
7,555Goodwill
4,513
4,188
4,094Other intangible assets – net
975
892
964Retirement benefits
3,450
3,273
3,133Deferred income taxes
2,361
2,284
2,088Other assets
3,461
3,461
3,483Total Assets
$107,001
$105,996
$106,303
Liabilities and Stockholders' Equity
Liabilities
Short-term borrowings
$15,632
$13,796
$15,948Short-term securitization borrowings
5,929
6,596
7,562Accounts payable and accrued expenses
13,653
13,909
13,345Deferred income taxes
422
434
496Long-term borrowings
42,261
43,544
42,811Retirement benefits and other liabilities
1,644
1,710
1,763Total liabilities
79,541
79,989
81,925
Redeemable noncontrolling interest
47
51
83
Stockholders' Equity
Total Deere & Company stockholders' equity
27,406
25,950
24,287Noncontrolling interests
7
6
8Total stockholders' equity
27,413
25,956
24,295Total Liabilities and Stockholders' Equity
$107,001
$105,996
$106,303
See Condensed Notes to Interim Consolidated Financial Statements. DEERE & COMPANYSTATEMENTS OF CONSOLIDATED CASH FLOWSFor the Six Months Ended May 3, 2026 and April 27, 2025(In millions of dollars) Unaudited
2026
2025Cash Flows from Operating Activities
Net income
$2,425
$2,667Adjustments to reconcile net income to net cash provided by operating activities:
Provision for credit losses
127
174Depreciation and amortization
1,184
1,104Impairments and other adjustments
(32)Share-based compensation expense
69
54Provision (credit) for deferred income taxes
(68)
11Changes in assets and liabilities:
Receivables related to sales
(1,084)
(1,069)Inventories
(738)
(772)Accounts payable and accrued expenses
(333)
(898)Accrued income taxes payable/receivable
(5)
(147)Retirement benefits
(290)
(794)Other
(245)
270Net cash provided by operating activities
1,042
568
Cash Flows from Investing Activities
Collections of receivables (excluding receivables related to sales)
14,385
14,348Proceeds from maturities and sales of marketable securities
258
245Proceeds from sales of equipment on operating leases
1,019
1,001Cost of receivables acquired (excluding receivables related to sales)
(13,157)
(12,744)Acquisition of business, net of cash acquired
(439)
Purchases of marketable securities
(284)
(347)Purchases of property and equipment
(451)
(555)Cost of equipment on operating leases acquired
(1,295)
(1,254)Collections of receivables from unconsolidated affiliates
152
234Collateral on derivatives – net
(8)
27Other
(87)
(176)Net cash provided by investing activities
93
779
Cash Flows from Financing Activities
Net proceeds in short-term borrowings (original maturities three months or less)
2,246
551Proceeds from borrowings issued (original maturities greater than three months)
3,451
5,156Payments of borrowings (original maturities greater than three months)
(5,935)
(4,837)Repurchases of common stock
(500)
(838)Dividends paid
(878)
(843)Other
(11)
(10)Net cash used for financing activities
(1,627)
(821)
Effect of Exchange Rate Changes on Cash, Cash Equivalents, and
Restricted Cash
94
20
Net Increase (Decrease) in Cash, Cash Equivalents, and Restricted Cash
(398)
546Cash, Cash Equivalents, and Restricted Cash at Beginning of Period
8,533
7,633Cash, Cash Equivalents, and Restricted Cash at End of Period
$8,135
$8,179
See Condensed Notes to Interim Consolidated Financial Statements.DEERE & COMPANY
Condensed Notes to Interim Consolidated Financial Statements
(In millions of dollars) Unaudited(1) AcquisitionIn February 2026, the company acquired Tenna LLC (Tenna), a U.S. construction technology company that offers mixed-fleet equipment operations and asset tracking solutions. The purchase price, net of cash acquired, was $439 million. Tenna was assigned to the CF segment. Most of the purchase price for this acquisition was allocated to goodwill and other intangible assets.(2) Special ItemsDiscrete Tax ItemsIn the first quarter of 2025, the company recorded favorable net discrete tax items primarily due to tax benefits of $110 million related to the realization of foreign net operating losses from the consolidation of certain subsidiaries and $53 million from an adjustment to an uncertain tax position of a foreign subsidiary.Banco John Deere S.A.In 2024, the company entered into an agreement with a Brazilian bank, Banco Bradesco S.A. (Bradesco), for Bradesco to invest and become a 50% owner of the company's wholly-owned subsidiary in Brazil, Banco John Deere S.A. (BJD). BJD finances retail and wholesale loans for agricultural, construction, and forestry equipment. The transaction is intended to reduce the company's incremental risk as it continues to grow in the Brazilian market.The BJD business was reclassified as held for sale in 2024. In January 2025, the valuation allowance on assets held for sale decreased, resulting in a pretax and after-tax gain (reversal of previous losses) of $32 million recorded in "Selling, administrative and general expenses" in the six months ended April 27, 2025. The valuation allowance changes are presented in "Impairments and other adjustments" in the statements of consolidated cash flows.The company deconsolidated BJD upon completion of the transaction in February 2025. The company accounts for its investment in BJD using the equity method of accounting and results of its operations are reported in "Equity in income (loss) of unconsolidated affiliates" within the Financial Services segment. The company reports investments in unconsolidated affiliates and receivables from unconsolidated affiliates in "Other assets" and "Other receivables," respectively.(3) The consolidated financial statements represent the consolidation of all the company's subsidiaries. The supplemental consolidating data in Note 4 to the financial statements is presented for informational purposes. Equipment operations represent the enterprise without Financial Services. Equipment operations include the company's Production & Precision Agriculture operations, Small Agriculture & Turf operations, Construction & Forestry operations, and other corporate assets, liabilities, revenues, and expenses not reflected within Financial Services. Transactions between the equipment operations and Financial Services have been eliminated to arrive at the consolidated financial statements.DEERE & COMPANY
(4) SUPPLEMENTAL CONSOLIDATING DATA
STATEMENTS OF INCOME
For the Three Months Ended May 3, 2026 and April 27, 2025
(In millions of dollars) Unaudited
EQUIPMENT
FINANCIAL
OPERATIONS
SERVICES
ELIMINATIONS
CONSOLIDATED
2026
2025
2026
2025
2026
2025
2026
2025
Net Sales and Revenues
Net sales
$11,778
$11,171
$11,778
$11,171
Finance and interest income
110
108
$1,359
$1,380
$(155)
$(134)
1,314
1,3541
Other income
212
187
150
121
(85)
(70)
277
2382, 3, 4
Total
12,100
11,466
1,509
1,501
(240)
(204)
13,369
12,763
Costs and Expenses
Cost of sales
8,277
7,617
(11)
(8)
8,266
7,6094
Research and development expenses
583
549
583
549
Selling, administrative and general expenses
980
961
231
238
(2)
(2)
1,209
1,1974
Interest expense
102
94
649
721
(39)
(31)
712
7841
Interest compensation to Financial Services
116
103
(116)
(103)
1
Other operating expenses
9
12
369
335
(72)
(60)
306
2873, 4, 5
Total
10,067
9,336
1,249
1,294
(240)
(204)
11,076
10,426
Income before Income Taxes
2,033
2,130
260
207
2,293
2,337
Provision for income taxes
452
490
66
49
518
539
Income after Income Taxes
1,581
1,640
194
158
1,775
1,798
Equity in income (loss) of unconsolidated affiliates
(1)
(4)
3
(5)
3
Net Income
1,580
1,640
190
161
1,770
1,801
Less: Net loss attributable to
noncontrolling interests
(3)
(3)
(3)
(3)
Net Income Attributable to Deere & Company
$1,583
$1,643
$190
$161
$1,773
$1,804
1Elimination of intercompany interest income and expense.2Elimination of equipment operations' margin from inventory transferred to equipment on operating leases.3Elimination of income and expenses between equipment operations and Financial Services related to intercompany guarantees of investments in certain international markets.4Elimination of intercompany service revenues and fees.5Elimination of Financial Services' lease depreciation expense related to inventory transferred to equipment on operating leases. DEERE & COMPANY
SUPPLEMENTAL CONSOLIDATING DATA (Continued)
STATEMENTS OF INCOME
For the Six Months Ended May 3, 2026 and April 27, 2025
(In millions of dollars) Unaudited
EQUIPMENT
FINANCIAL
OPERATIONS
SERVICES
ELIMINATIONS
CONSOLIDATED
2026
2025
2026
2025
2026
2025
2026
2025
Net Sales and Revenues
Net sales
$19,779
$17,980
$19,779
$17,980
Finance and interest income
230
217
$2,710
$2,835
$(282)
$(245)
2,658
2,8071
Other income
425
391
287
239
(168)
(145)
544
4852, 3, 4
Total
20,434
18,588
2,997
3,074
(450)
(390)
22,981
21,272
Costs and Expenses
Cost of sales
14,568
12,662
(21)
(16)
14,547
12,6464
Research and development expenses
1,137
1,075
1,137
1,075
Selling, administrative and general expenses
1,787
1,761
398
412
(4)
(4)
2,181
2,1694
Interest expense
195
178
1,313
1,487
(77)
(51)
1,431
1,6141
Interest compensation to Financial Services
205
194
(205)
(194)
1
Other operating expenses
(37)
(38)
736
699
(143)
(125)
556
5363, 4, 5
Total
17,855
15,832
2,447
2,598
(450)
(390)
19,852
18,040
Income before Income Taxes
2,579
2,756
550
476
3,129
3,232
Provision for income taxes
587
477
127
89
714
566
Income after Income Taxes
1,992
2,279
423
387
2,415
2,666
Equity in income (loss) of unconsolidated affiliates
(1)
(3)
11
4
10
1
Net Income
1,991
2,276
434
391
2,425
2,667
Less: Net loss attributable to
noncontrolling interests
(4)
(6)
(4)
(6)
Net Income Attributable to Deere & Company
$1,995
$2,282
$434
$391
$2,429
$2,673
1Elimination of intercompany interest income and expense.2Elimination of equipment operations' margin from inventory transferred to equipment on operating leases.3Elimination of income and expenses between equipment operations and Financial Services related to intercompany guarantees of investments in certain international markets.4Elimination of intercompany service revenues and fees.5Elimination of Financial Services' lease depreciation expense related to inventory transferred to equipment on operating leases. DEERE & COMPANY
SUPPLEMENTAL CONSOLIDATING DATA (Continued)
CONDENSED BALANCE SHEETS
(In millions of dollars) Unaudited
EQUIPMENT
FINANCIAL
OPERATIONS
SERVICES
ELIMINATIONS
CONSOLIDATED
May 3
Nov 2
Apr 27
May 3
Nov 2
Apr 27
May 3
Nov 2
Apr 27
May 3
Nov 2
Apr 27
2026
2025
2025
2026
2025
2025
2026
2025
2025
2026
2025
2025
Assets
Cash and cash equivalents
$5,917
$6,340
$6,331
$1,988
$1,936
$1,660
$7,905
$8,276
$7,991
Marketable securities
173
217
139
1,257
1,194
1,133
1,430
1,411
1,272
Receivables from Financial
Services
4,642
4,649
2,497
$(4,642)
$(4,649)
$(2,497)
6
Trade accounts and notes
receivable – net
1,579
1,316
1,429
8,001
5,900
7,406
(2,009)
(1,899)
(2,087)
7,571
5,317
6,7487
Financing receivables – net
102
88
82
42,814
44,487
42,947
42,916
44,575
43,029
Financing receivables
securitized – net
1
1
2
6,099
6,830
7,763
6,100
6,831
7,765
Other receivables
2,062
1,809
2,009
573
658
1,009
(53)
(64)
(43)
2,582
2,403
2,9758
Equipment on operating
leases – net
7,514
7,600
7,336
7,514
7,600
7,336
Inventories
8,188
7,406
7,870
8,188
7,406
7,870
Property and equipment – net
8,004
8,047
7,523
31
32
32
8,035
8,079
7,555
Goodwill
4,513
4,188
4,094
4,513
4,188
4,094
Other intangible assets – net
975
892
964
975
892
964
Retirement benefits
3,351
3,181
3,046
101
94
89
(2)
(2)
(2)
3,450
3,273
3,133
Deferred income taxes
2,532
2,507
2,377
45
46
42
(216)
(269)
(331)
2,361
2,284
2,0889
Other assets
2,358
2,218
2,349
1,126
1,244
1,152
(23)
(1)
(18)
3,461
3,461
3,483
Total Assets
$44,397
$42,859
$40,712
$69,549
$70,021
$70,569
$(6,945)
$(6,884)
$(4,978)
$107,001
$105,996
$106,303
Liabilities and
Stockholders' Equity
Liabilities
Short-term borrowings
$397
$414
$241
$15,235
$13,382
$15,707
$15,632
$13,796
$15,948
Short-term securitization
borrowings
1
1
1
5,928
6,595
7,561
5,929
6,596
7,562
Payables to equipment operations
4,642
4,649
2,497
$(4,642)
$(4,649)
$(2,497)
6
Accounts payable and
accrued expenses
12,600
12,757
12,180
3,138
3,116
3,313
(2,085)
(1,964)
(2,148)
13,653
13,909
13,3457, 8
Deferred income taxes
331
347
405
307
356
422
(216)
(269)
(331)
422
434
4969
Long-term borrowings
8,857
8,756
8,685
33,404
34,788
34,126
42,261
43,544
42,811
Retirement benefits and
other liabilities
1,579
1,646
1,695
67
66
70
(2)
(2)
(2)
1,644
1,710
1,763
Total liabilities
23,765
23,921
23,207
62,721
62,952
63,696
(6,945)
(6,884)
(4,978)
79,541
79,989
81,925
Redeemable noncontrolling
interest
47
51
83
47
51
83
Stockholders' Equity
Total Deere & Company
stockholders' equity
27,406
25,950
24,287
6,828
7,069
6,873
(6,828)
(7,069)
(6,873)
27,406
25,950
24,28710
Noncontrolling interests
7
6
8
7
6
8
Financial Services' equity
(6,828)
(7,069)
(6,873)
6,828
7,069
6,873
10
Adjusted total stockholders'
equity
20,585
18,887
17,422
6,828
7,069
6,873
27,413
25,956
24,295
Total Liabilities and
Stockholders' Equity
$44,397
$42,859
$40,712
$69,549
$70,021
$70,569
$(6,945)
$(6,884)
$(4,978)
$107,001
$105,996
$106,303
6 Elimination of receivables / payables between equipment operations and Financial Services.7 Primarily reclassification of sales incentive accruals on receivables sold to Financial Services.8 Reclassification of other receivables / payables.9 Reclassification of deferred tax assets / liabilities in the same taxing jurisdictions.10 Elimination of Financial Services' equity. DEERE & COMPANY
SUPPLEMENTAL CONSOLIDATING DATA (Continued)
STATEMENTS OF CASH FLOWS
For the Six Months Ended May 3, 2026 and April 27, 2025
(In millions of dollars) Unaudited
EQUIPMENT
FINANCIAL
OPERATIONS
SERVICES
ELIMINATIONS
CONSOLIDATED
2026
2025
2026
2025
2026
2025
2026
2025
Cash Flows from Operating Activities
Net income
$1,991
$2,276
$434
$391
$2,425
$2,667
Adjustments to reconcile net income to net cash provided
by operating activities:
Provision for credit losses
1
11
126
163
127
174
Depreciation and amortization
689
643
546
529
$(51)
$(68)
1,184
1,10411
Impairments and other adjustments
(32)
(32)
Share-based compensation expense
69
54
69
5412
Distributed earnings of Financial Services
734
984
(734)
(984)
13
Provision (credit) for deferred income taxes
(19)
(153)
(49)
164
(68)
11
Changes in assets and liabilities:
Receivables related to sales
(225)
(185)
(859)
(884)
(1,084)
(1,069)14, 16
Inventories
(649)
(691)
(89)
(81)
(738)
(772)15
Accounts payable and accrued expenses
(237)
(1,069)
14
102
(110)
69
(333)
(898)16
Accrued income taxes payable/receivable
15
(77)
(20)
(70)
(5)
(147)
Retirement benefits
(285)
(753)
(5)
(41)
(290)
(794)
Other
(335)
59
140
224
(50)
(13)
(245)
27011, 12, 15
Net cash provided by operating activities
1,680
1,045
1,186
1,430
(1,824)
(1,907)
1,042
568
Cash Flows from Investing Activities
Collections of receivables (excluding receivables related
to sales)
14,641
14,684
(256)
(336)
14,385
14,34814
Proceeds from maturities and sales of marketable
securities
91
18
167
227
258
245
Proceeds from sales of equipment on operating leases
1,019
1,001
1,019
1,001
Cost of receivables acquired (excluding receivables related
to sales)
(13,273)
(12,875)
116
131
(13,157)
(12,744)14
Acquisition of business, net of cash acquired
(439)
(439)
Purchases of marketable securities
(42)
(20)
(242)
(327)
(284)
(347)
Purchases of property and equipment
(451)
(555)
(451)
(555)
Cost of equipment on operating leases acquired
(1,415)
(1,363)
120
109
(1,295)
(1,254)15
Increase in trade and wholesale receivables
(1,110)
(1,019)
1,110
1,019
14
Collections of receivables from unconsolidated affiliates
183
152
51
152
234
Collateral on derivatives – net
2
3
(10)
24
(8)
27
Other
(54)
(72)
(33)
(104)
(87)
(176)
Net cash provided by (used for) investing activities
(893)
(443)
(104)
299
1,090
923
93
779
Cash Flows from Financing Activities
Net proceeds (payments) in short-term borrowings (original
maturities three months or less)
(4)
65
2,250
486
2,246
551
Change in intercompany receivables/payables
21
428
(21)
(428)
Proceeds from borrowings issued (original maturities
greater than three months)
252
2,043
3,199
3,113
3,451
5,156
Payments of borrowings (original maturities greater than
three months)
(181)
(766)
(5,754)
(4,071)
(5,935)
(4,837)
Repurchases of common stock
(500)
(838)
(500)
(838)
Dividends paid
(878)
(843)
(734)
(984)
734
984
(878)
(843)13
Other
5
(4)
(16)
(6)
(11)
(10)
Net cash provided by (used for) financing activities
(1,285)
85
(1,076)
(1,890)
734
984
(1,627)
(821)
Effect of Exchange Rate Changes on Cash, Cash
Equivalents, and Restricted Cash
79
22
15
(2)
94
20
Net Increase (Decrease) in Cash, Cash Equivalents,
and Restricted Cash
(419)
709
21
(163)
(398)
546
Cash, Cash Equivalents, and Restricted Cash at
Beginning of Period
6,364
5,643
2,169
1,990
8,533
7,633
Cash, Cash Equivalents, and Restricted Cash at
End of Period
$5,945
$6,352
$2,190
$1,827
$8,135
$8,179
11Elimination of depreciation on leases related to inventory transferred to equipment on operating leases.12Reclassification of share-based compensation expense.13Elimination of dividends from Financial Services to the equipment operations, which are included in the equipment operations operating activities.14Primarily reclassification of receivables related to the sale of equipment.15Reclassification of direct lease agreements with retail customers.16Reclassification of sales incentive accruals on receivables sold to Financial Services. View original content to download multimedia:https://www.prnewswire.com/news-releases/deere-reports-second-quarter-net-income-of-1-773-billion-302778847.htmlSOURCE Deere & Company Original: Deere Reports Second Quarter Net Income of $1.773 Billion
US Market News
4月前
Deere Reports First Quarter Net Income of $656 MillionFebruary 19, 2026 6:21 AM
PR Newswire (Canada)
First quarter shipments ahead of plan as order books strengthenDiverse customer segments and geographies enable resilience and growthNet income guidance range increased to $4.5 billion - $5.0 billionMOLINE, Ill., Feb. 19, 2026 /CNW/ -- Deere & Company (NYSE: DE) reported net income of $656 million for the first quarter ended February 1, 2026, or $2.42 per share, compared with net income of $869 million, or $3.19 per share, for the quarter ended January 26, 2025.
Worldwide net sales and revenues increased 13 percent, to $9,611 million, in the most recent quarter. Net sales were $8,001 million for the quarter, compared with $6,809 million in the same quarter of 2025."While the global large agriculture industry continues to experience challenges, we're encouraged by the ongoing recovery in demand within both the construction and small agriculture segments," said John May, chairman and CEO of John Deere. "These positive developments reinforce our belief that 2026 represents the bottom of the current cycle and provides us with a strong foundation for accelerated growth going forward."Company Outlook & SummaryNet income attributable to Deere & Company for fiscal 2026 is forecasted to be in a range of $4.5 billion to $5.0 billion."Our sustained investment in research and development throughout the cycle is yielding measurable results as we move toward launching a wide range of innovative products and solutions across all business segments," stated May. "These advancements underscore the value of maintaining a robust portfolio that spans broad markets and regions worldwide, which should position us for success as we transition out of the current cycle."
Deere & Company
First Quarter
$ in millions, except per share amounts
2026
2025
% Change
Net sales and revenues
$9,611
$8,508
13 %
Net income
$656
$869
-25 %
Fully diluted EPS
$2.42
$3.19
Results for the prior period were affected by special items. See Note 1 to the financial statements for further details. The cost of additional tariffs for each segment is included in the "Production costs" category below.
Production & Precision Agriculture
First Quarter
$ in millions
2026
2025
% Change
Net sales
$3,163
$3,067
3 %
Operating profit
$139
$338
-59 %
Operating margin
4.4 %
11.0 %
Production & Precision Agriculture sales increased for the quarter as a result of the positive effects of foreign currency translation. Operating profit decreased primarily due to higher tariffs, unfavorable sales mix, and higher warranty expenses.
Small Agriculture & Turf
First Quarter
$ in millions
2026
2025
% Change
Net sales
$2,168
$1,748
24 %
Operating profit
$196
$124
58 %
Operating margin
9.0 %
7.1 %
Small Agriculture & Turf sales increased for the quarter as a result of higher shipment volumes and the positive effects of foreign currency translation. Operating profit increased primarily due to higher shipment volumes / sales mix and price realization, partially offset by higher tariffs.
Construction & Forestry
First Quarter
$ in millions
2026
2025
% Change
Net sales
$2,670
$1,994
34 %
Operating profit
$137
$65
111 %
Operating margin
5.1 %
3.3 %
Construction & Forestry sales increased for the quarter as a result of higher shipment volumes and the positive effects of foreign currency translation. Operating profit increased primarily due to higher shipment volumes / sales mix and production efficiencies, partially offset by higher tariffs.
Financial Services
First Quarter
$ in millions
2026
2025
% Change
Net income
$244
$230
6 %
Financial Services net income increased primarily due to favorable financing spreads and a lower provision for credit losses, partially offset by a favorable special item recorded in the prior period described in Note 1 to the financial statements.
Industry Outlook for Fiscal 2026
Agriculture & Turf
U.S. & Canada:
Large Ag
Down 15 to 20%
Small Ag & Turf
Flat to up 5%
Europe
Flat to up 5%
South America (Tractors & Combines)
Down ~5%
Asia
Flat to down 5%
Construction & Forestry
U.S. & Canada:
Construction Equipment
Up ~5%
Compact Construction Equipment
Up ~5%
Global Forestry
Flat
Global Roadbuilding
Up ~5%
Deere Segment Outlook for Fiscal 2026
Currency
Price
$ in millions
Net Sales
Translation
Realization
Production & Precision Ag
Down 5 to 10%
+3.0 %
~ +1.5%
Small Ag & Turf
Up ~15%
+2.0 %
~ +2.0%
Construction & Forestry
Up ~15%
+2.0 %
~ +2.5%
Financial Services
Net Income
~ $840
FORWARD-LOOKING STATEMENTSCertain statements contained herein, including in the section entitled "Company Outlook & Summary," "Industry Outlook for Fiscal 2026," "Deere Segment Outlook for Fiscal 2026," and "Condensed Notes to Interim Consolidated Financial Statements" relating to future events, expectations, and trends constitute "forward-looking statements" as defined in the Private Securities Litigation Reform Act of 1995 and involve factors that are subject to change, assumptions, risks, and uncertainties that could cause actual results to differ materially. Some of these risks and uncertainties could affect all lines of the company's operations generally while others could more heavily affect a particular line of business.Forward-looking statements are based on currently available information and current assumptions, expectations, and projections about future events and should not be relied upon. Except as required by law, the company expressly disclaims any obligation to update or revise its forward-looking statements. Many factors, risks, and uncertainties could cause actual results to differ materially from these forward-looking statements. Among these factors are risks related to:the agricultural business cycle, which can be unpredictable and is affected by factors such as farm income, international trade, world grain stocks, crop yields, available farm acres, soil conditions, prices for commodities and livestock, input costs, government farm programs, availability of transport for crops as well as adverse macroeconomic conditions, including unemployment, inflation, interest rate volatility, changes in consumer practices due to slower economic growth or a recession, and regional or global liquidity constraintsthe uncertainty of government policies and actions with respect to the global trade environment including increased and proposed tariffs announced by the U.S. government, and retaliatory trade regulationspolitical, economic, and social instability in the geographies in which the company operatesworldwide demand for food and different forms of renewable energy impacting the price of farm commodities and consequently the demand for the company's equipmentrationalization, restructuring, relocation, expansion and/or reconfiguration of manufacturing and warehouse facilitiesaccurately forecasting customer demand for products and services and adequately managing inventoryuncertainty of the company's ability to sell products domestically or internationally, manage increased costs of production, absorb or pass on increased expenses, and accurately predict financial results and industry trendsavailability and price of raw materials, components, and whole goodsdelays or disruptions in the company's supply chainchanges in climate patterns, unfavorable weather events, and natural disasterssuppliers' and manufacturers' business practices and compliance with laws applicable to topics such as human rights, safety, environmental, and fair wageshigher interest rates and currency fluctuations which could adversely affect the U.S. dollar, customer confidence, access to capital, and demand for the company's products and solutionsthe ability to attract, develop, engage, and retain qualified employeesability to adapt in highly competitive markets, including understanding and meeting customers' changing expectations for products and solutions, including delivery and utilization of precision technologythe ability to execute business strategies, including the company's Smart Industrial Operating Model and refined Leap Ambitionsdealer practices and their ability to manage new and used inventory, distribute the company's products, and to provide support and service for precision technology solutionsthe ability to realize anticipated benefits of acquisitions and joint ventures, including challenges with successfully integrating operations and internal control processesnegative claims or publicity that damage the company's reputation or brandthe impact of workforce reductions on company culture, employee retention and morale, and institutional knowledgelabor relations and contracts, including work stoppages and other disruptionssecurity breaches, cybersecurity attacks, technology failures, and other disruptions to the company's information technology infrastructure and productsleveraging artificial intelligence and machine learning within the company's business processeschanges to existing laws and regulations, including the implementation of new, more stringent laws, as well as compliance with a variety of U.S., foreign and international laws, regulations, and policies relating to, but not limited to the following: advertising, anti-bribery and anti-corruption, anti-money laundering, antitrust, consumer finance, cybersecurity, data privacy, encryption, environmental (including climate change and engine emissions), farming, foreign exchange controls and cash repatriation restrictions, foreign ownership and investment, health and safety, human rights, import / export and trade, labor and employment, product liability, tariffs, tax, telematics, and telecommunicationsgovernmental and other actions designed to address climate change in connection with a transition to a lower-carbon economywarranty claims, post-sales repairs or recalls, product liability litigation, and regulatory investigations because of the deficient operation of the company's productsinvestigations, claims, lawsuits, or other legal proceedings, including the lawsuit filed by the Federal Trade Commission (FTC) and the Attorneys General of the States of Arizona, Illinois, Michigan, Minnesota, and Wisconsin alleging that the company unlawfully withheld self-repair capabilities from farmers and independent repair providersloss of or challenges to intellectual property rightsFurther information concerning the company or its businesses, including factors that could materially affect the company's financial results, is included in the company's filings with the SEC (including, but not limited to, the factors discussed in Item 1A. "Risk Factors" of the company's most recent Annual Report on Form 10-K). There also may be other factors that the company cannot anticipate or that are not described herein because the company does not currently perceive them to be material. DEERE & COMPANYFIRST QUARTER 2026 PRESS RELEASE(In millions of dollars) Unaudited
Three Months Ended
February 1
January 26
%
2026
2025
Change
Net sales and revenues:
Production & Precision Ag net sales
$3,163
$3,067
+3
Small Ag & Turf net sales
2,168
1,748
+24
Construction & Forestry net sales
2,670
1,994
+34
Financial Services revenues
1,384
1,470
-6
Other revenues
226
229
-1
Total net sales and revenues
$9,611
$8,508
+13
Operating profit: *
Production & Precision Ag
$139
$338
-59
Small Ag & Turf
196
124
+58
Construction & Forestry
137
65
+111
Financial Services
301
266
+13
Total operating profit
773
793
-3
Reconciling items **
79
103
-23
Income taxes
(196)
(27)
+626
Net income attributable to Deere & Company
$656
$869
-25
* Operating profit is income from continuing operations before corporate expenses, certain external interest expenses, certain foreign exchange gains and losses, and income taxes. Operating profit of Financial Services includes the effect of interest expense and foreign exchange gains and losses.
** Reconciling items are primarily corporate expenses, certain interest income and expenses, certain foreign exchange gains and losses, pension and postretirement benefit costs excluding the service cost component, and net income attributable to noncontrolling interests. DEERE & COMPANYSTATEMENTS OF CONSOLIDATED INCOMEFor the Three Months Ended February 1, 2026 and January 26, 2025(In millions of dollars and shares except per share amounts) Unaudited
2026
2025Net Sales and Revenues
Net sales
$8,001
$6,809Finance and interest income
1,343
1,453Other income
267
246Total
9,611
8,508
Costs and Expenses
Cost of sales
6,280
5,037Research and development expenses
554
526Selling, administrative and general expenses
972
972Interest expense
719
829Other operating expenses
250
249Total
8,775
7,613
Income of Consolidated Group before Income Taxes
836
895Provision for income taxes
196
27
Income of Consolidated Group
640
868Equity in income (loss) of unconsolidated affiliates
15
(1)
Net Income
655
867Less: Net loss attributable to noncontrolling interests
(1)
(2)Net Income Attributable to Deere & Company
$656
$869
Per Share Data
Basic
$2.43
$3.20Diluted
2.42
3.19Dividends declared
1.62
1.62Dividends paid
1.62
1.47
Average Shares Outstanding
Basic
270.3
271.6Diluted
270.9
272.3
See Condensed Notes to Interim Consolidated Financial Statements. DEERE & COMPANYCONDENSED CONSOLIDATED BALANCE SHEETS(In millions of dollars) Unaudited
February 1
November 2
January 26
2026
2025
2025Assets
Cash and cash equivalents
$6,798
$8,276
$6,601Marketable securities
1,398
1,411
1,214Trade accounts and notes receivable – net
5,993
5,317
4,931Financing receivables – net
42,113
44,575
41,396Financing receivables securitized – net
6,479
6,831
8,257Other receivables
2,411
2,403
2,979Equipment on operating leases – net
7,512
7,600
7,157Inventories
8,286
7,406
7,744Property and equipment – net
8,084
8,079
7,425Goodwill
4,280
4,188
3,872Other intangible assets – net
880
892
937Retirement benefits
3,378
3,273
3,018Deferred income taxes
2,268
2,284
1,852Other assets
3,556
3,461
2,807Assets held for sale
2,929Total Assets
$103,436
$105,996
$103,119
Liabilities and Stockholders' Equity
Liabilities
Short-term borrowings
$14,392
$13,796
$12,811Short-term securitization borrowings
6,283
6,596
8,014Accounts payable and accrued expenses
12,533
13,909
12,162Deferred income taxes
434
434
448Long-term borrowings
41,804
43,544
43,556Retirement benefits and other liabilities
1,633
1,710
1,734Liabilities held for sale
1,830Total liabilities
77,079
79,989
80,555
Redeemable noncontrolling interest
50
51
78
Stockholders' Equity
Total Deere & Company stockholders' equity
26,300
25,950
22,479Noncontrolling interests
7
6
7Total stockholders' equity
26,307
25,956
22,486Total Liabilities and Stockholders' Equity
$103,436
$105,996
$103,119
See Condensed Notes to Interim Consolidated Financial Statements. DEERE & COMPANYSTATEMENTS OF CONSOLIDATED CASH FLOWSFor the Three Months Ended February 1, 2026 and January 26, 2025(In millions of dollars) Unaudited
2026
2025Cash Flows from Operating Activities
Net income
$655
$867Adjustments to reconcile net income to net cash used for operating activities:
Provision for credit losses
36
69Depreciation and amortization
590
549Impairments and other adjustments
(32)Share-based compensation expense
41
28Provision for deferred income taxes
18
208Changes in assets and liabilities:
Receivables related to sales
350
1,063Inventories
(746)
(795)Accounts payable and accrued expenses
(1,486)
(1,845)Accrued income taxes payable/receivable
(88)
(540)Retirement benefits
(194)
(688)Other
(66)
(16)Net cash used for operating activities
(890)
(1,132)
Cash Flows from Investing Activities
Collections of receivables (excluding receivables related to sales)
8,098
8,137Proceeds from maturities and sales of marketable securities
144
61Proceeds from sales of equipment on operating leases
377
433Cost of receivables acquired (excluding receivables related to sales)
(6,023)
(6,045)Purchases of marketable securities
(129)
(141)Purchases of property and equipment
(256)
(352)Cost of equipment on operating leases acquired
(432)
(439)Collections of receivables from unconsolidated affiliates
105
Collateral on derivatives – net
(11)
(191)Other
(51)
(47)Net cash provided by investing activities
1,822
1,416
Cash Flows from Financing Activities
Net proceeds (payments) in short-term borrowings (original maturities three months or less)
848
(1,484)Proceeds from borrowings issued (original maturities greater than three months)
780
3,168Payments of borrowings (original maturities greater than three months)
(3,360)
(1,753)Repurchases of common stock
(302)
(441)Dividends paid
(441)
(403)Other
(15)
(10)Net cash used for financing activities
(2,490)
(923)
Effect of Exchange Rate Changes on Cash, Cash Equivalents, and Restricted Cash
98
(87)
Net Decrease in Cash, Cash Equivalents, and Restricted Cash
(1,460)
(726)Cash, Cash Equivalents, and Restricted Cash at Beginning of Period
8,533
7,633Cash, Cash Equivalents, and Restricted Cash at End of Period
$7,073
$6,907
See Condensed Notes to Interim Consolidated Financial Statements. DEERE & COMPANY
Condensed Notes to Interim Consolidated Financial Statements
(In millions of dollars) Unaudited(1) Special ItemsDiscrete Tax ItemsIn the first quarter of 2025, the company recorded favorable net discrete tax items primarily due to tax benefits of $110 million related to the realization of foreign net operating losses from the consolidation of certain subsidiaries and $53 million from an adjustment to an uncertain tax position of a foreign subsidiary.Banco John Deere S.A.In 2024, the company entered into an agreement with a Brazilian bank, Banco Bradesco S.A. (Bradesco), for Bradesco to invest and become 50% owner of the company's wholly-owned subsidiary in Brazil, Banco John Deere S.A. (BJD). BJD finances retail and wholesale loans for agricultural, construction, and forestry equipment. The transaction is intended to reduce the company's incremental risk as it continues to grow in the Brazilian market.The BJD business was reclassified as held for sale in 2024. In January 2025, the valuation allowance on assets held for sale decreased, resulting in a pretax and after-tax gain (reversal of previous losses) of $32 million recorded in "Selling, administrative and general expenses" in the three months ended January 26, 2025. The valuation allowance changes are presented in "Impairments and other adjustments" in the statements of consolidated cash flows.The company deconsolidated BJD upon completion of the transaction in February 2025. The company accounts for its investment in BJD using the equity method of accounting and results of its operations are reported in "Equity in income (loss) of unconsolidated affiliates" within the Financial Services segment. The company reports investments in unconsolidated affiliates and receivables from unconsolidated affiliates in "Other assets" and "Other receivables," respectively.(2) The consolidated financial statements represent the consolidation of all the company's subsidiaries. The supplemental consolidating data in Note 3 to the financial statements is presented for informational purposes. Equipment operations represent the enterprise without Financial Services. Equipment operations include the company's Production & Precision Agriculture operations, Small Agriculture & Turf operations, Construction & Forestry operations, and other corporate assets, liabilities, revenues, and expenses not reflected within Financial Services. Transactions between the equipment operations and Financial Services have been eliminated to arrive at the consolidated financial statements. DEERE & COMPANY
(3) SUPPLEMENTAL CONSOLIDATING DATA
STATEMENTS OF INCOME
For the Three Months Ended February 1, 2026 and January 26, 2025
(In millions of dollars) Unaudited
EQUIPMENT
FINANCIAL
OPERATIONS
SERVICES
ELIMINATIONS
CONSOLIDATED
2026
2025
2026
2025
2026
2025
2026
2025
Net Sales and Revenues
Net sales
$8,001
$6,809
$8,001
$6,809
Finance and interest income
120
110
$1,351
$1,455
$(128)
$(112)
1,343
1,4531
Other income
213
202
137
118
(83)
(74)
267
2462, 3, 4
Total
8,334
7,121
1,488
1,573
(211)
(186)
9,611
8,508
Costs and Expenses
Cost of sales
6,291
5,045
(11)
(8)
6,280
5,0374
Research and development expenses
554
526
554
526
Selling, administrative and general expenses
806
800
168
174
(2)
(2)
972
9724
Interest expense
93
84
664
766
(38)
(21)
719
8291
Interest compensation to Financial Services
90
91
(90)
(91)
1
Other operating expenses
(46)
(51)
366
364
(70)
(64)
250
2493, 4, 5
Total
7,788
6,495
1,198
1,304
(211)
(186)
8,775
7,613
Income before Income Taxes
546
626
290
269
836
895
Provision (credit) for income taxes
134
(13)
62
40
196
27
Income after Income Taxes
412
639
228
229
640
868
Equity in income (loss) of
unconsolidated affiliates
(1)
(2)
16
1
15
(1)
Net Income
411
637
244
230
655
867
Less: Net loss attributable to
noncontrolling interests
(1)
(2)
(1)
(2)
Net Income Attributable to Deere & Company
$412
$639
$244
$230
$656
$869
1 Elimination of intercompany interest income and expense.2 Elimination of equipment operations' margin from inventory transferred to equipment on operating leases.3 Elimination of income and expenses between equipment operations and Financial Services related to intercompany guarantees of investments in certain international markets.4 Elimination of intercompany service revenues and fees.5 Elimination of Financial Services' lease depreciation expense related to inventory transferred to equipment on operating leases. DEERE & COMPANYSUPPLEMENTAL CONSOLIDATING DATA (Continued)CONDENSED BALANCE SHEETS(In millions of dollars) Unaudited
EQUIPMENT
FINANCIAL
OPERATIONS
SERVICES
ELIMINATIONS
CONSOLIDATED
Feb 1
Nov 2
Jan 26
Feb 1
Nov 2
Jan 26
Feb 1
Nov 2
Jan 26
Feb 1
Nov 2
Jan 26
2026
2025
2025
2026
2025
2025
2026
2025
2025
2026
2025
2025
Assets
Cash and cash equivalents
$4,769
$6,340
$4,840
$2,029
$1,936
$1,761
$6,798
$8,276
$6,601
Marketable securities
146
217
114
1,252
1,194
1,100
1,398
1,411
1,214
Receivables from Financial
Services
4,132
4,649
1,826
$(4,132)
$(4,649)
$(1,826)
6
Trade accounts and notes
receivable – net
1,284
1,316
1,053
6,609
5,900
5,812
(1,900)
(1,899)
(1,934)
5,993
5,317
4,9317
Financing receivables – net
105
88
78
42,008
44,487
41,318
42,113
44,575
41,396
Financing receivables
securitized – net
1
2
6,479
6,830
8,255
6,479
6,831
8,257
Other receivables
1,841
1,809
2,367
621
658
654
(51)
(64)
(42)
2,411
2,403
2,9798
Equipment on operating
leases – net
7,512
7,600
7,157
7,512
7,600
7,157
Inventories
8,286
7,406
7,744
8,286
7,406
7,744
Property and equipment – net
8,053
8,047
7,392
31
32
33
8,084
8,079
7,425
Goodwill
4,280
4,188
3,872
4,280
4,188
3,872
Other intangible assets – net
880
892
937
880
892
937
Retirement benefits
3,282
3,181
2,933
98
94
86
(2)
(2)
(1)
3,378
3,273
3,018
Deferred income taxes
2,476
2,507
2,247
45
46
42
(253)
(269)
(437)
2,268
2,284
1,8529
Other assets
2,371
2,218
2,295
1,220
1,244
539
(35)
(1)
(27)
3,556
3,461
2,807
Assets held for sale
2,929
2,929
Total Assets
$41,905
$42,859
$37,700
$67,904
$70,021
$69,686
$(6,373)
$(6,884)
$(4,267)
$103,436
$105,996
$103,119
Liabilities and
Stockholders' Equity
Liabilities
Short-term borrowings
$366
$414
$1,101
$14,026
$13,382
$11,710
$14,392
$13,796
$12,811
Short-term
securitization borrowings
1
1
6,283
6,595
8,013
6,283
6,596
8,014
Payables to equipment
operations
4,132
4,649
1,826
$(4,132)
$(4,649)
$(1,826)
6
Accounts payable and
accrued expenses
11,387
12,757
10,869
3,132
3,116
3,296
(1,986)
(1,964)
(2,003)
12,533
13,909
12,1627, 8
Deferred income taxes
343
347
405
344
356
480
(253)
(269)
(437)
434
434
4489
Long-term borrowings
8,897
8,756
8,507
32,907
34,788
35,049
41,804
43,544
43,556
Retirement benefits and
other liabilities
1,568
1,646
1,668
67
66
67
(2)
(2)
(1)
1,633
1,710
1,734
Liabilities held for sale
1,830
1,830
Total liabilities
22,561
23,921
22,551
60,891
62,952
62,271
(6,373)
(6,884)
(4,267)
77,079
79,989
80,555
Redeemable noncontrolling
interest
50
51
78
50
51
78
Stockholders' Equity
Total Deere & Company
stockholders' equity
26,300
25,950
22,479
7,013
7,069
7,415
(7,013)
(7,069)
(7,415)
26,300
25,950
22,47910
Noncontrolling interests
7
6
7
7
6
7
Financial Services' equity
(7,013)
(7,069)
(7,415)
7,013
7,069
7,415
10
Adjusted total
stockholders' equity
19,294
18,887
15,071
7,013
7,069
7,415
26,307
25,956
22,486
Total Liabilities and Stockholders' Equity
$41,905
$42,859
$37,700
$67,904
$70,021
$69,686
$(6,373)
$(6,884)
$(4,267)
$103,436
$105,996
$103,119
6 Elimination of receivables / payables between equipment operations and Financial Services.7 Primarily reclassification of sales incentive accruals on receivables sold to Financial Services.8 Reclassification of other receivables / payables.9 Reclassification of deferred tax assets / liabilities in the same taxing jurisdictions.10 Elimination of Financial Services' equity. DEERE & COMPANYSUPPLEMENTAL CONSOLIDATING DATA (Continued)STATEMENTS OF CASH FLOWSFor the Three Months Ended February 1, 2026 and January 26, 2025(In millions of dollars) Unaudited
EQUIPMENT
FINANCIAL
OPERATIONS
SERVICES
ELIMINATIONS
CONSOLIDATED
2026
2025
2026
2025
2026
2025
2026
2025
Cash Flows from Operating Activities
Net income
$411
$637
$244
$230
$655
$867
Adjustments to reconcile net income to net cash provided by
(used for) operating activities:
Provision for credit losses
1
3
35
66
36
69
Depreciation and amortization
342
319
274
265
$(26)
$(35)
590
54911
Impairments and other adjustments
(32)
(32)
Share-based compensation expense
41
28
41
2812
Distributed earnings of Financial Services
350
162
(350)
(162)
13
Provision (credit) for deferred income taxes
29
(17)
(11)
225
18
208
Changes in assets and liabilities:
Receivables related to sales
18
140
332
923
350
1,06314, 16
Inventories
(728)
(784)
(18)
(11)
(746)
(795)15
Accounts payable and accrued expenses
(1,410)
(2,073)
(74)
6
(2)
222
(1,486)
(1,845)16
Accrued income taxes payable/receivable
(71)
(479)
(17)
(61)
(88)
(540)
Retirement benefits
(191)
(647)
(3)
(41)
(194)
(688)
Other
(94)
(136)
49
117
(21)
3
(66)
(16)11, 12, 15
Net cash provided by (used for) operating activities
(1,343)
(2,875)
497
775
(44)
968
(890)
(1,132)
Cash Flows from Investing Activities
Collections of receivables (excluding receivables
related to sales)
8,251
8,345
(153)
(208)
8,098
8,13714
Proceeds from maturities and sales of marketable securities
75
9
69
52
144
61
Proceeds from sales of equipment on operating leases
377
433
377
433
Cost of receivables acquired (excluding receivables
related to sales)
(6,044)
(6,093)
21
48
(6,023)
(6,045)14
Purchases of marketable securities
(129)
(141)
(129)
(141)
Purchases of property and equipment
(256)
(352)
(256)
(352)
Cost of equipment on operating leases acquired
(456)
(454)
24
15
(432)
(439)15
Decrease in trade and wholesale receivables
198
985
(198)
(985)
14
Collections of receivables from unconsolidated affiliates
105
105
Collateral on derivatives – net
1
(12)
(191)
(11)
(191)
Other
(33)
(51)
(18)
4
(51)
(47)
Net cash provided by (used for) investing activities
(213)
(394)
2,341
2,940
(306)
(1,130)
1,822
1,416
Cash Flows from Financing Activities
Net proceeds (payments) in short-term borrowings (original
maturities three months or less)
(38)
176
886
(1,660)
848
(1,484)
Change in intercompany receivables/payables
613
1,222
(613)
(1,222)
Proceeds from borrowings issued (original maturities greater
than three months)
166
2,032
614
1,136
780
3,168
Payments of borrowings (original maturities greater than
three months)
(78)
(12)
(3,282)
(1,741)
(3,360)
(1,753)
Repurchases of common stock
(302)
(441)
(302)
(441)
Dividends paid
(441)
(403)
(350)
(162)
350
162
(441)
(403)13
Other
(11)
(7)
(4)
(3)
(15)
(10)
Net cash provided by (used for) financing activities
(91)
2,567
(2,749)
(3,652)
350
162
(2,490)
(923)
Effect of Exchange Rate Changes on Cash, Cash
Equivalents, and Restricted Cash
78
(74)
20
(13)
98
(87)
Net Increase (Decrease) in Cash, Cash Equivalents, and
Restricted Cash
(1,569)
(776)
109
50
(1,460)
(726)
Cash, Cash Equivalents, and Restricted Cash at
Beginning of Period
6,364
5,643
2,169
1,990
8,533
7,633
Cash, Cash Equivalents, and Restricted Cash at
End of Period
$4,795
$4,867
$2,278
$2,040
$7,073
$6,907
11 Elimination of depreciation on leases related to inventory transferred to equipment on operating leases.12 Reclassification of share-based compensation expense.13 Elimination of dividends from Financial Services to the equipment operations, which are included in the equipment operations operating activities.14 Primarily reclassification of receivables related to the sale of equipment.15 Reclassification of direct lease agreements with retail customers.16 Reclassification of sales incentive accruals on receivables sold to Financial Services.
View original content to download multimedia:https://www.prnewswire.com/news-releases/deere-reports-first-quarter-net-income-of-656-million-302692550.htmlSOURCE John Deere Company
Original: Deere Reports First Quarter Net Income of $656 Million
 Hot Features

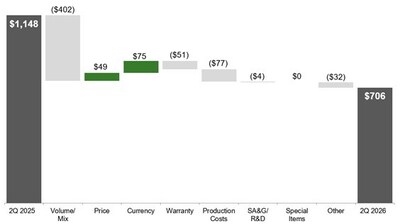

 DewDiligence
1月前
DewDiligence
1月前
 iHub News
1月前
iHub News
1月前
 bar1080
5月前
bar1080
5月前
 Monksdream
8月前
Monksdream
8月前
 fung_derf
10月前
fung_derf
10月前
 BottomBounce
1年前
BottomBounce
1年前
 Staypositive1
1年前
Staypositive1
1年前

 メールアドレスで登録


