| 34
Notes and Reconciliation of GAAP and Non-GAAP Financial
Measures (Cont.)
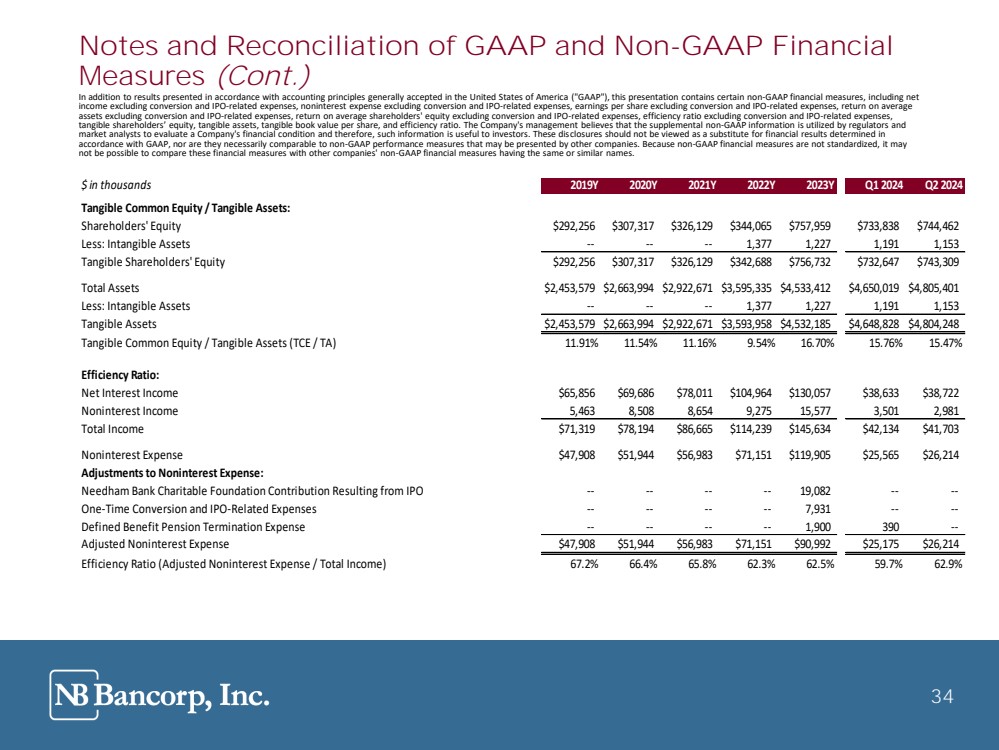
In addition to results presented in accordance with accounting principles generally accepted in the United States of America ("GAAP"), this presentation contains certain non-GAAP financial measures, including net
income excluding conversion and IPO-related expenses, noninterest expense excluding conversion and IPO-related expenses, earnings per share excluding conversion and IPO-related expenses, return on average
assets excluding conversion and IPO-related expenses, return on average shareholders' equity excluding conversion and IPO-related expenses, efficiency ratio excluding conversion and IPO-related expenses,
tangible harehol er ’ equity tangible a et tangible book alue per hare an e i ien y ratio. he Co pany' anage ent believes that the supplemental non-GAAP information is utilized by regulators and
market analysts to evaluate a Company's financial condition and therefore, such information is useful to investors. These disclosures should not be viewed as a substitute for financial results determined in
accordance with GAAP, nor are they necessarily comparable to non-GAAP performance measures that may be presented by other companies. Because non-GAAP financial measures are not standardized, it may
not be possible to compare these financial measures with other companies' non-GAAP financial measures having the same or similar names.
34
$ in thousands 2019Y 2020Y 2021Y 2022Y 2023Y Q1 2024 Q2 2024
Tangible Common Equity / Tangible Assets:
Shareholders' Equity $292,256 $307,317 $326,129 $344,065 $757,959 $733,838 $744,462
Less: Intangible Assets - - - - - - 1,377 1,227 1,191 1,153
Tangible Shareholders' Equity $292,256 $307,317 $326,129 $342,688 $756,732 $732,647 $743,309
Total Assets $2,453,579 $2,663,994 $2,922,671 $3,595,335 $4,533,412 $4,650,019 $4,805,401
Less: Intangible Assets - - - - - - 1,377 1,227 1,191 1,153
Tangible Assets $2,453,579 $2,663,994 $2,922,671 $3,593,958 $4,532,185 $4,648,828 $4,804,248
Tangible Common Equity / Tangible Assets (TCE / TA) 11.91% 11.54% 11.16% 9.54% 16.70% 15.76% 15.47%
Efficiency Ratio:
Net Interest Income $65,856 $69,686 $78,011 $104,964 $130,057 $38,633 $38,722
Noninterest Income 5,463 8,508 8,654 9,275 15,577 3,501 2,981
Total Income $71,319 $78,194 $86,665 $114,239 $145,634 $42,134 $41,703
Noninterest Expense $47,908 $51,944 $56,983 $71,151 $119,905 $25,565 $26,214
Adjustments to Noninterest Expense:
Needham Bank Charitable Foundation Contribution Resulting from IPO - - - - - - - - 19,082 - - - -
One-Time Conversion and IPO-Related Expenses - - - - - - - - 7,931 - - - -
Defined Benefit Pension Termination Expense - - - - - - - - 1,900 390 - -
Adjusted Noninterest Expense $47,908 $51,944 $56,983 $71,151 $90,992 $25,175 $26,214
Efficiency Ratio (Adjusted Noninterest Expense / Total Income) 67.2% 66.4% 65.8% 62.3% 62.5% 59.7% 62.9% |