 CA Market News
2月前
CA Market News
2月前
Chartwell Announces Strong First Quarter 2026 Results and Significant Advances on Key Strategic PrioritiesMay 7, 2026 5:12 PM
PR Newswire (Canada) MISSISSAUGA, ON, May 7, 2026 /CNW/ - Chartwell Retirement Residences ("Chartwell") (TSX: CSH.UN) announced today its results for the three months ended March 31, 2026.Highlights Property revenue increased $59.4 million or 24.4% in Q1 2026 compared to Q1 2025.Net income decreased $25.2 million in Q1 2026 compared to Q1 2025.Funds from operations ("FFO")(1) increased $29.4 million or 52.4%, and $0.07 per unit or 35.0% in Q1 2026 compared to Q1 2025.Same property adjusted net operating income ("NOI")(1) increased 15.6% from Q1 2025.Same property adjusted operating margin increased 230 basis points ("bps") to 42.0% from Q1 2025.Weighted average same property occupancy increased 400 bps to 94.7% from Q1 2025.Same property adjusted NOI per occupied suite ("NOIPOS")(1) increased 10.7% in Q1 2026 from Q1 2025."On the heels of the record year in 2025, our teams delivered a strong start to 2026, with same property NOI up 15.6%, and FFO per unit up 35%, driven by continued occupancy improvements and solid execution in all aspects of our business. I am grateful to our frontline and corporate support teams for their dedication and focus on creating exceptional experiences for those we have the privilege of serving. This strong operating and financial performance is the direct result of their excellent work," said Vlad Volodarski, Chartwell's Chief Executive Officer. "We continue building the sophistication, effectiveness and efficiency of our operating platform and property portfolio, including through the recently announced portfolio optimization, acquisitions and strategic partnerships. I am confident in our team's ability to continue driving this positive momentum and successfully execute on our strategic priorities."Results of Operations ($000s, except per unit amounts, number of units, per occupied suite
Three Months Ended
March 31amounts, and percentages)
20262025ChangeProperty revenue
302,950243,56859,382Direct property operating expense
179,211150,05629,155Net income
7,99233,194(25,202)FFO(1)
85,57856,16929,409FFO per unit(1)
0.270.200.07Weighted average number of units outstanding (000s)(2)
320,375277,94342,432G&A expenses
14,70217,083(2,381)Same property:
Adjusted resident revenue(1)
202,006184,35317,653Adjusted other property revenue(1)
2,8353,400(565)Adjusted property revenue(1)
204,841187,75317,088Adjusted DOE(1)
118,707113,2475,460Adjusted NOI(1)
86,13474,50611,628Adjusted operating margin(1)
42.0 %39.7 %2.3ppWeighted average occupancy rate(3)
94.7 %90.7 %4.0ppAdjusted resident revenue per occupied suite ("REVPOS")(1)
4,8254,596229Adjusted direct property operating expense per occupied suite ("DOEPOS")(1)
2,8352,82312NOIPOS(1)
2,0571,858199For Q1 2026, property revenue increased $59.4 million or 24.4%, and direct property operating expense increased $29.2 million or 19.4%.For Q1 2026, net income was $8.0 million compared to $33.2 million in Q1 2025 that included the gain on sale of $60.3 million due to the completed Welltower Transaction. The remaining differences are primarily due to:higher direct property operating expense,higher depreciation of property, plant and equipment ("PP&E"),lower lease revenue from joint ventures, andlower management and other fees,partially offset by:higher property revenue,lower current income taxes,lower negative changes in fair value of financial instruments,lower transaction costs related to dispositions, andlower general, administrative and Trust ("G&A") expenses.For Q1 2026, FFO was $85.6 million or $0.27 per unit, compared to $56.2 million or $0.20 per unit for Q1 2025. FFO does not include $3.3 million or 0.01 per unit of income guarantees related to recently acquired properties. The change in FFO was primarily due to:higher adjusted NOI of $27.8 million, andlower G&A expenses of $2.4 million,partially offset by:lower management fees of $1.0 million.Financial Position
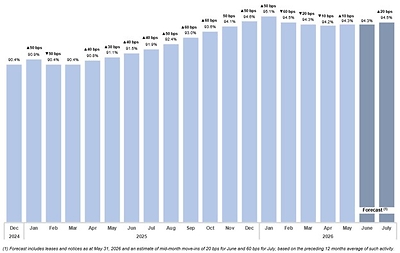
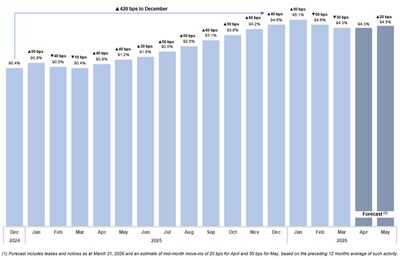
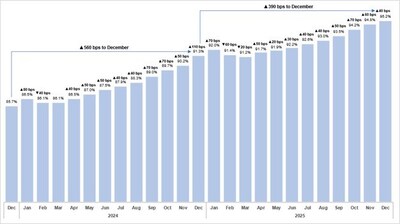
March 31, 2026December 31, 2025December 31, 2024Net Debt to Adjusted EBITDA(4) 6.3x6.9x8.4xInterest Coverage Ratio(4)3.7x3.5x2.7xAvailable liquidity(1) ($000)646,599504,043314,295Weighted average interest rate (consolidated)3.93 %3.92 %4.30 %As at March 31, 2026, liquidity(1) amounted to $646.6 million, which included $251.7 million of cash and cash equivalents and $394.9 million of available borrowing capacity on our credit facilities. 2026 Outlook and Recent DevelopmentsAn updated discussion of our business outlook can be found in the "2026 Outlook" section of our Management's Discussion and Analysis for the three months ended March 31, 2026 (the "Q1 2026 MD&A"). OperationsFigure 1 provides an update in respect of our same property occupancy.We experienced a seasonal occupancy dip during the 2026 winter that was more in-line with historical periods given severe weather conditions and a more pronounced flu season. We expect to see continued strong leasing activity given the robust industry supply and demand fundamentals and expect to achieve our full year average occupancy target of 95%.Portfolio Optimization ActivitiesWe continue to execute on our portfolio strategy of enhancing our asset base to generate increased NOI, acquiring new strategic properties in core markets, selling non-core properties, and repositioning underperforming properties. We are also pursuing new developments that support future growth of our asset base in line with our strategy. Recent activities include:On March 2, 2026, we acquired the remaining 15% ownership interest in Chartwell L'Unique, a 421-suite retirement residence located in the Saint-Eustache suburb of Montreal, Quebec from Batimo for $18.8 million before working capital adjustments and closing costs. The purchase price was partially settled through the proportionate assumption of the $6.5 million in place mortgage, with the balance settled in cash. We now have a 100% ownership interest in this residence.On March 24, 2026, we completed the sale of one non-core property in Ottawa, Ontario for $49.0 million.On April 2, 2026, we completed the acquisition of six seniors housing communities comprising 1,024 suites located in London, Waterloo, and Mississauga, for a total purchase price of $416.2 million. The purchase price at closing was partially settled through the assumption of $229.2 million of mortgages, the majority of which are CMHC-insured, with a weighted average interest rate of 4.50% and weighted average remaining term of 18.9 years. The remainder of the purchase price, subject to normal working capital and other closing adjustments was settled in cash. In addition, we entered into a forward purchase agreement to acquire 29 townhomes currently under development in London, Ontario for a purchase price of $15.8 million subject to normal capital and other closing adjustments. This acquisition is expected to close upon construction completion which is anticipated in Q1 2027.On April 15, 2026, we entered into a definitive agreement to acquire 100% ownership interest in Palermo Village Retirement Residence (116 suites) in Oakville, Ontario for $43.0 million. This transaction is expected to close in Q2 2026.On April 25, 2026, we entered into a definitive agreement to sell nine non-core properties in Ontario for $117.9 million. Net proceeds are expected to be $82.1 million, after transaction costs and repayment of $33.7 million of mortgages with a weighted average interest rate of 3.38% and weighted average term to maturity of 4.4 years. The transaction is expected to close in Q2 2026. Refer to the "Disposition Property List" section on page 7 of this press release for a complete list of the residences.On May 1, 2026, we entered into a definitive agreement to sell Chartwell Ballycliffe LTC in Ajax, Ontario for $68.3 million. The transaction is subject to customary adjustments in accordance with the terms of the purchase and sale agreement and, subject to regulatory and other required approvals, is expected to close in Q4 2026.Strategic Partnership and Acquisition of Interests in 23 Retirement ResidencesOn May 7, 2026, we entered into a definitive agreement to acquire a 30% ownership interest in the Seasons Retirement Communities portfolio (the "Portfolio") through a joint venture with Fengate Asset Management ("Fengate"), the existing owner and a leading alternative investment manager and real estate developer acting on behalf of its investor, the LiUNA Pension Fund of Central and Eastern Canada. Fengate will retain a 70% ownership interest in the joint venture (the "Transaction"). The Transaction represents a significant milestone in Chartwell's strategy to grow its platform with high-quality assets through partnerships with institutional capital. Closing is expected by the end of Q2 2026, subject to customary closing conditions, including third-party consents and regulatory approvals.The Portfolio is comprised of 23 seniors housing communities totalling 2,943 suites in Ontario, British Columbia and Alberta. These communities are designed to serve a broad range of seniors and strategically located in markets with strong underlying fundamentals. Current occupancy stands at approximately 86%. Refer to the "Acquisition Property List" section on page 7 of this press release for a complete list of the residences.The purchase price for Chartwell's 30% interest is $382.5 million ($1.275 billion at 100% ownership) and is expected to be funded through the assumption of approximately $195.8 million of in-place mortgages with a weighted average interest rate of 4.47% and a weighted average term to maturity of 3.7 years, with the balance to be paid in cash. RBC Capital Markets acted as the exclusive financial advisor to Chartwell on the Transaction.Chartwell will serve as operations manager of the Portfolio and Fengate will provide asset management services. Chartwell's agreement with Fengate provides for the opportunity to acquire a further 20% of the portfolio upon certain milestones being met.As part of the ongoing strategic partnership, Chartwell will have the option to participate in Fengate's future development of retirement residences in Ontario. Should Chartwell elect to participate in any such development, Chartwell will provide operations management services, and the parties will have certain put and call rights once the residence is stabilized."This Transaction reflects the continued execution of our disciplined investment strategy focused on acquiring high-quality residences in core markets with strong demographic profiles and long-term demand fundamentals," said Jonathan Boulakia, Chief Investment Officer of Chartwell. "The transaction also provides us with meaningful upside while managing capital deployment prudently with a 30% investment. The Portfolio's embedded lease-up and operational optimization opportunities, combined with Chartwell's proven operating platform and expertise, position us to deliver strong risk-adjusted returns for our unitholders. In addition, the partnership with Fengate, a leading real estate investment and development firm, represents an opportunity to align with a new development partner in Ontario for future growth and brings together two experienced organizations with a shared commitment to the long-term stewardship of retirement communities."Figure 2 presents a map of the Portfolio locations.Liquidity and Financing As at May 7, 2026, liquidity amounted to $581.6 million, which included $186.7 million of cash and cash equivalents and $394.9 million of available borrowing capacity on our Credit Facilities.As of the date of this release, for the remainder of 2026, we have $209.6 million of mortgage debt maturing with a weighted average interest rate of 2.99%. At May 7, 2026, 10-year CMHC-insured mortgage rates are estimated at approximately 4.13% and five-year unsecured debenture rate to be approximately 4.44%.TaxationIn 2026, we expect to incur SIFT tax payable, primarily driven by taxable income arising from property dispositions completed and announced during the year. This includes the sale of nine non-core properties in Ontario and the planned disposition of the Ballycliffe LTC (see the "Portfolio Optimization Activities" section of this release).The expected tax reflects the impact of recapture of capital cost allowance and capital gains associated with these transactions. We continue to assess available tax planning opportunities to manage and mitigate cash taxes where appropriate.Board Renewal Update and 2026 Annual General MeetingAs part of its ongoing commitment to strong governance, disciplined Board renewal, and long-term succession planning, Chartwell is providing an update on its Board renewal process and on its upcoming Annual General Meeting (the "2026 AGM").The 2026 AGM will be held on June 18, 2026, and unitholders of record as of the applicable record date will be entitled to vote at the meeting. Further details regarding the 2026 AGM, including voting procedures and meeting logistics, is set out in Chartwell's Management Information Circular dated April 24, 2026 (the "Circular").At the 2026 AGM, unitholders will be asked to elect directors to serve on Chartwell's Board until the next annual meeting. As disclosed in the Circular, the proposed slate of directors includes all current directors, as well as Douglas MacLatchy, who is standing for election as a new independent director. Rael Diamond, who was appointed to the Board effective January 1, 2026, is also standing for election for the first time.Mr. MacLatchy has more than thirty years of leadership experience across senior living, real estate, and financial services organizations. He previously served as President and Chief Executive Officer of Amica Senior Lifestyles, and as Vice Chair of Amica's Board of Directors. Mr. MacLatchy was also the founder and Chief Executive Officer of BayBridge Senior Living prior to its amalgamation with Amica. Earlier in his career, he served as Chief Executive Officer of Sunrise Senior Living REIT and held senior leadership and executive roles in a range of real estate and financial services organizations.Huw Thomas, Chair of the Board of Chartwell, commented:"Doug brings an exceptional combination of leadership, operational, financial, investment, and governance experience to Chartwell's Board. His deep understanding of senior living operations, capital stewardship, and resident-centric cultures makes him a highly valuable addition. Doug's breadth of experience strengthens our Board as we continue to thoughtfully execute our renewal process and support Chartwell's long-term strategy, for the benefit of our residents, employees and investors."At-the-Market ProgramOn May 7, 2026, we filed a new final base shelf prospectus (the "Base Shelf Prospectus") with the securities regulatory authorities in each province of Canada. The Base Shelf Prospectus is valid for a 37-month period, during which time we may offer and issue, from time to time, trust units ("Trust Units"), subscription receipts and debt securities. Our previous base shelf prospectus is scheduled to expire on May 30, 2026.On May 7, 2026, we will file a new prospectus supplement (the "Prospectus Supplement") to the Base Shelf Prospectus to renew our at-the-market equity distribution program (the "2026 ATM Program") that will allow Chartwell to issue up to $500.0 million of Trust Units. Since establishing our prior at-the-market equity distribution program (the "Prior ATM Program") on November 6, 2025, we have issued approximately $382 million of Trust Units which includes $142.4 million issued during the three months ended March 31, 2026. The 2026 ATM Program allows Chartwell to issue Trust Units from treasury to the public from time to time during the term of the ATM Program, at its discretion and will continue to provide Chartwell with additional financing flexibility, should it be required in the future. We intend to use the net proceeds from the 2026 ATM Program, if any, for future property acquisitions, development and redevelopment opportunities, repayment of indebtedness and for general trust purposes.In connection with the 2026 ATM Program, Chartwell has entered into an equity distribution agreement dated May 7, 2026 (the "Distribution Agreement") with TD Securities Inc., Scotia Capital Inc., and RBC Capital Markets (collectively, the "Agents"). Upon entry into the Distribution Agreement, the equity distribution agreement dated November 6, 2025, for the Prior ATM Program was terminated. Any Trust Units sold under the 2026 ATM Program will be distributed through the Toronto Stock Exchange or any other permitted marketplace at the market prices prevailing at the time of sale. The volume and timing of distributions under the 2026 ATM Program, if any, will be determined at Chartwell's sole discretion. There is no certainty that any Trust Units will be offered or sold under the 2026 ATM Program. The ATM Program will be effective until June 7, 2029, unless terminated prior to such date by Chartwell or otherwise in accordance with the terms of the Distribution Agreement.Given that Trust Units sold in the 2026 ATM Program, if any, will be distributed at the market prices prevailing at the time of sale, prices may vary among purchasers during the period of the distribution. Distributions of Trust Units through the 2026 ATM Program, if any, will be made pursuant to the terms of the Distribution Agreement.The Base Shelf Prospectus is and the Prospectus Supplement and the Distribution Agreement will be available on SEDAR+ at www.sedarplus.com under Chartwell's profile. Alternatively, the Agents will send copies of the Prospectus Supplement, the Distribution Agreement and the Base Shelf Prospectus, as applicable, to investors upon request to TD Securities Inc. at 1625 Tech Avenue, Mississauga, Ontario L4W 5P5, attention: Symcor, NPM, by telephone at (289) 360-2009, or by email at sdcconfirms@td.com., Scotia Capital Inc. at 40 Temperance Street, 6th Floor, Toronto, Ontario M5H 0B4, by telephone at (416) 863-7704 or by email at equityprospectus@scotiabank.com and RBC Dominion Securities Inc. at Distribution Centre, RBC Wellington Square, 8th Floor, 180 Wellington Street West, Toronto, Ontario M5J 0C2, by telephone at 416-842-5349 or by email at Distribution.RBCDS@rbc.com.This press release does not constitute an offer to sell securities, nor is it a solicitation of an offer to buy securities, in any jurisdiction in which such offer or solicitation is unlawful. This press release is not an offer of securities for sale in the United States ("U.S."). The securities being offered have not been and will not be registered under the U.S. Securities Act of 1933, as amended, and accordingly are not being offered for sale and may not be offered, sold or delivered, directly or indirectly within the U.S., its possessions and other areas subject to its jurisdiction or to, or for the account or for the benefit of a U.S. person, except pursuant to an exemption from the registration requirements of that Act.Quarterly Investor Materials and Conference CallWe invite you to review our Q1 2026 investor materials on our website at investors.chartwell.com.Q1 2026 Financial Statements
Q1 2026 MD&A
Q1 2026 Investor PresentationA conference call hosted by Chartwell's senior management will be held Friday, May 8, 2026, at 10:00 AM ET. Participation in the live conference call can be accessed by registering on the Investor Relations section of Chartwell's website or by clicking on the following link Participant Registration. A slide presentation to accompany management's comments during the conference call will be available on the website. To access the live webcast of the conference call and presentation, please go to the Investor Relations section of Chartwell's website or click on the following link Q1 2026 Results Webcast. A replay of the webcast will be available following the conference call on the Investor Relations section of Chartwell's website at investors.chartwell.com.Footnotes(1)FFO, FFO per unit, adjusted property revenue, adjusted resident revenue, adjusted other property revenue, adjusted DOE, adjusted NOI, adjusted operating margin, NOIPOS, REVPOS, DOEPOS, liquidity, interest coverage ratio, Imputed Cost of Debt, and net debt to adjusted EBITDA ratio are non-GAAP measures. These measures do not have standardized meanings prescribed by GAAP and, therefore, may not be comparable to similar measures used by other issuers. These measures are used by management in evaluating operating and financial performance. Please refer to the heading "Non-GAAP Financial Measures" on page 8 of this press release. Certain information about non-GAAP financial measures, non-GAAP ratios, capital management measures, and supplementary measures found in Chartwell's Q1 2026 MD&A, is incorporated by reference. Full definitions of FFO and FFO per unit can be found on page 14, same property adjusted NOI on page 15, adjusted NOI on page 15, adjusted operating margin, NOIPOS, REVPOS, and DOEPOS on page 15, liquidity on page 21, interest coverage ratio on page 35, and net debt to adjusted EBITDA ratio on page 37 of the Q1 2026 MD&A available on Chartwell's website, and under Chartwell's profile on the System for Electronic Document and Analysis Retrieval ("SEDAR+") website at sedarplus.com. The definitions of these measures have been incorporated by reference.(2)Includes Trust Units, Class B Units of Chartwell Master Care LP, and Trust Units issued under Executive Unit Purchase Plan and Deferred Trust Unit Plan.(3)'pp' means percentage points.(4)Non-GAAP; calculated in accordance with the Trust indentures for Chartwell's 6.000% Series C senior unsecured debentures, 4.400% Series D senior unsecured debentures, 3.650% Series E senior unsecured debentures, and 4.500% Series F senior unsecured debentures and may not be comparable to similar metrics used by other issuers or to any GAAP measures.(5)Forecast includes leases and notices as at April 30, 2026, and an estimate of mid-month move-ins of 30 bps for May and 50 bps for June, based on the preceding 12-month average of such activity.About ChartwellChartwell is in the business of serving and caring for Canada's seniors, committed to its vision of Making People's Lives BETTER and to providing a happier, healthier, and more fulfilling life experience for its residents. Chartwell is an unincorporated, open-ended real estate trust which indirectly owns and operates a complete range of seniors housing communities, from independent living through to assisted living and long term care. Chartwell is one of the largest operators in Canada, serving approximately 25,000 residents in four provinces across the country. For more information visit www.chartwell.com.Forward-Looking InformationThis press release contains forward-looking information that reflects the current expectations, estimates and projections of management about the future results, performance, achievements, prospects or opportunities for Chartwell and the seniors housing industry. Forward-looking statements are based upon a number of assumptions and are subject to a number of known and unknown risks and uncertainties, many of which are beyond our control, and that could cause actual results to differ materially from those that are disclosed in or implied by such forward-looking statements. Examples of forward-looking information in this document include, but are not limited to, statements regarding acquisitions, including closing and financing details; development activities; debt financings; portfolio optimization strategies; expectations with respect to taxes that are expected to be payable in the current and future years; statements regarding occupancy and rate forecasts; and the 2026 ATM Program, including the expected benefits thereof and intended use of net proceeds. Forward-looking information can be generally identified by the use of words such as "anticipate," "continue," "estimate," "expect," "expected," "intend," "may," "will," "project," "plan," "should," "believe," and similar expressions. There can be no assurance that forward-looking information will prove to be accurate, as actual results and future events could differ materially from those expected or estimated in such statements. Accordingly, readers should not place undue reliance on forward-looking information. These factors are more fully described in the "Risks and Uncertainties and Forward-Looking Information" section in Chartwell's Q1 2026 MD&A, and in materials filed with the securities regulatory authorities in Canada from time to time, including but not limited to our most recent Annual Information Form the ("AIF"). A copy of the Q1 2026 MD&A, the AIF, and Chartwell's other publicly filed documents can be accessed under Chartwell's profile on the SEDAR+ website at sedarplus.com. Except as required by law, Chartwell does not intend to update or revise any forward-looking statements, whether as a result of new information, future events, or for any other reason.For more information, please contact:
Chartwell Retirement Residences
Jeffrey Brown, Chief Financial Officer
Tel: (905) 501-6777
Email: investorrelations @GMan" style="display: block; font-size: 1.17em; margin-block-start: 1em; margin-block-end: 1em; margin-inline-start: 0px; margin-inline-end: 0px; font-weight: bold; text-align: left;" role="heading" aria-level="3">Disposition Property List – Ontario Non-Core Property Sale
YearSuite Count by Level of Care (1)#PropertyLocationBuiltILISLALTotal1Anne HathawayStratford, ON1998-61-612BayviewBelleville, ON1997-59-593ColonialWhitby, ON1996-94-944HartfordMorrisburg, ON1998-87-875Park PlaceAurora, ON1991-91-916PinewoodPembroke, ON1984-45-457Quail CreekRenfrew, ON1999-90-908RosedaleBrockville, ON1997-66-669Westmount on WilliamSudbury, ON1988-84-84
1994-677-677(1) IL = Independent Living; ISL = Independent Supportive Living; AL = Assisted Living.Acquisition Property List – Seasons Retirement Communities Portfolio
YearSuite Count by Level of Care (1)#PropertyLocationBuiltILISLALTotal1Wesbrook VillageVancouver, BC2011-154-1542ArbutusVancouver, BC2002-141-1413LondonLondon, ON202412147-1594St. CatharinesSt. Catharines, ON2024-120231435CambridgeCambridge, ON2020-120191396St. ThomasSt. Thomas, ON20209122201517Stoney CreekStoney Creek, ON2017-105311368MiltonMilton, ON2015-122281509StrathroyStrathroy, ON20111899-11710Dufferin CentreTrenton, ON2010-125-12511BrantfordBrantford, ON200925962514612Owen SoundOwen Sound, ON2008-118-11813WellandWelland, ON2008121102214414AmherstburgAmherstburg, ON200725723112815Belle RiverBelle River, ON20061293-10516Royal Oak VillageLaSalle, ON200620812612717Lethbridge GardensLethbridge, AB2012-103-10318EncoreOlds, AB2015-386910719High RiverHigh River, AB201466210817620Drayton ValleyDrayton Valley, AB2012721406821CamroseCamrose, AB2011-598214122PonokaPonoka, AB2010226406823WetaskiwinWetaskiwin, AB2005-514697
20131482,1856102,943(1) IL = Independent Living; ISL = Independent Supportive Living; AL = Assisted Living and includes Memory Care and Continuing Care Type B suites.Non-GAAP Financial MeasuresChartwell's condensed consolidated interim financial statements are prepared in accordance with International Financial Reporting Standards ("IFRS"). Management uses certain financial measures to assess Chartwell's operating and financial performance, which are measures not defined in generally accepted accounting principles ("GAAP") under IFRS. The following measures: FFO, FFO per unit, same property adjusted NOI, adjusted NOI, adjusted operating margin, REVPOS, DOEPOS, NOIPOS, liquidity, interest coverage ratio and net debt to adjusted EBITDA ratio as well as other measures discussed elsewhere in this release, do not have a standardized definition prescribed by IFRS. They are presented because management believes these non-GAAP measures are relevant and meaningful measures of Chartwell's performance and as computed may differ from similar computations as reported by other issuers and may not be comparable to similarly titled measures reported by such issuers. For a full definition of these measures, please refer to the Q1 2026 MD&A available on Chartwell's website and on SEDAR+.The following table reconciles property revenue and direct property operating expense from our financial statements to adjusted property revenue and adjusted direct property operating expense, and NOI to Adjusted NOI, and identifies contributions from our same property portfolio, our growth portfolio, and our repositioning portfolio:($000s, except occupancy rates)
Q1 2026Q1 2025ChangeProperty revenue
302,950243,56859,382Add (Subtract):
Share from joint ventures (1)
11,69621,629(9,933) Share from non-controlling interest (2)
-(1,244)1,244Adjusted property revenue
314,646263,95350,693Comprised of:
Same property
204,841187,75317,088 Growth
76,90039,39437,506 Repositioning
32,90536,806(3,901)Adjusted property revenue
314,646263,95350,693 Resident revenue
298,878239,03959,839 Add (Subtract):
Share from joint ventures (1)
11,58821,385(9,797) Share from non-controlling interest (2)
-(1,228)1,228 Adjusted resident revenue
310,466259,19651,270 Comprised of:
Same property
202,006184,35317,653 Growth
75,82938,72237,107 Repositioning
32,63136,121(3,490) Adjusted resident revenue
310,466259,19651,270 Other property revenue
4,0724,529(457) Add (Subtract):
Share from joint ventures (1)
108244(136) Share from non-controlling interest (2)
-(16)16 Adjusted other property revenue
4,1804,757(577) Comprised of:
Same property
2,8353,400(565) Growth
1,071672399 Repositioning
274685(411) Adjusted other property revenue
4,1804,757(577)Direct property operating expense
179,211150,05629,155Add (Subtract):
Share from joint ventures
6,63113,509(6,878) Share from non-controlling interest
-(626)626Adjusted direct property operating expense
185,842162,93922,903Comprised of:
Same property
118,707113,2475,460Growth
42,71023,25519,455Repositioning
24,42526,437(2,012)Adjusted direct property operating expense
185,842162,93922,903NOI
123,73993,51230,227Add (Subtract):
Share from joint ventures
5,0658,120(3,055) Share from non-controlling interest
-(618)618Adjusted NOI
128,804101,01427,790Comprised of:
Same property
86,13474,50611,628Growth
34,19016,13918,051Repositioning
8,48010,369(1,889)Adjusted NOI
128,804101,01427,790Weighted average occupancy rate:
Same property portfolio
94.7 %90.7 %4.0ppGrowth portfolio
91.8 %89.3 %2.5ppRepositioning portfolio
90.5 %86.2 %4.3ppTotal portfolio
93.4 %89.5 %3.9pp(1)Non-GAAP; represents Chartwell's proportionate share of the property revenue and direct property operating expense of our Equity-Accounted JVs, respectively.(2)Non-GAAP; represents Chartwell's proportionate share of the resident revenue and direct property operating expense of our non-controlling interest, respectively.The following table provides a reconciliation of net income/(loss) to FFO: ($000s, except per unit amounts and number of units)
Q1 2026Q1 2025Change
Net income/(loss)
7,99233,194(25,202)
Add (Subtract):
BDepreciation of PP&E
67,15452,69214,462DAmortization of limited life intangible assets
378466(88)BDepreciation of PP&E and amortization of intangible assets used for administrative purposes included in depreciation of PP&E and amortization of intangible assets above
(993)(879)(114)ELoss/(gain) on disposal of assets
(2,421)(60,253)57,832JTransaction costs arising on dispositions
3044,458(4,154)FTax on gains or losses on disposal of properties
-8,125(8,125)GDeferred income tax
11,38611,617(231)ODistributions on Class B Units recorded as interest expense
223228(5)MChanges in fair value of financial instruments
4445,479(5,035)QFFO adjustments for Equity-Accounted JVs
1,1111,130(19)UNon-controlling interest
-(88)88
FFO
85,57856,16929,409
Weighted average number of units (000)
320,375277,94342,432
FFO per unit
0.270.200.07The following table provides details of the weighted average number of occupied suites used in calculations of REVPOS, DOEPOS, and NOIPOS:
Q1 2026Q1 2025ChangeWeighted average number of occupied suites
13,95613,369587 SOURCE Chartwell Retirement Residences (IR) Original: Chartwell Announces Strong First Quarter 2026 Results and Significant Advances on Key Strategic Priorities
CA Market News
4月前
Chartwell Announces Fourth Quarter and Year End 2025 Results, Provides an Update on Growth and Portfolio Optimization Activities, and Increase to DistributionsFebruary 26, 2026 5:15 PM
PR Newswire (Canada)
MISSISSAUGA, ON, Feb. 26, 2026 /CNW/ - Chartwell Retirement Residences ("Chartwell") (TSX: CSH.UN) announced today its results for the fourth quarter and year ended December 31, 2025.Highlights Property revenue increased $73.8 million or 33.8% in Q4 2025, and $279.1 million or 34.9% for the year.Net income increased $3.7 million in Q4 2025, and $7.1 million for the year.Funds from operations ("FFO")(1) increased $23.6 million or 40.9% in Q4 2025, and $80.6 million or 40.8% for the year.Same property adjusted net operating income ("NOI")(1) increased 16.9% in Q4 2025, and 18.4% for the year.Same property adjusted operating margin increased 310 basis points ("bps") to 41.6% in Q4 2025, and 330 bps to 41.7% for the year.Weighted average same property occupancy increased 430 bps to 94.7% in Q4 2025, and 480 bps to 92.8% for the year, ending at 95.2% on December 31, exceeding our occupancy target of 95.0%.Same property adjusted NOI per occupied suite ("NOIPOS")(1) increased 11.6% in Q4 2025 on higher adjusted resident revenue per occupied suite ("REVPOS")(1) and lower adjusted direct property operating expense per occupied suite ("DOEPOS")(1), and increased 12.2% for the year on higher REVPOS and lower DOEPOS.Distribution increase of 2.0% effective March 31, 2026."2025 was a record year for Chartwell, and a powerful reflection of the dedication, care and professionalism of our people. Our teams delivered strong operating and financial performance and achieved all our 2025 strategic targets. We continued to grow our portfolio with over $1.7 billion in completed and announced acquisitions. These investments accelerated our shift to newer, high-quality residences that are better aligned with the evolving needs and expectations of today's seniors. With continued focus on process improvement and technology deployment, we strengthened the long-term quality and resilience of our management platform," said Vlad Volodarski, Chartwell's Chief Executive Officer. "I am deeply grateful to our employees for their passion, care and unwavering focus on making people's lives better. I am proud of what we have accomplished together and confident in our team's ability to sustain this momentum as we work toward our 2026–2028 strategic goals."Results of Operations($000s, except per unit amounts, number of units, per occupied suiteThree Months Ended
December 31Year Ended
December 31amounts, and percentages)20252024Change20252024ChangeProperty revenue292,258218,44573,8131,079,035799,923279,112Direct property operating expense174,944138,70736,237650,076509,179140,897Net income7,2443,5443,70029,49522,3787,117FFO(1)81,24157,66323,578278,020197,46280,558FFO per unit(1)0.260.210.050.950.760.19Weighted average number of units outstanding (000s)(2)310,769275,49435,275293,288260,11933,169G&A expenses12,71410,3342,38056,60149,4607,141Same property:
Adjusted property revenue(1)182,391168,45213,939705,927647,32758,600 Adjusted resident revenue(1)179,526165,27314,253694,304634,10360,201 Adjusted other property revenue(1)2,8653,179(314)11,62313,224(1,601)Adjusted direct property operating expense(1)106,567103,5862,981411,629398,77412,855Adjusted NOI(1)75,82464,86610,958294,298248,55345,745Adjusted operating margin(1)41.6 %38.5 %3.1pp41.7 %38.4 %3.3ppWeighted average occupancy rate(3)94.7 %90.4 %4.3pp92.8 %88.0 %4.8ppREVPOS(1)5,0264,8481784,9594,778181DOEPOS(1)2,9843,039(55)2,9403,005(65)NOIPOS(1)2,1231,9032202,1021,873229
Fourth Quarter ResultsFor Q4 2025, property revenue increased $73.8 million or 33.8%, and direct property operating expense increased $36.2 million or 26.1%.For Q4 2025, net income was $7.2 million compared to $3.5 million in Q4 2024 primarily due to:higher property revenue, andreversal of impairment expense,partially offset by:higher direct property operating expense,higher depreciation of property, plant and equipment ("PP&E"),negative changes in fair value of financial instruments in Q4 2025 as compared to positive changes in fair value of financial instruments in Q4 2024,higher deferred tax expense,higher finance costslower net income from joint ventures, andhigher general, administrative, and Trust ("G&A") expenses.For Q4 2025, FFO was $81.2 million or $0.26 per unit, compared to $57.7 million or $0.21 per unit for Q4 2024. The change in FFO was primarily due to:higher adjusted NOI of $28.8 million, andhigher adjusted interest income of $1.5 million, andhigher other lease revenue of $1.2 million,partially offset by:higher adjusted finance costs of $3.3 million,higher G&A expenses of $2.4 million, andlower management fees of $2.2 million.Annual / Year End ResultsFor 2025, property revenue increased $279.1 million or 34.9%, and direct property operating expense increased $140.9 million or 27.7%.For 2025, net income was $29.5 million compared to $22.4 million in 2024 primarily due to:higher property revenue,reversal of impairment expense, andhigher gain on disposal of assets,partially offset by:higher direct property operating expense,higher depreciation of PP&E,higher finance costs,higher deferred tax expense,lower net income from joint ventures, higher G&A expenses, andhigher negative changes in fair value of financial instruments.For 2025, FFO was $278.0 million or $0.95 per unit, compared to $197.5 million or $0.76 per unit for 2024. The change in FFO was primarily due to:higher adjusted NOI of $109.8 million,higher adjusted interest income of $3.7 million,higher other lease revenue of $2.2 million, andlower depreciation of PP&E and amortization of intangibles assets used for administrative purposes of $0.5 million,partially offset by:higher adjusted finance costs of $20.0 million,lower management fees of $7.6 million,higher G&A expenses of $7.1 million, andlower other income of $0.9 million. Financial Position
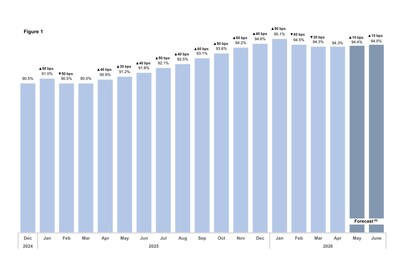
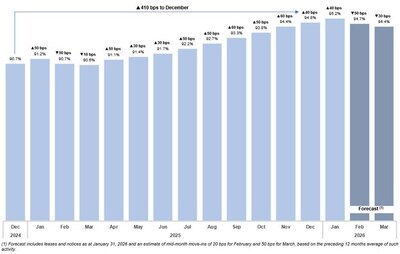
December 31, 2025December 31, 2024December 31, 2023Net Debt to Adjusted EBITDA(4) 6.9x8.4x10.2xInterest Coverage Ratio(4)3.5x2.7x2.3xAvailable liquidity(1) ($000)504,043314,295348,631Weighted average interest rate (consolidated)3.92 %4.30 %3.84 %As at December 31, 2025, liquidity(1) amounted to $504.0 million, which included $109.1 million of cash and cash equivalents and $394.9 million of available borrowing capacity on our credit facilities. 2026 Outlook and Recent Developments A discussion of our business outlook can be found in the "2026 Outlook" section of our Management's Discussion and Analysis for the year ended December 31, 2025 (the "2025 MD&A"). OperationsFigure 1 provides an update in respect of our same property occupancy (NOTE: Same property for the purpose of this graph is in accordance with our 2026 definition. Same property references elsewhere in this document reflect the 2025 composition of our same property portfolio).We experienced a seasonal occupancy dip during the 2026 winter that is more in-line with historical periods given severe weather conditions and a more pronounced flu season. We expect to see strong spring permanent move-in activity given the robust industry supply and demand fundamentals and expect to achieve our full year average occupancy target of 95%.Growth and Portfolio Optimization ActivitiesWe continue to execute on our portfolio strategy of enhancing our asset base to generate increased NOI, acquiring new strategic properties in core markets, selling non-core properties, and repositioning underperforming properties. We are also pursuing new developments that support future growth of our asset base in line with our strategy. Recent activities include:On December 1, 2025, we acquired a 334-suite retirement residence (rebranded Chartwell Azalis) in Repentigny, Quebec for $111.0 million. The purchase price was settled in cash.On December 2, 2025, we acquired the newly developed 155-suite retirement residence (rebranded Chartwell Edgewater) in Nanaimo, British Columbia for $102.7 million. The purchase price was settled in cash.On December 15, 2025, we acquired The Edward, a 90-suite retirement residence in Calgary, Alberta for $53.0 million. The purchase price was settled in cash.On December 18, 2025, we acquired the remaining 15% ownership interest in Résidence Légende, a 368-suite retirement residence in Longueuil, Quebec from Batimo for $17.9 million before working capital adjustments and closing costs. The purchase price included the proportionate assumption of the $10.1 million mortgage in place at closing, with the balance settled in cash. We now have 100% ownership interest in this residence.On February 19, 2026, we entered into a definitive agreement to sell one non-core property in Ontario, for $49.0 million with closing expected in Q1 2026.Liquidity and FinancingOn November 6, 2025, we filed a new prospectus supplement to renew our at-the-market equity distribution program (the "2025 ATM Program") that allows Chartwell to issue up to $500.0 million of Trust Units from treasury to the public from time to time during the term of the program. The 2025 ATM Program is effective until May 30, 2026, unless terminated prior to such date by Chartwell or otherwise in accordance with the terms of the Equity Distribution Agreement which sets out the terms of the sale of Trust Units under the 2025 ATM Program. As of December 31, 2025, we had issued and sold approximately $240.0 million of the Trust Units under the 2025 ATM Program.During the year ended December 31, 2025, under both the 2025 ATM Program and our prior at-the-market equity distribution program, Chartwell issued an aggregate 38,894,442 of Trust Units at an average price of $18.52 per Trust Unit for total gross proceeds of $720.5 million. Commission and other costs amounted to $11.5 million, offset by a deferred tax asset of $6.1 million.As at February 26, 2026, liquidity amounted to $483.8 million, which included $88.9 million of cash and cash equivalents and $394.9 million of available borrowing capacity on our Credit Facilities.As of the date of this release, for the remainder of 2026, we have $209.6 million of mortgage debt maturing with a weighted average interest rate of 2.99%. At February 26, 2026, 10-year CMHC-insured mortgage rates are estimated at approximately 3.85% and five-year unsecured debenture rate to be approximately 3.88%.Distributions IncreaseOn February 26, 2026, the Trustees approved an increase in our monthly distributions from $0.051 per unit ($0.612 annualized) to $0.052 per unit ($0.624 annualized). The increase will be effective for the March 31, 2026 distribution payable on April 15, 2026.Quarterly Investor Materials and Conference CallWe invite you to review our Q4 and Year End 2025 investor materials on our website at investors.chartwell.com2025 Financial Statements
2025 MD&A
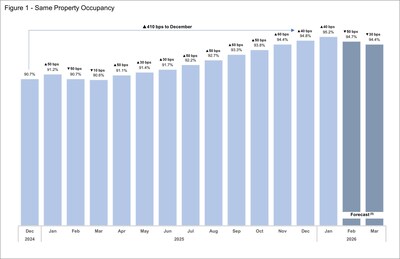
2025 Investor PresentationA conference call hosted by Chartwell's senior management will be held Friday, February 27, 2025, at 10:00 AM ET. Participation in the live conference call can be accessed by registering on the Investor Relations section of Chartwell's website or by clicking on the following link Participant Registration. A slide presentation to accompany management's comments during the conference call will be available on the website. To access the live webcast of the conference call and presentation, please go to the Investor Relations section of Chartwell's website or click on the following link Q4 and Year End 2025 Results Webcast. A replay of the webcast will be available following the conference call on the Investor Relations section of Chartwell's website at investors.chartwell.com.Footnotes(1)FFO, FFO per unit, adjusted property revenue, adjusted resident revenue, adjusted other property revenue, adjusted direct property operating expense, adjusted NOI, adjusted operating margin, NOIPOS, REVPOS, DOEPOS, liquidity, interest coverage ratio, Imputed Cost of Debt, and net debt to adjusted EBITDA ratio are non-GAAP measures. These measures do not have standardized meanings prescribed by GAAP and, therefore, may not be comparable to similar measures used by other issuers. These measures are used by management in evaluating operating and financial performance. Please refer to the heading "Non-GAAP Financial Measures" on page 6 of this press release. Certain information about non-GAAP financial measures, non-GAAP ratios, capital management measures, and supplementary measures found in Chartwell's 2025 MD&A, is incorporated by reference. Full definitions of FFO and FFO per unit can be found on page 20, same property adjusted NOI on page 21, adjusted NOI on page 21, adjusted operating margin, NOIPOS, REVPOS, and DOEPOS on page 21, liquidity on page 28, interest coverage ratio on page 43, and net debt to adjusted EBITDA ratio on page 44 of the 2025 MD&A available on Chartwell's website, and under Chartwell's profile on the System for Electronic Document and Analysis Retrieval ("SEDAR+") website at sedarplus.com. The definitions of these measures have been incorporated by reference.(2)Includes Trust Units, Class B Units of Chartwell Master Care LP, and Trust Units issued under Executive Unit Purchase Plan and Deferred Trust Unit Plan.(3)'pp' means percentage points. (4)Non-GAAP; calculated in accordance with the Trust indentures for Chartwell's 6.000% Series C senior unsecured debentures, 4.400% Series D senior unsecured debentures, 3.650% Series E senior unsecured debentures, and 4.500% Series F senior unsecured debentures and may not be comparable to similar metrics used by other issuers or to any GAAP measures.(5)Forecast includes leases and notices as at January 31, 2026, and an estimate of mid-month move-ins of 20 bps for February and 50 bps for March, based on the preceding 12-month average of such activity.About ChartwellChartwell is in the business of serving and caring for Canada's seniors, committed to its vision of Making People's Lives BETTER and to providing a happier, healthier, and more fulfilling life experience for its residents. Chartwell is an unincorporated, open-ended real estate trust which indirectly owns and operates a complete range of seniors housing communities, from independent living through to assisted living and long term care. Chartwell is one of the largest operators in Canada, serving approximately 25,000 residents in four provinces across the country. For more information visit www.chartwell.com.Forward-Looking InformationThis press release contains forward-looking information that reflects the current expectations, estimates and projections of management about the future results, performance, achievements, prospects or opportunities for Chartwell and the seniors housing industry. Forward-looking statements are based upon a number of assumptions and are subject to a number of known and unknown risks and uncertainties, many of which are beyond our control, and that could cause actual results to differ materially from those that are disclosed in or implied by such forward-looking statements. Examples of forward-looking information in this document include, but are not limited to, statements regarding our business strategies, operational sales, marketing and portfolio optimization strategies including targets, and the expected results of such strategies, predictions and expectations with respect to industry trends including growth in the senior population, a deficit of long term care beds and the pace of new construction starts, expectations with respect to taxes that are expected to be payable in the current and future years and statements regarding the tax classification of distributions, occupancy and rate forecasts, and the ATM Program, including the expected benefits thereof and intended use of net proceeds. Forward-looking information can be generally identified by the use of words such as "anticipate," "continue," "estimate," "expect," "expected," "intend," "may," "will," "project," "plan," "should," "believe," and similar expressions. There can be no assurance that forward-looking information will prove to be accurate, as actual results and future events could differ materially from those expected or estimated in such statements. Accordingly, readers should not place undue reliance on forward-looking information. These factors are more fully described in the "Risks and Uncertainties and Forward-Looking Information" section in Chartwell's Management's Discussion and Analysis for the year ended December 31, 2025 (the "2025 MD&A"), and in materials filed with the securities regulatory authorities in Canada from time to time, including but not limited to our most recent Annual Information Form the ("AIF"). A copy of the 2025 MD&A, the AIF, and Chartwell's other publicly filed documents can be accessed under Chartwell's profile on the SEDAR+ website at sedarplus.com. Except as required by law, Chartwell does not intend to update or revise any forward-looking statements, whether as a result of new information, future events, or for any other reason.For more information, please contact:Chartwell Retirement Residences
Jeffrey Brown, Chief Financial Officer
Tel: (905) 501-6777
Email: investorrelations @GMan" style="display: block; font-size: 1.17em; margin-block-start: 1em; margin-block-end: 1em; margin-inline-start: 0px; margin-inline-end: 0px; font-weight: bold; text-align: left;" role="heading" aria-level="3">Non-GAAP Financial MeasuresChartwell's audited consolidated financial statements are prepared in accordance with International Financial Reporting Standards ("IFRS"). Management uses certain financial measures to assess Chartwell's operating and financial performance, which are measures not defined in generally accepted accounting principles ("GAAP") under IFRS. The following measures: FFO, FFO per unit, same property adjusted NOI, adjusted NOI, adjusted operating margin, REVPOS, DOEPOS, NOIPOS, liquidity, interest coverage ratio and net debt to adjusted EBITDA ratio as well as other measures discussed elsewhere in this release, do not have a standardized definition prescribed by IFRS. They are presented because management believes these non-GAAP measures are relevant and meaningful measures of Chartwell's performance and as computed may differ from similar computations as reported by other issuers and may not be comparable to similarly titled measures reported by such issuers. For a full definition of these measures, please refer to the 2025 MD&A available on Chartwell's website and on SEDAR+.The following table reconciles property revenue and direct property operating expense from our financial statements to adjusted property revenue and adjusted direct property operating expense, and NOI to Adjusted NOI, and identifies contributions from our same property portfolio, our growth portfolio, and our repositioning portfolio:($000s, except occupancy rates)Q4 2025Q4 2024Change20252024ChangeProperty revenue292,258218,44573,8131,079,035799,923279,112Add (Subtract):
Share from joint ventures (1)11,46839,485(28,017)54,726142,430(87,704) Share from non-controlling interest (2)-(1,382)1,382(3,070)(2,710)(360)Adjusted property revenue (3)303,726256,54847,1781,130,691939,643191,048Comprised of:
Same property182,391168,45213,939705,927647,32758,600 Growth93,61442,29051,324315,971112,200203,771 Repositioning27,72145,806(18,085)108,793180,116(71,323)Adjusted property revenue303,726256,54847,1781,130,691939,643191,048 Resident revenue287,861214,69973,1621,061,351784,266277,085 Add (Subtract):
Share from joint ventures (1)11,35539,136(27,781)54,139141,050(86,911) Share from non-controlling interest (2)-(1,364)1,364(3,028)(2,673)(355) Adjusted resident revenue299,216252,47146,7451,112,462922,643189,819 Comprised of:
Same property179,526165,27314,253694,304634,10360,201 Growth92,12541,69750,428310,792110,687200,105 Repositioning27,56545,501(17,936)107,366177,853(70,487) Adjusted resident revenue299,216252,47146,7451,112,462922,643189,819 Other property revenue4,3973,74665117,68415,6572,027 Add (Subtract):
Share from joint ventures (1)113349(236)5871,380(793) Share from non-controlling interest (2)-(18)18(42)(37)(5) Adjusted other property revenue4,5104,07743318,22917,0001,229 Comprised of:
Same property2,8653,179(314)11,62313,224(1,601) Growth1,4895938965,1791,5133,666 Repositioning156305(149)1,4272,263(836) Adjusted other property revenue4,5104,07743318,22917,0001,229Direct property operating expense174,944138,70736,237650,076509,179140,897Add (Subtract):
Share from joint ventures6,59425,137(18,543)32,69492,177(59,483) Share from non-controlling interest-(697)697(1,528)(1,374)(154)Adjusted direct property operating expense181,538163,14718,391681,242599,98281,260Comprised of:
Same property106,567103,5862,981411,629398,77412,855Growth52,84325,71327,130182,98367,550115,433Repositioning22,12833,848(11,720)86,630133,658(47,028)Adjusted direct property operating expense181,538163,14718,391681,242599,98281,260NOI117,31479,73837,576428,959290,744138,215Add (Subtract):
Share from joint ventures4,87414,348(9,474)22,03250,253(28,221) Share from non-controlling interest -(685)685(1,542)(1,336)(206)Adjusted NOI122,18893,40128,787449,449339,661109,788Comprised of:
Same property75,82464,86610,958294,298248,55345,745Growth40,77116,57724,194132,98844,65088,338Repositioning5,59311,958(6,365)22,16346,458(24,295)Adjusted NOI122,18893,40128,787449,449339,661109,788Weighted average occupancy rate:
Same property portfolio94.7 %90.4 %4.3pp92.8 %88.0 %4.8ppGrowth portfolio91.8 %88.4 %3.4pp90.1 %87.5 %2.6ppRepositioning portfolio 88.7 %84.0 %4.7pp86.1 %83.8 %2.3ppTotal portfolio93.0 %88.7 %4.3pp90.7 %87.1 %3.6pp(1)Non-GAAP; represents Chartwell's proportionate share of the property revenue and direct property operating expense of our Equity-Accounted JVs, respectively.(2)Non-GAAP; represents Chartwell's proportionate share of the resident revenue and direct property operating expense of our non-controlling interest, respectively.The following table provides a reconciliation of net income/(loss) to FFO:($000s, except per unit amounts and number of units)Q4 2025Q4 2024Change20252024Change
Net income/(loss)7,2443,5443,70029,49522,3787,117
Add (Subtract):
BDepreciation of PP&E71,69349,22522,468245,509166,37179,138DAmortization of limited life intangible assets399485(86)1,7392,195(456)BDepreciation of PP&E and amortization of intangible assets used for administrative purposes included in
depreciation of PP&E and amortization of intangible assets above(1,039)(1,125)86(3,626)(4,092)466ELoss/(gain) on disposal of assets(1,128)941(2,069)(62,918)(53,963)(8,955)JTransaction costs arising on dispositions266491(225)6,7195,5181,201HImpairment losses/(reversals)(11,000)-(11,000)(12,963)-(12,963)FTax on gains or losses on disposal of properties(2,535)(2,744)2091,066(255)1,321GDeferred income tax11,4927,1664,32643,67534,7528,923ODistributions on Class B Units recorded as interest expense 223231(8)898927(29)MChanges in fair value of financial instruments 4,528(1,660)6,18824,34819,8754,473QFFO adjustments for Equity-Accounted JVs1,0981,196(98)4,3323,887445UNon-controlling interest-(87)87(254)(131)(123)
FFO81,24157,66323,578278,020197,46280,558
Weighted average number of units (000)310,769275,49435,275293,288260,11933,169
FFO per unit0.260.210.050.950.760.19The following table provides details of the weighted average number of occupied suites used in calculations of REVPOS, DOEPOS, and NOIPOS:
Q4 2025Q4 2024Change20252024ChangeWeighted average number of occupied suites11,90611,36354311,66711,059608
SOURCE Chartwell Retirement Residences (IR)
Original: Chartwell Announces Fourth Quarter and Year End 2025 Results, Provides an Update on Growth and Portfolio Optimization Activities, and Increase to Distributions
 Hot Features


 Renee
13年前
Renee
13年前

 メールアドレスで登録


