 US Market News
3日前
US Market News
3日前
S&P GLOBAL INC. COMPLETES SEPARATION OF MOBILITY GLOBAL INC.July 1, 2026 7:30 AM
PR Newswire (US) NEW YORK, July 1, 2026 /PRNewswire/ -- S&P Global Inc. (NYSE: SPGI) announced today that it has completed the separation of its Mobility division into an independent, public company, Mobility Global Inc. ("Mobility Global"). Mobility Global common stock will begin regular-way trading today on the New York Stock Exchange under the ticker symbol "MBGL". "The successful completion of this separation reflects the extraordinary work and dedication of the S&P Global and Mobility Global teams over the past 15 months," said Martina Cheung, President and CEO of S&P Global. "Together, we have built a strong foundation for Mobility Global as an independent company and both companies stand well-positioned for the future."The separation was achieved through the distribution of 100 percent of the shares of Mobility Global to holders of S&P Global common stock effective as of 12:01 a.m. New York City time on July 1, 2026, with S&P Global stockholders receiving one share of Mobility Global common stock for every share of S&P Global common stock held at the close of business on June 15, 2026, the record date. S&P Global stockholders entitled to receive the distribution received a book-entry account statement or a credit to their brokerage account reflecting their ownership of Mobility Global common stock. Fractional shares of Mobility Global common stock were not distributed. Any fractional share of Mobility Global common stock otherwise issuable to a S&P Global stockholder will be sold in the open market on such stockholder's behalf, and such stockholder will receive a cash payment for the fractional share based on its pro rata portion of the net cash proceeds from all sales of fractional shares.S&P Global expects to issue a press release on July 6, 2026 providing recast financial information for full year 2025, the four quarters of 2025 and the first quarter of 2026, reflecting the completion of the spin-off of Mobility Global.Morgan Stanley & Co. LLC, Goldman Sachs & Co. LLC, Citigroup Global Markets Inc. and Evercore Group L.L.C. served as financial advisors and Davis Polk & Wardwell LLP and Baker McKenzie LLP served as legal advisors to S&P Global.About S&P GlobalS&P Global (NYSE: SPGI) enables businesses, governments, and individuals with trusted data, expertise and technology to make decisions with conviction. We are Advancing Essential Intelligence through world-leading benchmarks, data, and insights that customers need in order to plan confidently, act decisively, and thrive in a rapidly changing global landscape.From helping our customers assess new investments across the capital and commodities markets to navigating the energy expansion, acceleration of artificial intelligence, and evolution of public and private markets, we enable the world's leading organizations to unlock opportunities, solve challenges, and plan for tomorrow – today.Forward-Looking StatementsThis press release contains "forward-looking statements," as defined in the Private Securities Litigation Reform Act of 1995. These statements, which express management's current views concerning future events, trends, contingencies or results, appear at various places in this press release and use words like "anticipate," "assume," "believe," "continue," "estimate," "expect," "forecast," "future," "intend," "plan," "potential," "predict," "project," "strategy," "target" and similar terms, and future or conditional tense verbs like "could," "may," "might," "should," "will" and "would." For example, management may use forward-looking statements when addressing topics such as: the outcome of contingencies; future actions by regulators; changes in the business strategies and methods of generating revenue of S&P Global Inc. (the "Company"); the development and performance of the Company's services and products; the expected impact of acquisitions and dispositions; and the Company's effective tax rates; the Company's cost structure, dividend policy, cash flows or liquidity.Forward-looking statements are subject to inherent risks and uncertainties. Factors that could cause actual results to differ materially from those expressed or implied in forward-looking statements include, among other things:worldwide economic, financial, political, and regulatory conditions (including slower GDP growth or recession, restrictions on trade (e.g., tariffs), instability in the banking sector and inflation), and factors that contribute to uncertainty and volatility (e.g., supply chain risk), geopolitical uncertainty (including military conflict), natural and man-made disasters, civil unrest, public health crises (e.g., pandemics), and conditions that result from legislative, regulatory, trade and policy changes, including from the U.S. administration;the volatility and health of debt, equity, commodities and energy markets, including credit quality and spreads, the composition and mix of credit maturity profiles, the level of liquidity and future debt issuances, equity flows from active to passive, fluctuations in average asset prices in global equities, demand for investment products that track indices and assessments and trading volumes of certain exchange traded derivatives;the demand and market for credit ratings in and across the sectors and geographies where the Company operates;the Company's ability to maintain adequate physical, technical and administrative safeguards to protect the security of confidential information and data, or protect against a system or network disruption that results in regulatory penalties and remedial costs or improper disclosure of confidential information or data;the outcome of litigation, government and regulatory proceedings, investigations and inquiries;concerns in the marketplace affecting the Company's credibility or otherwise affecting market perceptions of the integrity or utility of independent credit ratings, benchmarks, indices and other services;the level of merger and acquisition activity in the United States and abroad;the level of the Company's future cash flows and capital investments;the effect of competitive products (including those incorporating artificial intelligence ("AI")) and pricing, including the level of success of new product developments and global expansion;the impact of customer cost-cutting pressures;a decline in the demand for our products and services by our customers and other market participants;our ability to develop new products or technologies, to integrate our products with new technologies (e.g., AI), or to compete with new products or technologies offered by new or existing competitors;the introduction of competing products (including those developed by AI) or technologies by other companies;our ability to protect our intellectual property from unauthorized use and infringement, including by others using AI technologies, and to operate our business without violating third-party intellectual property rights, including through our own use of AI in our products and services;our ability to attract, incentivize and retain key employees, especially in a competitive business environment;our ability to successfully navigate key organizational changes;the continuously evolving regulatory environment in Europe, the United States and elsewhere around the globe affecting each of our businesses and the products they offer, and our compliance therewith;the Company's exposure to potential criminal sanctions or civil penalties for noncompliance with foreign and U.S. laws and regulations that are applicable in the jurisdictions in which it operates, including sanctions laws relating to countries such as Iran, Russia and Venezuela, anti-corruption laws such as the U.S. Foreign Corrupt Practices Act and the U.K. Bribery Act of 2010, and local laws prohibiting corrupt payments to government officials, as well as import and export restrictions;the Company's ability to make acquisitions and dispositions and successfully integrate the businesses we acquire;consolidation of the Company's customers, suppliers or competitors;the ability of the Company, and its third-party service providers, to maintain adequate physical and technological infrastructure;the Company's ability to successfully recover from a disaster or other business continuity problem, such as an earthquake, hurricane, flood, civil unrest, protests, military conflict, terrorist attack, outbreak of pandemic or contagious diseases, security breach, cyber attack, data breach, power loss, telecommunications failure or other natural or man-made event;the impact on the Company's revenue and net income caused by fluctuations in foreign currency exchange rates;the impact of changes in applicable tax or accounting requirements on the Company;the ability of the separation of Mobility Global to qualify for tax-free treatment for U.S. federal income tax purposes;any disruption to the Company's business in connection with the separation of Mobility Global;any loss of synergies from separating the businesses of Mobility Global and the Company that adversely impact the results of operations of both businesses, or the companies resulting from the separation of Mobility Global not realizing all of the expected benefits of the separation; andfollowing the separation of Mobility Global, the combined value of the common stock of the two publicly-traded companies not being equal to or greater than the value of the Company's common stock had the separation not occurred.The factors noted above are not exhaustive. The Company and its subsidiaries operate in a dynamic business environment in which new risks emerge frequently. Accordingly, the Company cautions readers not to place undue reliance on any forward-looking statements, which speak only as of the dates on which they are made. The Company undertakes no obligation to update or revise any forward-looking statement to reflect events or circumstances arising after the date on which it is made, except as required by applicable law. Further information about the Company's businesses, including information about factors that could materially affect its results of operations and financial condition, is contained in the Company's filings with the SEC, including Item 1A, Risk Factors in our most recently filed Annual Report on Form 10-K.Contacts:S&P Global Investor Relations:
Mark Grant
Senior Vice President, Investor Relations and Treasurer
Tel: +1 (347) 640-1521
mark.grant@spglobal.com Media:
Christina Twomey
Chief Communications Officer, S&P Global
Tel: +1 (646) 407-3001
christina.twomey@spglobal.com View original content to download multimedia:https://www.prnewswire.com/news-releases/sp-global-inc-completes-separation-of-mobility-global-inc-302815760.htmlSOURCE S&P Global Original: S&P GLOBAL INC. COMPLETES SEPARATION OF MOBILITY GLOBAL INC.
US Market News
4日前
S&P Cotality Case-Shiller Index Reports Annual Gain in April 2026June 30, 2026 9:54 AM
PR Newswire (US) The S&P Cotality Case-Shiller U.S. National Home Price NSA Index posted a 0.8% annual gain for April 2026, up from a 0.7% rise in the previous month.For the 11th consecutive month, U.S. home values fell in real terms, as April's 3.8% inflation ran roughly 3 percentage points above the 0.8% home price gain.A nearly 9 percentage-point gap separated April's strongest market (Chicago +6.5% YoY) and its weakest (Seattle -2.3%), underscoring a stark regional divergence in home price trends.NEW YORK, June 30, 2026 /PRNewswire/ -- S&P Dow Jones Indices (S&P DJI) today released the April 2026 results for the S&P Cotality Case-Shiller Indices.More than 27 years of history are available for the data series and can be accessed in full by going to www.spglobal.com/spdji/en/index-family/indicators/sp-Cotality-case-shiller.Cotality continues to have transaction delays from the recording office in Wayne County, the most populous county in the Detroit metro area. These delays impacted the April transaction data and, therefore, no valid April 2026 update of the Detroit S&P Cotality Case-Shiller Index will be provided for the June 30, 2026, release date. There was, however, enough data to calculate a valid March 2026 update, which is provided in Tables 2 and 3.S&P DJI will continue to provide updates to the Detroit index values for the month(s) with missing sale transactions data.ANALYSIS"April's figures confirm that U.S. home prices remain essentially flat, with the S&P Cotality Case-Shiller National Home Price Index up a scant 0.8% year over year, just above March's 0.7% pace," said Nicholas Godec, CFA, CAIA, CIPM, Head of Fixed Income Tradables & Commodities at S&P Dow Jones Indices. "With inflation accelerating to 3.8% in April, U.S. home values have now declined in real terms for an 11th straight month, further eroding inflation-adjusted housing wealth."Geographic dispersion remains pronounced," Godec continued. "Midwest and Northeast markets are still leading moderate growth, while many Sun Belt and Western metros see ongoing declines. Chicago was again the strongest market with a 6.5% annual gain, trailed by New York (3.8%) and Cleveland (3.2%). Seattle's 2.3% year-over-year drop was the steepest in April, with Denver (-1.8%), Tampa (-1.8%), Dallas (-1.6%), and Phoenix (-1.7%) also among the notable decliners. The nearly 9 percent performance spread between Chicago and Seattle highlights how localized housing trends remain."Monthly price movements show seasonal strength masking underlying softness," Godec observed. "On a non-seasonally adjusted basis, the National Index rose 0.8% from March (with the 10-City and 20-City Composites up 1.1% and 1.0%, respectively), reflecting typical spring gains. Yet after seasonal adjustment, the National Index dipped 0.1%, while the 20-City Composite was essentially flat (-0.04%). The latest six months saw a 1.35% national increase, offsetting a -0.5% decline in the prior six months. This represents a modest shift in direction, but remains limited in the context of rising costs."The affordability pinch remains a key headwind," Godec concluded. "After dipping below 6% earlier this year, 30-year mortgage rates climbed back to 6.3% in April, keeping financing costs elevated. In this higher-rate environment, home price growth remains constrained, with housing largely treading water in nominal terms and falling in real terms."YEAR-OVER-YEARThe S&P Cotality Case-Shiller U.S. National Home Price NSA Index, covering all nine U.S. census divisions, reported a 0.8% annual gain for April. The 10-City Composite saw an annual increase of 1.8%, up from a 1.5% increase in the previous month. The 20-City Composite posted a year-over-year increase of 1.1%, up from a 0.9% rise in the previous month.Chicago reported the highest annual gain among the 20 cities with a 6.5% increase in April, followed by New York and Cleveland with annual increases of 3.8% and 3.2%, respectively. Seattle posted the lowest return in April, falling 2.3%.MONTH-OVER-MONTHThe pre-seasonally adjusted U.S. National, 10-City Composite, and 20-City Composite Indices recorded monthly gains of 0.8%, 1.1%, and 1.0%, respectively.After seasonal adjustment, the U.S. National and 20-City Composite Indices reported monthly decreases of 0.1% and 0.04%, while the 10-City Composite Index posted a 0.04% gain.SUPPORTING DATAThe S&P Cotality Case-Shiller U.S. National Home Price NSA Index, which covers all nine U.S. census divisions, recorded a 0.8% annual increase in April 2026. The 10-City and 20-City Composites reported year-over-year increases of 1.8% and 1.1%, respectively.Table 1 below shows the housing boom/bust peaks and troughs for the three composites along with the current levels and percentage changes from the peaks and troughs.
2022 Peak2023 TroughCurrentIndexLevelDateLevelDateFrom Peak
(%)LevelFrom
Trough (%)From
Peak (%)National308.07Jun-22292.68Jan-23-5.0 %332.6813.7 %8.0 %20-City318.73Jun-22297.47Jan-23-6.7 %345.4316.1 %8.4 %10-City330.38Jun-22309.92Jan-23-6.2 %367.9018.7 %11.4 %Table 2 below summarizes the results for April 2026. The S&P Cotality Case-Shiller Indices could be revised for the prior 24 months, based on the receipt of additional source data.Metropolitan
AreaApril 2026
LevelApril / MarchChange (%)March / FebruaryChange (%)1-Year Change
(%)Atlanta250.451.06 %0.72 %-0.13 %Boston355.861.16 %1.96 %2.11 %Charlotte286.921.05 %0.59 %1.01 %Chicago231.511.55 %2.21 %6.52 %Cleveland204.990.76 %1.03 %3.18 %Dallas293.300.92 %0.57 %-1.57 %Denver316.210.84 %1.31 %-1.85 %Detroit----0.98 %--Las Vegas299.480.21 %0.48 %-1.66 %Los Angeles449.021.10 %0.64 %-0.45 %Miami447.810.52 %0.97 %1.10 %Minneapolis248.911.13 %0.76 %2.02 %New York343.410.96 %1.02 %3.82 %Phoenix325.12-0.05 %0.33 %-1.65 %Portland331.760.85 %0.85 %-0.42 %San Diego451.850.83 %1.20 %1.05 %San Francisco368.061.51 %1.79 %1.30 %Seattle393.191.25 %1.27 %-2.26 %Tampa369.290.91 %-0.17 %-1.77 %Washington339.991.21 %1.22 %0.17 %Composite-10367.901.06 %1.18 %1.78 %Composite-20345.431.03 %1.05 %1.14 %U.S. National332.680.77 %0.74 %0.85 %Sources: S&P Dow Jones Indices and CotalityData through April 2026Table 3 below shows a summary of the monthly changes using the seasonally adjusted (SA) and non-seasonally adjusted (NSA) data. Since its launch in early 2006, the S&P Cotality Case-Shiller Indices have published, and the markets have followed and reported on, the non-seasonally adjusted data set used in the headline indices. For analytical purposes, S&P Dow Jones Indices publishes a seasonally adjusted data set covered in the headline indices, as well as for the 17 of 20 markets with tiered price indices and the five condo markets that are tracked.
April / March Change (%)March / February Change (%)Metropolitan AreaNSASANSASAAtlanta1.06 %0.13 %0.72 %-0.09 %Boston1.16 %-0.42 %1.96 %0.71 %Charlotte1.05 %0.00 %0.59 %-0.18 %Chicago1.55 %0.65 %2.21 %1.13 %Cleveland0.76 %0.08 %1.03 %-0.11 %Dallas0.92 %-0.40 %0.57 %-0.54 %Denver0.84 %-0.45 %1.31 %-0.32 %Detroit----0.98 %0.01 %Las Vegas0.21 %-0.53 %0.48 %-0.22 %Los Angeles1.10 %0.00 %0.64 %-0.60 %Miami0.52 %-0.05 %0.97 %0.54 %Minneapolis1.13 %-0.04 %0.76 %-0.43 %New York0.96 %0.19 %1.02 %0.23 %Phoenix-0.05 %-0.61 %0.33 %-0.31 %Portland0.85 %-0.22 %0.85 %-0.49 %San Diego0.83 %-0.32 %1.20 %-0.55 %San Francisco1.51 %-0.12 %1.79 %-0.51 %Seattle1.25 %-0.53 %1.27 %-0.95 %Tampa0.91 %0.17 %-0.17 %-0.69 %Washington1.21 %0.21 %1.22 %-0.12 %Composite-101.06 %0.04 %1.18 %-0.04 %Composite-201.03 %-0.04 %1.05 %-0.15 %U.S. National0.77 %-0.15 %0.74 %-0.21 %Sources: S&P Dow Jones Indices and CotalityData through April 2026
ABOUT S&P DOW JONES INDICESS&P Dow Jones Indices is the largest global resource for essential index-based concepts, data and research, and home to iconic financial market indicators, such as the S&P 500® and the Dow Jones Industrial Average®. More assets are invested in products based on our indices than products based on indices from any other provider in the world. Since Charles Dow invented the first index in 1884, S&P DJI has been innovating and developing indices across the spectrum of asset classes helping to define the way investors measure and trade the markets.S&P Dow Jones Indices is a division of S&P Global (NYSE: SPGI), which provides essential intelligence for individuals, companies, and governments to make decisions with confidence. For more information, visit www.spglobal.com/spdji.FOR MORE INFORMATION:Lemuel Brewster
Americas Communications
(+1) 917 805 1089
lemuel.brewster@spglobal.comS&P Dow Jones Indices' interactive blog, IndexologyBlog.com, delivers real-time commentary and analysis from industry experts across S&P Global on a wide range of topics impacting residential home prices, homebuilding and mortgage financing in the United States. Readers and viewers can visit the blog at www.indexologyblog.com, where feedback and commentary are welcomed and encouraged.The S&P Cotality Case-Shiller Indices are published on the last Tuesday of each month at 9:00 am ET. They are constructed to accurately track the price path of typical single-family homes located in each metropolitan area provided. Each index combines matched price pairs for thousands of individual houses from the available universe of arms-length sales data. The S&P Cotality Case-Shiller U.S. National Home Price Index tracks the value of single-family housing within the United States. The index is a composite of single-family home price indices for the nine U.S. Census divisions and is calculated quarterly. The S&P Cotality Case-Shiller 10-City Composite Home Price Index is a value-weighted average of the 10 original metro area indices. The S&P Cotality Case-Shiller 20-City Composite Home Price Index is a value-weighted average of the 20 metro area indices. The indices have a base value of 100 in January 2000; thus, for example, a current index value of 150 translates to a 50% appreciation rate since January 2000 for a typical home located within the subject market.These indices are generated and published under agreements between S&P Dow Jones Indices and Cotality, Inc.The S&P Cotality Case-Shiller Indices are produced by Cotality, Inc. In addition to the S&P Cotality Case-Shiller Indices, Cotality also offers home price index sets covering thousands of zip codes, counties, metro areas, and state markets. The indices, published by S&P Dow Jones Indices, represent just a small subset of the broader data available through Cotality.Case-Shiller® and Cotality® are trademarks of Cotality Case-Shiller, LLC or its affiliates or subsidiaries ("Cotality") and have been licensed for use by S&P Dow Jones Indices. None of the financial products based on indices produced by Cotality or its predecessors in interest are sponsored, sold, or promoted by Cotality, and neither Cotality nor any of its affiliates, subsidiaries, or predecessors in interest makes any representation regarding the advisability of investing in such products. View original content:https://www.prnewswire.com/news-releases/sp-cotality-case-shiller-index-reports-annual-gain-in-april-2026-302814631.htmlSOURCE S&P Dow Jones Indices Original: S&P Cotality Case-Shiller Index Reports Annual Gain in April 2026
US Market News
1週前
Canadian Oil Sands Greenhouse Gas Intensity Continues a 17-year Decline -- Down Nearly One-third Since 2009, S&P Global Energy Analysis FindsJune 24, 2026 10:28 AM
PR Newswire (US) CALGARY, AB, June 24, 2026 /PRNewswire/ -- The greenhouse gas intensity of Canadian oil sands production has declined for a 13th straight year, according to a new analysis by S&P Global Energy. Since 2009, annual emissions intensity has declined every year but one (2012). The annual S&P Global Energy analysis finds that the benchmark average GHG intensity of oil sands production declined 2% to 59 kilograms of "carbon dioxide equivalent" per barrel (kgCO2e/bbl) in 2025, the most recent calendar year available.Since 2009, the average GHG intensity of oil sands production has declined by 31%, or nearly 27 kgCO2e/b of marketable product. "The downward trajectory of oil sands emissions intensity is now a well-established, multi-decade trend," said Kevin Birn, Vice President, Head of Carbon Research, S&P Global Energy. "Ongoing optimization efforts to maximize output from existing facilities, which are much more capital efficient compared to new projects, has been a critical factor, and this is expected to continue."Improvements in mining operations experienced the greatest gains, which came from improved fleet optimization, better waste-heat integration, improved predictive maintenance and shorter maintenance turnaround periods, the analysis finds.Integrated mines have also been where the larger step-out technologies have been tested and deployed, such as the completion of the Quest Carbon Capture, Utilization and Storage (CCUS) project in 2015 and Suncor's coke boiler replacement in 2024. Meanwhile greater volumes of steam-assisted gravity drainage (SAGD) and Mined dilibit—operations on average less intensive than integrated mines—diluted and reduced the overall industry average.While GHG intensity continues to decline, absolute emissions from oil sands have continued to rise, but at a slower rate. Between 2024-2025, absolute emissions rose 2% on account of a 150,000 b/d rise in overall production."As oil sands output has increased, emissions have been spread over more units pushing intensity lower, even as it also pushed absolute emissions higher, but at a slowing rate," Birn said. "With growing speculation that oil sands production growth may accelerate, absolute emissions growth should also be expected to rise without the application of CCUS. However, the learnings over the past two decades may mean these barrels still come at even lower intensity."Media Contacts: Jeff Marn
S&P Global Energy
+1 202 463 8213
jeff.marn@spglobal.comAbout S&P Global EnergyAt S&P Global Energy, our comprehensive view of global energy and commodities markets enables our customers to make superior decisions and create long-term, sustainable value. Our four core capabilities are: Platts for pricing and news; CERA for research and advisory; Horizons for energy expansion and sustainability solutions; and Events for industry collaboration.S&P Global Energy is a division of S&P Global (NYSE: SPGI). S&P Global enables businesses, governments, and individuals with trusted data, expertise, and technology to make decisions with conviction. We are Advancing Essential Intelligence through world-leading benchmarks, data, and insights that customers need in order to plan confidently, act decisively, and thrive in a rapidly changing global landscape. Learn more at www.spglobal.com/energy. View original content to download multimedia:https://www.prnewswire.com/news-releases/canadian-oil-sands-greenhouse-gas-intensity-continues-a-17-year-decline--down-nearly-one-third-since-2009-sp-global-energy-analysis-finds-302809420.htmlSOURCE S&P Global Energy Original: Canadian Oil Sands Greenhouse Gas Intensity Continues a 17-year Decline -- Down Nearly One-third Since 2009, S&P Global Energy Analysis Finds
US Market News
2週前
CARFAX Recognized as Top Workplace in Both of its U.S. Hub CitiesJune 22, 2026 10:00 AM
PR Newswire (US) Recognition Driven by Employee Feedback and a Strong Workplace CultureCENTREVILLE, Va., June 22, 2026 /PRNewswire/ -- CARFAX has been named a Top Workplace in both of its U.S. hub cities, earning recognition from WTOP in Washington, D.C., and from the St. Louis Post-Dispatch in Missouri. This honor marks the 12th time CARFAX has been recognized as a Washington Top Workplace, as well as the fifth consecutive year in Missouri, reflecting the company's continued commitment to fostering exceptional workplace culture. "Every day, our team is the driving force behind our mission to help millions of people," said Scott Fredericks, President of CARFAX. "Being recognized as a Top Workplace in both Virginia and Missouri is especially meaningful because these communities are our home. This recognition belongs to Team CARFAX for their passion, collaboration, and commitment to making CARFAX a place where people can grow, learn, and do their best work."These awards, administered through the Energage Workplace Survey, are based on anonymous employee feedback evaluating key aspects of the workplace experience, including leadership, culture, and overall employee satisfaction. This marks the first year WTOP, the region's leading all-news radio station, has hosted the Washington program following more than a decade under The Washington Post."People have asked me many times whether I would leave CARFAX for anything, and my answer has always been 'no'," said Jamie Gladney, Senior Manager for Service Automation at CARFAX in the Missouri hub. "For the past 25 years, CARFAX has been more than just a place to work — it's a place where I've been able to help others, keep learning, and make a real difference. Team CARFAX isn't just a slogan, it's a mindset."CARFAX is also preparing to move its headquarters to a new state-of-the-art space in Reston, Va., designed to strengthen teamwork, fuel innovation, and support the company's growth. At Reston Station, CARFAX will be part of a premier, transit-oriented development that brings together leading employers, modern amenities, and a connected community environment."I get to spend my workdays with smart, wonderful humans and balance it all with my other full-time gig as a parent; that makes choosing CARFAX a no-brainer," said Melissa Paloti, Director of Product Management at CARFAX. "I am also incredibly proud to work for a brand that is not only shaping an industry but also making the stressful and expensive process of buying a car much easier for consumers, every single day."CARFAX remains committed to investing in its people through competitive benefits, career development, and a culture built for long-term success. For more information about careers at CARFAX, visit www.carfax.com/careers.About CARFAXCARFAX, part of S&P Global Mobility, helps millions of people every day confidently shop, buy, service, and sell cars with innovative solutions powered by CARFAX® vehicle history information. The expert in vehicle history since 1984, CARFAX provides CARFAX Car Listings, CARFAX Car Care, CARFAX History-Based Value , and the flagship CARFAX Vehicle History Report to consumers and the automotive industry. CARFAX owns the world's largest vehicle history database and is nationally recognized as a top workplace by The Washington Post. Shop, Buy, Service, Sell – Show me the CARFAX®.S&P Global Mobility is a division of S&P Global (NYSE: SPGI). S&P Global is the world's foremost provider of credit ratings, benchmarks, analytics, and workflow solutions in the global capital, commodity, and automotive markets. View original content to download multimedia:https://www.prnewswire.com/news-releases/carfax-recognized-as-top-workplace-in-both-of-its-us-hub-cities-302806383.htmlSOURCE CARFAX Original: CARFAX Recognized as Top Workplace in Both of its U.S. Hub Cities
US Market News
3週前
S&P Global Energy Launches United Nations Global Compact Screening DatasetJune 12, 2026 9:00 AM
PR Newswire (US) New Sustainable1 dataset flags corporate conduct assessed against UNGC principlesLONDON and NEW YORK, June 12, 2026 /PRNewswire/ -- S&P Global Energy, the leading independent provider of information, data, analysis, benchmark prices and workflow solutions for the commodities, energy expansion and energy transition markets, today announced that S&P Global Sustainable1 has launched the United Nations Global Compact (UNGC) Screening Dataset.1The dataset is a one-stop screening solution that provides a structured method to help investment managers, bankers and non-financial corporates assess whether companies are aligned with the 10 UNGC Principles. S&P Global Sustainable1 has applied the UNGC Screening Dataset to a proprietary list of 16,500 companies globally and expects to cover an estimated 24,000. This dataset combines two evidence streams that enable customers to identify potential misalignment across human rights, labor, environment and anti-corruption principles, providing companies with timely and critical oversight of evolving risks:Controversy Screening: Tracks corporate controversies linked to one or more UNGC principles.Business Involvement Screening: Flags corporate revenues originating from specific controversial products."When investors evaluate portfolio risk, understanding any controversies companies are involved in can be a critical step. To help investors understand these risks, we have launched the S&P Global Sustainable1 UNGC Screening Dataset. This comprehensive, foundational tool identifies corporate conduct assessed against UNGC principles and better informs investment decisions," said Thomas Yagel, Head of Sustainable1 at S&P Global Energy. "The UNGC Screening Dataset provides clear and actionable UNGC alignment labels, enabling investors to integrate S&P Global Sustainable1 insights into their decision-making, portfolio construction and ongoing risk oversight."Leveraging S&P Global's?AI capabilities, this new dataset utilizes proprietary AI and machine learning?models?to systematically?identify, classify, and quantify ESG and?business?risks.?The AI models continuously screen?millions of public sources globally – across news, NGOs, regulators, and other stakeholders – in multiple languages to detect emerging risk incidents in?real time. These?AI–driven?insights are then?validated?and contextualized by a dedicated Controversy Research team within Sustainable1, strengthening accuracy, consistency and decision–ready?risk indicators for investors.Using this dataset, S&P Global Sustainable1 published a white paper, "How S&P Global data helps investors navigate the risks of corporate controversies", which found that misalignment in companies is most frequently linked to human rights-related controversies. The concentration of cases tied to human rights – and, to a lesser extent, environmental impacts and corruption – provides indicators for investors as to where they may face the most persistent and material sources of controversy-driven risk. By integrating these risk indicators into portfolio construction and ongoing oversight, investors can more consistently identify elevated exposure; engage companies from a clearer baseline of evidence and strengthen accountability expectations aligned with the UNGC principles.Details of the UNGC Screening Dataset are available here. Read the full white paper here.For more information on S&P Global products and solutions, please reach out to our teams here.1 The UN is not affiliated with, does not endorse, and has not reviewed the S&P Global Sustainable1 UNGC Screening Dataset.Media ContactKathleen Tanzy
S&P Global Energy, Americas/EMEA
+1 917-331-4607
kathleen.tanzy@spglobal.comAbout S&P Global Energy At S&P Global Energy, our comprehensive view of global energy and commodities markets enables our customers to make superior decisions and create long-term, sustainable value. Our four core capabilities are: Platts for pricing and news; CERA for research and advisory; Horizons for energy expansion and sustainability solutions; and Events for industry collaboration. S&P Global Energy is a division of S&P Global (NYSE: SPGI). S&P Global enables businesses, governments, and individuals with trusted data, expertise, and technology to make decisions with conviction. We are Advancing Essential Intelligence through world-leading benchmarks, data, and insights that customers need in order to plan confidently, act decisively, and thrive in a rapidly changing global landscape. Learn more at www.spglobal.com/energy View original content to download multimedia:https://www.prnewswire.com/news-releases/sp-global-energy-launches-united-nations-global-compact-screening-dataset-302799043.htmlSOURCE S&P Global Energy Original: S&P Global Energy Launches United Nations Global Compact Screening Dataset
US Market News
3週前
CARFAX: Top 10 Vehicles Targeted by Recent Catalytic Converters TheftsJune 10, 2026 9:30 AM
PR Newswire (US) Law enforcement warns there may be a surge in converter thefts stemming from increased value CENTREVILLE, Va., June 10, 2026 /PRNewswire/ -- New CARFAX data estimates more than 137,000 catalytic converters were stolen in 2025, with thousands more estimated stolen at the start of this year. Law enforcement warns thieves target these emission-control devices to get at the valuable precious metals they contain, including platinum, palladium and rhodium. Here are the Top Vehicles Most Frequently Targeted Nationwide:Ford F-150 pickup truckHyundai Tucson SUVFord Explorer SUVRam 2500 heavy-duty pickup truckChevrolet Silverado pickup truckChevrolet Traverse SUVRam 3500 heavy-duty pickup truckFord EcoSport SUVFord Expedition SUVChevrolet Trax SUV"There are a wide range of vehicles impacted, and most of these are pickup trucks and SUVs, which tend to sit higher off the ground, making it easier for thieves to get in and out," said Patrick Olsen, Editor-in-Chief at CARFAX. "Experts also tell us that while thieves can make anywhere from $25-$300 for a standard catalytic converter, converters from hybrid vehicles can sell for up to $1,400 because they have even more of those precious metals inside."Several factors may be contributing to continued catalytic converter thefts, including rising precious metal prices. Rhodium, one of the metals found in catalytic converters, has more than doubled in value over the past year, reaching about $11,000 per ounce in March. Prices today remain below the peak of roughly $30,000 per ounce reached in 2021.Some law enforcement tells CARFAX they've seen a resurgence in catalytic converter thefts, including a recent incident in Maryland where the Sykesville Police Department confirmed at least two drivers were victimized just weeks ago. The trend comes as replacement costs can reach $3,000, particularly for motorists without comprehensive insurance coverage."Thieves stripped these catalytic converters in a matter of minutes, leaving the car owners to face thousands of dollars in out-of-pocket repair bills," said Cpl. Annelise Barrett of the Sykesville Police Department. "We are seeing a noticeable bump in these incidents, not only in our area, but in the surrounding cities as well."To protect your vehicles, law enforcement recommends the following safety measures:Park securely: Utilize a locked garage whenever possible.Choose high-visibility areas: If parking outside, choose well-lit spaces with high foot traffic.Upgrade security: Install motion-sensor lights and increase your vehicle alarm's sensitivity.Install a physical deterrent: Consider adding a metal cage or lock around your catalytic converter. Thieves target easy opportunities; adding even a minor challenge can cause them to move on.Make identification easier: If possible, engrave your VIN on the catalytic converter. If it is stolen, the VIN can help law enforcement, scrapyards, and pawn shops identify and recover the part.About CARFAXCARFAX, part of S&P Global Mobility, helps millions of people every day confidently shop, buy, service, and sell cars with innovative solutions powered by CARFAX® vehicle history information. The expert in vehicle history since 1984, CARFAX provides CARFAX Car Listings, CARFAX Car Care, CARFAX History-Based Value , and the flagship CARFAX Vehicle History Report to consumers and the automotive industry. CARFAX owns the world's largest vehicle history database and is nationally recognized as a top workplace by The Washington Post. Shop, Buy, Service, Sell – Show me the CARFAX®.S&P Global Mobility is a division of S&P Global (NYSE: SPGI). S&P Global is the world's foremost provider of credit ratings, benchmarks, analytics, and workflow solutions in the global capital, commodity, and automotive markets. View original content to download multimedia:https://www.prnewswire.com/news-releases/carfax-top-10-vehicles-targeted-by-recent-catalytic-converters-thefts-302796114.htmlSOURCE CARFAX Original: CARFAX: Top 10 Vehicles Targeted by Recent Catalytic Converters Thefts
US Market News
4週前
S&P Global Expands AI Ecosystem Reach with Cohere to Power Trusted, Agentic Workflows for Financial InstitutionsJune 8, 2026 9:00 AM
PR Newswire (US) New collaboration brings S&P Global's essential intelligence into Cohere's secure enterprise AI platform, North, extending the reach of S&P Global data across the applications and platforms where customers work.Customers can now access financial data directly within Cohere's secure agentic AI platform, accelerating research, analysis, and reporting workflows across financial services.NEW YORK, June 8, 2026 /PRNewswire/ -- S&P Global (NYSE: SPGI) today announced a strategic collaboration with Cohere, a leading global sovereign AI provider for governments and regulated industries, to bring its trusted financial data directly into Cohere's secure enterprise platform, North. The collaboration will enable customers to leverage S&P Global's essential intelligence across more AI and agentic workflows grounded in verifiable fact, delivering faster research and greater accuracy with trusted, citation-backed information. With this integration, customers can run sensitive on-premise workloads directly within North powered by Cohere's cutting-edge AI models, combining S&P Global's trusted data with their own enterprise data to generate faster, more accurate answers to complex questions. The collaboration reflects S&P Global's strategy of integrating its data across the AI platforms where customers operate, ensuring its differentiated data translate into real productivity gains, no matter which AI environment a customer chooses."We've done the work on the backend to make our data AI-ready, build the retrieval infrastructure, and partner with best-in-class AI providers, so that customers can simply put S&P Global to work in the platforms they already use," said Bhavesh Dayalji, Chief AI Officer of S&P Global and CEO of Kensho. "As agentic workflows become the norm, we deliver value by ensuring that customers can access our data seamlessly and accurately, wherever they work.""By combining S&P Global's financial intelligence with Cohere's enterprise-grade sovereign AI platform, we're giving financial institutions a secure foundation to build agentic workflows wherever their data lives that deliver measurable impact," said Frank O'Dowd, Chief Revenue & Commercial Officer of Cohere. "Regulated industries need AI they can trust with their most sensitive workloads, and they want it deeply connected to the proprietary data that drives their business. This collaboration marks a major step forward in how the global financial ecosystem puts high-trust AI to work."The Cohere collaboration builds on S&P Global's broader strategy of making its data available across the AI platforms that customers use. This approach ensures customers can access S&P Global's high-quality intelligence in their preferred AI environments, with data validated at every step through source citations without the friction of building custom pipelines.That reach is enabled by S&P Global and Kensho's sustained investment in building a foundational data retrieval layer for customers, enabling access to S&P Global intelligence at scale across AI and agentic workflows.To learn more about S&P Global's AI solutions, visit: spglobal.comMedia Contacts:
Orla O'Brien
S&P Global
+1 857-407-8559
orla.obrien@spglobal.comMadeline McSherry
Kensho
Madeline.mcsherry@spglobal.comAbout S&P Global
S&P Global (NYSE: SPGI) enables businesses, governments, and individuals with trusted data, expertise and technology to make decisions with conviction. We are Advancing Essential Intelligence through world-leading benchmarks, data, and insights that customers need in order to plan confidently, act decisively, and thrive in a rapidly changing global landscape. From helping our customers assess new investments across the capital and commodities markets to navigating the energy expansion, acceleration of artificial intelligence, and evolution of public and private markets, we enable the world's leading organizations to unlock opportunities, solve challenges, and plan for tomorrow – today.About the Kensho LLM-ready API
The Kensho LLM-ready API integrates with any large language model, enabling customers to use natural language to query a range of S&P Global datasets, including S&P Capital IQ Financials, earnings call transcripts, and more. Unlike typical APIs, it is optimized for LLMs by offering a simplified structure that supports function calling patterns. It comes with a Python library that streamlines everything from authentication to LLM integration. Designed for professionals such as investment bankers, equity analysts, consultants, and other data-driven roles, this LLM-ready API supports efficient retrieval of financial data, including financial statement line items, security identifiers, and company information—ideal for creating pitch books, research reports, and market positioning presentations. The API was developed by Kensho, S&P Global's hub for AI innovation and transformation. View original content to download multimedia:https://www.prnewswire.com/news-releases/sp-global-expands-ai-ecosystem-reach-with-cohere-to-power-trusted-agentic-workflows-for-financial-institutions-302793973.htmlSOURCE S&P Global Original: S&P Global Expands AI Ecosystem Reach with Cohere to Power Trusted, Agentic Workflows for Financial Institutions
US Market News
4週前
Marvell Technology and Flex Set to Join S&P 500; Others to Join S&P MidCap 400 and S&P SmallCap 600June 5, 2026 7:25 PM
PR Newswire (US) NEW YORK, June 5, 2026 /PRNewswire/ -- S&P Dow Jones Indices will make the following changes to the S&P 500, S&P MidCap 400, and S&P SmallCap 600 indices effective prior to the open of trading on Monday, June 22, 2026, to coincide with the quarterly rebalance. The changes ensure that each index is more representative of its market capitalization range. The companies being removed from S&P MidCap 400 and S&P SmallCap 600 are no longer representative of the mid-cap and small-cap market space, respectively. Following is a summary of the changes that will take place prior to the open of trading on the effective date:Effective DateIndex Name ActionCompany NameTickerGICS SectorJune 22, 2026S&P 500AdditionMarvell TechnologyMRVLInformation TechnologyJune 22, 2026S&P 500DeletionPool CorpPOOLConsumer DiscretionaryJune 22, 2026S&P 500AdditionFlexFLEXInformation TechnologyJune 22, 2026S&P 500DeletionThe Campbell's CompanyCPBConsumer StaplesJune 22, 2026S&P MidCap 400AdditionRokuROKUCommunication ServicesJune 22, 2026S&P MidCap 400DeletionFlex FLEXInformation TechnologyJune 22, 2026S&P MidCap 400AdditionCoeur MiningCDEMaterialsJune 22, 2026S&P MidCap 400DeletionBellRing Brands BRBRConsumer StaplesJune 22, 2026S&P MidCap 400AdditionSemtechSMTCInformation TechnologyJune 22, 2026S&P MidCap 400DeletionCotyCOTYConsumer StaplesJune 22, 2026S&P MidCap 400AdditionSanminaSANMInformation TechnologyJune 22, 2026S&P MidCap 400DeletionConcentrix CNXCIndustrialsJune 22, 2026S&P MidCap 400AdditionViavi Solutions VIAVInformation TechnologyJune 22, 2026S&P MidCap 400DeletionBlackbaud BLKBInformation TechnologyJune 22, 2026S&P SmallCap 600AdditionPoolPOOLConsumer DiscretionaryJune 22, 2026S&P SmallCap 600DeletionEmbecta EMBCHealth CareJune 22, 2026S&P SmallCap 600AdditionThe Campbell's CompanyCPBConsumer StaplesJune 22, 2026S&P SmallCap 600DeletionUniversal Health Realty Trust UHTReal EstateJune 22, 2026S&P SmallCap 600AdditionCotyCOTYConsumer StaplesJune 22, 2026S&P SmallCap 600DeletionSemtechSMTCInformation TechnologyJune 22, 2026S&P SmallCap 600AdditionConcentrix CNXCIndustrialsJune 22, 2026S&P SmallCap 600DeletionSanmina SANMInformation TechnologyJune 22, 2026S&P SmallCap 600AdditionBlackbaudBLKBInformation TechnologyJune 22, 2026S&P SmallCap 600DeletionViavi SolutionsVIAVInformation TechnologyJune 22, 2026S&P SmallCap 600AdditionCredit Acceptance CACCFinancialsJune 22, 2026S&P SmallCap 600DeletionOxford IndustriesOXMConsumer DiscretionaryJune 22, 2026S&P SmallCap 600AdditionLazardLAZFinancialsJune 22, 2026S&P SmallCap 600DeletionGogoGOGOCommunication ServicesJune 22, 2026S&P SmallCap 600AdditionEastern BanksharesEBCFinancialsJune 22, 2026S&P SmallCap 600DeletionPRA GroupPRAAFinancialsJune 22, 2026S&P SmallCap 600AdditionWesbancoWSBCFinancialsJune 22, 2026S&P SmallCap 600DeletionInsteel IndustriesIIINIndustrialsJune 22, 2026S&P SmallCap 600AdditionWarby ParkerWRBYConsumer DiscretionaryJune 22, 2026S&P SmallCap 600DeletionEthan Allen InteriorsETDConsumer DiscretionaryJune 22, 2026S&P SmallCap 600AdditionNicolet BanksharesNICFinancialsJune 22, 2026S&P SmallCap 600DeletionCytek BiosciencesCTKBHealth CareJune 22, 2026S&P SmallCap 600AdditionLiquidia LQDAHealth CareJune 22, 2026S&P SmallCap 600DeletionMonroMNROConsumer DiscretionaryJune 22, 2026S&P SmallCap 600AdditionRush Street InteractiveRSIConsumer DiscretionaryJune 22, 2026S&P SmallCap 600DeletionVital FarmsVITLConsumer StaplesJune 22, 2026S&P SmallCap 600AdditionUnited States Lime & MineralsUSLMMaterialsJune 22, 2026S&P SmallCap 600DeletionCable OneCABOCommunication ServicesJune 22, 2026S&P SmallCap 600AdditionInvenTrust PropertiesIVTReal EstateJune 22, 2026S&P SmallCap 600DeletionForward AirFWRDIndustrialsABOUT S&P DOW JONES INDICESS&P Dow Jones Indices is the largest global resource for essential index-based concepts, data and research, and home to iconic financial market indicators, such as the S&P 500® and the Dow Jones Industrial Average®. More assets are invested in products based on our indices than products based on indices from any other provider in the world. Since Charles Dow invented the first index in 1884, S&P DJI has been innovating and developing indices across the spectrum of asset classes helping to define the way investors measure and trade the markets.S&P Dow Jones Indices is a division of S&P Global (NYSE: SPGI), which provides essential intelligence for individuals, companies, and governments to make decisions with confidence. For more information, visit www.spglobal.com/spdji/en/.FOR MORE INFORMATION:S&P Dow Jones Indices
index_services@spglobal.comMedia Inquiries
spdji.comms@spglobal.com View original content:https://www.prnewswire.com/news-releases/marvell-technology-and-flex-set-to-join-sp-500-others-to-join-sp-midcap-400-and-sp-smallcap-600-302793159.htmlSOURCE S&P Dow Jones Indices Original: Marvell Technology and Flex Set to Join S&P 500; Others to Join S&P MidCap 400 and S&P SmallCap 600
US Market News
4週前
S&P Dow Jones Indices Consultation on Treatment of MegaCap Companies - ResultsJune 4, 2026 6:00 PM
PR Newswire (US) NEW YORK, June 4, 2026 /PRNewswire/ -- S&P Dow Jones Indices ("S&P DJI") conducted a consultation with market participants on potential changes to the S&P U.S. Indices Methodology and Dow Jones U.S. Total Stock Market Indices Methodology (collectively, the "Relevant Index Families") related to MegaCap companies.The Index Committee appreciates the market engagement received in connection with this consultation and thanks all respondents for their feedback.S&P DJI's Index Committee continually monitors market developments to ensure indices meet their stated objectives and considers methodology changes as needed to help ensure its indices continue to do so.Market consultations are the primary mechanism through which the Index Committee engages with market participants and other stakeholders to seek feedback on whether methodology changes are necessary or appropriate, and to assess potential methodology developments. Consultations also provide an opportunity for any member of the public to submit input. This process is designed to preserve the independence of the Index Committee, effectively mitigate potential conflicts of interest, and help ensure transparency and fairness.The Index Committee carefully reviews all consultation responses received. However, while all responses are reviewed and considered, the Index Committee is not bound by any comments or information submitted as part of the consultation.S&P 500, S&P MidCap 400, and S&P SmallCap 600 Results:Based on S&P DJI's Index Committee review of the markets and after consideration of responses received from a wide range of market participants, no changes will be made to the eligibility criteria including financial viability screens, seasoning period, or minimum IWF, for the S&P 500, S&P MidCap 400, or S&P SmallCap 600 as a result of the S&P Dow Jones Indices consultation on the treatment of MegaCap companies. Accordingly, there will be no changes to existing methodology for this index family.S&P DJI determined that exceptions to the financial viability, seasoning, and IWF requirements should not be granted solely based on market capitalization. The decision not to adopt the proposed exceptions preserves core index principles by maintaining consistent application of these key requirements. Although there may be trade-offs between strict adherence to these eligibility requirements and broad representativeness, the current methodology provides substantial market coverage and sector balance. As a result, the indices can continue to meet their stated objectives while preserving their role as representative and investable benchmarks for the U.S. equity market.The table below summarizes the consultation results.ProposedMethodologyChangesCurrentResultIPO Seasoning
Period to be
reduced to six
months from 12
monthsInitial public offerings should be traded on an
eligible exchange for at least 12 months before
being considered for addition to an index.Spin-offs or in-specie distributions from existing
constituents are not required to have 12 months of
trading prior to their inclusion in the S&P
Composite 1500.Companies that migrate from an ineligible
exchange, emerge from bankruptcy, are newly
designated to be domiciled in the U.S. for index
purposes by S&P Dow Jones Indices, or convert
from an ineligible share or organizational type to an
eligible type do not need to trade on an eligible
U.S. exchange for 12 months before being
considered for addition.No ChangeInvestable
Weight Factor
(IWF) minimum
is waived for
MegaCap
companiesTo be eligible for addition, a stock must have an
IWF of at least 0.10.Companies passing the total company level market
capitalization criteria are also required to
have a security level float-adjusted market
capitalization (FMC) that is at least 50% of the
respective index's total company level minimum
market capitalization threshold.No ChangeFinancial
Viability
exception for
MegaCap
companies S&P Composite 1500. Generally Accepted
Accounting Principles (GAAP) net income from
continuing operations must be positive for:o the most recent quarter, ando the sum of the most recent four consecutive
quartersRule Exceptions. Exceptions to the above criteria
include:• Migrations from one S&P Composite 1500 index
to another do not need to meet the financial
viability, liquidity, or 50% of the respective
index's total company level minimum market
capitalization threshold criteria.• Companies that are spun-off from current S&P
Composite 1500 constituents do not need to
meet the outside addition criteria• Non-S&P Composite 1500 companies that
acquire S&P Composite 1500 index
constituents, but do not fully meet all of the
eligibility criteria, may still be added to an S&P
Composite 1500 index at the discretion of the
Index Committee if the merger consideration
includes the acquiring company issuing stock to
target company shareholders, and the
Committee determines that the addition could
mitigate turnover and enhance the
representativeness of the index as a market
benchmark.No ChangeS&P Total Market Index (TMI), S&P Completion Index (CI), and Dow Jones U.S. Total Stock Market Index (TSM)The S&P Total Market Index (TMI), S&P Completion Index (CI), and Dow Jones U.S. Total Stock Market Index (TSM) are broad market indices intended to represent the investment universe. The following changes will be applied.ProposedMethodologyChangesCurrentResultMegaCap
Classification----Investable Weight
Factor (IWF) –
S&P Total Market
IndexTo be eligible for addition, a stock must have an
IWF of at least 0.10. Current constituents have no
minimum requirement.To be eligible for addition, a stock must have
either:• IWF of at least 0.10, or • Float-adjusted market capitalization
greater than or equal to?10% of the
total company level market
capitalization of the 100th largest
company in the S&P Total Market
Index, ranked by total market
capitalization as of the reference
date.Current constituents have no minimum
requirement.Investable Weight
Factor (IWF) –
Dow Jones U.S.
Total Stock Market
IndexTo be eligible for addition, a stock must have an
IWF of at least 0.10. Current constituents have no
minimum requirement.To be eligible for addition, a stock must have
either:• IWF of at least 0.10, or • Float-adjusted market capitalization
greater than or equal to?10% of the
total company level market
capitalization of the 100th largest
company in the Dow Jones U.S. Total
Stock Market Index, ranked by total
market capitalization as of the
reference date.Current constituents have no minimum
requirement.An IPO that meets the requirements of the updated Investable Weight Factor (IWF) eligibility rule is eligible for fast-track entry, provided the company meets all other applicable fast-track criteria as well. Fast-track assessment is made using the closing price on the first day of trading on an eligible exchange. Once S&P Dow Jones Indices announces that an IPO is eligible for fast-track addition, it is added to the index with five business days' lead time. For more information on IPO fast track entry, see the relevant index methodology.Float Release after the end of IPO Lock-Up PeriodConsultation respondents generally supported implementing float increases following the release of lock-up shares gradually, or in tranches where appropriate, depending on company-specific circumstances.S&P DJI applies the published methodology as the default approach. In accordance with the Index Committee's governance framework, the Index Committee may, in certain circumstances, exercise discretion in the implementation of float increases after the end of the IPO lock-up period to reduce market impact, support replicability, and promote orderly implementation, taking into account company-specific facts, such as size of the index event and timelines. Any such decision will be communicated in advance where possible.IMPACTED INDICESIndex NameIndex CodeS&P Total Market Index (TMI)SPTMIS&P Completion Index (CI)SPCMIDow Jones U.S. Total Stock Market IndexDWCFPlease note that if a company is included within the above indices, such company may become eligible for derived indices that use the above index as a starting universe. For example, the derived indices include, but are not limited to, size, sector, style, factor, and sustainability indices derived from the impacted indices. Please refer to the individual index methodologies for more information on eligibility and timing.IMPLEMENTATION TIMINGS&P DJI is implementing the above described methodology changes to the S&P Total Market Index (TMI), S&P Completion Index (CI), and Dow Jones U.S. Total Stock Market Index (TSM) effective prior to the market open on Monday, June 8, 2026.For more information about S&P Dow Jones Indices, please visit www.spglobal.com/spdji. ABOUT S&P DOW JONES INDICESS&P Dow Jones Indices is the largest global resource for essential index-based concepts, data and research, and home to iconic financial market indicators, such as the S&P 500® and the Dow Jones Industrial Average®. More assets are invested in products based on our indices than products based on indices from any other provider in the world. Since Charles Dow invented the first index in 1884, S&P DJI has been innovating and developing indices across the spectrum of asset classes helping to define the way investors measure and trade the markets.S&P Dow Jones Indices is a division of S&P Global (NYSE: SPGI), which provides essential intelligence for individuals, companies and governments to make decisions with confidence. For more information, visit www.spglobal.com/spdji.FOR MORE INFORMATION: S&P Dow Jones Indices
index_services@spglobal.com View original content:https://www.prnewswire.com/news-releases/sp-dow-jones-indices-consultation-on-treatment-of-megacap-companies--results-302792104.htmlSOURCE S&P Dow Jones Indices Original: S&P Dow Jones Indices Consultation on Treatment of MegaCap Companies - Results
US Market News
4週前
S&P Global Launches Agentic AI-Powered Credit Memo Builder™ to Streamline Credit AnalysisJune 4, 2026 8:00 AM
PR Newswire (US) New solution significantly reduces credit memo data collection and synthesis time, enabling financial analysts to focus on strategic risk evaluationNEW YORK, June 4, 2026 /PRNewswire/ -- S&P Global (NYSE: SPGI) today announced the launch of Credit Memo Builder™ to enhance and streamline the creation of credit decisioning reports. Credit Memo Builder™ aggregates data sources from across the S&P Global enterprise to significantly shorten the drafting process. This new agentic workflow platform empowers loan committees, underwriters and credit analysts to make well-informed credit decisions quickly and confidently. Credit analysts spend significant time pulling and processing data from disparate systems – a manual, time-intensive process that can hinder timely decisions and increase operational risk. Credit Memo Builder™ directly addresses this challenge, allowing teams to save considerable time and shift their focus from manual data entry to the analytical evaluation of borrower risk and strategic credit assessment."At S&P Global, we constantly look for ways to enhance decision-making for our clients," said Whit McGraw, Head of Risk & Valuations Services at S&P Global Market Intelligence. "With Credit Memo Builder™, our objective is to meaningfully improve what can often be a cumbersome credit workflow—cutting through fragmented data and enabling financial teams to operate with greater speed and consistency. By embedding AI to assist and streamline key steps in the process, we're helping clients surface the right insights faster, while maintaining the rigor and control required for high-quality credit analysis."At the core of Credit Memo Builder™ sits the trusted data, research and analytics from S&P RatingsDirect®, RiskGauge™ and S&P Capital IQ Pro. Built with advanced Cognitive Automation and harnessing Kensho's adaptive data retrieval capabilities, Credit Memo Builder™ seamlessly connects structured and unstructured data for an automated credit output. It synthesizes curated information from internal and external sources—including ratings and macro research, financials, news and transcripts into a cohesive, analyst-ready format. This integration ensures that users have access to reliable, comprehensive data to inform their decisions.A key feature of Credit Memo Builder™ is its intuitive and flexible prompting that facilitates a user friendly and reliable AI-driven way of creating credit memos. The platform maintains human "analyst-in-the-loop" oversight allowing users to flexibly upload additional information and request AI-assisted revisions, designed to support accuracy and assist users in producing outputs aligned with relevant standards. Transparency is built in, with in-line citations linked to exact data sources, and insights into how responses are generated, ensuring every memo is robust and auditable.Credit Memo Builder™ is part of S&P Global Market Intelligence's agentic AI offerings, alongside CreditCompanion™, helping clients bring greater speed, consistency and insight to the credit analysis workflow.Credit Memo Builder™ is an analytical workflow tool and is not a substitute for independent credit analysis or credit ratings issued by S&P Global Ratings.For more information about Credit Memo Builder™, click here.For more information on S&P Global products and solutions, please reach out to our sales team here.About S&P GlobalS&P Global (NYSE: SPGI) enables businesses, governments, and individuals with trusted data, expertise and technology to make decisions with conviction. We are Advancing Essential Intelligence through world-leading benchmarks, data, and insights that customers need in order to plan confidently, act decisively, and thrive in a rapidly changing global landscape.From helping our customers assess new investments across the capital and commodities markets to navigating the energy expansion, acceleration of artificial intelligence, and evolution of public and private markets, we enable the world's leading organizations to unlock opportunities, solve challenges, and plan for tomorrow – today.Learn more at www.spglobal.com.Media ContactsOrla O'Brien
S&P Global
+1 857-407-8559
orla.obrien@spglobal.com Amanda Oey
S&P Global Market Intelligence
+1 212-438-1904
amanda.oey@spglobal.com or press.mi@spglobal.com View original content to download multimedia:https://www.prnewswire.com/news-releases/sp-global-launches-agentic-ai-powered-credit-memo-builder-to-streamline-credit-analysis-302790833.htmlSOURCE S&P Global Original: S&P Global Launches Agentic AI-Powered Credit Memo Builder™ to Streamline Credit Analysis
US Market News
1月前
S&P Global Mobility Opens FeeSync to Entire Automotive Industry at No Cost, Establishing First-of-Its-Kind Dealer Fee Transparency InfrastructureMay 27, 2026 2:00 PM
PR Newswire (US) Industry-wide initiative gives dealers centralized control over fee data and syndication to vendor partners, supporting pricing transparency across every advertising channel NEW YORK, May 27, 2026 /PRNewswire/ -- S&P Global Mobility today announced that it is opening access to FeeSync powered by Market Scan, its automotive payments-as-a-service platform, to the entire automotive industry at no cost. This is one of the most significant industry-wide infrastructure investments in recent memory. The first-of-its-kind platform gives dealers a centralized, secure environment to manage and syndicate their fee structures to vendor and agency partners, independent of any technology partners. For decades, the automotive retail ecosystem has relied on a fragmented network of vendors, agencies, and marketing partners, each maintaining their own copy of dealer fee data — often updated on different cadences, through different channels, and without a single source of truth. The result has been operational complexity for dealers and inconsistency for consumers, particularly as expectations around pricing transparency continue to rise across the industry and among regulators. FeeSync changes that. Through a simple, secure interface, dealers can update their fee structures in one place and grant or revoke access to specific vendor partners as needed. Approved partners can then extract that fee data via API, ensuring that every downstream marketing channel reflects the dealership's most current information. The platform is offered free of charge to dealers and the broader allied industry. "Dealers shouldn't have to chase updates across a dozen vendors every time their fee structure changes, and consumers shouldn't encounter different numbers depending on where they shop. The infrastructure to fix this should exist at the industry level, not at the dealership level — and we're in a unique position to provide it," said Aaron Baldwin, President, Sales Solutions at S&P Global Mobility. "Opening FeeSync to the entire industry at no cost is the right thing to do for our dealer partners, for the allied industry, and ultimately for the consumer. We're proud to serve as a trusted, agnostic third party in making it happen." The launch comes at a moment of heightened industry focus on advertising practices. S&P Global Mobility is committed to supporting dealer operations in this evolving landscape. While FeeSync is an operational tool and not a compliance product, it provides foundational infrastructure that empowers dealers to establish a single source of truth for their fee data. This centralized control is a critical first step for any data governance strategy and helps ensure the fee information being sent to marketing partners is accurate and consistent with the dealer's official records. Dealers remain responsible for ensuring that their advertising and pricing practices comply with all applicable federal, state, and local laws and regulations, including with respect to pricing transparency and vehicle availability. "This is the kind of industry-level thinking we've needed for years. As an investor who makes 10 investments per year, many into dealer-facing technology startups, we work with dozens of marketing and technology partners across the industry, and keeping fee data synchronized across all of them is a constant source of friction and operational risk. A neutral, secure platform that enables the industry to update once and syndicate everywhere is a real operational unlock," said Steve Greenfield from Automotive Ventures. "The fact that S&P Global Mobility is offering this to the entire industry at no cost speaks to the kind of partner they've been to dealers for a long time."FeeSync access will begin with automotiveMastermind® and CARFAX® customers in the coming weeks, with broader industry-wide dealership access to follow. Vendor and agency partners will be invited to integrate with the platform in a phased manner, with dealers retaining full control over which partners can access their data. S&P Global Mobility will serve as the operating steward of the platform, providing the neutrality and security infrastructure that an industry-wide utility of this kind requires. Additional details on access, onboarding timelines, and partner integration will be released in the coming weeks.About S&P Global MobilityS&P Global Mobility is a division of S&P Global (NYSE: SPGI). S&P Global is the world's foremost provider of credit ratings, benchmarks, analytics and workflow solutions in the global capital, commodity, and automotive markets.Media Contacts:
Kara Evanko
Global Head of Communications
S&P Global Mobility
kara.evanko @montgriz-7133 Jennifer Sanford
Vice President of Marketing and Enablement
Jennifer.sanford @AnUpTic-7004 View original content to download multimedia:https://www.prnewswire.com/news-releases/sp-global-mobility-opens-feesync-to-entire-automotive-industry-at-no-cost-establishing-first-of-its-kind-dealer-fee-transparency-infrastructure-302783464.htmlSOURCE S&P Global Mobility Original: S&P Global Mobility Opens FeeSync to Entire Automotive Industry at No Cost, Establishing First-of-Its-Kind Dealer Fee Transparency Infrastructure
US Market News
1月前
Dow Jones Industrial Average® Celebrates 130 Years as Iconic American BenchmarkMay 26, 2026 1:00 PM
PR Newswire (US) Legacy of Excellence: The Dow Jones Industrial Average® (DJIA®) turns 130, cementing its status as a symbol of American business strength, innovation, and resilience.A Global Icon: From humble beginnings with 12 industrial companies in 1896 to a powerhouse of 30 leading blue-chip firms today, The Dow® remains one of the world's most recognized and influential market indicators.Breaking Barriers: Just months after soaring past 50,000 for the first time on February 6, 2026, the DJIA's 130th anniversary highlights its enduring power and relevance in measuring global markets.NEW YORK, May 26, 2026 /PRNewswire/ -- S&P Dow Jones Indices today celebrates the 130th anniversary of the Dow Jones Industrial Average, one of the world's most recognized stock market indices and one of the most enduring measures of American markets strength. Since its launch on May 26, 1896, the DJIA, also known as The Dow® and US 30™, has evolved alongside the U.S. economy, from an index of 12 industrial companies to a benchmark of 30 leading corporations across sectors including technology, healthcare, financials, energy and consumer discretionary."The Dow is iconic because it represents far more than the stock market - it reflects the strength, resilience, and ingenuity of American business," said Cathy Clay, CEO, S&P Dow Jones Indices. "For 130 years, it has served as a trusted barometer of markets leadership and an enduring symbol of progress for investors around the world. As the world's leading index provider, S&P Dow Jones Indices is honored to be the steward of this historic benchmark, committed to upholding trust, transparency, and innovation in global markets for generations to come."The 130-year milestone comes just months after the DJIA closed above 50,000 for the first time, reinforcing its enduring relevance across generations of investors. Key milestones in the Dow's history include:1896: Launched with an initial value of 40.94 points1972: Crossed 1,000 for the first time1999: Surpassed 10,000 during the technology boom2017: Broke through 20,0002024: Reached historic highs above 40,0002026: Closed above 50,000S&P Dow Jones Indices will celebrate the milestone with global events throughout 2026. Read more about the evolution of The Dow® over 130 years in our latest Index Education blog here.ABOUT S&P DOW JONES INDICESS&P Dow Jones Indices is the largest global resource for essential index-based concepts, data and research, and home to iconic financial market indicators, such as the S&P 500® and the Dow Jones Industrial Average®. More assets are invested in products based on our indices than products based on indices from any other provider in the world. Since Charles Dow invented the first index in 1884, S&P DJI has been innovating and developing indices across the spectrum of asset classes helping to define the way investors measure and trade the markets.S&P Dow Jones Indices is a division of S&P Global (NYSE: SPGI), which provides essential intelligence for individuals, companies, and governments to make decisions with confidence. For more information, visit: www.spglobal.com/spdji.FOR MORE INFORMATION:Silke Mcguinness
Global Head of Communications
(+1) 415 205 8414
silke.mcguinness@spglobal.comLemuel Brewster
Americas Communications
(+1) 917-805-1089
lemuel.brewster@spglobal.com View original content to download multimedia:https://www.prnewswire.com/news-releases/dow-jones-industrial-average-celebrates-130-years-as-iconic-american-benchmark-302782088.htmlSOURCE S&P Dow Jones Indices Original: Dow Jones Industrial Average® Celebrates 130 Years as Iconic American Benchmark
US Market News
1月前
S&P Global Announces Leadership Change for Market Intelligence, Evolution of Enterprise Data, Technology & TransformationMay 26, 2026 8:47 AM
PR Newswire (US) Saugata Saha to depart the Company July 30, 2026Enterprise Data, Technology & Transformation Organizations Combine to Unlock Greater Value and InnovationNEW YORK, May 26, 2026 /PRNewswire/ -- S&P Global (NYSE: SPGI) announced today that Saugata Saha, President of S&P Global Market Intelligence and Chief Enterprise Data Officer, has decided to leave the company to pursue another opportunity. Mr. Saha will remain with S&P Global through July 30, 2026, to support transition. "Saugata is a respected leader and a valued member of our Executive Leadership Team. He leaves Market Intelligence and our Enterprise Data Organization in a position of strength, with clear momentum, and a solid foundation to build upon. I wish him continued success ahead," said Martina Cheung, President and Chief Executive Officer of S&P Global. "We expect to move quickly, and thoughtfully, as we evaluate and refine the leadership and structure for Market Intelligence."The Enterprise Data Organization (EDO) will move to become part of the Chief Technology & Transformation Office, led by Firdaus Bhathena, S&P Global Chief Technology & Transformation Officer."We are excited to unify the Company's data and technology capabilities under Firdaus," added Cheung. "This will accelerate the integration of AI across our products, enhance efficiency and productivity, and drive innovation and greater value for customers."The company reiterates its financial guidance for 2026.About S&P GlobalS&P Global (NYSE: SPGI) enables businesses, governments, and individuals with trusted data, expertise and technology to make decisions with conviction. We are Advancing Essential Intelligence through world-leading benchmarks, data, and insights that customers need in order to plan confidently, act decisively, and thrive in a rapidly changing global landscape.From helping our customers assess new investments across the capital and commodities markets to navigating the energy expansion, acceleration of artificial intelligence, and evolution of public and private markets, we enable the world's leading organizations to unlock opportunities, solve challenges, and plan for tomorrow – today.Forward-Looking StatementsThis press release contains "forward-looking statements," as defined in the Private Securities Litigation Reform Act of 1995. These statements, which express management's current views concerning future events, trends, contingencies or results, appear at various places in this press release and use words like "anticipate," "assume," "believe," "continue," "estimate," "expect," "forecast," "future," "intend," "plan," "potential," "predict," "project," "strategy," "target" and similar terms, and future or conditional tense verbs like "could," "may," "might," "should," "will" and "would." For example, management may use forward-looking statements when addressing topics such as: the outcome of contingencies; future actions by regulators; changes in the business strategies and methods of generating revenue of S&P Global Inc. (the "Company"); the development and performance of the Company's services and products; the expected impact of acquisitions and dispositions; the Company's effective tax rates; the Company's cost structure, dividend policy, cash flows or liquidity; and the anticipated separation of S&P Global Mobility ("Mobility") into a standalone public company.Forward-looking statements are subject to inherent risks and uncertainties. Factors that could cause actual results to differ materially from those expressed or implied in forward-looking statements include, among other things:worldwide economic, financial, political, and regulatory conditions (including slower GDP growth or recession, restrictions on trade (e.g., tariffs), instability in the banking sector and inflation), and factors that contribute to uncertainty and volatility (e.g., supply chain risk), geopolitical uncertainty (including military conflict), natural and man-made disasters, civil unrest, public health crises (e.g., pandemics), and conditions that result from legislative, regulatory, trade and policy changes, including from the U.S. administration;the volatility and health of debt, equity, commodities, energy and automotive markets, including credit quality and spreads, the composition and mix of credit maturity profiles, the level of liquidity and future debt issuances, equity flows from active to passive, fluctuations in average asset prices in global equities, demand for investment products that track indices and assessments and trading volumes of certain exchange traded derivatives;the demand and market for credit ratings in and across the sectors and geographies where the Company operates;the Company's ability to maintain adequate physical, technical and administrative safeguards to protect the security of confidential information and data, or protect against a system or network disruption that results in regulatory penalties and remedial costs or improper disclosure of confidential information or data;the outcome of litigation, government and regulatory proceedings, investigations and inquiries;concerns in the marketplace affecting the Company's credibility or otherwise affecting market perceptions of the integrity or utility of independent credit ratings, benchmarks, indices and other services;the level of merger and acquisition activity in the United States and abroad;the level of the Company's future cash flows and capital investments;the effect of competitive products (including those incorporating artificial intelligence ("AI")) and pricing, including the level of success of new product developments and global expansion;the impact of customer cost-cutting pressures;a decline in the demand for our products and services by our customers and other market participants;our ability to develop new products or technologies, to integrate our products with new technologies (e.g., AI), or to compete with new products or technologies offered by new or existing competitors;the introduction of competing products (including those developed by AI) or technologies by other companies;our ability to protect our intellectual property from unauthorized use and infringement, including by others using AI technologies, and to operate our business without violating third-party intellectual property rights, including through our own use of AI in our products and services;our ability to attract, incentivize and retain key employees, especially in a competitive business environment;our ability to successfully navigate key organizational changes;the continuously evolving regulatory environment in Europe, the United States and elsewhere around the globe affecting each of our businesses and the products they offer, and our compliance therewith;the Company's exposure to potential criminal sanctions or civil penalties for noncompliance with foreign and U.S. laws and regulations that are applicable in the jurisdictions in which it operates, including sanctions laws relating to countries such as Iran, Russia and Venezuela, anti-corruption laws such as the U.S. Foreign Corrupt Practices Act and the U.K. Bribery Act of 2010, and local laws prohibiting corrupt payments to government officials, as well as import and export restrictions;the Company's ability to make acquisitions and dispositions and successfully integrate the businesses we acquire;consolidation of the Company's customers, suppliers or competitors;the ability of the Company, and its third-party service providers, to maintain adequate physical and technological infrastructure;the Company's ability to successfully recover from a disaster or other business continuity problem, such as an earthquake, hurricane, flood, civil unrest, protests, military conflict, terrorist attack, outbreak of pandemic or contagious diseases, security breach, cyber attack, data breach, power loss, telecommunications failure or other natural or man-made event;the impact on the Company's revenue and net income caused by fluctuations in foreign currency exchange rates;the impact of changes in applicable tax or accounting requirements on the Company;the separation of Mobility not being consummated within the anticipated time period or at all;the ability of the separation of Mobility to qualify for tax-free treatment for U.S. federal income tax purposes;any disruption to the Company's business in connection with the proposed separation of Mobility;any loss of synergies from separating the businesses of Mobility and the Company that adversely impact the results of operations of both businesses, or the companies resulting from the separation of Mobility not realizing all of the expected benefits of the separation; andfollowing the separation of Mobility, the combined value of the common stock of the two publicly-traded companies not being equal to or greater than the value of the Company's common stock had the separation not occurred.The factors noted above are not exhaustive. The Company and its subsidiaries operate in a dynamic business environment in which new risks emerge frequently. Accordingly, the Company cautions readers not to place undue reliance on any forward-looking statements, which speak only as of the dates on which they are made. The Company undertakes no obligation to update or revise any forward-looking statement to reflect events or circumstances arising after the date on which it is made, except as required by applicable law. Further information about the Company's businesses, including information about factors that could materially affect its results of operations and financial condition, is contained in the Company's filings with the SEC, including Item 1A, Risk Factors in our most recently filed Annual Report on Form 10-K.Contacts:Investor Relations:
Mark Grant
Senior Vice President, Investor Relations and Treasurer
Tel: +1 (347) 640-1521
mark.grant@spglobal.comMedia:
Christina Twomey
Chief Communications Officer
Tel: +1 (646) 407-3001
christina.twomey@spglobal.com View original content to download multimedia:https://www.prnewswire.com/news-releases/sp-global-announces-leadership-change-for-market-intelligence-evolution-of-enterprise-data-technology--transformation-302781825.htmlSOURCE S&P Global Original: S&P Global Announces Leadership Change for Market Intelligence, Evolution of Enterprise Data, Technology & Transformation
US Market News
1月前
Jaguar Land Rover Schaumburg Earns Its First CarFax Top-Rated Dealer Award for 2025May 21, 2026 10:37 AM
PR Newswire (US) CARFAX has named Jaguar Land Rover Schaumburg a 2025 CARFAX Top-Rated Dealer. Also known as the Golden CARFOX, the award honors dealerships across the nation for their exceptional service based on verified customer ratings and reviews. SCHAUMBURG, Ill., May 21, 2026 /PRNewswire/ -- Jaguar Land Rover Schaumburg is proud to announce that it has earned the 2025 CARFAX Top-Dealer award, receiving the coveted Golden CARFOX trophy for the first time. "We're proud to receive the Golden CARFOX Award, which reflects our strong partnership with CARFAX and our shared commitment to transparency and trust. This recognition is a testament not only to our team here at Jaguar Land Rover Schaumburg, but to the dedication and values upheld across the entire Zeigler Auto Group," said John Nelson, GM of Jaguar Land Rover Schaumburg.The prestigious recognition is based on reviews and ratings from verified customers on the CARFAX website. Jaguar Land Rover Schaumburg currently holds an impressive 4.4 rating from 119 verified reviews highlighting its outstanding customer experience across sales, finance, and service. The luxury Zeigler dealer has also been favorited as a top service shop 2,271 times on the review platform."We're excited to celebrate dealers who truly raise the bar for their customers," said Gregg Cleary, Chief Revenue Officer at CARFAX. "Powered by more than 10.6 million verified ratings and reviews, this recognition reflects real customer experiences and highlights dealerships built on trust and transparency. Our goal is to support consumers through their car journey, and a big part of that is connecting them with the most trusted dealers in the country."About CARFAX
CARFAX, part of S&P Global Mobility, helps millions of people every day confidently shop, buy, service and sell cars with innovative solutions powered by CARFAX® vehicle history information. The expert in vehicle history since 1984, CARFAX provides CARFAX Car Listings, CARFAX Car Care, and the flagship CARFAX Vehicle History Report to consumers and the automotive industry. CARFAX owns the world's largest vehicle history database and is nationally recognized as a top workplace by The Washington Post. Shop, Buy, Service, Sell – Show me the CARFAX®.S&P Global Mobility is a division of S&P Global (NYSE: SPGI). S&P Global is the world's foremost provider of credit ratings, benchmarks, analytics, and workflow solutions in the global capital, commodity, and automotive markets.About Zeigler Auto Group
Zeigler Automotive Group is one of the largest privately-owned dealer groups in the U.S. with 88 franchises across 41 locations in Wisconsin, Illinois, Indiana, and Michigan. Vehicle brands represented include all of the domestic and the majority of the imported manufacturers.Besides its extensive automotive portfolio, the organization owns and operates Zeigler Motorsports, an 85,000-square-foot motorsports dealership and action park, offering 19 different powersports brands, plus its own onsite restaurant: Trak Houz Bar & Grill. Additionally, Zeigler Motorsports houses the Elevate Leadership & Team Building Academy, an executive training company.The Kalamazoo-based dealer group also owns and operates Zeigler Pre-Owned of Chicago, three Byrider franchises, three finance companies, several insurance firms, and a leasing firm.
Founded in 1975, the organization employs over 2,500 people, ranking among the top 1% of automotive dealers in the nation with estimated annual sales of $2.2 billion for 2025.The family-owned and operated company is well known for its commitment to both customer service and employee satisfaction. Zeigler is regularly recognized as one of the Best and Brightest Companies to Work for in the Nation, also earning similar accolades in Wisconsin, Chicago, and Michigan. Besides these prestigious accolades, Zeigler is also one of Glassdoor's 100 Best Places to Work in the U.S. for 2024, and among Glassdoor's top 10 U.S. companies for work-life balance. View original content to download multimedia:https://www.prnewswire.com/news-releases/jaguar-land-rover-schaumburg-earns-its-first-carfax-top-rated-dealer-award-for-2025-302779122.htmlSOURCE Zeigler Automotive Group Original: Jaguar Land Rover Schaumburg Earns Its First CarFax Top-Rated Dealer Award for 2025
US Market News
1月前
S&P Global Announces Approval of Separation of Mobility GlobalMay 21, 2026 7:12 AM
PR Newswire (US) NEW YORK, May 21, 2026 /PRNewswire/ -- S&P Global Inc. (NYSE: SPGI) ("S&P Global") today announced that its Board of Directors (the "Board") has approved the previously announced separation of its Mobility division, and the creation of an independent, public company, Mobility Global Inc. ("Mobility Global"). The separation will be achieved through a pro rata distribution of 100% of the outstanding shares of Mobility Global common stock to the holders of S&P Global common stock. S&P Global shareholders will receive one share of Mobility Global common stock for every share of S&P Global common stock held at the close of business on the record date of June 15, 2026 (the "record date"). The distribution of Mobility Global shares is expected to be effective at 12:01 a.m. New York City time on July 1, 2026.The holders of S&P Global common stock entitled to receive the distribution will receive a book-entry account statement or a credit to their brokerage account reflecting their ownership of Mobility Global common stock. No action is required by S&P Global shareholders to receive Mobility Global shares in the distribution.Fractional shares of Mobility Global common stock will not be distributed. Any fractional share of Mobility Global common stock otherwise issuable to a holder of S&P Global common stock will be sold in the open market on such shareholder's behalf, and such shareholder will receive a cash payment for the fractional share based on its pro rata portion of the net cash proceeds from all sales of fractional shares.Prior to the distribution, S&P Global expects to deliver an information statement to all shareholders entitled to receive the distribution. The information statement will describe Mobility Global, including the risks of owning Mobility Global common stock and other details regarding the separation.The completion of the distribution is subject to a number of customary conditions, including that Mobility Global's registration statement on Form 10 shall have been declared effective by the Securities and Exchange Commission and that no determination will have been made by the Board that it is inadvisable to proceed with the distribution.S&P Global expects that a "when-issued" public trading market for Mobility Global common stock will commence on or about June 26, 2026 under the symbol "MBGL WI," and will continue through June 30, 2026. S&P Global also anticipates that "regular-way" trading of Mobility Global common stock will begin on July 1, 2026.Beginning on or about June 26, 2026, and through June 30, 2026, it is expected that there will be two ways to trade S&P Global common stock – either with or without the distribution of Mobility Global common stock. S&P Global shareholders who sell their shares of S&P Global common stock in the "regular-way" market (that is, the normal trading market under the symbol "SPGI") after June 26, 2026 and on or prior to June 30, 2026 will be selling their right to receive shares of Mobility Global common stock in connection with the separation. Alternatively, S&P Global shareholders who sell their shares of S&P Global common stock in the "ex-distribution" market during the same period under the symbol "SPGI WI" will not be selling their right to receive shares of Mobility Global common stock in connection with the separation. Investors are encouraged to consult with their financial advisors regarding the specific implications of buying or selling shares of S&P Global common stock on or before June 30, 2026.Following the distribution, Mobility Global will be an independent, public company. Mobility Global expects to receive authorization to list its common stock on the New York Stock Exchange under the ticker symbol "MBGL".Goldman Sachs & Co. LLC and Morgan Stanley & Co. LLC are serving as financial advisors and Davis Polk & Wardwell LLP is serving as legal counsel to S&P Global.About S&P GlobalS&P Global (NYSE: SPGI) enables businesses, governments, and individuals with trusted data, expertise and technology to make decisions with conviction. We are Advancing Essential Intelligence through world-leading benchmarks, data, and insights that customers need in order to plan confidently, act decisively, and thrive in a rapidly changing global landscape.From helping our customers assess new investments across the capital and commodities markets to navigating the energy expansion, acceleration of artificial intelligence, and evolution of public and private markets, we enable the world's leading organizations to unlock opportunities, solve challenges, and plan for tomorrow – today. Learn more at www.spglobal.com. Investor Relations: https://investor.spglobal.com About Mobility Global Mobility Global is the world's standard for mobility intelligence, providing critical data and analytics across the full vehicle lifecycle. Its portfolio of trusted brands and products includes CARFAX, automotiveMastermind, Polk Automotive Solutions, and Market Scan, supporting the world's major automakers, suppliers, dealer groups, media, financial institutions, and consumers with data, forecast, insights, technology, and innovation. Additional information about the planned separation is available at https://investor.spglobal.com.Contacts:S&P Global Investor Relations:
Mark Grant
Senior Vice President, Investor Relations and Treasurer
Tel: +1 (347) 640-1521
mark.grant@spglobal.com Media:
Christina Twomey
Chief Communications Officer, S&P Global
Tel: +1 (646) 407-3001
christina.twomey@spglobal.comMobility Global Investor Relations:
Tejal Engman
Managing Director, Investor Relations
ir@mobilityglobal.comMedia:
mobilitycomms@spglobal.comForward-Looking StatementsThis press release contains "forward-looking statements," as defined in the Private Securities Litigation Reform Act of 1995. These statements, which express management's current views concerning future events, trends, contingencies or results, appear at various places in this press release and use words like "anticipate," "assume," "believe," "continue," "estimate," "expect," "forecast," "future," "intend," "plan," "potential," "predict," "project," "strategy," "target" and similar terms, and future or conditional tense verbs like "could," "may," "might," "should," "will" and "would." For example, management may use forward-looking statements when addressing topics such as: the outcome of contingencies; future actions by regulators; changes in the business strategies and methods of generating revenue of S&P Global Inc. (the "Company"); the development and performance of the Company's services and products; the expected impact of acquisitions and dispositions; the Company's effective tax rates; the Company's cost structure, dividend policy, cash flows or liquidity; and the anticipated separation of S&P Global Mobility ("Mobility") into a standalone public company.Forward-looking statements are subject to inherent risks and uncertainties. Factors that could cause actual results to differ materially from those expressed or implied in forward-looking statements include, among other things:worldwide economic, financial, political, and regulatory conditions (including slower GDP growth or recession, restrictions on trade (e.g., tariffs), instability in the banking sector and inflation), and factors that contribute to uncertainty and volatility (e.g., supply chain risk), geopolitical uncertainty (including military conflict), natural and man-made disasters, civil unrest, public health crises (e.g., pandemics), and conditions that result from legislative, regulatory, trade and policy changes, including from the U.S. administration;the volatility and health of debt, equity, commodities, energy and automotive markets, including credit quality and spreads, the composition and mix of credit maturity profiles, the level of liquidity and future debt issuances, equity flows from active to passive, fluctuations in average asset prices in global equities, demand for investment products that track indices and assessments and trading volumes of certain exchange traded derivatives;the demand and market for credit ratings in and across the sectors and geographies where the Company operates;the Company's ability to maintain adequate physical, technical and administrative safeguards to protect the security of confidential information and data, or protect against a system or network disruption that results in regulatory penalties and remedial costs or improper disclosure of confidential information or data;the outcome of litigation, government and regulatory proceedings, investigations and inquiries;concerns in the marketplace affecting the Company's credibility or otherwise affecting market perceptions of the integrity or utility of independent credit ratings, benchmarks, indices and other services;the level of merger and acquisition activity in the United States and abroad;the level of the Company's future cash flows and capital investments;the effect of competitive products (including those incorporating artificial intelligence ("AI")) and pricing, including the level of success of new product developments and global expansion;the impact of customer cost-cutting pressures;a decline in the demand for our products and services by our customers and other market participants;our ability to develop new products or technologies, to integrate our products with new technologies (e.g., AI), or to compete with new products or technologies offered by new or existing competitors;the introduction of competing products (including those developed by AI) or technologies by other companies;our ability to protect our intellectual property from unauthorized use and infringement, including by others using AI technologies, and to operate our business without violating third-party intellectual property rights, including through our own use of AI in our products and services;our ability to attract, incentivize and retain key employees, especially in a competitive business environment;our ability to successfully navigate key organizational changes;the continuously evolving regulatory environment in Europe, the United States and elsewhere around the globe affecting each of our businesses and the products they offer, and our compliance therewith;the Company's exposure to potential criminal sanctions or civil penalties for noncompliance with foreign and U.S. laws and regulations that are applicable in the jurisdictions in which it operates, including sanctions laws relating to countries such as Iran, Russia and Venezuela, anti-corruption laws such as the U.S. Foreign Corrupt Practices Act and the U.K. Bribery Act of 2010, and local laws prohibiting corrupt payments to government officials, as well as import and export restrictions;the Company's ability to make acquisitions and dispositions and successfully integrate the businesses we acquire;consolidation of the Company's customers, suppliers or competitors;the ability of the Company, and its third-party service providers, to maintain adequate physical and technological infrastructure;the Company's ability to successfully recover from a disaster or other business continuity problem, such as an earthquake, hurricane, flood, civil unrest, protests, military conflict, terrorist attack, outbreak of pandemic or contagious diseases, security breach, cyber attack, data breach, power loss, telecommunications failure or other natural or man-made event;the impact on the Company's revenue and net income caused by fluctuations in foreign currency exchange rates;the impact of changes in applicable tax or accounting requirements on the Company;the separation of Mobility not being consummated within the anticipated time period or at all;the ability of the separation of Mobility to qualify for tax-free treatment for U.S. federal income tax purposes;any disruption to the Company's business in connection with the proposed separation of Mobility;any loss of synergies from separating the businesses of Mobility and the Company that adversely impact the results of operations of both businesses, or the companies resulting from the separation of Mobility not realizing all of the expected benefits of the separation; andfollowing the separation of Mobility, the combined value of the common stock of the two publicly-traded companies not being equal to or greater than the value of the Company's common stock had the separation not occurred.The factors noted above are not exhaustive. The Company and its subsidiaries operate in a dynamic business environment in which new risks emerge frequently. Accordingly, the Company cautions readers not to place undue reliance on any forward-looking statements, which speak only as of the dates on which they are made. The Company undertakes no obligation to update or revise any forward-looking statement to reflect events or circumstances arising after the date on which it is made, except as required by applicable law. Further information about the Company's businesses, including information about factors that could materially affect its results of operations and financial condition, is contained in the Company's filings with the SEC, including Item 1A, Risk Factors in our most recently filed Annual Report on Form 10-K. View original content to download multimedia:https://www.prnewswire.com/news-releases/sp-global-announces-approval-of-separation-of-mobility-global-302778885.htmlSOURCE S&P Global Original: S&P Global Announces Approval of Separation of Mobility Global
US Market News
1月前
S&P Global Announces Pricing of $2,000,000,000 Private Offering of Senior Notes by Mobility Global Inc. Ahead of Planned SeparationMay 19, 2026 5:33 PM
PR Newswire (US) NEW YORK, May 19, 2026 /PRNewswire/ -- S&P Global Inc. ("S&P Global") (NYSE:SPGI), today announced the pricing of a private offering of $650,000,000 aggregate principal amount of 5.050% senior notes due 2029 (the "2029 Notes"), $650,000,000 aggregate principal amount of 5.450% senior notes due 2031 (the "2031 Notes") and $700,000,000 aggregate principal amount of 6.050% senior notes due 2036 (the "2036 Notes" and, together with the 2029 Notes and the 2031 Notes, the "Notes") by Mobility Global Inc. ("Mobility Global" or the "Issuer"). The Issuer is a recently formed holding company for S&P Global's Mobility division, which S&P Global intends to separate from its current business by means of a spin-off to its shareholders. The offering is expected to close on May 29, 2026, subject to customary closing conditions. The Issuer has also entered into a $500 million senior unsecured revolving credit facility. Upon completion of the separation, the Issuer intends to use the net proceeds of the offering, after deducting discounts and commissions to the initial purchasers, to finance a cash payment to S&P Global as consideration for the transfer of certain assets, liabilities and entities to the Issuer, and the Issuer will use any remaining proceeds to fund estimated fees and expenses and for general corporate purposes. Net proceeds of the offering will be deposited into escrow for the benefit of the holders of the Notes pending satisfaction of certain conditions related to the completion of the separation.The Notes have been offered for sale to persons reasonably believed to be qualified institutional buyers in an offering exempt from registration pursuant to Rule 144A under the U.S. Securities Act of 1933, as amended (the "Securities Act"), and to persons outside the United States in compliance with Regulation S under the Securities Act.The Notes have not been registered under the Securities Act, or any state securities laws, and unless so registered, may not be offered or sold in the United States except pursuant to an exemption from, or in a transaction not subject to, the registration requirements of the Securities Act and applicable state securities laws. This press release does not constitute an offer to sell or the solicitation of an offer to buy any security and shall not constitute an offer, solicitation or sale in any jurisdiction in which such offering, solicitation or sale would be unlawful. This press release is being issued pursuant to and in accordance with Rule 135c under the Securities Act.The Notes will be entitled to the benefits of a registration rights agreement pursuant to which the Issuer will agree to use commercially reasonable efforts to file a registration statement to exchange the Notes for new notes registered under the Securities Act, or under certain circumstances, to file a shelf registration statement with respect to the resale of the Notes.About Mobility GlobalMobility Global is the world's standard for mobility intelligence, providing critical data and analytics across the full vehicle lifecycle. Its portfolio of trusted brands and products includes CARFAX, automotiveMastermind, Polk Automotive Solutions, and Market Scan, supporting the world's major automakers, suppliers, dealer groups, media, financial institutions, and consumers with data, forecast, insights, technology, and innovation.About S&P GlobalS&P Global (NYSE: SPGI) enables businesses, governments, and individuals with trusted data, expertise and technology to make decisions with conviction. We are Advancing Essential Intelligence through world-leading benchmarks, data, and insights that customers need in order to plan confidently, act decisively, and thrive in a rapidly changing global landscape.From helping our customers assess new investments across the capital and commodities markets to navigating the energy expansion, acceleration of artificial intelligence, and evolution of public and private markets, we enable the world's leading organizations to unlock opportunities, solve challenges, and plan for tomorrow – today.Forward-Looking StatementsThis press release contains "forward-looking statements," as defined in the Private Securities Litigation Reform Act of 1995. These statements, which express management's current views concerning future events, trends, contingencies or results, appear at various places in this press release and use words like "anticipate," "assume," "believe," "continue," "estimate," "expect," "forecast," "future," "intend," "plan," "potential," "predict," "project," "strategy," "target" and similar terms, and future or conditional tense verbs like "could," "may," "might," "should," "will" and "would." For example, management may use forward-looking statements when addressing topics such as: the outcome of contingencies; future actions by regulators; changes in the business strategies and methods of generating revenue of S&P Global Inc. (the "Company"); the development and performance of the Company's services and products; the expected impact of acquisitions and dispositions; the Company's effective tax rates; the Company's cost structure, dividend policy, cash flows or liquidity; and the anticipated separation of S&P Global Mobility ("Mobility") into a standalone public company.Forward-looking statements are subject to inherent risks and uncertainties. Factors that could cause actual results to differ materially from those expressed or implied in forward-looking statements include, among other things:worldwide economic, financial, political, and regulatory conditions (including slower GDP growth or recession, restrictions on trade (e.g., tariffs), instability in the banking sector and inflation), and factors that contribute to uncertainty and volatility (e.g., supply chain risk), geopolitical uncertainty (including military conflict), natural and man-made disasters, civil unrest, public health crises (e.g., pandemics), and conditions that result from legislative, regulatory, trade and policy changes, including from the U.S. administration;the volatility and health of debt, equity, commodities, energy and automotive markets, including credit quality and spreads, the composition and mix of credit maturity profiles, the level of liquidity and future debt issuances, equity flows from active to passive, fluctuations in average asset prices in global equities, demand for investment products that track indices and assessments and trading volumes of certain exchange traded derivatives;the demand and market for credit ratings in and across the sectors and geographies where the Company operates;the Company's ability to maintain adequate physical, technical and administrative safeguards to protect the security of confidential information and data, or protect against a system or network disruption that results in regulatory penalties and remedial costs or improper disclosure of confidential information or data;the outcome of litigation, government and regulatory proceedings, investigations and inquiries;concerns in the marketplace affecting the Company's credibility or otherwise affecting market perceptions of the integrity or utility of independent credit ratings, benchmarks, indices and other services;the level of merger and acquisition activity in the United States and abroad;the level of the Company's future cash flows and capital investments;the effect of competitive products (including those incorporating artificial intelligence ("AI")) and pricing, including the level of success of new product developments and global expansion;the impact of customer cost-cutting pressures;a decline in the demand for our products and services by our customers and other market participants;our ability to develop new products or technologies, to integrate our products with new technologies (e.g., AI), or to compete with new products or technologies offered by new or existing competitors;the introduction of competing products (including those developed by AI) or technologies by other companies;our ability to protect our intellectual property from unauthorized use and infringement, including by others using AI technologies, and to operate our business without violating third-party intellectual property rights, including through our own use of AI in our products and services;our ability to attract, incentivize and retain key employees, especially in a competitive business environment;our ability to successfully navigate key organizational changes;the continuously evolving regulatory environment in Europe, the United States and elsewhere around the globe affecting each of our businesses and the products they offer, and our compliance therewith;the Company's exposure to potential criminal sanctions or civil penalties for noncompliance with foreign and U.S. laws and regulations that are applicable in the jurisdictions in which it operates, including sanctions laws relating to countries such as Iran, Russia and Venezuela, anti-corruption laws such as the U.S. Foreign Corrupt Practices Act and the U.K. Bribery Act of 2010, and local laws prohibiting corrupt payments to government officials, as well as import and export restrictions;the Company's ability to make acquisitions and dispositions and successfully integrate the businesses we acquire;consolidation of the Company's customers, suppliers or competitors;the ability of the Company, and its third-party service providers, to maintain adequate physical and technological infrastructure;the Company's ability to successfully recover from a disaster or other business continuity problem, such as an earthquake, hurricane, flood, civil unrest, protests, military conflict, terrorist attack, outbreak of pandemic or contagious diseases, security breach, cyber attack, data breach, power loss, telecommunications failure or other natural or man-made event;the impact on the Company's revenue and net income caused by fluctuations in foreign currency exchange rates;the impact of changes in applicable tax or accounting requirements on the Company;the separation of Mobility not being consummated within the anticipated time period or at all;the ability of the separation of Mobility to qualify for tax-free treatment for U.S. federal income tax purposes;any disruption to the Company's business in connection with the proposed separation of Mobility;any loss of synergies from separating the businesses of Mobility and the Company that adversely impact the results of operations of both businesses, or the companies resulting from the separation of Mobility not realizing all of the expected benefits of the separation; andfollowing the separation of Mobility, the combined value of the common stock of the two publicly-traded companies not being equal to or greater than the value of the Company's common stock had the separation not occurred.The factors noted above are not exhaustive. The Company and its subsidiaries operate in a dynamic business environment in which new risks emerge frequently. Accordingly, the Company cautions readers not to place undue reliance on any forward-looking statements, which speak only as of the dates on which they are made. The Company undertakes no obligation to update or revise any forward-looking statement to reflect events or circumstances arising after the date on which it is made, except as required by applicable law. Further information about the Company's businesses, including information about factors that could materially affect its results of operations and financial condition, is contained in the Company's filings with the SEC, including Item 1A, Risk Factors in our most recently filed Annual Report on Form 10-K.Contacts:S&P Global Investor Relations:
Mark Grant
Senior Vice President, Investor Relations and Treasurer
Tel: +1 (347) 640-1521
mark.grant@spglobal.comMedia:
Christina Twomey
Chief Communications Officer, S&P Global
Tel: +1 (646) 407-3001
christina.twomey@spglobal.comMobility Global Investor Relations:
Tejal Engman
Managing Director, Investor Relations
ir@mobilityglobal.comMedia:
mobilitycomms@spglobal.com View original content to download multimedia:https://www.prnewswire.com/news-releases/sp-global-announces-pricing-of-2-000-000-000-private-offering-of-senior-notes-by-mobility-global-inc-ahead-of-planned-separation-302776849.htmlSOURCE S&P Global Original: S&P Global Announces Pricing of $2,000,000,000 Private Offering of Senior Notes by Mobility Global Inc. Ahead of Planned Separation
US Market News
2月前
33rd Middle East Petroleum & Gas Conference (MPGC) on June 2-3 to Convene Global Leaders Amid Historic Supply ShockMay 19, 2026 7:00 AM
PR Newswire (US) Themed "Clarity for a Volatile Oil & Gas World," MPGC 2026 is critical nexus for actionable intelligenceLONDON and SINGAPORE , May 19, 2026 /PRNewswire/ -- The 33rd annual Middle East Petroleum & Gas Conference (MPGC) will take place in London on June 2–3, 2026, convening senior decision-makers from energy and finance as the closure of the Strait of Hormuz—the largest supply disruption in the history of oil markets—continues, confronting the global oil and natural gas community with profound uncertainty, market volatility and rapid reshaping of trade. With its "Clarity for a Volatile Oil & Gas World" theme, the event is set to address the industry's most urgent questions: how to respond now, how to restore resilience, and how to prepare for what comes next."The rules of global energy trade are being rewritten in real time—reshaping cargo routes, trade flows, and supply chains," said Dave Ernsberger, President of S&P Global Energy. "In this environment, leaders need ever-evolving wisdom to navigate successfully. The Middle East Petroleum & Gas Conference is a must-attend event, bringing together fresh market intelligence, insight, and decision-makers at a critical moment of necessitated industry adaptation." MPGC 2026 offers an in-person opportunity for leaders who want direct engagement and immediate access to the decision-makers actively navigating the markets. It features a range of energy and trading ecosystem perspectives from senior decision-makers from national oil companies, international oil companies, trading houses, refiners, and financial institutions.Daniel Yergin, Vice Chairman of S&P Global and renowned author of The New Map, The Quest and The Prize, will offer his views of "What Comes Next for Oil and Gas — 5 Signals to Watch."Sessions across the two-day program will explore a range of challenges, such as:How the global energy system is being reshaped by the Hormuz closureWhere Middle East molecules flow now — Europe, Africa, or AsiaWhat the new realities are for freight risk, logistics, and supply-chain resilienceHow downstream competitiveness can be maintained amid severe supply constraintsAmong the senior leaders who will offer perspectives on traversing the challenges:Musaab Al Mulla, VP Market Analysis, AramcoShaikh Khaled Ahmad Al-Sabah, MD International Marketing, Kuwait Petroleum CorporationDavid Bird, CEO, Dangote Petroleum RefineryScott Nelson, President & Head of Trading, Reliance InternationalTom Baker, Managing Director, Vitol BahrainToril Bosoni, Head of Oil Industry & Markets Division, IEAJohn Roper, CEO Middle East, Uniper Global CommoditiesAccess the website for the most up to date information on speakers, the agenda and flexible attendance registration options.MPGC typically attracts participants from the Middle East, Asia, Africa, Europe, and the Americas, including leading traders, oil and gas majors, refiners, professional consultants, digital technologists, banks, exchanges, legal firms, regulators, renewable energy players, and supply and service companies, and more.The Middle East Petroleum & Gas Conference is the longest-running and most prestigious annual gathering for the Middle East oil and gas industry. For more than three decades, it has brought together the supply chain and financial community to share actionable intelligence on market shifts, commercial opportunities, and the geopolitical risks shaping global energy flows.Media ContactsKathleen Tanzy?+ 1 917-331-4607, kathleen.tanzy @weeble-6241, melissa.tan@spglobal.comAbout S&P Global EnergyAt S&P Global Energy, our comprehensive view of global energy and commodities markets enables our customers to make superior decisions and create long-term, sustainable value. Our four core capabilities are: Platts for pricing and news; CERA for research and advisory; Horizons for energy expansion and sustainability solutions; and Events for industry collaboration.S&P Global Energy is a division of S&P Global (NYSE: SPGI). S&P Global enables businesses, governments, and individuals with trusted data, expertise, and technology to make decisions with conviction. We are Advancing Essential Intelligence through world-leading benchmarks, data, and insights that customers need in order to plan confidently, act decisively, and thrive in a rapidly changing global landscape. Learn more at www.spglobal.com/energy. View original content to download multimedia:https://www.prnewswire.com/news-releases/33rd-middle-east-petroleum--gas-conference-mpgc-on-june-2-3-to-convene-global-leaders-amid-historic-supply-shock-302775717.htmlSOURCE S&P Global Energy Original: 33rd Middle East Petroleum & Gas Conference (MPGC) on June 2-3 to Convene Global Leaders Amid Historic Supply Shock
US Market News
2月前
S&P Global Brings AI-Powered Energy Insights to S&P Capital IQ ProMay 13, 2026 7:25 AM
PR Newswire (US) GenAI-powered tools enable real-time analysis across the energy value chain NEW YORK, May 13, 2026 /PRNewswire/ -- S&P Global (NYSE: SPGI) today announced that industry-leading news and insights from S&P Global Energy are now available within S&P Global Market Intelligence's S&P Capital IQ Pro, providing clients with AI-powered access to proprietary intelligence across the global energy value chain. The new integration addresses critical market needs as geopolitical uncertainty continues to drive volatility across global energy markets, with downstream impacts on supply chains, company fundamentals and markets globally. In this environment, customers are increasingly relying on S&P Global's differentiated data and insights to navigate uncertainty and make informed decisions across interconnected markets. "Energy markets are increasingly interconnected with broader financial markets, and our clients need insights that reflects that reality," said Dave Ernsberger, President, S&P Global Energy. "Drawing on decades of experience covering global energy markets and our proprietary data models, we're providing the market with the essential intelligence they need to understand how the energy landscape impacts their portfolios and investment strategies." Clients gain deep, expert coverage of more than 12 industries across the global energy ecosystem, including agriculture, chemicals, oil and gas, LNG, clean energy, power, metals and shipping. This content is seamlessly integrated into Capital IQ Pro's GenAI capabilities including Document Intelligence and ChatIQ, bridging the gap between energy-focused intelligence and financial analysis."By combining S&P Global Energy's trusted energy insights with S&P Capital IQ Pro's GenAI-powered analytical tools, we're enabling clients to seamlessly connect energy market dynamics to company fundamentals and investment decisions, all within a single, integrated workflow," said Saugata Saha, President, S&P Global Market Intelligence and Chief Enterprise Data Officer, S&P Global. "This integration demonstrates our commitment to delivering comprehensive, AI-enhanced insights that meet the urgent needs of financial institutions navigating today's complex, interconnected markets." By integrating S&P Global Energy's industry-leading news and insights into Capital IQ Pro, the company is equipping clients with a level of energy market insight previously unavailable within capital markets workflows. To learn more about S&P Global Energy's intelligence on Capital IQ Pro, visit here. For more information on S&P Global products and solutions, please reach out to our teams here. Media Contacts: Orla O'Brien
S&P Global
+1 857-407-8559
orla.obrien@spglobal.com Amanda Oey
S&P Global Market Intelligence
+1 212-438-1904
amanda.oey@spglobal.comSuzanne Mount
S&P Global Energy
suzanne.mount@spgobal.com About S&P GlobalS&P Global (NYSE: SPGI) enables businesses, governments, and individuals with trusted data, expertise and technology to make decisions with conviction. We are Advancing Essential Intelligence through world-leading benchmarks, data, and insights that customers need in order to plan confidently, act decisively, and thrive in a rapidly changing global landscape. From helping our customers assess new investments across the capital and commodities markets to navigating the energy expansion, acceleration of artificial intelligence, and evolution of public and private markets, we enable the world's leading organizations to unlock opportunities, solve challenges, and plan for tomorrow – today. Learn more at www.spglobal.com. View original content to download multimedia:https://www.prnewswire.com/news-releases/sp-global-brings-ai-powered-energy-insights-to-sp-capital-iq-pro-302770819.htmlSOURCE S&P Global Original: S&P Global Brings AI-Powered Energy Insights to S&P Capital IQ Pro
US Market News
2月前
S&P Global Energy Launches HorizonsAgents: Faster Intelligence on Energy Security, Expansion, and Resilience with AIMay 12, 2026 9:04 AM
PR Newswire (US) Turns Complex Energy & Sustainability Data into Decision-Ready Insights in Minutes for Banks, Investors, Project Developers and CorporatesNEW YORK and LONDON and SINGAPORE, May 12, 2026 /PRNewswire/ -- S&P Global Energy today announced the expansion of its agentic solutions with the release of HorizonsAgents, a new suite of AI-powered agents designed to help banks, investors, project developers and corporates turn complex energy and sustainability information into decision-ready insights, faster, with greater consistency, and with clear auditability for regulated workflows. S&P Global Energy is the leading independent provider of information, analytics and benchmark prices for energy, commodities and energy expansion and transition markets.Today's announcement follows the November 2025 beta launch of the Transition Finance Agent, bringing the HorizonsAgents tally to four purpose-built agents for real-world project finance and investment workflows: Transition Finance Agent: generates insights to benchmark corporate decarbonization plans and build sustainable financing solutions.Data Center Intelligence Agent: supports rapid evaluation of data-center related energy and infrastructure risks and opportunities for project developers and investors.Sustainability Benchmarking Agent: enables rapid peer comparison and sustainability benchmarking so teams can assess relative positioning with more consistency and less manual effort.Net Zero Investment Agent: helps investors engage with their portfolio companies to ensure they are resilient to climate risk and taking advantage of opportunities."Continuing our leadership role in agentic AI development, AI-harnessed workflow solutions, and AI-ready data, we're excited to be announcing this next step as a first-mover in the multi-agent workflow space," said Leanne Todd, Head of Horizons, S&P Global Energy. "Our HorizonsAgents are purposefully designed to support analysis and decision making at the intersection of energy, finance and sustainability."As financial institutions face simultaneous pressure to deploy capital into energy expansion, manage transition risk, and respond to rapidly evolving sustainability expectations, the limiting factor is often not one of desire or ambition – it is time spent in discovery. Similarly, project developers and finance teams aiming to capture opportunities in data center development and power project deployment to address AI driven load growth need access to integrated, market-level data. "By embedding S&P Global Energy Horizons proprietary datasets directly into these solutions, our HorizonsAgents help our clients understand complex data and allow them to seamlessly extract critical insights to better understand corporate and infrastructure resilience," said Thomas Yagel, Head of Sustainable1, S&P Global Energy Horizons. "HorizonsAgents can generate comparable, decision-ready outputs in minutes – supporting faster origination, stronger screening discipline, and clearer internal alignment."HorizonsAgents are designed to augment human potential, increasing capacity so professionals can spend more time on client strategy, risk judgment, and building clarity into their investments. S&P Global Energy believes its newly expanded HorizonAgents suite helps ensure demonstrable use cases; acknowledges the energy requirements of AI by focusing on measurable and responsible use; and aims to align to key global frameworks such as the International Sustainability Standards Board.For more information about HorizonAgents, access this link.Media Contacts ??
Americas/EMEA: Kathleen Tanzy?+ 1 917-331-4607, kathleen.tanzy @weeble-6241, melissa.tan@spglobal.com About S&P Global Energy
At S&P Global Energy, our comprehensive view of global energy and commodities markets enables our customers to make superior decisions and create long-term, sustainable value. Our four core capabilities are: Platts for pricing and news; CERA for research and advisory; Horizons for energy expansion and sustainability solutions; and Events for industry collaboration.S&P Global Energy is a division of S&P Global (NYSE: SPGI). S&P Global enables businesses, governments, and individuals with trusted data, expertise, and technology to make decisions with conviction. We are Advancing Essential Intelligence through world-leading benchmarks, data, and insights that customers need in order to plan confidently, act decisively, and thrive in a rapidly changing global landscape. Learn more at www.spglobal.com/energy View original content to download multimedia:https://www.prnewswire.com/news-releases/sp-global-energy-launches-horizonsagents-faster-intelligence-on-energy-security-expansion-and-resilience-with-ai-302769613.htmlSOURCE S&P Global Energy Original: S&P Global Energy Launches HorizonsAgents: Faster Intelligence on Energy Security, Expansion, and Resilience with AI
US Market News
2月前
Le recul d'odomètre : une pratique frauduleuse répandue qui touche des milliers de CanadiensMay 11, 2026 12:19 PM
PR Newswire (Canada) CARFAX Canada et le COCVA vous donnent quelques conseils pour acheter un véhicule d'occasion en toute sécurité LONDON, ON, le 11 mai 2026 /CNW/ - En tant que l'une des principales sources de données automobiles au pays, CARFAX Canada invite les acheteurs de véhicules d'occasion à faire preuve de vigilance, alors que la falsification d'odomètre continue de représenter un risque pour la population canadienne. L'année dernière, CARFAX Canada a recensé 20 642 véhicules dont l'odomètre avait été trafiqué, d'après les Rapports d'historique de véhicules produits en 2025. Aujourd'hui, CARFAX Canada et le Conseil ontarien du commerce des véhicules automobiles (le COCVA) unissent leurs efforts pour sensibiliser la population canadienne.La falsification d'odomètre, aussi appelée « recul d'odomètre », consiste à reculer illégalement le kilométrage d'un véhicule pour en gonfler la valeur. Il s'agit d'un problème grave et d'une préoccupation croissante pour les acheteurs canadiens de véhicules d'occasion, d'autant plus qu'elle est difficile à détecter sans l'aide de données précises et d'outils de détection, généralement accessibles auprès de mécaniciens qualifiés.« Une lecture d'odomètre revue à la baisse peut pousser les acheteurs à payer un prix supérieur à la valeur réelle du véhicule, en plus de dissimuler l'usure normale due à un kilométrage élevé ainsi que des renseignements importants sur l'état véritable du véhicule », a déclaré Shawn Vording, président de CARFAX Canada. « Avec le nombre croissant de Canadiens actuellement à la recherche d'un véhicule d'occasion, il est recommandé aux acheteurs de prendre des précautions supplémentaires, comme de consulter le Rapport d'historique de véhicule de CARFAX Canada et de faire inspecter le véhicule par un mécanicien agréé, afin d'acheter en toute confiance. »« La falsification d'odomètre est un problème de plus en plus préoccupant que nous observons régulièrement dans le cadre de nos enquêtes, notamment celles visant des vendeurs illégaux non enregistrés », a déclaré Jeff Donnelly, responsable de la protection des consommateurs à le Conseil ontarien du commerce des véhicules automobiles (COCVA). « De plus en plus de consommateurs recherchent des véhicules d'occasion à bas prix et se tournent vers des vendeurs hors du marché réglementé, ce qui augmente le risque de fraude. Et avec un accès facilité aux outils permettant de falsifier les odomètres numériques, ce type de pratique gagne en popularité. La meilleure façon de se protéger est d'acheter auprès d'un concessionnaire inscrit à la COCVA.»La population canadienne peut se prémunir contre la fraude lors de l'achat d'un véhicule d'occasion en prenant soin de vérifier l'évolution des lectures d'odomètre dans le Rapport d'historique de véhicule de CARFAX Canada, mais aussi en faisant inspecter le véhicule par un mécanicien qualifié pour déceler tout signe de manipulation et s'assurer que l'usure du véhicule correspond bien au kilométrage déclaré.Comment avoir une longueur d'avance sur la fraude automobileVoici quelques conseils de CARFAX Canada et de la COCVA pour aider les consommateurs à éviter les escroqueries lors de l'achat d'un véhicule d'occasion :Privilégiez l'achat auprès d'un concessionnaire agréé par la COCVA ou par l'organisme de protection des consommateurs de votre province, puisqu'ils sont tenus de respecter des obligations légales et éthiques. Utilisez l'outil de recherche de concessionnaires de la COCVA pour confirmer que le vendeur est inscrit.Méfiez-vous des personnes non autorisées et non inscrites (vendeurs itinérants) qui vendent des voitures illégalement; elles pourraient faire de fausses déclarations sur l'état réel du véhicule, trafiquer l'odomètre ou dissimuler des problèmes majeurs.Soyez prudent si la transaction vous met mal à l'aise : les vendeurs illégaux et les escrocs utilisent souvent des tactiques de pression pour vous pousser à prendre une décision rapide.Si vous achetez un véhicule à un particulier, prenez des précautions supplémentaires pour vérifier l'identité du propriétaire. Assurez-vous que l'identité du vendeur correspond aux documents d'immatriculation du véhicule.Si l'offre semble trop belle pour être vraie, faites vos recherches et fiez-vous à votre intuition.Si possible, faites-vous accompagner d'un ami ou d'un membre de votre famille; cette personne remarquera peut-être quelque chose que vous n'avez pas vu.Inspectez le véhicule en personne, demandez toujours à un mécanicien agréé d'inspecter le véhicule et faites un essai routier en bonne et due forme.Ne versez pas d'acompte ou ne payez pas la totalité du véhicule en utilisant des liens ou des applications suspects.Vérifiez tous les documents et obtenez un Rapport d'historique de véhicule de CARFAX Canada jumelé à une Détection de NIV frauduleux. Ces rapports permettent de confirmer que l'historique du véhicule correspond bien aux informations fournies par le vendeur.En cas de doute, il vaut mieux renoncer à acheter le véhicule.Attention aux autres escroqueries courantes liées aux véhicules d'occasion au CanadaClonage de NIV (ou renivage)Le clonage de NIV, ou renivage, est un type de fraude automobile qui consiste à copier ou à « cloner » illégalement le numéro d'identification d'un véhicule avant de l'attribuer à un autre pour en dissimuler l'identité. Dans de nombreux cas, un NIV cloné est utilisé pour revendre un véhicule volé. L'acheteur dupé pourrait alors voir son bien saisi par les autorités, avec les lourdes conséquences financières et autres désagréments que cela implique.Historique non divulguéEn plus du recul d'odomètre et du clonage de NIV, les acheteurs devraient également être au fait de plusieurs autres types d'antécédents non divulgués concernant un véhicule afin d'éviter de graves problèmes :Accidents ou dommages dissimulésLe fait qu'un véhicule d'occasion ait été accidenté ou endommagé ne signifie pas pour autant qu'il n'est pas un bon choix. L'important est d'avoir connaissance de cet historique et de tout dommage que le véhicule pourrait avoir subi, afin de pouvoir confirmer que les réparations adéquates ont été effectuées. Dans le cas contraire, l'acheteur s'expose à des risques importants pour sa sécurité, mais aussi à des réparations coûteuses, à des problèmes d'assurance, à des défaillances mécaniques et à une valeur de revente moindre.Accident grave et reconstruction de véhicule non déclarés ou falsification du statut du véhicule : Les criminels peuvent délocaliser des véhicules gravement accidentés au Canada en vue de dissimuler leur historique et de les revendre avec de faux documents ou un statut sans incident : c'est ce qu'on appelle la « falsification d'un statut de véhicule ». Acheter sans le savoir un véhicule gravement accidenté ou reconstruit peut se transformer en un interminable casse-tête financier et judiciaire, sans parler des problèmes d'assurance. Droits de rétention non déclarésAu cours de la dernière année, CARFAX Canada a constaté que 40 % des véhicules soumis à la vérification des droits de rétention étaient grevés de dettes. Bien que les droits de rétention soient chose courante, un acheteur pourrait devenir responsable de la dette liée à un véhicule assujetti à un droit de rétention non déclaré. Si les droits de rétention n'ont pas été payés avant le transfert de propriété, le prêteur pourrait reprendre possession du véhicule, laissant à l'acheteur le soin de payer la somme due sur celui-ciKenny, un client de CARFAX Canada originaire de l'Alberta, raconte comment un Rapport d'historique de véhicule lui a permis d'éviter une erreur coûteuse : « Nous étions sur le point d'acheter un véhicule d'occasion et nous en avions même négocié le prix. Nous avons décidé d'effectuer une dernière vérification et avons découvert que le véhicule avait fait l'objet d'un recul d'odomètre. Sans ce rapport, nous ne l'aurions jamais su. Ça nous a épargné beaucoup de problèmes… et d'argent! »CARFAX Canada analyse des milliards de dossiers provenant de partout en Amérique du Nord et fournit des historiques de véhicule complets, des perspectives détaillées sur le marché et des données d'évaluation afin d'aider des millions de personnes à prendre des décisions éclairées en matière d'automobile.À propos de CARFAX Canada
CARFAX Canada, une division de S&P Global (NYSE : SPGI), est la principale source d'information sur l'automobile au Canada, fournissant des solutions d'historique, d'évaluation et d'entretien de véhicules. S'appuyant sur des milliards de données provenant de milliers de sources, ses produits aident les acheteurs et les vendeurs de véhicules d'occasion ainsi que les fournisseurs de services automobiles à prendre des décisions éclairées. CARFAX Canada se consacre à la transparence et est reconnue pour fournir des renseignements fiables sur l'historique et l'évaluation des véhicules aux concessionnaires, aux constructeurs automobiles, aux consommateurs, aux ateliers de services automobiles, aux ventes aux enchères majeures, aux gouvernements, aux fournisseurs d'assurance et aux services de police.Suivez CARFAX Canada sur Instagram, Facebook et LinkedIn. SOURCE CARFAX Canada Original: Le recul d'odomètre : une pratique frauduleuse répandue qui touche des milliers de Canadiens
US Market News
2月前
Odometer Rollbacks: A Common Scam Impacting Thousands of CanadiansMay 11, 2026 12:04 PM
PR Newswire (Canada) CARFAX Canada and OMVIC share tips on how to protect yourself when buying a used carLONDON, ON, May 11, 2026 /CNW/ - As one of Canada's leading sources of automotive data, CARFAX Canada is warning used car buyers to be vigilant as odometer tampering continues to put Canadian consumers at risk. Last year, CARFAX Canada identified 20,642 vehicles with rolled back odometers, flagged through Vehicle History Reports that were ordered in 2025. Today, CARFAX Canada and the Ontario Motor Vehicle Industry Council (OMVIC) are joining forces to warn Canadians.Odometer tampering, also known as an odometer rollback, occurs when a vehicle's mileage reading is illegally reduced to inflate its value. It is a serious and ongoing concern for buyers in Canada's used car market and cannot be spotted without the help of comprehensive data and detection tools available through most licensed mechanics."A rolled back odometer can leave buyers paying more than a vehicle is truly worth, mask the normal wear and tear that occurs with higher mileage vehicles, and ultimately hide important information about a vehicle's true condition," said Shawn Vording, President of CARFAX Canada. "With many Canadians in the market for used vehicles right now, buyers can take extra precautions like reviewing a CARFAX Canada Vehicle History Report and having the vehicle inspected by a licensed mechanic to buy with more confidence.""Odometer tampering is a growing concern, and one we're encountering more frequently in our investigations, particularly those involving illegal, unregistered sellers," said Jeff Donnelly, Chief Consumer Protection Officer at the Ontario Motor Vehicle Industry Council (OMVIC). "As more consumers search for lower-priced used vehicles and look beyond the regulated market, the risk of fraud increases. With easier access to tools that can alter digital odometers, this type of deception is becoming more common. The best way to protect yourself is to buy from an OMVIC registered dealer."Canadians can help protect themselves when buying a used car by reviewing the pattern of odometer readings in a CARFAX Canada Vehicle History Report (VHR), along with an inspection by a licensed mechanic to help identify signs of tampering and confirm that the vehicle's wear and tear aligns with the reported mileage.How to Stay Ahead of ScamsCARFAX Canada and OMVIC recommend the following tips to help avoid used car scams:Consider buying from a dealer registered with OMVIC or a consumer protection agency in your province as they must follow legal and ethical practices. Use OMVIC's dealer search tool to confirm the seller is registered.Beware of illegal, unregistered individuals (curbsiders) who sell cars illegally and might misrepresent the real condition of the car, turn back the odometer or hide major issues.Be cautious if the transaction makes you feel uneasy: Illegal sellers and scammers often use high-pressure tactics to rush decisions.If buying privately, take extra precautions to verify the owner of the vehicle: Ensure that the seller's identity matches the vehicle's registration documents.If the deal seems too good to be true, do your research and trust your gut.If possible, bring a friend or family member; they may notice something you don't.Inspect the vehicle in person, always get a licensed mechanic to inspect the vehicle, and take it for a proper test drive.Do not leave a deposit or pay in full for the vehicle using suspicious links or apps.Check all paperwork and obtain a CARFAX Canada Vehicle History Report and VIN Fraud Check. This helps verify that the vehicle's history matches with what the seller advertises.When in doubt, walk away.Beware of Other Common Used Car Scams in CanadaVIN Cloning or Re-VinningVIN cloning or re-vinning is a form of auto fraud where a vehicle's VIN is illegally copied or "cloned" onto another vehicle to cover its identity. In many cases, cloned VINs are used to conceal and re-sell a stolen vehicle, and if you buy one, it could be seized by authorities, leaving consumers to bear the full financial burden and other potential adverse consequences.Undisclosed HistoryBeyond odometer fraud and VIN cloning, buyers should also be aware of several other types of undisclosed vehicle history that can lead to serious problems:Hidden Accidents or DamageA vehicle's accident or damage history does not necessarily disqualify it from purchase. The critical factor is knowing about any previous damage, so buyers can confirm it has been repaired properly. Undisclosed damage can pose significant safety risks and lead to costly repairs, reduced resale value, insurance issues, and mechanical failures.Undisclosed Salvage and Rebuilt Branding or Title Washing: Criminals may move salvaged vehicles across the country to hide their history and re-sell them with fake documentation or a clean title – this is known as title washing. Unknowingly buying a rebuilt or salvage vehicle may quickly turn into long-term financial, legal and insurance headaches. Undisclosed LiensIn the past year, CARFAX Canada found that 40% of lien checks conducted through its platform had revealed outstanding debt attached to the vehicle. While liens are common, buyers may become responsible for the debt if purchasing a vehicle with a lien without knowing. If a lien is not paid off before transferring ownership, the lender can repossess the vehicle, leaving the buyer on the hook for paying off the money owing on the vehicle.A CARFAX Canada customer shared how a Vehicle History Report helped them avoid a costly mistake. Kenny from Alberta said: "We almost purchased a used vehicle and had even negotiated a price. We decided to give it one more check and discovered the vehicle had an odometer rollback issue. Without the report we would never have known, and it saved us a lot of headaches and money!"CARFAX Canada searches billions of data records across North America and provides comprehensive vehicle history, market insights and vehicle valuation data to help millions of people make decisions about cars.About CARFAX Canada
CARFAX Canada, a part of S&P Global (NYSE: SPGI), is Canada's definitive source of automotive information, delivering vehicle history, valuation and service solutions. Drawing on billions of data records from thousands of sources, its products enable used vehicle buyers, sellers and vehicle service providers to make informed decisions. CARFAX Canada is dedicated to transparency and is trusted to provide vehicle history, valuation and service information to dealerships, vehicle manufacturers, consumers, service shops, major auctions, governments, insurance providers and police agencies.Connect with CARFAX Canada on Instagram, Facebook and LinkedIn.SOURCE CARFAX Canada Original: Odometer Rollbacks: A Common Scam Impacting Thousands of Canadians
US Market News
2月前
CARFAX: Nearly 7 Million Vehicles Have Unfixed Backup Camera RecallsMay 11, 2026 9:00 AM
PR Newswire (US) New CARFAX data underscores growing risk as camera-related recall alerts spikeCENTREVILLE, Va., May 11, 2026 /PRNewswire/ -- Backup camera recalls are rising sharply, up more than a million and a half since the start of the year. New CARFAX data shows nearly 7 million vehicles on U.S. roads currently have an unfixed recall tied to their backup camera system, which can reduce driver visibility and increase the risk of a crash. These recalls stem from a range of issues, including blank or distorted screens, frozen images, and intermittent camera failures. Last week, Tesla recalled more than 210,000 vehicles due to lagging rearview camera images, according to the National Highway Traffic Safety Administration (NHTSA). Back up cameras increase vehicle safety by significantly reducing the risk of fatalities and serious injuries caused by back over accidents, according to NHTSA."Backup cameras are a critical safety feature and when they don't work properly, can significantly limit what drivers see behind them," said Faisal Hasan, Vice President of Data Acquisition. "With millions of vehicles still carrying unfixed recalls, it's important for drivers to check for open recalls and get them repaired as soon as possible. These fixes are free and can help prevent potential accidents."The 10 states with the highest number of unfixed camera recalls are:Texas: 696,000California: 545,000Florida: 492,000Michigan: 332,000Ohio: 282,000Illinois: 273,000New York: 269,000Pennsylvania: 263,000Georgia: 220,000North Carolina: 216,000Several factors are likely contributing to the rise in camera-related recalls. Since 2018, federal regulations have required backup cameras on all new vehicles sold in the U.S. that are 10,000 pounds or less, which includes most everyday vehicles like sedans and SUVs. As a result, even minor malfunctions can become federal safety compliance issues. At the same time, growing vehicle complexity means these systems often rely on interconnected hardware and software, creating more opportunities for widespread failures.Research continues to show the safety benefits of backup cameras. According to the American Academy of Pediatrics, rearview cameras are associated with:A roughly one-third reduction in backover incidentsNearly a 50% decrease in severe injuriesA 78% reduction in reported fatalitiesRecalls affect a wide range of automakers and model years. Drivers can check for open recalls on their vehicle for free at carfax.com/recall. All recall repairs are completed at no cost to consumers. Before scheduling service, drivers should contact their local dealer to confirm parts or software availability.Editor's note: State and DMA-level data on rearview backup camera recalls are available upon request. Interviews are also available. Please contact Em Nguyen at emnguyen@carfax.com.About CARFAXCARFAX, part of S&P Global Mobility, helps millions of people every day confidently shop, buy, service, and sell cars with innovative solutions powered by CARFAX® vehicle history information. The expert in vehicle history since 1984, CARFAX provides CARFAX Car Listings, CARFAX Car Care, CARFAX History-Based Value , and the flagship CARFAX Vehicle History Report to consumers and the automotive industry. CARFAX owns the world's largest vehicle history database and is nationally recognized as a top workplace by The Washington Post. Shop, Buy, Service, Sell – Show me the CARFAX®.S&P Global Mobility is a division of S&P Global (NYSE: SPGI). S&P Global is the world's foremost provider of credit ratings, benchmarks, analytics, and workflow solutions in the global capital, commodity, and automotive markets. View original content to download multimedia:https://www.prnewswire.com/news-releases/carfax-nearly-7-million-vehicles-have-unfixed-backup-camera-recalls-302767914.htmlSOURCE CARFAX Original: CARFAX: Nearly 7 Million Vehicles Have Unfixed Backup Camera Recalls
US Market News
2月前
S&P Global Announces Board of Directors for Mobility GlobalMay 8, 2026 8:01 AM
PR Newswire (US) Board brings together accomplished leaders with deep experience in automotive, data, strategy, technology, finance and global operations to support growth and value creation upon separation into a standalone public companyNEW YORK, May 8, 2026 /PRNewswire/ -- S&P Global Inc. (NYSE: SPGI) today announced the Board of Directors for Mobility Global Inc. ("Mobility Global") following its planned separation from S&P Global into an independent, public company by mid-2026. Joseph ("Joe") Hinrichs will lead the eight-person Board, effective as of the separation date, serving as its Chairman. Bill Eager, President of S&P Global Mobility and CEO-designate of Mobility Global, will also join the Board alongside a group of highly-qualified directors who bring leadership experience and deep expertise across the automative, data, and technology sectors.The new Mobility Global Board of Directors will include:Joe Hinrichs (Chairman), former CEO of CSXEric Aboaf, CFO of S&P GlobalBill Eager, CEO-designate of Mobility GlobalHeather Lavallee, CEO of Voya FinancialMonique Leroux, former CEO of Desjardins GroupMark Peek, former CFO of WorkdayShilpa Ranganathan, Chief Product Officer of Expedia GroupAlexander Taussig, Board Partner at Lightspeed Venture Partners"I am thrilled that we were able to assemble such a talented group of directors to serve on the Mobility Global Board," said Mr. Hinrichs. "This Board brings together a highly complementary set of skills and experiences, spanning global automotive leadership, data and technology innovation, consumer and product strategy, and deep financial and operational expertise, which will be instrumental in positioning the Company for value creation. Together with my fellow directors and the leadership team, we will be focused on generating long-term growth and shareholder value.""With this distinguished group of directors, we will be well-positioned to hit the ground running as we enter a new chapter for Mobility Global as a standalone public company," said Mr. Eager. "I look forward to working alongside the rest of the Board, leveraging their diverse perspectives and backgrounds, to continue building on the business's track record of driving profitable growth among leading global brands."S&P Global expects to complete the separation of its Mobility division in mid-2026, subject to the satisfaction of customary legal and regulatory requirements and approvals, including final approval by the S&P Global Board of Directors and the Form 10 registration statement being declared effective by the U.S. Securities and Exchange Commission.About Joe Hinrichs
Joe Hinrichs will serve as Chairman of the Board of Directors. Mr. Hinrichs served as the President and Chief Executive Officer of CSX Corporation from September 2022 to September 2025. Prior to joining CSX, Mr. Hinrichs served as President of Ford Motor Company's global automotive business from May 2019 to March 2020. During his tenure at Ford, Mr. Hinrichs also served as Executive Vice President and President of Global Operations, Executive Vice President and President of the Americas, President of Asia Pacific and Africa, Chairman and Chief Executive Officer of Ford China, and President and Chief Executive Officer of Ford Canada. Mr. Hinrichs has served as a member of the board of directors for The Goodyear Tire & Rubber Company since July 2023. From May 2021 to September 2022, Mr. Hinrichs served as member of the board of directors of Ascend Wellness Holdings, Inc. Mr. Hinrichs holds a BS in Electrical Engineering from the University of Dayton and an MBA from the Harvard Business School. Mr. Hinrichs' qualifications for election include his years of leadership experience in the automotive industry.About Eric Aboaf
Eric W. Aboaf will serve on the board of directors. Mr. Aboaf has served as Chief Financial Officer and Executive Vice President for S&P Global Inc. since February 2025. Mr. Aboaf joined S&P Global from State Street Corporation, where he served as Chief Financial Officer and Vice Chairman since May 2022, was Chief Financial Officer and Executive Vice President since February 2017, and joined as Executive Vice President in December 2016. Mr. Aboaf also served as Chief Financial Officer at Citizens Financial Group, Inc. from April 2015 to December 2016. Mr. Aboaf holds a BS from The Wharton School of Business and a BS from the Engineering School at the University of Pennsylvania and an MS in computer science from the Massachusetts Institute of Technology. Mr. Aboaf's qualifications for election include his financial expertise.About Bill Eager
Bill Eager will serve on the Board of Directors. Mr. Eager was President of S&P Global Mobility since August 2025. Prior to that, he held various leadership roles at CARFAX for more than 20 years, including serving as Chief Executive Officer since 2021. Previously, Mr. Eager served as Vice President of CARFAX's Dealer Business for 17 years. Prior to joining CARFAX, Mr. Eager was part of the leadership team at The Cobalt Group, an automotive digital retailing company. Mr. Eager holds a BA in economics from Villanova University and an MBA from George Mason University.About Heather Lavallee
Heather Lavallee will serve on the Board of Directors. Ms. Lavallee has served as Chief Executive Officer of Voya Financial, Inc. since January 2023, and as board member since July 2022. Prior to that, Ms. Lavallee was Chief Executive Officer of Voya's Retirement business from March 2021 to January 2023, President of Voya's Tax Exempt Markets segment from May 2016 to March 2021, and President of Voya's Employee Benefits segment from March 2011 to April 2016. Before joining Voya Financial, Ms. Lavallee worked at Mutual of Omaha as a regional vice president of the Group Insurance Division for their Western Region, and at Sun Life New York Insurance and Annuity Company. Ms. Lavallee holds a BA in psychology from Colby College and an MBA from Pepperdine University's Graziadio Business School. Ms. Lavallee's qualifications for election include her years of experience in executive leadership.About Monique Leroux
Monique F. Leroux will serve on the Board of Directors. Ms. Leroux is Companion of the Order of Canada and of the Canadian Business Hall of Fame. She has served as an independent board member of the Michelin Group since 2016, BCE Inc. since 2016 and Alimentation Couche-Tard Inc. since 2015. Ms. Leroux had served on the board of directors of S&P Global Inc. from 2016 to 2022. From 2004 to 2008, she was Chief Financial Officer and from 2008 to 2016, she was Chair of the Board and Chief Executive Officer of Desjardins Group. Prior to that, she was an audit partner at Ernst & Young and held executive positions at The Royal Bank of Canada and Quebecor, Inc. Among others, Ms. Leroux holds Honorary Doctorates from Mc Gill University, Canadian Forces College, Montreal University, Laval University and University of Ottawa. Ms. Leroux's qualifications for election include her extensive experience as chief executive officer and board member serving global public companies.About Mark Peek
Mark S. Peek will serve on the Board of Directors. Mr. Peek held various positions at Workday, Inc., from June 2012 to May 2025, including Chief Financial Officer, Co-President, and Managing Director and Co-Head of Workday Ventures. Prior to Workday, from April 2007 to May 2012, Mr. Peek was Chief Financial Officer and Co-President of Business Operations of VMware, Inc. From 2000 to 2007, Mr. Peek was Senior Vice President and Chief Accounting Officer at Amazon.com. Prior to joining Amazon.com, Mr. Peek spent 19 years at Deloitte, the last ten years as a partner. Mr. Peek has served on the board of directors of SentinelOne since May 2021 and on the board of directors of Trimble since 2010. Prior to his career at Workday, he also served on their board of directors. Mr. Peek holds a BS in accounting and international finance from Minnesota State University. Mr. Peek's qualifications for election include his executive management of software and technology companies as well as his finance and accounting expertise.About Shilpa Ranganathan
Shilpa Ranganathan will serve on the Board of Directors. Ms. Ranganathan has served as Chief Product Officer of Expedia Group, Inc. since January 2025. Prior to joining Expedia, Ms. Ranganathan held various positions at Microsoft Corporation, from May 2008 to December 2024, including Corporate Vice President of Windows from April 2022 to December 2024, Corporate Vice President of Mobile & Modern Productivity Experiences from May 2019 to April 2022, and General Manager of Mobile Experiences from January 2018 to May 2019. Ms. Ranganathan holds a BE in Electrical and Electronics from Birla Institute of Technology and Science, Pilani. Ms. Ranganathan's qualifications for election include her technology expertise, including in AI product development.About Alexander Taussig
Alexander Taussig will serve on the Board of Directors. Mr. Taussig has held various positions at Lightspeed Venture Partners since February 2016, including Board Partner since December 2024, Partner and Co-Head of Consumer Practice from December 2021 to December 2024 and Partner from February 2016 to December 2021. Prior to joining Lightspeed, Mr. Taussig held various positions at Highland Capital Partners, including Senior Associate and Principal from 2009 to 2013 and Partner from 2013 to January 2016. Mr. Taussig serves as member the board of directors of United Rentals, Inc. since February 2026. Mr. Taussig holds an AB in physics from Harvard University, an MS in materials science and engineering from MIT and an MBA from Harvard Business School. Mr. Taussig's qualifications for election include his expertise in scaling technology-enabled marketplaces and platforms and his track record advising management teams.About S&P Global
S&P Global (NYSE: SPGI) enables businesses, governments, and individuals with trusted data, expertise and technology to make decisions with conviction. We are Advancing Essential Intelligence through world-leading benchmarks, data, and insights that customers need in order to plan confidently, act decisively, and thrive in a rapidly changing global landscape.From helping our customers assess new investments across the capital and commodities markets to navigating the energy expansion, acceleration of artificial intelligence, and evolution of public and private markets, we enable the world's leading organizations to unlock opportunities, solve challenges, and plan for tomorrow – today. Learn more at www.spglobal.comAbout Mobility Global
Mobility Global is the world's standard for mobility intelligence, providing critical data and analytics across the full vehicle lifecycle. Its portfolio of trusted brands and products includes CARFAX, automotiveMastermind, Polk Automotive Solutions, and Market Scan, supporting the world's major automakers, suppliers, dealer groups, media, financial institutions, and consumers with data, forecast, insights, technology, and innovation. Additional information about the planned separation is available at https://investor.spglobal.com.Media Contact:
Orla O'Brien
S&P Global
orla.obrien@spglobal.comKara Evanko
Mobility Global
kara.evanko@spglobal.com Forward-Looking Statements
This press release contains "forward-looking statements," as defined in the Private Securities Litigation Reform Act of 1995. These statements, which express management's current views concerning future events, trends, contingencies or results, appear at various places in this press release and use words like "anticipate," "assume," "believe," "continue," "estimate," "expect," "forecast," "future," "intend," "plan," "potential," "predict," "project," "strategy," "target" and similar terms, and future or conditional tense verbs like "could," "may," "might," "should," "will" and "would." For example, management may use forward-looking statements when addressing topics such as: the outcome of contingencies; future actions by regulators; changes in the business strategies and methods of generating revenue of S&P Global Inc. (the "Company"); the development and performance of the Company's services and products; the expected impact of acquisitions and dispositions; the Company's effective tax rates; the Company's cost structure, dividend policy, cash flows or liquidity; and the anticipated separation of S&P Global Mobility ("Mobility") into a standalone public company. Forward-looking statements are subject to inherent risks and uncertainties. Factors that could cause actual results to differ materially from those expressed or implied in forward-looking statements include, among other things:worldwide economic, financial, political, and regulatory conditions (including slower GDP growth or recession, restrictions on trade (e.g., tariffs), instability in the banking sector and inflation), and factors that contribute to uncertainty and volatility (e.g., supply chain risk), geopolitical uncertainty (including military conflict), natural and man-made disasters, civil unrest, public health crises (e.g., pandemics), and conditions that result from legislative, regulatory, trade and policy changes, including from the U.S. administration;the volatility and health of debt, equity, commodities, energy and automotive markets, including credit quality and spreads, the composition and mix of credit maturity profiles, the level of liquidity and future debt issuances, equity flows from active to passive, fluctuations in average asset prices in global equities, demand for investment products that track indices and assessments and trading volumes of certain exchange-traded derivatives;the demand and market for credit ratings in and across the sectors and geographies where the Company operates;the Company's ability to maintain adequate physical, technical and administrative safeguards to protect the security of confidential information and data, or protect against a system or network disruption that results in regulatory penalties and remedial costs or improper disclosure of confidential information or data;the outcome of litigation, government and regulatory proceedings, investigations and inquiries;concerns in the marketplace affecting the Company's credibility or otherwise affecting market perceptions of the integrity or utility of independent credit ratings, benchmarks, indices and other services;the level of merger and acquisition activity in the United States and abroad;the level of the Company's future cash flows and capital investments;the effect of competitive products (including those incorporating artificial intelligence ("AI")) and pricing, including the level of success of new product developments and global expansion;the impact of customer cost-cutting pressures;a decline in the demand for our products and services by our customers and other market participants;our ability to develop new products or technologies, to integrate our products with new technologies (e.g., AI), or to compete with new products or technologies offered by new or existing competitors;the introduction of competing products (including those developed by AI) or technologies by other companies;our ability to protect our intellectual property from unauthorized use and infringement, including by others using AI technologies, and to operate our business without violating third-party intellectual property rights, including through our own use of AI in our products and services;our ability to attract, incentivize and retain key employees, especially in a competitive business environment;our ability to successfully navigate key organizational changes;the continuously evolving regulatory environment in Europe, the United States and elsewhere around the globe affecting each of our businesses and the products they offer, and our compliance therewith;the Company's exposure to potential criminal sanctions or civil penalties for noncompliance with foreign and U.S. laws and regulations that are applicable in the jurisdictions in which it operates, including sanctions laws relating to countries such as Iran, Russia and Venezuela, anti-corruption laws such as the U.S. Foreign Corrupt Practices Act and the U.K. Bribery Act of 2010, and local laws prohibiting corrupt payments to government officials, as well as import and export restrictions;the Company's ability to make acquisitions and dispositions and successfully integrate the businesses we acquire;consolidation of the Company's customers, suppliers or competitors;the ability of the Company, and its third-party service providers, to maintain adequate physical and technological infrastructure;the Company's ability to successfully recover from a disaster or other business continuity problem, such as an earthquake, hurricane, flood, civil unrest, protests, military conflict, terrorist attack, outbreak of pandemic or contagious diseases, security breach, cyber attack, data breach, power loss, telecommunications failure or other natural or man-made event;the impact on the Company's revenue and net income caused by fluctuations in foreign currency exchange rates;the impact of changes in applicable tax or accounting requirements on the Company;the separation of Mobility not being consummated within the anticipated time period or at all;the ability of the separation of Mobility to qualify for tax-free treatment for U.S. federal income tax purposes;any disruption to the Company's business in connection with the proposed separation of Mobility;any loss of synergies from separating the businesses of Mobility and the Company that adversely impact the results of operations of both businesses, or the companies resulting from the separation of Mobility not realizing all of the expected benefits of the separation; andfollowing the separation of Mobility, the combined value of the common stock of the two publicly-traded companies not being equal to or greater than the value of the Company's common stock had the separation not occurred.The factors noted above are not exhaustive. The Company and its subsidiaries operate in a dynamic business environment in which new risks emerge frequently. Accordingly, the Company cautions readers not to place undue reliance on any forward-looking statements, which speak only as of the dates on which they are made. The Company undertakes no obligation to update or revise any forward-looking statement to reflect events or circumstances arising after the date on which it is made, except as required by applicable law. Further information about the Company's businesses, including information about factors that could materially affect its results of operations and financial condition, is contained in the Company's filings with the SEC, including Item 1A, Risk Factors in our most recently filed Annual Report on Form 10-K. View original content to download multimedia:https://www.prnewswire.com/news-releases/sp-global-announces-board-of-directors-for-mobility-global-302766889.htmlSOURCE S&P Global Original: S&P Global Announces Board of Directors for Mobility Global
US Market News
2月前
S&P Global Announces Public Filing of Form 10 Registration Statement for Planned Separation of Mobility GlobalMay 7, 2026 4:27 PM
PR Newswire (US) NEW YORK, May 7, 2026 /PRNewswire/ -- S&P Global Inc. (NYSE: SPGI) announced today the public filing of a Form 10 registration statement ("Form 10") with the U.S. Securities and Exchange Commission in connection with its previously announced separation of its Mobility division into an independent, public company, Mobility Global Inc. ("Mobility Global").The filing provides detailed information on Mobility Global's business, strategy and historical financial results.Bill Eager, President of S&P Global Mobility and Chief Executive Officer of Mobility Global, said, "Mobility Global is the world's standard for automotive data and intelligence. OEMs, suppliers, dealers and consumers rely on our portfolio of category-defining brands including CARFAX, Polk and automotiveMastermind. As we prepare to launch as an independent public company, we are energized by the runway ahead to deliver on our mission: provide trusted information that helps billions of people build, sell and own vehicles with more confidence."S&P Global expects to complete the separation of its Mobility division in mid-2026, subject to the satisfaction of customary legal and regulatory requirements and approvals, including final approval by the S&P Global Board of Directors and the Form 10 registration statement being declared effective by the U.S. Securities and Exchange Commission.The Form 10 registration statement is available at www.sec.gov under "Mobility Global Inc."About S&P GlobalS&P Global (NYSE: SPGI) enables businesses, governments, and individuals with trusted data, expertise and technology to make decisions with conviction. We are Advancing Essential Intelligence through world-leading benchmarks, data, and insights that customers need in order to plan confidently, act decisively, and thrive in a rapidly changing global landscape.From helping our customers assess new investments across the capital and commodities markets to navigating the energy expansion, acceleration of artificial intelligence, and evolution of public and private markets, we enable the world's leading organizations to unlock opportunities, solve challenges, and plan for tomorrow – today. Learn more at www.spglobal.com.Investor Relations: https://investor.spglobal.com About Mobility Global Mobility Global is the world's standard for mobility intelligence, providing critical data and analytics across the full vehicle lifecycle. Its portfolio of trusted brands and products includes CARFAX, automotiveMastermind, Polk Automotive Solutions, and Market Scan, supporting the world's major automakers, suppliers, dealer groups, media, financial institutions, and consumers with data, forecast, insights, technology, and innovation. Additional information about the planned separation is available at https://investor.spglobal.com.Contacts:S&P Global Investor Relations:
Mark Grant
Senior Vice President, Investor Relations and Treasurer
Tel: +1 (347) 640-1521
mark.grant@spglobal.com Media:
Christina Twomey
Chief Communications Officer, S&P Global
Tel: +1 (646) 407-3001
christina.twomey@spglobal.comMobility Global Investor Relations:
Tejal Engman
Managing Director, Investor Relations
ir@mobilityglobal.comMedia:
mobilitycomms@spglobal.comForward-Looking StatementsThis press release contains "forward-looking statements," as defined in the Private Securities Litigation Reform Act of 1995. These statements, which express management's current views concerning future events, trends, contingencies or results, appear at various places in this press release and use words like "anticipate," "assume," "believe," "continue," "estimate," "expect," "forecast," "future," "intend," "plan," "potential," "predict," "project," "strategy," "target" and similar terms, and future or conditional tense verbs like "could," "may," "might," "should," "will" and "would." For example, management may use forward-looking statements when addressing topics such as: the outcome of contingencies; future actions by regulators; changes in the business strategies and methods of generating revenue of S&P Global Inc. (the "Company"); the development and performance of the Company's services and products; the expected impact of acquisitions and dispositions; the Company's effective tax rates; the Company's cost structure, dividend policy, cash flows or liquidity; and the anticipated separation of S&P Global Mobility ("Mobility") into a standalone public company.Forward-looking statements are subject to inherent risks and uncertainties. Factors that could cause actual results to differ materially from those expressed or implied in forward-looking statements include, among other things:worldwide economic, financial, political, and regulatory conditions (including slower GDP growth or recession, restrictions on trade (e.g., tariffs), instability in the banking sector and inflation), and factors that contribute to uncertainty and volatility (e.g., supply chain risk), geopolitical uncertainty (including military conflict), natural and man-made disasters, civil unrest, public health crises (e.g., pandemics), and conditions that result from legislative, regulatory, trade and policy changes, including from the U.S. administration;the volatility and health of debt, equity, commodities, energy and automotive markets, including credit quality and spreads, the composition and mix of credit maturity profiles, the level of liquidity and future debt issuances, equity flows from active to passive, fluctuations in average asset prices in global equities, demand for investment products that track indices and assessments and trading volumes of certain exchange traded derivatives;the demand and market for credit ratings in and across the sectors and geographies where the Company operates;the Company's ability to maintain adequate physical, technical and administrative safeguards to protect the security of confidential information and data, or protect against a system or network disruption that results in regulatory penalties and remedial costs or improper disclosure of confidential information or data;the outcome of litigation, government and regulatory proceedings, investigations and inquiries;concerns in the marketplace affecting the Company's credibility or otherwise affecting market perceptions of the integrity or utility of independent credit ratings, benchmarks, indices and other services;the level of merger and acquisition activity in the United States and abroad;the level of the Company's future cash flows and capital investments;the effect of competitive products (including those incorporating artificial intelligence ("AI")) and pricing, including the level of success of new product developments and global expansion;the impact of customer cost-cutting pressures;a decline in the demand for our products and services by our customers and other market participants;our ability to develop new products or technologies, to integrate our products with new technologies (e.g., AI), or to compete with new products or technologies offered by new or existing competitors;the introduction of competing products (including those developed by AI) or technologies by other companies;our ability to protect our intellectual property from unauthorized use and infringement, including by others using AI technologies, and to operate our business without violating third-party intellectual property rights, including through our own use of AI in our products and services;our ability to attract, incentivize and retain key employees, especially in a competitive business environment;our ability to successfully navigate key organizational changes;the continuously evolving regulatory environment in Europe, the United States and elsewhere around the globe affecting each of our businesses and the products they offer, and our compliance therewith;the Company's exposure to potential criminal sanctions or civil penalties for noncompliance with foreign and U.S. laws and regulations that are applicable in the jurisdictions in which it operates, including sanctions laws relating to countries such as Iran, Russia and Venezuela, anti-corruption laws such as the U.S. Foreign Corrupt Practices Act and the U.K. Bribery Act of 2010, and local laws prohibiting corrupt payments to government officials, as well as import and export restrictions;the Company's ability to make acquisitions and dispositions and successfully integrate the businesses we acquire;consolidation of the Company's customers, suppliers or competitors;the ability of the Company, and its third-party service providers, to maintain adequate physical and technological infrastructure;the Company's ability to successfully recover from a disaster or other business continuity problem, such as an earthquake, hurricane, flood, civil unrest, protests, military conflict, terrorist attack, outbreak of pandemic or contagious diseases, security breach, cyber attack, data breach, power loss, telecommunications failure or other natural or man-made event;the impact on the Company's revenue and net income caused by fluctuations in foreign currency exchange rates;the impact of changes in applicable tax or accounting requirements on the Company;the separation of Mobility not being consummated within the anticipated time period or at all;the ability of the separation of Mobility to qualify for tax-free treatment for U.S. federal income tax purposes;any disruption to the Company's business in connection with the proposed separation of Mobility;any loss of synergies from separating the businesses of Mobility and the Company that adversely impact the results of operations of both businesses, or the companies resulting from the separation of Mobility not realizing all of the expected benefits of the separation; andfollowing the separation of Mobility, the combined value of the common stock of the two publicly-traded companies not being equal to or greater than the value of the Company's common stock had the separation not occurred.The factors noted above are not exhaustive. The Company and its subsidiaries operate in a dynamic business environment in which new risks emerge frequently. Accordingly, the Company cautions readers not to place undue reliance on any forward-looking statements, which speak only as of the dates on which they are made. The Company undertakes no obligation to update or revise any forward-looking statement to reflect events or circumstances arising after the date on which it is made, except as required by applicable law. Further information about the Company's businesses, including information about factors that could materially affect its results of operations and financial condition, is contained in the Company's filings with the SEC, including Item 1A, Risk Factors in our most recently filed Annual Report on Form 10-K. View original content:https://www.prnewswire.com/news-releases/sp-global-announces-public-filing-of-form-10-registration-statement-for-planned-separation-of-mobility-global-302766252.htmlSOURCE S&P Global Original: S&P Global Announces Public Filing of Form 10 Registration Statement for Planned Separation of Mobility Global
US Market News
2月前
S&P Global Energy Expands Cement, Clinker and SCM Price Assessment Coverage to Meet Demand from Global Construction and Decarbonisation MarketsMay 7, 2026 4:30 AM
PR Newswire (US) Sixteen new Platts price assessments strengthen transparency across Europe, Asia and the AmericasNEW YORK and LONDON and SINGAPORE, May 7, 2026 /PRNewswire/ -- S&P Global Energy, the leading independent provider of information, data, analysis, benchmark prices and workflow solutions for the commodities, energy expansion and energy transition markets, today announced the launch of 16 new Platts cement, clinker, granulated blast furnace slag (GBFS) and related freight price assessments, effective May 7. The expanded coverage is designed to bring greater price transparency across key regional markets in Europe, the Middle East and Africa, Asia, and the Americas, supporting informed decision–making across the cement and construction value chain. Global cement and construction supply chains are entering a period of profound change, shaped by rising infrastructure demand, evolving trade flows, and increasing pressure to decarbonise one of the world's most emissions–intensive industries. Urbanisation, energy transition investments, and large–scale infrastructure projects are driving sustained demand for cement and concrete across transportation, energy, housing, and industrial development. At the same time, producers, traders, and consumers are navigating tighter environmental requirements, emerging carbon–pricing frameworks, and greater scrutiny over the carbon content of traded materials."As infrastructure investment expands and decarbonisation policy and commitments reshape trade flows, access to robust, market–reflective price information is becoming increasingly critical for cement market participants," said Vera Blei, Head of S&P Global Energy Platts. "These new assessments further extend the transparency Platts brings to physical spot markets, supporting customers as they navigate changing cost structures and supply chains, as well as sustainability commitments."Cement, with an estimated market value of around $400 billion, is the principal ingredient in concrete — the world's second–most consumed product after water — and a cornerstone of global economic development. Clinker, produced through energy–intensive kiln processes, is a critical intermediate in cement manufacturing, particularly for Portland cement, the most widely used cement type worldwide. As trade in cement and clinker continues to grow across borders, robust market–based price references are becoming increasingly important.Of the 16 new assessments, eight focus on Europe, the Middle East and Africa, five on Asia, and three on the Americas, reflecting both established and emerging trade corridors. The launch follows extensive engagement with market participants and responds to growing demand for consistent, transparent price signals across spot physical cement and cementitious materials markets.The expansion comes at a time when cement and related supply chains are being reshaped by two reinforcing global trends:Growing infrastructure and construction demand
Growth across major economies, public and private investment in infrastructure — spanning transport networks, energy systems, housing, and commercial development — is underpinning steady demand for cement and concrete. As projects scale in size and complexity, market participants are seeking clearer, regionally relevant price references to support procurement decisions, budgeting, contract negotiations, and risk management across different supply routes.Decarbonisation policy and carbon–accounting requirements
Cement producers are increasingly required to lower the carbon intensity of their production, driven by corporate sustainability commitments and regulations such as the EU's Carbon Border Adjustment Mechanism (CBAM). CBAM is intended to apply a carbon cost to certain imported goods, reinforcing the need for transparency around emissions exposure in international trade. Clinker production accounts for a substantial share of cement–related emissions, given its reliance on high–temperature kilns often fuelled by coal or petroleum coke. As a result, there is growing interest in blended cements and supplementary cementitious materials such as GBFS, which can help reduce clinker content and emissions intensity. This shift is increasing focus not only on cement and clinker prices, but also on the availability, pricing and freight economics of clinker substitutes and blending materials.Major producers of cement and cementitious materials - including China, India, Vietnam, the United States, Turkey, Iran, Brazil, Indonesia, Russia, and South Korea — are also among the world's largest consumers, reinforcing the importance of transparent pricing across domestic and international markets.For more information, scan the QR code to follow us on WhatsApp for daily market updates on Cement with Platts, part of S&P Global Energy.Media Contacts ??
Americas/EMEA: Kathleen Tanzy?+1 917-331-4607,?kathleen.tanzy @,?melissa.tan@spglobal.comAbout S&P Global Energy
At S&P Global Energy, our comprehensive view of global energy and commodities markets enables our customers to make superior decisions and create long-term, sustainable value. Our four core capabilities are: Platts for pricing and news; CERA for research and advisory; Horizons for energy expansion and sustainability solutions; and Events for industry collaboration.S&P Global Energy is a division of S&P Global (NYSE: SPGI). S&P Global enables businesses, governments, and individuals with trusted data, expertise, and technology to make decisions with conviction. We are Advancing Essential Intelligence through world-leading benchmarks, data, and insights that customers need in order to plan confidently, act decisively, and thrive in a rapidly changing global landscape. Learn more at www.spglobal.com/energy View original content to download multimedia:https://www.prnewswire.com/news-releases/sp-global-energy-expands-cement-clinker-and-scm-price-assessment-coverage-to-meet-demand-from-global-construction-and-decarbonisation-markets-302765359.htmlSOURCE S&P Global Energy Original: S&P Global Energy Expands Cement, Clinker and SCM Price Assessment Coverage to Meet Demand from Global Construction and Decarbonisation Markets
US Market News
2月前
CARFAX Launches Homegrown™ Badge for Vehicles Consistently Cared for by One DealershipMay 6, 2026 9:00 AM
PR Newswire (US) New golden badge helps shoppers find vehicles sold new and serviced at the same dealership CENTREVILLE, Va., May 6, 2026 /PRNewswire/ -- CARFAX is making it easier for car shoppers to find vehicles that a single dealership has known since Day 1. The new CARFAX Homegrown™ badge that appears on eligible CARFAX Reports, signals that a specific vehicle was sold new and received consistent care from the same dealership. These CARFAX Homegrown™ vehicles can offer greater long-term reliability and value, helping shoppers feel more confident in their buying, shopping, selling, and trade-in process."The CARFAX Homegrown™ badge on a CARFAX Report means this is a used car the dealer knows personally," said Paul Nadjarian, Chief Product Officer at CARFAX. "These vehicles have been serviced time and time again at the same dealership, which often reflects a higher level of care and familiarity. That can make a real difference for the next owner." According to CARFAX data, CARFAX Homegrown™ vehicles, which are typically maintained by the same technicians, command higher value and often sell more quickly. CARFAX Lifetime Dealers, who are committed to transparency and long-term care for their customers, have played a key role in making these insights possible. Their participation provides shoppers with access to detailed vehicle history information when they shop for a new vehicle.CARFAX Lifetime Dealers support consumers across three key areas:CARFAX Reports (CARFAX Advantage): Comprehensive accident and service records help buyers make more informed decisions.CARFAX Car Listings: New and used vehicle listings all come with a free CARFAX Report, making it easier for shoppers to compare options before visiting a dealership.CARFAX Car Care (CARFAX for Life): Consumers can stay connected with their preferred dealerships throughout the lifetime of the vehicle. More than 53 million users in the U.S. receive free timely maintenance reminders from the CARFAX Car Care app.CARFAX Lifetime Dealer Blaine Birner, Sales Manager at Gillman Subaru North, said introducing CARFAX into conversations with consumers immediately changes the energy on the floor. "The more [the customer] understood the history, the more comfortable he became. It wasn't just about picking a car anymore—it was about feeling sure. He ended up choosing a vehicle he felt genuinely good about," said Birner. "A few months later, [the customer] came back… just for a routine service. He mentioned how helpful it had been to keep track of everything through CARFAX for Life."With a database powered by more than 177,000 sources and more than 38 billion records, CARFAX delivers trusted insights to millions of people, supporting smarter decisions at every stage of the vehicle journey.About CARFAXCARFAX, part of S&P Global Mobility, helps millions of people every day confidently shop, buy, service, and sell cars with innovative solutions powered by CARFAX® vehicle history information. The expert in vehicle history since 1984, CARFAX provides CARFAX Car Listings, CARFAX Car Care, CARFAX History-Based Value , and the flagship CARFAX Vehicle History Report to consumers and the automotive industry. CARFAX owns the world's largest vehicle history database and is nationally recognized as a top workplace by The Washington Post. Shop, Buy, Service, Sell – Show me the CARFAX®.S&P Global Mobility is a division of S&P Global (NYSE: SPGI). S&P Global is the world's foremost provider of credit ratings, benchmarks, analytics, and workflow solutions in the global capital, commodity, and automotive markets. View original content to download multimedia:https://www.prnewswire.com/news-releases/carfax-launches-homegrown-badge-for-vehicles-consistently-cared-for-by-one-dealership-302763565.htmlSOURCE CARFAX Original: CARFAX Launches Homegrown™ Badge for Vehicles Consistently Cared for by One Dealership
US Market News
2月前
Nominations Open for Platts Global Energy Awards 2026April 29, 2026 4:40 AM
PR Newswire (US)
Call for nominations across range of 19 categories celebrating industry excellence,
innovation and impactNEW YORK, April 29, 2026 /PRNewswire/ -- S&P Global Energy, the leading independent provider of information, data, analysis, benchmark prices and workflow solutions for the commodities, energy expansion and energy transition markets, today announced the call for nominations for the Platts Global Energy Awards program, now in its 28th year. Nominations will close on July 1, 2026, and finalists will be announced on the Awards website on September 1, 2026.
"We are proud to open nominations to recognize excellence in energy through our 2026 Platts Global Energy Awards that spotlight exemplary leadership across companies, initiatives and individual performance that advance energy security, resilience in decarbonization progress, technology, community impact and more," said Lyn Tattum, Vice President, Head of Conferences, Training & Strategic Media, S&P Global Energy. "Steering a course for the energy of the future is no small feat amid ongoing transformation, surging AI-driven energy demand, and an increasingly complex global environment".Often described as "the Oscars of the energy industry," the Platts Global Energy Awards program recognizes corporate and individual innovation, leadership, and exemplary performance across a range of 19 categories. The categories include Upstream, Midstream, Downstream, Liquefied Natural Gas, Power, Chemicals, Finance as well as corporate awards such as Infrastructure Project of the Year, Energy Deal of the Year, Energy Company of the Year and also personal awards for Rising Star Individual, Lifetime Achievement, Chief Executive of the Year, and more.The judging process will rely on the expertise of an impartial panel of international energy experts whose background and experience include regulation, policymaking, corporate leadership, trading, and strategic consulting. The judges evaluate the finalists based on the criteria listed for each category, taking into consideration, where appropriate, company profiles and financial performance in the designated timeframe. The winners are then selected by the independent panel of judges and will be announced at a black-tie awards ceremony on December 3, 2026 in New York City. Neither S&P Global Energy nor its event sponsors submit votes or select winners.For information on event sponsorships, contact Oliver Sawyer or Ashley Matthews Greenleaf at: oliver.sawyer@spglobal.com or telephone 07483922681, and ashley.greenleaf @Outlawbabe2-8174, respectively. Access the full list of nomination categories and event details at the Platts Global Energy Awards website. Media Contacts ??
Americas/EMEA: Kathleen Tanzy?+1 917-331-4607,?kathleen.tanzy@spglobal.com ??
Asia/EMEA: Melissa Tan +65-81897569,?melissa.tan@spglobal.comAbout S&P Global Energy
At S&P Global Energy, our comprehensive view of global energy and commodities markets enables our customers to make superior decisions and create long-term, sustainable value. Our four core capabilities are: Platts for pricing and news; CERA for research and advisory; Horizons for energy expansion and sustainability solutions; and Events for industry collaboration.S&P Global Energy is a division of S&P Global (NYSE: SPGI). S&P Global enables businesses, governments, and individuals with trusted data, expertise, and technology to make decisions with conviction. We are Advancing Essential Intelligence through world-leading benchmarks, data, and insights that customers need in order to plan confidently, act decisively, and thrive in a rapidly changing global landscape. Learn more at www.spglobal.com/energy
View original content to download multimedia:https://www.prnewswire.com/news-releases/nominations-open-for-platts-global-energy-awards-2026-302756972.htmlSOURCE S&P Global Energy
Original: Nominations Open for Platts Global Energy Awards 2026
US Market News
2月前
S&P Cotality Case-Shiller Index Reports Annual Gain in February 2026April 28, 2026 10:57 AM
PR Newswire (US)
The S&P Cotality Case-Shiller U.S. National Home Price NSA Index posted a 0.7% annual gain for February 2026, down from a 0.8% rise in the previous month.More than half of major U.S. metropolitan markets posted year-over-year price declines in February, with Denver (-2.2%) displacing Tampa as the weakest market and Los Angeles and Washington joining the list of decliners.For the ninth consecutive month, inflation outpaced national home price appreciation. CPI ran 1.7 percentage points above the 0.7% annual gain, extending the streak of negative real home price returns.NEW YORK, April 28, 2026 /PRNewswire/ -- S&P Dow Jones Indices (S&P DJI) today released the February 2026 results for the S&P Cotality Case-Shiller Indices.More than 27 years of history are available for the data series and can be accessed in full by going to www.spglobal.com/spdji/en/index-family/indicators/sp-Cotality-case-shiller.Cotality continues to have transaction delays from the recording office in Wayne County, the most populous county in the Detroit metro area. These delays impacted the February transaction data and, therefore, no valid February 2026 update of the Detroit S&P Cotality Case-Shiller Index will be provided for the April 28, 2026, release date. There was, however, enough data to calculate a valid January 2026 update, which is provided in Tables 2 and 3.S&P DJI will continue to provide updates to the Detroit index values for the month(s) with missing sale transactions data.ANALYSIS"More than half of major U.S. metropolitan markets posted year-over-year price declines in February, signaling that the housing slowdown has broadened well beyond its Sun Belt origins," said Nicholas Godec, CFA, CAIA, CIPM, Head of Fixed Income Tradables & Commodities at S&P Dow Jones Indices. "The S&P Cotality Case-Shiller National Home Price Index rose just 0.7% year over year in February, down from 0.8% in January. With consumer inflation at 2.4%, U.S. home values have lost ground in real terms for nine consecutive months."The geographic mix has shifted meaningfully," Godec continued. "Mountain West (Denver -2.2%) and Pacific Northwest (Seattle -2.0%) markets now sit alongside Sun Belt decliners Tampa (-2.1%), Phoenix (-1.8%), and Dallas (-1.7%). Los Angeles (-0.8%) and Washington (-0.1%) joined the list of decliners, while Tampa's decline narrowed for a fourth consecutive month and Denver displaced it as the weakest market in the index."Leadership remains concentrated in Midwest and Northeast markets. Chicago led all metros at 5.0% annual growth, followed by New York (4.7%) and Cleveland (4.2%) — the same trio that has anchored this cycle's leadership. The 7.2 percentage point spread between Chicago and Denver illustrates how localized the housing story has become."Monthly data offered a modest seasonal lift without underlying momentum," Godec concluded. "The National Index rose 0.3% before seasonal adjustment, but after adjustment the National and 10-City Composites were essentially flat at 0.1% and the 20-City Composite slipped 0.1%. The H1/H2 split reinforces the picture: a 1.5% gain over the first six months of the trailing 12 gave way to a 0.8% decline over the most recent six. Mortgage rates near 6% continue to weigh on affordability and transaction activity, holding nominal price growth below inflation."YEAR-OVER-YEARThe S&P Cotality Case-Shiller U.S. National Home Price NSA Index, covering all nine U.S. census divisions, reported a 0.7% annual gain for February. The 10-City Composite saw an annual increase of 1.5%, down from a 1.7% increase in the previous month. The 20-City Composite posted a year-over-year increase of 0.9%, down from a 1.2% rise in the previous month.Chicago reported the highest annual gain among the 20 cities with a 5.0% increase in February, followed by New York and Cleveland with annual increases of 4.7% and 4.2%, respectively. Denver posted the lowest return in February, falling 2.2%.MONTH-OVER-MONTHThe pre-seasonally adjusted U.S. National, 10-City Composite, and 20-City Composite Indices recorded annual gains of 0.3%, 0.6%, and 0.4%, respectively.After seasonal adjustment, the U.S. National and 10-City Composite Indices reported a monthly increase of 0.1%. In contrast, the 20-City Composite Index had a decrease of 0.05%.SUPPORTING DATAThe S&P Cotality Case-Shiller U.S. National Home Price NSA Index, which covers all nine U.S. census divisions, recorded a 0.7% annual increase in February 2026. The 10-City and 20-City Composites reported year-over-year increases of 1.5% and 0.9%, respectively.Table 1 below shows the housing boom/bust peaks and troughs for the three composites along with the current levels and percentage changes from the peaks and troughs.
2022 Peak2023 TroughCurrentIndexLevelDateLevelDateFrom
Peak (%)LevelFrom Trough (%)From
Peak (%)National308.07Jun-22292.70Jan-23-5.0 %327.3111.8 %6.2 %20-City318.73Jun-22297.47Jan-23-6.7 %338.1513.7 %6.1 %10-City330.38Jun-22309.92Jan-23-6.2 %359.5416.0 %8.8 %
Table 2 below summarizes the results for February 2026. The S&P Cotality Case-Shiller Indices could be revised for the prior 24 months, based on the receipt of additional source data.Metropolitan
AreaFebruary
2026 LevelFebruary / January Change (%)January '26 / December '25
Change (%)1-Year Change
(%)
Atlanta246.120.22 %-0.47 %-0.29 %
Boston343.76-0.15 %-0.07 %0.81 %
Charlotte282.17-0.11 %0.23 %0.98 %
Chicago223.111.04 %-0.21 %5.04 %
Cleveland201.330.95 %-0.35 %4.15 %
Dallas289.04-0.15 %-0.40 %-1.74 %
Denver309.530.48 %-0.15 %-2.18 %
Detroit-----0.84 %--
Las Vegas297.37-0.06 %-0.06 %-1.09 %
Los Angeles441.500.52 %-0.05 %-0.84 %
Miami441.220.55 %0.46 %-0.03 %
Minneapolis244.22-0.25 %-0.36 %2.10 %
New York City336.170.33 %-0.05 %4.74 %
Phoenix324.28-0.12 %0.06 %-1.78 %
Portland326.230.64 %-0.23 %-0.86 %
San Diego442.131.00 %-0.29 %0.53 %
San Francisco356.331.90 %-0.24 %-0.30 %
Seattle383.480.19 %-0.59 %-2.03 %
Tampa366.650.20 %-0.27 %-2.06 %
Washington331.750.35 %0.07 %-0.13 %
Composite-10359.540.58 %-0.05 %1.46 %
Composite-20338.150.44 %-0.14 %0.90 %
U.S. National327.310.29 %-0.18 %0.67 %
Sources: S&P Dow Jones Indices and Cotality Data through February 2026
Table 3 below shows a summary of the monthly changes using the seasonally adjusted (SA) and non-seasonally adjusted (NSA) data. Since its launch in early 2006, the S&P Cotality Case-Shiller Indices have published, and the markets have followed and reported on, the non-seasonally adjusted data set used in the headline indices. For analytical purposes, S&P Dow Jones Indices publishes a seasonally adjusted data set covered in the headline indices, as well as for the 17 of 20 markets with tiered price indices and the five condo markets that are tracked.
February / January Change (%)January '26 / December '25 Change (%)Metropolitan AreaNSASANSASAAtlanta0.22 %0.08 %-0.47 %0.04 %Boston-0.15 %-0.24 %-0.07 %0.36 %Charlotte-0.11 %0.07 %0.23 %0.70 %Chicago1.04 %0.85 %-0.21 %0.37 %Cleveland0.95 %0.99 %-0.35 %0.50 %Dallas-0.15 %-0.48 %-0.40 %0.13 %Denver0.48 %-0.34 %-0.15 %-0.02 %Detroit-----0.84 %-0.07 %Las Vegas-0.06 %0.01 %-0.06 %0.44 %Los Angeles0.52 %-0.31 %-0.05 %0.12 %Miami0.55 %0.76 %0.46 %0.74 %Minneapolis-0.25 %-0.35 %-0.36 %0.16 %New York City0.33 %0.61 %-0.05 %0.48 %Phoenix-0.12 %-0.35 %0.06 %0.39 %Portland0.64 %-0.11 %-0.23 %0.08 %San Diego1.00 %-0.31 %-0.29 %-0.50 %San Francisco1.90 %0.15 %-0.24 %-0.02 %Seattle0.19 %-1.18 %-0.59 %-0.30 %Tampa0.20 %0.34 %-0.27 %0.23 %Washington0.35 %-0.06 %0.07 %0.27 %Composite-100.58 %0.07 %-0.05 %0.24 %Composite-200.44 %-0.05 %-0.14 %0.20 %U.S. National0.29 %0.09 %-0.18 %0.16 %Sources: S&P Dow Jones Indices and Cotality Data through February 2026
ABOUT S&P DOW JONES INDICESS&P Dow Jones Indices is the largest global resource for essential index-based concepts, data and research, and home to iconic financial market indicators, such as the S&P 500® and the Dow Jones Industrial Average®. More assets are invested in products based on our indices than products based on indices from any other provider in the world. Since Charles Dow invented the first index in 1884, S&P DJI has been innovating and developing indices across the spectrum of asset classes helping to define the way investors measure and trade the markets.S&P Dow Jones Indices is a division of S&P Global (NYSE: SPGI), which provides essential intelligence for individuals, companies, and governments to make decisions with confidence. For more information, visit www.spglobal.com/spdji.FOR MORE INFORMATION:Lemuel Brewster
Americas Communications
(+1) 917 805 1089
lemuel.brewster@spglobal.comS&P Dow Jones Indices' interactive blog, IndexologyBlog.com, delivers real-time commentary and analysis from industry experts across S&P Global on a wide range of topics impacting residential home prices, homebuilding and mortgage financing in the United States. Readers and viewers can visit the blog at www.indexologyblog.com, where feedback and commentary are welcomed and encouraged.The S&P Cotality Case-Shiller Indices are published on the last Tuesday of each month at 9:00 am ET. They are constructed to accurately track the price path of typical single-family homes located in each metropolitan area provided. Each index combines matched price pairs for thousands of individual houses from the available universe of arms-length sales data. The S&P Cotality Case-Shiller U.S. National Home Price Index tracks the value of single-family housing within the United States. The index is a composite of single-family home price indices for the nine U.S. Census divisions and is calculated quarterly. The S&P Cotality Case-Shiller 10-City Composite Home Price Index is a value-weighted average of the 10 original metro area indices. The S&P Cotality Case-Shiller 20-City Composite Home Price Index is a value-weighted average of the 20 metro area indices. The indices have a base value of 100 in January 2000; thus, for example, a current index value of 150 translates to a 50% appreciation rate since January 2000 for a typical home located within the subject market.These indices are generated and published under agreements between S&P Dow Jones Indices and Cotality, Inc.The S&P Cotality Case-Shiller Indices are produced by Cotality, Inc. In addition to the S&P Cotality Case-Shiller Indices, Cotality also offers home price index sets covering thousands of zip codes, counties, metro areas, and state markets. The indices, published by S&P Dow Jones Indices, represent just a small subset of the broader data available through Cotality.Case-Shiller® and Cotality® are trademarks of Cotality Case-Shiller, LLC or its affiliates or subsidiaries ("Cotality") and have been licensed for use by S&P Dow Jones Indices. None of the financial products based on indices produced by Cotality or its predecessors in interest are sponsored, sold, or promoted by Cotality, and neither Cotality nor any of its affiliates, subsidiaries, or predecessors in interest makes any representation regarding the advisability of investing in such products.
View original content:https://www.prnewswire.com/news-releases/sp-cotality-case-shiller-index-reports-annual-gain-in-february-2026-302755887.htmlSOURCE S&P Dow Jones Indices
Original: S&P Cotality Case-Shiller Index Reports Annual Gain in February 2026
 Hot Features

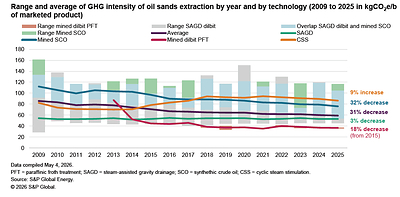


 メールアドレスで登録


