US Market News
4日前
US Market News
4日前
IBM to Appoint Omnicom Media as Global Media Agency of RecordJune 29, 2026 10:15 AM
PR Newswire (US) NEW YORK, June 29, 2026 /PRNewswire/ -- Omnicom Media, an Omnicom (NYSE: OMC) Connected Capability, today announced it will be named global media agency of record for IBM following a competitive review. The appointment includes media planning and buying responsibilities across the Americas, EMEA, Japan and APAC regions. The decision expands an existing relationship between IBM and Omnicom Media in EMEA, awarded in January 2025.The decision underscores Omnicom's strength in seamlessly integrating global and local markets, its deep B2B audience expertise, and its leadership in AI, automation, and performance-led media strategy and execution."IBM is working side-by-side with clients around the world, co-creating innovative technology and AI solutions that address their most complex challenges. To be successful, we need agency partners who understand our business, our ambitions, and the needs of the clients we serve," said Jonathan Adashek, Senior Vice President of Marketing and Communications at IBM. "Omnicom Media brings a globally integrated approach and a deep appreciation for how data, technology, and creativity come together at scale. That alignment gives us confidence in their ability to build more connected, relevant experiences that support IBM's long-term growth."Omnicom Media Chief Client Success Officer Guy Marks added, "We share IBM's belief that innovation is most powerful when it is applied to solve real business challenges. Together, we have an opportunity to build a more intelligent, agile and integrated media ecosystem powered by data, automation and emerging technologies that can drive measurable impact across markets."Omnicom Media's appointment is effective July 1.ABOUT OMNICOM MEDIAOmnicom Media, an Omnicom (NYSE: OMC) Connected Capability, is the world's largest global media management network. Powered by the Omni Intelligence Platform, Omnicom Media agencies leverage $75.6 billion in billings, 40,000+ specialists across 70+ markets, and the industry's most powerful portfolio identity, commerce, and intelligence assets to design dynamic Growth Ecosystems that enable the world's most ambitious businesses to grow faster and smarter. The Omnicom Media portfolio includes global media agency brands OMD, Initiative, PHD, UM, Hearts & Science, and Mediahub; core Omnicom Integrated Media offerings Acxiom, the world's premier identity solution, and the Flywheel digital commerce practice; and specialty services across the cloud consulting, creator, financial, healthcare, and sports & entertainment categories. For more information visit omnicommedia.com.CONTACT: Isabelle Gauvry, isabelle.gauvry@omc.com View original content to download multimedia:https://www.prnewswire.com/news-releases/ibm-to-appoint-omnicom-media-as-global-media-agency-of-record-302813180.htmlSOURCE Omnicom Media Original: IBM to Appoint Omnicom Media as Global Media Agency of Record
US Market News
1週前
OMNICOM MEDIA AND NBCUNIVERSAL LAUNCH DYNAMIC CONTEXTUAL ADVERTISING SOLUTION TO REDEFINE CREATIVE PERFORMANCE IN CTVJune 25, 2026 1:30 PM
PR Newswire (US) New Solution Combines AI-Powered Creative Optimization In-Flight with Contextual Signals to Deliver More Relevant Advertising Experiences Across Streaming EnvironmentsAnnouncement Wraps Omnicom Media's Cannes News Blitz Revealing First-Mover Partnerships That Connect Brand Content to Platform Programming, Viewing Experiences and Consumer ExpectationsCANNES, France, June 25, 2026 /PRNewswire/ -- Omnicom Media, an Omnicom (NYSE: OMC) connected capability, and NBCUniversal have co-developed a new solution to bring greater contextual intelligence and creative relevance to CTV advertising. The initiative combines audience and performance data from Omnicom's Acxiom identity solution with NBCUniversal's contextual signals to power Dynamic Contextual Content (DCC), a new approach to CTV advertising that aligns tailored creative messaging with specific episodes and environments in-flight. The initiative is designed to help brands develop adaptive creative experiences tailored to how consumers engage with streaming content in real time. By pairing contextual signals with AI-powered creative production and optimization, the companies are creating a more intelligent, self-optimizing CTV system that enables brands to rethink how creative performance is measured and delivered.For example, a travel brand could run a connected TV campaign across NBCUniversal programming tied to summer travel planning. Based on contextual signals combined with real-time engagement data, the travel brand could adapt its creative mid-flight based on the more optimally performing content environment.The DCC solution grew out of Omnicom Media's Connected Content study, which examined consumer sentiment around the current state of advertising and explored the factors that drive engagement across content and delivery experiences. The research found that while streaming environments have evolved rapidly, creative formats and delivery systems have not kept pace with how audiences actually experience CTV content today."Consumers expect advertising to feel more connected to the experience they are having in the moment," said Megan Pagliuca, Chief Product Officer at Omnicom Media. "Today, even premium CTV advertising is often delivered without consideration for the context surrounding it. Through this collaboration with NBCUniversal, we are bringing together data, content intelligence, and AI-powered creative capabilities to help brands move from simply reaching audiences to delivering relevance within the moments that matter most."How It WorksAcxiom audience data is paired with NBCUniversal content metadata to identify priority shows, episodes, environments, and moments. Advertisers can then map tailored creative variants - enabled by the Omnicom Production AI-driven content and production engine - to the content moments where they are expected to resonate most strongly with their specific audiences, moving from fixed creative assets to in-flight creative optimization. Creative versioning is informed by performance measurement and integrated into Omni's Video Content. With this integration, brands understand which combination of contextual tags and creative versions are driving business objectives."Marketers are navigating a fragmented, highly competitive ecosystem while being held to performance metrics," said Ryan McConville, Chief Product Officer and EVP, Ad Products & Solutions, NBCUniversal. "By pairing NBCUniversal's content metadata with Omnicom's audience and performance data, we can make creative optimization actionable and open up more relevant, effective ways for brands to engage their customers."The collaboration reflects a broader shift in the streaming marketplace, where marketers are increasingly focused not only on reaching audiences at scale, but also on improving the quality and contextual relevance of each advertising exposure.The Dynamic Contextual Content solution is currently in beta and is expected to be live in the US by end of year.CONTACT: isabelle.gauvry@omc.comAbout Omnicom Media
Omnicom Media, an Omnicom (NYSE: OMC) Connected Capability, is the world's largest global media management network. Powered by the Omni Intelligence Platform, Omnicom Media agencies leverage $75.6 billion in billings, 40,000+ specialists across 70+ markets, and the industry's most powerful portfolio identity, commerce, and intelligence assets to design dynamic Growth Ecosystems that enable the world's most ambitious businesses to grow faster and smarter. The Omnicom Media portfolio includes global media agency brands OMD, Initiative, PHD, UM, Hearts & Science, and Mediahub; core Omnicom Integrated Media offerings Acxiom, the world's premier identity solution, and the Flywheel digital commerce practice; and specialty services across the cloud consulting, creator, financial, healthcare, and sports & entertainment categories. For more information visit omnicommedia.com View original content to download multimedia:https://www.prnewswire.com/news-releases/omnicom-media-and-nbcuniversal-launch-dynamic-contextual-advertising-solution-to-redefine-creative-performance-in-ctv-302810797.htmlSOURCE Omnicom Media Original: OMNICOM MEDIA AND NBCUNIVERSAL LAUNCH DYNAMIC CONTEXTUAL ADVERTISING SOLUTION TO REDEFINE CREATIVE PERFORMANCE IN CTV
US Market News
1週前
OMNICOM MEDIA AND PARAMOUNT INTRODUCE DYNAMIC STREAMING FIXED AD UNIT TO POWER PERSONALIZED STORYTELLING ACROSS PREMIERE WEEK PROGRAMMINGJune 24, 2026 12:00 PM
PR Newswire (US) First-To-Market Capability Combines Premium Streaming Inventory, Audience Intelligence and Sequential Creative to Help Brands Move Beyond the One Size Fits All Ad ExperienceAnnouncement Marks Day 3 of Omnicom Media's Cannes News Blitz Revealing First-Mover Partnerships That Connect Content to Platform Programming, Viewing Experiences and Consumer ExpectationsCANNES, France, June 24, 2026 /PRNewswire/ -- Omnicom Media, an Omnicom (NYSE: OMC) Connected Capability, and Paramount today announced a new collaboration to enhance Paramount's Streaming Fixed Units, which delivers high-impact guaranteed placements during the first seven days of new episode premieres for Paramount's biggest series. Through this collaboration, Paramount and Omnicom will transform the ad format from a fixed creative execution into an adaptive, intelligent, and contextually responsive advertising environment – designed to create a more dynamic and personalized experience for audiences and brand marketers. Omnicom's audience intelligence and measurement infrastructure will combine with Paramount's premium streaming inventory to adapt a brand's creative messaging based on audience, location, or other relevant information. Advertisers can also guide viewers through a progressive narrative arc, optimized for smarter storytelling with each subsequent touchpoint delivering the next chapter of a campaign. Messaging is frequency capped and sequenced to create a more intentional consumer engagement while preserving scale and enabling measurement.The collaboration was developed in response to findings from Omnicom Media's Connected Content study, which examined consumer sentiment around the current advertising landscape and explored the factors that drive engagement across both content and delivery experiences. The research found that audiences are increasingly receptive to advertising experiences that feel relevant, intentional, and connected rather than repetitive."This solution is about bringing intelligence and narrative progression to one of streaming's most valuable ad formats," said Megan Pagliuca, Chief Product Officer, Omnicom Media. "Consumers have made it clear that repetitive, advertising diminishes engagement. By combining premium streaming inventory with audience intelligence and sequential storytelling, we are creating a model that allows brands to build momentum and relevance with audiences over time rather than restarting the conversation with every impression.""Streaming has created enormous opportunities for premium storytelling, and advertisers are looking for ways to make those moments work harder," said Leo O'Conner, Executive Vice President, Digital & Streaming, Paramount Advertising. "Together with Omnicom Media, we are evolving Streaming Fixed Units into a smarter, more adaptive advertising experience that combines the impact of premiere programming with the precision and accountability marketers increasingly expect."The capability is currently in beta tests with several Omnicom Media clients, including Volkswagen of America and Princess Cruises."We have been chasing relevance and creative storytelling at scale in streaming environments for years. What makes this approach compelling is the ability to turn a high-impact premiere placement into the beginning of a connected, multiple exposure consumer journey. It creates the potential for us to more intentionally and effectively engage our target audience and make each impression more purposeful." Nick Charrow, Director of Media for beta-test participant Princess CruisesHow It WorksUnder the new solution, audience intelligence from Omnicom's Acxiom identity platform is integrated into Paramount's streaming environment to inform real-time creative decisioning of the Streaming Fixed Units during the seven-day premiere window. Viewers exposed to the initial ad are then entered into a retargeting pool, allowing brands to deliver sequenced creative messaging enabled- by the Omnicom Production AI-driven content and production engine - throughout the remainder of the campaign window.The initiative also creates new opportunities for advertisers to connect the creative experience in streaming to measurable business outcomes. Through Omni Video Content, in partnership with VideoAmp, brands can connect business objectives, including downstream search and conversion activity, to Streaming Fixed Unit creative versions. Brands will also be able to extend sequential storytelling across multiple premiere events, creating larger connected narratives personalized to different audience segments.The solution is expected to be fully live in the US for Omnicom clients in Q3, and internationally by Q1 2027CONTACT: isabelle.gauvry@omc.comAbout Omnicom Media
Omnicom Media, an Omnicom (NYSE: OMC) Connected Capability, is the world's largest global media management network. Powered by the Omni Intelligence Platform, Omnicom Media agencies leverage $75.6 billion in billings, 40,000+ specialists across 70+ markets, and the industry's most powerful portfolio identity, commerce, and intelligence assets to design dynamic Growth Ecosystems that enable the world's most ambitious businesses to grow faster and smarter. The Omnicom Media portfolio includes global media agency brands OMD, Initiative, PHD, UM, Hearts & Science, and Mediahub; core Omnicom Integrated Media offerings Acxiom, the world's premier identity solution, and the Flywheel digital commerce practice; and specialty services across the cloud consulting, creator, financial, healthcare, and sports & entertainment categories. For more information visit omnicommedia.comAbout Paramount, a Skydance Corporation
Paramount, a Skydance Corporation (Nasdaq: PSKY) is a leading, next-generation global media and entertainment company, comprised of three business segments: Studios, Direct-to-Consumer, and TV Media. The Company's portfolio unites legendary brands, including Paramount Pictures, Paramount Television, CBS, CBS News, CBS Sports, Nickelodeon, MTV, BET, Comedy Central, SHOWTIME®, Paramount+, Pluto TV, Skydance Animation, Film, Television, and Interactive/Games, and the newly established Paramount Sports Entertainment. For more information, please visit www.paramount.com. View original content to download multimedia:https://www.prnewswire.com/news-releases/omnicom-media-and-paramount-introduce-dynamic-streaming-fixed-ad-unit-to-power-personalized-storytelling-across-premiere-week-programming-302808939.htmlSOURCE Omnicom Media Original: OMNICOM MEDIA AND PARAMOUNT INTRODUCE DYNAMIC STREAMING FIXED AD UNIT TO POWER PERSONALIZED STORYTELLING ACROSS PREMIERE WEEK PROGRAMMING
US Market News
1週前
OMNICOM AND DISNEY ADVERTISING TEAM UP TO ENABLE SMARTER SEQUENTIAL ADVERTISING IN STREAMINGJune 23, 2026 1:30 PM
PR Newswire (US) Innovative Solution Reduces Ad Repetition, Improves Personalization
Across Both VOD and Live Sports & EntertainmentAnnouncement continues Omnicom Media's Cannes News Blitz Revealing First-Mover Collaborations That Connect Brand Content to Platform Programming, Viewing Experiences and Consumer ExpectationsCANNES, France, June 23, 2026 /PRNewswire/ -- Omnicom Media, an Omnicom (NYSE: OMC) Connected Capability, and Disney Advertising are collaborating on a new CTV advertising solution - powered by Innovid, and enabled by Omnicom - that can trigger dynamic delivery of new advertising content in both video on demand and live sports & entertainment experiences that both reduces ad repetition and improves personalization. Through this collaboration, Omnicom Media and Disney Advertising are meeting consumer expectations by enabling smarter frequency management and sequential storytelling that delivers the right message at the right moment and stronger outcomes for marketers.The solution grew out of findings from two recent studies from Omnicom Media Intelligence. With "Why Frequency Matters: Combating Negative Reach," OM revealed that while overexposure to the same ad created "negative reach" – the point at which repeated impressions frustrate consumers and damage brand perception, consumers did not have an issue with seeing ads from the same brand with different creative executions. These findings were further validated in its latest report - "Connected Content" – in which OM examined consumer sentiment around the state of advertising and explored what drives engagement across content and delivery experiences. When asked how they would improve advertising, approximately half of all respondents cited "less repetition" as a primary way that advertising needs to improve."Omnicom Media and Disney Advertising are helping brands get better outcomes from their investment in premium streaming content and live sports & entertainment," said Omnicom Media Chief Product Officer Megan Pagliuca. "Instead of the risk of consumers seeing the same message over and over, advertisers can now move beyond the repetitive cycle with dynamic delivery of sequential storytelling that advances the customer journey." How It Works By understanding audience exposure by session, advertisers can deliver a sequence of complementary creative messages — across 15-, 30-, and 60-second formats — that build on one another to guide consumers through a brand story, product narrative, or customer journey. The result is a more relevant advertising experience that preserves the benefits of frequency while reducing the fatigue and frustration often associated with seeing the same ad creative repeatedly.By combining Disney's premium content, engaged audiences and proprietary Audience Graph with Omnicom's Acxiom identity solution and Innovid's creative sequencing technology, this collaboration works to deliver a more sophisticated approach to storytelling, with advanced measurement built in.In addition, for video on demand activations, Disney Advertising is using artificial intelligence and machine learning to analyze the content of programming, allowing marketers to initiate brand messaging with contextual relevance.Using Omnicom's Omni Video Content measurement tool, advertisers can understand how sequential storytelling influences engagement, reach, frequency, and business results.The collaboration underscores the growing industry focus on balancing advertising effectiveness with viewer experience as streaming platforms mature and advertisers look for more advanced ways to manage exposure, creative sequencing, and engagement across connected TV environments."As streaming technology continues to advance, brands have new opportunities to tell stories that evolve with each impression," said Jamie Power, SVP, Addressable Sales, Disney Advertising. "Rather than delivering the same message repeatedly, advertisers can use each exposure to build on a narrative, introduce new ideas, and deepen consumer engagement. That's a fundamentally more powerful approach to storytelling and one that creates more value for both consumers and marketers."The capability is currently live in the US, with EU launching late in 2026 and LATAM following.CONTACT: isabelle.gauvry@omc.com ABOUT OMNICOM MEDIA
Omnicom Media, an Omnicom (NYSE: OMC) Connected Capability, is the world's largest global media management network. Powered by the Omni Intelligence Platform, Omnicom Media agencies leverage $75.6 billion in billings, 40,000+ specialists across 70+ markets, and the industry's most powerful portfolio identity, commerce, and intelligence assets to design dynamic Growth Ecosystems that enable the world's most ambitious businesses to grow faster and smarter. The Omnicom Media portfolio includes global media agency brands OMD, Initiative, PHD, UM, Hearts & Science, and Mediahub; core Omnicom Integrated Media offerings Acxiom, the world's premier identity solution, and the Flywheel digital commerce practice; and specialty services across the cloud consulting, creator, financial, healthcare, and sports & entertainment categories. View original content to download multimedia:https://www.prnewswire.com/news-releases/omnicom-and-disney-advertising-team-up-to-enable-smarter-sequential-advertising-in-streaming-302807971.htmlSOURCE Omnicom Media Original: OMNICOM AND DISNEY ADVERTISING TEAM UP TO ENABLE SMARTER SEQUENTIAL ADVERTISING IN STREAMING
US Market News
1週前
Flywheel Launches GEO Capability to Help Brands Earn AI Recommendations Across Commerce ChannelsJune 23, 2026 11:00 AM
PR Newswire (US) New solution from Omnicom's designated commerce practice leverages reverse engineering from AI systems to reveal how product content is evaluatedCANNES, France, June 23, 2026 /PRNewswire/ -- Flywheel, a leader in commerce and technology solutions and part of the Omnicom (NYSE: OMC) Integrated Media offering, today launched a new Generative Engine Optimization (GEO) capability designed to help brands earn recommendations within AI-powered commerce experiences across retailers including Amazon, Walmart, and Target. The new capability is the latest addition to Omnicom's global portfolio of GEO solutions - spanning commerce, media and public relations - that help clients increase visibility and performance in AI search."As product discovery rapidly shifts toward AI-driven shopping experiences, brands need to rethink how they appear in these environments," said Alex McCord, CEO of Flywheel. "Flywheel sits at the intersection of retail expertise, commerce data, AI enablement, and scaled execution, which uniquely positions us to help brands optimize for how AI-powered commerce ecosystems actually work."From Search to RecommendationFor years, brands relied on traditional Search Engine Optimization (SEO) to improve visibility in retailer search results. But as conversational AI shopping experiences become more common, the focus is shifting from ranking in search to being selected and recommended by AI systems.While many brands continue optimizing Product Detail Pages (PDPs) for search algorithms, AI systems now evaluate products differently, prioritizing contextual relevance, conversational language, and consumer intent. Existing SEO tools and manual audits often fail to measure or improve performance in generative AI environments."The GEO conversation is evolving quickly, but brands cannot afford to wait," said Mike O'Donnell, Head of AI at Flywheel. "Without action, products risk disappearing from AI-generated recommendations, reducing organic traffic and increasing dependence on paid media to maintain visibility."How the Capability WorksThe short answer: reverse engineering AI systems to reveal how product content is evaluated.Flywheel's GEO solution combines AI-powered auditing, content optimization, and ongoing performance measurement into a single workflow designed for commerce platforms.The capability evaluates PDP content across retailers and benchmarks it against GEO best practices informed by AI behavior, algorithms, and visibility signals. It then identifies gaps in content quality and relevance before optimizing titles, bullet points, and descriptions with conversational language, use cases, audience targeting, and functional benefits.The solution also tracks downstream impact on traffic, conversion, and sales, while scaling insights across SKUs and categories in alignment with brand and SEO guidelines."What makes this capability different is its focus on platform-native AI optimization," said O'Donnell. "We are connecting content, AI discovery, and business outcomes in one integrated solution that combines audit, activation, and measurement."Early results have been strong. In a recent pilot for a beauty brand, Flywheel's GEO capability drove 56% portfolio growth and an 80% increase in clicks and website traffic after refining product descriptions to better align with consumer intent and AI recommendation models.Optimizing for AI-Driven CommerceRather than focusing solely on improving search rankings, Flywheel's GEO capability is designed to help products surface directly in AI-generated recommendations. The solution identifies missing content signals such as gifting context, age appropriateness, materials, and safety information that influence how AI systems evaluate products."AI recommendation engines rely on richer context than traditional search," said O'Donnell. "By strengthening those signals, brands can improve how products are surfaced and recommended during the shopping journey."Summing up the value the Flywheel offering adds to Omnicom's GEO solutions portfolio, Megan Pagliuca, Chief Product Officer at Omnicom Media, said: "By combining AI precision with deep retail and category expertise, Flywheel is helping brands adapt in real time to the changing dynamics of commerce and make smarter decisions that drive growth across retail channels."ABOUT FLYWHEELFlywheel, a leader in commerce and technology solutions and part of the Omnicom (NYSE: OMC) Integrated Media offering, provides best-in-class service that combines tailored expertise with advanced software solutions to help clients drive incremental sales, market share, profitability, and measurable commerce growth.A leader across major marketplace platforms, Flywheel combines global scale and influence with a customized, client-centric approach designed to deliver impactful business outcomes. Client success remains at the center of the company's mission.With operations across the Americas, Europe, APAC, and China, Flywheel is widely recognized for the scale of its retail media capabilities, while delivering value across the entire commerce ecosystem. The company helps brands navigate the evolving commerce landscape through integrated solutions built to accelerate growth and performance. View original content to download multimedia:https://www.prnewswire.com/news-releases/flywheel-launches-geo-capability-to-help-brands-earn-ai-recommendations-across-commerce-channels-302806098.htmlSOURCE Flywheel Digital Original: Flywheel Launches GEO Capability to Help Brands Earn AI Recommendations Across Commerce Channels
US Market News
2週前
Omnicom Launches Acxiom Fan Graph to Give Brands a More Complete View of Sports FandomJune 23, 2026 2:00 AM
PR Newswire (US) New sports marketing intelligence solution unifies fan data across media, commerce, and consumer engagementPARIS, June 23, 2026 /PRNewswire/ -- Omnicom (NYSE: OMC) today announced the launch of Acxiom Fan Graph, a new sports marketing intelligence solution anchored by Real ID™. The platform unifies data signals across media, commerce, attendance, purchases, participation, and consumer identity into a privacy-compliant view of fandom, giving brands the competitive insight they need to connect with sports audiences.The solution addresses one of the biggest challenges in modern marketing. While the global sports marketing and sponsorship market is valued at approximately $92 billion and projected to grow to $156 billion by 2032, marketers still struggle to understand which fans matter most, how fandom influences consumer behavior, and how sports investments drive business growth.Fan intelligence remains fragmented across streaming platforms, social networks, fantasy sports, ticketing, retail, loyalty programs, and live events. As a result, brands often rely on reach, impressions, and exposure to evaluate sports investments, without a clear understanding of how fandom translates into engagement, purchases, and long-term customer value.Built on Real ID™, Acxiom's Fan Graph connects intelligence across 260 million U.S. consumers and 2.6 billion global consumers to create a comprehensive, privacy-compliant understanding of sports fandom. Available through Omni, Omnicom's agentic marketing intelligence platform, it helps marketers optimize audience planning, creative development, media activation, commerce opportunities, sponsorship strategy, athlete representation and partnership, and measurement through a single connected view of fans.By connecting identity, behavior, and outcomes, Acxiom Fan Graph helps brands move beyond assumptions to uncover actionable insights into what drives fan engagement and growth."Sports has become one of the world's most powerful cultural and commercial forces, yet marketers still struggle to connect fan engagement to business outcomes," said George Manas, Chief Growth & Solutions Officer at Omnicom. "Fan Graph changes that. By creating a unified view of fandom, we're helping brands better understand their audiences, activate them more effectively, and measure the impact of sports investments with greater precision and accountability."The launch builds on Omnicom's industry-leading Sports & Entertainment capabilities, which span commerce, experiences, media, sponsorship strategy, athlete partnerships, and measurement. Omnicom manages $9.9 billion in sponsorship influence, oversees one in three sports media dollars, maintains more than 500 partnerships across leagues and platforms, manages hundreds of athlete relationships, and has visibility into more than 20,000 sporting events annually.This unique position enables Acxiom Fan Graph to function not just as a data source, but as the operating system for sports marketing strategy, activation, and measurement at scale.Omnicom will discuss Acxiom Fan Graph during a special session at the Omnicom Space during Cannes Lions on Tuesday, June 23rd at 12pm CEST. To attend in person, please RSVP. A livestream will also be available for Omnicom employees, clients, and partners on Omnicom's Cannes website.About Omnicom
Omnicom (NYSE: OMC) is the world's leading marketing and sales company, built for intelligent growth in the next era. Powered by Omni and its proprietary data and identity, Omnicom's Connected Capabilities unite the company's world-class agency brands, exceptional talent, and deep domain expertise across media, commerce, consulting, precision marketing, advertising, production, health, public relations, branding, and experiential to address clients' most critical growth priorities. For more information, visit www.omc.com. View original content:https://www.prnewswire.com/news-releases/omnicom-launches-acxiom-fan-graph-to-give-brands-a-more-complete-view-of-sports-fandom-302806736.htmlSOURCE Omnicom Group Inc. Original: Omnicom Launches Acxiom Fan Graph to Give Brands a More Complete View of Sports Fandom
US Market News
2週前
OMNICOM MEDIA BECOMES NETFLIX'S FIRST DATA COLLABORATION PARTNER FOR AI-POWERED AD CREATIVESJune 22, 2026 3:00 PM
PR Newswire (US) Announcement Launches Omnicom Media's Cannes News Blitz Revealing Partnerships that Connect Brand Content to Streaming Programming, Viewing Experiences and Consumer ExpectationsCANNES, France, June 22, 2026 /PRNewswire/ -- Omnicom Media, an Omnicom (NYSE: OMC) Connected Capability, and Netflix today announced a new collaboration that combines Omnicom's Media Group's Acxiom audience intelligence with Netflix's AI-powered advertising technology to help brands deliver more engaging and personally relevant advertising experiences on Netflix. Clients will be able to use Netflix's AI-enabled ad format, which marries advertisers' creative with the shows, films, and worlds Netflix members love, with Acxiom insights to create, optimize, and measure campaigns tailored to viewers' habits. This capability reflects findings in Omnicom Media's Connected Content research, which explores what types of content, creative experiences and delivery methods drive stronger engagement and connection with audiences. Consumers respond more positively to advertising experiences that align with the content they are actively choosing to watch and that feel additive, timely, and personalized rather than interruptive."Consumers have made it clear that relevance drives engagement, particularly in premium streaming environments where expectations for the viewing experience are exceptionally high," said Megan Pagliuca, Chief Product Officer, Omnicom Media. "This collaboration with Netflix creates an enhanced framework for how brands can connect audience intelligence with creative transformation in real time. By bringing these capabilities together, we are enabling brands to deliver advertising that feels more connected to the moments in which viewers are already highly engaged."Under the collaboration, Omnicom Media will provide advertiser-defined Acxiom audience segments alongside a brand brief. Netflix then applies those audience segments with its proprietary AI engines and LLM-enabled technology to fuse relevant Netflix titles with assets produced by the Omnicom Production content engine to build a highly personalized and engaging ad for members. This allows advertisers to show up in ways that feel natural and to build multiple iterations of a single ad."Since launching the Netflix Ads Suite, we've been committed to reimagining what advertising performance looks like. By combining Omnicom's audience planning with Netflix's AI capabilities, proprietary first-party data, and some of the most popular and beloved shows and movies, we can deliver ads that are as compelling as the titles they surround. For Omnicom clients, this offers creative that doesn't just capture attention — it drives outcomes. That's the power of bringing creativity, media, data, and AI together on one service," said Jon Whitticom, Vice President of Ads Product, Netflix.In addition to expanded relevance and personalization, the collaboration provides advertisers with closed-loop first-party measurement capabilities to better understand campaign effectiveness and performance across audiences, format variants, and content environments."As marketers, we are constantly looking for ways to make advertising feel more relevant and additive to the consumer experience," says Catherine Berger at Bimbo Bakeries. "What stood out for us is the ability to align creative with the content environment in a way that feels natural and personalized, while still maintaining speed to market and brand consistency at scale."The capability will be available to Omnicom Media clients in the US and will roll out to additional countries by the end of the year. CONTACT: isabelle.gauvry@omc.comABOUT OMNICOM MEDIA
Omnicom Media, an Omnicom (NYSE: OMC) Connected Capability, is the world's largest global media management network. Powered by the Omni Intelligence Platform, Omnicom Media agencies leverage $75.6 billion in billings, 40,000+ specialists across 70+ markets, and the industry's most powerful portfolio identity, commerce, and intelligence assets to design dynamic Growth Ecosystems that enable the world's most ambitious businesses to grow faster and smarter. The Omnicom Media portfolio includes global media agency brands OMD, Initiative, PHD, UM, Hearts & Science, and Mediahub; core Omnicom Integrated Media offerings Acxiom, the world's premier identity solution, and the Flywheel digital commerce practice; and specialty services across the cloud consulting, creator, financial, healthcare, and sports & entertainment categories. View original content to download multimedia:https://www.prnewswire.com/news-releases/omnicom-media-becomes-netflixs-first-data-collaboration-partner-for-ai-powered-ad-creatives-302806436.htmlSOURCE Omnicom Media Original: OMNICOM MEDIA BECOMES NETFLIX'S FIRST DATA COLLABORATION PARTNER FOR AI-POWERED AD CREATIVES
US Market News
2週前
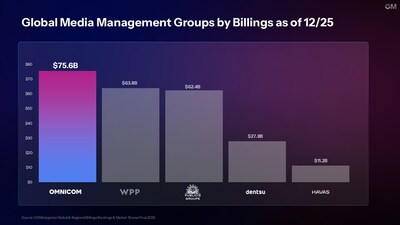
NEW REPORT CONFIRMS OMNICOM MEDIA AS LARGEST GLOBAL MEDIA MANAGEMENT NETWORK FOLLOWING THE INTEGRATION OF OMG AND MEDIABRANDSJune 19, 2026 8:15 AM
PR Newswire (US) Scale and Performance Power Post-Close Enterprise to #1 on the Global Ranking with $75.6 Billion in Billings, Leading Closest Competitor by $12 BillionNEW YORK, June 19, 2026 /PRNewswire/ -- Omnicom Media, an Omnicom (NYSE: OMC) Connected Capability, has been recognized in the COMvergence Final 2025 Global & Regional Billings Rankings as the world's largest media management organization, with total billings of $75.6 billion. The report marks the first official confirmation of OM's global billings scale since f Omnicom Media Group and IPG Mediabrands combined to create Omnicom Media, following the close of Omnicom's acquisition of IPG in late November 2025.Based on COMvergence's analysis of the combined organizations, as of the end of 2025 Omnicom Media holds 31% of all global billings managed by the world's major media groups, finishing $11.8 billion ahead of #2 ranked WPP and $13.2 billion ahead of third ranked Publicis.By year's end, Omnicom Media also rose to #1 in North America with $35.9 billion in billings, $3.9 billion ahead of Publicis Media; and in the USA with $33.1 billion. In LATAM, OM closed the year at the top of the ranking with $2.3 billion in billings, approximately $500 million ahead of Havas Media Network.Notably, in addition to post-integration scale the rankings also reflect the substantial impact of several major accounts that were won and/or became effective in 2025, including Amazon, Paramount and Volvo."The significance of these rankings isn't simply that we're the largest—it's what that scale enables," said Florian Adamski, CEO of Omnicom Media. "When scale is connected through common capabilities, shared intelligence, and world-class talent, it becomes an advantage for clients. It gives us greater access to data, stronger partnerships with the world's leading media and technology companies, more opportunities to invest in innovation, and more leverage to create better business outcomes."Adamski adds, "The same is true for our people. Scale creates more opportunities to build careers across disciplines, markets and capabilities while working on some of the world's most ambitious brands. That's the real value of what we've built."OMD Retains Position as the World's Leading Media Agency NetworkAt the agency level, OMD once again ranked as the #1 global media agency network, managing $26.9 billion in billings worldwide. The inaugural agency in the Omnicom Media portfolio also topped the North America and EMEA rankings; and was ranked #1 in more than a third of the 49 countries evaluated in the report – more than any other agency – including the USA, Australia, Canada, and Hong Kong.The rankings land as Omnicom Media heads into next week's Cannes Lions festival with $2.5 billion in billings awarded in the first six months of 2026 – according to the COMvergence dashboards that track new business performance in real time – including Delta, Dyson, and IBM. And with more than half of that total representing incremental wins, Omnicom Media is also the number one media group for net new business YTD.The COMvergence Final 2025 Global & Regional Billings Rankings evaluate media agency billings across 49 markets representing approximately 96% of worldwide media investment.CONTACT: Isabelle Gauvry
isabelle.gauvry@omc.comABOUT OMNICOM MEDIAOmnicom Media, an Omnicom (NYSE: OMC) Connected Capability, is the world's largest global media management network. Powered by the Omni Intelligence Platform, Omnicom Media agencies leverage $75.6 billion in billings, 40,000+ specialists across 70+ markets, and the industry's most powerful portfolio identity, commerce, and intelligence assets to design dynamic Growth Ecosystems that enable the world's most ambitious businesses to grow faster and smarter. The Omnicom Media portfolio includes global media agency brands OMD, Initiative, PHD, UM, Hearts & Science, and Mediahub; core Omnicom Integrated Media offerings Acxiom, the world's premier identity solution, and the Flywheel digital commerce practice; and specialty services across the cloud consulting, creator, financial, healthcare, and sports & entertainment categories. View original content to download multimedia:https://www.prnewswire.com/news-releases/new-report-confirms-omnicom-media-as-largest-global-media-management-network-following-the-integration-of-omg-and-mediabrands-302805297.htmlSOURCE Omnicom Media Group Original: NEW REPORT CONFIRMS OMNICOM MEDIA AS LARGEST GLOBAL MEDIA MANAGEMENT NETWORK FOLLOWING THE INTEGRATION OF OMG AND MEDIABRANDS
US Market News
3週前
The Truth About Global BrandsJune 11, 2026 1:12 PM
PR Newswire (US) Truth Is Everything: 72% of People Say It's More Important than Ever to Prioritize TruthResearch from McCann and Economist Enterprise reveals global growth will be driven by brands' ability to eliminate doubt and connect with the world's fastest-growing audience with ideas that move at the speed and flow of cultureNEW YORK, June 11, 2026 /PRNewswire/ -- McCann today released The Truth About Global Brands, a study of 20,713 people across 20 markets, revealing a fundamental reset in how brands achieve growth and relevance, globally. This year's study draws on independent insights from an analysis of B2B decision-makers conducted by Economist Enterprise, the B2B arm of The Economist Group. At a time when AI is reshaping decision-making, trust is fragmenting and cultural influence is shifting, the research finds that brands must help consumers navigate an increasingly complex "Truth Maze" by eradicating doubt to drive growth."Global brands are experiencing a growth crisis as we've shifted from a trust economy to a doubt economy, putting CMOs under more pressure than ever," said Tyler Turnbull, Global CEO, McCann. "The new playbook for the future of brand building will be grounded in a brand's ability to show up with clarity, credibility and cultural fluency at every decision point."The "Truth Maze": a New Battleground for Brands' Bottom LineIn a world flooded with information, consumers and business leaders are navigating a "Truth Maze:" a complex web of conflicting information, AI-generated content, and competing claims that has made it harder than ever to determine what is real.While 72% of people say it's more important than ever to prioritize truth, 55% believe brands are less truthful than they were 20 years ago76% worry they will soon be unable to distinguish between real people and artificial ones onlineWhile AI adoption is expected -- 72% of consumers and 88% of B2B leaders say brands must use AI to keep up -- accountability is what will set brands apart.53% of people say being transparent about AI use is the most effective way for brands to build trust, and 45% say brands should help them understand what's real and what isn't in AI-generated contentThe commercial stakes are high, with the research revealing that trust is not a soft brand value, but a revenue driver."In a world where truth matters more than ever, certainty is the new value exchange," said Harjot Singh, Global Chief Strategy Officer, McCann.A vast majority of people (80%) say they will actively choose brands they trust, even if they cost more, signaling a growing premium on credibility69% of consumers and 79% of B2B decision-makers have stopped using a brand because they no longer trusted it"The data tells a compelling story: when business leaders lose faith in a brand, they walk away and they don't come back easily," said Tamara McMillen, Chief Revenue Officer at Economist Enterprise. "What this means for global brands is that the commercial cost of doubt is real and measurable. Brands that invest in being trustworthy guides to B2B decision-makers are the ones best positioned to grow.""Multi-Modal Globality" Challenges Traditional Brand Building PlaybookIn a world inundated with information, the research reveals a major shift in how culture and influence flow globally, as ideas move fluidly across markets, platforms and communities.Influence is increasingly multi-directional, not West-to-restMarkets like China, India and Saudi Arabia are shaping global norms73% of people say you can be a global citizen without travellingCulture no longer flows in a straight line from global to local. Instead, it circulates --emerging, evolving and scaling across interconnected networks. Legacy models of global brand building — top-down or bottom-up — are no longer sufficient.The Next Growth Engine: 1 Billion Strong "Upward Class" With culture and influence now moving multi-directionally, a new, highly influential and expanding audience is defining the new era of brand growth: the "Upward Class."1.02 billion people globally$29.5 trillion in annual spending powerHighly motivated by progress, self-improvement and upward mobilityUnlike previous generations, these consumers use brands not just to consume, but to signal progress, identity and belonging, reshaping the meaning of status itself.Critically, the "Upward Class" shows lower brand cynicism and stronger belief in brands as tools for advancement, making them disproportionately influential in defining what growth looks like next."Future growth won't come from leaning on existing audiences or legacy markers of scale," continued Turnbull. "It will come from brands that turn truth into a genuine growth engine, building connected systems of meaning, culture and commerce. That's what McCann's Truth Well Told framework is designed to do."The New Playbook for Global Brand Growth Across all findings, one principle stands out: the brands that succeed in 2026 and beyond will not be those that say the most, but those that remove the most doubt and connect with segments shaping tomorrow's demand. This requires:Acting as a trusted guide in a complex information landscapeGoing back to the basics, delivering products and experiences that are relevant, useful and prove their valueIdentifying and engaging emerging, high-growth audiences that believe in brandsDesigning truth-based ideas that move with culture and scale across networksResearch MethodologyThe Truth About Global Brands is based on a survey of 20,713 people across 20 markets [US, UK, Australia, Brazil, Canada, China, France, Germany, Italy, India, Japan, Mexico, Spain, UAE, Saudi Arabia, Philippines, Singapore, South Korea, Thailand, New Zealand], conducted between November 2025 and January 2026, combined with qualitative insights from senior marketing leaders and global CMOs.*Trended data is reported on a like-for-like basis, with the following markets [US, UK, Brazil, China, France, Germany, India, Japan, Mexico] across 2018, 2023, 2026.This year's report includes a B2B brand perspective based on independent insights from Economist Enterprise, the B2B division of The Economist Group that helps organizations understand global economic and geopolitical change, make informed strategic decisions and reach influential audiences. Their analysis surfaces the critical nuances that distinguish B2B audiences from the broader consumer sample – and what those nuances mean for brands competing for the trust and confidence of business buyers today.About?McCann
McCann, part of Omnicom (NYSE: OMC), is a leading creative solutions company. The award-winning global brand network is united across 100+ countries by a mission to build iconic brands through the radical creativity of Truth Well?Told.?Because when the truth is well told, it moves people and markets. Named one of the World's Most Innovative Companies by Fast Company in 2025 and?2024, and?ranked in the top 3 most creatively effective networks globally in the Effie Index every year since 2019, McCann?is the global brand creative partner of such iconic brands as L'Oreal Paris, Mastercard, Xbox, IKEA and Maggi.
For more information, visit?www.mccann.com. View original content to download multimedia:https://www.prnewswire.co.uk/news-releases/the-truth-about-global-brands-302798381.html Original: The Truth About Global Brands
US Market News
3週前
The Truth About Global BrandsJune 11, 2026 12:37 PM
PR Newswire (US) Truth Is Everything: 72% of People Say It's More Important than Ever to Prioritize TruthResearch from McCann and Economist Enterprise reveals global growth will be driven by brands' ability to eliminate doubt and connect with the world's fastest-growing audience with ideas that move at the speed and flow of cultureNEW YORK, June 11, 2026 /PRNewswire/ -- McCann today released The Truth About Global Brands, a study of 20,713 people across 20 markets, revealing a fundamental reset in how brands achieve growth and relevance, globally. This year's study draws on independent insights from an analysis of B2B decision-makers conducted by Economist Enterprise, the B2B arm of The Economist Group. At a time when AI is reshaping decision-making, trust is fragmenting and cultural influence is shifting, the research finds that brands must help consumers navigate an increasingly complex "Truth Maze" by eradicating doubt to drive growth."Global brands are experiencing a growth crisis as we've shifted from a trust economy to a doubt economy, putting CMOs under more pressure than ever," said Tyler Turnbull, Global CEO, McCann. "The new playbook for the future of brand building will be grounded in a brand's ability to show up with clarity, credibility and cultural fluency at every decision point."The "Truth Maze": a New Battleground for Brands' Bottom LineIn a world flooded with information, consumers and business leaders are navigating a "Truth Maze:" a complex web of conflicting information, AI-generated content, and competing claims that has made it harder than ever to determine what is real.While 72% of people say it's more important than ever to prioritize truth, 55% believe brands are less truthful than they were 20 years ago76% worry they will soon be unable to distinguish between real people and artificial ones onlineWhile AI adoption is expected -- 72% of consumers and 88% of B2B leaders say brands must use AI to keep up -- accountability is what will set brands apart.53% of people say being transparent about AI use is the most effective way for brands to build trust, and 45% say brands should help them understand what's real and what isn't in AI-generated contentThe commercial stakes are high, with the research revealing that trust is not a soft brand value, but a revenue driver."In a world where truth matters more than ever, certainty is the new value exchange," said Harjot Singh, Global Chief Strategy Officer, McCann.A vast majority of people (80%) say they will actively choose brands they trust, even if they cost more, signaling a growing premium on credibility69% of consumers and 79% of B2B decision-makers have stopped using a brand because they no longer trusted it"The data tells a compelling story: when business leaders lose faith in a brand, they walk away and they don't come back easily," said Tamara McMillen, Chief Revenue Officer at Economist Enterprise. "What this means for global brands is that the commercial cost of doubt is real and measurable. Brands that invest in being trustworthy guides to B2B decision-makers are the ones best positioned to grow.""Multi-Modal Globality" Challenges Traditional Brand Building PlaybookIn a world inundated with information, the research reveals a major shift in how culture and influence flow globally, as ideas move fluidly across markets, platforms and communities.Influence is increasingly multi-directional, not West-to-restMarkets like China, India and Saudi Arabia are shaping global norms73% of people say you can be a global citizen without travellingCulture no longer flows in a straight line from global to local. Instead, it circulates --emerging, evolving and scaling across interconnected networks. Legacy models of global brand building — top-down or bottom-up — are no longer sufficient.The Next Growth Engine: 1 Billion Strong "Upward Class" With culture and influence now moving multi-directionally, a new, highly influential and expanding audience is defining the new era of brand growth: the "Upward Class."1.02 billion people globally$29.5 trillion in annual spending powerHighly motivated by progress, self-improvement and upward mobilityUnlike previous generations, these consumers use brands not just to consume, but to signal progress, identity and belonging, reshaping the meaning of status itself.Critically, the "UpwardClass"shows lower brand cynicism and stronger belief in brands as tools for advancement, making them disproportionately influential in defining what growth looks like next."Future growth won't come from leaning on existing audiences or legacy markers of scale," continuedTurnbull. "It will come from brands that turn truth into a genuine growth engine,building connected systems of meaning, culture and commerce. That's what McCann's Truth Well Told framework is designed to do."The New Playbook for Global Brand Growth Across all findings, one principle stands out:the brands that succeed in 2026 and beyond will not be those that say the most,but those that remove the most doubtandconnect withsegments shaping tomorrow's demand. This requires:Acting as a trusted guide in a complex information landscapeGoing back to the basics, delivering products and experiences that are relevant, useful and prove their valueIdentifying and engaging emerging, high-growth audiences that believe in brandsDesigning truth-based ideas that move with culture and scale across networksResearch MethodologyThe Truth About Global Brands is based on a survey of 20,713 people across 20 markets [US, UK, Australia, Brazil, Canada, China, France, Germany, Italy, India, Japan, Mexico, Spain, UAE, Saudi Arabia, Philippines, Singapore, South Korea, Thailand, New Zealand], conducted between November 2025 and January 2026, combined with qualitative insights from senior marketing leaders and global CMOs.*Trended data is reported on a like-for-like basis, with the following markets [US, UK, Brazil, China, France, Germany, India, Japan, Mexico] across 2018, 2023, 2026.This year's report includes a B2B brand perspective based on independent insights from Economist Enterprise, the B2B division of The Economist Group that helps organizations understand global economic and geopolitical change, make informed strategic decisions and reach influential audiences. Their analysis surfaces the critical nuances that distinguish B2B audiences from the broader consumer sample – and what those nuances mean for brands competing for the trust and confidence of business buyers today.About?McCann
McCann, part of Omnicom (NYSE: OMC), is a leading creative solutions company. The award-winning global brand network is united across 100+ countries by a mission to build iconic brands through the radical creativity of Truth Well?Told.?Because when the truth is well told, it moves people and markets. Named one of the World's Most Innovative Companies by Fast Company in 2025 and?2024, and?ranked in the top 3 most creatively effective networks globally in the Effie Index every year since 2019, McCann?is the global brand creative partner of such iconic brands as L'Oreal Paris, Mastercard, Xbox, IKEA and Maggi.
For more information, visit?www.mccann.com. View original content to download multimedia:https://www.prnewswire.com/news-releases/the-truth-about-global-brands-302798348.htmlSOURCE McCann Original: The Truth About Global Brands
US Market News
2月前
Susan Howe to Retire from Weber Shandwick; Karen Pugliese Named CEOMay 14, 2026 1:30 PM
PR Newswire (US) NEW YORK, May 14, 2026 /PRNewswire/ -- Weber Shandwick, an Omnicom Public Relations (OPR) agency, today announced that Susan Howe, who has served as CEO since 2024, will retire from the agency on September 1, 2026, after a career spanning nearly three decades. Karen Pugliese, currently serving as Weber Shandwick's Global President, will succeed Howe as CEO, effective September 1, 2026. Howe and Pugliese will continue working closely on the transition to ensure continuity for employees, clients and partners. "This is an important moment for Weber Shandwick," said Chris Foster, CEO, Omnicom Public Relations. "Susan has led this agency with vision and integrity, and she leaves the agency exceptionally well positioned for the future. Karen Pugliese is a deeply respected leader with a strong command of the business, our clients and our people. I have every confidence she will continue to strengthen the agency's reputation and impact."Under Howe's leadership, Weber Shandwick earned significant industry recognition, including PRWeek's Global Agency of the Year, PRovoke's Global Agency of the Decade and more than 250 Cannes Lions. Howe also oversaw the expansion of the agency's capabilities through Weber I/O, Weber Advisory and Weber Create, broadening Weber Shandwick's integrated communications and advisory offerings."Karen has been my trusted partner in building this agency into what it is today," said Howe. "She knows this business, our people and our clients with deep experience and commitment. I could not be more confident in her leadership and look forward to seeing what the agency accomplishes next. It has been a privilege to lead Weber Shandwick and work alongside such talented colleagues around the world."She's been a steady force at Weber Shandwick for more than 15 years, serving in leadership roles including Executive Vice President of the Consumer Practice, Chief of Staff to the CEO, Global Chief Growth Officer and, most recently, Global President. She has overseen the agency's business strategy and innovation agenda, led key client relationships and partnered closely with leaders across the network to shape the agency's future direction."Susan is one of the most visionary and impactful leaders I've had the privilege to work with," said Pugliese. "What she has built here — an agency defined by creative excellence and a culture that attracts and develops outstanding talent — is a strong platform for the future. I am deeply honored to take on this role and focused on what's next for our agency, our clients and our people."Weber Shandwick also announced that Jim O'Leary, Chief Executive Officer, North America and Global President, is departing the agency to pursue a new opportunity.About Weber Shandwick
Weber Shandwick is part of Omnicom Public Relations (OPR). The agency has been recognized with numerous industry honors, including PRWeek's Global Agency of the Year, PRovoke's Global Agency of the Decade and more than 250 Cannes Lions.About Omnicom Public Relations
Omnicom Public Relations (OPR) is the global public relations capability of Omnicom Group (NYSE: OMC) and one of the company's Connected Capabilities. Operating through leading agency brands, OPR advises and activates for clients across corporate and brand communications, health, public affairs, and social impact. OPR connects world-class talent with shared platforms, technology, and data-driven intelligence, including Omnicom's Omni platform, to deliver integrated communications that shape reputation, drive influence, and produce measurable impact worldwide.Contact:
US Market News
2月前
FleishmanHillard Launches Dedicated "America 250" Unit to Help Organizations Navigate Historic MilestoneMay 12, 2026 1:00 PM
PR Newswire (US) New offering supports brands and institutions in capturing opportunity and managing risk surrounding the United States' 250th anniversaryNEW YORK, May 12, 2026 /PRNewswire/ -- FleishmanHillard today announced the launch of an America 250 Unit, a specialized offering designed to help brands and organizations navigate the opportunities and complexities surrounding the United States' 250th anniversary in 2026. The semiquincentennial of the United States marks a defining cultural and civic moment, expected to drive unprecedented levels of national excitement, global attention, and engagement. For organizations, it presents a unique opportunity to connect with audiences, demonstrate shared values, and build lasting brand relevance. At the same time, it introduces heightened reputational risk as companies operate within an increasingly polarized and fast-moving environment."America 250 is not just a milestone. It is a defining moment for how organizations show up in culture, in communities, and in the national conversation," said Jim Joseph, Global Head of Brand Impact, FleishmanHillard. "There is enormous opportunity for brands to engage in meaningful ways, but it must be done with precision, authenticity, and a clear understanding of the broader environment. Our clients are looking for guidance that balances ambition with accountability, and that's exactly what this unit is built to deliver."FleishmanHillard's America 250 Advisory Unit brings together experts across corporate affairs and brand impact to help clients both leverage and navigate this moment in order to build brand value while protecting reputation.A Comprehensive Approach to America 250FleishmanHillard's America 250 Unit will provide clients with a full suite of capabilities, including:Strategic counsel on positioning, narrative development, and stakeholder engagementRisk assessment and scenario planning for reputational and political sensitivitiesPartnerships and alignment with official and unofficial America 250 organizationsEarned media strategy and collaboration with leading publishers, media platforms, and influencersExecutive visibility and thought leadership programming tied to the milestoneAlways-on intelligence and audience insights through a dedicated America 250 client newsletter and briefingsFleishmanHillard counselors are already in regular contact with key stakeholders shaping the America 250 ecosystem, including organizers, policymakers, media organizations, and cultural institutions. This access enables clients to identify credible opportunities and engage early in the planning cycle."We're already working across more than a dozen clients to help shape how they engage in this moment," said Michael Moroney, Head of Corporate Affairs, The Americas, FleishmanHillard. "What's clear is that this is not a one-size-fits-all opportunity. It requires a thoughtful balance of brand ambition, cultural awareness, and risk management. We've developed internal playbooks and frameworks to help clients move quickly, while ensuring they are aligned, relevant, and prepared for scrutiny."The America 250 Unit reflects FleishmanHillard's broader strategy to lead clients through moments where business, brand, policy, culture, and reputation converge. As organizations face increasing pressure to take positions and engage authentically, the firm's integrated model ensures that communications strategies are both impactful and resilient.About FleishmanHillard?
FleishmanHillard specializes in public relations, reputation management, public affairs, brand marketing, digital strategy, social engagement and content strategy. FleishmanHillard was named Data Driven Agency of the Year at the 2026 PRovoke Innovation SABRE Awards and was named the 2022 and 2023?PRWeek U.S. Outstanding Extra-Large Agency of the Year; 2023 Campaign US PR Agency of the Year; 2021 PRovoke APAC Consultancy of the Year; and 2021 PRWeek?UK?Large Consultancy of the Year. FleishmanHillard is part of?Omnicom PR and has nearly 80 offices in more than 30 countries, plus affiliates in 45 countries.? View original content to download multimedia:https://www.prnewswire.com/news-releases/fleishmanhillard-launches-dedicated-america-250-unit-to-help-organizations-navigate-historic-milestone-302769835.htmlSOURCE FleishmanHillard Inc. Original: FleishmanHillard Launches Dedicated "America 250" Unit to Help Organizations Navigate Historic Milestone
US Market News
2月前
Omnicom Elevates Christine Gambino to CEO of Omni PlatformMay 4, 2026 9:00 AM
PR Newswire (US)
Flywheel CEO Alex McCord Assumes Leadership of Omnicom Commerce
Duncan Painter Steps Down to Pursue UK-Based OpportunityNEW YORK, May 4, 2026 /PRNewswire/ -- Omnicom (NYSE: OMC), the world's leading marketing and sales company, today announced it has elevated Christine Gambino to Chief Executive Officer of Omni, effective immediately. She succeeds Duncan Painter, who is stepping down to pursue a senior executive opportunity in the United Kingdom, his home country.Gambino brings extensive expertise to this role. As Chief Operating Officer of Omni, she oversaw operations for a team of more than 1,000 product and technology leaders dedicated to building Omnicom's marketing and sales intelligence platform. In her new role as CEO, she will drive Omni's continued development, ensuring its evolution delivers strategic value to clients and Omnicom teams.Prior to Omni, Gambino spent six years at Flywheel. There, she led engineering, product, and data science teams and drove key innovations in automation and predictive analytics. She previously held roles at Under Armour, UPS, and CasSevern—building a strong foundation in technology, product development, and operational excellence."It's an honor to lead Omni at this pivotal moment when the platform is serving as a shared resource for the new Omnicom," said Gambino. "Duncan has created an exceptional foundation, and I'm grateful for his partnership and leadership as we now accelerate adoption across the organization. I look forward to ensuring teams across every discipline can leverage Omni's integrated capabilities to deliver measurable impact for clients."Omnicom Commerce, also previously under Painter, will now be led by Alex McCord, who will oversee its operations and growth while continuing as CEO of Flywheel. With 15 years of experience in the commerce industry, McCord has built a reputation for driving transformative growth by seamlessly integrating technology, data, and strategic insights to elevate sales and brand performance."I'm proud of how swiftly we launched the next generation of Omni following the Interpublic acquisition, establishing it as a unified asset for the combined group. Christine was central to that effort and brings a deep understanding of the platform to drive Omni to its next phase," said Painter. "Additionally, Alex has been instrumental in shaping Flywheel into an industry leader and brings deep commerce expertise to strengthen Omnicom Commerce. I have complete confidence in both of them to accelerate impact across Omnicom as I move into my next chapter in the UK, where I'll be closer to my family."Omni and Flywheel will continue to operate as a core part of Omnicom's Integrated Media capabilities.About Omnicom
Omnicom (NYSE: OMC) is the world's leading marketing and sales company, built for intelligent growth in the next era. Powered by Omni and its proprietary data and identity, Omnicom's Connected Capabilities unite the company's world–class agency brands, exceptional talent, and deep domain expertise across media, commerce, consulting, precision marketing, advertising, production, health, public relations, branding, and experiential to address clients' most critical growth priorities. For more information, visit www.omc.com.
View original content:https://www.prnewswire.com/news-releases/omnicom-elevates-christine-gambino-to-ceo-of-omni-platform-302760904.htmlSOURCE Omnicom Group Inc.
Original: Omnicom Elevates Christine Gambino to CEO of Omni Platform
US Market News
2月前
Creo Debuts AI Solution for Real-Time Creator Content Editing, Reducing Costs and Time-to-Market While Ensuring Brand Compliance at ScaleApril 28, 2026 11:30 AM
PR Newswire (US)
New agentic tool from Omnicom Media's influencer marketing arm leverages Google's advanced models, including GeminiVeo and Nano Banana, to add post-production editing to Creo's suite of AI-powered creator discovery, briefing and vetting toolsNEW YORK, April 28, 2026 /PRNewswire/ -- Creo, the influencer marketing arm of Omnicom Media announced a collaboration with Google Cloud to transform the content creator lifecycle. This partnership introduces advanced post-production editing capabilities to Creo's suite of AI-powered tools, drastically reducing the time and cost associated with brand compliance in influencer channels.
By integrating Google Cloud's generative AI, Creo is evolving its Content Vetting Agent from a diagnostic tool into a proactive editing solution. Built on Google Cloud's Gemini Enterprise Agent Platform, the tool now leverages the multimodal power of Gemini and Veo to analyze and instantly modify creator content.As brands scale influencer investments, ensuring content meets strict brand standards has become more complex and time-consuming, with traditional manual review processes slowing production times and limiting scalability. This new capability addresses that challenge by combining Gemini Enterprise and its advanced AI models from Google with Creo's proprietary influencer marketing platform to enable automated content analysis, real-time feedback, and seamless editing at the touch of a button."This is a breakthrough moment for influencer marketing," said Kevin Blazaitis, President, Creo. "For the first time, we're not just identifying issues in creator content - we're resolving them instantly, enabling our clients to move at the speed of culture while maintaining control and compliance."This first-mover capability represents the latest advancement in Creo's suite of AI-powered tools designed to accelerate the full creator lifecycle from discovery to activation. In addition to the Content Vetting Agent, the suite also includes the Creator Discovery Agent, which surfaces and vets creators aligned to brand objectives and the Creator Briefing Agent, which analyzes creator submissions against bespoke brand suitability guidelines and Creo best practices.How It WorksCreo's Content Vetting Agent - enabled by Gemini - evaluates submitted content, assigns a suitability score, and flags specific issues - such as the presence of restricted items (e.g., an alcoholic beverage in the background that violates brand guidelines).With the new enhancement, Creo takes this process a step further, enabling light-touch, non-substantive edits in real time—such as removing restricted objects, blurring logos, or adjusting wardrobe elements (e.g., changing a competitor's brand color to a neutral alternative).For regulated industries such as alcohol and gambling, the tool also ensures adherence to bespoke requirements, including persistent visibility of disclaimers like "Age 21+."Edited content is returned to creators within minutes for final approval, eliminating the need for costly and time-intensive reshoots while preserving the integrity of the creator's original storytelling."This collaboration with Creo brings our latest AI models directly into the creator workflow," said Tarun Rathnam, Director of AI & Cloud for Marketing at Google Cloud. "The integration empowers brands and creators to collaborate at the speed of culture, unlocking faster, higher-quality content production and near-instant automated refinements at scale."Delivering Measurable Impact for ClientsThe new capability delivers tangible benefits across cost, speed, and quality:Better Content: AI-driven screening using Gemini ensures alignment with brand, legal, and compliance standards, catching details that human review may miss.Faster Turnaround: Reduces content review and approval timelines by two-to-three days, with same-day turnaround now possible.Lower Production Costs: Eliminates additional creator revision fees, reshoot and editing costs.Operational Efficiency: Reduced time spent on manual review and coordination.The capability is currently available in the United States, with global expansion planned in Q3.CONTACT: Isabelle Gauvry
isabelle.gauvry@omc.comABOUT CREO
Creo, an Omnicom Media specialized service, is a data-driven, end-to-end influencer marketing agency that leverages the power of the Omni intelligence platform and Acxiom RealID™ to approach influencer marketing like a media channel that can be planned, measured and optimized to deliver impact at all levels of the marketing funnel. For more information visit creo.com.About Omnicom Media
Omnicom Media, an Omnicom (NYSE: OMC) Connected Capability, is the world's largest global media management network. Powered by the Omni Intelligence Platform, Omnicom Media agencies leverage $73.5 billion in billings, 40,000+ specialists across 70+ markets, and the industry's most powerful portfolio of Identity (Acxiom RealID™), Commerce (Flywheel), and Intelligence (Q™) assets to design dynamic Growth Ecosystems that enable the world's most ambitious businesses to grow faster and smarter. The Omnicom Media portfolio includes leading global media agency brands OMD, Initiative, PHD, UM, Hearts & Science, and Mediahub; Data, Identity & Analytics powerhouses Acxiom, and Annalect; and a broad spectrum of specialized services. For more information visit omnicommedia.com
View original content to download multimedia:https://www.prnewswire.com/news-releases/creo-debuts-ai-solution-for-real-time-creator-content-editing-reducing-costs-and-time-to-market-while-ensuring-brand-compliance-at-scale-302755923.htmlSOURCE Omnicom Media Group
Original: Creo Debuts AI Solution for Real-Time Creator Content Editing, Reducing Costs and Time-to-Market While Ensuring Brand Compliance at Scale
US Market News
2月前
Omnicom Expands Adobe Partnership to Drive Industry-Specific AI-Powered Marketing TransformationApril 21, 2026 1:22 PM
PR Newswire (US)
Omnicom to Launch New Enterprise Agentic Operating Model Solution powered by Omni Across Retail, Financial Services, Pharmaceuticals, and AutomotiveNEW YORK, April 21, 2026 /PRNewswire/ -- At Adobe Summit, Omnicom (NYSE: OMC), the world's leading marketing and sales company, today announced an expansion of its long-standing global partnership with Adobe to co-develop an enterprise-grade, industry-specialized AI Agentic Operating Model solution. Omnicom will bring this solution to market by integrating Omni, its proprietary marketing and sales platform, and its agentic framework with Adobe's enterprise marketing and creative technology stack. Designed for global brands, the solution enables orchestration across strategy, creative development, planning, activation, and measurement at enterprise scale. Its component-based architecture can be rapidly deployed across specific use cases and is anchored by a client specific knowledge graph powered by Omni.The partnership directly addresses a market challenge: most AI marketing solutions remain disconnected point tools that lack enterprise governance, vertical specialization, and true orchestration. The Agentic Operating Model solves this by creating a unified, managed solution built on Adobe technology and designed specifically for Retail, Financial Services, Pharmaceuticals, and Automotive enterprises.Over the next 12 months, Omnicom will design, architect, and operationalize the industry focused solution across five core use cases: end-to-end customer experience, omni channel planning, total creative workflow, .com, and email. The solution will feature seamless data exchanges between Adobe products, Omni's powerful connected platform layer and its agentic infrastructure, delivering predictive growth at enterprise scale.Omnicom's Precision Marketing Capability will lead the design, build, and operationalization of the Agentic operating model and development of new agents, delivering them as a managed service tailored to each vertical's specific workflows and governance requirements.Differentiated Approach to Enterprise AI AdoptionUnlike point solutions, this solution eliminates vendor fragmentation through a single branded offering sold directly to enterprises and managed as a service. The platform integrates Omnicom's specialized agency capabilities, providing deep vertical expertise and compliance frameworks critical to regulated industries, with Adobe's world-class content and data orchestration capabilities. Omni, powered by Acxiom Real ID's privacy-first identity foundation of 2.6 billion verified global IDs enriched with cultural, media, and commerce signals, further strengthens the ecosystem by accelerating audience activation and enabling sophisticated segmentation. This unified data layer flowing into Adobe Real-Time CDP solves cold-start challenges while providing a single source of truth across every team, from brief to activation."This expanded partnership fundamentally changes what's possible for CMOs today," said Luke Taylor, CEO, Omnicom Precision Marketing. "We're not bolting AI onto existing workflows, we're building production-ready systems for our clients that handle the full marketing journey, from strategy through measurement. By combining Adobe's platform, Omni's unified data layer and agentic capabilities, and our vertical expertise, we're delivering an agentic operating model that enterprise teams can actually trust and scale.""Our clients don't want another AI vendor adding complexity to their operations. They want systems built for enterprise reality: governance at scale, vertical specialization, and the ability to move from brief to activation without multiple tool switches," said Paolo Yuvienco, Chief Technology Officer at Omnicom. "This co-innovation with Adobe lets us deliver exactly that."Strategic Go-To-Market and OperationsOmnicom is establishing a Center of Excellence to operationalize the Agentic Operating Model solution, with comprehensive go-to-market acceleration across its four target verticals."This co-innovation brings together what enterprises need most: deep vertical expertise and a production-ready solution built for scale. By combining Adobe's technology with Omnicom's capabilities, we're enabling CMOs to deploy AI at scale and rapidly move from proof of concept to competitive advantage," said Stephen Frieder, Chief Revenue Officer, Enterprise, Adobe.The expanded partnership reflects Omnicom's commitment to advancing how agencies harness AI at enterprise scale. By embedding Adobe technology at the core of its operations and maintaining tight alignment through joint governance and strategic planning, both companies are accelerating the path from marketing strategy to production workflows powered by responsible, governed generative AI.About Omnicom
Omnicom (NYSE:OMC) is the world's leading marketing and sales company, built for intelligent growth in the next era. Powered by Omni and its proprietary data and identity, Omnicom's Connected Capabilities unite the company's world–class agency brands, exceptional talent, and deep domain expertise across media, commerce, consulting, precision marketing, advertising, production, health, public relations, branding, and experiential to address clients' most critical growth priorities. For more information, visit www.omc.com.
View original content:https://www.prnewswire.com/news-releases/omnicom-expands-adobe-partnership-to-drive-industry-specific-ai-powered-marketing-transformation-302749094.htmlSOURCE Omnicom Group Inc.
Original: Omnicom Expands Adobe Partnership to Drive Industry-Specific AI-Powered Marketing Transformation
US Market News
3月前
Omnicom's Transformation Consultancy Strengthens Capabilities with the Launch of Unified Adobe PracticeApril 1, 2026 9:43 AM
PR Newswire (US)
NEW YORK, April 1, 2026 /PRNewswire/ -- Omnicom (NYSE: OMC), the world's leading marketing and sales company, today announced that Credera, its transformation consultancy, has launched a comprehensive Adobe practice designed to meet the evolving needs of enterprise organizations. Nik DeBenedetto, former CEO of LeapPoint, which Omnicom acquired in 2024, will lead the Adobe practice as Global Managing Director. As part of this launch, LeapPoint will be fully integrated into Credera.The combination of Credera's transformation consulting expertise and LeapPoint's award-winning Adobe capabilities, integrated with Omnicom's leading connected capabilities—including media, creative, commerce, data, and identity solutions—significantly strengthens Omnicom's position as the market leader in enterprise marketing transformation. This comprehensive, end-to-end offering delivers transformation consulting at enterprise scale. In 2025, LeapPoint further demonstrated this leadership by winning the Adobe Digital Experience GenStudio Partner of the Year – Americas and the Adobe Digital Experience Partner of the Year – UK&I."Bringing together our teams and capabilities expands our ability to help clients realize the value of their Adobe investments faster," said Nik DeBenedetto, former CEO of LeapPoint and now Global Managing Director of Omnicom's Adobe Practice. "The trusted relationships and commitment to excellence that have long set us apart with clients and Adobe remain unchanged, now backed by Omnicom and a unified team with broader capabilities working on their behalf."Growth & Momentum for Omnicom's Transformation ConsultancyThis integration strengthens Omnicom's consulting transformation strategy, anchored by Credera's Adobe partnership and bolstered by proven industry talent—including Jantzen Bridges as Credera Global President and Todd Schwarz, the former Global Customer Technology & Adobe Lead at Accenture Song, as the Global Digital Platform Lead."With the addition of industry leader, Todd Schwartz, last year, we have significantly expanded the breadth and scale of the transformation we are helping our clients achieve." said Jantzen Bridges. "We expect growth to accelerate with Nik DeBenedetto and his team taking the helm of our Omnicom Adobe practice."Bridges continues, "Omnicom is helping to define the future of marketing and bringing that vision to life for clients through transformational work, including automating content supply chains, leveraging data and identity to drive better personalization and reach, and implementing new operating models powered by humans and enabled by agents. The new Adobe Practice will strengthen those capabilities and help us deliver them more effectively.""This launch is already driving growth opportunities for our clients and the business," said Luke Taylor, CEO of Omnicom Precision Marketing. "By combining LeapPoint's Adobe expertise with Credera's transformation capabilities through Omnicom's integrated client service model, we are well positioned to help clients transform their operations and drive sustainable revenue growth."Showcasing the Omnicom Adobe Practice at Adobe SummitOmnicom will officially unveil this unified Adobe practice at Adobe's Summit in April as a Diamond Sponsor. To learn more about Omnicom's Adobe practice, visit https://adobe.omc.com/adobe-summit.About Omnicom
Omnicom (NYSE:OMC) is the world's leading marketing and sales company, built for intelligent growth in the next era. Powered by Omni and its proprietary data and identity, Omnicom's Connected Capabilities unite the company's world-class agency brands, exceptional talent, and deep domain expertise across media, commerce, consulting, precision marketing, advertising, production, health, public relations, branding, and experiential to address clients' most critical growth priorities. For more information, visit www.omc.com.About Credera
Credera (Credera.com), Omnicom's Transformation Consultancy, empowers the world's leading brands to navigate the complexities of data, technology, and marketing. As a global consultancy embedded with Omnicom's creative and media scale, we bridge marketing ambition and technical execution to accelerate growth quickly and sustainably. Combining deep technical and data expertise with creative firepower, Credera's more than 3,000 consultants across the globe help enterprise leaders achieve marketing and advertising enablement and technology and data excellence.
View original content:https://www.prnewswire.com/news-releases/omnicoms-transformation-consultancy-strengthens-capabilities-with-the-launch-of-unified-adobe-practice-302731423.htmlSOURCE Omnicom Group Inc.
Original: Omnicom's Transformation Consultancy Strengthens Capabilities with the Launch of Unified Adobe Practice
US Market News
3月前
OMNICOM MEDIA NAMED BEST PERFORMING GLOBAL MEDIA GROUP, EARNS #1 RANKING ACROSS ALL FOUR REGIONSMarch 26, 2026 11:22 AM
PR Newswire (US)
Latest RECMA Diagnostics Report Sees OM agency OMD Scoring Its 11th Consecutive #1 Ranking, with PHD, Initiative and UM All Earning Slots Among the Top Ten NEW YORK, March 26, 2026 /PRNewswire/ -- In the latest edition of the Network Diagnostics report from RECMA (Research Company Evaluating the Media Agency Industry), Omnicom Media, an Omnicom (NYSE: OMC) connected capability, been named the best performing global media group, topping both the global ranking as well as the regional rankings across North America, EMEA, APAC and LATAM.
As RECMA notes in its report, Omnicom Media – officially created in December 2025 by the integration of Omnicom Media Group and IPG Mediabrands - is "emerging as the new industry powerhouse." The leader in Activity Volume/Billings with approximately 30% industry share, Omnicom Media also leads this Diagnostic Report globally with just under 35% of quali-share (approximately 50% higher than the #2 ranked group).Concurrently, four of the top 10 best performing media agencies were Omnicom Media brands, including OMD (ranked #1 for the 11th consecutive report), PHD, Initiative and UM.Widely considered the most comprehensive report for analyzing media agency performance, the bi-annual RECMA Diagnostics report is based on the evaluation of approximately 700 agencies in 45 markets. Utilizing 19 KPIs to evaluate vitality and structure, the report offers an assessment index that goes beyond typical quantitative metrics such as new business wins or billings volume alone to also consider criteria such as client portfolio and relationship stability; digital, data & content resources; and homogeneity across geographies. Participating agencies are ranked both numerically by "quali-points" and by the following profiles: Dominant, High Profile, Very Good Profile, Good Profile, and Average Profile.The Dominant profile is awarded in a market where an agency significantly outperforms its competitors across multiple Diagnostic criteria. In the current report, Omnicom Media agency brands were dominant in 19 markets - more than any other media group – encompassing all four regions. "In creating Omnicom Media, the goal was never to simply be the biggest, but to use that scale intelligently to design the leading growth ecosystem for our clients. The comparison between our 30% volume share and almost 35% quali-share proves that scale can be multiplied when combined with industry leading capabilities and talent," says Omnicom Media CEO Florian Adamski. "The strength of that offer is reflected not only in Omnicom Media's #1 ranking globally and across every region - but also in the continued leadership of OMD and the strength of PHD, Initiative, and UM, speaks to the consistency, collaboration, and ambition of our teams worldwide.RECMA Ranking Caps an Impressive First Hundred DaysThe report lands as Omnicom Media recently marked its first 100 days, during which OM announced first-mover data partnerships with Amazon, Google, Meta, Roku, Pinterest, and Walmart; saw Omnicom's commerce capabilities receive the highest possible scores in the Forrester Commerce Services Wave evaluation; paved the way for more than 30 clients to participate in the launch of ChatGPT ads; and was awarded $5 billion in new business, wins, retentions, and expansions. In recent weeks, trade publications have reported Delta, Dyson, and streaming platform SkyShowtime entrusting their global media investment business to Omnicom Media.Says Adamski, "As we move beyond our first 100 days, these milestones reinforce our belief that growth by design - powered by Omnicom Media's unique advantages in scale data, identity, commerce and talent - will enable us to deliver outsized growth for our clients and define the future of our industry."OMD's Lock on #1 Holds for Historic 11th CycleDescribing OMD's 11th top ranking as representing a "very comfortable" lead vs. the #2 ranked agency, RECMA reported that OMD also showed the greatest consistency of its performance across the 45 markets studied, ranking Dominant or High Profile in 62% of all markets. Looking at diversified services, OMD was ranked #1 in North America and EMEA for Digital, Data and Content experts.In the July 2025 RECMA Overall Activity Volume (OAV) analysis that tracks billings volume for more than 800 agencies across 54 markets), OMD was once again ranked #1 by volume, with close to $USD 35.6 billion in total billings - outperforming its nearest competitor by $4.4 billion – and YoY growth of +9.5 %.ABOUT OMNICOM MEDIAOmnicom Media, an Omnicom (NYSE: OMC) Connected Capability, is the world's largest global media management network. Powered by the Omni Intelligence Platform, Omnicom Media agencies leverage $73.5 billion in billings, 40,000+ specialists across 70+ markets, and the industry's most powerful portfolio of Identity (Acxiom RealID™), Commerce (Flywheel), and Intelligence (Q™) assets to design dynamic Growth Ecosystems that enable the world's most ambitious businesses to grow faster and smarter. The Omnicom Media portfolio includes leading global media agency brands OMD, Initiative, PHD, UM, Hearts & Science, and Mediahub; Data, Identity & Analytics powerhouses Acxiom and Annalect; and a broad spectrum of specialized services. For more information visit omnicommedia.comCONTACT: Isabelle Gauvry, isabelle.gauvry@omc.com
View original content to download multimedia:https://www.prnewswire.com/news-releases/omnicom-media-named-best-performing-global-media-group-earns-1-ranking-across-all-four-regions-302726276.htmlSOURCE Omnicom Media Group
Original: OMNICOM MEDIA NAMED BEST PERFORMING GLOBAL MEDIA GROUP, EARNS #1 RANKING ACROSS ALL FOUR REGIONS
US Market News
3月前
Omnicom Agencies Dominate Fast Company's Most Innovative Companies 2026March 24, 2026 11:12 AM
PR Newswire (US)
NEW YORK, March 24, 2026 /PRNewswire/ -- Omnicom (NYSE: OMC), the world's leading marketing and sales company, today announced five of its agencies have been named to Fast Company's Most Innovative Companies 2026. Four agencies were recognized on the Advertising & Marketing list, more than any other holding company. Additionally, Weber Shandwick ranked #2 on the Public Relations and Brand Strategies list, topping the list for the third year in a row.Fast Company's Most Innovative Companies list is the definitive source for recognizing the organizations that are transforming industries and shaping society. Having Omnicom agencies such as BBDO, Goodby Silverstein & Partners, MARTIN, and Weber Shandwick, recognized across sectors speaks to the depth and diversity of innovation happening throughout the company. The recognition reflects Omnicom's commitment to supporting the individuality of its agencies—empowering each to define and pursue innovation on its own terms while honoring their distinct cultures, talent, and perspectives.Recognizing the agencies' work and development through 2025 – the list celebrated those rethinking how they develop creative work, invest in talent, and build AI systems that help brands show up clearly in a fragmented world. At Goodby Silverstein & Partners, that meant a focus on "mass intimacy," using creativity to deliver broad reach with personal, emotional impact through culturally resonant campaigns for brands like Mountain Dew, Cheetos, and Doritos.Innovation also remained central to MARTIN, which continued its long evolution from a PR shop into a modern cultural agency, refining how it creates work, supports its people, and helps brands show up with clarity and consistency.Weber Shandwick continued to deepen its strategic role with clients, winning major new business including Mars and expanding seven-figure engagements, while also advancing the use of AI through proprietary tools and broad employee training.At BBDO, creativity was positioned as a driver of business growth and measurable impact. Guided by its mission to DO BIG THINGS, the agency strengthened its role as a business partner through cross-functional teams that test ideas against business metrics and help clients build enduring IP rather than one-off campaigns. FCB was also cited in the list for its category-defining campaigns driven by creative teams now primarily united with BBDO as part of the acquisition of Interpublic Group in late 2025."Having five Omnicom agencies recognized among Fast Company's Most Innovative Companies validates the exceptional talent and ingenuity within our company," said John Wren, Chairman and CEO, Omnicom. "We've always empowered our agencies to keep their individuality and culture while leveraging our collective intelligence, tools, and AI capabilities. The result is five completely different visions for 'innovation', but all with amazing results for our clients. I want to congratulate each of these agencies for their recognition and for their constant evolution that keeps them at the top of the industry."To learn more, visit Fast Company.This recognition follows another significant industry validation. Last week, WARC named Omnicom the #1 holding company for effectiveness in its Effective 100 ranking. The ranking recognizes the world's most awarded campaigns and companies for delivering tangible business impact.About Omnicom
Omnicom (NYSE: OMC) is the world's leading marketing and sales company, built for intelligent growth in the next era. Powered by Omni, Omnicom's Connected Capabilities unite the company's world-class agency brands, exceptional talent, and deep domain expertise across media, commerce, consulting, precision marketing, advertising, production, health, public relations, branding, and experiential to address clients' most critical growth priorities. For more information, visit www.omc.com.
View original content:https://www.prnewswire.com/news-releases/omnicom-agencies-dominate-fast-companys-most-innovative-companies-2026-302723594.htmlSOURCE Omnicom Group Inc.
Original: Omnicom Agencies Dominate Fast Company's Most Innovative Companies 2026
US Market News
4月前
OMNICOM PRICES SENIOR NOTES OFFERINGSFebruary 25, 2026 7:09 PM
PR Newswire (US)
NEW YORK, Feb. 25, 2026 /PRNewswire/ -- Omnicom (NYSE: OMC) today announced the pricing of its public offerings of (i) $1.7 billion aggregate principal amount of senior notes (collectively, the "USD Notes") to be issued by Omnicom and (ii) €600 million aggregate principal amount of senior notes to be issued by Omnicom Finance Holdings plc (the "Euro Notes Issuer"), a wholly owned indirect subsidiary of Omnicom, which Euro Notes (as defined below) will be fully and unconditionally guaranteed by Omnicom. The offerings are comprised of the following tranches:
$400 million aggregate principal amount of 4.200% Senior Notes due 2029 (the "2029 Notes");$700 million aggregate principal amount of 5.000% Senior Notes due 2033 (the "2033 Notes");$600 million aggregate principal amount of 5.300% Senior Notes due 2036 (the "2036 Notes"); and€600 million aggregate principal amount of 3.850% Senior Notes due 2034 (the "Euro Notes").The offerings are expected to close on March 2, 2026, subject to the satisfaction of customary closing conditions. The offerings are not conditioned on each other.The USD Notes Offering
The 2029 Notes, 2033 Notes and the 2036 Notes will mature on March 2, 2029, June 2, 2033 and June 2, 2036, respectively. The USD Notes will be the unsecured and unsubordinated obligations of Omnicom and will rank equal in right of payment to all its existing and future unsecured senior indebtedness.The USD Notes will not be listed on any securities exchange or included in any automated quotation system.Omnicom intends to use the net proceeds from the USD Notes offering to fund the repayment of its 3.600% Senior Notes due 2026 co-issued with Omnicom Capital Inc., which mature on April 15, 2026, of which $1.4 billion aggregate principal amount was outstanding as of December 31, 2025, and any remaining proceeds for general corporate purposes, which could include working capital expenditures, fixed asset expenditures, acquisitions, repayment of commercial paper and short-term debt, refinancing of other debt, repurchases of Omnicom's common stock or other capital transactions.Citigroup Global Markets Inc. and Deutsche Bank Securities Inc. are acting as joint global coordinators and joint book-running managers and BofA Securities, Inc., J.P. Morgan Securities LLC and Wells Fargo Securities, LLC are acting as joint book-running managers for the USD Notes offering.The Euro Notes Offering
The Euro Notes will mature on May 2, 2034. The Euro Notes will be fully and unconditionally guaranteed by Omnicom. The Euro Notes and the related guarantee will be the unsecured and unsubordinated obligations of the Euro Notes Issuer and Omnicom, respectively, and will rank equal in right of payment to all of their respective existing and future unsecured senior indebtedness.A listing application will be made to have the Euro Notes listed on The New York Stock Exchange, which will be subject to approval by The New York Stock Exchange. If such a listing is obtained, the Euro Notes Issuer will have no obligation to maintain such listing, and the Euro Notes Issuer may delist the Euro Notes at any time.The Euro Notes Issuer intends to use the net proceeds from the Euro Notes offering for general corporate purposes, which could include working capital expenditures, fixed asset expenditures, acquisitions, repayment of commercial paper and short-term debt, refinancing of other debt, repurchases of Omnicom's common stock or other capital transactions.Citigroup Global Markets Limited and Deutsche Bank AG, London Branch are acting as joint global coordinators and joint book-running managers and BNP PARIBAS and HSBC Bank plc are acting as joint book-running managers for the Euro Notes offering.This press release does not constitute an offer to sell or the solicitation of an offer to buy any securities in any jurisdiction to any person to whom it is unlawful to make an offer, solicitation or sale in such jurisdiction. The public offerings are being made pursuant to an effective shelf registration statement that has been filed with the Securities and Exchange Commission ("SEC"). A final prospectus supplement related to the Euro Notes offering will be filed with the SEC and will be available on the SEC's website at http://www.sec.gov. In addition, copies of the prospectus and prospectus supplement relating to the Euro Notes offered in the Euro Notes offering may be obtained by contacting any of the following underwriters: Citigroup Global Markets Limited at 1-800-831-9146, Deutsche Bank AG, London Branch at 1-800-503-4611, BNP PARIBAS at 1-800-854-5674 and HSBC Bank plc at 1-866-811-8049. A separate final prospectus supplement related to the USD Notes offering will be filed with the SEC and will be available on the SEC's website at http://www.sec.gov. In addition, copies of the prospectus and prospectus supplement relating to the USD Notes offered in the USD Notes offering may be obtained by contacting any of the following underwriters: Citigroup Global Markets Inc. at 1-800-831-9146, Deutsche Bank Securities Inc. at +1-800-503-4611, BofA Securities, Inc. at 201 North Tryon Street, NC1-022-02-25, Charlotte, NC 28255-0001, Attn: Prospectus Department or toll-free at 1-800-294-1322 or by email at dg.prospectus_requests@bofa.com, J.P. Morgan Securities LLC, c/o Broadridge Financial Solutions, at 1155 Long Island Avenue, Edgewood, NY 11717 or by email at prospectus-eq_fi@jpmchase.com and postsalemanualrequests @Georgia Bard-645-3751.MIFID II AND UK MIFIR PRODUCT GOVERNANCE / PROFESSIONAL INVESTORS AND ELIGIBLE COUNTERPARTIES ONLY TARGET MARKET / NO PRIIPs KID OR UK PRIIPs KID — Manufacturer target market is eligible counterparties and professional clients only (all distribution channels). No key information document ("KID") under Regulation (EU) No. 1286/2014 (as amended, the "PRIIPs Regulation") or PRIIPS Regulation as it forms part of domestic law by virtue of the European Union (Withdrawal) Act 2018 ("EUWA") (the "UK PRIIPs Regulation") has been prepared as the notes are not available to retail investors in a member state of the European Economic Area (the "EEA") or the United Kingdom ("UK").In the EEA, the notes offered are not intended to be offered, sold or otherwise made available to and should not be offered, sold or otherwise made available to any retail investor in the EEA. For these purposes, a retail investor means a person who is one (or more) of: (i) a retail client as defined in point (11) of Article 4(1) of Directive 2014/65/EU (as amended, "MiFID II"); or (ii) a customer within the meaning of Directive (EU) 2016/97, as amended, where that customer would not qualify as a professional client as defined in point (10) of Article 4(1) of MiFID II; or (iii) not a qualified investor as defined in Regulation (EU) 2017/1129, as amended or superseded. Consequently, no KID required by the PRIIPs Regulation, for offering or selling the notes or otherwise making them available to retail investors in the EEA has been prepared and therefore offering or selling the notes or otherwise making them available to any retail investor in the EEA may be unlawful under the PRIIPs Regulation.In the UK, the notes are not intended to be offered, sold or otherwise made available to and should not be offered, sold or otherwise made available to any retail investor in the UK. For these purposes, a retail investor means a person who is neither: (i) a professional client, as defined in point (8) of Article 2(1) of Regulation (EU) No 600/2014 as it forms part of domestic law by virtue of the EUWA (the "UK MiFIR"); nor (ii) a qualified investor as defined in paragraph 15 of Schedule 1 to The Public Offers and Admissions to Trading Regulations 2024. Consequently, no KID required by the UK PRIIPs Regulation for offering or selling the notes or otherwise making them available to retail investors in the UK has been prepared and therefore offering or selling the notes or otherwise making them available to any retail investor in the UK may be unlawful under the UK PRIIPs Regulation.In the UK, this press release is for distribution only to persons who (i) have professional experience in matters relating to investments falling within Article 19(5) of the Financial Services and Markets Act 2000 (Financial Promotion) Order 2005 (as amended, the "Financial Promotion Order"), (ii) are persons falling within Article 49(2)(a) to (d) ("high net worth companies, unincorporated associations etc.") of the Financial Promotion Order, (iii) are outside the UK, or (iv) are persons to whom an invitation or inducement to engage in investment activity (within the meaning of section 21 of the FSMA) in connection with the issue or sale of any securities may otherwise lawfully be communicated or caused to be communicated (all such persons together being referred to as "relevant persons"). This press release is directed only at relevant persons and must not be acted on or relied on by persons who are not relevant persons. Any investment or investment activity to which this press release relates is available only to relevant persons and will be engaged in only with relevant persons.About Omnicom
Omnicom (NYSE: OMC) is the world's leading marketing and sales company, built for intelligent growth in the next era. Powered by Omni, Omnicom's Connected Capabilities unite the company's world-class agency brands, exceptional talent, and deep domain expertise across media, commerce, consulting, precision marketing, advertising, production, health, public relations, branding, and experiential to address clients' most critical growth priorities.Forward-Looking Statements
Certain statements in this press release constitute forward-looking statements, including statements within the meaning of the Private Securities Litigation Reform Act of 1995, as amended. In addition, from time to time, Omnicom or its representatives have made, or may make, forward-looking statements, orally or in writing. These statements, other than statements of historical fact, may discuss goals, intentions and expectations as to future plans, trends, events, results of operations or financial condition, or otherwise, based on current beliefs of Omnicom's management as well as assumptions made by, and information currently available to, Omnicom's management. Forward-looking statements may be accompanied by words such as "aim," "anticipate," "believe," "plan," "could," "should," "would," "estimate," "expect," "forecast," "future," "guidance," "intend," "may," "will," "possible," "potential," "predict," "project" or similar words, phrases or expressions. These forward-looking statements are subject to various risks and uncertainties, many of which are outside Omnicom's control. Therefore, you should not place undue reliance on such statements. Factors that could cause actual results to differ materially from those in the forward-looking statements include:risks relating to the completed merger (the "Merger") between Omnicom and The Interpublic Group of Companies, Inc. ("IPG"), including risks related to the integration of IPG's business, such as, among others: uncertainties associated with retaining key management and other employees; potential disruptions to client, vendor, and business partner relationships; the risk that integration activities may be more time-consuming, complex, or costly than expected; the possibility that anticipated synergies, efficiencies, and other benefits of the Merger may not be realized, or may be realized more slowly than anticipated; and risks associated with managing a larger, more complex combined organization and effectively integrating systems, processes, operations, and cultures;adverse economic conditions, including geopolitical events, international hostilities, acts of terrorism, public health crises, inflation or stagflation, tariffs and other trade barriers, central bank interest rate policies in countries that comprise Omnicom's major markets, labor and supply chain issues affecting the distribution of Omnicom's clients' products, or a disruption in the credit markets;international, national or local economic conditions that could adversely affect Omnicom or its clients;reductions in client spending, a slowdown in client payments or a deterioration or disruption in the credit markets;the ability to attract new clients and retain existing clients in the manner anticipated;changes in client marketing and communications services requirements;failure to manage potential conflicts of interest between or among clients;unanticipated changes related to competitive factors in the marketing and communications services industries;unanticipated changes to, or an inability to hire and retain key personnel;currency exchange rate fluctuations;reliance on information technology systems and risks related to cybersecurity incidents;effective management of the risks, challenges and efficiencies presented by utilizing artificial intelligence, or AI, technologies and related partnerships in Omnicom's business, and their use by Omnicom's competitors;failure to adapt to technological developments;Omnicom's liquidity, long-term financing needs, credit ratings and access to capital markets;changes in legislation or governmental regulations affecting Omnicom or its clients;losses on media purchases and production costs incurred on behalf of clients;risks associated with assumptions Omnicom makes in connection with Omnicom's acquisitions, critical accounting estimates and legal proceedings;Omnicom's international operations, which are subject to the risks of currency repatriation restrictions, social or political conditions and an evolving regulatory environment in high-growth markets and developing countries;risks related to Omnicom's environmental, social and governance goals and initiatives, including impacts from regulators and other stakeholders, and the impact of factors outside of Omnicom's control on such goals and initiatives;changes in tax rates, tax laws, regulations or interpretations, or adverse outcomes of tax audits or proceedings; andother business, financial, operational and legal risks and uncertainties detailed from time to time in Omnicom's SEC filings.The foregoing list of factors is not exhaustive. You should carefully consider the foregoing factors and the other risks and uncertainties that may affect Omnicom's business, including those described in Item 1A, "Risk Factors" and Item 7, "Management's Discussion and Analysis of Financial Condition and Results of Operations" in Omnicom's Annual Report on Form 10-K for the year ended December 31, 2025 and in other documents filed from time to time with the SEC. Except as required under applicable law, Omnicom does not assume any obligation to update these forward-looking statements.
View original content:https://www.prnewswire.com/news-releases/omnicom-prices-senior-notes-offerings-302697706.htmlSOURCE Omnicom Group Inc.
Original: OMNICOM PRICES SENIOR NOTES OFFERINGS
US Market News
4月前
Omnicom Named a Leader in Commerce Services by Independent Research FirmFebruary 17, 2026 11:05 AM
PR Newswire (US)
NEW YORK, Feb. 17, 2026 /PRNewswire/ -- Omnicom (NYSE: OMC), the world's leading marketing and sales company, today announced it has been named a Leader in "The Forrester Wave™: Commerce Services, Q1 2026" by Forrester Research, Inc.Within Forrester's 23-point evaluation, Omnicom received the highest scores possible in 18 criteria, including B2C commerce strategy development process; vision; innovation; AI-powered commerce strategy, technology, and ops; retail media activation, buy, and run; awards in creativity; digital shelf, data, and analytics; CRM and loyalty program design; physical store merchandising; partner ecosystem; pricing flexibility and transparency; and global delivery strategy.This recognition follows Omnicom's 2024 acquisition of Flywheel Digital, a global leader in digital commerce. The addition of Flywheel established Omnicom as one of the world's largest buyers of retail media, with more than $10 billion of retail media under management. Access to Flywheel Commerce Cloud – the largest digital transaction dataset – solidified Omnicom's position as a global leader in connected commerce experiences across hundreds of retailers and digital marketplaces, including Amazon, Walmart, Target, Alibaba, and more. In November 2025, Omnicom strengthened its elite data foundation through its acquisition of Interpublic. The transaction provided access to Acxiom Real ID™, the largest and most ethically sourced identity in the industry spanning 2.6 billion verified global IDs. Omnicom further enhances this identity with trillions of media, content, cultural, and commerce signals – including those from Flywheel Commerce Cloud – as well as the industry's most advanced ID-less solutions. Combined, its data and identity provide the most comprehensive, high-fidelity view of consumers and their behavior worldwide.Omnicom's commerce offering is powered by Omni, its AI-driven marketing intelligence platform. Built on Acxiom Real ID™, enriched with real-time commerce signals from Flywheel Commerce Cloud, and strengthened by cross-platform identity intelligence, Omni gives teams a reliable, shared view of consumers and performance. With a consistent source of truth from planning through performance, teams can make sharper strategic decisions.Omnicom's leadership in connected commerce is bolstered by its deep in-store retail capabilities and the commerce technology leadership of Credera, its digital transformation consultancy. Together, these capabilities position Omnicom as a commerce powerhouse that helps clients accelerate into the rapidly expanding digital commerce and retail media sectors.The Forrester evaluation noted that Omnicom's "vision of connected commerce differentiates by spanning both demand and loyalty across physical stores, online marketplaces, and direct-to-consumer (DTC) experiences. Co-innovation with partners like Adobe and Salesforce is at scale within a broad partner network, including with retail partners like Amazon, TikTok Shop, and Walmart.""Our ranking in this Forrester Wave™ confirms Omnicom's leadership in commerce services," said John Wren, Chairman and CEO of Omnicom. "With the integration of Flywheel and Acxiom into our commerce capabilities, we've built the industry's most powerful intelligence engine that will help our clients transform every consumer touchpoint into a driver of measurable sales growth.""Omnicom offers outstanding commerce strategy development and execution in most facets of commerce, including physical point-of-sale solutions, CRM and loyalty programs, retail media, and commerce organization design," the report continues. "Customers praise Omnicom's ability to perform as a single agency, giving them access to a large talent pool. They acknowledge it's unlikely they will encounter a challenge Omnicom hasn't already tackled."To learn more, read the full report: The Forrester Wave™: Commerce Services, Q1 2026.Forrester does not endorse any company, product, brand, or service included in its research publications and does not advise any person to select the products or services of any company or brand based on the ratings included in such publications. Information is based on the best available resources. Opinions reflect judgment at the time and are subject to change. For more information, read about Forrester's objectivity here.About Omnicom
Omnicom (NYSE: OMC) is the world's leading marketing and sales company, built for intelligent growth in the next era. Powered by Omni, Omnicom's Connected Capabilities unite the company's world-class agency brands, exceptional talent, and deep domain expertise across media, commerce, consulting, precision marketing, advertising, production, health, public relations, branding, and experiential to address clients' most critical growth priorities. For more information, visit www.omc.com.
View original content:https://www.prnewswire.com/news-releases/omnicom-named-a-leader-in-commerce-services-by-independent-research-firm-302689657.htmlSOURCE Omnicom Group Inc.
Original: Omnicom Named a Leader in Commerce Services by Independent Research Firm
 Hot Features

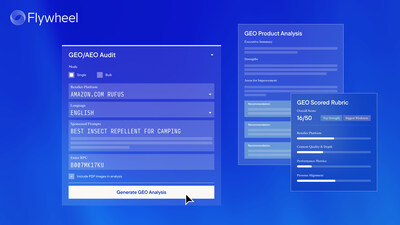
 Monksdream
2年前
Monksdream
2年前
 ValueInvestor15
9年前
ValueInvestor15
9年前
 investora2z
13年前
investora2z
13年前
 Penny Roger$
14年前
Penny Roger$
14年前
 メールアドレスで登録