Pay vs Performance Disclosure
|
12 Months Ended |
|
Nov. 30, 2023
USD ($)
|
Nov. 30, 2022
USD ($)
|
Nov. 30, 2021
USD ($)
|
Nov. 30, 2020
USD ($)
|
Nov. 30, 2019
USD ($)
|
| Pay vs Performance Disclosure |
|
|
|
|
|
| Pay vs Performance Disclosure, Table |
Pay Versus Performance For all fiscal years from 2019 - 2023, the Principal Executive Officer (“CEO”) was Richard B. Handler and “Other NEOs” included Brian P. Friedman, Joseph S. Steinberg, Michael J. Sharp and Theresa S. Gendron. In fiscal 2022 and 2023, Other NEOs also included Matthew S. Larson. The Summary Compensation Table totals reported for our CEO for fiscal 2019 - 2023 and those amounts for the Other NEOs reflected in the table on page 64 were subject to the following adjustments per Item 402(v)(2)(iii) of Regulation S-K to calculate “compensation actually paid”: Summary Compensation Table total compensation | | | $26,136,030 | | | $6,970,239 | | | $56,897,424 | | | $13,636,275 | | | $28,872,946 | | | $9,788,301 | | | $18,885,956 | | | $6,941,979 | | | $9,231,958 | | | $4,010,708 | Deduction for change in pension value in Summary Compensation Table | | | — | | | — | | | — | | | — | | | (15,287) | | | — | | | (66,692) | | | — | | | (36,833) | | | — | Increase - “Service cost” and “Prior service cost” for pension benefits | | | — | | | — | | | — | | | — | | | — | | | — | | | — | | | — | | | — | | | — | Deduction for amount reported under the “Stock Awards” and “Option Awards” columns of the Summary Compensation Table | | | (16,306,281) | | | (2,785,146) | | | (45,435,003) | | | (9,087,001) | | | (15,666,463) | | | (3,916,616) | | | — | | | — | | | — | | | — | Increase - year-end fair value of equity awards granted during year that remain unvested at year end | | | 13,718,620 | | | 2,282,185 | | | 46,726,109 | | | 9,345,222 | | | — | | | — | | | | | | | | | | | | | Increase - vest-date fair value of equity awards granted during year that vested during year | | | 2,022,899 | | | 404,580 | | | | | | | | | 15,666,463 | | | 3,916,616 | | | | | | | | | | | | | Increase/deduct - Change in fair value of all equity awards unvested at prior year end and at year end (year-end fair value minus prior-year-end fair value) | | | 4,648,323 | | | 630,381 | | | 10,536,256 | | | 2,107,251 | | | 37,842,380 | | | 9,463,138 | | | 5,844,028 | | | 1,466,494 | | | (1,508,820) | | | (1,504,894) | Increase/deduct - Change in fair value of all equity awards unvested at prior year end that vested during year (vest date fair value minus prior-year-end fair value) | | | 3,563,008 | | | 712,602 | | | (673,626) | | | (135,523) | | | — | | | 10,502 | | | 1,180,337 | | | 301,108 | | | (3,803,170) | | | (964,704) | Deduct - Fair value of equity awards unvested at prior year end but forfeited during year (deduct fair value at prior year end) | | | | | | — | | | — | | | — | | | — | | | — | | | (3,649,347) | | | (912,337) | | | | | | | Increase - dividends paid on restricted stock and dividend equivalents accrued on unvested equity awards or prior to vesting during the year (not otherwise counted in Summary Compensation Table or year-end or vest-date fair value of equity awards) | | | 155,202 | | | 60,607 | | | — | | | — | | | — | | | — | | | | | | 1,604 | | | | | | 15,974 | | | | | | | | | | | | | | | | | | | | | | | | | | | | | | | | Total adjustments | | | $7,801,772 | | | $1,305,208 | | | $11,153,736 | | | $2,229,949 | | | $37,827,093 | | | $9,473,640 | | | $3,308,327 | | | $856,869 | | | $(9,829,449) | | | $ (2,457,550) | Total - “Compensation Actually Paid” | | | $33,937,802 | | | $8,275,448 | | | $68,051,160 | | | $ 15,866,224 | | | $66,700,039 | | | $ 19,261,941 | | | $ 22,194,283 | | | $ 7,798,848 | | | $(597,491) | | | $1,553,158 |
The fair value of equity awards is determined in a manner consistent with that disclosed in our consolidated financial statements included in our 2023 Annual Report on Form 10-K, and in footnotes (1) and (2) to the Summary Compensation Table on page 56. Awards of RSUs are valued based on the closing market price of our Common Shares at each measurement date, subject to the following: (i) Performance-based RSUs based on TSR performance (with performance periods covering fiscal 2019 - 2022) were valued using a Monte Carlo valuation model at each measurement date; (ii) performance-based RSUs based on return on tangible equity (ROTE) or return on tangible deployable equity (ROTDE) performance were valued based on the probable outcome of the performance goal at each measurement date; (iii) awards subject to mandatory holding periods following vesting were valued at each measurement date with a discount based on the illiquidity of the vested shares subject to the holding period. Stock options were valued using the Black-Scholes valuation methodology. As required by Item 402(v) of Regulation S-K, we are providing the following information about the relationship between executive compensation deemed to be “compensation actually paid” or CAP (as that term is used in Item 402(v)) and certain key metrics relating to our financial performance. For further information regarding how our executive compensation program is structured and how we align executive compensation with Jefferies’ performance, please see “Compensation Discussion and Analysis” above. 2023 | | | 26,136,030 | | | 33,937,802 | | | 6,970,239 | | | 8,275,448 | | | $211.93 | | | $148.14 | | | $263,072 | | | 3.7% | 2022 | | | 56,897,424 | | | 68,051,160 | | | 13,636,275 | | | 15,866,224 | | | 209.65 | | | 146.91 | | | 777,168 | | | 10.3% | 2021 | | | 28,872,946 | | | 66,700,039 | | | 9,788,301 | | | 19,261,941 | | | 200.28 | | | 150.61 | | | 1,677,403 | | | 24.5% | 2020 | | | 18,885,956 | | | 22,194,283 | | | 6,941,979 | | | 7,798,848 | | | 117.98 | | | 108.44 | | | 769,605 | | | 11.7% | 2019 | | | 9,231,958 | | | (597,491) | | | 4,010,708 | | | 1,553,158 | | | 104.90 | | | 114.16 | | | 959,593 | | | 5.9% |
(1) Return on Tangible Equity (“ROTE”) is a non-GAAP measure. For reconciliation to GAAP amounts, see Annex A of this Proxy Statement.
|
|
|
|
|
| Company Selected Measure Name |
Return on Tangible Equity (“ROTE”)
|
|
|
|
|
| Named Executive Officers, Footnote |
For all fiscal years from 2019 - 2023, the Principal Executive Officer (“CEO”) was Richard B. Handler and “Other NEOs” included Brian P. Friedman, Joseph S. Steinberg, Michael J. Sharp and Theresa S. Gendron. In fiscal 2022 and 2023, Other NEOs also included Matthew S. Larson.
|
|
|
|
|
| Peer Group Issuers, Footnote |
Significantly, Jefferies’ TSR was positive in each of the last five fiscal years. By comparison, the S&P500 Financials Index total return was negative in two of those years and, over the full five years Jefferies’ TSR significantly exceeded the total return of that index of financial services companies. Our performance in ROTE did not reach our targets in two of the five years, and compensation actually paid to our CEO and Other NEOs was correspondingly lower in those years.
|
|
|
|
|
| PEO Total Compensation Amount |
$ 26,136,030
|
$ 56,897,424
|
$ 28,872,946
|
$ 18,885,956
|
$ 9,231,958
|
| PEO Actually Paid Compensation Amount |
$ 33,937,802
|
68,051,160
|
66,700,039
|
22,194,283
|
(597,491)
|
| Adjustment To PEO Compensation, Footnote |
The Summary Compensation Table totals reported for our CEO for fiscal 2019 - 2023 and those amounts for the Other NEOs reflected in the table on page 64 were subject to the following adjustments per Item 402(v)(2)(iii) of Regulation S-K to calculate “compensation actually paid”: Summary Compensation Table total compensation | | | $26,136,030 | | | $6,970,239 | | | $56,897,424 | | | $13,636,275 | | | $28,872,946 | | | $9,788,301 | | | $18,885,956 | | | $6,941,979 | | | $9,231,958 | | | $4,010,708 | Deduction for change in pension value in Summary Compensation Table | | | — | | | — | | | — | | | — | | | (15,287) | | | — | | | (66,692) | | | — | | | (36,833) | | | — | Increase - “Service cost” and “Prior service cost” for pension benefits | | | — | | | — | | | — | | | — | | | — | | | — | | | — | | | — | | | — | | | — | Deduction for amount reported under the “Stock Awards” and “Option Awards” columns of the Summary Compensation Table | | | (16,306,281) | | | (2,785,146) | | | (45,435,003) | | | (9,087,001) | | | (15,666,463) | | | (3,916,616) | | | — | | | — | | | — | | | — | Increase - year-end fair value of equity awards granted during year that remain unvested at year end | | | 13,718,620 | | | 2,282,185 | | | 46,726,109 | | | 9,345,222 | | | — | | | — | | | | | | | | | | | | | Increase - vest-date fair value of equity awards granted during year that vested during year | | | 2,022,899 | | | 404,580 | | | | | | | | | 15,666,463 | | | 3,916,616 | | | | | | | | | | | | | Increase/deduct - Change in fair value of all equity awards unvested at prior year end and at year end (year-end fair value minus prior-year-end fair value) | | | 4,648,323 | | | 630,381 | | | 10,536,256 | | | 2,107,251 | | | 37,842,380 | | | 9,463,138 | | | 5,844,028 | | | 1,466,494 | | | (1,508,820) | | | (1,504,894) | Increase/deduct - Change in fair value of all equity awards unvested at prior year end that vested during year (vest date fair value minus prior-year-end fair value) | | | 3,563,008 | | | 712,602 | | | (673,626) | | | (135,523) | | | — | | | 10,502 | | | 1,180,337 | | | 301,108 | | | (3,803,170) | | | (964,704) | Deduct - Fair value of equity awards unvested at prior year end but forfeited during year (deduct fair value at prior year end) | | | | | | — | | | — | | | — | | | — | | | — | | | (3,649,347) | | | (912,337) | | | | | | | Increase - dividends paid on restricted stock and dividend equivalents accrued on unvested equity awards or prior to vesting during the year (not otherwise counted in Summary Compensation Table or year-end or vest-date fair value of equity awards) | | | 155,202 | | | 60,607 | | | — | | | — | | | — | | | — | | | | | | 1,604 | | | | | | 15,974 | | | | | | | | | | | | | | | | | | | | | | | | | | | | | | | | Total adjustments | | | $7,801,772 | | | $1,305,208 | | | $11,153,736 | | | $2,229,949 | | | $37,827,093 | | | $9,473,640 | | | $3,308,327 | | | $856,869 | | | $(9,829,449) | | | $ (2,457,550) | Total - “Compensation Actually Paid” | | | $33,937,802 | | | $8,275,448 | | | $68,051,160 | | | $ 15,866,224 | | | $66,700,039 | | | $ 19,261,941 | | | $ 22,194,283 | | | $ 7,798,848 | | | $(597,491) | | | $1,553,158 |
The fair value of equity awards is determined in a manner consistent with that disclosed in our consolidated financial statements included in our 2023 Annual Report on Form 10-K, and in footnotes (1) and (2) to the Summary Compensation Table on page 56. Awards of RSUs are valued based on the closing market price of our Common Shares at each measurement date, subject to the following: (i) Performance-based RSUs based on TSR performance (with performance periods covering fiscal 2019 - 2022) were valued using a Monte Carlo valuation model at each measurement date; (ii) performance-based RSUs based on return on tangible equity (ROTE) or return on tangible deployable equity (ROTDE) performance were valued based on the probable outcome of the performance goal at each measurement date; (iii) awards subject to mandatory holding periods following vesting were valued at each measurement date with a discount based on the illiquidity of the vested shares subject to the holding period. Stock options were valued using the Black-Scholes valuation methodology.
|
|
|
|
|
| Non-PEO NEO Average Total Compensation Amount |
$ 6,970,239
|
13,636,275
|
9,788,301
|
6,941,979
|
4,010,708
|
| Non-PEO NEO Average Compensation Actually Paid Amount |
$ 8,275,448
|
15,866,224
|
19,261,941
|
7,798,848
|
1,553,158
|
| Adjustment to Non-PEO NEO Compensation Footnote |
The Summary Compensation Table totals reported for our CEO for fiscal 2019 - 2023 and those amounts for the Other NEOs reflected in the table on page 64 were subject to the following adjustments per Item 402(v)(2)(iii) of Regulation S-K to calculate “compensation actually paid”: Summary Compensation Table total compensation | | | $26,136,030 | | | $6,970,239 | | | $56,897,424 | | | $13,636,275 | | | $28,872,946 | | | $9,788,301 | | | $18,885,956 | | | $6,941,979 | | | $9,231,958 | | | $4,010,708 | Deduction for change in pension value in Summary Compensation Table | | | — | | | — | | | — | | | — | | | (15,287) | | | — | | | (66,692) | | | — | | | (36,833) | | | — | Increase - “Service cost” and “Prior service cost” for pension benefits | | | — | | | — | | | — | | | — | | | — | | | — | | | — | | | — | | | — | | | — | Deduction for amount reported under the “Stock Awards” and “Option Awards” columns of the Summary Compensation Table | | | (16,306,281) | | | (2,785,146) | | | (45,435,003) | | | (9,087,001) | | | (15,666,463) | | | (3,916,616) | | | — | | | — | | | — | | | — | Increase - year-end fair value of equity awards granted during year that remain unvested at year end | | | 13,718,620 | | | 2,282,185 | | | 46,726,109 | | | 9,345,222 | | | — | | | — | | | | | | | | | | | | | Increase - vest-date fair value of equity awards granted during year that vested during year | | | 2,022,899 | | | 404,580 | | | | | | | | | 15,666,463 | | | 3,916,616 | | | | | | | | | | | | | Increase/deduct - Change in fair value of all equity awards unvested at prior year end and at year end (year-end fair value minus prior-year-end fair value) | | | 4,648,323 | | | 630,381 | | | 10,536,256 | | | 2,107,251 | | | 37,842,380 | | | 9,463,138 | | | 5,844,028 | | | 1,466,494 | | | (1,508,820) | | | (1,504,894) | Increase/deduct - Change in fair value of all equity awards unvested at prior year end that vested during year (vest date fair value minus prior-year-end fair value) | | | 3,563,008 | | | 712,602 | | | (673,626) | | | (135,523) | | | — | | | 10,502 | | | 1,180,337 | | | 301,108 | | | (3,803,170) | | | (964,704) | Deduct - Fair value of equity awards unvested at prior year end but forfeited during year (deduct fair value at prior year end) | | | | | | — | | | — | | | — | | | — | | | — | | | (3,649,347) | | | (912,337) | | | | | | | Increase - dividends paid on restricted stock and dividend equivalents accrued on unvested equity awards or prior to vesting during the year (not otherwise counted in Summary Compensation Table or year-end or vest-date fair value of equity awards) | | | 155,202 | | | 60,607 | | | — | | | — | | | — | | | — | | | | | | 1,604 | | | | | | 15,974 | | | | | | | | | | | | | | | | | | | | | | | | | | | | | | | | Total adjustments | | | $7,801,772 | | | $1,305,208 | | | $11,153,736 | | | $2,229,949 | | | $37,827,093 | | | $9,473,640 | | | $3,308,327 | | | $856,869 | | | $(9,829,449) | | | $ (2,457,550) | Total - “Compensation Actually Paid” | | | $33,937,802 | | | $8,275,448 | | | $68,051,160 | | | $ 15,866,224 | | | $66,700,039 | | | $ 19,261,941 | | | $ 22,194,283 | | | $ 7,798,848 | | | $(597,491) | | | $1,553,158 |
The fair value of equity awards is determined in a manner consistent with that disclosed in our consolidated financial statements included in our 2023 Annual Report on Form 10-K, and in footnotes (1) and (2) to the Summary Compensation Table on page 56. Awards of RSUs are valued based on the closing market price of our Common Shares at each measurement date, subject to the following: (i) Performance-based RSUs based on TSR performance (with performance periods covering fiscal 2019 - 2022) were valued using a Monte Carlo valuation model at each measurement date; (ii) performance-based RSUs based on return on tangible equity (ROTE) or return on tangible deployable equity (ROTDE) performance were valued based on the probable outcome of the performance goal at each measurement date; (iii) awards subject to mandatory holding periods following vesting were valued at each measurement date with a discount based on the illiquidity of the vested shares subject to the holding period. Stock options were valued using the Black-Scholes valuation methodology.
|
|
|
|
|
| Compensation Actually Paid vs. Total Shareholder Return |
Relationship Between Compensation Actually Paid and Performance Measures The following chart, covering the past five fiscal years, demonstrates the correlation between (a) the compensation actually paid to Jefferies CEO and to Jefferies’ Other NEOs and (b) ROTE, TSR and the total return of the S&P 500 Financials Index. 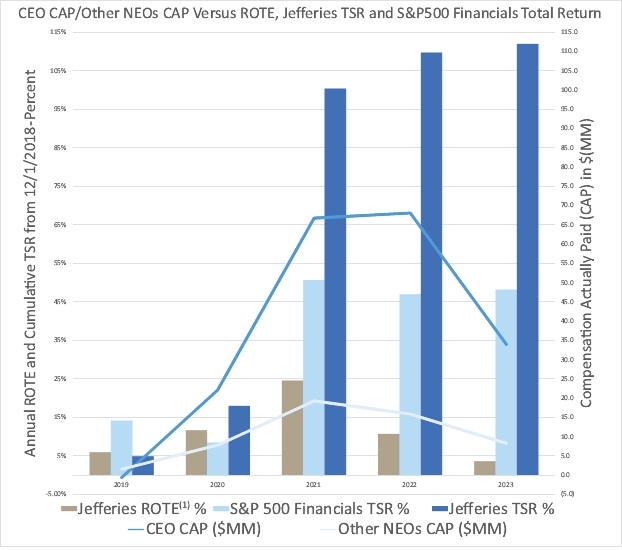
(1)
| ROTE is a non-GAAP measure. For reconciliation to GAAP amounts, see Annex A of this Proxy Statement. |
The above charts show that, over the past five fiscal years, compensation actually paid to the CEO and Other NEOs was reasonably aligned with ROTE and TSR and with Net Earnings. For the CEO, a significant factor affecting compensation actually paid is year-over-year changes in value of equity awards and, with respect to PSUs and the potential for and achievement of above-target earning of PSUs (particularly reflected in fiscal 2021 and 2022 CAP). The CEO’s CAP in fiscal 2022 was also increased by the grant of a retention award with a five-year service period and additional three-year holding period. These factors affect the compensation actually paid for Other NEOs, but to a lesser extent, because the President’s compensation (part of the average for the Other NEOs) is structured in the same way as the CEO’s compensation.
|
|
|
|
|
| Compensation Actually Paid vs. Net Income |
Relationship Between Compensation Actually Paid and Performance Measures The following chart, covering the past five fiscal years, demonstrates the correlation between the compensation actually paid to our CEO and our Other NEOs and our net earnings. 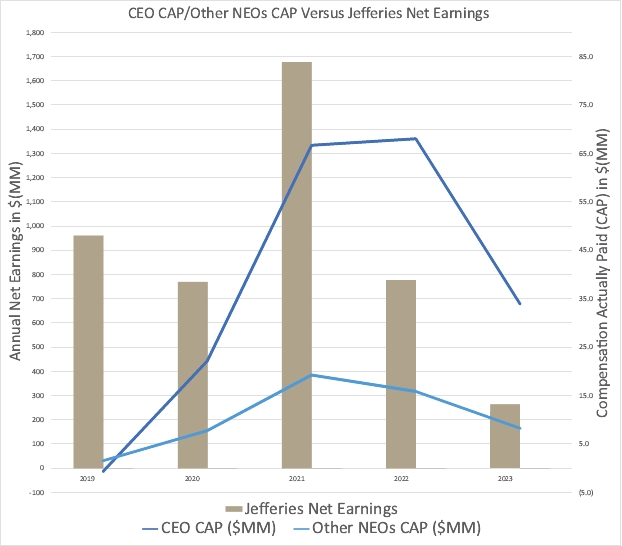
The above charts show that, over the past five fiscal years, compensation actually paid to the CEO and Other NEOs was reasonably aligned with ROTE and TSR and with Net Earnings. For the CEO, a significant factor affecting compensation actually paid is year-over-year changes in value of equity awards and, with respect to PSUs and the potential for and achievement of above-target earning of PSUs (particularly reflected in fiscal 2021 and 2022 CAP). The CEO’s CAP in fiscal 2022 was also increased by the grant of a retention award with a five-year service period and additional three-year holding period. These factors affect the compensation actually paid for Other NEOs, but to a lesser extent, because the President’s compensation (part of the average for the Other NEOs) is structured in the same way as the CEO’s compensation.
|
|
|
|
|
| Compensation Actually Paid vs. Company Selected Measure |
Relationship Between Compensation Actually Paid and Performance Measures The following chart, covering the past five fiscal years, demonstrates the correlation between (a) the compensation actually paid to Jefferies CEO and to Jefferies’ Other NEOs and (b) ROTE, TSR and the total return of the S&P 500 Financials Index.
(1)
| ROTE is a non-GAAP measure. For reconciliation to GAAP amounts, see Annex A of this Proxy Statement. |
The above charts show that, over the past five fiscal years, compensation actually paid to the CEO and Other NEOs was reasonably aligned with ROTE and TSR and with Net Earnings. For the CEO, a significant factor affecting compensation actually paid is year-over-year changes in value of equity awards and, with respect to PSUs and the potential for and achievement of above-target earning of PSUs (particularly reflected in fiscal 2021 and 2022 CAP). The CEO’s CAP in fiscal 2022 was also increased by the grant of a retention award with a five-year service period and additional three-year holding period. These factors affect the compensation actually paid for Other NEOs, but to a lesser extent, because the President’s compensation (part of the average for the Other NEOs) is structured in the same way as the CEO’s compensation.
|
|
|
|
|
| Total Shareholder Return Vs Peer Group |
Relationship Between Compensation Actually Paid and Performance Measures The following chart, covering the past five fiscal years, demonstrates the correlation between (a) the compensation actually paid to Jefferies CEO and to Jefferies’ Other NEOs and (b) ROTE, TSR and the total return of the S&P 500 Financials Index.
(1)
| ROTE is a non-GAAP measure. For reconciliation to GAAP amounts, see Annex A of this Proxy Statement. |
The above charts show that, over the past five fiscal years, compensation actually paid to the CEO and Other NEOs was reasonably aligned with ROTE and TSR and with Net Earnings. For the CEO, a significant factor affecting compensation actually paid is year-over-year changes in value of equity awards and, with respect to PSUs and the potential for and achievement of above-target earning of PSUs (particularly reflected in fiscal 2021 and 2022 CAP). The CEO’s CAP in fiscal 2022 was also increased by the grant of a retention award with a five-year service period and additional three-year holding period. These factors affect the compensation actually paid for Other NEOs, but to a lesser extent, because the President’s compensation (part of the average for the Other NEOs) is structured in the same way as the CEO’s compensation.
|
|
|
|
|
| Tabular List, Table |
Financial Performance Measures We have identified Return on Tangible Equity (“ROTE”) as the company-selected measure for the pay-versus-performance disclosure, as it represents the most important financial performance measure for our CEO and President to earn annual incentive awards and performance-based restricted share units (“PSUs”) and in the determination of annual equity award grants to the CEO and President. Total shareholder return (“TSR”) is the metric most affecting changes in value of outstanding equity awards, which greatly impact the compensation actually paid calculation for the CEO and President. This is because, under the SEC’s disclosure rules, the change in value of unvested equity awards from the end of one fiscal year to the end of the next fiscal year or to any vesting date within that next fiscal year, whether positive or negative, are included in the calculation of compensation actually paid. It is important to understand that executives cannot realize disposable income from equity awards until they are vested, so in that sense the changes in equity value factored into the SEC’s “compensation actually paid” prior to vesting of the equity awards constitute only potential and not actual disposable income. Tabular List of Performance Measures The three measures listed below represent an unranked list of the most important measures we currently use, which generally had the effect of aligning compensation actually paid to the NEOs for 2023 with Jefferies’ performance. ROTE | TSR | Net Earnings / Net Income |
As discussed in the Compensation Discussion and Analysis, a number of other financial and non-financial metrics are considered by the Compensation Committee in its decisions on the compensation of the CEO and the President. These metrics also are considerations of the Compensation Committee in determining the annual bonuses paid to the Executive Vice Presidents who are included as Other NEOs. However, those Other NEOs are compensated primarily through discretionary cash bonuses and not by equity award grants, so ROTE, TSR and Net Earnings have only indirect rather than formulaic impacts on their compensation actually paid.
|
|
|
|
|
| Total Shareholder Return Amount |
$ 211.93
|
209.65
|
200.28
|
117.98
|
104.9
|
| Peer Group Total Shareholder Return Amount |
148.14
|
146.91
|
150.61
|
108.44
|
114.16
|
| Net Income (Loss) |
$ 263,072,000
|
$ 777,168,000
|
$ 1,677,403,000
|
$ 769,605,000
|
$ 959,593,000
|
| Company Selected Measure Amount |
0.037
|
0.103
|
0.245
|
0.117
|
0.059
|
| PEO Name |
Richard B. Handler
|
Richard B. Handler
|
Richard B. Handler
|
Richard B. Handler
|
Richard B. Handler
|
| Measure:: 1 |
|
|
|
|
|
| Pay vs Performance Disclosure |
|
|
|
|
|
| Name |
ROTE
|
|
|
|
|
| Non-GAAP Measure Description |
(1) Return on Tangible Equity (“ROTE”) is a non-GAAP measure. For reconciliation to GAAP amounts, see Annex A of this Proxy Statement.
|
|
|
|
|
| Measure:: 2 |
|
|
|
|
|
| Pay vs Performance Disclosure |
|
|
|
|
|
| Name |
TSR
|
|
|
|
|
| Measure:: 3 |
|
|
|
|
|
| Pay vs Performance Disclosure |
|
|
|
|
|
| Name |
Net Earnings / Net Income
|
|
|
|
|
| PEO | Total Adjustments [Member] |
|
|
|
|
|
| Pay vs Performance Disclosure |
|
|
|
|
|
| Adjustment to Compensation, Amount |
$ 7,801,772
|
$ 11,153,736
|
$ 37,827,093
|
$ 3,308,327
|
$ (9,829,449)
|
| PEO | Change in Pension Value in Summary Compensation Table [Member] |
|
|
|
|
|
| Pay vs Performance Disclosure |
|
|
|
|
|
| Adjustment to Compensation, Amount |
0
|
0
|
(15,287)
|
(66,692)
|
(36,833)
|
| PEO | “Service Cost” and “Prior Service Cost” for Pension Benefits [Member] |
|
|
|
|
|
| Pay vs Performance Disclosure |
|
|
|
|
|
| Adjustment to Compensation, Amount |
0
|
0
|
0
|
0
|
0
|
| PEO | Amount Reported Under the “Stock Awards” and “Option Awards” Columns of the Summary Compensation Table [Member] |
|
|
|
|
|
| Pay vs Performance Disclosure |
|
|
|
|
|
| Adjustment to Compensation, Amount |
(16,306,281)
|
(45,435,003)
|
(15,666,463)
|
0
|
0
|
| PEO | Year-End Fair Value of Equity Awards Granted During Year that Remain Unvested at Year End [Member] |
|
|
|
|
|
| Pay vs Performance Disclosure |
|
|
|
|
|
| Adjustment to Compensation, Amount |
13,718,620
|
46,726,109
|
0
|
|
|
| PEO | Vest-Date Fair Value of Equity Awards Granted During Year that Vested During Year [Member] |
|
|
|
|
|
| Pay vs Performance Disclosure |
|
|
|
|
|
| Adjustment to Compensation, Amount |
2,022,899
|
|
15,666,463
|
|
|
| PEO | Change in Fair Value of All Equity Awards Unvested at Prior Year End and at Year End (Year-End Fair Value Minus Prior-Year-End Fair Value) [Member] |
|
|
|
|
|
| Pay vs Performance Disclosure |
|
|
|
|
|
| Adjustment to Compensation, Amount |
4,648,323
|
10,536,256
|
37,842,380
|
5,844,028
|
(1,508,820)
|
| PEO | Change in Fair Value of All Equity Awards Unvested at Prior Year End that Vested During Year (Vest Date Fair Value Minus Prior-Year-End Fair Value) [Member] |
|
|
|
|
|
| Pay vs Performance Disclosure |
|
|
|
|
|
| Adjustment to Compensation, Amount |
3,563,008
|
(673,626)
|
0
|
1,180,337
|
(3,803,170)
|
| PEO | Fair Value of Equity Awards Unvested at Prior Year End but Forfeited During Year (Deduct Fair Value at Prior Year End) [Member] |
|
|
|
|
|
| Pay vs Performance Disclosure |
|
|
|
|
|
| Adjustment to Compensation, Amount |
|
0
|
0
|
(3,649,347)
|
|
| PEO | Dividends Paid on Restricted Stock and Dividend Equivalents Accrued on Unvested Equity Awards Prior to Vesting During Year (Not Otherwise Counted in Summary Compensation Table or Year-End or Vest-Date Fair Value of Equity Awards) [Member] |
|
|
|
|
|
| Pay vs Performance Disclosure |
|
|
|
|
|
| Adjustment to Compensation, Amount |
155,202
|
0
|
0
|
|
|
| Non-PEO NEO | Total Adjustments [Member] |
|
|
|
|
|
| Pay vs Performance Disclosure |
|
|
|
|
|
| Adjustment to Compensation, Amount |
1,305,208
|
2,229,949
|
9,473,640
|
856,869
|
(2,457,550)
|
| Non-PEO NEO | Change in Pension Value in Summary Compensation Table [Member] |
|
|
|
|
|
| Pay vs Performance Disclosure |
|
|
|
|
|
| Adjustment to Compensation, Amount |
0
|
0
|
0
|
0
|
0
|
| Non-PEO NEO | “Service Cost” and “Prior Service Cost” for Pension Benefits [Member] |
|
|
|
|
|
| Pay vs Performance Disclosure |
|
|
|
|
|
| Adjustment to Compensation, Amount |
0
|
0
|
0
|
0
|
0
|
| Non-PEO NEO | Amount Reported Under the “Stock Awards” and “Option Awards” Columns of the Summary Compensation Table [Member] |
|
|
|
|
|
| Pay vs Performance Disclosure |
|
|
|
|
|
| Adjustment to Compensation, Amount |
(2,785,146)
|
(9,087,001)
|
(3,916,616)
|
0
|
0
|
| Non-PEO NEO | Year-End Fair Value of Equity Awards Granted During Year that Remain Unvested at Year End [Member] |
|
|
|
|
|
| Pay vs Performance Disclosure |
|
|
|
|
|
| Adjustment to Compensation, Amount |
2,282,185
|
9,345,222
|
0
|
|
|
| Non-PEO NEO | Vest-Date Fair Value of Equity Awards Granted During Year that Vested During Year [Member] |
|
|
|
|
|
| Pay vs Performance Disclosure |
|
|
|
|
|
| Adjustment to Compensation, Amount |
404,580
|
|
3,916,616
|
|
|
| Non-PEO NEO | Change in Fair Value of All Equity Awards Unvested at Prior Year End and at Year End (Year-End Fair Value Minus Prior-Year-End Fair Value) [Member] |
|
|
|
|
|
| Pay vs Performance Disclosure |
|
|
|
|
|
| Adjustment to Compensation, Amount |
630,381
|
2,107,251
|
9,463,138
|
1,466,494
|
(1,504,894)
|
| Non-PEO NEO | Change in Fair Value of All Equity Awards Unvested at Prior Year End that Vested During Year (Vest Date Fair Value Minus Prior-Year-End Fair Value) [Member] |
|
|
|
|
|
| Pay vs Performance Disclosure |
|
|
|
|
|
| Adjustment to Compensation, Amount |
712,602
|
(135,523)
|
10,502
|
301,108
|
(964,704)
|
| Non-PEO NEO | Fair Value of Equity Awards Unvested at Prior Year End but Forfeited During Year (Deduct Fair Value at Prior Year End) [Member] |
|
|
|
|
|
| Pay vs Performance Disclosure |
|
|
|
|
|
| Adjustment to Compensation, Amount |
0
|
0
|
0
|
(912,337)
|
|
| Non-PEO NEO | Dividends Paid on Restricted Stock and Dividend Equivalents Accrued on Unvested Equity Awards Prior to Vesting During Year (Not Otherwise Counted in Summary Compensation Table or Year-End or Vest-Date Fair Value of Equity Awards) [Member] |
|
|
|
|
|
| Pay vs Performance Disclosure |
|
|
|
|
|
| Adjustment to Compensation, Amount |
$ 60,607
|
$ 0
|
$ 0
|
$ 1,604
|
$ 15,974
|