0001283699false00012836992025-01-292025-01-290001283699tmus:CommonStockParValue0.00001PerShareMember2025-01-292025-01-290001283699tmus:A3.550SeniorNotesDue2029Member2025-01-292025-01-290001283699tmus:A3.700SeniorNotesDue2032Member2025-01-292025-01-290001283699tmus:A3.850SeniorNotesDue2036Member2025-01-292025-01-29
UNITED STATES
SECURITIES AND EXCHANGE COMMISSION
WASHINGTON, DC 20549
FORM 8-K
CURRENT REPORT
Pursuant to Section 13 or 15(d) of the
Securities Exchange Act of 1934
Date of report (Date of earliest event reported): January 29, 2025
T-MOBILE US, INC.
(Exact Name of Registrant as Specified in Charter)
| | | | | | | | | | | | | | |
| | | | |
| Delaware | | 1-33409 | | 20-0836269 |
| (State or other jurisdiction | | (Commission File Number) | | (I.R.S. Employer |
of incorporation) | | | | Identification No.) |
12920 SE 38th Street
Bellevue, Washington
(Address of principal executive offices)
98006-1350
(Zip Code)
Registrant’s telephone number, including area code: (425) 378-4000
(Former Name or Former Address, if Changed Since Last Report):
Check the appropriate box below if the Form 8-K filing is intended to simultaneously satisfy the filing obligation of the registrant under any of the following provisions:
| | | | | |
☐ | Written communications pursuant to Rule 425 under the Securities Act (17 CFR 230.425) |
☐ | Soliciting material pursuant to Rule 14a-12 under the Exchange Act (17 CFR 240.14a-12) |
☐ | Pre-commencement communications pursuant to Rule 14d-2(b) under the Exchange Act (17 CFR 240.14d-2(b)) |
☐ | Pre-commencement communications pursuant to Rule 13e-4(c) under the Exchange Act (17 CFR 240.13e-4(c)) |
Securities registered pursuant to Section 12(b) of the Act:
| | | | | | | | | | | | | | |
| Title of each class | | Trading Symbol(s) | | Name of each exchange on which registered |
| Common Stock, par value $0.00001 per share | | TMUS | | The NASDAQ Stock Market LLC |
| 3.550% Senior Notes due 2029 | | TMUS29 | | The NASDAQ Stock Market LLC |
| 3.700% Senior Notes due 2032 | | TMUS32 | | The NASDAQ Stock Market LLC |
| 3.850% Senior Notes due 2036 | | TMUS36 | | The NASDAQ Stock Market LLC |
Indicate by check mark whether the registrant is an emerging growth company as defined in Rule 405 of the Securities Act of 1933 (§ 230.405 of this chapter) or Rule 12b-2 of the Securities Exchange Act of 1934 (§ 240.12b-2 of this chapter).
Emerging growth company ☐
If an emerging growth company, indicate by check mark if the registrant has elected not to use the extended transition period for complying with any new or revised financial accounting standards provided pursuant to Section 13(a) of the Exchange Act. ☐
Item 2.02 — Results of Operations and Financial Condition
On January 29, 2025, T-Mobile US, Inc. (the “Company”) issued a press release announcing the financial and operating results of the Company for the quarter and year ended December 31, 2024. The text of the press release and accompanying Investor Factbook are furnished as Exhibits 99.1 and 99.2 and incorporated herein by reference.
The information in Item 2.02 to this Current Report on Form 8-K, including Exhibits 99.1 and 99.2, is being furnished and shall not be deemed “filed” for purposes of Section 18 of the Securities Exchange Act of 1934, as amended, or otherwise subject to the liabilities of that section, nor shall it be deemed incorporated by reference in any filing under the Securities Act of 1933, as amended, except as expressly set forth by specific reference in such filing.
Item 9.01 — Financial Statements and Exhibits
(d) Exhibits:
| | | | | | | | |
| Exhibit | | Description |
| | |
| | |
| 104 | | Cover Page Interactive Data File (formatted as inline XBRL and contained in Exhibit 101) |
Pursuant to the requirements of the Securities Exchange Act of 1934, the registrant has duly caused this report to be signed on its behalf by the undersigned hereunto duly authorized.
| | | | | | | | | | | |
| | T-MOBILE US, INC. | |
| | | |
| January 29, 2025 | | /s/ Peter Osvaldik | |
| | Peter Osvaldik
Executive Vice President and Chief Financial Officer | |
EXHIBIT 99.1
T-Mobile Delivers Best-in-Class Customer Results in 2024 as More People Joined the
Un-carrier Than Ever Before, and Is Poised for Another Exciting Year of Growth in 2025
Highest-Ever Postpaid Phone Gross Additions and Record Low Postpaid Phone Churn Drive the Third Straight Year of Over 3 Million Postpaid Phone Net Customer Additions Alongside Industry-Leading Service Revenue and Cash Flow Growth, and Highest-Ever Diluted EPS, Enabling Tremendous Shareholder Returns of $14.4 Billion in 2024
Industry-Leading Customer Growth Fueled by Best Network, Best Value and Best Experience Combination(1)
•Postpaid net account additions of 263 thousand in Q4 2024 and 1.1 million in 2024, both industry best
•Postpaid net customer additions of 1.9 million in Q4 2024 and 6.1 million in 2024, both industry best
•Postpaid phone net customer additions of 903 thousand in Q4 2024 and 3.1 million in 2024, both industry best
•Postpaid phone churn of 0.92% in Q4 2024, tied for lowest Q4, and 0.86% in 2024, best FY in company history
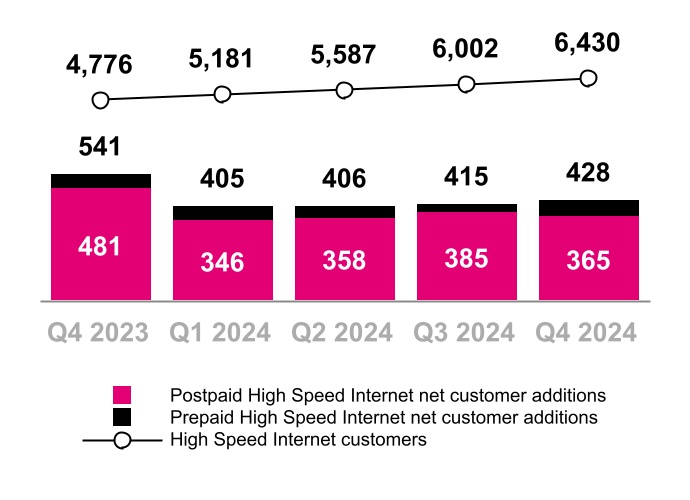
•High Speed Internet net customer additions of 428 thousand in Q4 2024 and 1.7 million in 2024, both industry best
Translating Industry-Leading Customer Growth into Industry-Leading Financial Performance
•Service revenues of $16.9 billion in Q4 2024 and $66.2 billion in 2024, both industry-leading growth
•Postpaid service revenues of $13.5 billion in Q4 2024 and $52.3 billion in 2024, both industry-leading growth
•Net income of $3.0 billion in Q4 2024 and $11.3 billion in 2024, highest FY in company history
•Diluted earnings per share (“EPS”) of $2.57 in Q4 2024 and $9.66 in 2024, highest FY in company history
•Core Adjusted EBITDA(2) of $7.9 billion in Q4 2024 and $31.8 billion in 2024, both industry-leading growth
•Net cash provided by operating activities of $5.5 billion in Q4 2024 and $22.3 billion in 2024, industry-leading FY growth
•Adjusted Free Cash Flow(2) of $4.1 billion in Q4 2024 and $17.0 billion in 2024, industry-leading FY growth
•Total cumulative stockholder returns(3) of $31.4 billion, including $14.4 billion in 2024, split across repurchases of $11.1 billion and cash dividends of $3.3 billion, with up to an additional $14.0 billion authorized through the end of 2025
Extending Overall Network Lead with Best Assets, Customer Centricity and Technology Leadership
•For the third year in a row, T-Mobile won all five overall network experience categories from Opensignal, along with 5G performance categories, consistent quality experience, and was unbeaten for reliability experience
•The company also won awards for the fastest, most consistent, and most available 5G network, alongside highest ranking consumer sentiment and best gaming and mobile video streaming experience from Ookla
•The company’s end-to-end, high-capacity 5G network continues to differentiate itself from competition and translate into real business outcomes, including a significant contract with the City of New York, including wireless services to be provided to its Public Safety network, which has the highest standards and most complex needs in the country
Strong Outlook for 2025 with Continued Industry-Leading Growth
•Postpaid net customer additions are expected to be between 5.5 million and 6.0 million, highest-ever guidance range issued at the beginning of the year
•Core Adjusted EBITDA(2) is expected to be between $33.1 billion and $33.6 billion
•Net cash provided by operating activities is expected to be between $26.8 billion and $27.5 billion and Adjusted Free Cash Flow(2) is expected to be between $17.3 billion and $18.0 billion
Bellevue, WA — January 29, 2025 — T-Mobile US, Inc. (NASDAQ: TMUS) reported fourth quarter and full-year 2024 results today, delivering industry-leading customer growth across the board, including industry-best growth in postpaid accounts, total postpaid, postpaid phone, prepaid, and High Speed Internet customers. The company also tied its lowest-ever Q4 postpaid phone churn, and delivered a record low postpaid phone churn for the full year alongside its highest-ever postpaid phone gross additions. The company translated its industry-leading customer growth into industry-best service revenue and cash flow growth in 2024 while fueling stockholder returns of $14.4 billion, executing against its ambitious multiyear growth plan.
“By putting customers first, T-Mobile delivered another monster Q4 that punctuated an amazing growth year with best-in-class results across wireless and broadband,” said Mike Sievert, CEO of T-Mobile. “In 2024, more new postpaid customers chose the Un-carrier than ever before, and we had our lowest ever full-year postpaid phone churn, leading to our third year of more than 3 million postpaid phone net additions. Now, building on this incredible momentum, 2025 is poised to be even more exciting, and because of this, we’re issuing the strongest start-of-year postpaid net additions guide in our history. We’ve already hit the ground running on our ambitious plans to give customers the kind of new, transformative experiences no one else can, and we’re just getting started.”
___________________________________________________________
(1)AT&T Inc. does not disclose postpaid net account additions. Comcast and Charter do not disclose postpaid phone net customer additions. Industry-leading claims are based on consensus expectations if results are not yet reported.
(2)Core Adjusted EBITDA and Adjusted Free Cash Flow are non-GAAP financial measures. These non-GAAP financial measures should be considered in addition to, but not as a substitute for, the information provided in accordance with GAAP. Reconciliations for these non-GAAP financial measures to the most directly comparable GAAP financial measures are provided in the Reconciliation of Non-GAAP Financial Measures to GAAP Financial Measures tables. We are not able to forecast Net income on a forward-looking basis without unreasonable efforts due to the high variability and difficulty in predicting certain items that affect Net income, including, but not limited to, Income tax expense and Interest expense. Core Adjusted EBITDA should not be used to predict Net income as the difference between this measure and Net income is variable.
(3)Beginning in Q3 2022 through December 31, 2024.
Industry-Leading Customer Growth Fueled by Best Network, Best Value and Best Experience Combination(1)
•Postpaid net account additions of 263 thousand in Q4 2024 and 1.1 million in 2024.
•Postpaid net customer additions of 1.9 million in Q4 2024 and 6.1 million in 2024.
•Postpaid phone net customer additions of 903 thousand in Q4 2024 and 3.1 million in 2024. Postpaid phone churn was 0.92% in Q4 2024 and 0.86% in 2024.
•Prepaid net customer additions of 103 thousand in Q4 2024 and 258 thousand in 2024. Prepaid churn was 2.85% in Q4 2024 and 2.73% in 2024.
•High Speed Internet net customer additions of 428 thousand in Q4 2024 and 1.7 million in 2024. T-Mobile ended the year with 6.4 million High Speed Internet customers.
•Total net customer additions were 2.0 million in Q4 2024 and 6.3 million in 2024. Total customer connections increased to a record high of 129.5 million.
| | | | | | | | | | | | | | | | | | | | | | | | | | | | | | | | |
| Quarter | | Year Ended December 31, | | | |
| (in thousands, except churn) | Q4 2024 | | Q3 2024 | | Q4 2023 | | 2024 | | 2023 | |
| Postpaid net account additions | 263 | | | 315 | | | 299 | | | 1,097 | | | 1,271 | | | | |
| Total net customer additions | 2,036 | | | 1,599 | | | 1,623 | | | 6,324 | | | 5,932 | | | | |
| Postpaid net customer additions | 1,933 | | | 1,575 | | | 1,570 | | | 6,066 | | | 5,650 | | | | |
| Postpaid phone net customer additions | 903 | | | 865 | | | 934 | | | 3,077 | | | 3,082 | | | | |
Postpaid other net customer additions (2) | 1,030 | | | 710 | | | 636 | | | 2,989 | | | 2,568 | | | | |
Prepaid net customer additions (2) | 103 | | | 24 | | | 53 | | | 258 | | | 282 | | | | |
Total customers, end of period (2) (3) | 129,528 | | | 127,492 | | | 119,700 | | | 129,528 | | | 119,700 | | | | |
| Postpaid phone churn | 0.92 | % | | 0.86 | % | | 0.96 | % | | 0.86 | % | | 0.87 | % | | | |
| Prepaid churn | 2.85 | % | | 2.78 | % | | 2.86 | % | | 2.73 | % | | 2.76 | % | | | |
| High Speed Internet net customer additions | 428 | | | 415 | | | 541 | | | 1,654 | | | 2,130 | | | | |
| Total High Speed Internet customers, end of period | 6,430 | | | 6,002 | | | 4,776 | | | 6,430 | | | 4,776 | | | | |
| | | | | | | | | | | | |
| | | | | | | | | | | | |
| | | | | | | | | | | | |
| | | | | | | | | | | | |
| | | | | | | | | | | | |
| | | | | | | | | | | | |
| | | | | | | | | | | | |
| | | | | | | | | | | | |
| | | | | | | | | | | | |
(1)AT&T Inc. does not disclose postpaid net account additions. Comcast and Charter do not disclose postpaid phone net customer additions. Industry-leading claims are based on consensus expectations if results are not yet reported.
(2)Includes High Speed Internet customers.
(3)In the second quarter of 2024, we acquired 3,504,000 prepaid customers through our acquisition of Ka’ena, which includes the impact of certain base adjustments to align the policies of Ka’ena and T-Mobile.
Translating Industry-Leading Customer Growth into Industry-Leading Financial Performance(1)
•Total service revenues increased 6% year-over-year to $16.9 billion in Q4 2024 and 5% year-over-year to $66.2 billion in 2024, which included Postpaid service revenue growth of 8% year-over-year in Q4 2024 and 7% growth year-over-year in 2024.
•Net income increased 48% year-over-year to $3.0 billion in Q4 2024 and increased 36% year-over-year to $11.3 billion in 2024.
•Diluted EPS increased 54% year-over-year to $2.57 per share in Q4 2024 and increased 39% year-over-year to $9.66 per share in 2024.
•Core Adjusted EBITDA increased 10% year-over-year to $7.9 billion in Q4 2024 and increased 9% year-over-year to $31.8 billion in 2024.
•Net cash provided by operating activities increased 14% year-over-year to $5.5 billion in Q4 2024 and increased 20% year-over-year to $22.3 billion in 2024, which included cash payments for Merger-related costs of $109 million in Q4 2024 and $767 million in 2024.
•Cash purchases of property and equipment, including capitalized interest increased 39% year-over-year to $2.2 billion in Q4 2024 and decreased 10% year-over-year to $8.8 billion in 2024.
•Adjusted Free Cash Flow decreased 5% year-over-year to $4.1 billion in Q4 2024 and increased 25% year-over-year to $17.0 billion in 2024, which included cash payments for Merger-related costs of $109 million in Q4 2024 and $767 million in 2024.
•Program-to-date stockholder returns through December 31, 2024 of $31.4 billion included 173.7 million shares repurchased for $27.3 billion and cash dividends of $4.0 billion. This includes 20.3 million shares of common stock repurchased for $4.6 billion in Q4 2024 and 59.4 million shares repurchased for $11.1 billion in 2024, and cash dividends of $1.0 billion in Q4 2024 and $3.3 billion in 2024. The current authorization allows for stock repurchases and dividends through December 2025 of up to $14.0 billion.
| | | | | | | | | | | | | | | | | | | | | | | | | | | | | | | | | | | | | | | | | | | | | | | |
| Quarter | | Year Ended December 31, | | Q4 2024 vs. Q3 2024 | | Q4 2024 vs. Q4 2023 | | YTD 2024 vs. YTD 2023 |
| (in millions, except EPS) | Q4 2024 | | Q3 2024 | | Q4 2023 | 2024 | | 2023 | | |
| Total service revenues | $ | 16,928 | | | $ | 16,725 | | | $ | 16,043 | | | $ | 66,178 | | | $ | 63,241 | | | 1.2 | % | | 5.5 | % | | 4.6 | % |
| Postpaid service revenues | 13,502 | | | 13,308 | | | 12,472 | | | 52,340 | | | 48,692 | | | 1.5 | % | | 8.3 | % | | 7.5 | % |
| Total revenues | 21,872 | | | 20,162 | | | 20,478 | | | 81,400 | | | 78,558 | | | 8.5 | % | | 6.8 | % | | 3.6 | % |
| Net income | 2,981 | | | 3,059 | | | 2,014 | | | 11,339 | | | 8,317 | | | (2.5) | % | | 48.0 | % | | 36.3 | % |
| Diluted EPS | 2.57 | | | 2.61 | | | 1.67 | | | 9.66 | | | 6.93 | | | (1.5) | % | | 53.9 | % | | 39.4 | % |
| Adjusted EBITDA | 7,916 | | | 8,243 | | | 7,224 | | | 31,864 | | | 29,428 | | | (4.0) | % | | 9.6 | % | | 8.3 | % |
| Core Adjusted EBITDA | 7,905 | | | 8,222 | | | 7,181 | | | 31,771 | | | 29,116 | | | (3.9) | % | | 10.1 | % | | 9.1 | % |
| Net cash provided by operating activities | 5,549 | | | 6,139 | | | 4,859 | | | 22,293 | | | 18,559 | | | (9.6) | % | | 14.2 | % | | 20.1 | % |
| Cash purchases of property and equipment, including capitalized interest | 2,212 | | | 1,961 | | | 1,587 | | | 8,840 | | | 9,801 | | | 12.8 | % | | 39.4 | % | | (9.8) | % |
Adjusted Free Cash Flow | 4,084 | | | 5,162 | | | 4,305 | | | 17,032 | | | 13,586 | | | (20.9) | % | | (5.1) | % | | 25.4 | % |
| | | | | | | | | | | | | | | |
| | | | | | | | | | | | | | | |
| | | | | | | | | | | | | | | |
| | | | | | | | | | | | | | | |
| | | | | | | | | | | | | | | |
| | | | | | | | | | | | | | | |
| | | | | | | | | | | | | | | |
| | | | | | | | | | | | | | | |
| | | | | | | | | | | | | | | |
| | | | | | | | | | | | | | | |
| | | | | | | | | | | | | | | |
| | | | | | | | | | | | | | | |
| | | | | | | | | | | | | | | |
| | | | | | | | | | | | | | | |
| | | | | | | | | | | | | | | |
| | | | | | | | | | | | | | | |
| | | | | | | | | | | | | | | |
| | | | | | | | | | | | | | | |
| | | | | | | | | | | | | | | |
| | | | | | | | | | | | | | | |
| | | | | | | | | | | | | | | |
| | | | | | | | | | | | | | | |
| | | | | | | | | | | | | | | |
| | | | | | | | | | | | | | | |
(1) Industry-leading claims are based on consensus expectations if results are not yet reported.
Extending Overall Network Lead with Best Assets, Customer Centricity and Technology Leadership
T-Mobile is the overall network leader, with the company continuing to earn third-party recognition and win pivotal contracts that require the most rigorous standards and highest expectations of performance:
•Opensignal: In its latest Mobile Network Experience report, T-Mobile won all five overall network experience categories including download and upload speed experience, along with games, video and live video experience for the third year in a row. The company also took home top honors in 5G for download speeds, coverage experience and availability, consistent quality experience and was unbeaten for reliability experience.
•Ookla: In its latest Speedtest Connectivity report, T-Mobile was awarded the fastest, most consistent, and most available 5G network, alongside other awards for highest ranking consumer sentiment and best gaming and mobile video streaming experience.
•T-Mobile’s combination of best network assets, customer centricity and technology leadership continues to translate to real, tangible business outcomes, including a significant contract with the City of New York, including wireless services to be provided to the City’s Public Safety network, which has the highest standards and most complex needs in the country. The contract highlights T-Mobile's differentiated ability to deliver network capabilities and is yet another testament to the company's network leadership.
Note: See 5G device, coverage, and access details at T-Mobile.com. Ookla awards: Based on analysis by Ookla® of Speedtest Intelligence® data for the U.S., 2H 2024. Ookla trademarks used under license and reprinted with permission. Opensignal Awards: USA: Mobile Network Experience Report January 2025, based on independent analysis of mobile measurements recorded during the period September 1 - November 29, 2024. © 2025 Opensignal Limited.
Strong Outlook for 2025 with Continued Industry-Leading Growth
T-Mobile’s 2025 guidance below excludes pending acquisitions of UScellular, Metronet, Lumos, and Vistar Media:
•Postpaid net customer additions are expected to be between 5.5 million and 6.0 million, expected to lead the industry for the 11th straight year.
•Core Adjusted EBITDA, which is Adjusted EBITDA less lease revenues, is expected to be between $33.1 billion and $33.6 billion, up 5% year-over-year at the midpoint.
•Net cash provided by operating activities, including payments for Merger-related costs, is expected to be between $26.8 billion and $27.5 billion.
•Cash purchases of property and equipment, including capitalized interest, are expected to be approximately $9.5 billion.
•Adjusted Free Cash Flow, including payments for Merger-related costs, is expected to be between $17.3 billion and $18.0 billion.
| | | | | | | | | | | | | | | | | |
| (in millions, except Postpaid net customer additions and Effective tax rate) | | | FY 2025 Guidance | | |
| Postpaid net customer additions (thousands) | | | | | 5,500 | | 6,000 | | |
Net income (1) | | | | | N/A | | N/A | | |
| Effective tax rate | | | | | 24% | | 26% | | |
Core Adjusted EBITDA (2) | | | | | $33,100 | | $33,600 | | |
| | | | | |
| | | | | |
| Net cash provided by operating activities | | | | | 26,800 | | 27,500 | | |
Capital expenditures (3) | | | | | ~9,500 | | |
| Adjusted Free Cash Flow | | | | | 17,300 | | 18,000 | | |
(1)T-Mobile is not able to forecast Net income on a forward-looking basis without unreasonable efforts due to the high variability and difficulty in predicting certain items that affect GAAP Net income, including, but not limited to, Income tax expense and Interest expense. Core Adjusted EBITDA should not be used to predict Net income as the difference between this measure and Net income is variable.
(2)Management uses Core Adjusted EBITDA as a measure to monitor the financial performance of Company operations, excluding the impact of lease revenues from related device financing programs.
(3)Capital expenditures means cash purchases of property and equipment, including capitalized interest.
Doing Well by Doing Good — The Un-carrier Way Leading the Industry in Connecting Students
T-Mobile remains committed to leveraging its network, scale, and resources to build a more connected and equitable future. Through its flagship philanthropic program, Project 10Million (“P10M”), T-Mobile is ensuring students have the tools they need to succeed in a digital world.
•Since its launch in 2020, P10M has focused on delivering critical connectivity to underserved K-12 students across the nation by offering free internet connectivity and mobile hotspots.
•In 2024, T-Mobile enhanced the program by doubling the data for eligible participants to 200GB per year for five years, introducing a deeply discounted data pass extension, and offering schools with the greatest needs served by P10M the opportunity to receive more free data for their students — up to 200GB.
•The company also partnered with the Boys & Girls Clubs of America to expand connectivity access to youth in underserved regions, addressing local needs at a regional level and equipping clubs across the country to enroll eligible families.
•In response to the California wildfires, T-Mobile is prioritizing P10M applications and waiving eligibility requirements for student households in impacted areas and offering a free hotspot and five years of free connectivity.
Through P10M, T-Mobile has connected over 6.3 million students nationwide and invested over $7.3 billion in devices and services.
Financial Results
For more details on T-Mobile’s Q4 2024 and full-year 2024 financial results, including the Investor Factbook with detailed financial tables, please visit T-Mobile US, Inc.’s Investor Relations website at https://investor.t-mobile.com.
Earnings Call Information
Date/Time
•Wednesday, January 29, 2025, at 8:00 a.m. (ET)
Pre-registration link for dial-in access and personalized PIN
Participants can pre-register for the conference call here in order to receive dial-in information and a personalized PIN. This option is recommended to avoid wait times when joining the call.
Access via Phone (audio only)
Please plan on accessing the call 10 minutes prior to the scheduled start time.
•Toll Free: 1-866-777-2509
•International: 1-412-317-5413
Access via Webcast
The earnings call will be broadcasted live and can be replayed via the Investor Relations website at https://investor.t-mobile.com.
Submit Questions via X
Send a post to @TMobileIR or @MikeSievert using $TMUS
Contact Information
•Media Relations: mediarelations@t-mobile.com
•Investor Relations: investor.relations@t-mobile.com
T-Mobile Social Media
Investors and others should note that we announce material financial and operational information to our investors using our investor relations website (https://investor.t-mobile.com), newsroom website (https://t-mobile.com/news), press releases, SEC filings and public conference calls and webcasts. We also intend to use certain social media accounts as a means of disclosing information about us and our services and for complying with our disclosure obligations under Regulation FD (the @TMobileIR X account (https://x.com/TMobileIR), the @MikeSievert X account (https://x.com/MikeSievert) and our CEO’s LinkedIn account (https://www.linkedin.com/in/sievert), both of which Mr. Sievert also uses as a means for personal communications and observations, and the @TMobileCFO X account (https://x.com/tmobilecfo), and our CFO’s LinkedIn account (https://www.linkedin.com/in/peter-osvaldik-3887394), both of which Mr. Osvaldik also uses as a means for personal communication and observations). The information we post through these social media channels may be deemed material. Accordingly, investors should monitor these social media channels in addition to following our press releases, SEC filings and public conference calls and webcasts. The social media channels that we intend to use as a means of disclosing the information described above may be updated from time to time as listed on our investor relations website.
About T-Mobile US, Inc.
T-Mobile US, Inc. (NASDAQ: TMUS) is America’s supercharged Un-carrier, delivering an advanced 4G LTE and transformative nationwide 5G network that will offer reliable connectivity for all. T-Mobile’s customers benefit from its unmatched combination of value and quality, unwavering obsession with offering them the best possible service experience and undisputable drive for disruption that creates competition and innovation in wireless and beyond. Based in Bellevue, Wash., T-Mobile provides services through its subsidiaries and operates its flagship brands, T-Mobile, Metro by T-Mobile and Mint Mobile. For more information please visit: https://www.t-mobile.com.
Forward-Looking Statements
This communication includes forward-looking statements within the meaning of the Private Securities Litigation Reform Act of 1995. All statements other than statements of historical fact, including information concerning T-Mobile US, Inc.’s future results of operations, are forward-looking statements. These forward-looking statements are generally identified by the words “anticipate,” “believe,” “estimate,” “expect,” “intend,” “may,” “could” or similar expressions.
Forward-looking statements are based on current expectations and assumptions, which are subject to risks and uncertainties and may cause actual results to differ materially from the forward-looking statements. Important factors that could affect future results and cause those results to differ materially from those expressed in the forward-looking statements include, among others, the following: competition, industry consolidation and changes in the market for wireless communications services and other forms of connectivity; criminal cyberattacks, disruption, data loss or other security breaches; our inability to timely adopt and effectively deploy network technology developments; our inability to effectively execute our digital transformation and drive customer and employee adoption of emerging technologies; our inability to retain or motivate key personnel, hire qualified personnel or maintain our corporate culture; system failures and business disruptions, allowing for unauthorized use of or interference with our network and other systems; the scarcity and cost of additional wireless spectrum, and regulations relating to spectrum use; the timing and effects of any pending and future acquisition, divestiture, investment, joint venture or merger involving us, including our inability to obtain any required regulatory approval necessary to consummate any such transactions or to achieve the expected benefits of such transactions; adverse economic, political or market conditions in the U.S. and international markets, including changes resulting from increases in inflation or interest rates, supply chain disruptions and impacts of geopolitical instability, such as the Ukraine-Russia and Israel-Hamas wars and further escalations thereof; our inability to successfully deliver new products and services; any disruption or failure of our third parties (including key suppliers) to provide products or services for the operation of our business; sociopolitical volatility and polarization and risks related to environmental, social and governance matters; our substantial level of indebtedness and our inability to service our debt obligations in accordance with their terms; changes in the credit market conditions, credit rating downgrades or an inability to access debt markets; our inability to maintain effective internal control over financial reporting; any changes in regulations or in the regulatory framework under which we operate; laws and regulations relating to the handling of privacy, data protection and artificial intelligence; unfavorable outcomes of and increased costs from existing or future regulatory or legal proceedings; difficulties in protecting our intellectual property rights or if we infringe on the intellectual property rights of others; our offering of regulated financial services products and exposure to a wide variety of state and federal regulations; new or amended tax laws or regulations or administrative interpretations and judicial decisions affecting the scope or application of tax laws or regulations; our wireless licenses, including those controlled through leasing agreements, are subject to renewal and may be revoked; our exclusive forum provision as provided in our Certificate of Incorporation; interests of DT, our controlling stockholder, which may differ from the interests of other stockholders; our current and future stockholder return programs may not be fully utilized, and our share repurchases and dividend payments pursuant thereto may fail to have the desired impact on stockholder value; future sales of our common stock by DT and SoftBank and our inability to attract additional equity financing outside the United States due to foreign ownership limitations by the FCC; and other risks as disclosed in our most recent annual report on Form 10-K, and subsequent Forms 10-Q and other filings with the Securities and Exchange Commission. Given these risks and uncertainties, readers are cautioned not to place undue reliance on such forward-looking statements. We undertake no obligation to revise or publicly release the results of any revision to these forward-looking statements, except as required by law.
T-Mobile US, Inc.
Reconciliation of Non-GAAP Financial Measures to GAAP Financial Measures
(Unaudited)
This Press Release includes non-GAAP financial measures. The non-GAAP financial measures should be considered in addition to, but not as a substitute for, the information provided in accordance with GAAP. Reconciliations for the non-GAAP financial measures to the most directly comparable GAAP financial measures are provided below. T-Mobile is not able to forecast Net income on a forward-looking basis without unreasonable efforts due to the high variability and difficulty in predicting certain items that affect GAAP net income, including, but not limited to, Income tax expense and Interest expense. Adjusted EBITDA and Core Adjusted EBITDA should not be used to predict Net income as the difference between either of these measures and Net income is variable.
Adjusted EBITDA and Core Adjusted EBITDA are reconciled to Net income as follows:
| | | | | | | | | | | | | | | | | | | | | | | | | | | | | | | | | | | | | | | | | | | | | | | | | | | | | | | | | | | | | |
| | | Quarter | | Year Ended December 31, |
| (in millions) | | | Q1 2023 | | Q2 2023 | | Q3 2023 | | Q4 2023 | | Q1 2024 | | Q2 2024 | | Q3 2024 | | Q4 2024 | | 2023 | | 2024 |
| | | | | | | | | | | | | | | | | | | | | |
| Net income | | | $ | 1,940 | | | $ | 2,221 | | | $ | 2,142 | | | $ | 2,014 | | | $ | 2,374 | | | $ | 2,925 | | | $ | 3,059 | | | $ | 2,981 | | | $ | 8,317 | | | $ | 11,339 | |
| Adjustments: | | | | | | | | | | | | | | | | | | | | | |
| | | | | | | | | | | | | | | | | | | | | |
| | | | | | | | | | | | | | | | | | | | | |
| Interest expense, net | | | 835 | | | 861 | | | 790 | | | 849 | | | 880 | | | 854 | | | 836 | | | 841 | | | 3,335 | | | 3,411 | |
| | | | | | | | | | | | | | | | | | | | | |
| | | | | | | | | | | | | | | | | | | | | |
| Other (income) expense, net | | | (9) | | | (6) | | | (41) | | | (12) | | | (20) | | | 8 | | | (7) | | | (94) | | | (68) | | | (113) | |
| Income tax expense | | | 631 | | | 717 | | | 705 | | | 629 | | | 764 | | | 843 | | | 908 | | | 858 | | | 2,682 | | | 3,373 | |
| Operating income | | | 3,397 | | | 3,793 | | | 3,596 | | | 3,480 | | | 3,998 | | | 4,630 | | | 4,796 | | | 4,586 | | | 14,266 | | | 18,010 | |
| Depreciation and amortization | | | 3,203 | | | 3,110 | | | 3,187 | | | 3,318 | | | 3,371 | | | 3,248 | | | 3,151 | | | 3,149 | | | 12,818 | | | 12,919 | |
| | | | | | | | | | | | | | | | | | | | | |
Stock-based compensation (1) | | | 173 | | | 155 | | | 152 | | | 164 | | | 140 | | | 147 | | | 143 | | | 156 | | | 644 | | | 586 | |
Merger-related costs (gain), net (2) | | | 358 | | | 276 | | | 152 | | | 248 | | | 130 | | | (9) | | | — | | | — | | | 1,034 | | | 121 | |
| | | | | | | | | | | | | | | | | | | | | |
| | | | | | | | | | | | | | | | | | | | | |
Legal-related (recoveries) expenses, net (3) | | | (43) | | | — | | | — | | | 1 | | | — | | | 15 | | | 1 | | | (105) | | | (42) | | | (89) | |
| (Gain) loss on disposal group held for sale | | | (42) | | | 17 | | | — | | | — | | | — | | | — | | | — | | | — | | | (25) | | | — | |
Other, net (4) | | | 153 | | | 54 | | | 513 | | | 13 | | | 13 | | | 22 | | | 152 | | | 130 | | | 733 | | | 317 | |
| Adjusted EBITDA | | | 7,199 | | | 7,405 | | | 7,600 | | | 7,224 | | | 7,652 | | | 8,053 | | | 8,243 | | | 7,916 | | | 29,428 | | | 31,864 | |
Lease revenues | | | (147) | | | (69) | | | (53) | | | (43) | | | (35) | | | (26) | | | (21) | | | (11) | | | (312) | | | (93) | |
| Core Adjusted EBITDA | | | $ | 7,052 | | | $ | 7,336 | | | $ | 7,547 | | | $ | 7,181 | | | $ | 7,617 | | | $ | 8,027 | | | $ | 8,222 | | | $ | 7,905 | | | $ | 29,116 | | | $ | 31,771 | |
| | | | | | | | | | | | | | | | | | | | | |
| | | | | | | | | | | | | | | | | | | | | |
| | | | | | | | | | | | | | | | | | | | | |
| | | | | | | | | | | | | | | | | | | | | |
| | | | | | | | | | | | | | | | | | | | | |
| | | | | | | | | | | | | | | | | | | | | |
| | | | | | | | | | | | | | | | | | | | | |
| | | | | | | | | | | | | | | | | | | | | |
| | | | | | | | | | | | | | | | | | | | | |
| | | | | | | | | | | | | | | | | | | | | |
| | | | | | | | | | | | | | | | | | | | | |
| | | | | | | | | | | | | | | | | | | | | |
| | | | | | | | | | | | | | | | | | | | | |
| | | | | | | | | | | | | | | | | | | | | |
| | | | | | | | | | | | | | | | | | | | | |
| | | | | | | | | | | | | | | | | | | | | |
| | | | | | | | | | | | | | | | | | | | | |
| | | | | | | | | | | | | | | | | | | | | |
| | | | | | | | | | | | | | | | | | | | | |
| | | | | | | | | | | | | | | | | | | | | |
| | | | | | | | | | | | | | | | | | | | | |
| | | | | | | | | | | | | | | | | | | | | |
| | | | | | | | | | | | | | | | | | | | | |
| | | | | | | | | | | | | | | | | | | | | |
| | | | | | | | | | | | | | | | | | | | | |
| | | | | | | | | | | | | | | | | | | | | |
| | | | | | | | | | | | | | | | | | | | | |
| | | | | | | | | | | | | | | | | | | | | |
| | | | | | | | | | | | | | | | | | | | | |
| | | | | | | | | | | | | | | | | | | | | |
| | | | | | | | | | | | | | | | | | | | | |
| | | | | | | | | | | | | | | | | | | | | |
| | | | | | | | | | | | | | | | | | | | | |
| | | | | | | | | | | | | | | | | | | | | |
| | | | | | | | | | | | | | | | | | | | | |
| | | | | | | | | | | | | | | | | | | | | |
| | | | | | | | | | | | | | | | | | | | | |
| | | | | | | | | | | | | | | | | | | | | |
| | | | | | | | | | | | | | | | | | | | | |
| | | | | | | | | | | | | | | | | | | | | |
| | | | | | | | | | | | | | | | | | | | | |
| | | | | | | | | | | | | | | | | | | | | |
| | | | | | | | | | | | | | | | | | | | | |
| | | | | | | | | | | | | | | | | | | | | |
(1)Stock-based compensation includes payroll tax impacts and may not agree to stock-based compensation expense in the Consolidated Financial Statements. Additionally, certain stock-based compensation expenses associated with the merger with Sprint Corporation (the “Merger”) have been included in Merger-related costs (gain), net.
(2)Merger-related costs (gain), net, for the year ended December 31, 2024, includes the $100 million gain recognized for the extension fee previously paid by DISH associated with the DISH License Purchase Agreement.
(3)Legal-related (recoveries) expenses, net consists of the settlement of certain litigation associated with the August 2021 cyberattack, net of insurance recoveries.
(4)Other, net, primarily consists of certain severance, restructuring and other expenses, gains and losses, including severance and related costs associated with the August 2023 workforce reduction, not directly attributable to the Merger, which are not reflective of T-Mobile’s core business activities and are, therefore, excluded from Adjusted EBITDA and Core Adjusted EBITDA.
Adjusted EBITDA represents earnings before Interest expense, net of Interest income, Income tax expense, Depreciation and amortization, stock-based compensation and certain expenses, gains and losses, which are not reflective of our ongoing operating performance (“Special Items”). Special Items include Merger-related costs (gain), net, (Gain) loss on disposal groups held for sale, certain legal-related recoveries and expenses, restructuring costs not directly attributable to the Merger (including severance), and other non-core gains and losses. Core Adjusted EBITDA represents Adjusted EBITDA less device lease revenues. Core Adjusted EBITDA and Adjusted EBITDA are non-GAAP financial measures utilized by T-Mobile’s management, including our chief operating decision maker, to monitor the financial performance of our operations and allocate resources of the Company as a whole. T-Mobile uses Core Adjusted EBITDA and Adjusted EBITDA as benchmarks to evaluate T-Mobile’s operating performance in comparison to its competitors. T-Mobile also uses Core Adjusted EBITDA internally as a measure to evaluate and compensate its personnel and management for their performance. Management believes analysts and investors use Core Adjusted EBITDA and Adjusted EBITDA as supplemental measures to evaluate overall operating performance and to facilitate comparisons with other wireless communications services companies because they are indicative of T-Mobile’s ongoing operating performance and trends by excluding the impact of Interest expense from financing, non-cash depreciation and amortization from capital investments, non-cash stock-based compensation, and Special Items. Management believes analysts and investors use Core Adjusted EBITDA because it normalizes for the transition in the company’s device financing strategy, by excluding the impact of device lease revenues from Adjusted EBITDA, to align with the related depreciation expense on leased devices, which is excluded from the definition of Adjusted EBITDA. Core Adjusted EBITDA and Adjusted EBITDA have limitations as analytical tools and should not be considered in isolation or as substitutes for Net income or any other measure of financial performance reported in accordance with U.S. Generally Accepted Accounting Principles (“GAAP”).
T-Mobile US, Inc.
Reconciliation of Non-GAAP Financial Measures to GAAP Financial Measures (continued)
(Unaudited)
Adjusted Free Cash Flow is calculated as follows:
| | | | | | | | | | | | | | | | | | | | | | | | | | | | | | | | | | | | | | | | | | | | | | | | | | | | | | | | | | | | | |
| | | Quarter | | Year Ended December 31, |
| (in millions, except percentages) | | | Q1 2023 | | Q2 2023 | | Q3 2023 | | Q4 2023 | | Q1 2024 | | Q2 2024 | | Q3 2024 | | Q4 2024 | | 2023 | | 2024 |
| | | | | | | | | | | | | | | | | | | | | |
| Net cash provided by operating activities | | | $ | 4,051 | | | $ | 4,355 | | | $ | 5,294 | | | $ | 4,859 | | | $ | 5,084 | | | $ | 5,521 | | | $ | 6,139 | | | $ | 5,549 | | | $ | 18,559 | | | $ | 22,293 | |
| Cash purchases of property and equipment, including capitalized interest | | | (3,001) | | | (2,789) | | | (2,424) | | | (1,587) | | | (2,627) | | | (2,040) | | | (1,961) | | | (2,212) | | | (9,801) | | | (8,840) | |
| Proceeds from sales of tower sites | | | 6 | | | 2 | | | 2 | | | 2 | | | — | | | — | | | — | | | — | | | 12 | | | — | |
| Proceeds related to beneficial interests in securitization transactions | | | 1,345 | | | 1,309 | | | 1,131 | | | 1,031 | | | 890 | | | 958 | | | 984 | | | 747 | | | 4,816 | | | 3,579 | |
| | | | | | | | | | | | | | | | | | | | | |
Adjusted Free Cash Flow | | | $ | 2,401 | | | $ | 2,877 | | | $ | 4,003 | | | $ | 4,305 | | | $ | 3,347 | | | $ | 4,439 | | | $ | 5,162 | | | $ | 4,084 | | | $ | 13,586 | | | $ | 17,032 | |
| Net cash provided by operating activities margin (Net cash provided by operating activities divided by Service revenues) | | | 26.1 | % | | 27.7 | % | | 33.3 | % | | 30.3 | % | | 31.6 | % | | 33.6 | % | | 36.7 | % | | 32.8 | % | | 29.3 | % | | 33.7 | % |
| Adjusted Free Cash Flow margin (Adjusted Free Cash Flow divided by Service revenues) | | | 15.4 | % | | 18.3 | % | | 25.2 | % | | 26.8 | % | | 20.8 | % | | 27.0 | % | | 30.9 | % | | 24.1 | % | | 21.5 | % | | 25.7 | % |
| | | | | | | | | | | | | | | | | | | | | |
| | | | | | | | | | | | | | | | | | | | | |
| | | | | | | | | | | | | | | | | | | | | |
| | | | | | | | | | | | | | | | | | | | | |
| | | | | | | | | | | | | | | | | | | | | |
| | | | | | | | | | | | | | | | | | | | | |
| | | | | | | | | | | | | | | | | | | | | |
| | | | | | | | | | | | | | | | | | | | | |
| | | | | | | | | | | | | | | | | | | | | |
| | | | | | | | | | | | | | | | | | | | | |
| | | | | | | | | | | | | | | | | | | | | |
| | | | | | | | | | | | | | | | | | | | | |
| | | | | | | | | | | | | | | | | | | | | |
| | | | | | | | | | | | | | | | | | | | | |
| | | | | | | | | | | | | | | | | | | | | |
| | | | | | | | | | | | | | | | | | | | | |
| | | | | | | | | | | | | | | | | | | | | |
| | | | | | | | | | | | | | | | | | | | | |
| | | | | | | | | | | | | | | | | | | | | |
| | | | | | | | | | | | | | | | | | | | | |
| | | | | | | | | | | | | | | | | | | | | |
| | | | | | | | | | | | | | | | | | | | | |
| | | | | | | | | | | | | | | | | | | | | |
| | | | | | | | | | | | | | | | | | | | | |
| | | | | | | | | | | | | | | | | | | | | |
| | | | | | | | | | | | | | | | | | | | | |
| | | | | | | | | | | | | | | | | | | | | |
| | | | | | | | | | | | | | | | | | | | | |
| | | | | | | | | | | | | | | | | | | | | |
| | | | | | | | | | | | | | | | | | | | | |
| | | | | | | | | | | | | | | | | | | | | |
Effective November 1, 2024, following amendments to the company’s Equipment Installment Plan Sale and Service Receivable Sale arrangements, all cash proceeds associated with the sale of such receivables, a portion of which was previously recognized as Proceeds related to beneficial interests in securitization transactions within investing cash flows, were recognized as operating cash flows. These amendments did not have a net impact on Adjusted Free Cash Flow.
Adjusted Free Cash Flow - Net cash provided by operating activities less Cash purchases of property and equipment, plus Proceeds from sales of tower sites and Proceeds related to beneficial interests in securitization transactions. Adjusted Free Cash Flow is utilized by T-Mobile’s management, investors and analysts to evaluate cash available to pay debt, repurchase shares, pay dividends and provide further investment in the business.
Adjusted Free Cash Flow margin - Adjusted Free Cash Flow divided by Service revenues. Adjusted Free Cash Flow Margin is utilized by T-Mobile’s management, investors, and analysts to evaluate the company’s ability to convert service revenue efficiently into cash available to pay debt, repurchase shares and provide further investment in the business.
The guidance range for Adjusted Free Cash Flow is calculated as follows:
| | | | | | | | | | | |
| FY 2025 |
| (in millions) | Guidance Range |
| | | |
| Net cash provided by operating activities | $ | 26,800 | | | $ | 27,500 | |
| Cash purchases of property and equipment, including capitalized interest | (9,500) | | | (9,500) | |
| | | |
| | | |
| | | |
| | | |
| Adjusted Free Cash Flow | $ | 17,300 | | | $ | 18,000 | |
| | | |
| | | |
| | | |
| | | |
| | | |
| | | |
| | | |
T-Mobile US, Inc.
Operating Measures
(Unaudited)
The following table sets forth company operating measures ARPA and ARPU:
| | | | | | | | | | | | | | | | | | | | | | | | | | | | | | | | | | | | | | | | | | | | | | | | | | | | | | | | | | | | | |
| | | Quarter | | Year Ended December 31, |
| (in dollars) | | | Q1 2023 | | Q2 2023 | | Q3 2023 | | Q4 2023 | | Q1 2024 | | Q2 2024 | | Q3 2024 | | Q4 2024 | | 2023 | | 2024 |
| | | | | | | | | | | | | | | | | | | | | |
| | | | | | | | | | | | | | | | | | | | | |
| | | | | | | | | | | | | | | | | | | | | |
| | | | | | | | | | | | | | | | | | | | | |
| | | | | | | | | | | | | | | | | | | | | |
| Postpaid ARPA | | | $ | 138.04 | | | $ | 138.94 | | | $ | 139.83 | | | $ | 140.23 | | | $ | 140.88 | | | $ | 142.54 | | | $ | 145.60 | | | $ | 146.28 | | | $ | 139.27 | | | $ | 143.85 | |
| | | | | | | | | | | | | | | | | | | | | |
| | | | | | | | | | | | | | | | | | | | | |
| | | | | | | | | | | | | | | | | | | | | |
| | | | | | | | | | | | | | | | | | | | | |
| | | | | | | | | | | | | | | | | | | | | |
| | | | | | | | | | | | | | | | | | | | | |
| | | | | | | | | | | | | | | | | | | | | |
| Postpaid phone ARPU | | | 48.63 | | | 48.84 | | | 48.93 | | | 48.91 | | | 48.79 | | | 49.07 | | | 49.79 | | | 49.73 | | | 48.83 | | | 49.35 | |
| | | | | | | | | | | | | | | | | | | | | |
| | | | | | | | | | | | | | | | | | | | | |
| | | | | | | | | | | | | | | | | | | | | |
| | | | | | | | | | | | | | | | | | | | | |
| | | | | | | | | | | | | | | | | | | | | |
| | | | | | | | | | | | | | | | | | | | | |
| | | | | | | | | | | | | | | | | | | | | |
| | | | | | | | | | | | | | | | | | | | | |
| | | | | | | | | | | | | | | | | | | | | |
| | | | | | | | | | | | | | | | | | | | | |
| | | | | | | | | | | | | | | | | | | | | |
| | | | | | | | | | | | | | | | | | | | | |
| | | | | | | | | | | | | | | | | | | | | |
| | | | | | | | | | | | | | | | | | | | | |
| | | | | | | | | | | | | | | | | | | | | |
| Prepaid ARPU | | | 37.98 | | | 37.98 | | | 38.18 | | | 37.55 | | | 37.18 | | | 35.94 | | | 35.81 | | | 35.49 | | | 37.92 | | | 36.06 | |
| | | | | | | | | | | | | | | | | | | | | |
| | | | | | | | | | | | | | | | | | | | | |
| | | | | | | | | | | | | | | | | | | | | |
| | | | | | | | | | | | | | | | | | | | | |
| | | | | | | | | | | | | | | | | | | | | |
| | | | | | | | | | | | | | | | | | | | | |
| | | | | | | | | | | | | | | | | | | | | |
| | | | | | | | | | | | | | | | | | | | | |
| | | | | | | | | | | | | | | | | | | | | |
| | | | | | | | | | | | | | | | | | | | | |
| | | | | | | | | | | | | | | | | | | | | |
| | | | | | | | | | | | | | | | | | | | | |
| | | | | | | | | | | | | | | | | | | | | |
| | | | | | | | | | | | | | | | | | | | | |
| | | | | | | | | | | | | | | | | | | | | |
| | | | | | | | | | | | | | | | | | | | | |
| | | | | | | | | | | | | | | | | | | | | |
| | | | | | | | | | | | | | | | | | | | | |
| | | | | | | | | | | | | | | | | | | | | |
| | | | | | | | | | | | | | | | | | | | | |
| | | | | | | | | | | | | | | | | | | | | |
| | | | | | | | | | | | | | | | | | | | | |
| | | | | | | | | | | | | | | | | | | | | |
| | | | | | | | | | | | | | | | | | | | | |
| | | | | | | | | | | | | | | | | | | | | |
| | | | | | | | | | | | | | | | | | | | | |
| | | | | | | | | | | | | | | | | | | | | |
| | | | | | | | | | | | | | | | | | | | | |
| | | | | | | | | | | | | | | | | | | | | |
| | | | | | | | | | | | | | | | | | | | | |
| | | | | | | | | | | | | | | | | | | | | |
| | | | | | | | | | | | | | | | | | | | | |
| | | | | | | | | | | | | | | | | | | | | |
Postpaid Average Revenue Per Account (“ARPA”) - Average monthly postpaid service revenue earned per account. Postpaid service revenues for the specified period divided by the average number of postpaid accounts during the period, further divided by the number of months in the period.Average Revenue Per User (“ARPU”) - Average monthly service revenue earned per customer. Service revenues for the specified period divided by the average number of customers during the period, further divided by the number of months in the period.
Postpaid phone ARPU excludes postpaid other customers and related revenues.
EXHIBIT 99.2
| | | | | | | | |
| | Highlights |
| | Customer Metrics |
| | Financial Metrics |
| | Capital Structure |
| | |
| | Guidance |
| | Contacts |
| | Financial and Operational Tables |
(1)AT&T Inc. historically does not disclose postpaid net account additions. Comcast and Charter do not disclose postpaid phone net customer additions. Industry leading claims are based on consensus expectations if results are not yet reported.
(2)Core Adjusted EBITDA and Adjusted Free Cash Flow are non-GAAP financial measures. These non-GAAP financial measures should be considered in addition to, but not as a substitute for, the information provided in accordance with GAAP. Reconciliations for these non-GAAP financial measures to the most directly comparable GAAP financial measures are provided in the Reconciliation of Non-GAAP Financial Measures to GAAP Financial Measures tables. We are not able to forecast Net income on a forward-looking basis without unreasonable efforts due to the high variability and difficulty in predicting certain items that affect Net income, including, but not limited to, Income tax expense and Interest expense. Core Adjusted EBITDA should not be used to predict Net income as the difference between this measure and Net income is variable.
| | | | | |
| Postpaid Accounts (in thousands) |
Continued growth in Postpaid accounts with a decrease in net additions primarily due to:
■Fewer High Speed Internet only additions
Continued growth in Postpaid accounts with a decrease in net additions primarily due to:
■Seasonally fewer High Speed Internet only additions
Postpaid ARPA increased 4% primarily due to:
■Higher premium services, primarily high-end rate plans, net of contra revenues for content included in such plans, and discounts for specific affinity groups (55+, military, and first responders)
■An increase in customers per account, including continued adoption of High Speed Internet
■The impact from rate plan optimizations
■Partially offset by increased promotional activity and an increase in total High Speed Internet only accounts
Postpaid phone ARPU increased 2% due to:
■Higher premium services, primarily high-end rate plans, net of contra revenues for content included in such plans, and discounts for specific affinity groups (55+, military, and first responders)
■The impact from rate plan optimizations
■Partially offset by increased promotional activity, including the success of bundled offerings
Postpaid ARPA increased slightly due to:
■An increase in customers per account, including continued adoption of High Speed Internet
■Higher premium services, primarily high-end rate plans, net of contra revenues for content included in such plans, and discounts for specific affinity groups (55+, military, and first responders)
■Mostly offset by seasonally increased promotional activity
Postpaid phone ARPU was relatively flat due to:
■Seasonally higher promotional activity
■Mostly offset by higher premium services, primarily high-end rate plans, net of contra revenues for content included in such plans, and discounts for specific affinity groups (55+, military, and first responders)
| | | | | |
| Postpaid ARPA & Postpaid Phone ARPU |
| | | | | |
| Postpaid Customers (in thousands) |
Postpaid phone net customer additions decreased primarily due to:
■Increased deactivations from a growing customer base, partially offset by lower churn
Postpaid other net customer additions increased primarily due to:
■Higher net additions from mobile internet devices, primarily due to higher prior year deactivations of lower ARPU mobile internet devices in the educational sector that were activated during the Pandemic and no longer needed, and other connected devices
■Partially offset by lower net additions from wearables and High Speed Internet
Postpaid phone net customer additions increased primarily due to:
■Seasonally higher gross additions
■Partially offset by seasonally higher churn
Postpaid other net customer additions increased primarily due to:
■Seasonally higher net additions from mobile internet and other connected devices
Postpaid phone churn decreased 4 basis points primarily due to:
■Improved customer retention, including the benefits of a differentiated value proposition and network experience
Postpaid phone churn increased 6 basis points primarily due to:
■Seasonal trends
| | | | | |
| Prepaid Customers (in thousands) |
During Q2 2024, we acquired 3.5 million prepaid customers, net of certain base adjustments, through the acquisition of Mint Mobile and Ultra Mobile.
Prepaid net customer additions increased primarily due to:
■Higher net additions following the acquisition of Mint Mobile and Ultra Mobile
■Partially offset by higher deactivations from a larger base and continued moderation of prepaid industry growth
Prepaid net customer additions increased primarily due to:
■Seasonally higher gross additions
■Partially offset by seasonally higher churn
High Speed Internet net customer additions decreased primarily due to:
■Increased deactivations from a growing customer base
High Speed Internet net customer additions increased primarily due to:
■Higher gross additions
■Partially offset by increased deactivations from a growing customer base
| | | | | |
| High Speed Internet Customers (in thousands) |
| | | | | |
| Service Revenues ($ in millions) |
Service revenues increased 6% primarily due to:
■Increase in Postpaid service revenues
■Increase in Prepaid service revenues, driven by the impact of the acquisition of Mint Mobile and Ultra Mobile
■Partially offset by a decrease in Wholesale and other service revenues, primarily driven by lower MVNO revenues, including the impact of the acquisition of Mint Mobile and Ultra Mobile, as well as lower DISH and TracFone MVNO revenue, and lower Affordable Connectivity Program and Lifeline revenues
Service revenues increased 1% primarily due to:
■Increase in Postpaid service revenues
Postpaid service revenues increased 8% primarily due to:
■Higher postpaid ARPA
■Higher average postpaid accounts
Postpaid service revenues increased 1% primarily due to:
■Higher average postpaid accounts
■Higher postpaid ARPA
| | | | | |
| Postpaid Service Revenues ($ in millions) |

| | | | | |
| Equipment Revenues ($ in millions) |
Equipment revenues increased 13% primarily due to:
■A higher average revenue per device sold, net of promotions, primarily driven by an increase in the high-end phone mix, including from higher postpaid device sales and lower Assurance Wireless device sales
■Higher liquidation revenue primarily due to a higher number of liquidated devices, as well as an increase in the high-end phone mix
Equipment revenues increased 47% primarily due to:
■A higher average revenue per device sold, net of promotions, primarily due to a seasonal increase in the high-end phone mix
■A seasonal increase in the total number of devices sold
■Higher liquidation revenue primarily due to a higher number of liquidated devices, as well as an increase in the high-end phone mix
Cost of equipment sales, exclusive of Depreciation and Amortization (D&A), increased 9% primarily due to: ■A higher average cost per device sold, primarily driven by an increase in the high-end phone mix, including from higher postpaid device sales and lower Assurance Wireless device sales
■Higher liquidation costs primarily due to a higher number of liquidated devices, as well as an increase in the high-end phone mix
Cost of equipment sales, exclusive of D&A, increased 41% primarily due to:
■A higher average cost per device sold primarily due to a seasonal increase in the high-end phone mix
■A seasonal increase in the total number of devices sold
■Higher liquidation costs primarily due to a higher number of liquidated devices, as well as an increase in the high-end phone mix
| | | | | |
| Cost of Equipment Sales, exclusive of D&A ($ in millions) |
| | | | | |
| Cost of Services, exclusive of D&A ($ in millions, % of Service revenues) |
Cost of services, exclusive of D&A, decreased 3% primarily due to:
■Prior year Merger-related costs related to network decommissioning and integration
■Lower repair and maintenance expenses
■Higher Merger synergies
Cost of services, exclusive of D&A, decreased 1% primarily due to:
■Lower repair and maintenance expenses and utility expenses
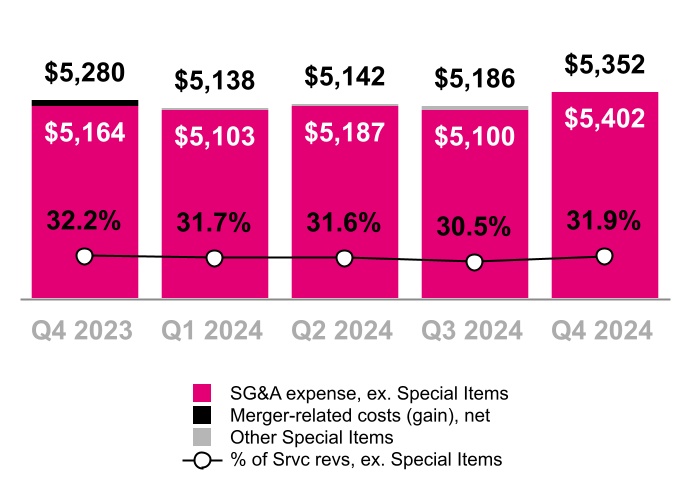
SG&A expense increased 1% primarily due to:
■Higher costs as the result of the acquisition of Mint Mobile and Ultra Mobile
■Higher payroll-related expenses
■Higher advertising expenses
■Partially offset by gains related to the closing of certain spectrum exchange transactions and legal-related insurance recoveries
SG&A expense increased 3% primarily due to:
■Seasonally higher advertising and other selling expenses
■Higher external labor and payroll-related expenses, including commissions expense on seasonally higher sales
■Partially offset by gains related to the closing of certain spectrum exchange transactions and legal-related insurance recoveries
| | | | | |
| Selling, General and Administrative (SG&A) Expense ($ in millions, % of Service revenues) |
| | | | | |
| Net Income ($ in millions, % of Service revenues) |
| | | | | |
| Diluted Earnings Per Share (Diluted EPS) |
Net income was $3.0 billion and Diluted earnings per share was $2.57 in Q4 2024, compared to $2.0 billion and $1.67 in Q4 2023, primarily due to the factors described above and included the following, net of tax:
■Merger-related costs of $186 million, or $0.15 per share, in Q4 2023
Net income was $3.0 billion and Diluted earnings per share was $2.57 in Q4 2024, compared to $3.1 billion and $2.61 in Q3 2024, primarily due to the factors described above.
| | | | | |
| Core Adjusted EBITDA* ($ in millions, % of Service revenues) |
*Excludes Special Items (see detail on page 24)
Core Adjusted EBITDA increased 10% primarily due to:
■Higher Total service revenues
■Higher Equipment revenues, excluding Lease revenues
■Partially offset by higher Cost of equipment sales and higher SG&A expenses, excluding Special Items
Core Adjusted EBITDA decreased 4% primarily due to:
■Higher Cost of equipment sales
■Higher SG&A expenses, excluding Special Items
■Partially offset by higher Equipment revenues, excluding Lease revenues, and higher Total service revenues
Net cash provided by operating activities increased 14% primarily due to:
■Higher Net income, adjusted for non-cash income and expenses
Net cash provided by operating activities decreased 10% primarily due to:
■Lower Net income, adjusted for non-cash income and expenses
■Higher net cash outflows from changes in working capital
The impact of net payments for Merger-related costs on Net cash provided by operating activities was $109 million in Q4 2024 compared to $124 million in Q3 2024 and $416 million in Q4 2023.
| | | | | |
| Net Cash Provided by Operating Activities ($ in millions) |
Effective November 1, 2024, following amendments to the company’s Equipment Installment Plan Sale and Service Receivable Sale arrangements, all cash proceeds associated with the sale of such receivables, a portion of which was previously recognized as Proceeds related to beneficial interests in securitization transactions within investing cash flows, were recognized as operating cash flows. These amendments did not have a net impact on Adjusted Free Cash Flow.
| | | | | |
| Cash Purchases of Property and Equipment, incl. Capitalized Interest ($ in millions, % of Service revenues) |
Cash purchases of property and equipment, including capitalized interest, increased 39% primarily due to:
■Planned timing of capital purchases
Cash purchases of property and equipment, including capitalized interest, increased 13% primarily due to:
■Planned timing of capital purchases
Adjusted Free Cash Flow decreased 5% primarily due to:
■Higher Cash purchases of property and equipment
■Lower proceeds related to securitization transactions, which were offset in Net cash provided by operating activities. There were no significant net cash impacts during the quarter from securitization.
■Partially offset by higher Net cash provided by operating activities
Adjusted Free Cash Flow decreased 21% primarily due to:
■Lower Net cash provided by operating activities
■Higher Cash purchases of property and equipment
■Lower proceeds related to securitization transactions, which were offset in Net cash provided by operating activities. There were no significant net cash impacts during the quarter from securitization.
The impact of net payments for Merger-related costs on Adjusted Free Cash Flow was $109 million in Q4 2024 compared to $124 million in Q3 2024 and $416 million in Q4 2023.
| | | | | |
| Adjusted Free Cash Flow ($ in millions) |
| | | | | |
| Net Debt (Excluding Tower Obligations) & Net Debt to LTM Net Income and Core Adj. EBITDA Ratios ($ in billions) |
| | | | | |
| Stockholder Returns ($ in millions) |
Total debt, excluding tower obligations, at the end of Q4 2024 was $80.6 billion.
Net debt, excluding tower obligations, at the end of Q4 2024 was $75.2 billion.
■On a cumulative basis, since the company initiated its stockholder return program in Q3 2022, a total of $31.4 billion has been returned to stockholders as of December 31, 2024, with 173.7 million shares repurchased for approximately $27.3 billion, and cumulative cash dividends of $4.0 billion.
■During Q4 2024, 20.3 million shares were repurchased for $4.6 billion.
■During Q4 2024, the company paid a cash dividend of $0.88 per share of common stock, or approximately $1.0 billion, on December 12, 2024.
■On December 13, 2024, the Board of Directors announced a stockholder return program for up to $14.0 billion that will run through December 31, 2025, consisting of additional repurchases of shares and payment of cash dividends, with the next dividend payable on March 13, 2025.
2025 Outlook
| | | | | | | |
| | | |
| Postpaid net customer additions | | 5.5 to 6.0 million | |
Net income (1) | | N/A | |
| Effective tax rate | | 24% to 26% | |
Core Adjusted EBITDA (2) | | $33.1 to $33.6 billion | |
| Net cash provided by operating activities | | $26.8 to $27.5 billion | |
Capital expenditures (3) | | ~$9.5 billion | |
| Adjusted Free Cash Flow | | $17.3 to $18.0 billion | |
T-Mobile’s 2025 guidance above excludes pending acquisitions of UScellular, Metronet, Lumos, and Vistar Media.
(1)We are not able to forecast Net income on a forward-looking basis without unreasonable efforts due to the high variability and difficulty in predicting certain items that affect GAAP Net income, including, but not limited to, Income tax expense and Interest expense. Core Adjusted EBITDA should not be used to predict Net income as the difference between this measure and Net income is variable.
(2)Management uses Core Adjusted EBITDA as a measure to monitor the financial performance of our operations, excluding the impact of lease revenues from our related device financing programs.
(3)Capital expenditures means cash purchases of property and equipment, including capitalized interest.
Investor Relations
| | | | | | | | | | | | | | | | | | | | |
| | | | | | |
| | | | | | |
| Cathy Yao | | Justin Taiber | | Rob Brust | |
| Senior Vice President | | Senior Director | | Senior Director | |
| Investor Relations | | Investor Relations | | Investor Relations | |
| | | | | | | | | | | | | | | | | | | | |
| | | | | | |
| | | | | | |
| Zach Witterstaetter | | Rose Kopecky | | Jacob Marks | |
| Investor Relations | | Investor Relations | | Investor Relations | |
| Manager | | Manager | | Manager | |
investor.relations@t-mobile.com
https://investor.t-mobile.com
T-Mobile US, Inc.
Consolidated Balance Sheets
(Unaudited)
| | | | | | | | | | | |
| (in millions, except share and per share amounts) | December 31,
2024 | | December 31,
2023 |
| Assets | | | |
| Current assets | | | |
| | | |
| Cash and cash equivalents | $ | 5,409 | | | $ | 5,135 | |
| Accounts receivable, net of allowance for credit losses of $176 and $161 | 4,276 | | | 4,692 | |
Equipment installment plan receivables, net of allowance for credit losses and imputed discount of $656 and $623 | 4,379 | | | 4,456 | |
| | | |
| Inventory | 1,607 | | | 1,678 | |
| | | |
| Prepaid expenses | 880 | | | 702 | |
| | | |
| Other current assets | 1,853 | | | 2,352 | |
| | | |
| Total current assets | 18,404 | | | 19,015 | |
| | | |
| Property and equipment, net | 38,533 | | | 40,432 | |
| Operating lease right-of-use assets | 25,398 | | | 27,135 | |
| Financing lease right-of-use assets | 3,091 | | | 3,270 | |
| Goodwill | 13,005 | | | 12,234 | |
| Spectrum licenses | 100,558 | | | 96,707 | |
| Other intangible assets, net | 2,512 | | | 2,618 | |
Equipment installment plan receivables due after one year, net of allowance for credit losses and imputed discount of $158 and $150 | 2,209 | | | 2,042 | |
| | | |
| Other assets | 4,325 | | | 4,229 | |
| | | |
| Total assets | $ | 208,035 | | | $ | 207,682 | |
| Liabilities and Stockholders' Equity | | | |
| Current liabilities | | | |
| | | |
| Accounts payable and accrued liabilities | $ | 8,463 | | | $ | 10,373 | |
| | | |
| Short-term debt | 4,068 | | | 3,619 | |
| | | |
| Deferred revenue | 1,222 | | | 825 | |
| Short-term operating lease liabilities | 3,281 | | | 3,555 | |
| Short-term financing lease liabilities | 1,175 | | | 1,260 | |
| | | |
| Other current liabilities | 1,965 | | | 1,296 | |
| | | |
| Total current liabilities | 20,174 | | | 20,928 | |
| | | |
| Long-term debt | 72,700 | | | 69,903 | |
| Long-term debt to affiliates | 1,497 | | | 1,496 | |
| Tower obligations | 3,664 | | | 3,777 | |
| Deferred tax liabilities | 16,700 | | | 13,458 | |
| Operating lease liabilities | 26,408 | | | 28,240 | |
| Financing lease liabilities | 1,151 | | | 1,236 | |
| | | |
| | | |
| Other long-term liabilities | 4,000 | | | 3,929 | |
| | | |
| Total long-term liabilities | 126,120 | | | 122,039 | |
| Commitments and contingencies | | | |
| Stockholders' equity | | | |
| | | |
| | | |
| Common stock, par value $0.00001 per share, 2,000,000,000 shares authorized; 1,271,074,364 and 1,262,904,154 shares issued, 1,144,579,681 and 1,195,807,331 shares outstanding | — | | | — | |
| Additional paid-in capital | 68,798 | | | 67,705 | |
| Treasury stock, at cost, 126,494,683 and 67,096,823 shares issued | (20,584) | | | (9,373) | |
| Accumulated other comprehensive loss | (857) | | | (964) | |
| Retained earnings | 14,384 | | | 7,347 | |
| | | |
| Total stockholders' equity | 61,741 | | | 64,715 | |
| Total liabilities and stockholders' equity | $ | 208,035 | | | $ | 207,682 | |
| | | |
| | | |
| | | |
| | | |
| | | |
| | | |
| | | |
| | | |
| | | |
| | | |
| | | |
| | | |
| | | |
| | | |
| | | |
| | | |
| | | |
| | | |
| | | |
| | | |
T-Mobile US, Inc.
Consolidated Statements of Comprehensive Income
(Unaudited)
| | | | | | | | | | | | | | | | | | | | | | | | | | | | | |
| Three Months Ended | | Year Ended December 31, |
| (in millions, except share and per share amounts) | December 31,
2024 | | September 30,
2024 | | December 31,
2023 | | 2024 | | 2023 |
| Revenues | | | | | | | | | |
| | | | | | | | | |
| Postpaid revenues | $ | 13,502 | | | $ | 13,308 | | | $ | 12,472 | | | $ | 52,340 | | | $ | 48,692 | |
| Prepaid revenues | 2,688 | | | 2,716 | | | 2,433 | | | 10,399 | | | 9,767 | |
| Wholesale and other service revenues | 738 | | | 701 | | | 1,138 | | | 3,439 | | | 4,782 | |
| | | | | | | | | |
| | | | | | | | | |
| Total service revenues | 16,928 | | | 16,725 | | | 16,043 | | | 66,178 | | | 63,241 | |
| | | | | | | | | |
| Equipment revenues | 4,699 | | | 3,207 | | | 4,174 | | | 14,263 | | | 14,138 | |
| Other revenues | 245 | | | 230 | | | 261 | | | 959 | | | 1,179 | |
| | | | | | | | | |
| Total revenues | 21,872 | | | 20,162 | | | 20,478 | | | 81,400 | | | 78,558 | |
| | | | | | | | | |
| Operating expenses | | | | | | | | | |
| | | | | | | | | |
| Cost of services, exclusive of depreciation and amortization shown separately below | 2,697 | | | 2,722 | | | 2,792 | | | 10,771 | | | 11,655 | |
| Cost of equipment sales, exclusive of depreciation and amortization shown separately below | 6,088 | | | 4,307 | | | 5,608 | | | 18,882 | | | 18,533 | |
| Selling, general and administrative | 5,352 | | | 5,186 | | | 5,280 | | | 20,818 | | | 21,311 | |
| | | | | | | | | |
| Gain on disposal group held for sale | — | | | — | | | — | | | — | | | (25) | |
| Depreciation and amortization | 3,149 | | | 3,151 | | | 3,318 | | | 12,919 | | | 12,818 | |
| | | | | | | | | |
| | | | | | | | | |
| Total operating expenses | 17,286 | | | 15,366 | | | 16,998 | | | 63,390 | | | 64,292 | |
| | | | | | | | | |
| Operating income | 4,586 | | | 4,796 | | | 3,480 | | | 18,010 | | | 14,266 | |
| | | | | | | | | |
| Other expense, net | | | | | | | | | |
| | | | | | | | | |
| Interest expense, net | (841) | | | (836) | | | (849) | | | (3,411) | | | (3,335) | |
| | | | | | | | | |
| | | | | | | | | |
| Other income, net | 94 | | | 7 | | | 12 | | | 113 | | | 68 | |
| Total other expense, net | (747) | | | (829) | | | (837) | | | (3,298) | | | (3,267) | |
| Income before income taxes | 3,839 | | | 3,967 | | | 2,643 | | | 14,712 | | | 10,999 | |
| Income tax expense | (858) | | | (908) | | | (629) | | | (3,373) | | | (2,682) | |
| | | | | | | | | |
| | | | | | | | | |
| | | | | | | | | |
| Net income | $ | 2,981 | | | $ | 3,059 | | | $ | 2,014 | | | $ | 11,339 | | | $ | 8,317 | |
| | | | | | | | | |
| | | | | | | | | |
| | | | | | | | | |
| Net income | $ | 2,981 | | | $ | 3,059 | | | $ | 2,014 | | | $ | 11,339 | | | $ | 8,317 | |
| Other comprehensive income, net of tax | | | | | | | | | |
| | | | | | | | | |
| | | | | | | | | |
Reclassification of loss from cash flow hedges, net of tax effect of $15, $15, $14, $60 and $56 | 46 | | | 44 | | | 42 | | | 176 | | | 163 | |
Reclassification of loss (gain) from fair value hedges, net of unrealized loss (gain) on fair value hedges, net of tax effect of $20, $(5), $0, $5 and $0 | 58 | | | (12) | | | — | | | 16 | | | — | |
Unrealized gain on foreign currency translation adjustment, net of tax effect of $0, $0, $0, $0 and $0 | — | | | — | | | — | | | — | | | 9 | |
| | | | | | | | | |
Actuarial loss, net of amortization and reclassification, on pension and other postretirement benefits, net of tax effect of $(24), $(2), $(20), $(29) and $(31) | (72) | | | (4) | | | (57) | | | (85) | | | (90) | |
| | | | | | | | | |
| | | | | | | | | |
| Other comprehensive income (loss) | 32 | | | 28 | | | (15) | | | 107 | | | 82 | |
| | | | | | | | | |
| Total comprehensive income | $ | 3,013 | | | $ | 3,087 | | | $ | 1,999 | | | $ | 11,446 | | | $ | 8,399 | |
| Earnings per share | | | | | | | | | |
| | | | | | | | | |
| | | | | | | | | |
| | | | | | | | | |
| Basic | $ | 2.58 | | | $ | 2.62 | | | $ | 1.74 | | | $ | 9.70 | | | $ | 7.02 | |
| | | | | | | | | |
| | | | | | | | | |
| | | | | | | | | |
| Diluted | $ | 2.57 | | | $ | 2.61 | | | $ | 1.67 | | | $ | 9.66 | | | $ | 6.93 | |
| Weighted-average shares outstanding | | | | | | | | | |
| Basic | 1,154,679,440 | | | 1,166,961,755 | | | 1,157,313,367 | | | 1,169,195,373 | | | 1,185,121,562 | |
| Diluted | 1,159,095,696 | | | 1,170,649,561 | | | 1,205,014,105 | | | 1,173,213,898 | | | 1,200,286,264 | |
| | | | | | | | | |
| | | | | | | | | |
| | | | | | | | | |
| | | | | | | | | |
| | | | | | | | | |
| | | | | | | | | |
| | | | | | | | | |
| | | | | | | | | |
| | | | | | | | | |
| | | | | | | | | |
| | | | | | | | | |
| | | | | | | | | |
| | | | | | | | | |
| | | | | | | | | |
| | | | | | | | | |
| | | | | | | | | |
| | | | | | | | | |
| | | | | | | | | |
| | | | | | | | | |
| | | | | | | | | |
| | | | | | | | | |
| | | | | | | | | |
| | | | | | | | | |
| | | | | | | | | |
| | | | | | | | | |
| | | | | | | | | |
| | | | | | | | | |
| | | | | | | | | |
| | | | | | | | | |
| | | | | | | | | |
T-Mobile US, Inc.
Consolidated Statements of Cash Flows
(Unaudited)
| | | | | | | | | | | | | | | | | | | | | | | | | | | | | |
| Three Months Ended | | Year Ended December 31, |
| (in millions) | December 31,
2024 | | September 30,
2024 | | December 31,
2023 | | 2024 | | 2023 |
| Operating activities | | | | | | | | | |
| Net income | $ | 2,981 | | | $ | 3,059 | | | $ | 2,014 | | | $ | 11,339 | | | $ | 8,317 | |
| Adjustments to reconcile net income to net cash provided by operating activities | | | | | | | | | |
| | | | | | | | | |
| Depreciation and amortization | 3,149 | | | 3,151 | | | 3,318 | | | 12,919 | | | 12,818 | |
| Stock-based compensation expense | 175 | | | 170 | | | 167 | | | 649 | | | 667 | |
| Deferred income tax expense | 841 | | | 817 | | | 615 | | | 3,120 | | | 2,600 | |
| Bad debt expense | 356 | | | 299 | | | 235 | | | 1,192 | | | 898 | |
| (Gains) losses from sales of receivables | (7) | | | 23 | | | 30 | | | 62 | | | 165 | |
| | | | | | | | | |
| | | | | | | | | |
| | | | | | | | | |
| | | | | | | | | |
| | | | | | | | | |
| Loss on remeasurement of disposal group held for sale | — | | | — | | | — | | | — | | | 9 | |
| Changes in operating assets and liabilities | | | | | | | | | |
| Accounts receivable | (652) | | | (734) | | | (1,210) | | | (3,088) | | | (5,038) | |
| Equipment installment plan receivables | (883) | | | (72) | | | (393) | | | (523) | | | 170 | |
| Inventory | 188 | | | (448) | | | 15 | | | 131 | | | 197 | |
| Operating lease right-of-use assets | 875 | | | 877 | | | 898 | | | 3,480 | | | 3,721 | |
| Other current and long-term assets | (136) | | | (19) | | | (435) | | | (411) | | | (358) | |
| Accounts payable and accrued liabilities | (180) | | | (165) | | | 412 | | | (2,041) | | | (1,126) | |
| Short- and long-term operating lease liabilities | (909) | | | (805) | | | (901) | | | (3,879) | | | (3,785) | |
| Other current and long-term liabilities | (21) | | | (125) | | | 70 | | | (678) | | | (839) | |
| Other, net | (228) | | | 111 | | | 24 | | | 21 | | | 143 | |
| | | | | | | | | |
| Net cash provided by operating activities | 5,549 | | | 6,139 | | | 4,859 | | | 22,293 | | | 18,559 | |
| Investing activities | | | | | | | | | |
| | | | | | | | | |
Purchases of property and equipment, including capitalized interest of $(8), $(9), $(10), $(34) and $(104) | (2,212) | | | (1,961) | | | (1,587) | | | (8,840) | | | (9,801) | |
| Purchases of spectrum licenses and other intangible assets, including deposits | (835) | | | (2,419) | | | (785) | | | (3,471) | | | (1,010) | |
| Proceeds from sales of tower sites | — | | | — | | | 2 | | | — | | | 12 | |
| Proceeds related to beneficial interests in securitization transactions | 747 | | | 984 | | | 1,031 | | | 3,579 | | | 4,816 | |
| | | | | | | | | |
| Acquisition of companies, net of cash acquired | 17 | | | — | | | — | | | (373) | | | — | |
| | | | | | | | | |
| Other, net | (17) | | | 89 | | | 118 | | | 33 | | | 154 | |
| | | | | | | | | |
| Net cash used in investing activities | (2,300) | | | (3,307) | | | (1,221) | | | (9,072) | | | (5,829) | |
| Financing activities | | | | | | | | | |
| | | | | | | | | |
| Proceeds from issuance of long-term debt | 498 | | | 2,480 | | | — | | | 8,587 | | | 8,446 | |
| | | | | | | | | |
| | | | | | | | | |
| | | | | | | | | |
| Repayments of financing lease obligations | (342) | | | (347) | | | (313) | | | (1,367) | | | (1,227) | |
| | | | | | | | | |
| Repayments of long-term debt | (1,904) | | | (223) | | | (223) | | | (5,073) | | | (5,051) | |
| | | | | | | | | |
| | | | | | | | | |
| Repurchases of common stock | (4,687) | | | (560) | | | (2,183) | | | (11,228) | | | (13,074) | |
| Dividends on common stock | (1,014) | | | (758) | | | (747) | | | (3,300) | | | (747) | |
| | | | | | | | | |
| | | | | | | | | |
| Tax withholdings on share-based awards | (25) | | | (36) | | | (30) | | | (269) | | | (297) | |
| | | | | | | | | |
| | | | | | | | | |
| Other, net | (48) | | | (49) | | | (34) | | | (165) | | | (147) | |
| | | | | | | | | |
| Net cash (used in) provided by financing activities | (7,522) | | | 507 | | | (3,530) | | | (12,815) | | | (12,097) | |
| Change in cash and cash equivalents, including restricted cash and cash held for sale | (4,273) | | | 3,339 | | | 108 | | | 406 | | | 633 | |
| Cash and cash equivalents, including restricted cash and cash held for sale | | | | | | | | | |
| Beginning of period | 9,986 | | | 6,647 | | | 5,199 | | | 5,307 | | | 4,674 | |
| End of period | $ | 5,713 | | | $ | 9,986 | | | $ | 5,307 | | | $ | 5,713 | | | $ | 5,307 | |
| | | | | | | | | |
| | | | | | | | | |
| | | | | | | | | |
| | | | | | | | | |
| | | | | | | | | |
| | | | | | | | | |
| | | | | | | | | |
| | | | | | | | | |
| | | | | | | | | |
| | | | | | | | | |
| | | | | | | | | |
| | | | | | | | | |
| | | | | | | | | |
| | | | | | | | | |
| | | | | | | | | |
| | | | | | | | | |
| | | | | | | | | |
| | | | | | | | | |
| | | | | | | | | |
| | | | | | | | | |
| | | | | | | | | |
| | | | | | | | | |
| | | | | | | | | |
| | | | | | | | | |
| | | | | | | | | |
| | | | | | | | | |
| | | | | | | | | |
| | | | | | | | | |
T-Mobile US, Inc.
Consolidated Statements of Cash Flows (Continued)
(Unaudited)
| | | | | | | | | | | | | | | | | | | | | | | | | | | | | |
| Three Months Ended | | Year Ended December 31, |
| (in millions) | December 31,
2024 | | September 30,
2024 | | December 31,
2023 | | 2024 | | 2023 |
| Supplemental disclosure of cash flow information | | | | | | | | | |
| Interest payments, net of amounts capitalized | $ | 905 | | | $ | 947 | | | $ | 895 | | | $ | 3,683 | | | $ | 3,546 | |
| Operating lease payments | 1,234 | | | 1,127 | | | 1,228 | | | 5,162 | | | 5,062 | |
| Income tax payments | 47 | | | 50 | | | 23 | | | 211 | | | 149 | |
| Non-cash investing and financing activities | | | | | | | | | |
| Non-cash beneficial interest obtained in exchange for securitized receivables | $ | 138 | | | $ | 789 | | | $ | 842 | | | $ | 2,421 | | | $ | 3,990 | |
| | | | | | | | | |
| Change in accounts payable and accrued liabilities for purchases of property and equipment | 1,190 | | | 41 | | | 336 | | | 105 | | | (860) | |
| | | | | | | | | |
| | | | | | | | | |
| | | | | | | | | |
| | | | | | | | | |
| Operating lease right-of-use assets obtained in exchange for lease obligations | 441 | | | 469 | | | 465 | | | 1,741 | | | 2,141 | |
| Financing lease right-of-use assets obtained in exchange for lease obligations | 239 | | | 409 | | | 263 | | | 1,222 | | | 1,224 | |
| Contingent and other deferred consideration related to the Ka’ena Acquisition | 8 | | | — | | | — | | | 218 | | | — | |
T-Mobile US, Inc.
Supplementary Operating and Financial Data
(Unaudited)
| | | | | | | | | | | | | | | | | | | | | | | | | | | | | | | | | | | | | | | | | | | | | | | | | | | | | | | | | | | |
| Quarter | | Year Ended December 31, |
| (in thousands) | Q1 2023 | | Q2 2023 | | Q3 2023 | | Q4 2023 | | Q1 2024 | | Q2 2024 | | Q3 2024 | | Q4 2024 | | 2023 | | 2024 |
| Customers, end of period | | | | | | | | | | | | | | | | | | | |
| | | | | | | | | | | | | | | | | | | |
Postpaid phone customers (1) | 73,372 | | | 74,132 | | | 74,982 | | | 75,936 | | | 76,468 | | | 77,245 | | | 78,110 | | | 79,013 | | | 75,936 | | | 79,013 | |
Postpaid other customers (1) | 20,153 | | | 20,954 | | | 21,330 | | | 22,116 | | | 22,804 | | | 23,365 | | | 24,075 | | | 25,105 | | | 22,116 | | | 25,105 | |
| | | | | | | | | | | | | | | | | | | |
| Total postpaid customers | 93,525 | | | 95,086 | | | 96,312 | | | 98,052 | | | 99,272 | | | 100,610 | | | 102,185 | | | 104,118 | | | 98,052 | | | 104,118 | |
| | | | | | | | | | | | | | | | | | | |
Prepaid customers (2) | 21,392 | | | 21,516 | | | 21,595 | | | 21,648 | | | 21,600 | | | 25,283 | | | 25,307 | | | 25,410 | | | 21,648 | | | 25,410 | |
| | | | | | | | | | | | | | | | | | | |
| Total customers | 114,917 | | | 116,602 | | | 117,907 | | | 119,700 | | | 120,872 | | | 125,893 | | | 127,492 | | | 129,528 | | | 119,700 | | | 129,528 | |
| | | | | | | | | | | | | | | | | | | |
| | | | | | | | | | | | | | | | | | | |
| | | | | | | | | | | | | | | | | | | |
| | | | | | | | | | | | | | | | | | | |
| | | | | | | | | | | | | | | | | | | |
Adjustments to customers (1) (2) | — | | | — | | | — | | | 170 | | | — | | | 3,504 | | | — | | | — | | | 170 | | | 3,504 | |
| | | | | | | | | | | | | | | | | | | |
| | | | | | | | | | | | | | | | | | | |
| | | | | | | | | | | | | | | | | | | |
| | | | | | | | | | | | | | | | | | | |
| | | | | | | | | | | | | | | | | | | |
| | | | | | | | | | | | | | | | | | | |
| | | | | | | | | | | | | | | | | | | |
| | | | | | | | | | | | | | | | | | | |
| | | | | | | | | | | | | | | | | | | |
| | | | | | | | | | | | | | | | | | | |
| | | | | | | | | | | | | | | | | | | |
| | | | | | | | | | | | | | | | | | | |
| | | | | | | | | | | | | | | | | | | |
| | | | | | | | | | | | | | | | | | | |
| | | | | | | | | | | | | | | | | | | |
| | | | | | | | | | | | | | | | | | | |
| | | | | | | | | | | | | | | | | | | |
| | | | | | | | | | | | | | | | | | | |
| | | | | | | | | | | | | | | | | | | |
| | | | | | | | | | | | | | | | | | | |
| | | | | | | | | | | | | | | | | | | |
| | | | | | | | | | | | | | | | | | | |
| | | | | | | | | | | | | | | | | | | |
| | | | | | | | | | | | | | | | | | | |
| | | | | | | | | | | | | | | | | | | |
| | | | | | | | | | | | | | | | | | | |
| | | | | | | | | | | | | | | | | | | |
| | | | | | | | | | | | | | | | | | | |
| | | | | | | | | | | | | | | | | | | |
| | | | | | | | | | | | | | | | | | | |
| | | | | | | | | | | | | | | | | | | |
| | | | | | | | | | | | | | | | | | | |
(1)In the fourth quarter of 2023, we recognized a base adjustment to increase postpaid phone customers by 20,000 and increase postpaid other customers by 150,000 due to fewer customers than expected whose service was deactivated as a result of the network shutdowns.
(2)In the second quarter of 2024, we acquired 3,504,000 prepaid customers through our acquisition of Ka’ena, which includes the impact of certain base adjustments to align the policies of Ka’ena and T-Mobile.
| | | | | | | | | | | | | | | | | | | | | | | | | | | | | | | | | | | | | | | | | | | | | | | | | | | | | | | | | | | |
| Quarter | | Year Ended December 31, |
| (in thousands) | Q1 2023 | | Q2 2023 | | Q3 2023 | | Q4 2023 | | Q1 2024 | | Q2 2024 | | Q3 2024 | | Q4 2024 | | 2023 | | 2024 |
| Net customer additions (losses) | | | | | | | | | | | | | | | | | | | |
| | | | | | | | | | | | | | | | | | | |
| Postpaid phone customers | 538 | | | 760 | | | 850 | | | 934 | | | 532 | | | 777 | | | 865 | | | 903 | | | 3,082 | | | 3,077 | |
| Postpaid other customers | 755 | | | 801 | | | 376 | | | 636 | | | 688 | | | 561 | | | 710 | | | 1,030 | | | 2,568 | | | 2,989 | |
| | | | | | | | | | | | | | | | | | | |
| Total postpaid customers | 1,293 | | | 1,561 | | | 1,226 | | | 1,570 | | | 1,220 | | | 1,338 | | | 1,575 | | | 1,933 | | | 5,650 | | | 6,066 | |
| | | | | | | | | | | | | | | | | | | |
| Prepaid customers | 26 | | | 124 | | | 79 | | | 53 | | | (48) | | | 179 | | | 24 | | | 103 | | | 282 | | | 258 | |
| | | | | | | | | | | | | | | | | | | |
| Total net customer additions | 1,319 | | | 1,685 | | | 1,305 | | | 1,623 | | | 1,172 | | | 1,517 | | | 1,599 | | | 2,036 | | | 5,932 | | | 6,324 | |
| | | | | | | | | | | | | | | | | | | |
| Migrations from prepaid to postpaid plans | 145 | | | 140 | | | 155 | | | 170 | | | 145 | | | 140 | | | 175 | | | 160 | | | 610 | | | 620 | |
| | | | | | | | | | | | | | | | | | | |
| | | | | | | | | | | | | | | | | | | |
| | | | | | | | | | | | | | | | | | | |
| | | | | | | | | | | | | | | | | | | |
| | | | | | | | | | | | | | | | | | | |
| | | | | | | | | | | | | | | | | | | |
| | | | | | | | | | | | | | | | | | | |
| | | | | | | | | | | | | | | | | | | |
| | | | | | | | | | | | | | | | | | | |
| | | | | | | | | | | | | | | | | | | |
| | | | | | | | | | | | | | | | | | | |
| | | | | | | | | | | | | | | | | | | |
| | | | | | | | | | | | | | | | | | | |
| | | | | | | | | | | | | | | | | | | |
| | | | | | | | | | | | | | | | | | | |
| | | | | | | | | | | | | | | | | | | |
| | | | | | | | | | | | | | | | | | | |
| | | | | | | | | | | | | | | | | | | |
| | | | | | | | | | | | | | | | | | | |
| | | | | | | | | | | | | | | | | | | |
| | | | | | | | | | | | | | | | | | | |
| | | | | | | | | | | | | | | | | | | |
| | | | | | | | | | | | | | | | | | | |
| | | | | | | | | | | | | | | | | | | |
| | | | | | | | | | | | | | | | | | | |
| | | | | | | | | | | | | | | | | | | |
| | | | | | | | | | | | | | | | | | | |
| | | | | | | | | | | | | | | | | | | |
| | | | | | | | | | | | | | | | | | | |
| | | | | | | | | | | | | | | | | | | |
| | | | | | | | | | | | | | | | | | | |
| | | | | | | | | | | | | | | | | | | |
| | | | | | | | | | | | | | | | | | | |
| | | | | | | | | | | | | | | | | | | |
| | | | | | | | | | | | | | | | | | | |
| | | | | | | | | | | | | | | | | | | |
| | | | | | | | | | | | | | | | | | | |
| | | | | | | | | | | | | | | | | | | |
| | | | | | | | | | | | | | | | | | | |
| | | | | | | | | | | | | | | | | | | |
| | | | | | | | | | | | | | | | | | | |
| | | | | | | | | | | | | | | | | | | |
| | | | | | | | | | | | | | | | | | | |
| | | | | | | | | | | | | | | | | | | | | | | | | | | | | | | | | | | | | | | | | | | | | | | | | | | | | | | | | | | |
| Quarter | | Year Ended December 31, |
| Q1 2023 | | Q2 2023 | | Q3 2023 | | Q4 2023 | | Q1 2024 | | Q2 2024 | | Q3 2024 | | Q4 2024 | | 2023 | | 2024 |
| Churn | | | | | | | | | | | | | | | | | | | |
| Postpaid phone churn | 0.89 | % | | 0.77 | % | | 0.87 | % | | 0.96 | % | | 0.86 | % | | 0.80 | % | | 0.86 | % | | 0.92 | % | | 0.87 | % | | 0.86 | % |
| Prepaid churn | 2.76 | % | | 2.62 | % | | 2.81 | % | | 2.86 | % | | 2.75 | % | | 2.54 | % | | 2.78 | % | | 2.85 | % | | 2.76 | % | | 2.73 | % |
| | | | | | | | | | | | | | | | | | | | | | | | | | | | | | | | | | | | | | | | | | | | | | | | | | | | | | | | | | | |
| Quarter | | Year Ended December 31, |
| Q1 2023 | | Q2 2023 | | Q3 2023 | | Q4 2023 | | Q1 2024 | | Q2 2024 | | Q3 2024 | | Q4 2024 | | 2023 | | 2024 |
| Postpaid upgrade rate | | | | | | | | | | | | | | | | | | | |
| Postpaid device upgrade rate | 3.2 | % | | 2.6 | % | | 2.7 | % | | 3.2 | % | | 2.4 | % | | 2.3 | % | | 2.6 | % | | 3.6 | % | | 11.7 | % | | 11.1 | % |
T-Mobile US, Inc.
Supplementary Operating and Financial Data
(Unaudited)
| | | | | | | | | | | | | | | | | | | | | | | | | | | | | | | | | | | | | | | | | | | | | | | | | | | | | | | | | | | |
| Quarter | | Year Ended December 31, |
| (in thousands) | Q1 2023 | | Q2 2023 | | Q3 2023 | | Q4 2023 | | Q1 2024 | | Q2 2024 | | Q3 2024 | | Q4 2024 | | 2023 | | 2024 |
| Accounts, end of period | | | | | | | | | | | | | | | | | | | |
| Total postpaid customer accounts | 28,813 | | 29,112 | | 29,498 | | 29,797 | | 30,015 | | 30,316 | | 30,631 | | 30,894 | | 29,797 | | 30,894 |
| | | | | | | | | | | | | | | | | | | |
| | | | | | | | | | | | | | | | | | | |
| | | | | | | | | | | | | | | | | | | | | | | | | | | | | | | | | | | | | | | | | | | | | | | | | | | | | | | | | | | |
| Quarter | | Year Ended December 31, |
| (in thousands) | Q1 2023 | | Q2 2023 | | Q3 2023 | | Q4 2023 | | Q1 2024 | | Q2 2024 | | Q3 2024 | | Q4 2024 | | 2023 | | 2024 |
| Net account additions | | | | | | | | | | | | | | | | | | | |
| Postpaid net account additions | 287 | | 299 | | 386 | | 299 | | 218 | | 301 | | 315 | | 263 | | 1,271 | | 1,097 |
| | | | | | | | | | | | | | | | | | | |
| | | | | | | | | | | | | | | | | | | |
| | | | | | | | | | | | | | | | | | | | | | | | | | | | | | | | | | | | | | | | | | | | | | | | | | | | | | | | | | | |
| Quarter | | Year Ended December 31, |
| (in thousands) | Q1 2023 | | Q2 2023 | | Q3 2023 | | Q4 2023 | | Q1 2024 | | Q2 2024 | | Q3 2024 | | Q4 2024 | | 2023 | | 2024 |
| High speed internet customers, end of period | | | | | | | | | | | | | | | | | | | |
| Postpaid high speed internet customers | 2,855 | | 3,302 | | 3,807 | | 4,288 | | 4,634 | | 4,992 | | 5,377 | | 5,742 | | 4,288 | | 5,742 |
| Prepaid high speed internet customers | 314 | | 376 | | 428 | | 488 | | 547 | | 595 | | 625 | | 688 | | 488 | | 688 |
| Total high speed internet customers, end of period | 3,169 | | 3,678 | | 4,235 | | 4,776 | | 5,181 | | 5,587 | | 6,002 | | 6,430 | | 4,776 | | 6,430 |
| | | | | | | | | | | | | | | | | | | |
| | | | | | | | | | | | | | | | | | | |
| | | | | | | | | | | | | | | | | | | | | | | | | | | | | | | | | | | | | | | | | | | | | | | | | | | | | | | | | | | |
| Quarter | | Year Ended December 31, |
| (in thousands) | Q1 2023 | | Q2 2023 | | Q3 2023 | | Q4 2023 | | Q1 2024 | | Q2 2024 | | Q3 2024 | | Q4 2024 | | 2023 | | 2024 |
| High speed internet - net customer additions | | | | | | | | | | | | | | | | | | | |
| Postpaid high speed internet customers | 445 | | 447 | | 505 | | 481 | | 346 | | 358 | | 385 | | 365 | | 1,878 | | 1,454 |
| Prepaid high speed internet customers | 78 | | 62 | | 52 | | 60 | | 59 | | 48 | | 30 | | 63 | | 252 | | 200 |
| Total high speed internet net customer additions | 523 | | 509 | | 557 | | 541 | | 405 | | 406 | | 415 | | 428 | | 2,130 | | 1,654 |
| | | | | | | | | | | | | | | | | | | |
| | | | | | | | | | | | | | | | | | | |
| | | | | | | | | | | | | | | | | | | | | | | | | | | | | | | | | | | | | | | | | | | | | | | | | | | | | | | | | | | |
| Quarter | | Year Ended December 31, |
| (in millions) | Q1 2023 | | Q2 2023 | | Q3 2023 | | Q4 2023 | | Q1 2024 | | Q2 2024 | | Q3 2024 | | Q4 2024 | | 2023 | | 2024 |
| Device financing - equipment installment plans | | | | | | | | | | | | | | | | | | | |
| Gross EIP financed | $ | 3,335 | | | $ | 2,858 | | | $ | 3,116 | | | $ | 4,275 | | | $ | 3,218 | | | $ | 3,037 | | | $ | 3,304 | | | $ | 4,689 | | | $ | 13,584 | | | $ | 14,248 | |
| EIP billings | 3,871 | | | 3,732 | | | 3,622 | | | 3,829 | | | 3,880 | | | 3,604 | | | 3,423 | | | 3,509 | | | 15,054 | | | 14,416 | |
| EIP receivables, net | 7,262 | | | 6,745 | | | 6,349 | | | 6,498 | | | 5,967 | | | 5,556 | | | 5,347 | | | 6,588 | | | 6,498 | | | 6,588 | |
| | | | | | | | | | | | | | | | | | | |
| | | | | | | | | | | | | | | | | | | |
| | | | | | | | | | | | | | | | | | | |
| Device financing - leased devices | | | | | | | | | | | | | | | | | | | |
| Lease revenues | $ | 147 | | | $ | 69 | | | $ | 53 | | | $ | 43 | | | $ | 35 | | | $ | 26 | | | $ | 21 | | | $ | 11 | | | $ | 312 | | | $ | 93 | |
| Leased device depreciation | 58 | | | 46 | | | 37 | | | 29 | | | 22 | | | 15 | | | 11 | | | 6 | | | 170 | | | 54 | |
| | | | | | | | | | | | | | | | | | | |
| | | | | | | | | | | | | | | | | | | |
| | | | | | | | | | | | | | | | | | | |
| | | | | | | | | | | | | | | | | | | |
| | | | | | | | | | | | | | | | | | | | | | | | | | | | | | | | | | | | | | | | | | | | | | | | | | | | | | | | | | | |
| Quarter | | Year Ended December 31, |
| (in dollars) | Q1 2023 | | Q2 2023 | | Q3 2023 | | Q4 2023 | | Q1 2024 | | Q2 2024 | | Q3 2024 | | Q4 2024 | | 2023 | | 2024 |
| Operating measures | | | | | | | | | | | | | | | | | | | |
| Postpaid ARPA | $ | 138.04 | | | $ | 138.94 | | | $ | 139.83 | | | $ | 140.23 | | | $ | 140.88 | | | $ | 142.54 | | | $ | 145.60 | | | $ | 146.28 | | | $ | 139.27 | | | $ | 143.85 | |
| Postpaid phone ARPU | 48.63 | | 48.84 | | 48.93 | | 48.91 | | 48.79 | | 49.07 | | 49.79 | | 49.73 | | 48.83 | | 49.35 |
| Prepaid ARPU | 37.98 | | 37.98 | | 38.18 | | 37.55 | | 37.18 | | 35.94 | | 35.81 | | 35.49 | | 37.92 | | 36.06 |
| | | | | | | | | | | | | | | | | | | |
| | | | | | | | | | | | | | | | | | | |
T-Mobile US, Inc.
Supplementary Operating and Financial Data (continued)
(Unaudited)
| | | | | | | | | | | | | | | | | | | | | | | | | | | | | | | | | | | | | | | | | | | | | | | | | | | | | | | | | | | |
| Quarter | | Year Ended December 31, |
| (in millions, except percentages) | Q1 2023 | | Q2 2023 | | Q3 2023 | | Q4 2023 | | Q1 2024 | | Q2 2024 | | Q3 2024 | | Q4 2024 | | 2023 | | 2024 |
| Financial measures | | | | | | | | | | | | | | | | | | | |
| | | | | | | | | | | | | | | | | | | |
| Service revenues | $ | 15,546 | | | $ | 15,738 | | | $ | 15,914 | | | $ | 16,043 | | | $ | 16,096 | | | $ | 16,429 | | | $ | 16,725 | | | $ | 16,928 | | | $ | 63,241 | | | $ | 66,178 | |
| | | | | | | | | | | | | | | | | | | |
| Equipment revenues | $ | 3,719 | | | $ | 3,169 | | | $ | 3,076 | | | $ | 4,174 | | | $ | 3,251 | | | $ | 3,106 | | | $ | 3,207 | | | $ | 4,699 | | | $ | 14,138 | | | $ | 14,263 | |
| Lease revenues | 147 | | | 69 | | | 53 | | | 43 | | | 35 | | | 26 | | | 21 | | | 11 | | | 312 | | | 93 | |
| Equipment sales | $ | 3,572 | | | $ | 3,100 | | | $ | 3,023 | | | $ | 4,131 | | | $ | 3,216 | | | $ | 3,080 | | | $ | 3,186 | | | $ | 4,688 | | | $ | 13,826 | | | $ | 14,170 | |
| | | | | | | | | | | | | | | | | | | |
| Total revenues | $ | 19,632 | | | $ | 19,196 | | | $ | 19,252 | | | $ | 20,478 | | | $ | 19,594 | | | $ | 19,772 | | | $ | 20,162 | | | $ | 21,872 | | | $ | 78,558 | | | $ | 81,400 | |
| | | | | | | | | | | | | | | | | | | |
| Net income | $ | 1,940 | | | $ | 2,221 | | | $ | 2,142 | | | $ | 2,014 | | | $ | 2,374 | | | $ | 2,925 | | | $ | 3,059 | | | $ | 2,981 | | | $ | 8,317 | | | $ | 11,339 | |
| Net income margin | 12.5 | % | | 14.1 | % | | 13.5 | % | | 12.6 | % | | 14.7 | % | | 17.8 | % | | 18.3 | % | | 17.6 | % | | 13.2 | % | | 17.1 | % |
| | | | | | | | | | | | | | | | | | | |
| Adjusted EBITDA | $ | 7,199 | | | $ | 7,405 | | | $ | 7,600 | | | $ | 7,224 | | | $ | 7,652 | | | $ | 8,053 | | | $ | 8,243 | | | $ | 7,916 | | | $ | 29,428 | | | $ | 31,864 | |
| Adjusted EBITDA margin | 46.3 | % | | 47.1 | % | | 47.8 | % | | 45.0 | % | | 47.5 | % | | 49.0 | % | | 49.3 | % | | 46.8 | % | | 46.5 | % | | 48.1 | % |
| Core Adjusted EBITDA | $ | 7,052 | | | $ | 7,336 | | | $ | 7,547 | | | $ | 7,181 | | | $ | 7,617 | | | $ | 8,027 | | | $ | 8,222 | | | $ | 7,905 | | | $ | 29,116 | | | $ | 31,771 | |
| Core Adjusted EBITDA margin | 45.4 | % | | 46.6 | % | | 47.4 | % | | 44.8 | % | | 47.3 | % | | 48.9 | % | | 49.2 | % | | 46.7 | % | | 46.0 | % | | 48.0 | % |
| | | | | | | | | | | | | | | | | | | |
| Cost of services, exclusive of depreciation and amortization | $ | 3,061 | | | $ | 2,916 | | | $ | 2,886 | | | $ | 2,792 | | | $ | 2,688 | | | $ | 2,664 | | | $ | 2,722 | | | $ | 2,697 | | | $ | 11,655 | | | $ | 10,771 | |
| Merger-related costs | 208 | | | 178 | | | 120 | | | 146 | | | 107 | | | 73 | | | — | | | — | | | 652 | | | 180 | |
| Other Special Items | 23 | | | 18 | | | 154 | | | — | | | 1 | | | — | | | 67 | | | 75 | | | 195 | | | 143 | |
| | | | | | | | | | | | | | | | | | | |
| Cost of services, excluding depreciation and amortization and Special Items | $ | 2,830 | | | $ | 2,720 | | | $ | 2,612 | | | $ | 2,646 | | | $ | 2,580 | | | $ | 2,591 | | | $ | 2,655 | | | $ | 2,622 | | | $ | 10,808 | | | $ | 10,448 | |
| | | | | | | | | | | | | | | | | | | |
| Cost of equipment sales, exclusive of depreciation and amortization | $ | 4,588 | | | $ | 4,088 | | | $ | 4,249 | | | $ | 5,608 | | | $ | 4,399 | | | $ | 4,088 | | | $ | 4,307 | | | $ | 6,088 | | | $ | 18,533 | | | $ | 18,882 | |
| Merger-related recoveries | (9) | | | — | | | (3) | | | — | | | — | | | — | | | — | | | — | | | (12) | | | — | |
| | | | | | | | | | | | | | | | | | | |
| Cost of equipment sales, excluding depreciation and amortization and Special Items | $ | 4,597 | | | $ | 4,088 | | | $ | 4,252 | | | $ | 5,608 | | | $ | 4,399 | | | $ | 4,088 | | | $ | 4,307 | | | $ | 6,088 | | | $ | 18,545 | | | $ | 18,882 | |
| | | | | | | | | | | | | | | | | | | |
| Selling, general and administrative | $ | 5,425 | | | $ | 5,272 | | | $ | 5,334 | | | $ | 5,280 | | | $ | 5,138 | | | $ | 5,142 | | | $ | 5,186 | | | $ | 5,352 | | | $ | 21,311 | | | $ | 20,818 | |
| Merger-related costs (gain), net | 159 | | | 98 | | | 35 | | | 102 | | | 23 | | | (82) | | | — | | | — | | | 394 | | | (59) | |
| Other Special Items | 87 | | | 36 | | | 359 | | | 14 | | | 12 | | | 37 | | | 86 | | | (50) | | | 496 | | | 85 | |
| | | | | | | | | | | | | | | | | | | |
| Selling, general and administrative, excluding Special Items | $ | 5,179 | | | $ | 5,138 | | | $ | 4,940 | | | $ | 5,164 | | | $ | 5,103 | | | $ | 5,187 | | | $ | 5,100 | | | $ | 5,402 | | | $ | 20,421 | | | $ | 20,792 | |
| | | | | | | | | | | | | | | | | | | | |
| Total bad debt expense and losses from sales of receivables | $ | 260 | | | $ | 264 | | | $ | 274 | | | $ | 265 | | | $ | 303 | | | $ | 280 | | | $ | 322 | | | $ | 349 | | | $ | 1,063 | | | $ | 1,254 | |
| Bad debt and losses from sales of receivables as a percentage of Total revenues | 1.3 | % | | 1.4 | % | | 1.4 | % | | 1.3 | % | | 1.5 | % | | 1.4 | % | | 1.6 | % | | 1.6 | % | | 1.4 | % | | 1.5 | % |
| | | | | | | | | | | | | | | | | | | |
| Cash purchases of property and equipment including capitalized interest | $ | 3,001 | | | $ | 2,789 | | | $ | 2,424 | | | $ | 1,587 | | | $ | 2,627 | | | $ | 2,040 | | | $ | 1,961 | | | $ | 2,212 | | | $ | 9,801 | | | $ | 8,840 | |
| Capitalized interest | 14 | | | 14 | | | 66 | | | 10 | | | 9 | | | 8 | | | 9 | | | 8 | | | 104 | | | 34 | |
| | | | | | | | | | | | | | | | | | | |
| Net cash proceeds from securitization | $ | (29) | | | $ | (31) | | | $ | (33) | | | $ | (21) | | | $ | (29) | | | $ | (30) | | | $ | (29) | | | $ | (27) | | | $ | (114) | | | $ | (115) | |
| | | | | | | | | | | | | | | | | | | |
| Net cash payments for Merger-related costs | $ | 484 | | | $ | 728 | | | $ | 345 | | | $ | 416 | | | $ | 293 | | | $ | 241 | | | $ | 124 | | | $ | 109 | | | $ | 1,973 | | | $ | 767 | |
| | | | | | | | | | | | | | | | | | | |
| | | | | | | | | | | | | | | | | | | |
| | | | | | | | | | | | | | | | | | | |
| | | | | | | | | | | | | | | | | | | |
| | | | | | | | | | | | | | | | | | | |
| | | | | | | | | | | | | | | | | | | |
| | | | | | | | | | | | | | | | | | | |
| | | | | | | | | | | | | | | | | | | |
| | | | | | | | | | | | | | | | | | | |
| | | | | | | | | | | | | | | | | | | |
| | | | | | | | | | | | | | | | | | | |
| | | | | | | | | | | | | | | | | | | |
| | | | | | | | | | | | | | | | | | | |
| | | | | | | | | | | | | | | | | | | |
| | | | | | | | | | | | | | | | | | | |
| | | | | | | | | | | | | | | | | | | |
| | | | | | | | | | | | | | | | | | | |
| | | | | | | | | | | | | | | | | | | |
| | | | | | | | | | | | | | | | | | | |
| | | | | | | | | | | | | | | | | | | |
| | | | | | | | | | | | | | | | | | | |
| | | | | | | | | | | | | | | | | | | |
| | | | | | | | | | | | | | | | | | | |
| | | | | | | | | | | | | | | | | | | |
| | | | | | | | | | | | | | | | | | | |
| | | | | | | | | | | | | | | | | | | |
| | | | | | | | | | | | | | | | | | | |
T-Mobile US, Inc.
Supplementary Operating and Financial Data
(Unaudited)
| | | | | | | | | | | | | | | | | | | | | | | | | | | | | | | | | | | | | | | | | | | | | | | | | | | | | | | | | | | |
| Quarter | | Year Ended December 31, |
| (in millions, except share and per share amounts) | Q1 2023 | | Q2 2023 | | Q3 2023 | | Q4 2023 | | Q1 2024 | | Q2 2024 | | Q3 2024 | | Q4 2024 | | 2023 | | 2024 |
| Stockholder returns | | | | | | | | | | | | | | | | | | | |
| Total repurchases | $ | 4,766 | | | $ | 3,525 | | | $ | 2,675 | | | $ | 2,241 | | | $ | 3,568 | | | $ | 2,277 | | | $ | 644 | | | $ | 4,619 | | | $ | 13,207 | | | $ | 11,108 | |
| Total shares repurchased | 32,963,940 | | | 25,183,838 | | | 19,313,159 | | | 15,464,107 | | | 21,933,790 | | | 13,979,843 | | | 3,179,707 | | | 20,283,582 | | | 92,925,044 | | | 59,376,922 | |
| Average purchase price per share | $ | 144.57 | | | $ | 140.00 | | | $ | 138.48 | | | $ | 144.95 | | | $ | 162.69 | | | $ | 162.85 | | | $ | 202.45 | | | $ | 227.72 | | | $ | 142.13 | | | $ | 187.07 | |
| Total dividends paid | $ | — | | | $ | — | | | $ | — | | | $ | 747 | | | $ | 769 | | | $ | 759 | | | $ | 758 | | | $ | 1,014 | | | $ | 747 | | | $ | 3,300 | |
| Dividends per share | $ | — | | | $ | — | | | $ | — | | | $ | 0.65 | | | $ | 0.65 | | | $ | 0.65 | | | $ | 0.65 | | | $ | 0.88 | | | $ | 0.65 | | | $ | 2.83 | |
| Total stockholder returns | $ | 4,766 | | | $ | 3,525 | | | $ | 2,675 | | | $ | 2,988 | | | $ | 4,337 | | | $ | 3,036 | | | $ | 1,402 | | | $ | 5,633 | | | $ | 13,954 | | | $ | 14,408 | |
| Cumulative total repurchases | $ | 7,766 | | | $ | 11,291 | | | $ | 13,966 | | | $ | 16,207 | | | $ | 19,775 | | | $ | 22,052 | | | $ | 22,696 | | | $ | 27,315 | | | $ | 16,207 | | | $ | 27,315 | |
| Cumulative shares repurchased | 54,325,349 | | | 79,509,187 | | | 98,822,346 | | | 114,286,453 | | | 136,220,243 | | | 150,200,086 | | | 153,379,793 | | | 173,663,375 | | | 114,286,453 | | | 173,663,375 | |
| Cumulative stockholder returns | $ | 7,766 | | | $ | 11,291 | | | $ | 13,966 | | | $ | 16,954 | | | $ | 21,291 | | | $ | 24,327 | | | $ | 25,729 | | | $ | 31,362 | | | $ | 16,954 | | | $ | 31,362 | |
| | | | | | | | | | | | | | | | | | | |
| | | | | | | | | | | | | | | | | | | |
T-Mobile US, Inc.
Reconciliation of Non-GAAP Financial Measures to GAAP Financial Measures
(Unaudited)
This Investor Factbook includes non-GAAP financial measures. The non-GAAP financial measures should be considered in addition to, but not as a substitute for, the information provided in accordance with GAAP. Reconciliations for the non-GAAP financial measures to the most directly comparable GAAP financial measures are provided below. T-Mobile is not able to forecast Net income on a forward-looking basis without unreasonable efforts due to the high variability and difficulty in predicting certain items that affect GAAP net income, including, but not limited to, Income tax expense and Interest expense. Adjusted EBITDA and Core Adjusted EBITDA should not be used to predict Net income, as the difference between either of these measures and Net income is variable.
Adjusted EBITDA and Core Adjusted EBITDA are reconciled to Net income as follows:
| | | | | | | | | | | | | | | | | | | | | | | | | | | | | | | | | | | | | | | | | | | | | | | | | | | | | | | | | | | |
| Quarter | | Year Ended December 31, |
| (in millions, except percentages) | Q1 2023 | | Q2 2023 | | Q3 2023 | | Q4 2023 | | Q1 2024 | | Q2 2024 | | Q3 2024 | | Q4 2024 | | 2023 | | 2024 |
| Net income | $ | 1,940 | | | $ | 2,221 | | | $ | 2,142 | | | $ | 2,014 | | | $ | 2,374 | | | $ | 2,925 | | | $ | 3,059 | | | $ | 2,981 | | | $ | 8,317 | | | $ | 11,339 | |
| Adjustments: | | | | | | | | | | | | | | | | | | | |
| | | | | | | | | | | | | | | | | | | |
| | | | | | | | | | | | | | | | | | | |
| Interest expense, net | 835 | | | 861 | | | 790 | | | 849 | | | 880 | | | 854 | | | 836 | | | 841 | | | 3,335 | | | 3,411 | |
| | | | | | | | | | | | | | | | | | | |
| | | | | | | | | | | | | | | | | | | |
| Other (income) expense, net | (9) | | | (6) | | | (41) | | | (12) | | | (20) | | | 8 | | | (7) | | | (94) | | | (68) | | | (113) | |
| Income tax expense | 631 | | | 717 | | | 705 | | | 629 | | | 764 | | | 843 | | | 908 | | | 858 | | | 2,682 | | | 3,373 | |
| | | | | | | | | | | | | | | | | | | |
| Operating income | 3,397 | | | 3,793 | | | 3,596 | | | 3,480 | | | 3,998 | | | 4,630 | | | 4,796 | | | 4,586 | | | 14,266 | | | 18,010 | |
| Depreciation and amortization | 3,203 | | | 3,110 | | | 3,187 | | | 3,318 | | | 3,371 | | | 3,248 | | | 3,151 | | | 3,149 | | | 12,818 | | | 12,919 | |
| | | | | | | | | | | | | | | | | | | |
Stock-based compensation (1) | 173 | | | 155 | | | 152 | | | 164 | | | 140 | | | 147 | | | 143 | | | 156 | | | 644 | | | 586 | |
Merger-related costs (gain), net (2) | 358 | | | 276 | | | 152 | | | 248 | | | 130 | | | (9) | | | — | | | — | | | 1,034 | | | 121 | |
| | | | | | | | | | | | | | | | | | | |
| | | | | | | | | | | | | | | | | | | |
Legal-related (recoveries) expenses, net (3) | (43) | | | — | | | — | | | 1 | | | — | | | 15 | | | 1 | | | (105) | | | (42) | | | (89) | |
| (Gain) loss on disposal group held for sale | (42) | | | 17 | | | — | | | — | | | — | | | — | | | — | | | — | | | (25) | | | — | |
Other, net (4) | 153 | | | 54 | | | 513 | | | 13 | | | 13 | | | 22 | | | 152 | | | 130 | | | 733 | | | 317 | |
| | | | | | | | | | | | | | | | | | | |
| Adjusted EBITDA | 7,199 | | | 7,405 | | | 7,600 | | | 7,224 | | | 7,652 | | | 8,053 | | | 8,243 | | | 7,916 | | | 29,428 | | | 31,864 | |
| Lease revenues | (147) | | | (69) | | | (53) | | | (43) | | | (35) | | | (26) | | | (21) | | | (11) | | | (312) | | | (93) | |
| Core Adjusted EBITDA | $ | 7,052 | | | $ | 7,336 | | | $ | 7,547 | | | $ | 7,181 | | | $ | 7,617 | | | $ | 8,027 | | | $ | 8,222 | | | $ | 7,905 | | | $ | 29,116 | | | $ | 31,771 | |
| Net income margin (Net income divided by Service revenues) | 12.5 | % | | 14.1 | % | | 13.5 | % | | 12.6 | % | | 14.7 | % | | 17.8 | % | | 18.3 | % | | 17.6 | % | | 13.2 | % | | 17.1 | % |
| Adjusted EBITDA margin (Adjusted EBITDA divided by Service revenues) | 46.3 | % | | 47.1 | % | | 47.8 | % | | 45.0 | % | | 47.5 | % | | 49.0 | % | | 49.3 | % | | 46.8 | % | | 46.5 | % | | 48.1 | % |
| Core Adjusted EBITDA margin (Core Adjusted EBITDA divided by Service revenues) | 45.4 | % | | 46.6 | % | | 47.4 | % | | 44.8 | % | | 47.3 | % | | 48.9 | % | | 49.2 | % | | 46.7 | % | | 46.0 | % | | 48.0 | % |
| | | | | | | | | | | | | | | | | | | |
| | | | | | | | | | | | | | | | | | | |
| | | | | | | | | | | | | | | | | | | |
| | | | | | | | | | | | | | | | | | | |
| | | | | | | | | | | | | | | | | | | |
| | | | | | | | | | | | | | | | | | | |
| | | | | | | | | | | | | | | | | | | |
| | | | | | | | | | | |
| | | | | | | | | | | | | | | | | | | |
| | | | | | | | | | | | | | | | | | | |
| | | | | | | | | | | | | | | | | | | |
| | | | | | | | | | | | | | | | | | | |
| | | | | | | | | | | | | | | | | | | |
| | | | | | | | | | | | | | | | | | | |
| | | | | | | | | | | | | | | | | | | |
| | | | | | | | | | | | | | | | | | | |
| | | | | | | | | | | | | | | | | | | |
| | | | | | | | | | | | | | | | | | | |
| | | | | | | | | | | | | | | | | | | |
| | | | | | | | | | | | | | | | | | | |
| | | | | | | | | | | | | | | | | | | |
| | | | | | | | | | | | | | | | | | | |
| | | | | | | | | | | | | | | | | | | |
| | | | | | | | | | | | | | | | | | | |
| | | | | | | | | | | | | | | | | | | |
| | | | | | | | | | | | | | | | | | | |
| | | | | | | | | | | | | | | | | | | |
| | | | | | | | | | | | | | | | | | | |
| | | | | | | | | | | | | | | | | | | |
| | | | | | | | | | | | | | | | | | | |
| | | | | | | | | | | | | | | | | | | |
| | | | | | | | | | | | | | | | | | | |
| | | | | | | | | | | | | | | | | | | |
| | | | | | | | | | | | | | | | | | | |
| | | | | | | | | | | | | | | | | | | |
| | | | | | | | | | | | | | | | | | | |
| | | | | | | | | | | | | | | | | | | |
| | | | | | | | | | | | | | | | | | | |
| | | | | | | | | | | | | | | | | | | |
(1)Stock-based compensation includes payroll tax impacts and may not agree to stock-based compensation expense on the Consolidated Financial Statements. Additionally, certain stock-based compensation expenses associated with the merger with Sprint Corporation (the “Merger”) have been included in Merger-related costs (gain), net.
(2)Merger-related costs (gain), net, for the year ended December 31, 2024, includes the $100 million gain recognized for the extension fee previously paid by DISH associated with the DISH License Purchase Agreement.
(3)Legal-related (recoveries) expenses, net, consists of the settlement of certain litigation associated with the August 2021 cyberattack and is presented net of insurance recoveries.
(4)Other, net, primarily consists of certain severance, restructuring and other expenses, gains and losses, including severance and related costs associated with the August 2023 workforce reduction, not directly attributable to the Merger which are not reflective of T-Mobile’s core business activities and are, therefore, excluded from Adjusted EBITDA and Core Adjusted EBITDA.
T-Mobile US, Inc.
Reconciliation of Non-GAAP Financial Measures to GAAP Financial Measures (continued)
(Unaudited)
Net debt (excluding tower obligations) to the LTM Net income, LTM Adjusted EBITDA and LTM Core Adjusted EBITDA ratios are calculated as follows:
| | | | | | | | | | | | | | | | | | | | | | | | | | | | | | | | | | | | | | | | | | | | | | | |
| (in millions, except net debt ratios) | Mar 31,
2023 | | Jun 30,
2023 | | Sep 30,
2023 | | Dec 31,
2023 | | Mar 31,
2024 | | Jun 30,
2024 | | Sep 30,
2024 | | Dec 31,
2024 |
| | | | | | | | | | | | | | | |
| Short-term debt | $ | 5,215 | | | $ | 7,731 | | | $ | 3,437 | | | $ | 3,619 | | | $ | 5,356 | | | $ | 5,867 | | | $ | 5,851 | | | $ | 4,068 | |
| | | | | | | | | | | | | | | |
| Short-term financing lease liabilities | 1,180 | | | 1,220 | | | 1,286 | | | 1,260 | | | 1,265 | | | 1,252 | | | 1,252 | | | 1,175 | |
| Long-term debt | 68,035 | | | 68,646 | | | 70,365 | | | 69,903 | | | 71,361 | | | 70,203 | | | 72,522 | | | 72,700 | |
| Long-term debt to affiliates | 1,495 | | | 1,495 | | | 1,496 | | | 1,496 | | | 1,496 | | | 1,496 | | | 1,497 | | | 1,497 | |
| Financing lease liabilities | 1,284 | | | 1,254 | | | 1,273 | | | 1,236 | | | 1,163 | | | 1,133 | | | 1,185 | | | 1,151 | |
| Less: Cash and cash equivalents | (4,540) | | | (6,647) | | | (5,030) | | | (5,135) | | | (6,708) | | | (6,417) | | | (9,754) | | | (5,409) | |
| | | | | | | | | | | | | | | |
| Net debt (excluding tower obligations) | $ | 72,669 | | | $ | 73,699 | | | $ | 72,827 | | | $ | 72,379 | | | $ | 73,933 | | | $ | 73,534 | | | $ | 72,553 | | | $ | 75,182 | |
| Divided by: Last twelve months Net income | $ | 3,817 | | | $ | 6,146 | | | $ | 7,780 | | | $ | 8,317 | | | $ | 8,751 | | | $ | 9,455 | | | $ | 10,372 | | | $ | 11,339 | |
| Net debt (excluding tower obligations) to LTM Net income Ratio | 19.0 | | | 12.0 | | | 9.4 | | | 8.7 | | | 8.4 | | | 7.8 | | | 7.0 | | | 6.6 | |
| | | | | | | | | | | | | | | |
| | | | | | | | | | | | | | | |
| | | | | | | | | | | | | | | |
| | | | | | | | | | | | | | | |
| Divided by: Last twelve months Adjusted EBITDA | $ | 28,070 | | | $ | 28,471 | | | $ | 29,032 | | | $ | 29,428 | | | $ | 29,881 | | | $ | 30,529 | | | $ | 31,172 | | | $ | 31,864 | |
| Net debt (excluding tower obligations) to LTM Adjusted EBITDA Ratio | 2.6 | | | 2.6 | | | 2.5 | | | 2.5 | | | 2.5 | | | 2.4 | | | 2.3 | | | 2.4 | |
| Divided by: Last twelve months Core Adjusted EBITDA | $ | 26,980 | | | $ | 27,698 | | | $ | 28,517 | | | $ | 29,116 | | | $ | 29,681 | | | $ | 30,372 | | | $ | 31,047 | | | $ | 31,771 | |
| Net debt (excluding tower obligations) to LTM Core Adjusted EBITDA Ratio | 2.7 | | | 2.7 | | | 2.6 | | | 2.5 | | | 2.5 | | | 2.4 | | | 2.3 | | | 2.4 | |
| | | | | | | | | | | | | | | |
| | | | | | | | | | | | | | | |
| | | | | | | | | | | | | | | |
| | | | | | | | | | | | | | | |
| | | | | | | | | | | | | | | |
| | | | | | | | | | | | | | | |
| | | | | | | | | | | | | | | |
| | | | | | | | | | | | | | | |
| | | | | | | | | | | | | | | |
| | | | | | | | | | | | | | | |
| | | | | | | | | | | | | | | |
| | | | | | | | | | | | | | | |
| | | | | | | | | | | | | | | |
Adjusted Free Cash Flow is calculated as follows:
| | | | | | | | | | | | | | | | | | | | | | | | | | | | | | | | | | | | | | | | | | | | | | | | | | | | | | | | | | | |
| Quarter | | Year Ended December 31, |
| (in millions, except percentages) | Q1 2023 | | Q2 2023 | | Q3 2023 | | Q4 2023 | | Q1 2024 | | Q2 2024 | | Q3 2024 | | Q4 2024 | | 2023 | | 2024 |
| | | | | | | | | | | | | | | | | | | |
| Net cash provided by operating activities | $ | 4,051 | | | $ | 4,355 | | | $ | 5,294 | | | $ | 4,859 | | | $ | 5,084 | | | $ | 5,521 | | | $ | 6,139 | | | $ | 5,549 | | | $ | 18,559 | | | $ | 22,293 | |
| Cash purchases of property and equipment, including capitalized interest | (3,001) | | | (2,789) | | | (2,424) | | | (1,587) | | | (2,627) | | | (2,040) | | | (1,961) | | | (2,212) | | | (9,801) | | | (8,840) | |
| Proceeds from sales of tower sites | 6 | | | 2 | | | 2 | | | 2 | | | — | | | — | | | — | | | — | | | 12 | | | — | |
| Proceeds related to beneficial interests in securitization transactions | 1,345 | | | 1,309 | | | 1,131 | | | 1,031 | | | 890 | | | 958 | | | 984 | | | 747 | | | 4,816 | | | 3,579 | |
| | | | | | | | | | | | | | | | | | | |
| | | | | | | | | | | | | | | | | | | |
| | | | | | | | | | | | | | | | | | | |
| Adjusted Free Cash Flow | $ | 2,401 | | | $ | 2,877 | | | $ | 4,003 | | | $ | 4,305 | | | $ | 3,347 | | | $ | 4,439 | | | $ | 5,162 | | | $ | 4,084 | | | $ | 13,586 | | | $ | 17,032 | |
Net cash provided by operating activities margin | 26.1 | % | | 27.7 | % | | 33.3 | % | | 30.3 | % | | 31.6 | % | | 33.6 | % | | 36.7 | % | | 32.8 | % | | 29.3 | % | | 33.7 | % |
Adjusted Free Cash Flow margin | 15.4 | % | | 18.3 | % | | 25.2 | % | | 26.8 | % | | 20.8 | % | | 27.0 | % | | 30.9 | % | | 24.1 | % | | 21.5 | % | | 25.7 | % |
| | | | | | | | | | | | | | | | | | | |
| | | | | | | | | | | | | | | | | | | |
| | | | | | | | | | | | | | | | | | | |
| | | | | | | | | | | | | | | | | | | |
| | | | | | | | | | | | | | | | | | | |
| | | | | | | | | | | | | | | | | | | |
| | | | | | | | | | | | | | | | | | | |
| | | | | | | | | | | | | | | | | | | |
| | | | | | | | | | | | | | | | | | | |
| | | | | | | | | | | | | | | | | | | |
| | | | | | | | | | | | | | | | | | | |
| | | | | | | | | | | | | | | | | | | |
| | | | | | | | | | | | | | | | | | | |
| | | | | | | | | | | | | | | | | | | |
| | | | | | | | | | | | | | | | | | | |
| | | | | | | | | | | | | | | | | | | |
| | | | | | | | | | | | | | | | | | | |
| | | | | | | | | | | | | | | | | | | |
| | | | | | | | | | | | | | | | | | | |
| | | | | | | | | | | | | | | | | | | |
| | | | | | | | | | | | | | | | | | | |
| | | | | | | | | | | | | | | | | | | |
| | | | | | | | | | | | | | | | | | | |
| | | | | | | | | | | | | | | | | | | |
| | | | | | | | | | | | | | | | | | | |
| | | | | | | | | | | | | | | | | | | |
| | | | | | | | | | | | | | | | | | | |
| | | | | | | | | | | | | | | | | | | |
| | | | | | | | | | | | | | | | | | | |
| | | | | | | | | | | | | | | | | | | |
T-Mobile US, Inc.
Reconciliation of Non-GAAP Financial Measures to GAAP Financial Measures (continued)
(Unaudited)
The guidance range for Adjusted Free Cash Flow is calculated as follows:
| | | | | | | | | | | |
| FY 2025 |
| (in millions) | Guidance Range |
| | | |
| Net cash provided by operating activities | $ | 26,800 | | | $ | 27,500 | |
| | | |
| Cash purchases of property and equipment, including capitalized interest | (9,500) | | | (9,500) | |
| | | |
| | | |
| | | |
| Adjusted Free Cash Flow | $ | 17,300 | | | $ | 18,000 | |
| | | |
| | | |
| | | |
| | | |
| | | |
| | | |
Definitions of Terms
Operating and financial measures are utilized by T-Mobile’s management to evaluate its operating performance and, in certain cases, its ability to meet liquidity requirements. Although companies in the wireless industry may not define measures in precisely the same way, T-Mobile believes the measures facilitate key operating performance comparisons with other companies in the wireless industry to provide management, investors and analysts with useful information to assess and evaluate past performance and assist in forecasting future performance.
1.Account - A billing account number that generates revenue. Postpaid accounts generally consist of customers that are qualified for postpaid service utilizing phones, High Speed Internet modems, mobile internet devices, including tablets and hotspots, wearables, DIGITS or other connected devices, including SyncUP and IoT, where they generally pay after receiving service.
2.Customer - A SIM number with a unique T-Mobile identifier which is associated with an account that generates revenue. Customers are qualified either for postpaid service utilizing phones, High Speed Internet modems, mobile internet devices, including tablets and hotspots, wearables, DIGITS or other connected devices, including SyncUP and IoT, where they generally pay after receiving service, or prepaid service, where they generally pay in advance of receiving service.
3.Churn - The number of customers whose service was deactivated as a percentage of the average number of customers during the specified period further divided by the number of months in the period. The number of customers whose service was deactivated is presented net of customers that subsequently have their service restored within a certain period of time and excludes customers who received service for less than a certain minimum period of time.
4.Postpaid Average Revenue Per Account (“ARPA”) - Average monthly postpaid service revenue earned per account. Postpaid service revenues for the specified period divided by the average number of postpaid accounts during the period, further divided by the number of months in the period.
Average Revenue Per User (“ARPU”) - Average monthly service revenue earned per customer. Service revenues for the specified period divided by the average number of customers during the period, further divided by the number of months in the period.
Postpaid phone ARPU excludes postpaid other customers and related revenues.
Service revenues - Postpaid, including handset insurance, prepaid, wholesale and other service revenues.
5.Cost of services - Costs directly attributable to providing wireless service through the operation of T-Mobile’s network, including direct switch and cell site costs, such as rent, network access and transport costs, utilities, maintenance, associated labor costs, long distance costs, regulatory program costs, roaming fees paid to other carriers and data content costs.
Cost of equipment sales - Costs of devices and accessories sold to customers and dealers, device costs to fulfill insurance and warranty claims, write-downs of inventory related to shrinkage and obsolescence, and shipping and handling costs.
Selling, general and administrative expenses - Costs not directly attributable to providing wireless service for the operation of sales, customer care and corporate activities. These include all commissions paid to dealers and retail employees for activations and upgrades, labor and facilities costs associated with retail sales force and administrative space, marketing and promotional costs, customer support and billing, bad debt expense and administrative support activities.
6.Net income margin - Net income divided by Service revenues.
7.Adjusted EBITDA and Core Adjusted EBITDA - Adjusted EBITDA represents earnings before Interest expense, net of Interest income, Income tax expense, Depreciation and amortization, stock-based compensation and Special Items. Core Adjusted EBITDA represents Adjusted EBITDA less device lease revenues. Core Adjusted EBITDA and Adjusted EBITDA are non-GAAP financial measures utilized by T-Mobile’s management, including our chief operating decision maker, to monitor the financial performance of our operations and allocate resources of the Company as a whole. T-Mobile historically used Adjusted EBITDA and T-Mobile currently uses Core Adjusted EBITDA internally as a measure to evaluate and compensate its personnel and management for their performance. T-Mobile uses Adjusted EBITDA and Core Adjusted EBITDA as benchmarks to evaluate its operating performance in comparison to competitors. Management believes analysts and investors use Core Adjusted EBITDA and Adjusted EBITDA as supplemental measures to evaluate overall operating performance and to facilitate comparisons with other wireless communications services companies because they are indicative of T-Mobile’s ongoing operating performance and trends by excluding the impact of Interest expense from financing, non-cash depreciation and amortization from capital investments, non-cash stock-based compensation and Special Items. Management believes analysts and investors use Core Adjusted EBITDA because it normalizes for the transition in the company’s device financing strategy, by excluding the impact of device lease revenues from Adjusted EBITDA, to align with the related depreciation expense on leased devices, which is excluded from the definition of Adjusted EBITDA. Core Adjusted EBITDA and Adjusted EBITDA have limitations as analytical tools and should not be considered in isolation or as a substitute for Income from operations, Net income or any other measure of financial performance reported in accordance with U.S. Generally Accepted Accounting Principles (“GAAP”).
8.Special Items - Certain expenses, gains, and losses which are not reflective of our ongoing performance. Special Items include Merger-related costs (gain), net, (Gain) loss on disposal groups held for sale, certain legal-related recoveries and expenses, restructuring costs not directly attributable to the Merger (including severance), and other non-core gains and losses.
9.Adjusted EBITDA margin and Core Adjusted EBITDA margin - Adjusted EBITDA margin is calculated as Adjusted EBITDA divided by Service revenues. Core Adjusted EBITDA margin is calculated as Core Adjusted EBITDA divided by Service revenues. Adjusted EBITDA margin and Core Adjusted EBITDA margin are non-GAAP financial measures utilized by T-Mobile’s management, including our chief operating decision maker, to monitor the financial performance of our operations and allocate resources of the Company as a whole.
10.Net cash provided by operating activities margin - Net cash provided by operating activities margin is calculated as Net cash provided by operating activities divided by Service revenues.
11.Adjusted Free Cash Flow - Net cash provided by operating activities less cash payments for purchases of property and equipment, plus proceeds from sales of tower sites and proceeds related to beneficial interests in securitization transactions. Adjusted Free Cash Flow is utilized by T-Mobile’s management, investors, and analysts of our financial information to evaluate cash available to pay debt, repurchase shares, pay dividends and provide further investment in the business.
12.Adjusted Free Cash Flow margin - Adjusted Free Cash Flow margin is calculated as Adjusted Free Cash Flow divided by Service revenues. Adjusted Free Cash Flow Margin is utilized by T-Mobile’s management, investors, and analysts to evaluate the company’s ability to convert service revenue efficiently into cash available to pay debt, repurchase shares, pay dividends and provide further investment in the business.
13.Net debt - Short-term debt, short-term debt to affiliates, long-term debt (excluding tower obligations), and long-term debt to affiliates, short-term financing lease liabilities and financing lease liabilities, less cash and cash equivalents.
14.Merger-related costs include:
•Integration costs to achieve efficiencies in network, retail, information technology and back office operations, migrate customers to the T-Mobile network and billing systems and the impact of legal matters assumed as part of the Merger;
•Restructuring costs, including severance, store rationalization and network decommissioning; and
•Transaction costs, including legal and professional services related to the completion of the Merger and the acquisitions of affiliates.
Cautionary Statement Regarding Forward-Looking Statements
This communication includes forward-looking statements within the meaning of the Private Securities Litigation Reform Act of 1995. All statements other than statements of historical fact, including information concerning T-Mobile US, Inc.’s future results of operations, are forward-looking statements. These forward-looking statements are generally identified by the words “anticipate,” “believe,” “estimate,” “expect,” “intend,” “may,” “could” or similar expressions. Forward-looking statements are based on current expectations and assumptions, which are subject to risks and uncertainties and may cause actual results to differ materially from the forward-looking statements. Important factors that could affect future results and cause those results to differ materially from those expressed in the forward-looking statements include, among others, the following: competition, industry consolidation and changes in the market for wireless communications services and other forms of connectivity; criminal cyberattacks, disruption, data loss or other security breaches; our inability to timely adopt and effectively deploy network technology developments; our inability to effectively execute our digital transformation and drive customer and employee adoption of emerging technologies; our inability to retain or motivate key personnel, hire qualified personnel or maintain our corporate culture; system failures and business disruptions, allowing for unauthorized use of or interference with our network and other systems; the scarcity and cost of additional wireless spectrum, and regulations relating to spectrum use; the timing and effects of any pending and future acquisition, divestiture, investment, joint venture or merger involving us, including our inability to obtain any required regulatory approval necessary to consummate any such transactions or to achieve the expected benefits of such transactions; adverse economic, political or market conditions in the U.S. and international markets, including changes resulting from increases in inflation or interest rates, supply chain disruptions and impacts of geopolitical instability, such as the Ukraine-Russia and Israel-Hamas wars and further escalations thereof; our inability to successfully deliver new products and services; any disruption or failure of our third parties (including key suppliers) to provide products or services for the operation of our business; sociopolitical volatility and polarization and risks related to environmental, social and governance matters; our substantial level of indebtedness and our inability to service our debt obligations in accordance with their terms; changes in the credit market conditions, credit rating downgrades or an inability to access debt markets; our inability to maintain effective internal control over financial reporting; any changes in regulations or in the regulatory framework under which we operate; laws and regulations relating to the handling of privacy, data protection and artificial intelligence; unfavorable outcomes of and increased costs from existing or future regulatory or legal proceedings; difficulties in protecting our intellectual property rights or if we infringe on the intellectual property rights of others; our offering of regulated financial services products and exposure to a wide variety of state and federal regulations; new or amended tax laws or regulations or administrative interpretations and judicial decisions affecting the scope or application of tax laws or regulations; our wireless licenses, including those controlled through leasing agreements, are subject to renewal and may be revoked; our exclusive forum provision as provided in our Certificate of Incorporation; interests of DT, our controlling stockholder, which may differ from the interests of other stockholders; our current and future stockholder return programs may not be fully utilized, and our share repurchases and dividend payments pursuant thereto may fail to have the desired impact on stockholder value; future sales of our common stock by DT and SoftBank and our inability to attract additional equity financing outside the United States due to foreign ownership limitations by the FCC; and other risks as disclosed in our most recent annual report on Form 10-K, and subsequent Forms 10-Q and other filings with the Securities and Exchange Commission. Given these risks and uncertainties, readers are cautioned not to place undue reliance on such forward-looking statements. We undertake no obligation to revise or publicly release the results of any revision to these forward-looking statements, except as required by law.
About T-Mobile US, Inc.
T-Mobile US, Inc. (NASDAQ: TMUS) is America’s supercharged Un-carrier, delivering an advanced 4G LTE and transformative nationwide 5G network that will offer reliable connectivity for all. T-Mobile’s customers benefit from its unmatched combination of value and quality, unwavering obsession with offering them the best possible service experience and undisputable drive for disruption that creates competition and innovation in wireless and beyond. Based in Bellevue, Wash., T-Mobile provides services through its subsidiaries and operates its flagship brands, T-Mobile, Metro by T-Mobile and Mint Mobile. For more information please visit: http://www.t-mobile.com.
v3.24.4
Cover Page
|
Jan. 29, 2025 |
| Cover [Abstract] |
|
| Document Type |
8-K
|
| Document Period End Date |
Jan. 29, 2025
|
| Entity Registrant Name |
T-MOBILE US, INC.
|
| Entity Incorporation, State or Country Code |
DE
|
| Entity File Number |
1-33409
|
| Entity Tax Identification Number |
20-0836269
|
| Entity Address, Address Line One |
12920 SE 38th Street
|
| Entity Address, City or Town |
Bellevue
|
| Entity Address, State or Province |
WA
|
| Entity Address, Postal Zip Code |
98006-1350
|
| City Area Code |
425
|
| Local Phone Number |
378-4000
|
| Written Communications |
false
|
| Soliciting Material |
false
|
| Pre-commencement Tender Offer |
false
|
| Pre-commencement Issuer Tender Offer |
false
|
| Entity Emerging Growth Company |
false
|
| Entity Central Index Key |
0001283699
|
| Amendment Flag |
false
|
| Common Stock, Par Value $0.00001 Per Share |
|
| Cover [Abstract] |
|
| Title of 12(b) Security |
Common Stock, par value $0.00001 per share
|
| Trading Symbol |
TMUS
|
| Security Exchange Name |
NASDAQ
|
| Entity Listings [Line Items] |
|
| Title of 12(b) Security |
Common Stock, par value $0.00001 per share
|
| Trading Symbol |
TMUS
|
| Security Exchange Name |
NASDAQ
|
| 3.550% Senior Notes Due 2029 |
|
| Cover [Abstract] |
|
| Title of 12(b) Security |
3.550% Senior Notes due 2029
|
| Trading Symbol |
TMUS29
|
| Security Exchange Name |
NASDAQ
|
| Entity Listings [Line Items] |
|
| Title of 12(b) Security |
3.550% Senior Notes due 2029
|
| Trading Symbol |
TMUS29
|
| Security Exchange Name |
NASDAQ
|
| 3.700% Senior Notes Due 2032 |
|
| Cover [Abstract] |
|
| Title of 12(b) Security |
3.700% Senior Notes due 2032
|
| Trading Symbol |
TMUS32
|
| Security Exchange Name |
NASDAQ
|
| Entity Listings [Line Items] |
|
| Title of 12(b) Security |
3.700% Senior Notes due 2032
|
| Trading Symbol |
TMUS32
|
| Security Exchange Name |
NASDAQ
|
| 3.850% Senior Notes Due 2036 |
|
| Cover [Abstract] |
|
| Title of 12(b) Security |
3.850% Senior Notes due 2036
|
| Trading Symbol |
TMUS36
|
| Security Exchange Name |
NASDAQ
|
| Entity Listings [Line Items] |
|
| Title of 12(b) Security |
3.850% Senior Notes due 2036
|
| Trading Symbol |
TMUS36
|
| Security Exchange Name |
NASDAQ
|
| X |
- DefinitionBoolean flag that is true when the XBRL content amends previously-filed or accepted submission.
| Name: |
dei_AmendmentFlag |
| Namespace Prefix: |
dei_ |
| Data Type: |
xbrli:booleanItemType |
| Balance Type: |
na |
| Period Type: |
duration |
|
| X |
- DefinitionFor the EDGAR submission types of Form 8-K: the date of the report, the date of the earliest event reported; for the EDGAR submission types of Form N-1A: the filing date; for all other submission types: the end of the reporting or transition period. The format of the date is YYYY-MM-DD.
| Name: |
dei_DocumentPeriodEndDate |
| Namespace Prefix: |
dei_ |
| Data Type: |
xbrli:dateItemType |
| Balance Type: |
na |
| Period Type: |
duration |
|
| X |
- DefinitionThe type of document being provided (such as 10-K, 10-Q, 485BPOS, etc). The document type is limited to the same value as the supporting SEC submission type, or the word 'Other'.
| Name: |
dei_DocumentType |
| Namespace Prefix: |
dei_ |
| Data Type: |
dei:submissionTypeItemType |
| Balance Type: |
na |
| Period Type: |
duration |
|
| X |
- DefinitionAddress Line 1 such as Attn, Building Name, Street Name
| Name: |
dei_EntityAddressAddressLine1 |
| Namespace Prefix: |
dei_ |
| Data Type: |
xbrli:normalizedStringItemType |
| Balance Type: |
na |
| Period Type: |
duration |
|
| X |
- Definition
+ References
+ Details
| Name: |
dei_EntityAddressCityOrTown |
| Namespace Prefix: |
dei_ |
| Data Type: |
xbrli:normalizedStringItemType |
| Balance Type: |
na |
| Period Type: |
duration |
|
| X |
- DefinitionCode for the postal or zip code
| Name: |
dei_EntityAddressPostalZipCode |
| Namespace Prefix: |
dei_ |
| Data Type: |
xbrli:normalizedStringItemType |
| Balance Type: |
na |
| Period Type: |
duration |
|
| X |
- DefinitionName of the state or province.
| Name: |
dei_EntityAddressStateOrProvince |
| Namespace Prefix: |
dei_ |
| Data Type: |
dei:stateOrProvinceItemType |
| Balance Type: |
na |
| Period Type: |
duration |
|
| X |
- DefinitionA unique 10-digit SEC-issued value to identify entities that have filed disclosures with the SEC. It is commonly abbreviated as CIK. Reference 1: http://www.xbrl.org/2003/role/presentationRef
-Publisher SEC
-Name Exchange Act
-Number 240
-Section 12
-Subsection b-2
| Name: |
dei_EntityCentralIndexKey |
| Namespace Prefix: |
dei_ |
| Data Type: |
dei:centralIndexKeyItemType |
| Balance Type: |
na |
| Period Type: |
duration |
|
| X |
- DefinitionIndicate if registrant meets the emerging growth company criteria. Reference 1: http://www.xbrl.org/2003/role/presentationRef
-Publisher SEC
-Name Exchange Act
-Number 240
-Section 12
-Subsection b-2
| Name: |
dei_EntityEmergingGrowthCompany |
| Namespace Prefix: |
dei_ |
| Data Type: |
xbrli:booleanItemType |
| Balance Type: |
na |
| Period Type: |
duration |
|
| X |
- DefinitionCommission file number. The field allows up to 17 characters. The prefix may contain 1-3 digits, the sequence number may contain 1-8 digits, the optional suffix may contain 1-4 characters, and the fields are separated with a hyphen.
| Name: |
dei_EntityFileNumber |
| Namespace Prefix: |
dei_ |
| Data Type: |
dei:fileNumberItemType |
| Balance Type: |
na |
| Period Type: |
duration |
|
| X |
- DefinitionTwo-character EDGAR code representing the state or country of incorporation.
| Name: |
dei_EntityIncorporationStateCountryCode |
| Namespace Prefix: |
dei_ |
| Data Type: |
dei:edgarStateCountryItemType |
| Balance Type: |
na |
| Period Type: |
duration |
|
| X |
- DefinitionLine items represent financial concepts included in a table. These concepts are used to disclose reportable information associated with domain members defined in one or many axes to the table.
| Name: |
dei_EntityListingsLineItems |
| Namespace Prefix: |
dei_ |
| Data Type: |
xbrli:stringItemType |
| Balance Type: |
na |
| Period Type: |
duration |
|
| X |
- DefinitionThe exact name of the entity filing the report as specified in its charter, which is required by forms filed with the SEC. Reference 1: http://www.xbrl.org/2003/role/presentationRef
-Publisher SEC
-Name Exchange Act
-Number 240
-Section 12
-Subsection b-2
| Name: |
dei_EntityRegistrantName |
| Namespace Prefix: |
dei_ |
| Data Type: |
xbrli:normalizedStringItemType |
| Balance Type: |
na |
| Period Type: |
duration |
|
| X |
- DefinitionThe Tax Identification Number (TIN), also known as an Employer Identification Number (EIN), is a unique 9-digit value assigned by the IRS. Reference 1: http://www.xbrl.org/2003/role/presentationRef
-Publisher SEC
-Name Exchange Act
-Number 240
-Section 12
-Subsection b-2
| Name: |
dei_EntityTaxIdentificationNumber |
| Namespace Prefix: |
dei_ |
| Data Type: |
dei:employerIdItemType |
| Balance Type: |
na |
| Period Type: |
duration |
|
| X |
- DefinitionLocal phone number for entity.
| Name: |
dei_LocalPhoneNumber |
| Namespace Prefix: |
dei_ |
| Data Type: |
xbrli:normalizedStringItemType |
| Balance Type: |
na |
| Period Type: |
duration |
|
| X |
- DefinitionBoolean flag that is true when the Form 8-K filing is intended to satisfy the filing obligation of the registrant as pre-commencement communications pursuant to Rule 13e-4(c) under the Exchange Act. Reference 1: http://www.xbrl.org/2003/role/presentationRef
-Publisher SEC
-Name Exchange Act
-Number 240
-Section 13e
-Subsection 4c
| Name: |
dei_PreCommencementIssuerTenderOffer |
| Namespace Prefix: |
dei_ |
| Data Type: |
xbrli:booleanItemType |
| Balance Type: |
na |
| Period Type: |
duration |
|
| X |
- DefinitionBoolean flag that is true when the Form 8-K filing is intended to satisfy the filing obligation of the registrant as pre-commencement communications pursuant to Rule 14d-2(b) under the Exchange Act. Reference 1: http://www.xbrl.org/2003/role/presentationRef
-Publisher SEC
-Name Exchange Act
-Number 240
-Section 14d
-Subsection 2b
| Name: |
dei_PreCommencementTenderOffer |
| Namespace Prefix: |
dei_ |
| Data Type: |
xbrli:booleanItemType |
| Balance Type: |
na |
| Period Type: |
duration |
|
| X |
- DefinitionTitle of a 12(b) registered security. Reference 1: http://www.xbrl.org/2003/role/presentationRef
-Publisher SEC
-Name Exchange Act
-Number 240
-Section 12
-Subsection b
| Name: |
dei_Security12bTitle |
| Namespace Prefix: |
dei_ |
| Data Type: |
dei:securityTitleItemType |
| Balance Type: |
na |
| Period Type: |
duration |
|
| X |
- DefinitionName of the Exchange on which a security is registered. Reference 1: http://www.xbrl.org/2003/role/presentationRef
-Publisher SEC
-Name Exchange Act
-Number 240
-Section 12
-Subsection d1-1
| Name: |
dei_SecurityExchangeName |
| Namespace Prefix: |
dei_ |
| Data Type: |
dei:edgarExchangeCodeItemType |
| Balance Type: |
na |
| Period Type: |
duration |
|
| X |
- DefinitionBoolean flag that is true when the Form 8-K filing is intended to satisfy the filing obligation of the registrant as soliciting material pursuant to Rule 14a-12 under the Exchange Act. Reference 1: http://www.xbrl.org/2003/role/presentationRef
-Publisher SEC
-Name Exchange Act
-Section 14a
-Number 240
-Subsection 12
| Name: |
dei_SolicitingMaterial |
| Namespace Prefix: |
dei_ |
| Data Type: |
xbrli:booleanItemType |
| Balance Type: |
na |
| Period Type: |
duration |
|
| X |
- DefinitionTrading symbol of an instrument as listed on an exchange.
| Name: |
dei_TradingSymbol |
| Namespace Prefix: |
dei_ |
| Data Type: |
dei:tradingSymbolItemType |
| Balance Type: |
na |
| Period Type: |
duration |
|
| X |
- DefinitionBoolean flag that is true when the Form 8-K filing is intended to satisfy the filing obligation of the registrant as written communications pursuant to Rule 425 under the Securities Act. Reference 1: http://www.xbrl.org/2003/role/presentationRef
-Publisher SEC
-Name Securities Act
-Number 230
-Section 425
| Name: |
dei_WrittenCommunications |
| Namespace Prefix: |
dei_ |
| Data Type: |
xbrli:booleanItemType |
| Balance Type: |
na |
| Period Type: |
duration |
|
| X |
- Details
| Name: |
us-gaap_StatementClassOfStockAxis=tmus_CommonStockParValue0.00001PerShareMember |
| Namespace Prefix: |
|
| Data Type: |
na |
| Balance Type: |
|
| Period Type: |
|
|
| X |
- Details
| Name: |
us-gaap_StatementClassOfStockAxis=tmus_A3.550SeniorNotesDue2029Member |
| Namespace Prefix: |
|
| Data Type: |
na |
| Balance Type: |
|
| Period Type: |
|
|
| X |
- Details
| Name: |
us-gaap_StatementClassOfStockAxis=tmus_A3.700SeniorNotesDue2032Member |
| Namespace Prefix: |
|
| Data Type: |
na |
| Balance Type: |
|
| Period Type: |
|
|
| X |
- Details
| Name: |
us-gaap_StatementClassOfStockAxis=tmus_A3.850SeniorNotesDue2036Member |
| Namespace Prefix: |
|
| Data Type: |
na |
| Balance Type: |
|
| Period Type: |
|
|
T Mobile US (NASDAQ:TMUS)
過去 株価チャート
から 1 2025 まで 2 2025

T Mobile US (NASDAQ:TMUS)
過去 株価チャート
から 2 2024 まで 2 2025

