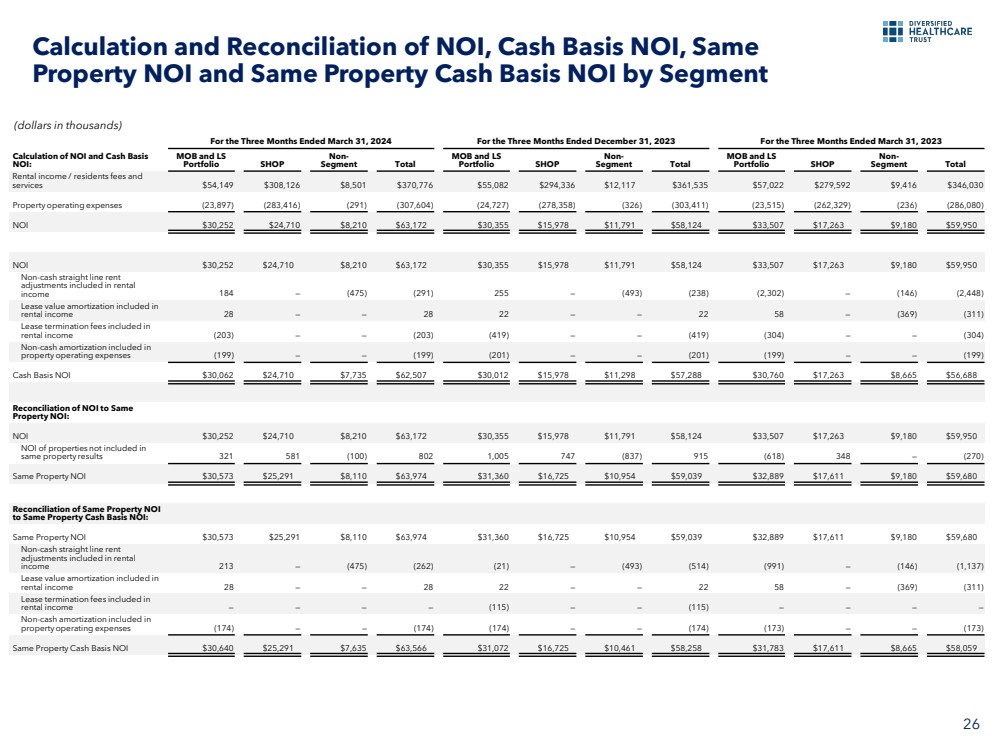
false 0001075415 0001075415 2024-05-21 2024-05-21 0001075415 us-gaap:CommonStockMember 2024-05-21 2024-05-21 0001075415 DHC:SeniorNotesDue2042Member 2024-05-21 2024-05-21 0001075415 DHC:SeniorNotesDue2046Member 2024-05-21 2024-05-21 iso4217:USD xbrli:shares iso4217:USD xbrli:shares


UNITED STATES
SECURITIES AND EXCHANGE COMMISSION

WASHINGTON, DC 20549


FORM 8-K


CURRENT REPORT PURSUANT

TO SECTION 13 OR 15(d) OF THE
SECURITIES EXCHANGE ACT OF 1934


Date of report (Date of earliest event reported): May 21, 2024


DIVERSIFIED HEALTHCARE TRUST

(Exact Name of Registrant as Specified in Its Charter)


Maryland

(State or Other Jurisdiction of Incorporation)


001-15319   04-3445278
(Commission File Number)   (IRS Employer Identification No.)


Two Newton Place, 255 Washington Street, Suite 300, Newton, Massachusetts 02458-1634

(Address of Principal Executive Offices) (Zip Code)


617-796-8350

(Registrant’s Telephone Number, Including Area Code)


Check the appropriate box below if the Form 8-K filing is intended to simultaneously satisfy the filing obligation of the registrant under any of the following provisions:


¨Written communications pursuant to Rule 425 under the Securities Act (17 CFR 230.425)
  
¨Soliciting material pursuant to Rule 14a-12 under the Exchange Act (17 CFR 240.14a-12)
  
¨Pre-commencement communications pursuant to Rule 14d-2(b) under the Exchange Act (17 CFR 240.14d-2(b))
  
¨Pre-commencement communications pursuant to Rule 13e-4(c) under the Exchange Act (17 CFR 240.13e-4(c))


Securities registered pursuant to Section 12(b) of the Act:


Title Of Each Class   Trading Symbol(s)   Name Of Each Exchange On Which Registered
Common Shares of Beneficial Interest   DHC   The Nasdaq Stock Market LLC
5.625% Senior Notes due 2042   DHCNI   The Nasdaq Stock Market LLC
6.25% Senior Notes due 2046   DHCNL   The Nasdaq Stock Market LLC


Indicate by check mark whether the registrant is an emerging growth company as defined in Rule 405 of the Securities Act of 1933 (§230.405 of this chapter) or Rule 12b-2 of the Securities Exchange Act of 1934 (§240.12b-2 of this chapter).


Emerging growth company ¨


If an emerging growth company, indicate by check mark if the registrant has elected not to use the extended transition period for complying with any new or revised financial accounting standards provided pursuant to Section 13(a) of the Exchange Act. ¨


Item 7.01.Regulation FD Disclosure.


On May 21, 2024, Diversified Healthcare Trust posted to its website an investor presentation, a copy of which is attached hereto as Exhibit 99.1.


Item 9.01.Financial Statements and Exhibits.


(d)Exhibits.


99.1   Investor Presentation dated May 21, 2024. (Furnished herewith.)
104   Cover Page Interactive Data File. (Embedded within the Inline XBRL document.)


SIGNATURES


Pursuant to the requirements of the Securities Exchange Act of 1934, the registrant has duly caused this report to be signed on its behalf by the undersigned hereunto duly authorized.


  DIVERSIFIED HEALTHCARE TRUST
   
  By: /s/ Matthew C. Brown
  Name: Matthew C. Brown
  Title: Chief Financial Officer and Treasurer


Date:  May 21, 2024


Exhibit 99.1

GRAPHIC

Investor Presentation Five Star Senior Living Tiffany Court Walnut Creek 1866 San Miguel Drive Walnut Creek, CA Five Star Senior Living The Horizon Club 1208 South Military Trail Deerfield Beach, FL MAY 2024

GRAPHIC

2 2 This presentation contains forward-looking statements within the meaning of the Private Securities Litigation Reform Act of 1995 and other securities laws that are subject to risks and uncertainties. These statements may include words such as “believe”, “expect”, “anticipate”, “intend”, “plan”, “estimate”, “will”, “may” and negatives or derivatives of these or similar expressions. These forward-looking statements include, among others, statements about: the performance of DHC’s SHOP, Medical Office and Life Science Portfolio and Triple Net Leased Senior Living and Wellness Centers segments; demand for medical office and life science properties and senior living communities; expected continuation of SHOP margin expansion and occupancy improvement; DHC’s financial outlook; DHC’s liquidity and financing strategies; expected favorable senior living industry trends and positive pharmaceutical and medical research industry fundamentals; DHC’s ability to capture near and long term value and increase total shareholder returns; DHC’s potential exercise of its option to extend the maturity date of its zero coupon senior secured notes; DHC’s redevelopment, repositioning and construction activities and plans; and DHC’s pending or potential property dispositions. Forward-looking statements reflect DHC's current expectations, are based on judgments and assumptions, are inherently uncertain and are subject to risks, uncertainties and other factors, which could cause DHC's actual results, performance or achievements to differ materially from expected future results, performance or achievements expressed or implied in those forward-looking statements. Some of the risks, uncertainties and other factors that may cause DHC's actual results, performance or achievements to differ materially from those expressed or implied by forward-looking statements include, but are not limited to, the following: the impact of unfavorable market and commercial real estate industry conditions due to possible reduced demand for healthcare related space and senior living communities, high interest rates, wage and commodity price inflation, limited labor availability, increased insurance costs, supply chain disruptions, volatility in the public equity and debt markets, pandemics, geopolitical instability and tensions, economic downturns or a possible recession or changes in real estate utilization, among other things, on DHC and its managers and other operators and tenants; DHC's senior living operators' abilities to successfully and profitably operate the communities they manage for DHC; the continuing impact of changing market practices, including those that arose or intensified during the COVID-19 pandemic, or delayed returns to prior market practices on DHC and its managers and other operators and tenants, such as reduced demand for leased medical office, life science and other space of DHC and residencies at senior living communities, increased operating costs and labor availability constraints; the financial strength of DHC's managers and other operators and tenants; whether the aging U.S. population and increasing life spans of seniors will increase the demand for senior living communities and other medical and healthcare related properties and healthcare services; whether DHC’s tenants will renew or extend their leases or whether DHC will obtain replacement tenants on terms as favorable to DHC as its prior leases; the likelihood that DHC's tenants and residents will pay rent or be negatively impacted by continuing unfavorable market and commercial real estate industry conditions; DHC’s managers’ abilities to increase or maintain rates charged to residents of DHC’s senior living communities and manage operating costs for those communities; DHC's ability to increase or maintain occupancy at its properties on terms desirable to DHC; DHC's ability to increase rents when its leases expire or renew; costs DHC incurs and concessions it grants to lease its properties; risk and uncertainties regarding the costs and timing of development, redevelopment and repositioning activities, including as a result of prolonged high inflation, cost overruns, supply chain challenges, labor shortages, construction delays or inability to obtain necessary permits or volatility in the commercial real estate markets; DHC's ability to manage its capital expenditures and other operating costs effectively and to maintain and enhance its properties and their appeal to tenants and residents; DHC's ability to effectively raise and balance its use of debt and equity capital; DHC’s ability to comply with the financial covenants under its debt agreements; DHC's ability to make required payments on its debt; DHC's ability to maintain sufficient liquidity and otherwise manage leverage; DHC's credit ratings; DHC’s ability to sell properties at prices or returns it targets; DHC's ability to sell additional equity interests in, or contribute additional properties to, its existing joint ventures, or enter into additional real estate joint ventures or to attract co-venturers and benefit from DHC's existing joint ventures or any real estate joint ventures it may enter into; DHC's ability to acquire, develop, redevelop or reposition properties that realize its targeted returns; DHC’s ability to pay distributions to its shareholders and to maintain or increase the amount of such distributions; the ability of RMR to successfully manage DHC; competition in the real estate industry, particularly in those markets in which DHC’s properties are located; government regulations affecting Medicare and Medicaid reimbursement rates and operational requirements; compliance with, and changes to, federal, state and local laws and regulations, accounting rules, tax laws and similar matters; exposure to litigation and regulatory and government proceedings due to the nature of the senior living and other health and wellness related service businesses; actual and potential conflicts of interest with DHC's related parties, including DHC’s Managing Trustees, RMR, ABP Trust, AlerisLife and others affiliated with them; limitations imposed by and DHC’s ability to satisfy complex rules to maintain DHC’s qualification for taxation as a REIT for U.S. federal income tax purposes; acts of terrorism, outbreaks of pandemics or other public health safety events or conditions, war or other hostilities, global climate change or other manmade or natural disasters beyond DHC’s control; and other matters. These risks, uncertainties and other factors are not exhaustive and should be read in conjunction with other cautionary statements that are included in DHC's periodic filings. The information contained in DHC's filings with the SEC, including under the caption “Risk Factors” in its periodic reports, or incorporated therein, identifies important factors that could cause differences from the forward-looking statements in this presentation. DHC's filings with the SEC are available on the SEC's website at www.sec.gov. You should not place undue reliance upon DHC's forward-looking statements. Except as required by law, DHC does not intend to update or change any forward-looking statements as a result of new information, future events or otherwise. Warning Concerning Forward Looking Statements

GRAPHIC

3 3 Table of Contents Page COMPANY OVERVIEW 4 FINANCIAL AND OPERATING HIGHLIGHTS 5 2024 OUTLOOK 7 STRATEGY DRIVING FOR SHAREHOLDER VALUE 8 CAPITAL AND LIQUIDITY OUTLOOK 9 SHOP OVERVIEW 10 MEDICAL OFFICE & LIFE SCIENCE PORTFOLIO OVERVIEW 14 APPENDIX 19

GRAPHIC

4 4 DHC Today - National Healthcare REIT Well Positioned For Growth 371 Healthcare Related Properties 8.5M sf Medical Office & Life Science Space Approximately 27,000 Senior Living Units $7.2B Investment Portfolio 27 Triple Net Senior Living Communities and 10 Wellness Centers DHC is well positioned to drive performance within a favorable industry backdrop to deliver attractive shareholder returns. Long term, positive healthcare sector tailwinds providing a favorable outlook for improved industry fundamentals. An institutional quality portfolio diversified across the healthcare spectrum supporting long term stable growth. Diversified tenant base with nearly 500 tenants in attractive medical office and life science markets. An aging U.S. population coupled with constrained supply provides an opportunity to capitalize on demographic trends. Attractive portfolio with a strong lease coverage profile of 1.56x, embedded NOI growth and a weighted average lease term of 10.8 years.

GRAPHIC

5 5 Industry tailwinds driving continued demand Delivered Strong Results In 2023 - Portfolio Highlights 2023 Full Year Performance Highlights SHOP 28% Triple net leased senior living communities 15% Wellness centers 5% Medical Office 34% Life Science 18% +43% Cash Basis NOI Growth +207% Normalized FFO Growth 370 bps SHOP Occupancy Improvement 11% MOB / Life Science Rent Growth 7.0% SHOP Avg. Monthly Rate Increase 886,000 SF MOB / Life Science Leasing Activity Q4 2023 NOI by Property Type Solid performance of operating fundamentals for both SHOP and MOB / Life Science Portfolio. • Net loss of $293.6 million, or $1.23 per share

GRAPHIC

6 6 Financial and Operating Results Delivered Continued Momentum • Net loss of $86.3 million, or $0.36 per share • Normalized FFO $3.5 million, or $0.01 per share. • Same property cash basis NOI of $63.6 million, an increase of $5.5 million, or 9.5%. • Medical Office and Life Science portfolio executed 100,916 square feet of leasing activity at weighted average rents that were 11.5% higher than prior rents for the same space. • Renewed 129,600 square feet in triple net leased wellness center portfolio at rates that were 7.5% higher than prior rents for the same space. • Notably, SHOP same property cash basis NOI increased 43.6%, reflecting higher revenue attributable to a 200 bps increase in occupancy and a 6.8% increase in average monthly rate. +180 bps year over year SHOP margin improvement +200 bps SHOP occupancy increased year over year to 78.9% 89.8% Medical Office and Life Science same store occupancy First Quarter 2024 Financial Results1 Morningside of Wilmington 2744 S 17th St Wilmington, NC Overture at Plano 500 Coit Road Plano, TX 1. Q1 2024 financial results reflect comparisons to Q1 2023.

GRAPHIC

7 7 2024 Full Year Financial Outlook Shows Continued Positive Momentum Category Guidance Assumptions Low point Mid point High point SHOP NOI1 $120 million $130 million $140 million • Annual growth weighted towards the second half of 2024. SHOP RevPOR Growth 10% 11% 12% • Increases in rate and occupancy levels supported by value-enhancing capital investment and industry fundamentals. SHOP Occupancy Growth 300 bps 350 bps 400 bps SHOP Expense Growth1 6% 6.5% 7% SHOP CapEx MOB/LS and Other CapEx $190 million $50 million $195 million $55 million $200 million $60 million SHOP FY2024 NOI OUTLOOK1 $0 $20 $40 $60 $80 $100 $120 $140 2023 Occupancy Growth RevPOR Growth Expense Growth 2024 Mid Guidance $77M $130M +300 – 400 bps +10 – 12% +6 – 7% +~70% • AlerisLife transitioned to annual rental rate increases, resulting in a 7% average rate increase. • Capital improvements and continued demand tailwinds driving occupancy and rental rate growth. • Located in submarkets with strong aging population demographics. • Transitioning 13 communities to Charter Senior living, providing organic growth with a high performing operator. • Moderate expense growth. Margin Expansion Drivers (Dollars in millions) 1 DHC is not providing a reconciliation of these non-GAAP measures as part of its guidance because certain information required for such reconciliation is not available without unreasonable efforts or at all, such as gains and losses or impairment charges related to the disposition of real estate. There can be no assurance that the Company’s actual results will not be materially higher or lower than these expectations.

GRAPHIC

8 8 2024 Strategic Priorities Designed to Capture Near and Long Term Value Financing Strategies • Targeting real estate secured fixed rate debt financing to enhance liquidity and repay the 2025 debt maturity at accretive rates. o CMBS financing secured by certain medical office and life science properties. o Secured fixed rate debt with select SHOP communities. CapEX • Continued investment into communities, focusing on high ROI projects. o Major renovations stabilized ROI Target: 15%+ o Light refresh stabilized ROI Target: 8 – 10% • 23 light refresh projects underway totaling $25.7 million, with estimated Q4 2024 delivery. SHOP • Ongoing performance review of communities and operators to ensure optimal performance. • Transitioned operations of 13 communities to Charter Senior Living. We estimate these communities when stabilized will contribute to a 60 bps margin improvement and a 70 bps occupancy improvement to the SHOP portfolio. Select Property Sales • Marketing the sale of eight non-core, underperforming properties, collectively 30% occupied, with expected proceeds of $50 million – $60 million. • Evaluate broader portfolio strategies across SHOP and Medical Office / Life Science portfolio for potential dispositions or strategic alternatives. Focused on the execution of strategic priorities and increasing total shareholder returns.

GRAPHIC

9 9 Opportunities to Further Strengthen Capital and Liquidity $1.4 $502.0 $941.4 $0.3 $500.3 $1,107.4 $0 $200 $400 $600 $800 $1,000 $1,200 2024 2025 2026 2027 2028 2029 & After Unsecured Fixed Rate Debt Secured Fixed Rate Debt Debt Maturity Schedule (As of March 31, 2024) (dollars in millions) • As of March 31, 2024, $208 million of cash and cash equivalents and restricted cash. • Fully unencumbered SHOP portfolio of 232 communities. • Ongoing capital recycling program targeting the sale of non-core assets. • In compliance with all debt covenants and no significant debt maturities until June 2025. • Debt has a weighted average term to maturity of 5.9 years. • Targeting CMBS financing secured by certain medical office and life science properties. • Expect to issue fixed rate debt secured by select SHOP communities to repay $500 million of notes maturing in June 2025. o Repayment of June 2025 unsecured senior notes will be accretive and will improve weighted average remaining debt term. • Proceeds generated from the sale of properties across the portfolio. 2024 Financing Strategy Financing priorities in 2024 focus on enhancing liquidity while continuing to invest in properties that deliver strong returns. Liquidity Profile Today 1 1. DHC has a one-time option to extend the maturity date of these senior secured notes by one year, to January 15, 2027, subject to satisfaction of certain conditions and payment of an extension fee.

GRAPHIC

1010 SHOP Segment Five Star Senior Living Heritage Place at Boerne 120 Crosspoint Drive Boerne, TX

GRAPHIC

1111 SHOP Overview 232 SHOP communities span across 31 states. Portfolio largely located in areas where the growth rate of 75+ population is higher than NIC designated metro population growth rate. Good mix of properties strategically located in areas where home values are outpacing the national median home value. Majority of the portfolio is in locations above the national median income. Q1 2024 SHOP Absorption Primary and Secondary NIC1 4.3% DHC Top 101 5.7% DHC Primary/Secondary 4.5% • Higher absorption levels, signaling strong supply/demand fundamentals, supporting SHOP occupancy and rate outlook. • SHOP is well positioned in favorable markets with demographics growth, strong absorption, and affordability. • SHOP Primary/Secondary RevPOR increased 6.0% Y/Y2, outpacing respective NIC markets (+4.7% Y/Y). SHOP Assets Strategically Positioned in Key Primary and Secondary Markets 1. NIC and SHOP data as of March 31, 2024. 2. RevPOR growth excludes SNFs, consistent with presentation of NIC data. Qualified Population by Net Worth Bubble sizes reflect DHC’s unit count in identified market. Bubble color reflects households within the submarkets where our communities are located, with an age of 75+ and a median net worth of $400,000. - $400,000 +

GRAPHIC

1212 (4.2%) 3.8% 7.0% 11.0% 4.0% 3.3% 0.7% 6.5% 71.1% 74.4% 78.1% 81.6% 50% 55% 60% 65% 70% 75% 80% 85% -5% 0% 5% 10% 15% 2021 2022 2023 2024 Midpoint Guidance Occupancy RevPOR / ExpPOR Growth RevPOR Y/Y ∆% ExpPOR Y/Y ∆% Occupancy % SHOP Margin Expansion is Expected to Continue RevPOR growth continues to outpace ExpPOR growth in 2024. SHOP RevPOR vs ExpPOR and Occupancy Growth Trends l 1. Occupancy is for the year end. 1

GRAPHIC

1313 Expect Favorable Industry Trends to Support Operational Momentum • Senior living demographic of 80+ population is projected to grow at a 4.2% CAGR over the next 10 years while inventory growth is expected to remain depressed at 1.2%.1,2 • Rent growth remains elevated with top primary / secondary markets increasing up to 10% annually. Age 80+ Population Growth1 Inventory Growth3 - 5.0 10.0 15.0 20.0 25.0 Millions 0.0% 1.0% 2.0% 3.0% 4.0% 5.0% 6.0% 7.0% Senior Housing Indepentant Lving Assisted Living Long term senior population growth is significantly outpacing inventory growth supporting higher occupancy levels and rent growth. 1. Source: Population estimates from the Organization for Economic Co-Operation and Development (OECD) as of March 2024. 2. Source: National Investment Center for Seniors Housing & Care (NIC) as of March 2024. 3. Source: NIC Map © Data Service in primary and secondary markets as of Q1 2024. For more information on the NIC MAP © Data Service, please visit www.nic.org/NIC-map.

GRAPHIC

1414 Medical Office & Life Science Segment Torrey Pines 3030 Science Park San Diego, CA

GRAPHIC

1515 High quality Medical Office and Life Science portfolio. • Nearly 500 individual tenants including industry-leading institutions. • Diverse tenant industry mix including healthcare systems, medical and dental offices, pharmaceutical and biotech research, health insurance and other related industries. • Geographically diversified medical office portfolio across the US. • Life Science properties concentrated in leading pharmaceutical and medical research markets. • Proven ability to proactively manage leasing, routinely achieving double digit rent growth. Medical Office Concentrated in Geographically Diverse Markets2 Medical Office & Life Science Portfolio Overview San Francisco Bay Area 30% San Diego/ Los Angeles 26% Boston 29% Raleigh/ Durham 3% Other Markets 12% NOI Breakdown2 Life Science Concentrated in Leading Markets2 1. By annualized rental income as of March 31, 2024. 2. By Medical Office & Life Science segment NOI as of March 31, 2024. Life Science 32% Patient Care 53% Other 15% Hospitals/ Clinics 29% Life Sciences 25% Medical/ Dentist Office 22% Other 24% Tenant Industry1 Milwaukee 20% St. Louis, 9% Minneapolis/St. Paul, 8% Honolulu, 7% Albuquerque, 5% Boston, 4% Austin, 4% San Antonio, 4% VA Beach/Hampton Road, 4% Other 35%

GRAPHIC

1616 $461.6B $715.5B 2020 2021 2022 2023 2024 2025 2026 2027 2028 2029 2030 Conventional Drugs Biologics & Biosmilars Positive Pharmaceutical and Medical Research Industry Fundamentals • Industry tailwinds driving continued demand. • Increasing demand for healthcare services, driven by an aging population and advancements in medical technology is bolstering the need for medical facilities. • Migration towards outpatient care further drives the demand for medical office space. • A rising chronic disease prevalence, as well as the aging population, are driving demand for pharmaceuticals. • Increasing demand for R&D coupled with rapid pace of innovation in biotechnology and pharmaceuticals is fueling demand for laboratory and research facilities. DHC’s focus on diversified medical office and life science real estate positions DHC to capitalize on these opportunities and deliver value to investors. Growing U.S. Drug Demand ($ in billions) Sources: Statista, CMS and Grandview Research. $4.1B $6.8B 2020 2021 2022 2023 2024 2025 2026 2027 2028 2029 2030 Growing U.S. Outpatient Expenditures ($ in billions)

GRAPHIC

1717 Triple Net Leased Senior Living & Wellness Centers Segment The Stratford 2460 Glebe Street Carmel, IN

GRAPHIC

1818 Stable performance outlook with embedded growth through a mix of contracted rental increases and percent rent. Triple Net Leased Senior Living & Wellness Centers Portfolio Overview 2,062 Units 100% Occupancy 7.4 year WALT1 1.49x Rent Coverage 812,000 SF 100% Occupancy 15.9 year WALT1 1.67x Rent Coverage - - - 11.8% - 1.4% 86.8% 2024 2025 2026 2027 2028 2029 2030 and Thereafter NNN Lease Expiration Schedule DHC’s triple net leased senior living communities and wellness centers consistently deliver strong performance with best-in-class operators. NNN Senior Living NNN Wellness LifeTime Fitness 971 State Hwy 121 Allen, TX 1. Weighted average lease term by annualized rental income.

GRAPHIC

The picture can't be displayed. 19 Appendix

GRAPHIC

2020 1. Certifications as of December 31, 2023. Our business strategy for our Medical Office and Life Science portfolio incorporates a focus on sustainable approaches to operating these properties in a manner that benefits our shareholders, tenants and the communities in which we are located. We seek to operate those properties in ways that improve the economic performance of their operations, while simultaneously ensuring tenant comfort and safety and managing energy and water consumption, as well as greenhouse gas emissions. Our strategy for our SHOP is to work with our operators to prioritize the safety and well-being of our residents, while also seeking to maximize the operating efficiencies of our senior living communities. Impact Through Action Green Building Certifications1 Dedicated Leadership 2020 23 PROPERTIES 2,233,052 SF GREEN LEASE LEADERS — GOLD PARTNER 33 PROPERTIES 3,362,012 SF 16 PROPERTIES 1,268,841 SF DHC’s Board of Trustees DHC’s board demonstrates a strong dedication to environmental and sustainable initiatives and embodies a rich diversity in professional experience and national background, leveraging a wide rage of expertise and perspective. Learn more about the Sustainability programs of our manager, The RMR Group, through its most recently published Sustainability Report. Female Lead Independent 67% Independent 33% Underrepresented Communities 50% Women DHC’s Commitment to Sustainability and Good Governance

GRAPHIC

2121 Private Clients DHC is managed by The RMR Group LLC, an alternative asset manager More than $41 Billion in AUM RMR Platform More than $5 Billion in Annual Revenues Over 20,000 Employees Approximately 2,100 Properties National Multi-Sector Investment Platform Industrial Residential Senior Living Medical Office Life Science Hotels Retail Office RMR Clients Perpetual Capital Private Real Estate Funds Private Capital 21

GRAPHIC

National Vertically Integrated Real Estate Operating Platform is a Differentiator and Competitive Advantage RMR Shared Services Accounting Marketing Human Resources Investor Relations Property Management Development Finance Legal Information Technology Project Management Tax Portfolio Management Transactions Asset Management 2222

GRAPHIC

2323 Management aligned with shareholder interests RMR base management fee tied to DHC share price performance • Consists of an annual fee based on 50 bps of the lower of: (1) DHC’s historical cost of real estate, or (2) DHC’s total market capitalization. • There is no incentive for RMR to complete any transaction that could reduce DHC’s share price. RMR incentive fees are contingent on total shareholder return outperformance • Equal to 12% of value generated by DHC in excess of the benchmark index total returns (MSCI U.S. REIT/Health Care REIT Index)1 per share over a three year period, subject to a cap (1.5% of equity market cap). • Outperformance must be positive: it can’t be the best of the worst. • Shareholders keep 100% of benchmark returns and at least 88% of returns in excess of the benchmark. Other fees • Property management fee: consists of an annual fee based on 3.0% of rents collected at DHC’s medical office, life science and active adult properties. • Construction supervision fee based on project costs. Alignment of Interests If DHC’s total market cap exceeds historical cost of real estate, base fee is paid on assets. If DHC’s total market cap is less than historical cost of real estate, base fee fluctuates with share price. Incentive fee structure keeps RMR focused on increasing total shareholder return. Members of RMR senior management are holders of DHC shares, some subject to long term lock up agreements. DHC shareholders have visibility into publicly traded RMR. DHC benefits from RMR’s national footprint and economies of scale of a $41 billionplatform.

GRAPHIC

RMR’s Demonstrated Commitment to Sustainability with Measurable Progress 1. Certifications as of December 31, 2023. • Zero Emissions Promise by 2050 for all RMR managed properties. – Reduce GHG emissions 50% by 2029 from 2019 baseline. – Achieve net zero emissions from operations by 2050. • Water and Waste Goals compared to 2019 baseline. – Reduce water consumption 25% by 2030. – Achieve a 50% diversion rate from landfills by 2025. • Clean Energy Transition – Goal set to Install 75MW of solar capacity across 160 properties over 5 years. 86 ENERGY STAR® Certified Properties 73 BOMA 360 Recognized Properties 87 LEED Certified Properties Impact Through Action Enabling Client Efficiency • Real-time Monitoring (RTM) program – Identifying savings opportunities using high-resolution building automation data and cross-disciplinary team collaboration. • Partnership with Clockworks Analytics® – Creating a network of RTM and notification that delivers performance, comfort and maintenance improvement. • Dedicated sustainability team – Team consists of 11 professionals, predominantly engineering professionals. Green Building Certifications1 2023 Environmental Progress Highlights 28.4% Reduction in Energy Consumption from 2019 Baseline 35.8% Reduction from GHG Emissions from 2019 Baseline 23.3% Reduction in Water Consumption from 2019 Baseline 48.5% Waste Diverted to Recycling in 2023 2424

GRAPHIC

2525 (dollars in thousands) For the Three Months Ended 3/31/2024 12/31/2023 9/30/2023 6/30/2023 3/31/2023 Calculation of NOI and Cash Basis NOI: Revenues: Rental income $ 62,650 $ 67,199 $ 63,390 $ 61,373 $ 66,438 Residents fees and services 308,126 294,336 293,134 284,846 279,592 Total revenues 370,776 361,535 356,524 346,219 346,030 Property operating expenses (307,604) (303,411) (298,432) (286,228) (286,080) NOI 63,172 58,124 58,092 59,991 59,950 Non-cash straight line rent adjustments included in rental income (291) (238) (676) 4,457 (2,448) Lease value amortization included in rental income 28 22 22 25 (311) Lease termination fees included in rental income (203) (419) (413) (2,183) (304) Non-cash amortization included in property operating expenses (199) (201) (199) (199) (199) Cash Basis NOI $ 62,507 $ 57,288 $ 56,826 $ 62,091 $ 56,688 Reconciliation of Net Loss to NOI and Cash Basis NOI: Net loss $ (86,259) $ (102,564) $ (65,779) $ (72,571) $ (52,658) Equity in net (earnings) losses of investees (1,898) 22,598 145 (2,929) 647 Income tax expense (benefit) 187 66 189 221 (31) Loss on modification or early extinguishment of debt — 1,393 — — 1,075 Interest expense 57,576 48,853 47,758 47,384 47,780 Interest and other income (2,237) (2,964) (3,243) (5,134) (4,195) Gains on equity investments, net — — — — (8,126) Losses (gains) on sale of properties 5,874 28 — — (1,233) Impairment of assets 12,142 — 1,156 11,299 5,925 Acquisition and certain other transaction related costs 86 1,041 3,676 6,043 93 General and administrative 7,568 6,020 6,954 7,284 5,873 Depreciation and amortization 70,133 83,653 67,236 68,394 64,800 NOI 63,172 58,124 58,092 59,991 59,950 Non-cash straight line rent adjustments included in rental income (291) (238) (676) 4,457 (2,448) Lease value amortization included in rental income 28 22 22 25 (311) Lease termination fees included in rental income (203) (419) (413) (2,183) (304) Non-cash amortization included in property operating expenses (199) (201) (199) (199) (199) Cash Basis NOI $ 62,507 $ 57,288 $ 56,826 $ 62,091 $ 56,688 Calculation and Reconciliation of NOI and Cash Basis NOI

GRAPHIC

2626 For the Three Months Ended March 31, 2024 For the Three Months Ended December 31, 2023 For the Three Months Ended March 31, 2023 Calculation of NOI and Cash Basis NOI: MOB and LS Portfolio SHOP Non-Segment Total MOB and LS Portfolio SHOP Non-Segment Total MOB and LS Portfolio SHOP Non-Segment Total Rental income / residents fees and services $54,149 $308,126 $8,501 $370,776 $55,082 $294,336 $12,117 $361,535 $57,022 $279,592 $9,416 $346,030 Property operating expenses (23,897) (283,416) (291) (307,604) (24,727) (278,358) (326) (303,411) (23,515) (262,329) (236) (286,080) NOI $30,252 $24,710 $8,210 $63,172 $30,355 $15,978 $11,791 $58,124 $33,507 $17,263 $9,180 $59,950 NOI $30,252 $24,710 $8,210 $63,172 $30,355 $15,978 $11,791 $58,124 $33,507 $17,263 $9,180 $59,950 Non-cash straight line rent adjustments included in rental income 184 — (475) (291) 255 — (493) (238) (2,302) — (146) (2,448) Lease value amortization included in rental income 28 — — 28 22 — — 22 58 — (369) (311) Lease termination fees included in rental income (203) — — (203) (419) — — (419) (304) — — (304) Non-cash amortization included in property operating expenses (199) — — (199) (201) — — (201) (199) — — (199) Cash Basis NOI $30,062 $24,710 $7,735 $62,507 $30,012 $15,978 $11,298 $57,288 $30,760 $17,263 $8,665 $56,688 Reconciliation of NOI to Same Property NOI: NOI $30,252 $24,710 $8,210 $63,172 $30,355 $15,978 $11,791 $58,124 $33,507 $17,263 $9,180 $59,950 NOI of properties not included in same property results 321 581 (100) 802 1,005 747 (837) 915 (618) 348 — (270) Same Property NOI $30,573 $25,291 $8,110 $63,974 $31,360 $16,725 $10,954 $59,039 $32,889 $17,611 $9,180 $59,680 Reconciliation of Same Property NOI to Same Property Cash Basis NOI: Same Property NOI $30,573 $25,291 $8,110 $63,974 $31,360 $16,725 $10,954 $59,039 $32,889 $17,611 $9,180 $59,680 Non-cash straight line rent adjustments included in rental income 213 — (475) (262) (21) — (493) (514) (991) — (146) (1,137) Lease value amortization included in rental income 28 — — 28 22 — — 22 58 — (369) (311) Lease termination fees included in rental income — — — — (115) — — (115) — — — — Non-cash amortization included in property operating expenses (174) — — (174) (174) — — (174) (173) — — (173) Same Property Cash Basis NOI $30,640 $25,291 $7,635 $63,566 $31,072 $16,725 $10,461 $58,258 $31,783 $17,611 $8,665 $58,059 (dollars in thousands) Calculation and Reconciliation of NOI, Cash Basis NOI, Same Property NOI and Same Property Cash Basis NOI by Segment

GRAPHIC

2727 (amounts in thousands, except per share data) For the Three Months Ended 3/31/2024 12/31/2023 9/30/2023 6/30/2023 3/31/2023 Net loss $ (86,259) $ (102,564) $ (65,779) $ (72,571) $ (52,658) Depreciation and amortization 70,133 83,653 67,236 68,394 64,800 Loss (gain) on sale of properties 5,874 28 — — (1,233) Impairment of assets 12,142 — 1,156 11,299 5,925 Gains on equity securities, net — — — — (8,126) Equity in net (earnings) losses of investees (1,898) 22,598 145 (2,929) 647 Share of FFO from unconsolidated joint ventures 2,014 1,930 1,912 1,897 1,999 Adjustments to reflect DHC's share of FFO attributable to an equity method investment 1 582 — — — (1,586) FFO 2,588 5,645 4,670 6,090 9,768 Business management incentive fees 849 — — — — Acquisition and certain other transaction related costs 86 1,041 3,676 6,043 93 Loss on modification or early extinguishment of debt — 1,393 — — 1,075 Adjustments to reflect DHC's share of Normalized FFO attributable to an equity method investment 1 — — — — 1,576 Normalized FFO $ 3,523 $ 8,079 $ 8,346 $ 12,133 $ 12,512 Weighted average common shares outstanding (basic and diluted) 239,193 239,175 238,892 238,682 238,589 Per Common Share Data (basic and diluted): Net loss $ (0.36) $ (0.43) $ (0.28) $ (0.30) $ (0.22) FFO $ 0.01 $ 0.02 $ 0.02 $ 0.03 $ 0.04 Normalized FFO $ 0.01 $ 0.03 $ 0.03 $ 0.05 $ 0.05 1. For the three months ended March 31, 2024, represents DHC's 34% pro rata share of AlerisLife's FFO and Normalized FFO for DHC's period of ownership from February 16, 2024 to March 31, 2024. Calculation and Reconciliation of FFO and Normalized FFO

GRAPHIC

2828 NOI, Cash Basis NOI, Same Property NOI and Same Property Cash Basis NOI The calculations of NOI, Cash Basis NOI, same property NOI and same property cash basis NOI exclude certain components of net income (loss) in order to provide results that are more closely related to our property level results of operations. We calculate NOI, Cash Basis NOI, same property NOI and same property cash basis NOI as shown in this appendix. We define NOI as income from our real estate less our property operating expenses. NOI excludes amortization of capitalized tenant improvement costs and leasing commissions that we record as depreciation and amortization. We define Cash Basis NOI as NOI excluding non-cash straight line rent adjustments, lease value amortization, lease termination fees, if any, and non-cash amortization included in property operating expenses. We calculate same property NOI and same property cash basis NOI in the same manner that we calculate the corresponding NOI and cash basis NOI amounts, except that we only include same properties in calculating same property NOI and same property cash basis NOI. We use NOI, Cash Basis NOI, same property NOI and same property cash basis NOI to evaluate individual and company wide property level performance. Other real estate companies and REITs may calculate NOI, Cash Basis NOI, same property NOI and same property cash basis NOI differently than we do. FFO and Normalized FFO We calculate FFO and Normalized FFO as shown in this appendix. FFO is calculated on the basis defined by Nareit, which is net income (loss), calculated in accordance with GAAP, excluding any gain or loss on sale of properties, equity in net earnings or losses of investees, loss on impairment of real estate assets, gains or losses on equity securities, net, if any, and including adjustments to reflect our proportionate share of FFO of our equity method investment in AlerisLife and our proportionate share of FFO from our unconsolidated joint ventures, plus real estate depreciation and amortization of consolidated properties and, as well as certain other adjustments currently not applicable to us. In calculating Normalized FFO, we adjust for the items shown in this appendix. FFO and Normalized FFO are among the factors considered by our Board of Trustees when determining the amount of distributions to our shareholders. Other factors include, but are not limited to, requirements to maintain our qualification for taxation as a REIT, limitations in the agreements governing our debt, the availability to us of debt and equity capital, our expectation of our future capital requirements and operating performance, and our expected needs for and availability of cash to pay our obligations. Other real estate companies and REITs may calculate FFO and Normalized FFO differently than we do. Non-GAAP Financial Measures We present certain "non-GAAP financial measures" within the meaning of applicable rules of the SEC, including net operating income, or NOI, Cash Basis NOI, same property NOI, same property Cash Basis NOI, funds from operations, or FFO, and normalized funds from operations, or Normalized FFO. These measures do not represent cash generated by operating activities in accordance with GAAP and should not be considered alternatives to net income (loss) as indicators of our operating performance or as measures of our liquidity. These measures should be considered in conjunction with net income (loss) as presented in our consolidated statements of income (loss). We consider these non-GAAP measures to be appropriate supplemental measures of operating performance for a REIT, along with net income (loss). We believe these measures provide useful information to investors because by excluding the effects of certain historical amounts, such as depreciation and amortization, they may facilitate a comparison of our operating performance between periods and with other REITs and, in the case of NOI, Cash Basis NOI, same property NOI and same property Cash Basis NOI, reflecting only those income and expense items that are generated and incurred at the property level may help both investors and management to understand the operations of our properties. DEFINITIONS OF CERTAIN NON-GAAP FINANCIAL MEASURES

v3.24.1.1.u2
Cover
May 21, 2024
Document Information [Line Items]  
Document Type 8-K
Amendment Flag false
Document Period End Date May 21, 2024
Entity File Number 001-15319
Entity Registrant Name DIVERSIFIED HEALTHCARE TRUST
Entity Central Index Key 0001075415
Entity Tax Identification Number 04-3445278
Entity Incorporation, State or Country Code MD
Entity Address, Address Line One Two Newton Place
Entity Address, Address Line Two 255 Washington Street
Entity Address, Address Line Three Suite 300
Entity Address, City or Town Newton
Entity Address, State or Province MA
Entity Address, Postal Zip Code 02458-1634
City Area Code 617
Local Phone Number 796-8350
Written Communications false
Soliciting Material false
Pre-commencement Tender Offer false
Pre-commencement Issuer Tender Offer false
Entity Emerging Growth Company false
Common Stock [Member]  
Document Information [Line Items]  
Title of 12(b) Security Common Shares of Beneficial Interest
Trading Symbol DHC
Security Exchange Name NASDAQ
Senior Notes Due 2042  
Document Information [Line Items]  
Title of 12(b) Security 5.625% Senior Notes due 2042
Trading Symbol DHCNI
Security Exchange Name NASDAQ
Senior Notes Due 2046  
Document Information [Line Items]  
Title of 12(b) Security 6.25% Senior Notes due 2046
Trading Symbol DHCNL
Security Exchange Name NASDAQ

Diversified Healthcare (NASDAQ:DHCNL)
過去 株価チャート
から 5 2024 まで 6 2024 Diversified Healthcareのチャートをもっと見るにはこちらをクリック
Diversified Healthcare (NASDAQ:DHCNL)
過去 株価チャート
から 6 2023 まで 6 2024 Diversified Healthcareのチャートをもっと見るにはこちらをクリック