UNITED STATES
SECURITIES AND EXCHANGE COMMISSION
Washington,
D.C. 20549
FORM N-CSR
CERTIFIED SHAREHOLDER REPORT OF REGISTERED MANAGEMENT
INVESTMENT COMPANIES
Investment Company Act file number 811-22853
| |
ArrowMark
Financial Corp. |
|
| |
(Exact name of registrant as specified in charter) |
|
| |
100 Fillmore Street, Suite 325 |
|
| |
Denver,
CO 80206 |
|
| |
(Address of principal executive offices) (Zip code) |
|
| |
Sanjai
Bhonsle, CEO |
|
| |
ArrowMark Asset Management, LLC |
|
| |
100 Fillmore Street, Suite 325 |
|
| |
Denver, CO 80206 |
|
| |
(Name and address of agent for service) |
|
Copies of Communications to:
John P. Falco, Esq.
Pepper Hamilton LLP
3000 Two Logan Square / Eighteenth and Arch Streets
Philadelphia, PA 19103-2799
(215) 981-4659
Registrant's telephone number, including area code:
(303) 398-2929
Date of fiscal year end: December 31
Date of reporting period: December
31, 2023
Item 1. Reports to Stockholders.
| |
(a) |
Include a copy of the report transmitted to stockholders pursuant to Rule 30e-1 under the Act (17 CFR 270.30e-1). |
| |
|
The Report to Shareholders is attached
herewith. |

| |
Annual Report |
| |
December 31, 2023 |
| NASDAQ | BANX |
|
ir.arrowmarkfinancialcorp.com |
ARROWMARK FINANCIAL
CORP.
Table of Contents
Page
| Letter to Shareholders |
|
1 |
| About ArrowMark Financial Corp |
|
3 |
| Consolidated Schedule of Investments |
|
7 |
| Consolidated Statement of Assets and
Liabilities |
|
11 |
| Consolidated Statement of Operations |
|
12 |
| Consolidated Statements of Changes
In Net Assets |
|
13 |
| Consolidated Statement of Cash Flows |
|
14 |
| Consolidated Financial Highlights |
|
15 |
| Notes to Consolidated Financial Statements |
|
17 |
| Auditor’s Report |
|
33 |
| Dividends and Distributions |
|
34 |
| Senior Securities |
|
36 |
| Share Price Data |
|
37 |
| Fee Table and Example |
|
38 |
| Tax Information |
|
40 |
| Additional Information |
|
40 |
| Results of Stockholders Meeting |
|
41 |
| Board Approval of the Management Agreement |
|
42 |
| Management |
|
45 |
| Shareholder Information |
|
49 |
| Privacy Notice |
|
57 |
This page intentionally
left blank.
Letter
To Shareholders
February 29,
2024
Dear
Shareholders,
We
are pleased to provide you with the enclosed annual report for ArrowMark Financial Corp. (“ArrowMark Financial” or the “Fund”)
for the twelve months ended December 31, 2023.
2023
endured one of the most aggressive interest rates increases in recent history, despite this, the economy remained resilient as evidenced
by continued consumer spending, a healthy job market, and lower than predicted default rates. During the fourth quarter, the U.S. Federal
Reserve’s (the “Fed”) remarks signaled lower interest rates in 2024, sparking a stock rally that rippled across markets.
The policy shift was followed by steeper declines in inflation during the quarter, which dropped from 3.7% to 3.4%.
Regulatory
capital relief, which comprises 87% of the portfolio, primary market activity accelerated into year end and contributed to record full-year
issuance of $21-$23bn. Adding to the typical fourth quarter surge of activity, the Fed’s guidance on the treatment of various regulatory
capital relief transaction structures drove a resurgence of activity from U.S. banks.
In
2023, the Fund’s investments in regulatory capital relief securities, showed resilience and outperformance resulting from strong
income generation from floating-rate security coupons and the strength of underlying collateral fundamentals. Income generation from these
securities, which increased over the course of the year given the rise in base rates, more than offset modest mark-to-market price volatility.
During the 12-month period, the Fund returned 16.93% (net), outperforming the Bloomberg High Yield, Bloomberg Aggregate, and Morningstar
Leveraged Loan which returned 13.44%, 5.53%, and 13.08%, respectively. As a reminder, regulatory capital is the amount of capital a bank
or financial institution needs to satisfy the capital requirements as determined by banking regulators.
While
our investment strategy continues to include the entire banking sector, from community banks to global money center banks, the Fund’s
new investments of $30.3 million were made in regulatory capital relief securities as we believe the asset class offered a more attractive
coupon and risk-return profile vis-à-vis community banking investments.
The
Fund’s Net Asset Value (“NAV”) increased year-over-year by 2.69% from $20.79 to $21.43. The Fund reports its NAV monthly,
which we believe helps stabilize the stock price during periods of market volatility and creates pricing alignment with the underlying
investments.
During
2023, the Fund declared distributions totaling $2.20 per share, including a long term capital gain distribution of $0.42 per share in
October and a special distribution of $0.10 per share in the fourth quarter. In September, the Fund announced that its Board of Directors
increased the quarterly cash distribution to $0.45 per share from $0.39 per share, an increase of $0.06 from the previous recurring quarterly
rate. Since the fourth quarter 2019, the Fund has over-earned its stated distribution rate.
Forward
Outlook
We expect the Fund’s opportunity
set to persist as banks place an even greater focus on capital management due to a variety of factors, including increased loan loss provisions,
interest rate-driven mark-to-market declines of banks’ significant fixed income holdings, increased capital buffers, and regulatory
changes. Security return profiles remain attractive on an absolute basis and represent a material premium to traditional markets. In addition,
the combination of collateral quality, collateral diversification, and the alignment created with issuing banks through security structures,
contribute to the asset class’s historical track record of outperformance during periods of rising rates and/or general market turbulence.
| 1 |
ArrowMark Financial Corp. | Annual Report |
On
the following pages, we provide additional details on our 2023 financial and operational results. We appreciate your continued support
of ArrowMark Financial. We look forward to updating you on our progress throughout the year.
Sincerely,
Sanjai
Bhonsle
Chairman &
CEO
| Annual Report | ArrowMark Financial Corp. |
2 |
About Arrow Mark Financial Corp.
MANAGEMENT
DISCUSSION AND SUMMARY
This
report provides information on the financial performance for ArrowMark Financial Corp. ("ArrowMark Financial" or the "Fund")
for the year ended December 31, 2023. ArrowMark Financial (BANX) is a closed-end management investment company listed on the NASDAQ
Global Select Market.
As
of year-end, the Fund had total assets of $203.7 million, consisting of total portfolio investments of $196.6 million and a cash and other
assets of $7.1 million. Based on total investments of $196.6 million, the portfolio investments consisted of 5.3% term loans, 5.6% structured
debt securities, 87.6% Regulatory Capital Securities in the form of credit-linked notes (“Regulatory Capital Securities”),
1.2% trust preferred and preferred securities, and 0.3% of short- term or cash and cash equivalent investments.
For
the full year ended December 31, 2023, ArrowMark Financial had total investment income of $28.7 million and net operating expenses
of $10.0 million. This resulted in net investment income of $18.7 million or $2.63 per share based on average shares outstanding during
the year. The Fund had realized and unrealized gains of $1.6 million or $0.21 per share. During the year, ArrowMark Financial declared
distributions of $2.20 per share.
The
fourth quarter 2023 declared dividend of $0.55 per share was comprised of a regular cash dividend of $0.45 per share and a special cash
dividend of $0.10 per share. For the full year ended December 31, 2023, an investment in ArrowMark Financial resulted in a total
annual return of 20.89%, including the reinvestment of distributions based on the closing market prices of ArrowMark Financial’s
stock.
Net
Asset Value at year end, December 31, 2023, was $21.43 per share, reflecting an increase of $0.64 per share from the prior year end.
This was compromised of net investment income of $2.63 per share, offset by net realized and unrealized gains of $0.21 per share, and
cash distributions declared to shareholders of $2.20 per share, including the Fund’s fourth quarter special cash distribution of
$0.10 per share.
PORTFOLIO
DISCUSSION
THE
PORTFOLIO
ArrowMark
Financial makes long-term, non-control investments in banking-related assets including securities issued by community banks and global
financial institutions for regulatory capital relief transactions which are issued by both U.S. and foreign issuers to assist a bank in
managing its regulatory capital requirements.
Over
the course of 2023,ArrowMark Financial purchased securities totaling $30.3 million, which consisted of eight transactions. During the
same period, the Fund executed redemptions totaling $34.5 million. This was comprised of call (redemption) notices of $17.0 million in
five transactions and received paydowns and partial paydowns of approximately $17.5 million.
| 3 |
ArrowMark Financial Corp. | Annual Report |
As
of December 31, 2023, the Company had a total investment portfolio of $196.6 million representing 96.5% of total assets and consisting
of:
| Investment Type |
|
Amount1 |
|
| Term Loans |
|
|
5.3 |
% |
| Structured Debt Security |
|
|
5.6 |
% |
| Regulatory
Capital Relief Securities2 |
|
|
87.6 |
% |
| Trust Preferred and Preferred Securities |
|
|
1.2 |
% |
| Money Market (Short Term Investment) |
|
|
0.3 |
% |
| 1 |
Based on Total Investments of $196.6 million |
| 2 |
Regulatory Capital Securities in this category are in the form of Credit-Linked
Notes |
PORTFOLIO
CONSIDERATIONS
ArrowMark
Financial is steadfast in its pursuit of constructing a portfolio that we believe is able to generate long-term, risk-adjusted returns,
primarily for income distribution. The Fund seeks to achieve this goal while maintaining high credit quality standards.
Among
the factors that affect the timing of capital deployment are: (i) a bank’s timeframe to obtain internal approvals to issue,
(ii) the protracted nature of mergers and acquisitions, and (iii) an approval process from government regulators which must
provide final regulatory approvals for a bank merger, capital issuances and capital redemptions (refinancing).
The
Fund continues to source community banking debt, trust preferred and preferred securities and, Regulatory Capital Securities in the form
of credit-linked notes. Regulatory Capital Securities are issued by both U.S. and foreign bank issuers to manage their regulatory capital
requirements. All of the purchase transactions in 2023 were Regulatory Capital Securities. The second largest type of investment is Structured
Debt Securities, solely consisting of Community Funding 2018, LLC. Community Funding 2018, LLC is comprised of community bank debt and
trust preferred or preferred securities.
INVESTMENT
PROCESS
ArrowMark
Financial’s investment committee is focused on delivering on what we believe to be attractive risk-adjusted returns through in-depth
fundamental research with an emphasis on risk mitigation for capital preservation. The Fund conducts due diligence on pending investments
in several phases, and the assessment of downside risk is integrated into each phase of the process. Sourcing investments and access to
new investment opportunities are a result of the Fund’s dedication to building and maintaining strong banking relationships, as
well as working with intermediaries in the banking sector. The investment team provides in-depth analysis of security structure and underlying
collateral to determine the financial integrity of the institution. The investment process includes both quantitative and qualitative
reviews with investment decisions made by an experienced investment team that has worked together across the spectrum of banking-related
assets for over 13 years. The investment team places a high value on its relationships with the underlying bank’s management teams,
and conducts regular in person or teleconference reviews, with particular focus on the bank’s local markets. The Fund’s disciplined
approach to due diligence and its commitment to credit quality reflects its long-term view of creating shareholder value. The Fund believes
shareholders have high regard for this dedicated and disciplined approach to portfolio construction. We expect the investment process
will serve to provide predictable cash flows and stable to growing net asset value over an extended timeframe.
| Annual Report | ArrowMark Financial Corp. |
4 |
Under
the ArrowMark Partners (“ArrowMark Partners”) platform, the breadth and the scope of personnel working on the investment portfolio
and in the operations of ArrowMark Financial have been significantly expanded. We believe that the depth of expertise in banking-related
assets across ArrowMark Partners platform offers a significant and intangible advantage to the Fund and to our shareholders.
Investment
advice is provided to the Fund by ArrowMark Asset Management, LLC.
INVESTMENT
FOCUS
ArrowMark
Financial typically pursues a range of investments in a bank’s capital structure. A bank’s capital structure includes senior
and subordinated debt, Regulatory Capital Securities, preferred stock, and common equity. Bank holding company senior debt can also be
absorbed at the bank level and become part of the bank’s capital structure. As a lender, a bank makes senior and mezzanine loans
to borrowers. A bank’s common equity and the bank’s loan loss reserves offer a capital buffer to absorb credit losses from
bank loans. Under normal circumstances, ArrowMark Financial would only incur a credit loss if the bank’s common equity plus loan
loss reserves were exhausted.
Conclusion
We
believe that ArrowMark Financial offers investors a unique opportunity to participate in a Fund focused on investing in banking-related
assets.
The
Fund will continue to work diligently for our shareholders by prudently managing the investment portfolio with the capital entrusted to
us. ArrowMark Financial’s investment team works meticulously to deploy capital with a long-term focus on risk-adjusted returns,
capital preservation, and credit quality. The Fund is focused on executing a disciplined and rigorous investment approach in the best
interest of our stakeholders. ArrowMark Financial believes these investment considerations are paramount in its stewardship, and in the
value that we offer to our shareholders.
ArrowMark
Financial continued its solid progress in 2023. The Fund was able to take advantage of its liquidity, available through its credit line,
to invest assets at what we view as attractive prices throughout the year.
We
believe the strength of the management team and the Fund’s ability to nimbly respond to market opportunities will position the Fund
for growth, as well as offer an attractive yield and risk-adjusted returns.
Our
mission is to create long-term value for our shareholders. We appreciate the recognition and the support over the past year, and we wish
you a safe year ahead.
| 5 |
ArrowMark Financial Corp. | Annual Report |
Performance
Data
Comparison of
change in value of $10,000 investment in ArrowMark Financial Corp. vs. Bloomberg U.S. Aggregate Total Return Value Index and Bloomberg
U.S. Corporate High Yield 2% Issuer Capped Index (Unaudited)
| Average Annual Total Returns |
| |
|
1 Year |
|
|
5 Year |
|
|
10 Year |
|
| ArrowMark
Financial Corp.1 |
|
|
20.89 |
% |
|
|
8.11 |
% |
|
|
5.75 |
% |
| Bloomberg U.S. Aggregate Total Return Value Index |
|
|
5.53 |
% |
|
|
1.10 |
% |
|
|
1.81 |
% |
| Bloomberg U.S. Corporate High Yield 2% Issuer Capped Index |
|
|
13.44 |
% |
|
|
5.35 |
% |
|
|
4.59 |
% |
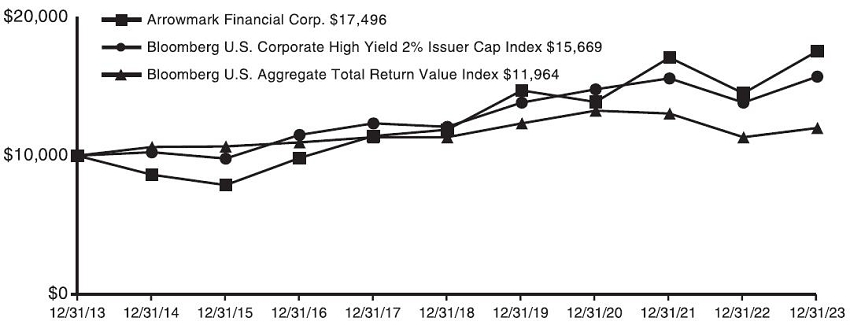
1
Based on market price.
The
performance data quoted represents past performance and does not guarantee future results. The investment return and principal
value of an investment in the Fund will fluctuate so that an investor’s shares, when redeemed, may be worth more or less than their
original cost. The graph and table do not reflect the deduction of taxes that a shareholder would pay on Fund distributions or redemption
of Fund shares. Current performance may be lower or higher. Performance data current to the most recent month-end may be obtained by calling
Investor Relations at (212) 468-5441.
The
Fund intends to evaluate performance as compared to that of the Bloomberg U.S. Aggregate Total Return Value Index and the Bloomberg U.S.
Corporate High Yield 2% Issuer Capped Index. The Bloomberg U.S. Aggregate Total Return Value Index is a broad-based flagship benchmark
that measures the investment grade, U.S. dollar-denominated, fixed-rate taxable bond market and the Bloomberg U.S. Corporate High Yield
2% Issuer Capped Index is an index that measures the performance of high yield, non-investment grade corporate bonds, with a maximum allocation
of 2% to any one issuer. References to an index over a specific period are provided for your information only and should not be considered
indicative of an investment in ArrowMark Financial Corp. Note that an index is unmanaged and the information contained herein does not
reflect any investment management fees or transaction costs. It is impossible to invest directly in an index.
The
Fund’s investment objectives, strategies, risks, charges, and expenses must be considered carefully before investing. The prospectus
contains this and other important information about the Fund and may be obtained by calling 877-737-6374. Please read carefully before
investing.
ArrowMark Financial Corp.
Consolidated Schedule of Investments
As of
December 31, 2023
| Company(1) |
|
Investment |
|
#
of
Shares/Par
Amount(2) |
|
|
Fair Value(3) |
|
| Term
Loans – 6.9% |
|
|
|
|
|
|
|
|
|
|
| Banking
– 6.9% |
|
|
|
|
|
|
|
|
|
|
| Equity Bancshares
Inc. |
|
Subordinated Term Loan, 7.00%,
6/30/2030 |
|
$ |
5,000,000 |
|
|
$ |
4,812,500 |
|
| F.N.B.C. of
La Grange, Inc. |
|
Subordinated Term Loan, 6.38%,
1/01/2030(4) |
|
$ |
700,000 |
|
|
|
588,000 |
|
| TransPecos Financial
Corp. |
|
Senior Term Loan, 9.00%, 10/01/2028 |
|
$ |
4,000,000 |
|
|
|
3,660,000 |
|
| Tulsa
Valley Bancshares |
|
Subordinated
Term Loan, 6.38%, 12/31/2028(4) |
|
$ |
1,700,000 |
|
|
|
1,428,000 |
|
| |
|
Total Term
Loans
(Cost $11,400,000) |
|
|
|
|
|
|
10,488,500 |
|
| Structured
Debt Security – 7.2% |
|
|
|
|
|
|
|
|
|
|
| Banking
– 7.2% |
|
|
|
|
|
|
|
|
|
|
| Community
Funding 2018, LLC. |
|
Preferred Shares
(Estimated effective yield 9.34%), 144A(5)(6) |
|
$ |
14,860,000 |
|
|
|
10,959,250 |
|
| |
|
Total Structured
Debt Securities
(Cost $14,691,250) |
|
|
|
|
|
|
10,959,250 |
|
| |
|
| Regulatory Capital
Relief Securities – 113.1% |
|
| Banking
– 113.1% |
|
|
|
|
|
|
|
|
| Absolute |
|
Credit
Linked Note, 17.85%, 10/10/2027(7)(8)** |
|
$ |
3,857,979 |
|
|
|
3,896,559 |
|
| Algonquin |
|
Credit
Linked Note, 14.84%, 11/20/2025(8)+ |
|
$ |
3,000,000 |
|
|
|
2,864,787 |
|
| Algonquin |
|
Credit
Linked Note, 15.57%, 11/01/2028(8)+ |
|
$ |
2,000,000 |
|
|
|
1,995,405 |
|
| Algonquin |
|
Guarantee Linked Note, 13.84%,
05/01/2027(8)+ |
|
$ |
5,000,000 |
|
|
|
4,785,058 |
|
| AMF
Ireland Finance - Series 1 |
|
Profit Participating Note, 18.85%,
06/30/2031(7)(8) |
|
$ |
7,000,000 |
|
|
|
7,035,700 |
|
| AMF
Ireland Finance - Series 2 |
|
Profit Participating Note, 12.60%,
7/31/2029(7)(8) |
|
$ |
4,900,000 |
|
|
|
4,900,000 |
|
| Auto
ABS Synthetic French Loans |
|
Credit Linked Note, 16.43%,
12/15/2030(7)(9)** |
|
€ |
3,000,000 |
|
|
|
3,320,130 |
|
| Boa
Vista |
|
Credit
Linked Note, 12.97%, 09/07/2026(9)** |
|
€ |
2,000,000 |
|
|
|
2,207,900 |
|
| Castelo |
|
Credit
Linked Note, 12.96%, 05/05/2025(9)** |
|
€ |
1,952,649 |
|
|
|
2,115,964 |
|
| Cedar |
|
Credit
Linked Note, 14.47%, 12/15/2027(9)** |
|
€ |
2,854,860 |
|
|
|
3,157,925 |
|
| Cedar |
|
Credit
Linked Note, 14.97%, 03/30/2030(7)(9)** |
|
€ |
4,300,000 |
|
|
|
4,806,322 |
|
| CHAKRA |
|
Credit
Linked Note, 14.76%, 06/26/2027(7)(8)+ |
|
$ |
4,000,000 |
|
|
|
3,920,000 |
|
| Colonnade |
|
Credit
Linked Note, 17.45%, 04/30/2028(7)(8) |
|
$ |
5,910,579 |
|
|
|
5,827,646 |
|
| Colonnade |
|
Credit
Linked Note, 17.18%, 11/30/2029(7)(8) |
|
$ |
7,140,002 |
|
|
|
6,866,892 |
|
| Colonnade |
|
Credit
Linked Note, 17.99%, 12/15/2029(7)(8) |
|
$ |
5,000,000 |
|
|
|
5,025,000 |
|
| Colonnade |
|
Credit
Linked Note, 17.32%, 04/30/2030(7)(8) |
|
$ |
9,769,570 |
|
|
|
9,297,172 |
|
| CRAFT |
|
Credit
Linked Note, 17.10%, 12/15/2027(7)(8) |
|
$ |
5,000,000 |
|
|
|
5,257,500 |
|
| CRAFT |
|
Credit
Linked Note, 15.66%, 04/30/2028(10) |
|
$ |
2,008,783 |
|
|
|
2,154,420 |
|
| CRAFT |
|
Credit
Linked Note, 14.14%, 02/21/2031(10) |
|
$ |
3,200,000 |
|
|
|
3,152,000 |
|
| Elvetia |
|
Credit
Linked Note, 9.71%, 10/20/2029(11)+ |
|
CHF |
2,000,000 |
|
|
|
2,351,941 |
|
| Elvetia |
|
Credit
Linked Note, 10.96%, 10/20/2030(11)+ |
|
CHF |
2,933,972 |
|
|
|
3,394,798 |
|
| Elvetia |
|
Credit
Linked Note, 11.21%, 1/20/2031(7)(11)+ |
|
CHF |
2,550,000 |
|
|
|
3,071,946 |
|
| FCT
Colisee |
|
Credit
Linked Note, 14.47%, 01/09/2024(12)+ |
|
€ |
1,694,352 |
|
|
|
1,878,429 |
|
| FCT
Colisee |
|
Credit
Linked Note, 11.98%, 07/07/2034(9)+ |
|
€ |
2,131,686 |
|
|
|
2,355,863 |
|
| FCT
Opale |
|
Credit
Linked Note, 12.50%, 05/05/2030(8)+ |
|
$ |
4,000,000 |
|
|
|
3,990,000 |
|
| Future
Ready Chakra |
|
Credit
Linked Note, 13.35%, 12/15/2030(8)+ |
|
$ |
5,000,000 |
|
|
|
4,694,750 |
|
| 7 |
ArrowMark Financial Corp. | Annual Report |
See Notes to financial statements. |
| Company(1) |
|
Investment |
|
#
of
Shares/Par
Amount(2) |
|
|
Fair
Value(3) |
|
| Regulatory
Capital Relief Securities (continued) |
| Banking
(continued) |
|
|
|
|
|
|
|
|
|
|
| LOFT |
|
Credit
Linked Note, 12.85%, 02/28/2030(7)(8) |
|
$ |
2,870,000 |
|
|
$ |
2,984,800 |
|
| LOFT |
|
Credit
Linked Note, 24.35%, 02/28/2030(7)(8) |
|
$ |
6,910,000 |
|
|
|
7,255,500 |
|
| Mespil |
|
Credit
Linked Note, 15.34%, 12/08/2031(8)** |
|
$ |
4,743,607 |
|
|
|
4,615,055 |
|
| Muskoka |
|
Credit
Linked Note, 15.59%, 11/01/2027(8)+ |
|
$ |
2,650,000 |
|
|
|
2,624,814 |
|
| Nansa |
|
Credit
Linked Note, 13.37%, 03/01/2026(9)** |
|
€ |
7,001,194 |
|
|
|
7,671,001 |
|
| Nightingale
LF |
|
Credit
Linked Note, 15.94%,
04/01/2028(7)(13)** |
|
£ |
2,000,000 |
|
|
|
2,519,983 |
|
| Premium
Green PLC |
|
5
Year Secured Amortizing Floating Rate Note, 16.40%, 12/20/2024(8)+ |
|
$ |
1,176,576 |
|
|
|
1,180,988 |
|
| Premium
Green PLC |
|
5
Year Secured Amortizing Floating Rate Note, 13.57%, 06/29/2026(12)** |
|
€ |
1,642,266 |
|
|
|
1,796,300 |
|
| Premium
Green PLC |
|
5
Year Secured Amortizing Floating Rate Note, 13.47%, 11/10/2026(12)+ |
|
€ |
1,832,564 |
|
|
|
1,905,316 |
|
| Pymes
Magdalena |
|
Credit
Linked Note, 11.92%, 03/20/2024(9)** |
|
€ |
2,040,456 |
|
|
|
2,192,531 |
|
| Resonance |
|
Credit
Linked Note, 11.98%, 10/05/2028(9)** |
|
€ |
2,080,764 |
|
|
|
2,260,881 |
|
| Salisbury |
|
Credit
Linked Note, 15.69%, 06/16/2027(13)+ |
|
£ |
5,079,745 |
|
|
|
6,230,989 |
|
| Salisbury |
|
Credit
Linked Note, 14.94%, 03/20/2028(13)+ |
|
£ |
672,232 |
|
|
|
834,612 |
|
| Salisbury |
|
Credit
Linked Note, 15.19%, 04/17/2028(7)(13)+ |
|
£ |
4,127,719 |
|
|
|
5,276,918 |
|
| Salisbury |
|
Credit
Linked Note, 17.29%, 04/17/2028(13)+ |
|
£ |
1,934,883 |
|
|
|
2,402,282 |
|
| Start |
|
Credit
Linked Note, 15.35%, 06/16/2025(8)+ |
|
$ |
4,383,840 |
|
|
|
4,022,174 |
|
| Terra |
|
Credit
Linked Note, 13.25%, 09/25/2029(8)** |
|
$ |
10,000,000 |
|
|
|
9,624,000 |
|
| Waterloo |
|
Credit
Linked Note, 15.10%, 03/21/2026(7)(8)** |
|
$ |
2,700,000 |
|
|
|
2,700,000 |
|
| |
|
Total
Regulatory Capital Relief Securities
(Cost $174,310,203) |
|
|
|
|
|
|
172,422,251 |
|
| |
|
|
|
|
|
|
|
|
|
|
| Trust
Preferred and Preferred Securities – 1.6% |
|
|
|
|
|
|
|
|
|
|
| Banking
– 1.6% |
|
|
|
|
|
|
|
|
|
|
| |
|
|
|
|
|
|
|
|
|
|
| Fidelity
Federal Bancorp |
|
Fixed
Rate Cumulative Perpetual Preferred Stock, Series A - 9%(14) |
|
$ |
2,789,000 |
|
|
|
2,231,200 |
|
| Fidelity
Federal Bancorp |
|
Fixed
Rate Cumulative Perpetual Preferred Stock, Series B - 9%(14) |
|
|
|
|
|
|
|
|
| |
|
|
|
$ |
200,000 |
|
|
|
160,000 |
|
| |
|
Total
Trust Preferred and Preferred Securities (Cost $3,004,203) |
|
|
|
|
|
|
2,391,200 |
|
| |
|
|
|
|
|
|
|
|
|
|
| |
|
Total
Long-Term Investments
(Cost $203,405,656) |
|
|
|
|
|
|
196,261,201 |
|
| Money
Market Fund – 0.2% |
|
|
|
|
|
|
|
|
|
|
| Morgan
Stanley Institutional Liquidity Funds - Treasury Portfolio |
|
Institutional
Share Class - Money Market Mutual Fund (MISXX) 5.21% |
|
|
363,895 |
|
|
|
363,895 |
|
| |
|
Total
Money Market Fund
(Cost $363,895) |
|
|
|
|
|
|
363,895 |
|
| |
|
Total
Investments
(Cost
$203,769,551)(15)(16) — 129.0% |
|
|
|
|
|
|
196,625,096 |
|
| |
|
Other
assets and liabilities, net — (29.0)%(17) |
|
|
|
|
|
|
(44,189,545 |
) |
| |
|
Total
Net Assets — 100.0%* |
|
|
|
|
|
$ |
152,435,551 |
|
| (1) |
Except with respect to
Community Funding 2018, LLC ("CF 2018"), we do not "control" and are not an "affiliate" of any
of our investments, as such terms are defined under the Investment Company Act of 1940 (the "1940 Act"). We may be deemed
to control and be an affiliate of CF 2018 because we are the sole member of such entity. |
| (2) |
Par Value in USD, GBP,
EUR or CHF. |
| (3) |
Fair Value is determined
in good faith in accordance with the Company’s valuation policy and is reviewed and accepted by the Company’s Board of Directors. |
| See Notes to financial statements. |
Annual Report | ArrowMark
Financial Corp. |
8 |
| (4) |
The estimated effective
yield including structuring fees paid annually through maturity of 2030 and 2028, respectively, is 9.60%. |
| (5) |
Securities are exempt
from registration under Rule 144A of the Securities Act of 1933. |
| (6) |
The preferred shares
are considered an equity position. Equity investments are entitled to recurring distributions which are generally equal to the remaining
cash flow of the payments made by the underlying company’s securities less contractual payments to debt holders and company expenses.
The estimated effective yield indicated is based upon a current projection of the amount and timing of these recurring distributions and
the estimated amount of repayment of principal upon termination. Such projections are periodically reviewed and adjusted as needed. The
estimated effective yield may ultimately not be realized. |
| (7) |
Investments determined
using significant unobservable inputs (Level 3). The value of such securities is $ 83,962,068 or 55.08% of net assets. |
| (8) |
Floating rate note: SOFR
+ minimum of 7.16% |
| (9) |
Floating rate note: 3M
EURIBOR (Floored at 0%) + minimum of 8.00% |
| (10) |
Floating rate note: 3M
SOFR + minimum of 8.76% |
| (11) |
Floating rate note: 3M
CHF LIBOR + minimum 8.00% |
| (12) |
Floating rate note: 3M
EURIBOR + minimum 9.50% |
| (13) |
Floating rate note: SONIA
+ minimum 9.75% |
| (14) |
Non-income producing
securities |
| (15) |
As of December 31,
2023, the tax cost basis of investment securities was $203,769,551. The gross unrealized appreciation over tax cost was $2,780,453 and
gross unrealized depreciation under tax cost was $9,924,908. Net unrealized depreciation of tax cost under value was $7,144,455. |
| (16) |
Cost values reflect accretion
of original issue discount or market discount, and amortization of premium. |
| (17) |
Includes $45,000,000
in bank loans from Texas Capital Bank. |
| * |
Substantially all of the Company’s
portfolio assets are pledged in respect of the credit facility (see note 7 to financial statements). |
| ** |
Held in Marshall Holdings
Limited II. |
| + |
Held in Marshall Holdings
Limited III. |
Forward
foreign currency contracts outstanding as of December 31, 2023 were as follows:
| Currency
Purchased |
|
Currency
Sold |
|
Expiration |
|
Counterparty |
|
Unrealized
Appreciation
(Depreciation) |
|
| USD |
|
9,122,766 |
|
CHF |
|
7,670,422 |
|
01/31/24 |
|
NWG |
|
$ |
(29,360 |
) |
| USD |
|
37,711,089 |
|
EUR |
|
33,912,850 |
|
01/31/24 |
|
NWG |
|
|
221,916 |
|
| USD |
|
18,464,023 |
|
GBP |
|
14,436,296 |
|
01/31/24 |
|
NWG |
|
|
59,341 |
|
| GBP |
|
300,000 |
|
USD |
|
383,700 |
|
01/31/24 |
|
NWG |
|
|
(1,233 |
) |
| |
|
|
|
|
|
|
|
|
|
|
|
$ |
250,664
|
|
| ABS |
|
Asset-Backed
Security |
| CHF |
|
Swiss Franc |
| EUR |
|
Euro |
| EURIBOR |
|
Euro London Interbank Offered
Rate |
| GBP |
|
British Pound |
| LIBOR |
|
London
Interbank Offered Rate |
| NWG |
|
NatWest |
| PLC |
|
Public
Limited Company |
| SOFR |
|
Secured
Overnight Financing Rate |
| SONIA |
|
Sterling
Overnight Interbank Average Rate |
| USD |
|
United
States Dollar |
|
Investments
in and advances to Affiliates (as per |
|
Shares/Principal |
|
|
Net
Realized
Gain/Loss |
|
Net
Increase
(Decrease) in
Unrealized |
|
|
Interest |
|
|
12/31/2023 |
|
| 210.12-14)
for Year Ended 12/31/2023 |
|
Amount* |
|
|
for
Year |
|
Appreciation |
|
|
Received |
|
|
Value |
|
| Security
Name |
|
|
|
|
|
|
|
|
|
|
|
|
|
|
|
|
|
|
| Community
Funding 2018, LLC., Preferred shares, 9.34%* |
|
$ |
14,860,000 |
|
|
$ |
– |
|
$ |
(268,084 |
) |
|
$ |
1,670,770 |
|
|
$ |
10,959,250 |
|
*The
balance at the beginning of the period was $19,000,000. During the year the Fund made no additions or sales of the position and received
paydowns at par of $4,140,000.
| 9 |
ArrowMark Financial Corp. | Annual Report |
See Notes to financial statements. |
Additional
Information
The
following is a listing of the underlying unsecured loans that were made by Community Funding 2018, LLC. See Notes to Financial Statements
for additional information on ArrowMark Financial Corp’s. investment in Community Funding 2018, LLC.
| Bank
Name |
|
Principal
Amount |
|
|
State |
|
| Big
Poppy Holdings, Inc. |
|
$ |
9,000,000 |
|
|
|
California |
|
| Delmar
Bancorp |
|
|
4,500,000 |
|
|
|
Maryland |
|
| Fidelity
Federal Bancorp |
|
|
8,000,000 |
|
|
|
Indiana |
|
| First
Bancshares, Inc. |
|
|
10,000,000 |
|
|
|
Mississippi |
|
| Halbur
Bancshares |
|
|
3,000,000 |
|
|
|
Iowa |
|
| Vintage
Bancorp |
|
|
1,650,000 |
|
|
|
Kansas |
|
| Total |
|
$ |
36,150,000 |
|
|
|
|
|
| See Notes to financial statements. |
Annual Report | ArrowMark
Financial Corp. |
10 |
Financial
Statements
Consolidated
Statement of Assets and Liabilities As of December 31, 2023
| Assets |
|
|
|
| Unaffiliated investments
in securities, at fair value (Cost $189,078,301) |
|
$ |
185,665,846 |
|
| Affiliated investments in
securities, at fair value (Cost $14,691,250) |
|
|
10,959,250 |
|
| Cash |
|
|
427,004 |
|
| Foreign Cash (Cost $16,409) |
|
|
16,409 |
|
| Receivable for investments
sold |
|
|
1,635,072 |
|
| Unrealized appreciation
on forward foreign currency contracts |
|
|
281,257 |
|
| Interest and dividends receivable |
|
|
3,925,707 |
|
| Prepaid
assets |
|
|
786,000 |
|
| Total
assets |
|
|
203,696,545 |
|
| |
|
|
|
|
| Liabilities |
|
|
|
|
| Loan payable (Note 7) |
|
|
45,000,000 |
|
| Dividends payable |
|
|
3,911,862 |
|
| Investment advisory fees
payable |
|
|
898,362 |
|
| Payable for securities purchased |
|
|
479,140 |
|
| Excise tax payable (Note
5) |
|
|
360,470 |
|
| Loan interest payable |
|
|
304,024 |
|
| Unrealized depreciation
on forward foreign currency contracts |
|
|
30,593 |
|
| Accrued
expenses payable |
|
|
276,543 |
|
| Total
liabilities |
|
|
51,260,994 |
|
| |
|
|
|
|
| Net
Assets |
|
$ |
152,435,551 |
|
| |
|
|
|
|
| Net assets
consist of: |
|
|
|
|
| Common stock, at par ($0.001 per share) |
|
$ |
7,112 |
|
| Paid-in capital |
|
|
156,284,515 |
|
| Total
distributable earnings (loss) |
|
|
(3,856,076 |
) |
| Net
Assets |
|
$ |
152,435,551 |
|
| |
|
|
|
|
| Net asset value per share |
|
|
|
|
| Common
Stock Shares Outstanding |
|
|
7,112,453 |
|
| Net asset value per common
share |
|
$ |
21.43 |
|
| Market price per share |
|
$ |
18.16 |
|
| Market price discount
to net asset value per share |
|
|
(15.26 |
)% |
| 11 |
ArrowMark Financial Corp. | Annual Report |
See Notes to financial statements. |
Consolidated
Statement of Operations For the Year Ended December 31, 2023
This
Statement of Operations summarizes the Company’s investment income earned and expenses incurred in operating the Company. It also
shows net gains (losses) for the period stated.
| Investment
Income |
|
|
|
| Interest
from unaffiliated investments |
|
$ |
26,527,632 |
|
| Interest
from affiliated investments |
|
|
1,670,770 |
|
| Dividends |
|
|
240,730 |
|
| Origination
fee income (Note 9) |
|
|
128,660 |
|
| Other
income (Note 9) |
|
|
115,511 |
|
| Total
investment income |
|
|
28,683,303 |
|
| |
|
|
|
|
| Expenses |
|
|
|
|
| Interest
expense |
|
|
3,550,396 |
|
| Investment
advisory fee |
|
|
3,468,767 |
|
| Professional
fees |
|
|
384,894 |
|
| Excise
tax (Note 5) |
|
|
360,470 |
|
| Transfer
agent, custodian fees and administrator fees |
|
|
351,148 |
|
| Directors’
fees |
|
|
348,973 |
|
| Bank
fees |
|
|
294,400 |
|
| Valuation
service fees |
|
|
230,477 |
|
| Investor
relations fees |
|
|
229,651 |
|
| Delaware
franchise tax |
|
|
85,929 |
|
| Insurance
expense |
|
|
77,445 |
|
| Miscellaneous
fees (proxy, rating agency, etc.) |
|
|
707,442 |
|
| Total
expenses |
|
|
10,089,992 |
|
| Waivers
and/or reimbursements |
|
|
(70,994 |
) |
| Net
expenses |
|
|
10,018,998 |
|
| Net
investment income |
|
|
18,664,305 |
|
| |
|
|
|
|
| Realized
and Unrealized Gain/(Loss) on Investments, Forward Foreign Currency Contracts and Foreign Currency Translations |
| Net
realized gain (loss) on investments |
|
|
(748,130 |
) |
| Net
realized loss from forward foreign currency contracts |
|
|
(4,246,221 |
) |
| Net
realized gain from foreign currency translations |
|
|
1,916,546 |
|
| Net
change in unrealized appreciation on unaffiliated investments |
|
|
4,268,219 |
|
| Net
change in unrealized depreciation on affiliated investments |
|
|
(268,084 |
) |
| Net
change in unrealized appreciation on forward foreign currency contracts |
|
|
648,915 |
|
| Net
change in unrealized appreciation on foreign currency translations |
|
|
12,376 |
|
| Net
realized and unrealized gain/(loss) on investments, forward foreign currency contracts and forward foreign translations |
|
|
1,583,621 |
|
| |
|
|
|
|
| Net
Increase in Net Assets Resulting From Operations |
|
$ |
20,247,926 |
|
| See Notes to financial statements. |
Annual Report | ArrowMark
Financial Corp. |
12 |
Consolidated
Statements of Changes In Net Assets
These
statements of changes in net assets show how the value of the Company’s net assets has changed during the last two periods. The
difference reflects earnings less expenses, any investment gains and losses, distributions, if any, paid to shareholders and the net of
Company share transactions.
| |
|
For
the
Year Ended
December 31,
2023 |
|
|
For
the
Year Ended
December 31,
2022 |
|
| Increase (Decrease) in Net Assets |
|
|
|
|
|
|
|
|
| From Operations |
|
|
|
|
|
|
|
|
| Net
investment income |
|
$ |
18,664,305 |
|
|
$ |
13,077,463 |
|
| Net
realized gain on investments, forward foreign currency contracts and foreign currency translations |
|
|
(3,077,805 |
) |
|
|
3,615,022 |
|
| Net
change in unrealized depreciation on investments, forward foreign currency contracts and foreign currency translations |
|
|
4,661,426 |
|
|
|
(11,326,530 |
) |
| |
|
|
|
|
|
|
|
|
| Net
increase in net assets resulting from operations |
|
|
20,247,926 |
|
|
|
5,365,955 |
|
| |
|
|
|
|
|
|
|
|
| Distributions
to shareholders |
|
|
|
|
|
|
|
|
| From
total distributable earnings |
|
|
(15,639,229 |
) |
|
|
(11,786,706 |
) |
| Total
distributions |
|
|
(15,639,229 |
) |
|
|
(11,786,706 |
) |
| |
|
|
|
|
|
|
|
|
| From
Company share transactions |
|
|
|
|
|
|
|
|
| Proceeds
from sales |
|
|
— |
|
|
|
458,264 |
|
| Reinvestment
of distributions |
|
|
167,793 |
|
|
|
118,650 |
|
| Increase
in net assets resulting from Company share transactions |
|
|
167,793 |
|
|
|
576,914 |
|
| |
|
|
|
|
|
|
|
|
| Total
increase/(decrease) |
|
|
4,776,490 |
|
|
|
(5,843,837 |
) |
| |
|
|
|
|
|
|
|
|
| Net
assets |
|
|
|
|
|
|
|
|
| Beginning
of year |
|
|
147,659,061 |
|
|
|
153,502,898 |
|
| End
of year |
|
$ |
152,435,551 |
|
|
$ |
147,659,061 |
|
| |
|
|
|
|
|
|
|
|
| Shares
outstanding |
|
|
|
|
|
|
|
|
| Beginning
of year |
|
|
7,102,626 |
|
|
|
7,075,430 |
|
| Proceeds
from sales |
|
|
— |
|
|
|
21,114 |
|
| Reinvestment
of distributions |
|
|
9,827 |
|
|
|
6,082 |
|
| End
of year |
|
|
7,112,453 |
|
|
|
7,102,626 |
|
| 13 |
ArrowMark Financial Corp. | Annual Report |
See Notes to financial statements. |
Consolidated
Statement of Cash Flow
This
Statement of Cash Flows shows cash flow from operating and financing activities for the year stated.
| |
|
For
the Year Ended December 31, 2023 |
|
| Cash
flows from operating activities |
|
|
|
|
| Net
increase in net assets from operations |
|
$ |
20,247,926 |
|
| |
|
|
|
|
| Adjustments
to reconcile net increase in net assets from operations to net cash provided by operating activities: |
|
|
|
|
|
Purchase
of investments securities |
|
|
(31,569,865 |
) |
| Proceeds
from sales and redemptions of investment securities |
|
|
39,080,774 |
|
| Net
sales of short-term investments |
|
|
3,077,228 |
|
| Net
realized loss on investments |
|
|
748,130 |
|
| Net
change in net unrealized appreciation on investments |
|
|
(4,000,135 |
) |
| Net
change in unrealized appreciation on forward foreign currency contracts |
|
|
(648,915 |
) |
| Net
accretion of discount |
|
|
(351,919 |
) |
| Decrease
in prepaid expenses |
|
|
459,974 |
|
| Increase
in receivable for investments sold |
|
|
(1,635,072 |
) |
| Increase
in interest receivable and dividends receivable |
|
|
(676,784 |
) |
| Increase
in payable for securities purchased |
|
|
479,140 |
|
| Decrease
in advisory fees payable |
|
|
(19,564 |
) |
| Increase
in loan interest payable |
|
|
257,227 |
|
| Increase
in excise tax payable |
|
|
113,507 |
|
| Increase
in accrued fees payable |
|
|
126,204 |
|
| Net
cash provided by operating activities |
|
|
25,687,856 |
|
| Cash
flows from financing activities |
|
|
|
|
| Decrease
in loan payable |
|
|
(10,600,000 |
) |
| Cash
distributions to shareholders |
|
|
(15,039,861 |
) |
| Net
cash used for financing activities |
|
|
(25,639,861 |
) |
| Net
increase in cash |
|
|
47,995 |
|
| Cash
and Foreign Cash: |
|
|
|
|
|
Beginning
of year |
|
|
395,418 |
|
| End
of year |
|
$ |
443,413 |
|
| |
|
|
|
|
| Supplemental
disclosure of cash flow information |
|
|
|
|
| Cash
paid for interest |
|
$ |
3,293,169 |
|
| Distributions
reinvested |
|
$ |
167,793 |
|
| See Notes to financial statements. |
Annual Report | ArrowMark
Financial Corp. |
14 |
Consolidated
Financial Highlights
The
financial highlights show how the Company’s net asset value for a common stock share has changed during the year.
| |
|
For the |
|
|
For the |
|
|
For the |
|
|
For the |
|
|
For the |
|
| |
|
Year |
|
|
Year |
|
|
Year |
|
|
Year |
|
|
Year |
|
| |
|
Ended |
|
|
Ended |
|
|
Ended |
|
|
Ended |
|
|
Ended |
|
| |
|
December 31, |
|
|
December 31, |
|
|
December 31, |
|
|
December 31, |
|
|
December 31, |
|
| |
|
2023 |
|
|
2022 |
|
|
2021 |
|
|
2020 |
|
|
2019 |
|
| Per
share operating performance |
|
|
|
|
|
|
|
|
|
|
|
|
|
|
|
| Net
Asset value, beginning of year |
|
$ |
20.79 |
|
|
$ |
21.70 |
|
|
$ |
21.44 |
|
|
$ |
21.83 |
|
|
$ |
21.43 |
|
| Net
investment income1 |
|
|
2.63 |
|
|
|
1.84 |
|
|
|
1.60 |
|
|
|
1.68 |
|
|
|
1.54 |
|
| Net
realized and unrealized gain/(loss) on investments1 |
|
|
0.21 |
|
|
|
(1.09 |
) |
|
|
0.28 |
|
|
|
(0.50 |
) |
|
|
0.38 |
|
| Offering
cost1 |
|
|
— |
|
|
|
— |
|
|
|
— |
|
|
|
— |
|
|
|
— |
|
| Total
from investment operations |
|
|
2.84 |
|
|
|
0.75 |
|
|
|
1.88 |
|
|
|
1.18 |
|
|
|
1.92 |
|
| Less
distributions to shareholders |
|
|
|
|
|
|
|
|
|
|
|
|
|
|
|
|
|
|
|
|
| From
net investment income |
|
|
(1.78 |
) |
|
|
(1.66 |
) |
|
|
(1.62 |
) |
|
|
(1.57 |
) |
|
|
(1.52 |
) |
| From
net realized capital gains |
|
|
(0.42 |
) |
|
|
— |
|
|
|
— |
|
|
|
— |
|
|
|
— |
|
| Total
distributions |
|
|
(2.20 |
) |
|
|
(1.66 |
) |
|
|
(1.62 |
) |
|
|
(1.57 |
) |
|
|
(1.52 |
) |
| Net
asset value, end of year |
|
$ |
21.43 |
|
|
$ |
20.79 |
|
|
$ |
21.70 |
|
|
$ |
21.44 |
|
|
$ |
21.83 |
|
| Per
share market value, end of year |
|
$ |
18.16 |
|
|
$ |
17.04 |
|
|
$ |
21.97 |
|
|
$ |
19.25 |
|
|
$ |
22.30 |
|
| Total
investment return based on market value2 |
|
|
20.89 |
% |
|
|
(15.16 |
)% |
|
|
23.19 |
% |
|
|
(5.76 |
)% |
|
|
24.00 |
% |
| Total
investment return based on net asset value2 |
|
|
16.93 |
% |
|
|
4.80 |
% |
|
|
9.25 |
% |
|
|
7.22 |
% |
|
|
9.32 |
% |
| Ratios
and supplemental data |
|
|
|
|
|
|
|
|
|
|
|
|
|
|
|
|
|
|
|
|
| Net
assets end of period (in millions) |
|
$ |
152.4 |
|
|
$ |
147.7 |
|
|
$ |
153.5 |
|
|
$ |
140.8 |
|
|
$ |
143.2 |
|
| Ratios
(as a percentage of average net assets): |
|
|
|
|
|
|
|
|
|
|
|
|
|
|
|
|
|
|
|
|
| Expenses
before waivers and/or recoupment, if any3 |
|
|
6.72 |
% |
|
|
5.64 |
% |
|
|
4.47 |
% |
|
|
4.17 |
% |
|
|
4.39 |
% |
| Expenses
after waivers and/or recoupment, if any4,5 |
|
|
6.67 |
% |
|
|
5.64 |
% |
|
|
4.41 |
% |
|
|
4.17 |
% |
|
|
4.39 |
% |
| Net
investment income6 |
|
|
12.43 |
% |
|
|
8.72 |
% |
|
|
7.46 |
% |
|
|
8.10 |
% |
|
|
7.11 |
% |
| Portfolio
turnover rate |
|
|
16 |
% |
|
|
29 |
% |
|
|
20 |
% |
|
|
60 |
% |
|
|
13 |
% |
| Revolving
credit agreement |
|
|
|
|
|
|
|
|
|
|
|
|
|
|
|
|
|
|
|
|
| Total
revolving credit agreement outstanding (000s) |
|
$ |
45,000 |
|
|
$ |
55,600 |
|
|
$ |
60,000 |
|
|
$ |
43,000 |
|
|
$ |
17,700 |
|
| Asset
Coverage per $1,000 for revolving credit agreement |
|
|
4,387 |
|
|
|
3,656 |
|
|
|
3,558 |
|
|
|
4,274 |
|
|
|
9,090 |
|
| 1 |
The net investment income and unrealized
gain/(loss) on investments per share were calculated using the average shares outstanding method. |
| 2 |
Investment return based on net asset value
includes management fee and all other expenses paid by the Fund. Dividends are reinvested in accordance with Fund’s Dividend Reinvestment
Plan. Investment return based on market value is based on share market price and reinvestment of distributions at the price obtained under
the Dividend Reinvestment Plan. Total return does not include sales load and offering expenses. |
| 3 |
Ratio of expenses before waivers or recoupment,
if any, to managed assets equals 5.13%, 4.08%, 3.34%, 3.49%, 3.55%, 3.83%, 3.67%, 3.58% and 3.62% for the years ended December 31,
2023, 2021, 2020, 2019, 2018, 2017, 2016 and 2015, respectively. |
| 4 |
Excluding interest expense, net operating
expenses would have been 4.31%, 4.09%, 3.53%, 3.61%, 3.40%, 3.61%, 3.75%, 3.74% and 3.54% for the years ended December 31, 2023,
2022, 2021, 2020, 2019, 2018, 2017, 2016 and 2015, respectively. |
| 5 |
Ratio of expenses after waivers or recoupment,
if any, to managed assets equals 5.09%, 4.08%, 3.38%, 3.49%, 3.55%, 3.78%, 3.73%, 3.52% and 3.35% for the years ended December 31,
2023, 2022, 2021, 2020, 2019, 2018, 2017, 2016 and 2015, respectively. |
| 6 |
Ratio of net investment income to managed
assets equals 9.48%, 6.31%, 5.65%, 6.77%, 5.75%, 5.74%, 5.51%, 5.23% and 4.88% for the years ended December 31, 2023, 2022, 2021,
2020, 2019, 2018, 2017, 2016 and 2015, respectively. |
| 15 |
ArrowMark Financial Corp. | Annual Report |
See Notes to financial statements. |
Consolidated
Financial Highlights
The
financial highlights show how the Company’s net asset value for a common stock share has changed during the year.
| |
|
For the |
|
|
For the |
|
|
For the |
|
|
For the |
|
|
For the |
|
| |
|
Year |
|
|
Year |
|
|
Year |
|
|
Year |
|
|
Year |
|
| |
|
Ended |
|
|
Ended |
|
|
Ended |
|
|
Ended |
|
|
Ended |
|
| |
|
December 31, |
|
|
December 31, |
|
|
December 31, |
|
|
December 31, |
|
|
December 31, |
|
| |
|
2018 |
|
|
2017 |
|
|
2016 |
|
|
2015 |
|
|
2014 |
|
| Per
share operating performance |
|
|
|
|
|
|
|
|
|
|
|
|
|
|
|
| Net
Asset value, beginning of year |
|
$ |
21.56 |
|
|
$ |
21.22 |
|
|
$ |
21.62 |
|
|
$ |
21.86 |
|
|
$ |
23.07 |
|
| Net
investment income |
|
|
1.63 |
|
|
|
1.58 |
|
|
|
1.56 |
|
|
|
1.44 |
|
|
|
0.84 |
|
| Net
realized and unrealized gain/(loss) on investments |
|
|
(0.10 |
) |
|
|
0.26 |
|
|
|
(0.50 |
) |
|
|
(0.17 |
) |
|
|
0.01 |
|
| Offering
cost |
|
|
— |
|
|
|
— |
|
|
|
— |
|
|
|
— |
|
|
|
(0.06 |
) |
| Total
from investment operations |
|
|
1.53 |
|
|
|
1.84 |
|
|
|
1.06 |
|
|
|
1.27 |
|
|
|
0.79 |
|
| Less
distributions to shareholders From net investment income |
|
|
(1.66 |
) |
|
|
(1.50 |
) |
|
|
(1.46 |
) |
|
|
(1.29 |
) |
|
|
(1.22 |
) |
| Return
of capital |
|
|
— |
|
|
|
— |
|
|
|
— |
|
|
|
(0.22 |
) |
|
|
(0.78 |
) |
| Total
distributions |
|
|
(1.66 |
) |
|
|
(1.50 |
) |
|
|
(1.46 |
) |
|
|
(1.51 |
) |
|
|
(2.00 |
) |
| Net
asset value, end of year |
|
$ |
21.43 |
|
|
$ |
21.56 |
|
|
$ |
21.22 |
|
|
$ |
21.62 |
|
|
$ |
21.86 |
|
| Per
share market value, end of period/year |
|
$ |
19.30 |
|
|
$ |
20.13 |
|
|
$ |
18.69 |
|
|
$ |
16.30 |
|
|
$ |
19.47 |
|
| Total
investment return based on market value |
|
|
3.84 |
% |
|
|
16.21 |
% |
|
|
24.45 |
% |
|
|
(8.68 |
)% |
|
|
(13.59 |
)% |
| Total
investment return based on net asset value |
|
|
7.65 |
% |
|
|
9.62 |
% |
|
|
6.53 |
% |
|
|
7.88 |
% |
|
|
3.28 |
% |
| Ratios
and supplemental data |
|
|
|
|
|
|
|
|
|
|
|
|
|
|
|
|
|
|
|
|
| Net
assets end of period (in millions) |
|
$ |
140.4 |
|
|
$ |
141.0 |
|
|
$ |
138.6 |
|
|
$ |
140.8 |
|
|
$ |
142.1 |
|
| Ratios
(as a percentage of average net assets): |
|
|
|
|
|
|
|
|
|
|
|
|
|
|
|
|
|
|
|
|
| Expenses
before waivers and/or recoupment, if any |
|
|
5.01 |
% |
|
|
4.93 |
% |
|
|
5.02 |
% |
|
|
4.87 |
% |
|
|
3.73 |
% |
| Expenses
after waivers and/or recoupment, if any |
|
|
4.95 |
% |
|
|
5.01 |
% |
|
|
4.94 |
% |
|
|
4.50 |
% |
|
|
3.73 |
% |
| Net
investment income |
|
|
7.52 |
% |
|
|
7.39 |
% |
|
|
7.33 |
% |
|
|
6.56 |
% |
|
|
3.41 |
% |
| Portfolio
turnover rate |
|
|
30 |
% |
|
|
16 |
% |
|
|
34 |
% |
|
|
101 |
% |
|
|
30 |
% |
| Revolving
credit agreement |
|
|
|
|
|
|
|
|
|
|
|
|
|
|
|
|
|
|
|
|
| Total
revolving credit agreement outstanding (000s) |
|
$ |
51,000 |
|
|
$ |
25,750 |
|
|
$ |
61,500 |
|
|
$ |
25,000 |
|
|
$ |
22,500 |
|
| Asset
Coverage per $1,000 for revolving credit agreement |
|
|
3,753 |
|
|
|
6,478 |
|
|
|
3,253 |
|
|
|
6,631 |
|
|
|
7,317 |
|
| See Notes to financial statements. |
Annual Report | ArrowMark
Financial Corp. |
16 |
Notes
to Consolidated Financial Statements
Note
1 — Organization
ArrowMark
Financial Corp. (“AMFC” or the “Company”) is a Delaware corporation registered as a non-diversified, closed-end
management investment company under the Investment Company Act of 1940, as amended, (the “Investment Company Act”) which commenced
investment operations on November 13, 2013. In addition, AMFC has elected to be treated for tax purposes as a regulated investment
company (‘‘RIC’’) under Subchapter M of the Internal Revenue Code of 1986, as amended (the ‘‘Code’’).As
an investment company, the Company follows the accounting and reporting guidance of the Financial Accounting Standards Board and the Accounting
Standards Codification Topic 946 “Financial Services — Investment Companies.”
Investment
Objectives — ArrowMark Financial Corp.’s primary investment objective is to provide stockholders with current income,
and to a lesser extent, capital appreciation. There can be no assurance that the Company will achieve the investment objectives.
Investment
Strategies — The Company is focused on income generation, capital preservation, and providing risk-adjusted rates of return.
The Company attempts to achieve its investment objective through investment in preferred equity, debt and subordinated debt, structured
notes and securities, convertible securities, regulatory capital securities and common equity issued or structured by banks and financial
institutions including community banks, larger regional, national and money center banks domiciled in the United States and foreign and
global money center banks. (“banking-related securities”). The Company makes investments that will generally be expected to
pay the Company dividends and interest on a current basis and generate capital gains over time. The Company may seek to enhance the Company’s
returns through the use of warrants, options and other equity conversion features. The Company has a policy to invest, under normal circumstances,
at least 80% of the value of its net assets plus the amount of any borrowings for investment purposes in such banking-related securities.
The
Company focuses its portfolio on making long-term, passive, non-control investments in the banking sector, including “regulatory
capital securities” which are securities issued or structured by banks seeking capital that is treated more favorably under banking
regulations than other types of capital, acquisitions and other refinancing activities regulatory capital securities are issued or structured
by a bank to maintain or reduce its regulatory capital requirements by transferring certain credit risks to investors. Regulatory capital
securities may be structured in a variety of ways and are highly bespoke to the needs of the bank or other deposit-taking institution
involved. Regulatory capital securities may be in the form of structured notes (e.g., credit-linked notes), contingent convertible securities,
and other structured products or transactions. The Company intends to continue to direct investments in numerous issuers differentiated
by asset size, business models and geographies. The Company also may invest in an option strategy that will normally consist of writing
(selling) call options on bank equity securities in the Company’s portfolio (“covered calls”).The Company invests in
foreign securities and the Company is not limited in the amount of assets the Company may invest in such foreign securities.
| 17 |
ArrowMark Financial Corp.| Annual Report |
|
The
Company indirectly invests in securities issued or structured by banks through structured securities and credit derivatives, including
collateralized loan obligations (CLOs) and credit-linked notes. The Company currently invests in credit-linked notes for which the performance
and payment of principal and interest is tied to a reference asset such as a pool of loans originated by a bank and held on its balance
sheet. The Company also invests in equity and junior debt tranches of CLOs, and other debt securitizations, that are collateralized by
a portfolio consisting primarily of unsecured, subordinated loans made to (and, to a lesser extent, unsecured, subordinated debentures
and notes issued by) community banks or savings institutions or their respective holding companies. The Company may also invest in other
securities and instruments that are related to these investments or that the Adviser believes are consistent with the Company’s
investment objectives, including senior debt tranches of CLOs and loan accumulation facilities. These indirect investments provide exposure
to and focus on the same types of direct investments that the Company makes in banking companies and, accordingly, the Company’s
investments in structured securities (such as credit-linked notes and CLOs) and credit derivatives that provide exposure to the banking
industry are considered an investment in banking securities. The loans or other assets pledged as collateral in these securitizations
may not be publicly rated by any rating agency, and may have greater credit and liquidity risks than investment-grade corporate obligations
that are publicly rated. The Company believes that the use of such instruments complements the Company’s overall strategy and enhance
the diversity of the Company’s holdings.
The
Company may also incur additional leverage to the extent permitted by the Investment Company Act. Although the Company normally seeks
to invest substantially all of the Company’s assets in banking-related securities, the Company reserves the ability to invest up
to 20% of the Company’s assets in other types of securities and instruments.
Additionally,
the Company may take temporary defensive positions that are inconsistent with the Company’s investment strategy in attempting to
respond to adverse market, economic, political or other conditions. If the Company does so, the Company may not achieve the Company’s
investment objective. The Company may also choose not to take defensive positions.
Consolidation
of Disregarded Entities — The Company makes investments in securities through Marshall Holdings II, Limited and Marshall
Holdings III, Limited, both organized under the laws of the Cayman Islands (the “Disregarded Entities”).The consolidated financial
statements of the Company include all assets and liabilities of the Disregarded Entities. All inter-company accounts and transactions
have been eliminated. As of December 31, 2023, the net assets of the Designated Entities were $112,665,621, which represented 73.91%
of the Fund’s net assets.
Note
2 — Significant accounting policies
The
following is a summary of significant accounting policies consistently followed by AMFC in the preparation of its financial statements.
The preparation of the financial statements is in conformity with accounting principles generally accepted in the United States of America
("U.S. GAAP") and requires the Board of Directors, inclusive of the sub-committees, and ArrowMark Asset Management, LLC
(the "Advisor") to make estimates and assumptions that affect the reported amounts of assets and liabilities in the financial
statements and the reported amounts of increases and decreases in net assets from operations during the reporting period. Actual results
could differ from those estimates.
Cash
and Cash Equivalents — AMFC considers all highly liquid debt instruments with a maturity of three months or less at
the time of purchase to be cash equivalents.
Investment
Valuation — The most significant estimates made in the preparation of the financial statements of ArrowMark Financial
Corp. are the valuation of equity and debt investments and the effective yield calculation with respect to certain debt securities, as
well as the related amounts of unrealized appreciation and depreciation of investments recorded. The Company believes that there is no
single definitive method for determining fair value in good faith. As a result, determining fair value requires that judgment be applied
to the specific facts and circumstances of each portfolio investment while employing a consistently applied valuation process for the
types of investments that AMFC makes. The Company is required to specifically fair value each individual investment on a quarterly basis.
| |
Annual Report | ArrowMark
Financial Corp. |
18 |
The
Company complies with ASC 820-10, Fair Value Measurements and Disclosure, which establishes a three-level valuation hierarchy for disclosure
of fair value measurements. ASC 820-10 clarified the definition of fair value and requires companies to expand their disclosure about
the use of fair value to measure assets and liabilities in interim and annual periods subsequent to initial recognition. ASC 820-10 defines
fair value as the price that would be received to sell an asset or paid to transfer a liability (i.e. the “exit price”) in
an orderly transaction between market participants at the measurement date. ASC 820-10 also establishes the following three-tier fair
value hierarchy:
| · |
Level 1— Quoted prices in active markets for identical securities; |
| · |
Level 2 — Other significant observable inputs. These inputs may include quoted prices for the
identical instrument on an active market, prices for similar instruments, interest rates, prepayment speeds, credit risk, yield curves,
default rates, and similar data; and |
| · |
Level 3 — Significant unobservable inputs, including the Company’s own determinations
about the assumptions that a market participant would use in valuing the asset or liability, and that would be based on the best information
available. |
To
the extent securities owned by the Company are actively traded and valuation adjustments are not applied, they are categorized in Level
1 of the fair value hierarchy. Securities traded on inactive markets or valued by reference to similar instruments are generally categorized
in Level 2 of the fair value hierarchy.
The
availability of valuation techniques and observable inputs can vary from security to security and is affected by a wide variety of factors
including the type of security, whether the security is new and not yet established in the marketplace, and other characteristics particular
to the transaction. To the extent that valuation is based on models or inputs that are less observable or unobservable in the market,
the determination of fair value requires more judgement. Those estimated values do not necessarily represent the amounts that may be ultimately
realized due to the occurrence of future circumstances that cannot be reasonably determined. Because of the inherent uncertainty of valuation,
those estimated values may be materially higher or lower than the values that would have been used had a ready market for the securities
existed. Accordingly, the degree of judgment exercised by AMFC in determining fair value is greatest for securities categorized in Level
3. In certain cases, the inputs used to measure fair value may fall into different levels of the fair value hierarchy. In such cases,
for disclosure purposes, the level in the fair value hierarchy within which the fair value measurement in its entirety falls, is determined
based on the lowest level input that is significant to the fair value measurement. The valuation levels are not necessarily an indication
of the risk associated with investing in those securities.
Fair
value is a market-based measure considered from the perspective of a market participant rather than an entity-specific measure. Therefore,
even when market assumptions are not readily available, AMFC’s own assumptions are set to reflect those that market participants
would use in pricing the asset or liability at the measurement date. AMFC uses prices and inputs that are current as of the measurement
date, including periods of market dislocation. In periods of market dislocation, the observability of prices and inputs may be reduced
for many securities. This condition could cause a security to be reclassified to a lower level within the fair value hierarchy.
| 19 |
ArrowMark Financial Corp. | Annual Report |
|
AMFC
will determine fair value of its assets and liabilities in accordance with valuation procedures adopted by its Board of Directors. The
Company may utilize the services of one or more regionally or nationally recognized independent valuation firms to help it determine the
value of each investment for which a market price is not available. AMFC’s Board of Directors will also review valuations of such
investments provided by the Advisor. To the extent AMFC invests in securities for which market quotations are readily available, such
market value will be used to value those securities. If a market value cannot be obtained or if the Advisor determines that the value
of a security as so obtained does not represent a fair value as of the measurement date (due to a significant development subsequent to
the time its price is determined or otherwise), fair value shall be determined pursuant to the methodologies established by the Board
of Directors. In making these determinations, the Company may engage an independent valuation firm from time to time to assist in determining
the fair value of our investments. The methods for valuing these investments may include fundamental analysis, discounts from market prices
of similar securities, purchase price of securities, subsequent private transactions in the security or related securities, or discounts
applied to the nature and duration of restrictions on the disposition of the securities, as well as a combination of these and other factors.
Structured
Debt Securities– AMFC may acquire equity or preferred equity in structured debt securities or other structured financings.
In valuing such investments, AMFC attempts to obtain a minimum of two marks provided by recognized industry brokers as a primary source,
supplemented by actual trades executed in the market at or around period-end, as well as the marks provided by the broker who arranges
transactions in such investment vehicles. Any event adversely affecting the value of such structured debt securities and other structured
financings, including events that impact the value of the underlying collateral held by such vehicles, would be magnified to the extent
leverage is utilized. AMFC’s investment in structured debt securities and other structured financings that utilize leverage may
make it more likely that substantial changes in the Company’s net asset value (“NAV”) will occur.
The
fair value of the structured debt securities is determined using market price quotations (where observable) and other observable market
inputs. When using market price quotations from brokers, fair value is calculated using the average of two or more indicative broker quotes
obtained as of the valuation date. When quotations are unobservable, internal valuation models (typically including discounted cash flow
analysis and comparable analysis) are employed. Structured debt securities are generally categorized as Level 2 or 3 in the fair value
hierarchy, depending on the availability of broker quotes and observable inputs. At December 31, 2023, AMFC’s investment in
Community Funding 2018, LLC was valued on the basis of the average of two broker quotes.
Service
fees are paid to StoneCastle Investment Management, LLC, (“The Servicer”).The Servicer rebates the entire service fee to AMFC
quarterly. For the year ended December 31, 2023 this amounted to $115,511 relating to Community Funding 2018, LLC.
Regulatory
Capital Relief Securities. Regulatory capital relief securities are senior unsecured debt obligations that are credit linked
to the performance of a reference portfolio of certain loan related claims on corporate and similar entities. The fair value of regulatory
capital relief securities is generally based on broker quotes. Regulatory capital relief securities are generally categorized as Level
2 or 3 in the fair value hierarchy, depending on the availability of broker quotes.
Preferred
and Trust Preferred Securities. The fair value of preferred securities and trust preferred securities is generally determined
using market price quotations (where observable) and other observable market inputs (including recently executed transactions). When using
market price quotations from brokers, fair value is calculated using the average of two or more indicative broker quotes obtained as of
the valuation date. When quotations are unobservable, internal valuation models (typically including discounted cash flow analysis and
comparable analysis) are employed. Perpetual preferred and trust preferred securities are generally categorized as Level 2 or 3 in the
fair value hierarchy, depending on the availability of observable inputs.
| |
Annual Report | ArrowMark
Financial Corp. |
20 |
Debt
Securities. Under procedures established by the Board of Directors, we value secured debt, unsecured debt, senior term loans,
subordinated term loans and other debt securities, for which market quotations are readily available, at such market quotations (unless
they are deemed not to represent fair value).We attempt to obtain market quotations from at least two brokers if available. If not available
or when market quotations are deemed not to represent fair value, we typically utilize independent third party valuation firms to assist
us in determining fair value. Our independent valuation firms consider observable market inputs together with significant unobservable
inputs in arriving at their valuation recommendations for such Level 2 and Level 3 categorized assets. Investments that are not publicly
traded or whose market quotations are not readily available are valued at fair value as determined in good faith by or under the direction
of the Board of Directors. Such determination of fair value may involve subjective judgments and estimates.
Equity
Securities. AMFC may invest in equity securities (including exchange traded funds) for which bid and ask prices can be observed
in the marketplace. Bid prices reflect the highest price that the marketplace participants are willing to pay for an asset. Ask prices
represent the lowest price that the marketplace participants are willing to accept for an asset. The Company’s policy for listed
securities for which no sale was reported on that date is generally to value the security using the last reported “bid” price
if held long, and last reported “ask” price if sold short. Equity securities are generally categorized as Level 1 or 2 in
the fair value hierarchy, depending on trading volume levels.
Forward
Contracts. Forward contracts are traded on the OTC market. The fair value of forward contracts is determined using observable
inputs, such as currency exchange rates or commodity prices, applied to notional amounts stated in the applicable contracts. Forward contracts
are generally categorized in Level 2 of the fair value hierarchy.
The
Company’s assets measured at fair value subject to the disclosure requirements of ASC 820-10-35 at December 31, 2023, were
as follows:
| |
|
TOTAL
FAIR
VALUE AT 12-31-23 |
|
|
LEVEL
1
QUOTED PRICE |
|
|
LEVEL
2
SIGNIFICANT
OBSERVABLE INPUTS |
|
|
LEVEL 3
SIGNIFICANT
UNOBSERVABLE
INPUTS |
|
| Assets |
|
|
|
|
|
|
|
|
|
|
|
|
|
|
|
|
| Term Loans |
|
$ |
10,488,500 |
|
|
$ |
— |
|
|
$ |
10,488,500 |
|
|
$ |
— |
|
| Structured Debt Security |
|
|
10,959,250 |
|
|
|
— |
|
|
|
10,959,250 |
|
|
|
— |
|
| Regulatory Capital Relief
Securities |
|
|
172,422,251 |
|
|
|
— |
|
|
|
88,460,183 |
|
|
|
83,962,068 |
|
| Trust Preferred and Preferred
Securities |
|
|
2,391,200 |
|
|
|
— |
|
|
|
2,391,200 |
|
|
|
— |
|
| Money Market Fund |
|
|
363,895 |
|
|
|
363,895 |
|
|
|
— |
|
|
|
— |
|
| Derivatives: |
|
|
|
|
|
|
|
|
|
|
|
|
|
|
|
|
| Foreign Currency Contracts |
|
|
|
|
|
|
|
|
|
|
|
|
|
|
|
|
| Forward
Foreign Currency Contracts |
|
|
281,257 |
|
|
|
— |
|
|
|
281,257 |
|
|
|
— |
|
| Total Assets |
|
$ |
196,906,353 |
|
|
$ |
363,895 |
|
|
$ |
112,580,390 |
|
|
$ |
83,962,068 |
|
| 21 |
ArrowMark Financial Corp. | Annual Report |
| |
|
TOTAL
FAIR
VALUE AT 12-31-23 |
|
|
LEVEL
1
QUOTED PRICE |
|
|
LEVEL
2
SIGNIFICANT
OBSERVABLE INPUTS |
|
|
LEVEL 3
SIGNIFICANT
UNOBSERVABLE
INPUTS |
|
| Liabilities |
|
|
|
|
|
|
|
|
|
|
|
|
| Derivatives: |
|
|
|
|
|
|
|
|
|
|
|
|
| Foreign Currency Contracts |
|
|
|
|
|
|
|
|
|
|
|
|
|
|
|
|
| Forward
Foreign Currency Contracts |
|
$ |
(30,593 |
) |
|
$ |
— |
|
|
$ |
(30,593 |
) |
|
$ |
— |
|
| Total Liabilities |
|
$ |
(30,593 |
) |
|
$ |
— |
|
|
$ |
(30,593 |
) |
|
$ |
— |
|
The
Level 3 categorized assets listed above have been valued via the use of a) independent third party valuation firms, or, b) fair valued
as determined in good faith by the Board of Directors, in accordance with procedures established by the Board of Directors.
For
fair valuations using significant unobservable inputs, U.S. GAAP requires AMFC to present a reconciliation of the beginning to ending
balances for reported fair values that presents changes attributable to total realized and unrealized gains or losses, purchase and sales,
and transfers in and out of Level 3 during the period. Transfers in and out between levels are based on values at the end of a period.
U.S. GAAP also requires AMFC to disclose amounts and reasons for all transfers in and out of Level 1 and Level 2 fair value measurements.
A reconciliation of Level 3 investments is presented below:
| |
|
REGULATORY
CAPITAL
RELIEF
SECURITIES |
|
| Balance at December 31, 2022 |
|
$ |
69,529,738 |
|
| Realized loss including earnings |
|
|
— |
|
| Unrealized appreciation on investments |
|
|
649,691 |
|
| Purchases |
|
|
26,852,524 |
|
| Sales |
|
|
(4,000,635 |
) |
| Transfers in |
|
|
7,723,827 |
|
| Transfers out |
|
|
(16,793,077 |
) |
| Balance at December 31, 2023 |
|
$ |
83,962,068 |
|
The
change in unrealized appreciation on Level 3 securities held as of December 31, 2023 was $649,691.
| |
|
FAIR VALUE
AT
12-31-23 |
|
|
VALUATION
TECHNIQUES |
|
UNOBSERVABLE
INPUTS |
|
|
ASSUMPTIONS |
|
|
IMPACT
TO
VALUATION FROM AN
INCREASE TO INPUT |
|
| Regulatory Capital Securities |
|
$ |
83,962,068 |
|
|
Broker
Quote |
|
|
— |
|
|
|
— |
|
|
|
— |
|
| |
|
$ |
83,962,068 |
|
|
|
|
|
|
|
|
|
|
|
|
|
|
|
| |
Annual Report | ArrowMark
Financial Corp. |
22 |
In
accordance with Regulation S-X Rules 3-09 and 4-08(g), the Company evaluates its unconsolidated subsidiary-Community Funding 2018,
LLC (“CF 2018”) as a significant subsidiary under the respective rules. However, as of December 31, 2023, CF 2018 was
not considered a significant subsidiary under Regulation S-X Rule 1-02(w). Based on the requirements under Regulation S-X Rule 4-08(g),
the summarized financial information of CF 2018 for the year ended December 31, 2023 is presented below:
Community Funding 2018,
LLC.
| |
|
Amount |
|
| Assets |
|
|
|
|
| Cash: Expense Reserve |
|
$ |
100,000 |
|
| Collateral Loans Outstanding |
|
|
|
|
| Big Poppy Holdings, Inc. |
|
$ |
9,000,000 |
|
| Fidelity Federal Bancorp. |
|
|
8,000,000 |
|
| First Bancshares, Inc. |
|
|
10,000,000 |
|
| Halibur Bancshares |
|
|
3,000,000 |
|
| Delmar Bancorp |
|
|
4,500,000 |
|
| Vintage Bancorp. |
|
|
1,650,000 |
|
| |
|
|
36,150,000 |
|
| Total Assets |
|
$ |
36,250,000 |
|
| Liabilities |
|
|
|
|
| Pro-Rata Note outstanding |
|
$ |
8,730,250 |
|
| Pro-Rata Note outstanding |
|
|
2,414,750 |
|
| Pro-Rata Note outstanding |
|
|
11,145,000 |
|
| Total Liabilities |
|
$ |
22,290,000 |
|
| Equity |
|
|
|
|
| Preferred Shares (non-voting, equity
investment)(a) |
|
$ |
13,960,000 |
|
| Total Equity |
|
$ |
13,960,000 |
|
| Total Liabilities and Equity |
|
$ |
36,250,000 |
|
(a) Investment
by ArrowMark Financial Corp., purchased at a discount. Valued at $10,959,250 at 12/31/23, see Schedule of Investments, page 7.
CF 2018 Interest Collections
and Disbursements for year ended December 31, 2023
| Interest Collections |
|
$ |
3,153,990 |
|
| Interest Disbursements to Preferred Shares and Notes |
|
|
(3,153,990 |
) |
| Net |
|
$ |
– |
|
CF 2018
Principal Collections and Disbursements for year ended December 31, 2023
| Principal Collections |
|
$ |
10,350,000 |
|
| Principal Disbursements to Preferred Shares and Notes |
|
|
(10,350,000 |
) |
| Net |
|
$ |
– |
|
Securities
Transactions, Investment Income and Expenses — Securities transactions are recorded on trade date for accounting
and financial statement preparation purposes. Realized gains and losses on investments sold are recorded on the identified cost basis.
Interest income is recorded on the accrual basis. Accretion of discounts and amortization of premiums are recorded on a daily basis using
the effective yield method except for short term securities, which records discounts and premiums on a straight-line basis. Dividends
are recorded on the ex-dividend date.
Dividends
and Distributions to Shareholders — Dividends from net investment income, if any, are declared and paid quarterly.
Distributions, if any, of net short-term capital gain and net capital gain (the excess of net long-term capital gain over the short-term
capital loss) realized by AMFC, after deducting any available capital loss carryovers are declared and paid to shareholders at least annually.
Income dividends and capital gain distributions are determined in accordance with U.S. federal income tax regulations, which may differ
from U.S.GAAP. These differences include the treatment of non-taxable dividends, losses deferred due to wash sales and excise tax
regulations. Permanent book and tax basis differences relating to shareholder distributions will result in reclassifications within the
components of net assets.
| 23 |
ArrowMark Financial Corp. | Annual Report |
Forward
Foreign Currency Transactions/Contracts — The Fund may enter into forward foreign currency contracts to hedge against foreign
currency exchange rate risk on their non-U.S. dollar denominated securities or to facilitate settlement of foreign currency denominated
portfolio transactions. A forward foreign currency contract is an agreement between two parties to buy and sell a currency at a set price
on a future date. The contract is marked-to-market daily and the change in value is recorded by the Fund as an unrealized gain or loss.
When a forward foreign currency contract is extinguished, through either delivery or offset by entering into another forward foreign currency
contract, the Fund records a realized gain or loss equal to the difference between the value of the contract at the time it was opened
and the value of the contract at the time it was extinguished.
Forward
foreign currency contracts involve elements of market risk in excess of the amounts reflected in the Statements of Assets and Liabilities.
The Fund bears the risk of an unfavorable change in the foreign exchange rate underlying the forward foreign currency contract. Risks
may also arise upon entering into these contracts from the potential inability of the counter parties to meet the terms of their contracts.
For the year ended December 31, 2023, the Fund’s average monthly volume of forward foreign currency contracts was as follows:
Forward Foreign
Currency
Contracts
—
Purchased |
|
|
Forward Foreign
Currency
Contracts
—
Sold |
|
| $ |
251,064 |
|
|
$ |
66,111,873 |
|
Foreign
Currency Translation — The books and records of the Fund are maintained in U.S. dollars. Investment securities and
other assets and liabilities denominated in a foreign currency are translated into U.S. dollars at the prevailing exchange rates at period
end. The effect of changes in foreign currency exchange rates on investments is included within net realized and unrealized gain (loss)
on investments. Changes in the value of other assets and liabilities as a result of fluctuations in foreign exchange rates are included
in the Statement of Operations within net change in unrealized gain (loss) on foreign currency translations. Transactions denominated
in foreign currencies are translated into U.S. dollars on the date the transaction occurred, the effects of which are included within
net realized gain (loss) on foreign currency.
Master
Netting Agreement — In order to define its contractual rights and to secure rights that will help mitigate its counterparty
risk, the Fund has entered into an International Swaps and Derivatives Association, Inc. Master Agreement (“ISDA Master Agreement”).An
ISDA Master Agreement is a bilateral agreement between the Fund and a counterparty that governs certain OTC derivatives and typically
contains, among other things, collateral posting terms and netting provisions in the event of a default and/or termination event. Under
an ISDA Master Agreement, the Fund may, under certain circumstances, offset with the counterparty certain derivative financial instruments’
payables and/or receivables with collateral held and/or posted and create one single net payment. The provisions of the ISDA Master Agreement
typically permit a single net payment in the event of default including the bankruptcy or insolvency of the counterparty. Bankruptcy or
insolvency laws of a particular jurisdiction may restrict or prohibit the right of offset in bankruptcy, insolvency or other events. In
addition, certain ISDA Master Agreements allow counterparties to terminate derivative contracts prior to maturity in the event the Fund’s
net assets decline by a stated percentage or the Fund fails to meet the terms of its ISDA Master Agreements. The result would cause the
Fund to accelerate payment of any net liability owed to the counterparty.
| |
Annual Report | ArrowMark
Financial Corp. |
24 |
Collateral
Requirements — For derivatives traded under an ISDA Master Agreement, the collateral requirements are typically calculated
by netting the mark-to-market amount for each transaction under such agreement and comparing that amount to the value of any collateral
currently pledged by the Fund and the counterparty. Cash collateral that has been pledged to cover obligations of the Fund and cash collateral
received from the counterparty, if any, is reported separately on the Statement of Assets and Liabilities as cash pledged as collateral
and cash received as collateral, respectively. Non-cash collateral pledged by the Fund, if any, is noted in the Portfolio of Investments.
Generally, the amount of collateral due from or to a counterparty is subject to a certain minimum transfer amount threshold before a transfer
is required, which is determined at the close of business of the Fund. Any additional required collateral is delivered to/pledged by the
Fund on the next business day. Typically, the counterparty is not permitted to sell, re-pledge or use cash and non-cash collateral it
receives. The Fund generally agrees not to use non-cash collateral that it receives but may, absent default or certain other circumstances
defined in the underlying ISDA Master Agreement, be permitted to use cash collateral received. In such cases, interest may be paid pursuant
to the collateral arrangement with the counterparty. To the extent amounts due to the Fund from its counterparties are not fully collateralized,
they bear the risk of loss from counterparty nonperformance. Likewise, to the extent the Fund has delivered collateral to a counterparty
and stands ready to perform under the terms of its agreement with such counterparty, it bears the risk of loss from a counterparty in
the amount of the value of the collateral in the even the counterparty fails to return such collateral. Based on the terms of agreements,
collateral may not be required for all derivative contracts. For financial reporting purposes, the Fund does not offset derivative assets
and derivative liabilities that are subject to netting arrangements, if any, in the Statements of Assets and Liabilities.
The
following tables present derivative assets and liabilities net of amounts available for offset under a master netting agreement and any
related collateral received or posted by the Fund for forward foreign currency contracts as of December 31, 2023:
| Counterparty |
|
Derivative
Assets
- Gross |
|
|
Derivative Available
for
Offset |
|
|
Collateral
Received |
|
|
Derivative
Assets
- Net* |
|
| NatWest |
|
$ |
281,257 |
|
|
$ |
(30,593 |
) |
|
$ |
— |
|
|
$ |
250,664 |
|
*
Net amount represents the net receivable from the counterparty in the event of a default.
| Counterparty |
|
Derivative
Liability
- Gross |
|
|
Derivative Available
for
Offset |
|
|
Collateral
Posted |
|
|
Derivative
Liability
- Net** |
|
| NatWest |
|
$ |
30,593 |
|
|
$ |
(30,593 |
) |
|
$ |
— |
|
|
$ |
— |
|
**
Net amount represents the net payable to the counterparty in the event of a default.
Currency
Risk — The Fund invests in securities of foreign issuers, including American Depositary Receipts. These markets are
subject to special risks associated with foreign investments not typically associated with investing in U.S. markets. Because the foreign
securities in which the Fund may invest generally trade in currencies other than the U.S. dollar, changes in currency exchange rates will
affect the Fund’s NAV, the value of dividends and interest earned and gains and losses realized on the sale of securities. Because
the NAV for the Fund is determined on the basis of U.S. dollars, the Fund may lose money by investing in a foreign security if the local
currency of a foreign market depreciates against the U.S. dollar, even if the local currency value of the Fund’s holdings goes up.
Generally, a strong U.S. dollar relative to these other currencies will adversely affect the value of the Fund’s holdings in foreign
securities.
| 25 |
ArrowMark Financial Corp. | Annual Report |
Foreign
Securities Market Risk — Securities of many non-U.S. companies may be less liquid and their prices more volatile than
securities of comparable U.S. companies. Securities of companies traded in many countries outside the U.S., particularly emerging markets
countries, may be subject to further risks due to the inexperience of local investment professionals and financial institutions, the possibility
of permanent or temporary termination of trading and greater spreads between bid and asked prices of securities. In addition, non-U.S.
stock exchanges and investment professionals are subject to less governmental regulation, and commissions may be higher than in the United
States. Also, there may be delays in the settlement of non-U.S. stock exchange transactions.
Disclosure
About Derivative Instruments and Hedging Activities — The following tables provide quantitative disclosures about fair
value amounts of, gains and losses on, the Fund’s derivative instruments as of December 31, 2023.
The
following table lists the fair values of the Fund’s derivative holdings as of December 31, 2023 grouped by contract type and
risk exposure category.
| Derivative Type |
|
Balance Sheet
Location |
|
Equity
Contracts |
|
|
Foreign
Currency
Contracts |
|
|
Total |
|
| |
|
|
|
|
|
|
|
|
|
|
|
| Asset Derivatives |
| Forward foreign currency contracts |
|
Unrealized appreciation on forward foreign currency contracts |
|
$ |
— |
|
|
$ |
281,257 |
|
|
$ |
281,257 |
|
| Total Value - Assets |
|
|
|
$ |
— |
|
|
$ |
281,257 |
|
|
$ |
281,257 |
|
| Liabilities Derivatives |
| Forward Foreign Currency Contracts |
|
Unrealized depreciation on forward foreign currency contracts |
|
$ |
— |
|
|
$ |
(30,593 |
) |
|
$ |
(30,593 |
) |
| Total Value - Liabilities |
|
|
|
$ |
— |
|
|
$ |
(30,593 |
) |
|
$ |
(30,593 |
) |
The
following table lists the amounts of realized gains or losses included in net increase in net assets resulting from operations for the
year ended December 31, 2023, grouped by contract type and risk exposure.
| Derivative Type |
|
Income
Statement
Location |
|
Equity
Contracts |
|
|
Foreign
Currency
Contracts |
|
|
Total |
|
| |
|
|
|
|
|
|
|
|
|
|
|
| Realized Gain (Loss) |
| Forward
Foreign Currency Contracts |
|
Net realized loss from forward
foreign currency contracts |
|
$ |
— |
|
|
$ |
(4,246,221 |
) |
|
$ |
(4,246,221 |
) |
| Total Realized Gain (Loss) |
|
|
|
$ |
— |
|
|
$ |
(4,246,221 |
) |
|
$ |
(4,246,221 |
) |
The
following table lists the amounts of change in unrealized appreciation (depreciation) included in net increase in net assets resulting
from operations for the year ended December 31, 2023, grouped by contract type and risk exposure.
| Derivative Type |
|
Income
Statement
Location |
|
Equity
Contracts |
|
|
Foreign
Currency
Contracts |
|
|
Total |
|
| |
|
|
|
|
|
|
|
|
|
|
|
| Change in appreciation (depreciation) |
| Forward
Foreign Currency Contracts |
|
Net change in unrealized appreciation
on forward foreign currency contracts |
|
$ |
— |
|
|
$ |
648,915 |
|
|
$ |
648,915 |
|
| Total change in appreciation |
|
|
|
$ |
— |
|
|
$ |
648,915 |
|
|
$ |
648,915 |
|
Note
3 — Investment Advisory Fee and Other Fee Arrangements
ArrowMark
Asset Management, LLC, serves as investment advisor to AMFC pursuant to a management agreement with AMFC (the “Management Agreement”).
For its services as the investment advisor, AMFC pays the Advisor a fee at the annual rate of 1.75% of managed assets. AMFC will pay the
management fee quarterly in arrears, and it will be equal to 0.4375% (1.75% annualized) of our managed assets at the end of such quarter,
including cash and cash equivalents and assets purchased with borrowings.
| |
Annual Report | ArrowMark
Financial Corp. |
26 |
In
addition, for the year ended December 31, 2023, the Advisor reimbursed the Fund $70,994 for expenses related to Investor Relations
Fees, representing approximately 0.05% of net assets.
AMFC
currently pays each Director who is not an officer or employee of the Advisor a fee of $55,000 per annum, plus $1,500 for each in-person
meeting of the Board of Directors or committee meeting. The chairman of AMFC’s audit committee, nominating committee and the Lead
Independent Director are each paid an additional $10,000 per year. Directors do not receive any pension or retirement plan benefits and
are not part of any profit sharing plan. Interested Directors do not receive any compensation from AMFC. AMFC has incurred $348,973 of
Directors fees for the year ended December 31, 2023.
Note
4 — Purchases and Sales and Redemptions of Securities
For
the year ended December 31, 2023, (i) the cost of purchases was $31,569,865 (ii) the sales and redemptions of securities
was $39,080,774.
Note
5 — Federal Tax Information
The
Company intends to operate so as to qualify to be taxed as a RIC under Subchapter M of the Internal Revenue Code and, as such, to not
be subject to federal income tax on the portion of its taxable income and gains distributed to stockholders. To qualify for RIC tax treatment,
AMFC is required to distribute at least 90% of its investment company taxable income, as defined by the Code.
Because
federal income tax regulations differ from accounting principles generally accepted in the United States, distributions in accordance
with tax regulations may differ from net investment income and realized gains recognized for financial reporting purposes. Differences
may be permanent or temporary. Permanent differences are reclassified among capital accounts in the financial statement to reflect their
tax character. Temporary differences arise when certain items of income, expense, gain or loss are recognized at some time in the future.
Differences in classification may also result from the treatment of short-term gains as ordinary income for tax purposes.
AMFC
has followed the authoritative guidance on accounting for and disclosure of uncertainty in tax positions, which requires AMFC to determine
whether a tax position is more likely than not to be sustained upon examination, including resolution of any related appeals or litigation
processes, based on the technical merits of the position. AMFC has determined that there was no effect on the financial statements from
following this authoritative guidance. In the normal course of business, AMFC is subject to examination by federal, state and local jurisdictions,
where applicable, for tax years for which applicable statutes of limitations have not expired.
In
order to present net asset components on the Statement of Assets and Liabilities that more closely represent their tax character, certain
reclassifications are made to the net asset components. Net assets, net investment income and net realized gains were not affected by
these adjustments. For the year ended December 31, 2023, these adjustments increased distributable earnings by $360,470 and decreased
paid-in capital by $360,470. The primary reasons for this reclassification relates to a reclass of capital gain to ordinary income, disallowed
expenses, redesignation of dividends paid and fund level return of capital.
| 27 |
ArrowMark Financial Corp. | Annual Report |
As of December 31, 2023, the components of distributable
earnings on a tax basis were as follows:
| Capital Loss Carryforwards |
|
$ |
(5,090,959 |
) |
| Unrealized Depreciation* |
|
|
(7,114,901 |
) |
| Undistributed Ordinary Income |
|
|
12,261,646 |
|
| Other |
|
|
(3,911,862 |
) |
| Total |
|
$ |
(3,856,076 |
) |
* Includes unrealized depreciation on foreign currency
translations.
For the year ended December 31, 2023, the tax
character of distributions paid by the Company was $12,220,585 of ordinary income dividends and $2,987,081 of long-term capital gains.
For the year ended December 31, 2022, the tax character of distributions paid by the Company was $11,702,625 of ordinary income dividends.
Distributions from net investment income and short-term capital gains are treated as ordinary income for federal tax purposes.
The Company declared a $0.39 per share
dividend on March 8, 2023 and June 9, 2023, a $0.45 per share dividend on September 11, 2023, a $0.42 per share long-term
capital gains distribution on September 15,2023, and a $0.55 per share dividend on December 8, 2023, which was paid on March 31,
2023, June 28, 2023, September 29, 2023, October 27, 2023 and January 5, 2024, respectively.
At December 31, 2023, the federal
tax cost, aggregate gross unrealized appreciation and depreciation of securities held by AMFC were as follows:
| Federal tax cost |
|
$ |
203,769,551 |
|
| Gross unrealized appreciation |
|
|
2,780,453 |
|
| Gross unrealized depreciation |
|
|
(9,924,908 |
) |
| Net unrealized depreciation |
|
$ |
(7,144,455 |
) |
Pursuant to federal income tax rules applicable
to regulated investment companies, AMFC may elect to treat certain capital losses up to and including December 31 as occurring on
the first day of the following tax year. For the period after October 31, 2023 and ending December 31, 2023, any amount of losses
elected within the tax year will not be recognized for federal income tax purposes until 2024. For the year ended December 31, 2023,AMFC
had no ordinary income or long-term capital loss deferrals.
Accumulated capital losses represent
net capital loss carry forwards as of December 31, 2023 that may be available to offset future realized capital gains and thereby
reduce future capital gains distributions. AMFC is permitted to carry forward capital losses incurred for an unlimited period. Additionally,
capital losses that are carried forward will retain their character as either short-term or long-term capital losses. For the year ended
December 31, 2023, AMFC had capital loss carryforwards of $5,090,959, of which $723,044 are short-term losses and $4,637,915 are
long-term losses..
Note 6 — Risk Considerations
Risks are inherent in all investing.
The following summarizes some, but not all, of the risks that should be considered for the Company. For additional information about the
risks associated with investing in the Company, please see the Company’s prospectus as well as other Company regulatory filings.
Investment and Market Risk
— An investment in the Company’s common shares (“Common Shares”) is subject to investment risk, including
the possible loss of the entire principal invested. Common Shares at any point in time may be worth less than the original investment,
even after taking into account the reinvestment of Company dividends and distributions. The Company expects to utilize leverage, which
will magnify investment risk.
Preferred and Debt Securities
Risk — Preferred and debt securities in which the Company invests are subject to various risks, including credit risk,
interest rate risk, call/prepayment risk and reinvestment risk. In addition, preferred securities are subject to certain other risks,
including deferral and omission risk, subordination risk, limited voting rights risk and special redemption rights risk.
| Annual Report | ArrowMark Financial Corp. |
28 |
Credit Risk —
The Company is subject to credit risk, which is the risk that an issuer of a security may be unable or unwilling to make dividend, interest
and principal payments when due and the related risk that the value of a security may decline because of concerns about the issuer’s
ability or willingness to make such payments.
Leverage Risk
— The use of leverage by the Company can magnify the effect of any losses. If the income and gains from the securities and investments
purchased with leverage proceeds do not cover the cost of leverage, the return on the Common Shares will be less than if leverage had
not been used. Moreover, leverage involves risks and special considerations for holders of Common Shares including the likelihood of greater
volatility of net asset value and market price of the Common Shares than a comparable portfolio without leverage, and the risk that fluctuations
in interest rates on reverse repurchase agreements, borrowings and short-term debt or in the dividend rates on any preferred shares issued
by the Company will reduce the return to the holders of Common Shares or will result in fluctuations in the dividends paid on the Common
Shares. There is no assurance that a leveraging strategy will be successful. See Note 7 for additional information on leverage.
Call/Prepayment and Reinvestment
Risk — If an issuer of a security exercises an option to redeem its issue at par or prepay principal earlier than scheduled,
the Company may be forced to reinvest in lower yielding securities. A decline in income could affect the Common Shares’ market price
or the overall return of the Company.
Risks of Concentration in
the Banking industry/Financial Sector — Because the Company concentrates in the banking industry and may invest up
to 100% of its managed assets in the banking industry and financials sector, it will be more susceptible to adverse economic or regulatory
occurrences affecting the banking industry and financials sector, such as changes in interest rates, loan concentration and competition.
Regulatory Risk
— Financial institutions, including community banks, are subject to various state and federal banking regulations that impact how
they conduct business, including but not limited to how they obtain funding. Changes to these regulations could have an adverse effect
on their operations and operating results and our investments. We expect to make long-term investments in financial institutions that
are subject to various state and federal regulations and oversight. Congress, state legislatures and the various bank regulatory agencies
frequently introduce proposals to change the laws and regulations governing the banking industry in response to the Dodd-Frank Act, Consumer
Financial Protection Bureau (the “CFPB”) rulemaking or otherwise. The likelihood and timing of any proposals or legislation
and the impact they might have on our investments in financial institutions affected by such changes cannot be determined and any such
changes may be adverse to our investments. Federal banking regulators recently proposed amended regulatory capital regulations in response
to The Dodd-Frank Wall Street Reform and Consumer Protection Act (the “Dodd-Frank Act”) and Basel III protocols which would
impose even more stringent capital requirements. In the event that a regulated bank falls below certain capital adequacy standards, it
may become subject to regulatory intervention including, but not limited to, being placed into a Federal Deposit Insurance Corporation
("FDIC")-administered receivership or conservatorship. The effect of inadequate capital can have a potentially adverse consequence
on the institution’s financial condition, its ability to operate as a going concern and its ability to operate as a regulated financial
institution and may have a material adverse impact on our investments.
Interest Rate Risk
— The Company is subject to interest rate risk, which is the risk that the preferred and debt securities in which the Company invests
will decline in value because of rising market interest rates.
| 29 |
ArrowMark Financial Corp. | Annual Report |
Convertible Securities/Contingent
Convertible Securities Risk — The market value of convertible securities tends to decline as interest rates increase
and, conversely, tends to increase as interest rates decline. In addition, because of the conversion feature, the market value of convertible
securities tends to vary with fluctuations in the market value of the underlying common stock. Contingent convertible securities provide
for mandatory conversion into common stock of the issuer under certain circumstances. Since the common stock of the issuer may not pay
a dividend, investors in these instruments could experience a reduced income rate, potentially to zero; and conversion would deepen the
subordination of the investor, hence worsening standing in a bankruptcy. In addition, some such instruments have a set stock conversion
rate that would cause a reduction in value of the security if the price of the stock is below the conversion price on the conversion date.
Illiquid and Restricted Securities
Risk — Investment of the Company’s assets in illiquid and restricted securities may restrict the Company’s
ability to take advantage of market opportunities. Illiquid and restricted securities may be difficult to dispose of at a fair price at
the times when the Company believes it is desirable to do so. The market price of illiquid and restricted securities generally is more
volatile than that of more liquid securities, which may adversely affect the price that the Company pays for or recovers upon the sale
of such securities. Illiquid and restricted securities are also more difficult to value, especially in challenging markets. The risks
associated with illiquid and restricted securities may be particularly acute in situations in which the Company’s operations require
cash and could result in the Company borrowing to meet its short-term needs or incurring losses on the sale of illiquid or restricted
securities.
Regulatory Capital Relief
Securities Risk — Regulatory capital relief securities are subject to several risks. In particular, to all capital
securities, banking regulators could change or amend existing banking regulations which could affect the regulatory treatment of regulatory
capital relief securities, where stricter regulation could make regulatory capital relief securities less desirable, or undesirable, for
banks to issue, reducing the supply of new investments. Should an adverse regulatory development occur in the future, it would likely
result in the bank issuer of such securities being able to redeem an investment early, which subjects the Company to reinvestment risk.
Regulatory capital relief securities remain subject to the same sector specific and other risks as any banking-related investment that
the Company may acquire, including, but not limited to, credit risk, interest rate risk, prepayments, adverse changes in market value
or liquidity and the quality of the loans extended by each bank to its clients.
Note 7 — Revolving Credit
Agreement
The Company has utilized a revolving
credit agreement with Texas Capital Bank, located in Dallas, Texas. (the “Credit Agreement” or “Facility”) since
June 9, 2014. The Credit Agreement has been modified since then to reflect changes in borrowing amounts and lending terms.
The most recent modifications are as
follows:
On May 25, 2017, the Company amended
its Credit Agreement to the following terms:
| • |
The cost of the Facility has decreased to a significantly lower credit spread
of LIBOR +2.35%, down from LIBOR +2.85%. |
| • |
The maturity date of the facility has been extended for five years to May 16, 2022. |
| • |
The size of the Facility has been adjusted from $70 million to $62 million. |
| • |
The Company is charged a fee of 0.50% on any undrawn commitment balance. |
| • |
The Company was no longer required to maintain a deposit account of $3.5 million. |
| Annual Report | ArrowMark Financial Corp. |
30 |
On May 25, 2022, the Company amended
the following terms of its Credit Agreement:
| • |
The maturity date of the Facility was extended to May 27, 2025 (which may be extended until May 27,
2026 at the option of the Company). |
| • |
The maximum size of the Facility was increased from
$62 million to $70 million and the cost of the Facility was priced at Secured Overnight Funding Rate ("SOFR") + 2.61%. |
| • |
At closing, two additional lenders joined Texas Capital Bank as the lending group |
The Credit Agreement contains customary
covenants, negative covenants, and default provisions, including covenants that limit the Company’s ability to incur additional
debt or consolidate or merge into or with any person, other than as permitted, or sell, lease, or otherwise transfer, directly or indirectly,
all or substantially all of its assets. The covenants also impose on the Company asset coverage requirements, which are more stringent
than those imposed on the Company by the Investment Company Act, as well as the Company’s policies.
The Facility was rated “A3”
by Moody’s Investor Services as of December 31, 2021. As of January 12, 2022, the rating was Baa1.The Facility remains
secured by substantially all of the assets of the Company.
As of December 31, 2023, $45,000,000
has been committed and drawn and is at fair value. Such borrowings constitute financial leverage. For the year ended December 31,
2023, the average daily loan balance was $44,294,247, a weighted average interest rate of 7.73% with respect to these borrowings, interest
expense of $3,550,396 is included in the Statement of Operations.
Note 8 — Indemnification
In the normal course of business, AMFC
may enter into contracts that provide general indemnifications. AMFC’s maximum exposure under these arrangements is dependent on
claims that may be made against AMFC in the future, and therefore, cannot be estimated; however, based on experience, the risk of material
loss from such claims is considered remote.
Under the AMFC’s organizational
documents, its officers and directors are indemnified against certain liabilities arising out of the performance of their duties to AMFC.
Note 9 — Origination Fees and Other Income
Includes closing fees (or origination
fees or structuring fees) associated with investments in portfolio companies. Such fees are normally paid at closing of the Company’s
investments, are fully earned and non-refundable, and are generally non-recurring. Other Income includes service fees earned from the
Community Funding 2018, LLC. AMFC had closing fee income of $128,660 and other income of $115,511 for the year ended December 31,
2023.
Note 10 — Capital Share Transactions
As of December 31, 2023, 50,000,000
shares of $0.001 par value capital stock were authorized. Of the authorized shares, AMFC is authorized to issue 40,000,000 shares of common
stock and 10,000,000 shares of preferred stock. Prior to commencement of operations on November 13, 2013, AMFC issued 4,001 shares
of common stock. On November 13, 2013,AMFC sold 4,400,000 shares of common stock via an initial public offering at a price of $25.00
per share. On December 3, 2013 and December 11, 2013 AMFC sold an additional 125,000 shares and 167,047 shares, respectively,
of common stock at a public offering price of $25.00 per share pursuant to the underwriters’ exercise of the over-allotment option.
On November 7, 2014, AMFC sold an additional 1,600,000 shares of common stock via an initial public offering at a price of $23.00
per share. On December 2, 2014, AMFC sold an additional 202,000 shares of common stock at a public offering price of $23.00 per share
pursuant to the underwriters’ exercise of the over-allotment option. On July 13, 2021, AMFC sold an additional 492,234 shares
of common stock at a public offering price of $21.89 in a registered direct offering. The purchase price for one share of common stock
was $21.89. The Net Asset Value at the time of the transaction was $21.85. The registered direct offering was accretive to current shareholders.
| 31 |
ArrowMark Financial Corp. | Annual Report |
On October 21, 2021, the Company
announced that it filed a prospectus supplement with the U.S. Securities and Exchange Commission (“SEC”), under which it may
offer and sell up to $30,000,000 of its common stock (the “Common Stock”) from time to time through an “at-the-market”
equity offering program (the “ATM Offering”). Common Stock are offered through B. Riley Securities, Inc. which is serving
as the sales agent.
For the period of October 21, 2021
to December 31, 2021, the Company sold 5,771 shares of its common stock, for total net proceeds to the Company of $127,331. In connection
with such sales, the Company paid a total of approximately $1,299 in sales agent commissions.
For the period January 1, 2022 to
December 31, 2022, the Company sold 21,114 shares of its common stock, for total net proceeds to the Company of $458,370. In connection
with such sales, the Company paid a total of approximately $6,496 in sales agent commissions.
Total shares of Common Stock issued and
outstanding at December 31, 2023 were 7,112,453.
Note 11 — Subsequent Events
Management has evaluated the impact of
all subsequent events on the company and has determined that there were no subsequent events requiring recognition or disclosure in the
financial statements.
| |
Annual
Report | ArrowMark Financial Corp. |
32 |
Auditor’s Report
Report of Independent Registered Public Accounting
Firm
To the Shareholders and Board of Directors
of ArrowMark Financial Corp.
Opinion on the Financial Statements
We have audited the accompanying consolidated
statement of assets and liabilities of ArrowMark Financial Corp. (the “Company”), including the consolidated schedule of investments,
as of December 31, 2023, the related consolidated statement of operations for the year then ended, the consolidated statement of
cash flows for the year then ended, the consolidated statements of changes in net assets for each of the two years in the period then
ended, and the consolidated financial highlights for each of the nine years in the period then ended, and the related notes (collectively
referred to as the “consolidated financial statements”). In our opinion, the financial statements present fairly, in all material
respects, the financial position of ArrowMark Financial Corp. as of December 31, 2023, the results of its operations for the year
then ended, its cash flows for the year then ended, the changes in its net assets for each of the two years in the period then ended,
and the financial highlights for each of the nine years in the period then ended, in conformity with accounting principles generally accepted
in the United States of America.
Basis for Opinion
These consolidated financial statements
are the responsibility of the Company’s management. Our responsibility is to express an opinion on the Company’s consolidated
financial statements based on our audits. We are a public accounting firm registered with the Public Company Accounting Oversight Board
(United States) (“PCAOB”) and are required to be independent with respect to the Company in accordance with the U.S. federal
securities laws and the applicable rules and regulations of the Securities and Exchange Commission and the PCAOB. We have served
as the Company’s auditor since 2015.
We conducted our audits in accordance
with the standards of the PCAOB. Those standards require that we plan and perform the audit to obtain reasonable assurance about whether
the consolidated financial statements are free of material misstatement, whether due to error or fraud. The Company is not required to
have, nor were we engaged to perform, an audit of its internal control over financial reporting. As part of our audits we are required
to obtain an understanding of internal control over financial reporting, but not for the purpose of expressing an opinion on the effectiveness
of the Company’s internal control over financial reporting. Accordingly, we express no such opinion.
Our audits included performing procedures
to assess the risks of material misstatement of the consolidated financial statements, whether due to error or fraud, and performing procedures
that respond to those risks. Such procedures included examining, on a test basis, evidence regarding the amounts and disclosures in the
consolidated financial statements. Our audits also included evaluating the accounting principles used and significant estimates made by
management, as well as evaluating the overall presentation of the consolidated financial statements. Our procedures included confirmation
of securities owned as of December 31, 2023 by correspondence with the custodian, private companies and brokers. We believe that
our audits provide a reasonable basis for our opinion.
TAIT, WELLER & BAKER LLP
Philadelphia, Pennsylvania
February 29, 2024
| 33 |
ArrowMark Financial Corp. | Annual Report |
Dividends and Distributions
Dividends and Distributions
Dividends from net investment income
are declared and paid on a quarterly basis. Distributions of net realized capital gains, if any, will be made at least annually. It is
the Company’s policy to comply with the requirements of the Internal Revenue Code of 1986, as amended, applicable to “regulated
investment companies” or “RICs” and to distribute substantially all of its taxable income to its shareholders. In order
to provide shareholders with a more stable level of dividend distributions, the Company may at times pay out more or less than distributable
income earned in any particular quarter. The Company’s current accumulated but undistributed net investment income, if any, is disclosed
in the Statement of Assets and Liabilities, which comprises part of the financial information included in this report. The character and
timing of dividends and distributions are determined in accordance with federal income tax regulations, which may differ from U.S. GAAP.
Summary of Dividends Declared
in 2023
| Period |
|
Amount
Declared |
|
| 1st Quarter 2023 |
|
$ |
0.39 |
|
| 2nd Quarter 2023 |
|
$ |
0.39 |
|
| 3rd Quarter 2023 |
|
$ |
0.45 |
|
| 4th Quarter 2023 |
|
$ |
0.55 |
|
| |
|
$ |
1.78 |
|
Summary of Distributions Declared in 2023
| Period |
|
Amount
Declared |
|
| 1st Quarter 2023 |
|
$ |
— |
|
| 2nd Quarter 2023 |
|
$ |
— |
|
| 3rd Quarter 2023 |
|
$ |
0.42 |
|
| 4th Quarter 2023 |
|
$ |
— |
|
| |
|
$ |
0.42 |
|
Dividend Reinvestment Plan
We have a common stock dividend reinvestment
plan for our stockholders. Our plan is implemented as an “opt out” dividend reinvestment plan. As a result, if a stockholder
participates in our Automatic Dividend Reinvestment Plan (the “Plan”) all distributions will automatically be reinvested in
additional common stock (unless a stockholder is ineligible or elects otherwise). If a stockholder opts out of the Plan, such stockholder
will receive distributions in cash. If a stockholder holds shares with a brokerage firm that does not participate in the Plan, the stockholder
may not be able to participate in the Plan and any dividend reinvestment may be effected on different terms than those of the Plan.
In the case that newly issued shares
of our common stock are used to implement the Plan, the number of shares of common stock to be delivered to a participating stockholder
shall be determined by (i) dividing the total dollar amount of the dividends payable to such stockholder by (ii) 97% of the
average market prices per share of common stock at the close of regular trading on the NASDAQ Global Select Market for the five trading
days immediately prior to the valuation date to be fixed by the Board of Directors.
In the case that shares repurchased on
the open market are used to implement the Plan, the number of shares of common stock to be delivered to a participating stockholder shall
be determined by dividing (i) the total dollar amount of the dividends payable to such stockholder by (ii) the weighted average
purchase price of such shares.
| Annual Report | ArrowMark Financial Corp. |
34 |
We intend to use primarily newly issued
shares to implement the dividend reinvestment plan (so long as we are trading at a premium to net asset value). If our shares are trading
at a significant enough discount to net asset value and we are otherwise permitted under applicable law to purchase such shares, we intend
to purchase shares in the open market in connection with our obligations under our dividend reinvestment plan. However, we reserve the
right to issue new shares of our common stock in connection with our obligations under the dividend reinvestment plan even if our shares
are trading below net asset value. Automatically reinvesting dividends and distributions does not mean that a stockholder does not have
to pay income taxes due upon receiving dividends and distributions. Capital gains and income are realized although cash is not received
by the stockholder.
For further information or to opt-out
of or withdraw from the Plan, contact the Plan Agent, Computershare Trust Company, N.A. by writing to 250 Royall Street, Canton, Massachusetts
02021.
| 35 |
ArrowMark Financial Corp. | Annual Report |
Senior Securities
Information in the table below
has been audited by Tait, Weller & Baker LLP, the Company’s independent registered public accounting firm. The Company
did not have any senior securities outstanding prior to June 9, 2014. Borrowings under the Credit Facility for each fiscal year commencing
with December 31, 2013, were as follows:
|
Class and
Year(a) |
|
Total Amount
Outstanding(b)
|
|
|
Asset Coverage
Per
Unit(c) |
|
|
Average
Market
Value
(excludes Bank
Loans) |
|
| Credit
Facility |
|
|
|
|
|
|
|
|
|
|
|
| Fiscal 2013 (as of December 31, 2013) |
|
|
N/A |
(d) |
|
|
N/A |
(d) |
|
N/A |
(d) |
| Fiscal 2014 (as of December 31, 2014) |
|
$ |
22,500,000 |
|
|
$ |
7,317 |
|
|
N/A |
|
| Fiscal 2015 (as of December 31, 2015) |
|
$ |
25,000,000 |
|
|
$ |
6,631 |
|
|
N/A |
|
| Fiscal 2016 (as of December 31, 2016) |
|
$ |
61,500,000 |
|
|
$ |
3,253 |
|
|
N/A |
|
| Fiscal 2017 (as of December 31, 2017) |
|
$ |
25,750,000 |
|
|
$ |
6,478 |
|
|
N/A |
|
| Fiscal 2018 (as of December 31, 2018) |
|
$ |
51,000,000 |
|
|
$ |
3,753 |
|
|
N/A |
|
| Fiscal 2019 (as of December 31, 2019) |
|
$ |
17,700,000 |
|
|
$ |
9,090 |
|
|
N/A |
|
| Fiscal 2020 (as of December 31, 2020) |
|
$ |
43,000,000 |
|
|
$ |
4,274 |
|
|
N/A |
|
| Fiscal 2021 (as of December 31, 2021) |
|
$ |
60,000,000 |
|
|
$ |
3,558 |
|
|
N/A |
|
| Fiscal 2022 (as of December 31, 2022) |
|
$ |
55,600,000 |
|
|
$ |
3,656 |
|
|
N/A |
|
| Fiscal 2023 (as of December 31, 2023) |
|
$ |
45,000,000 |
|
|
$ |
4,387 |
|
|
N/A |
|
| (a) |
On June 9, 2014, the Company entered into the Credit Facility, a revolving credit agreement which had
an initial aggregate principal amount of up to $45,000,000 and stated maturity date of June 9, 2019. The interest rate applicable
to borrowings thereunder was generally LIBOR plus an applicable margin of 2.85%. The Credit Facility’s commitment was increased
to $70 million on January 16, 2015.The Credit Facility was further amended
in May 2017 to reflect a single lender, Texas Capital Bank, N.A., a reduced rate of LIBOR +2.35%
and a maximum borrowing amount of $62 million. In May 2022, the Credit Facility was further amended to reflect the addition of two
lenders, a new rate of SOFR +2.61% and a maximum borrowing amount of $70
million. See “Leverage—Effects of Leverage” for a description of our revolving credit agreement. |
| (b) |
Total amount of each class of senior securities outstanding at the end of the period. |
| (c) |
The asset coverage ratio for senior securities representing indebtedness is calculated as our consolidated
total assets, less all consolidated liabilities and indebtedness not represented by senior securities, divided by senior securities representing
indebtedness. This asset coverage ratio is multiplied by $1,000 to determine the Asset Coverage Per Unit. |
| (d) |
No credit facility was in place in 2013. The credit facility was put in place during 2014. See (a). |
| Annual Report | ArrowMark Financial Corp. |
36 |
Share Price Data
The following table sets forth, for the quarters indicated,
the highest and lowest prices on the NASDAQ Global Select Market per share of common stock, and the NAV per share and the premium to or
discount from NAV, on the date of each of the high and low market prices. The table also sets forth the number of Shares traded on the
NASDAQ Global Select Market during the respective quarters.
| |
|
|
|
|
|
|
|
|
|
|
|
|
|
Premium/ |
|
|
|
|
| |
|
|
|
|
|
|
|
NASDAQ |
|
|
(Discount) |
|
|
|
|
| |
|
NAV per Share |
|
|
Global Select |
|
|
to NAV |
|
|
|
|
| |
|
on Date of |
|
|
Market Price |
|
|
on Date of |
|
|
|
|
| During |
|
Market Price(1) |
|
|
Per Share(2) |
|
|
Market Price(3) |
|
|
Trading |
|
| Quarter Ended |
|
High |
|
|
Low |
|
|
High |
|
|
Low |
|
|
High |
|
|
Low |
|
|
Volume(4) |
|
| March 31, 2021 |
|
$ |
21.62 |
|
|
$ |
21.62 |
|
|
$ |
21.00 |
|
|
$ |
19.22 |
|
|
|
(2.9 |
)% |
|
|
(11.1 |
)% |
|
|
1,058,800 |
|
| June 30, 2021 |
|
$ |
21.85 |
|
|
$ |
21.85 |
|
|
$ |
22.20 |
|
|
$ |
19.52 |
|
|
|
1.6 |
% |
|
|
(10.7 |
)% |
|
|
1,279,200 |
|
| September 30, 2021 |
|
$ |
21.86 |
|
|
$ |
21.86 |
|
|
$ |
22.60 |
|
|
$ |
21.07 |
|
|
|
3.4 |
% |
|
|
(3.6 |
)% |
|
|
654,941 |
|
| December 31, 2021 |
|
$ |
21.70 |
|
|
$ |
21.70 |
|
|
$ |
24.19 |
|
|
$ |
21.10 |
|
|
|
11.5 |
% |
|
|
(2.8 |
)% |
|
|
668,890 |
|
| March 31, 2022 |
|
$ |
21.44 |
|
|
$ |
21.44 |
|
|
$ |
21.75 |
|
|
$ |
21.20 |
|
|
|
1.4 |
% |
|
|
(1.1 |
)% |
|
|
701,814 |
|
| June 30, 2022 |
|
$ |
20.94 |
|
|
$ |
20.94 |
|
|
$ |
19.69 |
|
|
$ |
19.07 |
|
|
|
(6.0 |
)% |
|
|
(8.9 |
)% |
|
|
753,477 |
|
| September 30, 2022 |
|
$ |
20.74 |
|
|
$ |
20.74 |
|
|
$ |
17.40 |
|
|
$ |
16.86 |
|
|
|
(16.1 |
)% |
|
|
(18.7 |
)% |
|
|
934,517 |
|
| December 31, 2022 |
|
$ |
20.79 |
|
|
$ |
20.79 |
|
|
$ |
17.31 |
|
|
$ |
16.83 |
|
|
|
(16.7 |
)% |
|
|
(19.0 |
)% |
|
|
1,160,000 |
|
| March 31, 2023 |
|
$ |
20.62 |
|
|
$ |
20.62 |
|
|
$ |
18.16 |
|
|
$ |
16.75 |
|
|
|
(11.9 |
)% |
|
|
(18.8 |
)% |
|
|
1,110,000 |
|
| June 30, 2023 |
|
$ |
21.29 |
|
|
$ |
21.29 |
|
|
$ |
17.06 |
|
|
$ |
16.63 |
|
|
|
(19.9 |
)% |
|
|
(21.9 |
)% |
|
|
990,214 |
|
| September 30, 2023 |
|
$ |
21.59 |
|
|
$ |
21.59 |
|
|
$ |
18.01 |
|
|
$ |
17.41 |
|
|
|
(16.6 |
)% |
|
|
(19.4 |
)% |
|
|
1,240,000 |
|
| December 30, 2023 |
|
$ |
21.43 |
|
|
$ |
21.43 |
|
|
$ |
18.31 |
|
|
$ |
18.11 |
|
|
|
(14.6 |
)% |
|
|
(15.5 |
)% |
|
|
851,252 |
|
(1) Based on our computations.
(2) Source: The NASDAQ Global Select Market.
(3) Based on our computations.
(4) Source: Bloomberg.
On December 31, 2023, our per share NAV was $21.43
and our per share market price was $18.16,
representing a 15.26%
discount to such NAV.
We cannot predict whether our common
stock will trade at a premium or discount to NAV in the future. Our issuance of common stock may have an adverse effect on prices for
our common stock in the secondary market by increasing the number of common shares available, which may put downward pressure on the market
price for our common stock.
Shares of closed-end funds frequently
trade at a market price that is less than the value of the net assets attributable to those shares (a “discount”).The possibility
that our shares will trade at a discount from NAV is a risk separate and distinct from the risk that our NAV will decrease. The risk of
purchasing shares of a closed-end fund that might trade at a discount or unsustainable premium is more pronounced for investors who wish
to sell their shares in a relatively short period of time after purchasing them because, for those investors, realization of a gain or
loss on their investments is likely to be more dependent upon the existence of a premium or discount than upon portfolio performance.
Our shares are not redeemable at the request of stockholders. We may repurchase our shares in the open market or in private transactions,
although we have no present intention to do so. Stockholders desiring liquidity may, subject to applicable securities laws, trade their
shares on the NASDAQ Global Select or other markets on which such shares may trade at the then current market value, which may differ
from the then current NAV.
| 37 |
ArrowMark Financial Corp. | Annual Report |
Fee
Table and Example
The
following table is intended to assist you in understanding the costs and expenses that an investor in shares of our common stock will
bear, directly or indirectly. Other expenses are estimated and may vary. Except where the context suggests otherwise, whenever the Company’s
prospectus contains a reference to fees or expenses paid by “you” or “us” or that “we” will pay fees
or expenses, stockholders will indirectly bear such fees or expenses. We caution you that certain of the indicated percentages
in the table below indicating annual expenses are estimates and may vary.
|
Stockholder
Transaction Expenses (as a percentage of offering price): |
|
|
|
| Sales Load(1) |
|
|
2.00 |
% |
| Offering
Expenses(2) |
|
|
0.11 |
% |
| Dividend
Reinvestment Plan Expenses(3) |
|
|
None |
|
| Total
Stockholder Transaction Expenses |
|
|
2.11 |
% |
|
Annual
Expenses (as
a percentage of net assets attributable to common stock): |
|
|
|
|
| Management Fees(4) |
|
|
2.63 |
% |
| Interest
payments on borrowed funds(5) |
|
|
3.71 |
% |
| Other
Expenses (estimated for the current fiscal year)(7) |
|
|
2.01 |
% |
| Total
Annual Expenses(8) |
|
|
8.35 |
% |
| (1) |
In the event that the securities
to which the Company’s prospectus relates are sold to or through underwriters or agents, a corresponding prospectus supplement will
disclose the applicable sales load. |
| (2) |
The Company’s related
prospectus supplement will disclose the estimated amount of total offering expenses (which may include offering expenses borne by third
parties on our behalf), the offering price and the offering expenses borne by us as a percentage of the offering price. |
| (3) |
The expenses associated
with the administration of our dividend reinvestment plan are included in “Other Expenses.” Participants in the dividend reinvestment
plan that instruct the plan administrator to sell shares obtained under the plan may be accessed a $15 transaction fee by the plan administrator
and the proceeds of such sale will be net of brokerage commissions, fees and transaction costs. For more details about the plan, see “Dividend
Reinvestment Plan" see page 33. |
| (4) |
For the purposes of calculating
our expenses, we have assumed the maximum contractual management fee of 1.75% of Managed Assets. See “Investment Advisory Fee and
Other Fee Arrangements.” see note 3 |
| (5) |
We entered into a revolving
credit agreement on June 9, 2014. Interest expense assumes that leverage will represent approximately 30% of our Managed Assets (as
defined under “Management—Management Agreement — Management Fee”) - see note 7, and charge interest or involve
payment at a rate set by an interest rate transaction at the rate of 7.97% as of December 31, 2023. We have assumed for purposes
of these expense estimates that we will utilize leverage for the entire year. |
| (6) |
Includes fees and expenses
of approximately 0.00% incurred indirectly as a result of investment in shares of one or more “Acquired Funds,” which include
(i) investment companies, or (ii) companies that would be an investment company under Section 3(a) of the 1940 Act
except for exceptions under Sections 3(c)(1) and 3(c)(7) under the 1940 Act. |
| (7) |
Pursuant to the management
agreement, our Adviser furnishes us, or arranges for the furnishing of office facilities and clerical and administrative services necessary
for our operation (other than services provided by our custodian, accounting agent, administrator, dividend and interest paying agent
and other service providers). We bear all expenses incurred in our operations, and we will bear the expenses related to any future offering.
“Other
Expenses” above includes all such costs not borne by our Adviser, which may include but are not limited to overhead costs of our
business, commissions, fees and expenses connected with our investments and auditing, accounting and legal expenses, and Acquired Fund
Fees and Expenses. |
| (8) |
Total
Annual Expenses may not correlate to the ratio of expenses to average net assets disclosed in the Company’s annual and semi-annual
reports to stockholders in the financial highlights table, which reflects operating expenses of the Company and does not include “Acquired
Fund” fees and expenses. For the year ended December 31, 2023, the Advisor voluntarily reimbursed the Fund $70,994 for expenses
related to Investor Relations Fees. |
| Annual
Report | ArrowMark Financial Corp. |
38 |
Example
The
following example demonstrates the hypothetical dollar amount of total cumulative expenses that would be incurred over various periods
with respect to a hypothetical investment in our common stock. These amounts are based upon the assumption that our annual operating expenses
remain at the levels set forth in the table above and that the annual return on investments before fees and expenses is 5%.
| |
|
|
1
Year |
|
3
Years |
|
|
5
Years |
|
|
10
Years |
|
| You
would pay the following expenses on a $1,000 investment, assuming a 5% annual return: |
|
$ |
101 |
|
$ |
254 |
|
|
$ |
397 |
|
|
$ |
714 |
|
The
purpose of the table and example above is to assist you in understanding the various costs and expenses that an investor in any future
offering will bear directly or indirectly. The example and the expenses in the tables above should not be considered a representation
of our future expenses, and actual expenses may be greater or less than those shown.
Moreover,
while the example assumes, as required by the SEC, a 5% annual return, our performance will vary and may result in a return greater or
less than 5%. In addition, while the example assumes reinvestment of all distributions at NAV, participants in our dividend reinvestment
plan may receive common stock valued at the market price in effect at that time. This price may be at, above or below NAV. See “Dividend
Reinvestment Plan” for additional information regarding our dividend reinvestment plan.
| 39 |
ArrowMark
Financial Corp. | Annual Report |
Tax
Information
For
federal income tax purposes, the following information is furnished with respect to the distributions of the Company, if any, paid during
its taxable year ended December 31, 2023.
1.90%
of ordinary income dividends paid qualify for the corporate dividends-received deduction.
Under
the Jobs and Growth Tax Relief Reconciliation Act of 2003 (the “Act”), 1.90% of ordinary dividends paid during the fiscal
year ended December 31, 2023 are designated as "qualified dividend income,” as defined in the Act, and are subject to
reduced tax rates.
Eligible
shareholders were mailed a 2023 Form 1099-DIV in early 2024.This reflected the tax character of all distributions paid in calendar
year 2023.
Additional
Information
Availability
of Quarterly Schedule of Investments
The
Company files their complete schedule of portfolio holdings with the SEC for the first and third quarters of each fiscal year on Form N-PORT.
The Company’s Form N-PORT is available on the SEC’s website at http://www.sec.gov. The Company’s Form N-PORT
may also be obtained upon request and without charge by calling Investor Relations (877) 855-3434 or on the Company’s website at
ir.arrowmarkfinancialcorp.com.
Availability
of Proxy Voting Policies and Procedures
A
description of the policies and procedures that the Company uses to determine how to vote proxies relating to portfolio securities is
available (1) without charge, upon request, by calling Investor Relations (877) 855-3434; (2) at ir.arrowmarkfinancialcorp.com;
and (3) on the SEC’s website at http://www.sec.gov.
Availability
of Proxy Voting Record
Information
about how the Company voted proxies relating to securities held in the Company’s portfolio during the Annual period ended June 30
is available upon request and without charge (1) at ir.arrowmarkfinancialcorp.com or by calling Investor Relations (877) 855-3434
and (2) on the SEC’s website at http://www.sec.gov.
| Annual
Report | ArrowMark Financial Corp. |
40 |
Results
of June 16, 2023 Stockholders Meeting
The
annual meeting of Stockholders of ArrowMark Financial Corp. (“the Company”) was held on June 16, 2023.A description of
the proposal and number of shares voted at the Meeting are as follows:
Proposal
1:
The
undersigned appointed Inspector of Election for the Annual Meeting of Stockholders of ArrowMark Financial Corp. held on June 16,
2023, hereby reports the voting as follows:
| |
|
Voted
For |
|
|
Votes
Withheld |
|
| Emil
W. Henry, Jr |
|
|
5,696,428 |
|
|
|
171,486 |
|
| Karen
L. Reidy |
|
|
5,214,413 |
|
|
|
653,501 |
|
| 41 |
ArrowMark
Financial Corp. | Annual Report |
Board
Approval of the Management Agreement
On
December 7, 2023 the Company’s Board of Directors (the “Board”), including those Directors who are not “interested
persons” as such term is defined in the Investment Company Act of 1940 (“Independent Directors”), unanimously approved
the continuation of the management agreement (the “Management Agreement”) between the Company and its investment adviser,
ArrowMark Asset Management, LLC (the “Adviser” or “ArrowMark”) for an additional one-year period.
Prior
to approval of the continuation of the Management Agreement, the Directors requested from the Adviser, and received and evaluated, materials
and information relating to the Adviser and the performance of its obligations under the Management Agreement. In an executive session
of the Independent Directors, the Independent Directors reviewed the proposed continuation of the Management Agreement with counsel who
is independent of the Adviser, who advised on the relevant legal standards.
Nature,
Quality and Extent of Services. Based on the information provided by the Adviser, the Independent Directors concluded that (i) the
nature, extent and quality of the services provided by the Adviser are appropriate and consistent with the terms of the Management Agreement,
(ii) the quality of those services has been consistent with industry norms, (iii) the Company is likely to benefit from the
continued provision of those services by the Adviser, (iv) the Adviser has sufficient personnel, with the appropriate education and
experience, to serve the Company effectively and has demonstrated its continuing ability to attract and retain qualified personnel, and
(v) the satisfactory nature, extent, and quality of services currently provided to the Company and its stockholders is likely to
continue. In addition, the Board noted the Adviser’s expertise in, and numerous relationships with investment professionals within,
the banking industry in which the Company concentrates its investment activity, is likely to benefit the Company and its stockholders.
Investment
Performance. The Independent Directors reviewed and considered the Company’s performance based on market price and net asset
value versus the performance of the (1) Bloomberg U.S. Aggregate Total Return Value Bond Index (the “Aggregate Total Return
Value Bond Index”) and (2) the Bloomberg US High Yield 2% Issuer Capped Index (the “U.S. High Yield Index”) since
March 31, 2020, the quarter end nearest to the date ArrowMark’s engagement as the Company’s manager commenced) (“inception”)
through September 30, 2023, the nine months ended September 30, 2023, the 12 months ended December 31, 2022, and the three
years ended September 30, 2023. They also reviewed market price performance for the period February 12, 2020 to September 30,
2023.
The
Independent Directors noted that the indices were selected by the Adviser for comparison purposes because the indices’ constituents
had similar characteristics to those securities in which the Company may invest but acknowledged that no index was likely to correspond
to the Company’s holdings in light of the Company’s unique investment strategy.
The
Independent Directors noted that: (a) based on net asset value, the Company outperformed the indices for the nine month period ended
September 30, 2023, the one-year period ended December 31, 2022, the three-year period ended September 30, 2023 and since
inception through September 30, 2023; and (b) based on market price, the Company outperformed the indices for the nine month
period ending September 30, 2023, the three year period ending September 30, 2023, and the period since inception ending September 30,
2023; the Independent Directors also noted that the Company underperformed the indices for the year ended December 31, 2022, and
underperformed the Aggregate Total Return Value Bond Index but outperformed the U.S. High Yield Index for the period of February 12,
2020 to September 30, 2023.
| |
Annual Report
| ArrowMark Financial Corp. |
42 |
The
Independent Directors considered the overall investment performance of the Adviser and the Company since the Adviser was appointed the
Company’s investment adviser in February 2020.The Independent Directors reviewed and considered the Company’s performance
relative to a comparative peer group (the “Peer Group”), consisting of both business development companies (“BDCs”)
and registered closed-end investment companies (“CEICs”) that operate in a similar manner as the Company noting, however,
the limited usefulness of such information in light of the Company’s unique investment strategy and industry focus.
The
Independent Directors also noted their review and evaluation of the Company’s investment performance on an on-going basis throughout
the year. The Independent Directors considered the consistency of performance results and the short-term and long-term performance of
the Company and recognized that such performance was affected by, among other things, issuer prepayment and calls and the time lag required
for the initial deployment and subsequent redeployments of assets. The Board considered that the impact COVID-19 may have affected financial
markets during this period. The Board concluded that the performance of the Company and the Adviser represented satisfactory performance
in light of the Company’s investment objective and strategy.
Cost
of Services. The Independent Directors considered the costs of the services provided by the Adviser, the compensation and benefits
received by the Adviser in providing services to the Company, as well as the Adviser’s profitability. The Independent Directors
were provided with and had reviewed the certain unaudited financial information of the Adviser for the six months ended June 30,
2023 and the year ended December 31, 2022. The Independent Directors concluded that the Adviser’s fees and profits derived
from its relationship with the Company in light of the Company’s expenses were reasonable in relation to the nature and quality
of the services provided, taking into account the fees charged by other investment advisers of CEICs and BDCs in the Peer Group. The Independent
Directors noted that the Company’s management fee was equal to median of the peer group, and below the median management fees charged
by the Company’s peer group when taking into consideration performance fees charged by certain BDCs in the peer group. The Board
noted that for the fiscal year ended December 31, 2022, the Company’s expense ratio was significantly lower than the median
and average expense ratios of the peer group. The Independent Directors concluded that the overall expense ratio was reasonable, taking
into account the size of the Company, the quality of services provided by the Adviser, and the investment performance of the Company.
On the basis of these considerations, together, with the other information they considered, the Independent Directors determined that
the advisory fee is reasonable in light of the services provided under the Management Agreement.
Economies
of Scale. The Independent Directors discussed and considered the extent to which economies of scale would be realized as the Company
grows, and whether the advisory fee levels currently reflect economies of scale for the benefit of stockholders. The Independent Directors
determined that economies of scale could be achieved at higher asset levels for the Company to the benefit of Company stockholders as
fixed expenses are spread over a larger asset base. The Independent Directors noted that the while the Company has an effective shelf
registration statement in place, opportunities for asset growth by CEICs can be limited.
The
Independent Directors also noted the high level of diligence the Independent Directors exercised throughout the year in evaluating the
Adviser, and the extensive information provided with respect to the Adviser’s performance and the Company’s expenses on a
quarterly basis. The Independent Directors considered whether any events have occurred that would constitute a reason for the Independent
Directors not to renew the Management Agreement and determined that there were none.
| 43 |
ArrowMark Financial
Corp. | Annual Report |
|
After
the executive session of the Independent Directors, the Independent Directors reviewed with the Board as a whole each of the determinations
made by the Independent Directors during the executive session. The Board concluded that the investment advisory fee rate under the Management
Agreement is reasonable in relation to the services provided and that continuation of the Management Agreement is in the best interests
of the stockholders of the Company. The Directors also concluded that the investment advisory fees are at acceptable levels in light of
the quality of services provided to the Company. On these bases, the Directors concluded that the investment advisory fees for the Company
under the Management Agreement are reasonable. In arriving at their decision, the Directors did not identify any single matter as controlling,
but made their determination in light of all the circumstances.
| |
Annual Report
| ArrowMark Financial Corp. |
44 |
Management
Board of Directors
and Executive Officers
Our business and affairs are
managed under the direction of the board of directors. Accordingly, the board of directors provides broad supervision over our affairs,
including supervision of the duties performed by the Advisor. The Advisor is responsible for our day-to-day operations. The names, ages
and addresses of our directors and officers and specified employees of the Advisor, together with their principal occupations and other
affiliations during the past five years, are set forth below. Each director and officer will hold office for the term to which he is elected
and until his successor is duly elected and qualifies, or until he resigns or is removed in the manner provided by law. Unless otherwise
indicated, the address of each director is c/o ArrowMark Financial Corp., 100 Fillmore Street, Suite 325, Denver, CO 80206. The board
of directors will initially consist of three directors who are not “interested persons” (as defined in the Investment Company
Act) of the Advisor or its affiliates and two directors who are “interested persons. ”The directors who are not interested
persons are also independent pursuant to the NASDAQ stock exchange listing standards, and we refer to them as “independent directors.”
We refer to the directors who are “interested persons” (as defined in the Investment Company Act) are referred to below as
“interested directors.” Under our certificate of incorporation, the board is divided into three classes. Each class of directors
will hold office for a three-year term. However, the initial members of the three classes have initial terms of one, two and three years,
respectively. At each annual meeting of our stockholders, the successors to the class of directors whose terms expire at such meeting
will be elected to hold office for a term expiring at the annual meeting of stockholders held in the third year following the year of
their election and until their successors are duly elected and qualified.
Interested Directors
| |
|
|
|
|
|
|
|
|
|
Principal |
|
Other |
| |
|
|
|
Position(s) Held with |
|
Term |
|
Term |
|
Occupation(s) |
|
Directorships |
| Name |
|
Age |
|
Company |
|
Served |
|
End |
|
Last
5 Years |
|
Last
5 Years |
| Sanjai Bhonsle |
|
53 |
|
Chairman,
Class III Director |
|
Since February
2020 |
|
2025 |
|
Partner and
Portfolio Manager of ArrowMark Partners, 2012 to Present |
|
Brown (RI)
Management, LLC and Affiliates from 2018–Present |
| |
|
|
|
|
|
|
|
|
|
|
|
|
| Karen Reidy, CFA |
|
56 |
|
Class I Director |
|
Since February 2020 |
|
2026 |
|
Partner and Portfolio
Manager at ArrowMark Partners from 2008–Present |
|
Brown (RI) Management,
LLC and Affiliates from 2018–Present |
| 45 |
ArrowMark Financial Corp. |
Annual Report |
|
| Independent Directors |
|
|
|
|
|
|
|
|
|
| |
|
|
|
|
|
|
|
|
|
|
|
|
| |
|
|
|
|
|
|
|
|
|
Principal |
|
Other |
| |
|
|
|
Position(s) Held |
|
Term |
|
Term |
|
Occupation(s) |
|
Directorships |
| Name |
|
Age |
|
with
Company |
|
Served |
|
End |
|
Last
5 Years |
|
Last
5 Years |
| Emil
Henry |
|
63 |
|
Class
I Director, Lead Independent Director |
|
Since
November 2013 |
|
2026 |
|
CEO
and Founder of Tiger Infrastructure Partners |
|
Director
of Easterly Government Properties, Director of numerous private companies that are Tiger Infrastructure portfolio companies |
| |
|
|
|
|
|
|
|
|
|
|
|
|
| Michael
Stolper |
|
78 |
|
Class
II Director, Chairman of Nominating Committee |
|
Since
February 2020 |
|
2024 |
|
Financial
Advisor at Stolper & Co. from 1975–2017 |
|
Director
of Meridian Funds from 1985-Present; Director of Windowpane Funds (one portfolio) |
| |
|
|
|
|
|
|
|
|
|
|
|
|
| John
S. Emrich |
|
56 |
|
Class
III Director, Chairman of Audit Committee |
|
Since
February 2020 |
|
2025 |
|
Director
of Meridian Funds from 2010–Present; Director of Destra Funds from 2015–Present |
|
Director
of Meridian Funds from 2010–Present; Director of Destra Funds from 2015–Present |
Executive Officers Who are not Directors
| Name |
|
Age |
|
Position(s)
Held with
Company |
|
Term
Served |
|
Principal
Occupation(s)
Last 5 Years |
| Dana
Staggs |
|
51 |
|
President |
|
Since
June 2022 |
|
Managing
Director of ArrowMark Partners. |
| |
|
|
|
|
|
|
|
|
| Patrick
J. Farrell, CPA |
|
63 |
|
Chief
Financial Officer |
|
Since
April 2014 |
|
Chief Financial
Officer of StoneCastle Partners, LLC from April 2014 to Present. |
| |
|
|
|
|
|
|
|
|
| Rick
Grove |
|
55 |
|
Chief Compliance
Officer |
|
Since
February 2020 |
|
Chief Compliance
Officer of ArrowMark Colorado Holdings, LLC.; Chief Compliance Officer of ArrowMark Asset Management, LLC.; Vice President Secretary and
Chief Compliance Officer of Meridian Fund, Inc. |
| |
|
|
|
|
|
|
|
|
| Blake
Rice |
|
46 |
|
Secretary |
|
Since
September 2021 |
|
ArrowMark Partners
General Counsel; former Managing Director and Associate General Counsel at Neuberger Berman. |
| |
|
|
|
|
|
|
|
|
| Kelsey
Auble |
|
33 |
|
Controller |
|
Since
September 2021 |
|
Controller of
ArrowMark Partners; Assistant Treasurer of Meridian Fund, Inc. |
| |
Annual Report | ArrowMark Financial Corp. |
46 |
Biographical Information
Interested Directors
The following sets forth certain
biographical information for our Interested Directors. An Interested Director is an “interested person” as defined in Section 2(a)(19)
of the 1940 Act:
Sanjai Bhonsle.
Sanjai joined ArrowMark Partners in October 2012 and serves as Partner and Portfolio Manager for ArrowMark’s leveraged loan
investments and CLO funds. Prior to joining ArrowMark, he founded MB Consulting Partners in 2009, where he specialized in financial and
operational restructuring advisory to stressed and distressed middle-market companies. With more than 10 years of restructuring experience,
he has led several assignments across various industries. Sanjai was a Senior Portfolio Manager at GSO Capital Partners, a subsidiary
of The Blackstone Group, and member of the Investment and Management Committee (2005-2009). Prior to joining GSO Capital Partners, Sanjai
was an Assistant Portfolio Manager for RBC Capital Partners’ debt investment group and was a member of the Investment Committee
(2001-2005). He also led the group’s restructuring efforts related to distressed investments and represented the firm’s interests
on creditor committees. From 1999-2001, Sanjai was a Senior Investment Analyst at lndosuez Capital Partners. Sanjai received a bachelor’s
degree in Mechanical Engineering from the University of Wisconsin -Madison and an MBA from the Eli Broad Graduate School of Management
at Michigan State University.
Karen Reidy.
Ms. Reidy is a founding Partner and co-manages ArrowMark Partners’ collateralized loan obligation and specialty finance investments
and research analyst team. Prior to founding ArrowMark, Ms. Reidy served as Executive Vice President and Portfolio Manager at Janus
Capital, managing $10 billion for two strategies: Janus Balanced Fund and Janus Core Equity Fund, as well as institutional separate accounts
(2000-2005). Ms. Reidy was also the Assistant Portfolio Manager of the Janus Fund (1998-2000). She joined Janus Capital as an equity
analyst in 1995. Prior to Janus Capital Group, she worked at PricewaterhouseCoopers LLC in the audit and mergers and acquisitions departments.
Ms. Reidy graduated from the University of Colorado with a bachelor’s degree and holds the Chartered Financial Analyst designation.
Independent Directors
The following sets forth certain
biographical information for our Independent Directors. Independent Directors are not “interested persons” of ArrowMark Financial
Corp., as defined by the 1940 Act:
Emil W. Henry, Jr.
Mr. Henry is the CEO and Founder of Tiger Infrastructure Partners, a private equity firm focused on infrastructure investment opportunities.
Prior to founding Tiger Infrastructure Partners, he was Global Head of the Lehman Brothers Private Equity Infrastructure businesses, where
he oversaw global infrastructure investments. In 2005, Mr. Henry was appointed Assistant Secretary of the Treasury for Financial
Institutions by the President of the United States. Until his departure in 2007, he was a key advisor to two Treasury Secretaries on economic,
legislative and regulatory matters affecting U.S. financial institutions and markets. Before joining the Treasury, Mr. Henry was
a partner of Gleacher Partners LLC, an investment banking and investment management firm, where he served as Chairman of Asset Management,
and Managing Director, and where he oversaw the firm’s investment activities. Mr. Henry began the formative part of his career
at Morgan Stanley in the mid-1980s in that firm’s merchant banking arm where he executed management buyouts for Morgan Stanley’s
flagship private equity fund. He holds an M.B.A. from Harvard Business School and a B.A. in Economics from Yale University.
Michael Stolper.
Mr. Stolper provides broad financial advisor, and brokerage business experience serving as the President of Stolper & Co., Inc.,
an investment adviser for over 35 years. Based upon his years of experience, he possesses a keen understanding of the securities industry
and the regulatory framework applicable to it, including the funds. He also holds a Master of Arts degree in Finance.
| 47 |
ArrowMark Financial Corp. |
Annual Report |
|
John S. Emrich.
Mr. Emrich has significant experience in the investment management and financial services industry. Mr. Emrich served as a financial
analyst or portfolio manager for over 13 years for various investment advisory firms. Prior to such positions he also performed business
valuations and appraisal analyses at KPMG Peat Marwick, an accounting firm.
Executive Officers
Who Are Not Directors
Dana Staggs.
Dana Staggs leads the private direct lending strategy at ArrowMark and is a team member of ArrowMark’s Capital Solutions Group where
he sources, structures, and manages non-control private equity and private debt investments. Prior to joining ArrowMark Partners in 2017,
he worked in similar capacities at firms to include Goldman Sachs & Co, Barclays Private Credit Partners LLC and GE Capital.
Dana previously served over 10 years as a surface warfare officer in the U.S. Navy, having attained the rank of Lieutenant Commander.
He earned a Bachelor of Science degree in Physics from the United States Naval Academy and an MBA from The Mason School of Business at
the College of William and Mary.
Patrick J. Farrell.
Chief Financial Officer. Mr. Farrell has over 40 years of hands-on management experience in finance and accounting, specifically
focused on domestic and offshore mutual funds, bank deposit account programs, investment advisory and broker dealer businesses. Prior
to joining StoneCastle Partners as Chief Financial Officer in February 2014, Mr. Farrell was CFO/COO of the Emerging Managers
Group, L.P., a specialty asset management firm focused on offshore mutual funds. Prior to that, Mr. Farrell was CFO at Reserve Management,
where he oversaw all financial activities for the company. Earlier in his career, he held financial positions at Lexington Management,
Drexel Burnham, Alliance Capital and New York Life Investment Management, all focused on investment advisory and mutual fund activities.
He began his career at Peat Marwick Mitchell & Co. Mr. Farrell holds a B.S. in Business Administration-Accounting from Manhattan
College. Mr. Farrell is a Certified Public Accountant in New York State and a member of the American Institute of Certified Public
Accountants.
Rick Grove.
Rick is a Principal and Chief Compliance Officer at ArrowMark Partners. He was previously Vice President and Chief Compliance Officer
for Black Creek Global Advisors (2007-2008). Prior to that position, Rick served as Vice President and Chief Compliance Officer for Madison
Capital Management (2005- 2007),Assistant Vice President and Director of Compliance at Janus Capital Group (1993-2005), and Fund Accountant
for Oppenheimer Funds (1992-1993). Rick graduated from the University of Wyoming with a bachelor’s degree in Accounting.
Blake Rice. Blake
serves as ArrowMark Partners General Counsel. In his role, Rice leads and manages legal and compliance efforts at ArrowMark and ensures
the firm is well-positioned for the continued growth of its business and investment strategies while thoughtfully managing risk. Prior
to ArrowMark, Blake worked at Neuberger Berman where he spent the last 13 years as Managing Director and Associate General Counsel for
the alternatives business. In his role, Blake managed a team that oversaw legal matters for the alternatives business which consists of
private credit, private equity, real estate, infrastructure, and several other alternative strategies. Blake received his B.A. from Trinity
University and his J.D. from the University of Chicago.
Kelsey Auble. Kelsey
serves as Controller for ArrowMark Partners and Assistant Treasurer for Meridian Fund, Inc. Prior to joining ArrowMark, she was a
Supervisor in the Alternative Investment Accounting group at ALPS Fund Services, a third-party fund administrator and distributor (2012-2016).
Kelsey graduated from the University of Colorado with a bachelor’s degree in Accounting.
Additional information regarding
the Directors of ArrowMark Financial Corp. can be found in the Statement of Additional Information, which is available, without charge,
upon request, by calling 1-877-373-6374 and is also available on the Company’s website at ir.arrowmarkfinancialcorp.com
| |
Annual Report | ArrowMark Financial Corp. |
48 |
Shareholder Information (unaudited)
The following information is
a summary of certain information about the Fund and changes that occurred since the effective date of its registration statement on Form N-2
on May 28, 2021. (the “prior disclosure date”). This information may not reflect all of the changes that have occurred
since you purchased the Company’s shares.
There have been no changes
in the Company’s investment objective or principal investment policies since the Company’s December 31, 2022 Annual Report.
INVESTMENT OBJECTIVE, POLICIES AND PRINCIPAL
RISKS
Investment Objectives
ArrowMark Financial Corp.’s
primary investment objective is to provide stockholders with current income, and to a lesser extent, capital appreciation. There can be
no assurance that the Company will achieve the investment objectives.
Investment Strategies
The Company is focused on income
generation, capital preservation, and providing risk-adjusted rates of return. The Company attempts to achieve its investment objective
through investment in preferred equity, debt and subordinated debt, structured notes and securities, convertible securities, regulatory
capital securities and common equity issued or structured by banks and financial institutions including community banks, larger regional,
national and money center banks domiciled in the United States and foreign and global money center banks. (“banking-related securities”).
The Company makes investments that will generally be expected to pay the Company dividends and interest on a current basis and generate
capital gains over time. The Company may seek to enhance the Company’s returns through the use of warrants, options and other equity
conversion features. The Company has a policy to invest, under normal circumstances, at least 80% of the value of its net assets plus
the amount of any borrowings for investment purposes in such banking-related securities.
The Company focuses its portfolio
on making long-term, passive, non-control investments in the banking sector, including “regulatory capital securities” which
are securities issued or structured by banks seeking capital that is treated more favorably under banking regulations than other types
of capital, acquisitions and other refinancing activities regulatory capital securities are issued or structured by a bank to maintain
or reduce its regulatory capital requirements by transferring certain credit risks to investors. Regulatory capital securities may be
structured in a variety of ways and are highly bespoke to the needs of the bank or other deposit-taking institution involved. Regulatory
capital securities may be in the form of structured notes (e.g., credit-linked notes), contingent convertible securities, and other structured
products or transactions. The Company intends to continue to direct investments in numerous issuers differentiated by asset size, business
models and geographies. The Company also may invest in an option strategy that will normally consist of writing (selling) call options
on bank equity securities in the Company’s portfolio (“covered calls”). The Company invests in foreign securities and
the Company is not limited in the amount of assets the Company may invest in such foreign securities.
| 49 |
ArrowMark Financial Corp. |
Annual Report |
|
The Company indirectly invests
in securities issued or structured by banks through structured securities and credit derivatives, including collateralized loan obligations
(CLOs) and credit-linked notes. The Company currently invests in credit-linked notes for which the performance and payment of principal
and interest is tied to a reference asset such as a pool of loans originated by a bank and held on its balance sheet. The Company also
invests in equity and junior debt tranches of CLOs, and other debt securitizations, that are collateralized by a portfolio consisting
primarily of unsecured, subordinated loans made to (and, to a lesser extent, unsecured, subordinated debentures and notes issued by) community
banks or savings institutions or their respective holding companies. The Company may also invest in other securities and instruments that
are related to these investments or that the Adviser believes are consistent with the Company’s investment objectives, including
senior debt tranches of CLOs and loan accumulation facilities. These indirect investments provide exposure to and focus on the same types
of direct investments that the Company makes in banking companies and, accordingly, the Company’s investments in structured securities
(such as credit-linked notes and CLOs) and credit derivatives that provide exposure to the banking industry are considered an investment
in banking securities. The loans or other assets pledged as collateral in these securitizations may not be publicly rated by any rating
agency, and may have greater credit and liquidity risks than investment-grade corporate obligations that are publicly rated. The Company
believes that the use of such instruments complements the Company’s overall strategy and enhance the diversity of the Company’s
holdings.
The Company may also incur
additional leverage to the extent permitted by the Investment Company Act. Although the Company normally seeks to invest substantially
all of the Company’s assets in banking-related securities, the Company reserves the ability to invest up to 20% of the Company’s
assets in other types of securities and instruments.
Additionally, the Company may
take temporary defensive positions that are inconsistent with the Company’s investment strategy in attempting to respond to adverse
market, economic, political or other conditions. If the Company does so, the Company may not achieve the Company’s investment objective.
The Company may also choose not to take defensive positions.
Investment Restrictions
The restrictions listed below
are policies of the Company. Except as described herein, the Company may not alter these policies without the approval of the holders
of a majority of its outstanding shares. For purposes of the foregoing, “a majority of the outstanding shares” means (i) 67%
or more of such shares present at a meeting, if the holders of more than 50% of such shares are present or represented by proxy, or (ii) more
than 50% of such shares, whichever is less. Unless otherwise indicated, all limitations applicable to the Company’s investments
apply only at the time a transaction is entered into. Any subsequent change in the percentage of the Company’s assets invested in
certain securities or other instruments resulting from market fluctuations or other changes in the Company’s total assets, will
not require the Company to dispose of an investment.
| 1. |
The Company may borrow money, make loans or issue senior securities to the fullest extent permitted by the
Investment Company Act, the rules or regulations thereunder or applicable orders of the SEC, as such statute, rules, regulations
or orders may be amended from time to time. |
| |
|
| 2. |
Except with respect to the banking industry, no more than 25% of the Company’s total assets may be invested
in a particular industry or group of industries. Securities issued or guaranteed by the U.S. Government or its agencies or instrumentalities
or securities issued by other investment companies are not considered to represent an industry. |
| |
|
| 3. |
The Company may purchase or sell commodities, commodities contracts, futures contracts and related options,
options, forward contracts or real estate to the fullest extent permitted by the Investment Company Act, the rules or regulations
thereunder or applicable orders of the SEC, as such statute, rules, regulations or orders may be amended from time to time. |
| |
Annual Report | ArrowMark Financial Corp. |
50 |
| 4. |
The Company may underwrite securities to the fullest extent permitted by the Investment Company Act, the rules or
regulations thereunder or applicable orders of the SEC, as such statute, rules, regulations or orders may be amended from time to time. |
The investment restrictions
set forth above limit the Company’s ability to engage in certain practices and purchase securities and other instruments other than
as permitted by, or consistent with, the Investment Company Act. These limitations are based either on the Investment Company Act itself,
the rules or regulations thereunder or applicable orders of the SEC. In addition, interpretations and guidance provided by the SEC
staff may be taken into account, where deemed appropriate by the Company, to determine if a certain practice or the purchase of securities
or other instruments is permitted by the Investment Company Act, the rules or regulations thereunder or applicable orders of the
SEC. As a result, the foregoing investment policies may be interpreted differently over time as the statute, rules, regulations or orders
(or, if applicable, interpretations) that relate to the meaning and effect of these policies change, and no stockholder vote will be required
or sought.
Principal Risks
An investment in the Company’s
securities involves risk, and the Company urges you to consult your tax and legal advisors before making an investment in the Company’s
securities. You could lose some or all of your investment. There can be no assurance that the Company will achieve the Company’s
investment objective.
An investment in the Company’s common stock
involves significant risks, including:
Risks Related to Investing in the Banking
Sector.
The Company’s assets
will be concentrated in the banking industry, potentially exposing the Company to greater risks than companies that invest in multiple
sectors.
● The
Company primarily invests in equity and debt securities issued by banks, subjecting the Company to unique risks.
● All
of the Company’s investments are subject to liquidity risk, but the Company may face higher liquidity risk if the Company invests
in debt obligations and other securities that are unrated and issued by banks that have no corporate rating.
● The
Company expects to keep the Company’s portfolio of securities and investments focused on the bank sector, which would make the Company
more economically vulnerable in the event of a downturn in the banking industry.
● A
large number of banks may fail during times of economic stress.
● The
Company expects to keep the Company’s portfolio of securities and investments focused on the bank sector including community banks
whose business is subject to greater lending risks than larger banks.
| 51 |
ArrowMark Financial Corp. |
Annual Report |
|
Risks Related to Banking Regulations and
Banking Investments Affecting the Company’s Business
● The
banking institutions in which the Company invests, including global money center banks, are subject to substantial regulations that could
adversely affect their ability to operate and the value of the Company’s investments. In addition, geopolitical instability, natural
disasters, including outbreaks of infectious diseases, or in times of significant global market downturns, which may impact the value
of regulatory capital securities or other investments.
● Regulatory
capital securities are subject to several risks. Banking regulators could change or amend existing banking regulations which could affect
the regulatory treatment of regulatory capital securities, where stricter regulation could make regulatory capital securities less desirable,
or undesirable, for banks to issue, reducing the supply of new investments. Should an adverse regulatory development occur in the future,
it would likely result in the bank issuer of such securities being able to redeem an investment early, which subjects the Company to reinvestment
risk. Regulatory capital securities remain subject to the same sector specific and other risks as any banking-related investment that
the Company may acquire, including, but not limited to, credit risk, interest rate risk, currency risk, prepayments, adverse changes in
market value or liquidity and the quality of the loans extended by each bank to its clients.
● The
Company may become subject to adverse current or future banking regulations.
● Ownership
of the Company’s stock by certain types of regulated institutions may subject the Company to additional regulations.
● Investments
in banking institutions and transactions related to the Company’s portfolio investments may require approval from one or more regulatory
authorities.
● If
the Company were deemed to be a bank holding company or thrift holding company, bank holding companies or thrift holding companies that
invest in the Company would be subject to certain restrictions and regulations.
● The
Financial Accounting Standards Board, or FASB, has issued a new credit impairment model, the Current Expected Credit Loss, or CECL model,
which must be implemented by banks and certain other companies beginning in 2021. Under the CECL model, entities subject to the model
will be required to present certain financial assets carried at amortized cost, such as loans held for investment and held-to-maturity
debt securities, at the net amount expected to be collected. The measurement of expected credit losses is to be based on information about
past events, including historical experience, current conditions, and reasonable and supportable forecasts that affect the collectability
of the reported amount. This measurement will take place at the time the financial asset is first added to the balance sheet and periodically
thereafter. This differs significantly from the "incurred loss" model, which delays recognition until it is probable a loss
has been incurred. CECL may create more volatility in the companies in which the Company invests, and this in turn could affect the value
of the Company’s portfolio.
Risks Related to the Company’s Investments
● The
Company’s investments will be subject to dividend and interest rate fluctuations, and the Company is subject to interest rate risk.
In particular, the Company’s investments in subordinated or unsecured debt securities that are perpetual or have maturities in excess
of ten years subject the Company to a high degree of interest rate risk.
● Most
of the Company’s assets will be unrated, illiquid, and their fair value may not be readily determinable. As a consequence, the Company
may be unable to sell such assets at an attractive value for a period of time, if at all. The assets in which the Company invests may
not be publicly rated by any rating agency, and may have greater credit and liquidity risks than investment-grade corporate obligations
that are publicly rated.
| |
Annual Report | ArrowMark Financial Corp. |
52 |
● The
Company’s investments in regulatory capital securities subject the Company to the risks of underlying bank assets.
● Risks
of credit-linked notes include those risks associated with fixed-income instruments and those of the underlying reference instrument or
credit obligation including but not limited to market risk, interest rate risk, credit (default) risk, counterparty risk, valuation risk,
foreign security and foreign currency risk.
● The
Company may acquire CLO equity and junior debt securities that are subordinated to more senior tranches of CLO debt. CLOs present risks
including credit(default), interest rate and prepayment risks. Investors in CLO securities indirectly bear risks of the collateral held
by such CLOs. The prices of CLOs (and, therefore, the prices of the CLOs’ securities) are influenced by the same types of political
and economic events that affect issuers of securities and capital markets generally. CLO interests are generally thinly traded or have
only a limited trading market. CLO securities are typically privately offered and sold, even in the secondary market. As a result, investments
in CLO securities are illiquid and the price at which these securities are sold may be less than the price used to calculate the Company’s
NAV. CLO equity and junior debt securities are typically highly levered and, therefore, the junior debt and equity tranches in which the
Company is currently invested and in which it may invest will be subject to a higher degree of risk of total loss. The loans or other
assets pledged as collateral in a CLO may not be publicly rated by any rating agency, and may have greater credit and liquidity risks
than investment-grade corporate obligations that are publicly rated.
● Foreign
securities may experience greater price volatility and changes in value. Investments denominated in foreign currencies as well as currency
hedge transactions will be subject to fluctuations in value.
● Derivatives
transactions may limit the ’s income or result in losses.
● The
Company may invest in securities rated below investment grade or which are unrated. Securities rated below investment grade and certain
unrated securities are considered to be speculative, “high yield,” or “junk” and are subject to greater market
and credit risks, and accordingly, that the risk of non-payment or default is higher than investment-grade securities. In addition, such
securities may be more sensitive to interest rate changes and more likely to receive early returns of principal in falling rate environments.
Risks Related to the Company’s Use
of Leverage
● The
Company currently has a bank loan to finance investments as a form of leverage. the Company also has authority to issue preferred stock
or engage in reverse repurchase agreements to finance investments.
● Leverage
exaggerates the effects of market downturns or upturns on the NAV and market value of the Company’s common stock, as well as on
distributions to holders of the Company’s common stock.
● Leverage
can also increase the volatility of the Company’s NAV, and expenses related to leverage can reduce the Company’s income.
| 53 |
ArrowMark Financial Corp. |
Annual Report |
|
● In
the case of leverage, if the Company’s assets decline in value so that asset coverage requirements for any borrowings or preferred
stock would not be met, the Company may be prevented from paying distributions, which could jeopardize the Company’s qualification
for pass- through tax treatment, make the Company liable for excise taxes and/or force the Company to sell portfolio securities at an
inopportune time.
● The
use of leverage through investments such as CLO equity or junior debt securities that inherently involve leverage, may magnify the Company’s
risk of loss. CLO equity or junior debt securities are very highly leveraged, and therefore the CLO securities in which the Company is
currently invested and in which the Company intends to invest are subject to a higher degree of loss since the use of leverage magnifies
losses.
● The
Company utilizes a revolving credit agreement with Texas Capital Bank to provide for a maximum borrowing amount of $70 million and a fee
of Secured Overnight Funding Rate (“SOFR”) +2.61%,
with a maturity date of May 2025 (the “Credit Facility”).
● The
Credit Facility imposes asset coverage requirements, which are more stringent than those imposed by the Investment Company Act, or by
the Company’s policies. In addition, the Company agreed not to purchase assets not contemplated by the investment policies and restrictions
in effect when the Credit Facility became effective unless changes to these policies and restrictions are consented to by Texas Capital
Bank.
● The
covenants or guidelines under the Credit Facility could impede the Adviser from fully managing the Company’s portfolio in accordance
with the Company’s investment objectives and policies. Furthermore, non-compliance with such covenants or the occurrence of other
events could lead to the cancellation of the Credit Facility.
● For
as long as the Credit Facility remains in effect, the Company may not incur additional debt under any other facility, except in limited
circumstances.
● The
Credit Facility allows the Company to prepay borrowings under the Credit Facility at any time. The Company does not anticipate that such
guidelines will have a material adverse effect on the holders of the Company’s common stock or on the Company’s ability to
achieve the Company’s investment objectives. The Company may also consider alternative measures of obtaining leverage in the future.
Risks Related to the
Company’s Operations
● The
Company’s performance is highly dependent on the Adviser. The Adviser may rely on assumptions that prove to be incorrect.
● The
Adviser and its affiliates may serve as investment adviser to other funds, investment vehicles and investors, which may create conflicts
of interest not in the best interest of the Company or the Company’s stockholders.
● The
Company may generate low or negative rates of return on capital, and the Company may not be able to execute the Company’s business
plans as expected, if at all.
● The
Company’s business model depends to a significant extent upon strong referral relationships, and the Company’s inability to
maintain or develop these relationships, as well as the failure of these relationships to generate investment opportunities, could adversely
affect the Company’s business.
● If
the Company is unable to source investments effectively, the Company may be unable to achieve the Company’s investment objective.
| |
Annual Report | ArrowMark Financial Corp. |
54 |
● The
Company’s quarterly results may fluctuate.
● The
Company makes distributions to the Company’s stockholders on a quarterly basis. If the amount of any distribution exceeds the Company’s
net investment income or capital gains, then all or a portion of such distribution could constitute a return of capital to stockholders
rather than dividend income for tax purposes. A return of capital distribution has the effect of lowering stockholders’ basis in
their shares, which will result in higher tax liability when the shares are sold, even if such shares have not increased in value or have,
in fact, lost value. In addition to the tax consequences, such a distribution is a return of a shareholder’s own investment, but
distributed net of Company expenses, and will decrease the funds available for investment by the Company.
● Financing
arrangements with lenders or preferred shareholders may limit the Company’s ability to make dividend payments to the Company’s
stockholders.
● The
Company may change the Company’s business strategy and operational policies without stockholder consent (unless stockholder consent
is specifically required by the Investment Company Act), which may result in a determination to pursue riskier business activities.
● Laws
and regulations may prohibit the banks in which the Company invests from paying interest and/or dividends to the Company.
● Legal
and regulatory changes could occur that may adversely affect the Company.
● The
Company may be required to register as a commodity pool operator.
● Market
fluctuations caused by force majeure, terrorism, global pandemics, or certain other acts may adversely affect the Company’s performance.
The recent global outbreak of the COVID-19 virus and the resulting pandemic has disrupted economic markets and the economic impact, duration
and spread of the COVID-19 pandemic remains uncertain at this time. The operational and financial performance of some of the portfolio
banks in which the Company makes investments may be impacted by COVID-19, which may in turn impact the valuation of the Company’s
investments and results of the Company’s operations.
● Changes
in interest rates may affect the Company’s net investment income, reinvestment risk and the probability of defaults of the Company’s
investments.
Risks Related to the
Adviser and/or its Affiliates
● The
Company’s performance is dependent on the Adviser, and the Company may not find a suitable replacement if the management agreement
is terminated.
● The
departure or death of any of the members of senior management of the Adviser or ArrowMark Partners may adversely affect the Company’s
ability to achieve the Company’s business objective; The Company’s management agreement does not require the availability
to the Company of any particular individuals.
● If
the Adviser ceases to be the Company’s manager under the Company’s management agreement, financial institutions that provided
the Company’s credit facilities may not provide future financing to the Company.
● The
Adviser’s liability is limited under the Company’s management agreement, and the Company has agreed to indemnify the Adviser
against certain liabilities.
| 55 |
ArrowMark Financial Corp. |
Annual Report |
|
● There
may be potential conflicts of interest between the Company’s management and the Adviser, on one hand, and the interest of the Company’s
common stockholders, on the other.
● The
Company is limited in the Company’s ability to conduct transactions with affiliates.
● The
Adviser’s investment committee is not independent from its management.
● The
Company may compete with the Adviser’s current and future investment vehicles for access to capital and assets.
● There
may be other conflicts of interest in the Company’s relationship with the Adviser and/or its affiliates that could negatively affect
the Company’s earnings.
● The
Adviser’s management of the Company’s business is subject to the oversight of the Company’s board of directors, but
the Company’s board of directors will not approve each business decision made by the Adviser.
● The
Adviser may be incentivized to incur additional leverage, up to the extent permitted by regulations, even if additional leverage is not
in the best interests of the Company’s stockholders.
Risks Related to Offerings
● The
price for the Company’s common stock may be volatile.
● The
price for the Company’s common stock is subject to market risk.
● Future
offerings of debt securities or preferred stock, which would rank senior to the Company’s common stock upon the Company’s
liquidation, and future offerings of equity securities, which would dilute the Company’s existing stockholders and may be senior
to the Company’s common stock for the purposes of dividend and liquidating distributions, may adversely affect the market value
of the Company’s common stock.
Risks Related to Taxation
● Despite
the Company’s election to be treated as a RIC, the Company may not be able to meet the requirements to maintain an election to be
treated as a RIC.
● The
Company will be subject to corporate-level federal income tax on all of the Company’s income if the Company is unable to maintain
RIC status under Subchapter M of the Code.
● Whether
an investment in a RIC is appropriate for a Non-U.S. Stockholder will depend upon the Non-U.S. Stockholder’s particular circumstances.
| |
Annual Report | ArrowMark Financial Corp. |
56 |
Privacy Notice
ArrowMark Financial Corp. (“we”
or “us”) is committed to maintaining your right to privacy. Protecting the information we receive as part of our relationship
with you is of primary importance to us. Please take the time to read and understand the privacy policies and procedures that we have
implemented to safeguard your nonpublic personal information.
Information We Collect
We must collect certain personally
identifiable financial information about our customers to provide financial services and products. Nonpublic personal information means
personally identifiable financial information and any list, description or other grouping of consumers that is derived using any personally
identifiable financial information that is not publicly available. The personally identifiable financial information that we gather during
the normal course of doing business with you may include:
| 1. |
information we receive from you on applications or other forms; |
| |
|
| 2. |
information about your transactions with us, our affiliates, or others; |
| |
|
| 3. |
information collected through the Internet; and |
| |
|
| 4. |
information we receive from a consumer reporting agency. |
Information We Use
The information that we collect
and store relating to you is primarily used to enable us to provide our services to you in the best possible manner. In addition, we may
use the information for the following purposes:
| 1. |
To provide you with information relating to us; |
| |
|
| 2. |
To provide third parties with statistical information about the users of our website; |
| |
|
| 3. |
To monitor and conduct an analysis of our Website traffic and usage patterns; and |
| |
|
| 4. |
To analyze trends. |
Information We Disclose
We do not disclose any nonpublic
personal information about our customers or former customers to anyone, except as permitted or required by law, or as necessary to provide
services to you. We may disclose all of the information we collect, as described above, to certain nonaffiliated third parties such as
attorneys, accountants, auditors, regulators and persons or entities that are assessing our compliance with industry standards. We enter
into contractual agreements with all nonaffiliated third parties that prohibit such third parties from disclosing or using the information
other than to carry out the purposes for which we disclose the information.
If you have questions or comments
about our privacy practices, please call us at (877) 855-3434.
| 57 |
ArrowMark Financial Corp. |
Annual Report |
|
ArrowMark Financial Corp.
BOARD OF DIRECTORS
| Interested Directors(1) |
Sanjai Bhonsle, Chief Executive
Officer and Chairman of the Board of Directors
Karen Reidy, Director |
| |
| Independent Directors |
John S. Emrich
Emil Henry, Jr.
Michael
Stolper |
| |
| OFFICERS |
| |
| Dana Staggs, President |
Patrick J. Farrell, Chief
Financial Officer
Rick Grove, Chief Compliance Officer
Blake Rice, Secretary |
| Kelsey Auble, Controller |
| |
| INVESTMENT ADVISOR |
| |
ArrowMark
Asset Management, LLC
100 Fillmore Street, Suite 325 |
| Denver,
CO 80206 |
| |
| INDEPENDENT REGISTERED
PUBLIC ACCOUNTING FIRM |
| |
| Tait,
Weller & Baker LLP |
| 50 South
16th Street, Suite 2900 |
| Philadelphia,
PA 19102 |
| |
| TRANSFER AND DIVIDEND
PAYING AGENT AND REGISTRAR |
| |
Computershare
Trust Company, N.A.
250 Royall Street |
| Canton,
MA 02021 |
(1) As defined under the Investment Company Act of 1940,
as amended.
Item 2. Code of Ethics.
| |
(a) |
The registrant (sometimes referred to herein as “Company”), as of the end of the period covered
by this report, has adopted a code of ethics that applies to the registrant’s principal executive officer, principal financial officer,
principal accounting officer or controller, or persons performing similar functions, regardless of whether these individuals are employed
by the registrant or a third party. |
| |
(c) |
There have been no amendments, during the period covered by this report, to a provision of the code of ethics
that applies to the registrant’s principal executive officer, principal financial officer, principal accounting officer or controller,
or persons performing similar functions, regardless of whether these individuals are employed by the registrant or a third party, and
that relates to any element of the code of ethics description. |
| |
(d) |
The registrant has not granted any waivers, including an implicit waiver, from a provision of the code of ethics
that applies to the registrant’s principal executive officer, principal financial officer, principal accounting officer or controller,
or persons performing similar functions, regardless of whether these individuals are employed by the registrant or a third party, that
relates to one or more of the items set forth in paragraph (b) of this item’s instructions. |
| |
(f) |
The registrant posts its code of
ethics referenced in Item 2(a) above on its Internet website at www.ir.arrowmarkfinancialcorp.com. |
Item 3. Audit Committee Financial Expert.
As of the end of the period covered by the report,
the registrant’s board of directors determined that John Emrich qualifies and serves as audit committee financial expert on the
audit committee and is “independent” as defined by Item 3 of Form N-CSR.
Mr. Emrich has significant experience in the investment
management and financial services industry. Mr. Emrich is a Chartered Financial Analyst and served as a financial analyst or portfolio
manager for over 13 years for various investment advisory firms. Prior to such positions, he also performed business valuations an appraisal
analyses at KPMG Peat Marwick, an accounting firm.
Mr. Van Praag has an extensive background in the
financial industry as a JPMorgan Chase executive with over 35 years of experience in banking, commercial lending, cash management, treasury
services and capital markets. Based upon his depth of experience, Mr. Van Praag possesses a keen understanding of the securities
industry and banking-related activity that is of direct relevance to the Company’s investment strategy. He also holds a Master of
Business Administration degree in Banking and Finance.
Item 4. Principal Accountant Fees and Services.
Audit Fees
| |
(a) |
The aggregate fees billed for each of the last two fiscal years for professional services rendered by the principal
accountant for the audit of the registrant's annual financial statements or services that are normally provided by the accountant in connection
with statutory and regulatory filings or engagements for those fiscal years are $45,000 for 2023 and $45,000 for 2022. |
Audit-Related
Fees
(b) The aggregate fees billed in each
of the last two fiscal years for assurance and related services by the principal accountant that are reasonably related to the performance
of the audit of the registrant's financial statements and are not reported under paragraph (a) of this Item are $0 for 2023 and $0
for 2022.
Tax Fees
(c) The aggregate fees billed in each of the last two
fiscal years for professional services rendered by the principal accountant for tax compliance, tax advice, and tax planning are $3,000
for 2023 and $3,000 for 2022. The tax services provided to the registrant were limited to the review and signing of the registrant's tax
returns which are prepared by the registrant's administrator.
All Other Fees
| |
(d) |
The aggregate fees billed in each of the last two fiscal years for products and services provided by the principal
accountant, other than the services reported in paragraphs (a) through (c) of this Item are $0 for 2023 and $0 for 2022. |
| |
(e)(1) |
Audit committee's pre-approval policies and procedures described in paragraph (c)(7) of Rule 2-01
of Regulation S-X. |
The audit committee (“Committee”)
has adopted policies and procedures with regard to the pre-approval of services. Audit, audit-related and tax compliance services provided
to the registrant on an annual basis require specific preapproval by the Committee. The Committee also must approve other non-audit services
provided to the registrant and those non-audit services provided to the Investment Adviser and Fund Service Providers that relate directly
to the operations and the financial reporting of the registrant. Certain of these non-audit services that the Committee believes are (a) consistent
with the SEC’s auditor independence rules and (b) routine and recurring services that will not impair the independence
of the independent accountants may be approved by the Committee without consideration on a specific case-by-case basis (“general
pre-approval”). The term of any general pre-approval is 12 months from the date of the pre-approval unless the Committee provides
for a different period. The Committee is informed of each service approved subject to general pre-approval at the next regularly scheduled
board meeting. At this meeting, an analysis of such services is presented to the Committee for ratification. The Committee may delegate
to the Committee Chairman, or any other Committee member, the authority to approve the provision of and fees for any specific engagement
of permitted non-audit services.
| |
(e)(2) |
None of the services described in Items 4(b) through (d) were approved by the Committee pursuant
to the de minimis exception in paragraph (c)(7)(i)(C) of Rule 2-01 of Regulation S-X. |
| |
(g) |
The aggregate non-audit fees billed by the registrant's accountant for services rendered to the registrant,
and rendered to the registrant's investment adviser (not including any sub-adviser whose role is primarily portfolio management and is
subcontracted with or overseen by another investment adviser), and any entity controlling, controlled by, or under common control with
the adviser that provides ongoing services to the registrant for each of the last two fiscal years of the registrant was $0 for 2023 and
$0 for 2022. |
| |
(h) |
The registrant's audit committee of the board of directors
has considered whether the provision of non-audit services that were rendered to the registrant's investment adviser (not including
any sub-adviser whose role is primarily portfolio management and is subcontracted with or overseen by another investment adviser), and
any entity controlling, controlled by, or under common control with the investment adviser that provides ongoing services to the registrant
that were not pre-approved pursuant to paragraph (c)(7)(ii) of Rule 2-01 of Regulation S-X is compatible with maintaining the
principal accountant's independence. |
Item 5. Audit Committee of Listed Registrants.
| |
(a) |
The registrant has a separately designated audit committee. The members of the audit committee are: John Emrich
and Michael Van Praag. |
Item 6. Investments.
| |
(a) |
Schedule of Investments in securities of unaffiliated issuers as of the close of the reporting period is included
as part of the report to shareholders filed under Item 1(a) of this form. |
Item 7. Disclosure
of Proxy Voting Policies and Procedures for Closed-End Management Investment Companies.
A copy of the Company’s Proxy Voting Policies
and Procedures is attached herewith.
ARROWMARK
FINANCIAL CORP.
PROXY
VOTING PROCEDURES
The
board of directors (the “Board”) of ArrowMark Financial Corp. (the “Company”),
including a majority of the directors that are not “interested persons” of the Company under Section 2(a)(19) of the Investment
Company Act of 1940, as amended, have adopted these proxy voting policies for the Company in substantially the same form as they apply
to all clients of ArrowMark Asset Management LLC (the “Advisor”). Subject to
the Board’s oversight, the implementation of the Company’s proxy voting policy has been delegated to the Advisor. It
is the policy of the Advisor to consider and vote each proxy proposal in the best interests of clients and account beneficiaries with
respect to securities held in the accounts of all clients for whom the Advisor provides discretionary investment management services and
has authority to vote their proxies. The Advisor will make every effort to consult with the portfolio manager and/or analyst covering
the security subject to each proxy.
All
proxy voting decisions made by the Advisor on behalf of the Company will be determined by the Advisor’s Investment Committee and
executed by the Company’s Chief Executive Officer (the “CEO”).
The
Advisor, on behalf of the Company, will vote for routine matters (e.g. the ratification of auditors, etc.) in accordance
with the recommendation of the Advisor’s Investment Committee unless the Advisor determines it has a conflict of interest with respect
to such vote or the Advisor determines that there are other reasons not to vote in accordance with the recommendation of the Advisor’s
Investment Committee.
The
Advisor, on behalf of the Company, will vote or abstain from voting if deemed appropriate, on non-routine matters (e.g.
the election of directors, amendments to governing instruments, compensation proposals, corporate governance proposals, shareholder proposals,
etc.) on a case-by-case basis in a manner it believes to be in the best economic interests of the Company’s stockholders.
Although
the Advisor will generally vote against proposals that may have a negative impact, the Advisor may vote for such a proposal if there is
a compelling long-term reason to do so. The Advisor may determine not to vote a particular proxy if the costs and burdens exceed the benefits
of voting (e.g., when securities are subject to loan or to share blocking restrictions).
The
CEO is responsible for monitoring the Advisor’s actions under this proxy voting policy and for ensuring that:
| |
● |
Proxies are received and
forwarded to the appropriate decision makers; and |
| |
● |
Proxies are voted in a timely
manner upon receipt of voting instructions. |
The
Advisor, on behalf of the Company, is not responsible for voting proxies that it or the Company does not receive, but will make reasonable
efforts to obtain missing proxies.
The
CEO is responsible for implementing and executing procedures designed to identify and monitor potential conflicts of interest that could
affect the proxy voting process including:
| |
● |
Significant relationships
between the Advisor, its affiliates and clients on one hand and the Company on the other; |
| |
● |
Other potential material
business reiationships of the Advisor, its affiliates and clients on one hand and the Company on the other; and |
| |
● |
Material personal and family
relationships of the Advisor, members of the Advisory Committee, its officers, members and directors on one hand and the Company on the
other. |
The
Advisor’s policies and procedures have been designed to identify and properly disclose, mitigate, and/or eliminate applicable conflicts
of interest. Conflicts of interest that involve the Advisor, its affiliates and its officers, directors, members or employees on one hand,
and the Company on the other, will generally be fully disclosed and/or resolved in a way that favors the interests of the Company over
the interests of the Advisor, its affiliates and its officers, directors, members or employees. If an employee of the Advisor believes
that a conflict of interest has not been identified or appropriately addressed, that employee should promptly bring the issue to the attention
of the Advisor’s Chief Compliance Officer.
Conflicts
based on a business relationship with the Advisor or any affiliate will be considered only to the extent that the Advisor has actual knowledge
of such relationships. If the Advisor determines that voting a particular proxy would create a material conflict of interest between
the Advisor’s interests and the interests of clients, the Advisor may:
| |
● |
disclose the conflict to
the client and obtain the client’s consent before voting the proxy; or |
| |
● |
establish an ethical wall
or other informational barrier between the persons involved in the conflict and the persons making the voting decisions. |
| |
B. |
Reporting and Disclosure |
Once
each year, the Advisor on behalf of the Company, or its designee, shall provide the entire voting record of the Company for the past year
electronically in accordance with the posting of such proxy voting records by the Company on Form N-PX. The Advisor may delegate the preparation
and filing of Form N-PX to the Company’s administrator or other service provider.
The
Advisor shall disclose in its Form ADV how other clients can obtain information on how their securities were voted. The Advisor shall
also describe this proxy voting policy and procedures within the Form ADV, along with a disclosure that a client shall be provided a copy
upon request. A description of the proxy voting policy and procedures is also available upon request on the SEC website.
The
Company shall retain records relating to the voting of proxies, including:
| |
1 |
A copy of these proxy voting policy and procedures. |
| |
2 |
A copy of each proxy statement received by the Company
regarding its portfolio securities. |
| |
3 |
A record of each vote cast
by the Advisor on behalf of the Company. |
4 A
copy of each written request by the Company on how the Advisor voted proxies on behalf of its account, and a copy of any written response
by the Advisor.
5
A copy of any document prepared by the Advisor that was material to making a decision regarding how to vote proxies or that memorializes
the basis for the decision.
These
records shall be retained for five (5) years from the end of the fiscal year during which the last entry was made on such record and during
the first two (2) years onsite at the Company’s principal place of business.
Adopted
September 10, 2013
Item 8. Portfolio Managers of Closed-End Management
Investment Companies.
| |
(a)(1) |
Identification of Portfolio Manager(s) or Management Team Members and Description of Role of Portfolio
Manager(s) or Management Team Members |
As
of the filing date of this report, the registrant is managed by a team of investment professionals comprised of Sanjai Bhonsle,
Chief Executive Officer, Karen Reidy, Partner, and Kaelyn Abrell, Partner. Sanjai Bhonsle is one of the Fund’s portfolio managers
and is responsible for the day-to-day management of the Fund’s portfolio and the selection of its investments.
| Name |
|
Position(s)
Held with Company |
|
Principal
Occupations Last 5 Years |
| Sanjai
Bhonsle |
|
Chairman
and Chief Executive Officer |
|
Partner
and Portfolio Manager of ArrowMark Partners, 2013 to Present |
| |
|
|
|
|
| Karen
Reidy |
|
Class
I Director |
|
Founding
Partner of ArrowMark Partners, 2009 to Present |
| |
|
|
|
|
| Kaelyn
Abrell |
|
Portfolio
Manager |
|
Partner
and Portfolio Manager of ArrowMark Partners since 2010 |
| |
(a)(2) |
Other Accounts Managed
by Portfolio Manager(s) or Management Team Member and Potential Conflicts of Interest |
Other
Accounts Managed by Portfolio Manager(s) or Management Team Member
As
of December 31, 2023:
|
Name
of Portfolio Manager or
Team
Member |
Type
of Accounts |
Total
No.
of Accounts Managed |
Total
Assets |
No.
of Accounts where Advisory Fee is Based on Performance |
Total
Assets in Accounts where Advisory Fee is Based on Performance |
| Sanjai
Bhonsle |
Registered
Investment Companies: |
0 |
Not
applicable |
Not
applicable |
Not
applicable |
| |
Other
Pooled Investment Vehicles: |
0 |
Not
applicable |
Not
applicable |
$0 |
| |
Other
Accounts: |
18 |
$5.7
billion |
3 |
$1
billion |
| Karen
Reidy |
Registered
Investment Companies: |
0 |
Not
applicable |
Not
applicable |
Not
applicable |
| |
Other
Pooled Investment Vehicles: |
0 |
Not
applicable |
Not
applicable |
$0 |
| |
Other
Accounts: |
17 |
$5.7
billion |
3 |
$1
billion |
| Kaelyn
Abrell |
Registered
Investment Companies: |
0 |
Not
applicable |
Not
applicable |
Not
applicable |
| |
Other
Pooled Investment Vehicles: |
15 |
$3.7
billion |
14 |
$3.5
billion |
| |
Other
Accounts: |
0 |
Not
applicable |
|
Not
applicable |
Potential Conflicts of Interests
The Advisor and its affiliates manage funds
and accounts other than those of the registrant that have similar investment objectives. The investment policies, Advisor compensation
arrangements and other circumstances of the registrant may vary from those of these other funds and accounts. Accordingly, conflicts may
arise regarding the allocation of investments or opportunities among the registrant and those other accounts. In certain cases, investment
opportunities may be made available to the registrant by our Advisor other than on a pro rata basis. For example, the registrant may desire
to retain an asset at the same time that one or more of those other funds or accounts desires to sell, or the registrant may not have
additional capital to invest at the same time as such other funds and accounts. The Advisor intends to allocate investment opportunities
to the registrant and those other funds and accounts in a manner that they believe, in their good faith judgment and based upon their
fiduciary duties, to be appropriate considering a variety of factors such as the investment objectives, size of transaction, investable
assets, alternative investments potentially available, prior allocations, liquidity, maturity, expected holding period, diversification,
lender covenants and other limitations of the registrant and other funds or accounts.
There may be situations in which one or more
funds or accounts managed by the Advisor or its affiliates might invest in different securities issued by the same company. It is possible
that if the target company’s financial performance and condition deteriorates such that one or both investments are or could be
impaired, the Advisor might face a conflict of interest given the difference in seniority of the respective investments. In such situations,
the Advisor would review the conflict on a case-by-case basis and implement procedures consistent with its fiduciary duties to enable
it to act fairly to each of its clients in the circumstances. Any steps by the Advisor will take into consideration the interests of each
of the affected clients, the circumstances giving rise to the conflict, the procedural efficacy of various methods of addressing the conflict
and applicable legal requirements.
Our board of directors, including a majority
of our directors who are independent, is responsible for reviewing and approving the terms of all transactions between the registrant
and the Advisor or its affiliates or any member of our board of directors, including (when applicable) the economic, structural and other
terms of the registrant’s investments and investment transactions and the review of any investment decisions that may present potential
conflicts of interest among the Advisor and its affiliates, on one hand, and the registrant, on the other. The board of directors, including
a majority of the directors who are independent, is also responsible for reviewing the Advisor’s performance and the fees and expenses
that paid to the Advisor. In addition, the Adviser has adopted policies that are intended to provide reasonable oversight fair and equitable
treatment to the Advisor’s clients over time.
| |
(a)(3) |
Compensation Structure of Portfolio Manager(s) or Management Team
Members |
As of December 31, 2023:
Portfolio Manager
compensation may include a variety of components and may vary from year to year based on a number of factors. The principal components
of compensation include a base salary, a performance-based discretionary bonus, participation in various benefits programs and ownership
economics of the Advisor and its affiliates.
Base
Compensation
Generally, portfolio
managers receive base compensation based on their position with the firm.
Discretionary
Incentive Compensation
Discretionary incentive
compensation is a function of several components: the performance of Advisor and its affiliates, the performance of the portfolio manager’s
group, the investment performance, including risk-adjusted returns, of the firm’s assets or strategies under management or supervision
by that portfolio manager, and/or the individual’s performance and contribution to the overall performance of the strategies under
management.
Other Compensation
Benefits.
In addition to base salary and discretionary
incentive compensation, portfolio managers may be eligible to receive ownership economics of the Advisor and its affiliates.
| |
(a)(4) |
Disclosure of Securities Ownership |
As of December 31, 2023:
| Name
of Portfolio Manager or Team Member |
|
|
Dollar
($) Range of Fund Shares Beneficially Owned |
|
| Sanjai
Bhonsle |
|
|
$100,000
- $500,000 |
|
| Karen
Reidy |
|
|
$100,000
- $500,000 |
|
| Kaelyn
Abrell |
|
|
None |
|
Item 9. Purchases
of Equity Securities by Closed-End Management Investment Company and Affiliated Purchasers.
Not applicable.
Item 10. Submission of Matters to a Vote of
Security Holders.
There have been no material changes to the procedures
by which the shareholders may recommend nominees to the registrant’s board of directors, where those changes were implemented after
the registrant last provided disclosure in response to the requirements of Item 407(c)(2)(iv) of Regulation S-K (17 CFR 229.407)
(as required by Item 22(b)(15) of Schedule 14A (17 CFR 240.14a-101)), or this Item.
Item 11. Controls and Procedures.
| |
(a) |
The registrant’s principal executive and principal financial officers, or persons performing similar
functions, have concluded that the registrant’s disclosure controls and procedures (as defined in Rule 30a-3(c) under
the Investment Company Act of 1940, as amended (the “1940 Act”) (17 CFR 270.30a-3(c))) are effective, as of a date within
90 days of the filing date of the report that includes the disclosure required by this paragraph, based on their evaluation of these controls
and procedures required by Rule 30a-3(b) under the 1940 Act (17 CFR 270.30a-3(b)) and Rules 13a-15(b) or 15d-15(b) under
the Securities Exchange Act of 1934, as amended (17 CFR 240.13a-15(b) or 240.15d-15(b)). |
| |
(b) |
There were no changes in the registrant’s internal control over financial reporting (as defined in Rule 30a-3(d) under
the 1940 Act (17 CFR 270.30a-3(d))) that occurred during the period covered by this report that has materially affected, or is reasonably
likely to materially affect, the registrant’s internal control over financial reporting. |
Item 12. Disclosure of Securities
Lending Activities for Closed-End Management Investment Companies.
Not applicable.
Item
13. Recovery of Erroneously Awarded Compensation.
(a)
Not applicable.
(b)
Not applicable.
Item 14. Exhibits.
| |
(a)(1) |
Code of ethics – See Item 2. |
(a)(2)(1) Not applicable.
(a)(2)(2) Not applicable.
SIGNATURES
Pursuant to the requirements of the Securities Exchange
Act of 1934 and the Investment Company Act of 1940, the registrant has duly caused this report to be signed on its behalf by the undersigned,
thereunto duly authorized.
| (Registrant) |
ArrowMark Financial Corp. |
|
| By (Signature and Title)* |
/s/ Sanjai Bhonsle |
|
| |
Sanjai Bhonsle, Chief Executive Officer & Chairman of the Board |
|
| |
(principal executive officer) |
|
Pursuant to the requirements of the Securities Exchange
Act of 1934 and the Investment Company Act of 1940, this report has been signed below by the following persons on behalf of the registrant
and in the capacities and on the dates indicated.
| By (Signature and Title)* |
/s/ Sanjai Bhonsle |
|
| |
Sanjai Bhonsle, Chief Executive Officer & Chairman of the Board |
|
| |
(principal executive officer) |
|
| By (Signature and Title)* |
/s/ Patrick J. Farrell |
|
| |
Patrick J. Farrell, Chief Financial Officer |
|
| |
(principal financial officer) |
|
* Print the name and title of each signing officer under his or her signature.
I, Patrick J. Farrell, certify that:
I, Sanjai Bhonsle, Chief Executive Officer &
Chairman of the Board of ArrowMark Financial Corp. (the “Registrant”), certify that:
I, Patrick J. Farrell, Chief Financial Officer
of ArrowMark Financial Corp. (the “Registrant”), certify that:
We consent to the incorporation by reference in
the Registration Statement on Form N-2/A filed with the SEC on May 26, 2021 of our report dated February 29, 2024, relating to the financial
statements and financial highlights of ArrowMark Financial Corp., for the year ended December 31, 2023, which appear in this Form N-CSR.
N-2 - USD ($)
|
3 Months Ended |
12 Months Ended |
|
|
|
|
|
|
|
|
Dec. 31, 2023 |
Sep. 30, 2023 |
Jun. 30, 2023 |
Mar. 31, 2023 |
Dec. 31, 2022 |
Sep. 30, 2022 |
Jun. 30, 2022 |
Mar. 31, 2022 |
Dec. 31, 2021 |
Sep. 30, 2021 |
Jun. 30, 2021 |
Mar. 31, 2021 |
Dec. 31, 2023 |
Dec. 31, 2020 |
Dec. 31, 2019 |
Dec. 31, 2018 |
Dec. 31, 2017 |
Dec. 31, 2016 |
Dec. 31, 2015 |
Dec. 31, 2014 |
Dec. 31, 2013 |
| Cover [Abstract] |
|
|
|
|
|
|
|
|
|
|
|
|
|
|
|
|
|
|
|
|
|
|
| Entity Central Index Key |
|
|
|
|
|
|
|
|
|
|
|
|
|
0001578987
|
|
|
|
|
|
|
|
|
| Amendment Flag |
|
|
|
|
|
|
|
|
|
|
|
|
|
false
|
|
|
|
|
|
|
|
|
| Document Type |
|
|
|
|
|
|
|
|
|
|
|
|
|
N-CSR
|
|
|
|
|
|
|
|
|
| Entity Registrant Name |
|
|
|
|
|
|
|
|
|
|
|
|
|
ArrowMark
Financial Corp.
|
|
|
|
|
|
|
|
|
| Document Period End Date |
|
|
|
|
|
|
|
|
|
|
|
|
|
Dec. 31, 2023
|
|
|
|
|
|
|
|
|
| Fee Table [Abstract] |
|
|
|
|
|
|
|
|
|
|
|
|
|
|
|
|
|
|
|
|
|
|
| Shareholder Transaction Expenses [Table Text Block] |
|
|
|
|
|
|
|
|
|
|
|
|
|
|
Stockholder
Transaction Expenses (as a percentage of offering price): |
|
|
|
| Sales Load(1) |
|
|
2.00 |
% |
| Offering
Expenses(2) |
|
|
0.11 |
% |
| Dividend
Reinvestment Plan Expenses(3) |
|
|
None |
|
| Total
Stockholder Transaction Expenses |
|
|
2.11 |
% |
| (1) |
In the event that the securities
to which the Company’s prospectus relates are sold to or through underwriters or agents, a corresponding prospectus supplement will
disclose the applicable sales load. |
| (2) |
The Company’s related
prospectus supplement will disclose the estimated amount of total offering expenses (which may include offering expenses borne by third
parties on our behalf), the offering price and the offering expenses borne by us as a percentage of the offering price. |
| (3) |
The expenses associated
with the administration of our dividend reinvestment plan are included in “Other Expenses.” Participants in the dividend reinvestment
plan that instruct the plan administrator to sell shares obtained under the plan may be accessed a $15 transaction fee by the plan administrator
and the proceeds of such sale will be net of brokerage commissions, fees and transaction costs. For more details about the plan, see “Dividend
Reinvestment Plan" see page 33. |
|
|
|
|
|
|
|
|
|
| Sales Load [Percent] |
[1] |
|
|
|
|
|
|
|
|
|
|
|
|
2.00%
|
|
|
|
|
|
|
|
|
| Dividend Reinvestment and Cash Purchase Fees |
[2] |
|
|
|
|
|
|
|
|
|
|
|
|
$ 0
|
|
|
|
|
|
|
|
|
| Other Transaction Expenses [Abstract] |
|
|
|
|
|
|
|
|
|
|
|
|
|
|
|
|
|
|
|
|
|
|
| Other Transaction Expenses [Percent] |
[3] |
|
|
|
|
|
|
|
|
|
|
|
|
0.11%
|
|
|
|
|
|
|
|
|
| Annual Expenses [Table Text Block] |
|
|
|
|
|
|
|
|
|
|
|
|
|
|
Annual
Expenses (as
a percentage of net assets attributable to common stock): |
|
|
|
|
| Management Fees(4) |
|
|
2.63 |
% |
| Interest
payments on borrowed funds(5) |
|
|
3.71 |
% |
| Other
Expenses (estimated for the current fiscal year)(7) |
|
|
2.01 |
% |
| Total
Annual Expenses(8) |
|
|
8.35 |
% |
| (4) |
For the purposes of calculating
our expenses, we have assumed the maximum contractual management fee of 1.75% of Managed Assets. See “Investment Advisory Fee and
Other Fee Arrangements.” see note 3 |
| (5) |
We entered into a revolving
credit agreement on June 9, 2014. Interest expense assumes that leverage will represent approximately 30% of our Managed Assets (as
defined under “Management—Management Agreement — Management Fee”) - see note 7, and charge interest or involve
payment at a rate set by an interest rate transaction at the rate of 7.97% as of December 31, 2023. We have assumed for purposes
of these expense estimates that we will utilize leverage for the entire year. |
| (6) |
Includes fees and expenses
of approximately 0.00% incurred indirectly as a result of investment in shares of one or more “Acquired Funds,” which include
(i) investment companies, or (ii) companies that would be an investment company under Section 3(a) of the 1940 Act
except for exceptions under Sections 3(c)(1) and 3(c)(7) under the 1940 Act. |
| (7) |
Pursuant to the management
agreement, our Adviser furnishes us, or arranges for the furnishing of office facilities and clerical and administrative services necessary
for our operation (other than services provided by our custodian, accounting agent, administrator, dividend and interest paying agent
and other service providers). We bear all expenses incurred in our operations, and we will bear the expenses related to any future offering.
“Other
Expenses” above includes all such costs not borne by our Adviser, which may include but are not limited to overhead costs of our
business, commissions, fees and expenses connected with our investments and auditing, accounting and legal expenses, and Acquired Fund
Fees and Expenses. |
| (8) |
Total
Annual Expenses may not correlate to the ratio of expenses to average net assets disclosed in the Company’s annual and semi-annual
reports to stockholders in the financial highlights table, which reflects operating expenses of the Company and does not include “Acquired
Fund” fees and expenses. For the year ended December 31, 2023, the Advisor voluntarily reimbursed the Fund $70,994 for expenses
related to Investor Relations Fees. |
|
|
|
|
|
|
|
|
|
| Management Fees [Percent] |
[4] |
|
|
|
|
|
|
|
|
|
|
|
|
2.63%
|
|
|
|
|
|
|
|
|
| Interest Expenses on Borrowings [Percent] |
[5] |
|
|
|
|
|
|
|
|
|
|
|
|
3.71%
|
|
|
|
|
|
|
|
|
| Other Annual Expenses [Abstract] |
|
|
|
|
|
|
|
|
|
|
|
|
|
|
|
|
|
|
|
|
|
|
| Other Annual Expense 1 [Percent] |
[6] |
|
|
|
|
|
|
|
|
|
|
|
|
2.01%
|
|
|
|
|
|
|
|
|
| Total Annual Expenses [Percent] |
[7] |
|
|
|
|
|
|
|
|
|
|
|
|
8.35%
|
|
|
|
|
|
|
|
|
| Expense Example [Table Text Block] |
|
|
|
|
|
|
|
|
|
|
|
|
|
Example
The
following example demonstrates the hypothetical dollar amount of total cumulative expenses that would be incurred over various periods
with respect to a hypothetical investment in our common stock. These amounts are based upon the assumption that our annual operating expenses
remain at the levels set forth in the table above and that the annual return on investments before fees and expenses is 5%.
| |
|
|
1
Year |
|
3
Years |
|
|
5
Years |
|
|
10
Years |
|
| You
would pay the following expenses on a $1,000 investment, assuming a 5% annual return: |
|
$ |
101 |
|
$ |
254 |
|
|
$ |
397 |
|
|
$ |
714 |
|
The
purpose of the table and example above is to assist you in understanding the various costs and expenses that an investor in any future
offering will bear directly or indirectly. The example and the expenses in the tables above should not be considered a representation
of our future expenses, and actual expenses may be greater or less than those shown.
Moreover,
while the example assumes, as required by the SEC, a 5% annual return, our performance will vary and may result in a return greater or
less than 5%. In addition, while the example assumes reinvestment of all distributions at NAV, participants in our dividend reinvestment
plan may receive common stock valued at the market price in effect at that time. This price may be at, above or below NAV. See “Dividend
Reinvestment Plan” for additional information regarding our dividend reinvestment plan.
|
|
|
|
|
|
|
|
|
| Expense Example, Year 01 |
|
|
|
|
|
|
|
|
|
|
|
|
|
$ 101
|
|
|
|
|
|
|
|
|
| Expense Example, Years 1 to 3 |
|
|
|
|
|
|
|
|
|
|
|
|
|
254
|
|
|
|
|
|
|
|
|
| Expense Example, Years 1 to 5 |
|
|
|
|
|
|
|
|
|
|
|
|
|
397
|
|
|
|
|
|
|
|
|
| Expense Example, Years 1 to 10 |
|
|
|
|
|
|
|
|
|
|
|
|
|
$ 714
|
|
|
|
|
|
|
|
|
| Purpose of Fee Table , Note [Text Block] |
|
|
|
|
|
|
|
|
|
|
|
|
|
The
following table is intended to assist you in understanding the costs and expenses that an investor in shares of our common stock will
bear, directly or indirectly. Other expenses are estimated and may vary. Except where the context suggests otherwise, whenever the Company’s
prospectus contains a reference to fees or expenses paid by “you” or “us” or that “we” will pay fees
or expenses, stockholders will indirectly bear such fees or expenses. We caution you that certain of the indicated percentages
in the table below indicating annual expenses are estimates and may vary.
|
|
|
|
|
|
|
|
|
| Basis of Transaction Fees, Note [Text Block] |
|
|
|
|
|
|
|
|
|
|
|
|
|
as
a percentage of net assets attributable to common stock
|
|
|
|
|
|
|
|
|
| Other Expenses, Note [Text Block] |
|
|
|
|
|
|
|
|
|
|
|
|
|
“Other
Expenses” above includes all such costs not borne by our Adviser, which may include but are not limited to overhead costs of our
business, commissions, fees and expenses connected with our investments and auditing, accounting and legal expenses, and Acquired Fund
Fees and Expenses.
|
|
|
|
|
|
|
|
|
| Acquired Fund Total Annual Expenses, Note [Text Block] |
|
|
|
|
|
|
|
|
|
|
|
|
|
Total
Annual Expenses may not correlate to the ratio of expenses to average net assets disclosed in the Company’s annual and semi-annual
reports to stockholders in the financial highlights table, which reflects operating expenses of the Company and does not include “Acquired
Fund” fees and expenses. For the year ended December 31, 2023, the Advisor voluntarily reimbursed the Fund $70,994 for expenses
related to Investor Relations Fees
|
|
|
|
|
|
|
|
|
| Financial Highlights [Abstract] |
|
|
|
|
|
|
|
|
|
|
|
|
|
|
|
|
|
|
|
|
|
|
| Senior Securities [Table Text Block] |
|
|
|
|
|
|
|
|
|
|
|
|
|
|
Class and
Year(a) |
|
Total Amount
Outstanding(b)
|
|
|
Asset Coverage
Per
Unit(c) |
|
|
Average
Market
Value
(excludes Bank
Loans) |
|
| Credit
Facility |
|
|
|
|
|
|
|
|
|
|
|
| Fiscal 2013 (as of December 31, 2013) |
|
|
N/A |
(d) |
|
|
N/A |
(d) |
|
N/A |
(d) |
| Fiscal 2014 (as of December 31, 2014) |
|
$ |
22,500,000 |
|
|
$ |
7,317 |
|
|
N/A |
|
| Fiscal 2015 (as of December 31, 2015) |
|
$ |
25,000,000 |
|
|
$ |
6,631 |
|
|
N/A |
|
| Fiscal 2016 (as of December 31, 2016) |
|
$ |
61,500,000 |
|
|
$ |
3,253 |
|
|
N/A |
|
| Fiscal 2017 (as of December 31, 2017) |
|
$ |
25,750,000 |
|
|
$ |
6,478 |
|
|
N/A |
|
| Fiscal 2018 (as of December 31, 2018) |
|
$ |
51,000,000 |
|
|
$ |
3,753 |
|
|
N/A |
|
| Fiscal 2019 (as of December 31, 2019) |
|
$ |
17,700,000 |
|
|
$ |
9,090 |
|
|
N/A |
|
| Fiscal 2020 (as of December 31, 2020) |
|
$ |
43,000,000 |
|
|
$ |
4,274 |
|
|
N/A |
|
| Fiscal 2021 (as of December 31, 2021) |
|
$ |
60,000,000 |
|
|
$ |
3,558 |
|
|
N/A |
|
| Fiscal 2022 (as of December 31, 2022) |
|
$ |
55,600,000 |
|
|
$ |
3,656 |
|
|
N/A |
|
| Fiscal 2023 (as of December 31, 2023) |
|
$ |
45,000,000 |
|
|
$ |
4,387 |
|
|
N/A |
|
| (a) |
On June 9, 2014, the Company entered into the Credit Facility, a revolving credit agreement which had
an initial aggregate principal amount of up to $45,000,000 and stated maturity date of June 9, 2019. The interest rate applicable
to borrowings thereunder was generally LIBOR plus an applicable margin of 2.85%. The Credit Facility’s commitment was increased
to $70 million on January 16, 2015.The Credit Facility was further amended
in May 2017 to reflect a single lender, Texas Capital Bank, N.A., a reduced rate of LIBOR +2.35%
and a maximum borrowing amount of $62 million. In May 2022, the Credit Facility was further amended to reflect the addition of two
lenders, a new rate of SOFR +2.61% and a maximum borrowing amount of $70
million. See “Leverage—Effects of Leverage” for a description of our revolving credit agreement. |
| (b) |
Total amount of each class of senior securities outstanding at the end of the period. |
| (c) |
The asset coverage ratio for senior securities representing indebtedness is calculated as our consolidated
total assets, less all consolidated liabilities and indebtedness not represented by senior securities, divided by senior securities representing
indebtedness. This asset coverage ratio is multiplied by $1,000 to determine the Asset Coverage Per Unit. |
| (d) |
No credit facility was in place in 2013. The credit facility was put in place during 2014. See (a). |
|
|
|
|
|
|
|
|
|
| Senior Securities Amount |
[8],[9] |
$ 45,000,000
|
|
|
|
$ 55,600,000
|
|
|
|
$ 60,000,000
|
|
|
|
$ 45,000,000
|
$ 43,000,000
|
$ 17,700,000
|
$ 51,000,000
|
$ 25,750,000
|
$ 61,500,000
|
$ 25,000,000
|
$ 22,500,000
|
|
| Senior Securities Coverage per Unit |
[8],[10] |
$ 4,387
|
|
|
|
$ 3,656
|
|
|
|
$ 3,558
|
|
|
|
$ 4,387
|
$ 4,274
|
$ 9,090
|
$ 3,753
|
$ 6,478
|
$ 3,253
|
$ 6,631
|
$ 7,317
|
|
| Senior Securities, Note [Text Block] |
|
|
|
|
|
|
|
|
|
|
|
|
|
Senior Securities
Information in the table below
has been audited by Tait, Weller & Baker LLP, the Company’s independent registered public accounting firm. The Company
did not have any senior securities outstanding prior to June 9, 2014. Borrowings under the Credit Facility for each fiscal year commencing
with December 31, 2013, were as follows:
|
Class and
Year(a) |
|
Total Amount
Outstanding(b)
|
|
|
Asset Coverage
Per
Unit(c) |
|
|
Average
Market
Value
(excludes Bank
Loans) |
|
| Credit
Facility |
|
|
|
|
|
|
|
|
|
|
|
| Fiscal 2013 (as of December 31, 2013) |
|
|
N/A |
(d) |
|
|
N/A |
(d) |
|
N/A |
(d) |
| Fiscal 2014 (as of December 31, 2014) |
|
$ |
22,500,000 |
|
|
$ |
7,317 |
|
|
N/A |
|
| Fiscal 2015 (as of December 31, 2015) |
|
$ |
25,000,000 |
|
|
$ |
6,631 |
|
|
N/A |
|
| Fiscal 2016 (as of December 31, 2016) |
|
$ |
61,500,000 |
|
|
$ |
3,253 |
|
|
N/A |
|
| Fiscal 2017 (as of December 31, 2017) |
|
$ |
25,750,000 |
|
|
$ |
6,478 |
|
|
N/A |
|
| Fiscal 2018 (as of December 31, 2018) |
|
$ |
51,000,000 |
|
|
$ |
3,753 |
|
|
N/A |
|
| Fiscal 2019 (as of December 31, 2019) |
|
$ |
17,700,000 |
|
|
$ |
9,090 |
|
|
N/A |
|
| Fiscal 2020 (as of December 31, 2020) |
|
$ |
43,000,000 |
|
|
$ |
4,274 |
|
|
N/A |
|
| Fiscal 2021 (as of December 31, 2021) |
|
$ |
60,000,000 |
|
|
$ |
3,558 |
|
|
N/A |
|
| Fiscal 2022 (as of December 31, 2022) |
|
$ |
55,600,000 |
|
|
$ |
3,656 |
|
|
N/A |
|
| Fiscal 2023 (as of December 31, 2023) |
|
$ |
45,000,000 |
|
|
$ |
4,387 |
|
|
N/A |
|
| (a) |
On June 9, 2014, the Company entered into the Credit Facility, a revolving credit agreement which had
an initial aggregate principal amount of up to $45,000,000 and stated maturity date of June 9, 2019. The interest rate applicable
to borrowings thereunder was generally LIBOR plus an applicable margin of 2.85%. The Credit Facility’s commitment was increased
to $70 million on January 16, 2015.The Credit Facility was further amended
in May 2017 to reflect a single lender, Texas Capital Bank, N.A., a reduced rate of LIBOR +2.35%
and a maximum borrowing amount of $62 million. In May 2022, the Credit Facility was further amended to reflect the addition of two
lenders, a new rate of SOFR +2.61% and a maximum borrowing amount of $70
million. See “Leverage—Effects of Leverage” for a description of our revolving credit agreement. |
| (b) |
Total amount of each class of senior securities outstanding at the end of the period. |
| (c) |
The asset coverage ratio for senior securities representing indebtedness is calculated as our consolidated
total assets, less all consolidated liabilities and indebtedness not represented by senior securities, divided by senior securities representing
indebtedness. This asset coverage ratio is multiplied by $1,000 to determine the Asset Coverage Per Unit. |
| (d) |
No credit facility was in place in 2013. The credit facility was put in place during 2014. See (a). |
|
|
|
|
|
|
|
|
|
| General Description of Registrant [Abstract] |
|
|
|
|
|
|
|
|
|
|
|
|
|
|
|
|
|
|
|
|
|
|
| Investment Objectives and Practices [Text Block] |
|
|
|
|
|
|
|
|
|
|
|
|
|
INVESTMENT OBJECTIVE, POLICIES AND PRINCIPAL
RISKS
Investment Objectives
ArrowMark Financial Corp.’s
primary investment objective is to provide stockholders with current income, and to a lesser extent, capital appreciation. There can be
no assurance that the Company will achieve the investment objectives.
Investment Strategies
The Company is focused on income
generation, capital preservation, and providing risk-adjusted rates of return. The Company attempts to achieve its investment objective
through investment in preferred equity, debt and subordinated debt, structured notes and securities, convertible securities, regulatory
capital securities and common equity issued or structured by banks and financial institutions including community banks, larger regional,
national and money center banks domiciled in the United States and foreign and global money center banks. (“banking-related securities”).
The Company makes investments that will generally be expected to pay the Company dividends and interest on a current basis and generate
capital gains over time. The Company may seek to enhance the Company’s returns through the use of warrants, options and other equity
conversion features. The Company has a policy to invest, under normal circumstances, at least 80% of the value of its net assets plus
the amount of any borrowings for investment purposes in such banking-related securities.
The Company focuses its portfolio
on making long-term, passive, non-control investments in the banking sector, including “regulatory capital securities” which
are securities issued or structured by banks seeking capital that is treated more favorably under banking regulations than other types
of capital, acquisitions and other refinancing activities regulatory capital securities are issued or structured by a bank to maintain
or reduce its regulatory capital requirements by transferring certain credit risks to investors. Regulatory capital securities may be
structured in a variety of ways and are highly bespoke to the needs of the bank or other deposit-taking institution involved. Regulatory
capital securities may be in the form of structured notes (e.g., credit-linked notes), contingent convertible securities, and other structured
products or transactions. The Company intends to continue to direct investments in numerous issuers differentiated by asset size, business
models and geographies. The Company also may invest in an option strategy that will normally consist of writing (selling) call options
on bank equity securities in the Company’s portfolio (“covered calls”). The Company invests in foreign securities and
the Company is not limited in the amount of assets the Company may invest in such foreign securities.
The Company indirectly invests
in securities issued or structured by banks through structured securities and credit derivatives, including collateralized loan obligations
(CLOs) and credit-linked notes. The Company currently invests in credit-linked notes for which the performance and payment of principal
and interest is tied to a reference asset such as a pool of loans originated by a bank and held on its balance sheet. The Company also
invests in equity and junior debt tranches of CLOs, and other debt securitizations, that are collateralized by a portfolio consisting
primarily of unsecured, subordinated loans made to (and, to a lesser extent, unsecured, subordinated debentures and notes issued by) community
banks or savings institutions or their respective holding companies. The Company may also invest in other securities and instruments that
are related to these investments or that the Adviser believes are consistent with the Company’s investment objectives, including
senior debt tranches of CLOs and loan accumulation facilities. These indirect investments provide exposure to and focus on the same types
of direct investments that the Company makes in banking companies and, accordingly, the Company’s investments in structured securities
(such as credit-linked notes and CLOs) and credit derivatives that provide exposure to the banking industry are considered an investment
in banking securities. The loans or other assets pledged as collateral in these securitizations may not be publicly rated by any rating
agency, and may have greater credit and liquidity risks than investment-grade corporate obligations that are publicly rated. The Company
believes that the use of such instruments complements the Company’s overall strategy and enhance the diversity of the Company’s
holdings.
The Company may also incur
additional leverage to the extent permitted by the Investment Company Act. Although the Company normally seeks to invest substantially
all of the Company’s assets in banking-related securities, the Company reserves the ability to invest up to 20% of the Company’s
assets in other types of securities and instruments.
Additionally, the Company may
take temporary defensive positions that are inconsistent with the Company’s investment strategy in attempting to respond to adverse
market, economic, political or other conditions. If the Company does so, the Company may not achieve the Company’s investment objective.
The Company may also choose not to take defensive positions.
Investment Restrictions
The restrictions listed below
are policies of the Company. Except as described herein, the Company may not alter these policies without the approval of the holders
of a majority of its outstanding shares. For purposes of the foregoing, “a majority of the outstanding shares” means (i) 67%
or more of such shares present at a meeting, if the holders of more than 50% of such shares are present or represented by proxy, or (ii) more
than 50% of such shares, whichever is less. Unless otherwise indicated, all limitations applicable to the Company’s investments
apply only at the time a transaction is entered into. Any subsequent change in the percentage of the Company’s assets invested in
certain securities or other instruments resulting from market fluctuations or other changes in the Company’s total assets, will
not require the Company to dispose of an investment.
| 1. |
The Company may borrow money, make loans or issue senior securities to the fullest extent permitted by the
Investment Company Act, the rules or regulations thereunder or applicable orders of the SEC, as such statute, rules, regulations
or orders may be amended from time to time. |
| |
|
| 2. |
Except with respect to the banking industry, no more than 25% of the Company’s total assets may be invested
in a particular industry or group of industries. Securities issued or guaranteed by the U.S. Government or its agencies or instrumentalities
or securities issued by other investment companies are not considered to represent an industry. |
| |
|
| 3. |
The Company may purchase or sell commodities, commodities contracts, futures contracts and related options,
options, forward contracts or real estate to the fullest extent permitted by the Investment Company Act, the rules or regulations
thereunder or applicable orders of the SEC, as such statute, rules, regulations or orders may be amended from time to time. |
| 4. |
The Company may underwrite securities to the fullest extent permitted by the Investment Company Act, the rules or
regulations thereunder or applicable orders of the SEC, as such statute, rules, regulations or orders may be amended from time to time. |
The investment restrictions
set forth above limit the Company’s ability to engage in certain practices and purchase securities and other instruments other than
as permitted by, or consistent with, the Investment Company Act. These limitations are based either on the Investment Company Act itself,
the rules or regulations thereunder or applicable orders of the SEC. In addition, interpretations and guidance provided by the SEC
staff may be taken into account, where deemed appropriate by the Company, to determine if a certain practice or the purchase of securities
or other instruments is permitted by the Investment Company Act, the rules or regulations thereunder or applicable orders of the
SEC. As a result, the foregoing investment policies may be interpreted differently over time as the statute, rules, regulations or orders
(or, if applicable, interpretations) that relate to the meaning and effect of these policies change, and no stockholder vote will be required
or sought.
|
|
|
|
|
|
|
|
|
| Risk Factors [Table Text Block] |
|
|
|
|
|
|
|
|
|
|
|
|
|
Principal Risks
An investment in the Company’s
securities involves risk, and the Company urges you to consult your tax and legal advisors before making an investment in the Company’s
securities. You could lose some or all of your investment. There can be no assurance that the Company will achieve the Company’s
investment objective.
An investment in the Company’s common stock
involves significant risks, including:
Risks Related to Investing in the Banking
Sector.
The Company’s assets
will be concentrated in the banking industry, potentially exposing the Company to greater risks than companies that invest in multiple
sectors.
● The
Company primarily invests in equity and debt securities issued by banks, subjecting the Company to unique risks.
● All
of the Company’s investments are subject to liquidity risk, but the Company may face higher liquidity risk if the Company invests
in debt obligations and other securities that are unrated and issued by banks that have no corporate rating.
● The
Company expects to keep the Company’s portfolio of securities and investments focused on the bank sector, which would make the Company
more economically vulnerable in the event of a downturn in the banking industry.
● A
large number of banks may fail during times of economic stress.
● The
Company expects to keep the Company’s portfolio of securities and investments focused on the bank sector including community banks
whose business is subject to greater lending risks than larger banks.
Risks Related to Banking Regulations and
Banking Investments Affecting the Company’s Business
● The
banking institutions in which the Company invests, including global money center banks, are subject to substantial regulations that could
adversely affect their ability to operate and the value of the Company’s investments. In addition, geopolitical instability, natural
disasters, including outbreaks of infectious diseases, or in times of significant global market downturns, which may impact the value
of regulatory capital securities or other investments.
● Regulatory
capital securities are subject to several risks. Banking regulators could change or amend existing banking regulations which could affect
the regulatory treatment of regulatory capital securities, where stricter regulation could make regulatory capital securities less desirable,
or undesirable, for banks to issue, reducing the supply of new investments. Should an adverse regulatory development occur in the future,
it would likely result in the bank issuer of such securities being able to redeem an investment early, which subjects the Company to reinvestment
risk. Regulatory capital securities remain subject to the same sector specific and other risks as any banking-related investment that
the Company may acquire, including, but not limited to, credit risk, interest rate risk, currency risk, prepayments, adverse changes in
market value or liquidity and the quality of the loans extended by each bank to its clients.
● The
Company may become subject to adverse current or future banking regulations.
● Ownership
of the Company’s stock by certain types of regulated institutions may subject the Company to additional regulations.
● Investments
in banking institutions and transactions related to the Company’s portfolio investments may require approval from one or more regulatory
authorities.
● If
the Company were deemed to be a bank holding company or thrift holding company, bank holding companies or thrift holding companies that
invest in the Company would be subject to certain restrictions and regulations.
● The
Financial Accounting Standards Board, or FASB, has issued a new credit impairment model, the Current Expected Credit Loss, or CECL model,
which must be implemented by banks and certain other companies beginning in 2021. Under the CECL model, entities subject to the model
will be required to present certain financial assets carried at amortized cost, such as loans held for investment and held-to-maturity
debt securities, at the net amount expected to be collected. The measurement of expected credit losses is to be based on information about
past events, including historical experience, current conditions, and reasonable and supportable forecasts that affect the collectability
of the reported amount. This measurement will take place at the time the financial asset is first added to the balance sheet and periodically
thereafter. This differs significantly from the "incurred loss" model, which delays recognition until it is probable a loss
has been incurred. CECL may create more volatility in the companies in which the Company invests, and this in turn could affect the value
of the Company’s portfolio.
Risks Related to the Company’s Investments
● The
Company’s investments will be subject to dividend and interest rate fluctuations, and the Company is subject to interest rate risk.
In particular, the Company’s investments in subordinated or unsecured debt securities that are perpetual or have maturities in excess
of ten years subject the Company to a high degree of interest rate risk.
● Most
of the Company’s assets will be unrated, illiquid, and their fair value may not be readily determinable. As a consequence, the Company
may be unable to sell such assets at an attractive value for a period of time, if at all. The assets in which the Company invests may
not be publicly rated by any rating agency, and may have greater credit and liquidity risks than investment-grade corporate obligations
that are publicly rated.
● The
Company’s investments in regulatory capital securities subject the Company to the risks of underlying bank assets.
● Risks
of credit-linked notes include those risks associated with fixed-income instruments and those of the underlying reference instrument or
credit obligation including but not limited to market risk, interest rate risk, credit (default) risk, counterparty risk, valuation risk,
foreign security and foreign currency risk.
● The
Company may acquire CLO equity and junior debt securities that are subordinated to more senior tranches of CLO debt. CLOs present risks
including credit(default), interest rate and prepayment risks. Investors in CLO securities indirectly bear risks of the collateral held
by such CLOs. The prices of CLOs (and, therefore, the prices of the CLOs’ securities) are influenced by the same types of political
and economic events that affect issuers of securities and capital markets generally. CLO interests are generally thinly traded or have
only a limited trading market. CLO securities are typically privately offered and sold, even in the secondary market. As a result, investments
in CLO securities are illiquid and the price at which these securities are sold may be less than the price used to calculate the Company’s
NAV. CLO equity and junior debt securities are typically highly levered and, therefore, the junior debt and equity tranches in which the
Company is currently invested and in which it may invest will be subject to a higher degree of risk of total loss. The loans or other
assets pledged as collateral in a CLO may not be publicly rated by any rating agency, and may have greater credit and liquidity risks
than investment-grade corporate obligations that are publicly rated.
● Foreign
securities may experience greater price volatility and changes in value. Investments denominated in foreign currencies as well as currency
hedge transactions will be subject to fluctuations in value.
● Derivatives
transactions may limit the ’s income or result in losses.
● The
Company may invest in securities rated below investment grade or which are unrated. Securities rated below investment grade and certain
unrated securities are considered to be speculative, “high yield,” or “junk” and are subject to greater market
and credit risks, and accordingly, that the risk of non-payment or default is higher than investment-grade securities. In addition, such
securities may be more sensitive to interest rate changes and more likely to receive early returns of principal in falling rate environments.
Risks Related to the Company’s Use
of Leverage
● The
Company currently has a bank loan to finance investments as a form of leverage. the Company also has authority to issue preferred stock
or engage in reverse repurchase agreements to finance investments.
● Leverage
exaggerates the effects of market downturns or upturns on the NAV and market value of the Company’s common stock, as well as on
distributions to holders of the Company’s common stock.
● Leverage
can also increase the volatility of the Company’s NAV, and expenses related to leverage can reduce the Company’s income.
● In
the case of leverage, if the Company’s assets decline in value so that asset coverage requirements for any borrowings or preferred
stock would not be met, the Company may be prevented from paying distributions, which could jeopardize the Company’s qualification
for pass- through tax treatment, make the Company liable for excise taxes and/or force the Company to sell portfolio securities at an
inopportune time.
● The
use of leverage through investments such as CLO equity or junior debt securities that inherently involve leverage, may magnify the Company’s
risk of loss. CLO equity or junior debt securities are very highly leveraged, and therefore the CLO securities in which the Company is
currently invested and in which the Company intends to invest are subject to a higher degree of loss since the use of leverage magnifies
losses.
● The
Company utilizes a revolving credit agreement with Texas Capital Bank to provide for a maximum borrowing amount of $70 million and a fee
of Secured Overnight Funding Rate (“SOFR”) +2.61%,
with a maturity date of May 2025 (the “Credit Facility”).
● The
Credit Facility imposes asset coverage requirements, which are more stringent than those imposed by the Investment Company Act, or by
the Company’s policies. In addition, the Company agreed not to purchase assets not contemplated by the investment policies and restrictions
in effect when the Credit Facility became effective unless changes to these policies and restrictions are consented to by Texas Capital
Bank.
● The
covenants or guidelines under the Credit Facility could impede the Adviser from fully managing the Company’s portfolio in accordance
with the Company’s investment objectives and policies. Furthermore, non-compliance with such covenants or the occurrence of other
events could lead to the cancellation of the Credit Facility.
● For
as long as the Credit Facility remains in effect, the Company may not incur additional debt under any other facility, except in limited
circumstances.
● The
Credit Facility allows the Company to prepay borrowings under the Credit Facility at any time. The Company does not anticipate that such
guidelines will have a material adverse effect on the holders of the Company’s common stock or on the Company’s ability to
achieve the Company’s investment objectives. The Company may also consider alternative measures of obtaining leverage in the future.
Risks Related to the
Company’s Operations
● The
Company’s performance is highly dependent on the Adviser. The Adviser may rely on assumptions that prove to be incorrect.
● The
Adviser and its affiliates may serve as investment adviser to other funds, investment vehicles and investors, which may create conflicts
of interest not in the best interest of the Company or the Company’s stockholders.
● The
Company may generate low or negative rates of return on capital, and the Company may not be able to execute the Company’s business
plans as expected, if at all.
● The
Company’s business model depends to a significant extent upon strong referral relationships, and the Company’s inability to
maintain or develop these relationships, as well as the failure of these relationships to generate investment opportunities, could adversely
affect the Company’s business.
● If
the Company is unable to source investments effectively, the Company may be unable to achieve the Company’s investment objective.
● The
Company’s quarterly results may fluctuate.
● The
Company makes distributions to the Company’s stockholders on a quarterly basis. If the amount of any distribution exceeds the Company’s
net investment income or capital gains, then all or a portion of such distribution could constitute a return of capital to stockholders
rather than dividend income for tax purposes. A return of capital distribution has the effect of lowering stockholders’ basis in
their shares, which will result in higher tax liability when the shares are sold, even if such shares have not increased in value or have,
in fact, lost value. In addition to the tax consequences, such a distribution is a return of a shareholder’s own investment, but
distributed net of Company expenses, and will decrease the funds available for investment by the Company.
● Financing
arrangements with lenders or preferred shareholders may limit the Company’s ability to make dividend payments to the Company’s
stockholders.
● The
Company may change the Company’s business strategy and operational policies without stockholder consent (unless stockholder consent
is specifically required by the Investment Company Act), which may result in a determination to pursue riskier business activities.
● Laws
and regulations may prohibit the banks in which the Company invests from paying interest and/or dividends to the Company.
● Legal
and regulatory changes could occur that may adversely affect the Company.
● The
Company may be required to register as a commodity pool operator.
● Market
fluctuations caused by force majeure, terrorism, global pandemics, or certain other acts may adversely affect the Company’s performance.
The recent global outbreak of the COVID-19 virus and the resulting pandemic has disrupted economic markets and the economic impact, duration
and spread of the COVID-19 pandemic remains uncertain at this time. The operational and financial performance of some of the portfolio
banks in which the Company makes investments may be impacted by COVID-19, which may in turn impact the valuation of the Company’s
investments and results of the Company’s operations.
● Changes
in interest rates may affect the Company’s net investment income, reinvestment risk and the probability of defaults of the Company’s
investments.
Risks Related to the
Adviser and/or its Affiliates
● The
Company’s performance is dependent on the Adviser, and the Company may not find a suitable replacement if the management agreement
is terminated.
● The
departure or death of any of the members of senior management of the Adviser or ArrowMark Partners may adversely affect the Company’s
ability to achieve the Company’s business objective; The Company’s management agreement does not require the availability
to the Company of any particular individuals.
● If
the Adviser ceases to be the Company’s manager under the Company’s management agreement, financial institutions that provided
the Company’s credit facilities may not provide future financing to the Company.
● The
Adviser’s liability is limited under the Company’s management agreement, and the Company has agreed to indemnify the Adviser
against certain liabilities.
● There
may be potential conflicts of interest between the Company’s management and the Adviser, on one hand, and the interest of the Company’s
common stockholders, on the other.
● The
Company is limited in the Company’s ability to conduct transactions with affiliates.
● The
Adviser’s investment committee is not independent from its management.
● The
Company may compete with the Adviser’s current and future investment vehicles for access to capital and assets.
● There
may be other conflicts of interest in the Company’s relationship with the Adviser and/or its affiliates that could negatively affect
the Company’s earnings.
● The
Adviser’s management of the Company’s business is subject to the oversight of the Company’s board of directors, but
the Company’s board of directors will not approve each business decision made by the Adviser.
● The
Adviser may be incentivized to incur additional leverage, up to the extent permitted by regulations, even if additional leverage is not
in the best interests of the Company’s stockholders.
Risks Related to Offerings
● The
price for the Company’s common stock may be volatile.
● The
price for the Company’s common stock is subject to market risk.
● Future
offerings of debt securities or preferred stock, which would rank senior to the Company’s common stock upon the Company’s
liquidation, and future offerings of equity securities, which would dilute the Company’s existing stockholders and may be senior
to the Company’s common stock for the purposes of dividend and liquidating distributions, may adversely affect the market value
of the Company’s common stock.
Risks Related to Taxation
● Despite
the Company’s election to be treated as a RIC, the Company may not be able to meet the requirements to maintain an election to be
treated as a RIC.
● The
Company will be subject to corporate-level federal income tax on all of the Company’s income if the Company is unable to maintain
RIC status under Subchapter M of the Code.
● Whether
an investment in a RIC is appropriate for a Non-U.S. Stockholder will depend upon the Non-U.S. Stockholder’s particular circumstances.
|
|
|
|
|
|
|
|
|
| Annual Dividend Payment |
|
0.55
|
$ 0.45
|
$ 0.39
|
$ 0.39
|
|
|
|
|
|
|
|
|
$ 1.78
|
|
|
|
|
|
|
|
|
| Share Price [Table Text Block] |
|
|
|
|
|
|
|
|
|
|
|
|
|
Share Price Data
The following table sets forth, for the quarters indicated,
the highest and lowest prices on the NASDAQ Global Select Market per share of common stock, and the NAV per share and the premium to or
discount from NAV, on the date of each of the high and low market prices. The table also sets forth the number of Shares traded on the
NASDAQ Global Select Market during the respective quarters.
| |
|
|
|
|
|
|
|
|
|
|
|
|
|
Premium/ |
|
|
|
|
| |
|
|
|
|
|
|
|
NASDAQ |
|
|
(Discount) |
|
|
|
|
| |
|
NAV per Share |
|
|
Global Select |
|
|
to NAV |
|
|
|
|
| |
|
on Date of |
|
|
Market Price |
|
|
on Date of |
|
|
|
|
| During |
|
Market Price(1) |
|
|
Per Share(2) |
|
|
Market Price(3) |
|
|
Trading |
|
| Quarter Ended |
|
High |
|
|
Low |
|
|
High |
|
|
Low |
|
|
High |
|
|
Low |
|
|
Volume(4) |
|
| March 31, 2021 |
|
$ |
21.62 |
|
|
$ |
21.62 |
|
|
$ |
21.00 |
|
|
$ |
19.22 |
|
|
|
(2.9 |
)% |
|
|
(11.1 |
)% |
|
|
1,058,800 |
|
| June 30, 2021 |
|
$ |
21.85 |
|
|
$ |
21.85 |
|
|
$ |
22.20 |
|
|
$ |
19.52 |
|
|
|
1.6 |
% |
|
|
(10.7 |
)% |
|
|
1,279,200 |
|
| September 30, 2021 |
|
$ |
21.86 |
|
|
$ |
21.86 |
|
|
$ |
22.60 |
|
|
$ |
21.07 |
|
|
|
3.4 |
% |
|
|
(3.6 |
)% |
|
|
654,941 |
|
| December 31, 2021 |
|
$ |
21.70 |
|
|
$ |
21.70 |
|
|
$ |
24.19 |
|
|
$ |
21.10 |
|
|
|
11.5 |
% |
|
|
(2.8 |
)% |
|
|
668,890 |
|
| March 31, 2022 |
|
$ |
21.44 |
|
|
$ |
21.44 |
|
|
$ |
21.75 |
|
|
$ |
21.20 |
|
|
|
1.4 |
% |
|
|
(1.1 |
)% |
|
|
701,814 |
|
| June 30, 2022 |
|
$ |
20.94 |
|
|
$ |
20.94 |
|
|
$ |
19.69 |
|
|
$ |
19.07 |
|
|
|
(6.0 |
)% |
|
|
(8.9 |
)% |
|
|
753,477 |
|
| September 30, 2022 |
|
$ |
20.74 |
|
|
$ |
20.74 |
|
|
$ |
17.40 |
|
|
$ |
16.86 |
|
|
|
(16.1 |
)% |
|
|
(18.7 |
)% |
|
|
934,517 |
|
| December 31, 2022 |
|
$ |
20.79 |
|
|
$ |
20.79 |
|
|
$ |
17.31 |
|
|
$ |
16.83 |
|
|
|
(16.7 |
)% |
|
|
(19.0 |
)% |
|
|
1,160,000 |
|
| March 31, 2023 |
|
$ |
20.62 |
|
|
$ |
20.62 |
|
|
$ |
18.16 |
|
|
$ |
16.75 |
|
|
|
(11.9 |
)% |
|
|
(18.8 |
)% |
|
|
1,110,000 |
|
| June 30, 2023 |
|
$ |
21.29 |
|
|
$ |
21.29 |
|
|
$ |
17.06 |
|
|
$ |
16.63 |
|
|
|
(19.9 |
)% |
|
|
(21.9 |
)% |
|
|
990,214 |
|
| September 30, 2023 |
|
$ |
21.59 |
|
|
$ |
21.59 |
|
|
$ |
18.01 |
|
|
$ |
17.41 |
|
|
|
(16.6 |
)% |
|
|
(19.4 |
)% |
|
|
1,240,000 |
|
| December 30, 2023 |
|
$ |
21.43 |
|
|
$ |
21.43 |
|
|
$ |
18.31 |
|
|
$ |
18.11 |
|
|
|
(14.6 |
)% |
|
|
(15.5 |
)% |
|
|
851,252 |
|
(1) Based on our computations.
(2) Source: The NASDAQ Global Select Market.
(3) Based on our computations.
(4) Source: Bloomberg.
|
|
|
|
|
|
|
|
|
| Lowest Price or Bid |
[11] |
18.11
|
17.41
|
16.63
|
16.75
|
16.83
|
$ 16.86
|
$ 19.07
|
$ 21.2
|
21.1
|
$ 21.07
|
$ 19.52
|
$ 19.22
|
|
|
|
|
|
|
|
|
|
| Highest Price or Bid |
[11] |
18.31
|
18.01
|
17.06
|
18.16
|
17.31
|
17.4
|
19.69
|
21.75
|
24.19
|
22.6
|
22.2
|
21
|
|
|
|
|
|
|
|
|
|
| Lowest Price or Bid, NAV |
[12] |
21.43
|
21.59
|
21.29
|
20.62
|
20.79
|
20.74
|
20.94
|
21.44
|
21.7
|
21.86
|
21.85
|
21.62
|
|
|
|
|
|
|
|
|
|
| Highest Price or Bid, NAV |
[12] |
$ 21.43
|
$ 21.59
|
$ 21.29
|
$ 20.62
|
$ 20.79
|
$ 20.74
|
$ 20.94
|
$ 21.44
|
$ 21.7
|
$ 21.86
|
$ 21.85
|
$ 21.62
|
|
|
|
|
|
|
|
|
|
| Highest Price or Bid, Premium (Discount) to NAV [Percent] |
[12] |
(14.60%)
|
(16.60%)
|
(19.90%)
|
(11.90%)
|
(16.70%)
|
(16.10%)
|
(6.00%)
|
1.40%
|
11.50%
|
3.40%
|
1.60%
|
(2.90%)
|
|
|
|
|
|
|
|
|
|
| Lowest Price or Bid, Premium (Discount) to NAV [Percent] |
[12] |
(15.50%)
|
(19.40%)
|
(21.90%)
|
(18.80%)
|
(19.00%)
|
(18.70%)
|
(8.90%)
|
(1.10%)
|
(2.80%)
|
(3.60%)
|
(10.70%)
|
(11.10%)
|
|
|
|
|
|
|
|
|
|
| Share Price |
|
$ 18.16
|
|
|
|
$ 17.04
|
|
|
|
$ 21.97
|
|
|
|
$ 18.16
|
19.25
|
22.3
|
19.3
|
20.13
|
18.69
|
16.3
|
19.47
|
|
| NAV Per Share |
|
$ 21.43
|
|
|
|
$ 20.79
|
|
|
|
$ 21.7
|
|
|
|
$ 21.43
|
$ 21.44
|
$ 21.83
|
$ 21.43
|
$ 21.56
|
$ 21.22
|
$ 21.62
|
$ 21.86
|
$ 23.07
|
| Latest Premium (Discount) to NAV [Percent] |
|
|
|
|
|
|
|
|
|
|
|
|
|
15.26%
|
|
|
|
|
|
|
|
|
| Capital Stock, Long-Term Debt, and Other Securities [Abstract] |
|
|
|
|
|
|
|
|
|
|
|
|
|
|
|
|
|
|
|
|
|
|
| Security Title [Text Block] |
[8],[9] |
|
|
|
|
|
|
|
|
|
|
|
|
Credit
Facility
|
|
|
|
|
|
|
|
|
| Risks Related To Investing In Banking Sector [Member] |
|
|
|
|
|
|
|
|
|
|
|
|
|
|
|
|
|
|
|
|
|
|
| General Description of Registrant [Abstract] |
|
|
|
|
|
|
|
|
|
|
|
|
|
|
|
|
|
|
|
|
|
|
| Risk [Text Block] |
|
|
|
|
|
|
|
|
|
|
|
|
|
Risks Related to Investing in the Banking
Sector.
The Company’s assets
will be concentrated in the banking industry, potentially exposing the Company to greater risks than companies that invest in multiple
sectors.
● The
Company primarily invests in equity and debt securities issued by banks, subjecting the Company to unique risks.
● All
of the Company’s investments are subject to liquidity risk, but the Company may face higher liquidity risk if the Company invests
in debt obligations and other securities that are unrated and issued by banks that have no corporate rating.
● The
Company expects to keep the Company’s portfolio of securities and investments focused on the bank sector, which would make the Company
more economically vulnerable in the event of a downturn in the banking industry.
● A
large number of banks may fail during times of economic stress.
● The
Company expects to keep the Company’s portfolio of securities and investments focused on the bank sector including community banks
whose business is subject to greater lending risks than larger banks.
|
|
|
|
|
|
|
|
|
| Risks Related To Banking Regulations And Banking Investments Affecting Company Business [Member] |
|
|
|
|
|
|
|
|
|
|
|
|
|
|
|
|
|
|
|
|
|
|
| General Description of Registrant [Abstract] |
|
|
|
|
|
|
|
|
|
|
|
|
|
|
|
|
|
|
|
|
|
|
| Risk [Text Block] |
|
|
|
|
|
|
|
|
|
|
|
|
|
Risks Related to Banking Regulations and
Banking Investments Affecting the Company’s Business
● The
banking institutions in which the Company invests, including global money center banks, are subject to substantial regulations that could
adversely affect their ability to operate and the value of the Company’s investments. In addition, geopolitical instability, natural
disasters, including outbreaks of infectious diseases, or in times of significant global market downturns, which may impact the value
of regulatory capital securities or other investments.
● Regulatory
capital securities are subject to several risks. Banking regulators could change or amend existing banking regulations which could affect
the regulatory treatment of regulatory capital securities, where stricter regulation could make regulatory capital securities less desirable,
or undesirable, for banks to issue, reducing the supply of new investments. Should an adverse regulatory development occur in the future,
it would likely result in the bank issuer of such securities being able to redeem an investment early, which subjects the Company to reinvestment
risk. Regulatory capital securities remain subject to the same sector specific and other risks as any banking-related investment that
the Company may acquire, including, but not limited to, credit risk, interest rate risk, currency risk, prepayments, adverse changes in
market value or liquidity and the quality of the loans extended by each bank to its clients.
● The
Company may become subject to adverse current or future banking regulations.
● Ownership
of the Company’s stock by certain types of regulated institutions may subject the Company to additional regulations.
● Investments
in banking institutions and transactions related to the Company’s portfolio investments may require approval from one or more regulatory
authorities.
● If
the Company were deemed to be a bank holding company or thrift holding company, bank holding companies or thrift holding companies that
invest in the Company would be subject to certain restrictions and regulations.
● The
Financial Accounting Standards Board, or FASB, has issued a new credit impairment model, the Current Expected Credit Loss, or CECL model,
which must be implemented by banks and certain other companies beginning in 2021. Under the CECL model, entities subject to the model
will be required to present certain financial assets carried at amortized cost, such as loans held for investment and held-to-maturity
debt securities, at the net amount expected to be collected. The measurement of expected credit losses is to be based on information about
past events, including historical experience, current conditions, and reasonable and supportable forecasts that affect the collectability
of the reported amount. This measurement will take place at the time the financial asset is first added to the balance sheet and periodically
thereafter. This differs significantly from the "incurred loss" model, which delays recognition until it is probable a loss
has been incurred. CECL may create more volatility in the companies in which the Company invests, and this in turn could affect the value
of the Company’s portfolio.
|
|
|
|
|
|
|
|
|
| Risks Related To Company Investments [Member] |
|
|
|
|
|
|
|
|
|
|
|
|
|
|
|
|
|
|
|
|
|
|
| General Description of Registrant [Abstract] |
|
|
|
|
|
|
|
|
|
|
|
|
|
|
|
|
|
|
|
|
|
|
| Risk [Text Block] |
|
|
|
|
|
|
|
|
|
|
|
|
|
Risks Related to the Company’s Investments
● The
Company’s investments will be subject to dividend and interest rate fluctuations, and the Company is subject to interest rate risk.
In particular, the Company’s investments in subordinated or unsecured debt securities that are perpetual or have maturities in excess
of ten years subject the Company to a high degree of interest rate risk.
● Most
of the Company’s assets will be unrated, illiquid, and their fair value may not be readily determinable. As a consequence, the Company
may be unable to sell such assets at an attractive value for a period of time, if at all. The assets in which the Company invests may
not be publicly rated by any rating agency, and may have greater credit and liquidity risks than investment-grade corporate obligations
that are publicly rated.
|
|
|
|
|
|
|
|
|
| Risks Related To Use Of Leverage [Member] |
|
|
|
|
|
|
|
|
|
|
|
|
|
|
|
|
|
|
|
|
|
|
| General Description of Registrant [Abstract] |
|
|
|
|
|
|
|
|
|
|
|
|
|
|
|
|
|
|
|
|
|
|
| Risk [Text Block] |
|
|
|
|
|
|
|
|
|
|
|
|
|
Risks Related to the Company’s Use
of Leverage
● The
Company currently has a bank loan to finance investments as a form of leverage. the Company also has authority to issue preferred stock
or engage in reverse repurchase agreements to finance investments.
● Leverage
exaggerates the effects of market downturns or upturns on the NAV and market value of the Company’s common stock, as well as on
distributions to holders of the Company’s common stock.
● Leverage
can also increase the volatility of the Company’s NAV, and expenses related to leverage can reduce the Company’s income.
● In
the case of leverage, if the Company’s assets decline in value so that asset coverage requirements for any borrowings or preferred
stock would not be met, the Company may be prevented from paying distributions, which could jeopardize the Company’s qualification
for pass- through tax treatment, make the Company liable for excise taxes and/or force the Company to sell portfolio securities at an
inopportune time.
● The
use of leverage through investments such as CLO equity or junior debt securities that inherently involve leverage, may magnify the Company’s
risk of loss. CLO equity or junior debt securities are very highly leveraged, and therefore the CLO securities in which the Company is
currently invested and in which the Company intends to invest are subject to a higher degree of loss since the use of leverage magnifies
losses.
● The
Company utilizes a revolving credit agreement with Texas Capital Bank to provide for a maximum borrowing amount of $70 million and a fee
of Secured Overnight Funding Rate (“SOFR”) +2.61%,
with a maturity date of May 2025 (the “Credit Facility”).
● The
Credit Facility imposes asset coverage requirements, which are more stringent than those imposed by the Investment Company Act, or by
the Company’s policies. In addition, the Company agreed not to purchase assets not contemplated by the investment policies and restrictions
in effect when the Credit Facility became effective unless changes to these policies and restrictions are consented to by Texas Capital
Bank.
● The
covenants or guidelines under the Credit Facility could impede the Adviser from fully managing the Company’s portfolio in accordance
with the Company’s investment objectives and policies. Furthermore, non-compliance with such covenants or the occurrence of other
events could lead to the cancellation of the Credit Facility.
● For
as long as the Credit Facility remains in effect, the Company may not incur additional debt under any other facility, except in limited
circumstances.
● The
Credit Facility allows the Company to prepay borrowings under the Credit Facility at any time. The Company does not anticipate that such
guidelines will have a material adverse effect on the holders of the Company’s common stock or on the Company’s ability to
achieve the Company’s investment objectives. The Company may also consider alternative measures of obtaining leverage in the future.
|
|
|
|
|
|
|
|
|
| Risks Related To Company Operations [Member] |
|
|
|
|
|
|
|
|
|
|
|
|
|
|
|
|
|
|
|
|
|
|
| General Description of Registrant [Abstract] |
|
|
|
|
|
|
|
|
|
|
|
|
|
|
|
|
|
|
|
|
|
|
| Risk [Text Block] |
|
|
|
|
|
|
|
|
|
|
|
|
|
Risks Related to the
Company’s Operations
● The
Company’s performance is highly dependent on the Adviser. The Adviser may rely on assumptions that prove to be incorrect.
● The
Adviser and its affiliates may serve as investment adviser to other funds, investment vehicles and investors, which may create conflicts
of interest not in the best interest of the Company or the Company’s stockholders.
● The
Company may generate low or negative rates of return on capital, and the Company may not be able to execute the Company’s business
plans as expected, if at all.
● The
Company’s business model depends to a significant extent upon strong referral relationships, and the Company’s inability to
maintain or develop these relationships, as well as the failure of these relationships to generate investment opportunities, could adversely
affect the Company’s business.
● If
the Company is unable to source investments effectively, the Company may be unable to achieve the Company’s investment objective.
● The
Company’s quarterly results may fluctuate.
● The
Company makes distributions to the Company’s stockholders on a quarterly basis. If the amount of any distribution exceeds the Company’s
net investment income or capital gains, then all or a portion of such distribution could constitute a return of capital to stockholders
rather than dividend income for tax purposes. A return of capital distribution has the effect of lowering stockholders’ basis in
their shares, which will result in higher tax liability when the shares are sold, even if such shares have not increased in value or have,
in fact, lost value. In addition to the tax consequences, such a distribution is a return of a shareholder’s own investment, but
distributed net of Company expenses, and will decrease the funds available for investment by the Company.
● Financing
arrangements with lenders or preferred shareholders may limit the Company’s ability to make dividend payments to the Company’s
stockholders.
● The
Company may change the Company’s business strategy and operational policies without stockholder consent (unless stockholder consent
is specifically required by the Investment Company Act), which may result in a determination to pursue riskier business activities.
● Laws
and regulations may prohibit the banks in which the Company invests from paying interest and/or dividends to the Company.
● Legal
and regulatory changes could occur that may adversely affect the Company.
● The
Company may be required to register as a commodity pool operator.
● Market
fluctuations caused by force majeure, terrorism, global pandemics, or certain other acts may adversely affect the Company’s performance.
The recent global outbreak of the COVID-19 virus and the resulting pandemic has disrupted economic markets and the economic impact, duration
and spread of the COVID-19 pandemic remains uncertain at this time. The operational and financial performance of some of the portfolio
banks in which the Company makes investments may be impacted by COVID-19, which may in turn impact the valuation of the Company’s
investments and results of the Company’s operations.
● Changes
in interest rates may affect the Company’s net investment income, reinvestment risk and the probability of defaults of the Company’s
investments.
|
|
|
|
|
|
|
|
|
| Risks Related To Adviser And Affiliates [Member] |
|
|
|
|
|
|
|
|
|
|
|
|
|
|
|
|
|
|
|
|
|
|
| General Description of Registrant [Abstract] |
|
|
|
|
|
|
|
|
|
|
|
|
|
|
|
|
|
|
|
|
|
|
| Risk [Text Block] |
|
|
|
|
|
|
|
|
|
|
|
|
|
Risks Related to the
Adviser and/or its Affiliates
● The
Company’s performance is dependent on the Adviser, and the Company may not find a suitable replacement if the management agreement
is terminated.
● The
departure or death of any of the members of senior management of the Adviser or ArrowMark Partners may adversely affect the Company’s
ability to achieve the Company’s business objective; The Company’s management agreement does not require the availability
to the Company of any particular individuals.
● If
the Adviser ceases to be the Company’s manager under the Company’s management agreement, financial institutions that provided
the Company’s credit facilities may not provide future financing to the Company.
● The
Adviser’s liability is limited under the Company’s management agreement, and the Company has agreed to indemnify the Adviser
against certain liabilities.
● There
may be potential conflicts of interest between the Company’s management and the Adviser, on one hand, and the interest of the Company’s
common stockholders, on the other.
● The
Company is limited in the Company’s ability to conduct transactions with affiliates.
● The
Adviser’s investment committee is not independent from its management.
● The
Company may compete with the Adviser’s current and future investment vehicles for access to capital and assets.
● There
may be other conflicts of interest in the Company’s relationship with the Adviser and/or its affiliates that could negatively affect
the Company’s earnings.
● The
Adviser’s management of the Company’s business is subject to the oversight of the Company’s board of directors, but
the Company’s board of directors will not approve each business decision made by the Adviser.
● The
Adviser may be incentivized to incur additional leverage, up to the extent permitted by regulations, even if additional leverage is not
in the best interests of the Company’s stockholders.
|
|
|
|
|
|
|
|
|
| Risks Related To Offerings [Member] |
|
|
|
|
|
|
|
|
|
|
|
|
|
|
|
|
|
|
|
|
|
|
| General Description of Registrant [Abstract] |
|
|
|
|
|
|
|
|
|
|
|
|
|
|
|
|
|
|
|
|
|
|
| Risk [Text Block] |
|
|
|
|
|
|
|
|
|
|
|
|
|
Risks Related to Offerings
● The
price for the Company’s common stock may be volatile.
● The
price for the Company’s common stock is subject to market risk.
● Future
offerings of debt securities or preferred stock, which would rank senior to the Company’s common stock upon the Company’s
liquidation, and future offerings of equity securities, which would dilute the Company’s existing stockholders and may be senior
to the Company’s common stock for the purposes of dividend and liquidating distributions, may adversely affect the market value
of the Company’s common stock.
|
|
|
|
|
|
|
|
|
| Risks Related To Taxation [Member] |
|
|
|
|
|
|
|
|
|
|
|
|
|
|
|
|
|
|
|
|
|
|
| General Description of Registrant [Abstract] |
|
|
|
|
|
|
|
|
|
|
|
|
|
|
|
|
|
|
|
|
|
|
| Risk [Text Block] |
|
|
|
|
|
|
|
|
|
|
|
|
|
Risks Related to Taxation
● Despite
the Company’s election to be treated as a RIC, the Company may not be able to meet the requirements to maintain an election to be
treated as a RIC.
● The
Company will be subject to corporate-level federal income tax on all of the Company’s income if the Company is unable to maintain
RIC status under Subchapter M of the Code.
● Whether
an investment in a RIC is appropriate for a Non-U.S. Stockholder will depend upon the Non-U.S. Stockholder’s particular circumstances.
|
|
|
|
|
|
|
|
|
|
|
