Form 6-K - Report of foreign issuer [Rules 13a-16 and 15d-16]
2023年10月27日 - 9:31PM
Edgar (US Regulatory)
UNITED STATES
SECURITIES AND EXCHANGE COMMISSION
Washington, DC 20549
FORM 6-K
REPORT OF FOREIGN PRIVATE ISSUER
PURSUANT TO RULE 13a-16 OR 15d-16
UNDER THE SECURITIES EXCHANGE ACT OF 1934
For the month of October, 2023.
Commission File Number 001-38755
Suzano S.A.
(Exact name of registrant as specified in its charter)
SUZANO INC.
(Translation of Registrant’s Name into English)
Av. Professor Magalhaes Neto, 1,752
10th Floor, Rooms 1010 and 1011
Salvador, Brazil 41 810-012
(Address of principal executive office)
Indicate by check mark whether the registrant files or will file annual reports under cover of Form 20-F or Form 40-F.
Form 20-F ⌧ Form 40-F ◻
Indicate by check mark if the registrant is submitting the Form 6-K in paper as permitted by Regulation S-T Rule 101(b)(1): ◻
Indicate by check mark if the registrant is submitting the Form 6-K in paper as permitted by Regulation S-T Rule 101(b)(7): ◻
SIGNATURE
Pursuant to the requirements of the Securities Exchange Act of 1934, the registrant has duly caused this report to be signed on its behalf by the undersigned, thereunto duly authorized.
Date: October 27, 2023
| | |
| | SUZANO S.A. |
| | |
| By: | /s/ Marcelo Feriozzi Bacci |
| Name: | Marcelo Feriozzi Bacci |
| Title: | Chief Financial and Investor Relations Officer |
3
Exhibit 99.1

| Eucalyptus fiber |
| agenda
Highlights 3Q23
Business Strategy
Financial Management |
| agenda
Highlights
3Q23 |

| With a new drop, cash cost reaches a lower level
than same quarter last year
1 Excluding Consumer Goods. | 2 Operating Cash Generation = Adjusted EBITDA less Sustaining Capex. | 3 Considers Finnvera credit line. | 4 Net Debt / Adjusted EBITDA in the last twelve months. 4
2.5 million tons
(vs. 2.8 million tons 3Q22 and
2.5 million tons 2Q23)
Pulp:
272 thousand tons
(vs. 299 thousand tons 3Q22 and
263 thousand tons 2Q23)
Paper1
:
Pulp Inventory:
Below optimum
operational levels
Adjusted EBITDA:
Operating cash generation2
:
Cash cost ex-downtimes:
R$3.7 bn
(vs. R$8.6 bn 3Q22 and
R$3.9 bn 2Q23)
R$1.9 bn
(vs. R$7.2 bn 3Q22 and
R$2.2 bn 2Q23)
R$861/ton
(vs. R$883/ton 3Q22 and
R$918/ton 2Q23)
Liquidity3
:
US$11.5 bn
(vs. US$10.7 bn 3Q22 and
R$11.3 bn 2Q23)
Leverage4
:
US$6.3 bn
(vs. US$4.7 bn 3Q22
and US$6.3 bn 2Q23)
Net debt:
2.7x in US$
(vs. 2.1x in US$ 3Q22 and
2.2x in US$ 2Q23)
Operating
Performance
Sales
Volume
Financial
Management |

| agenda
Business
Strategy |
| 6
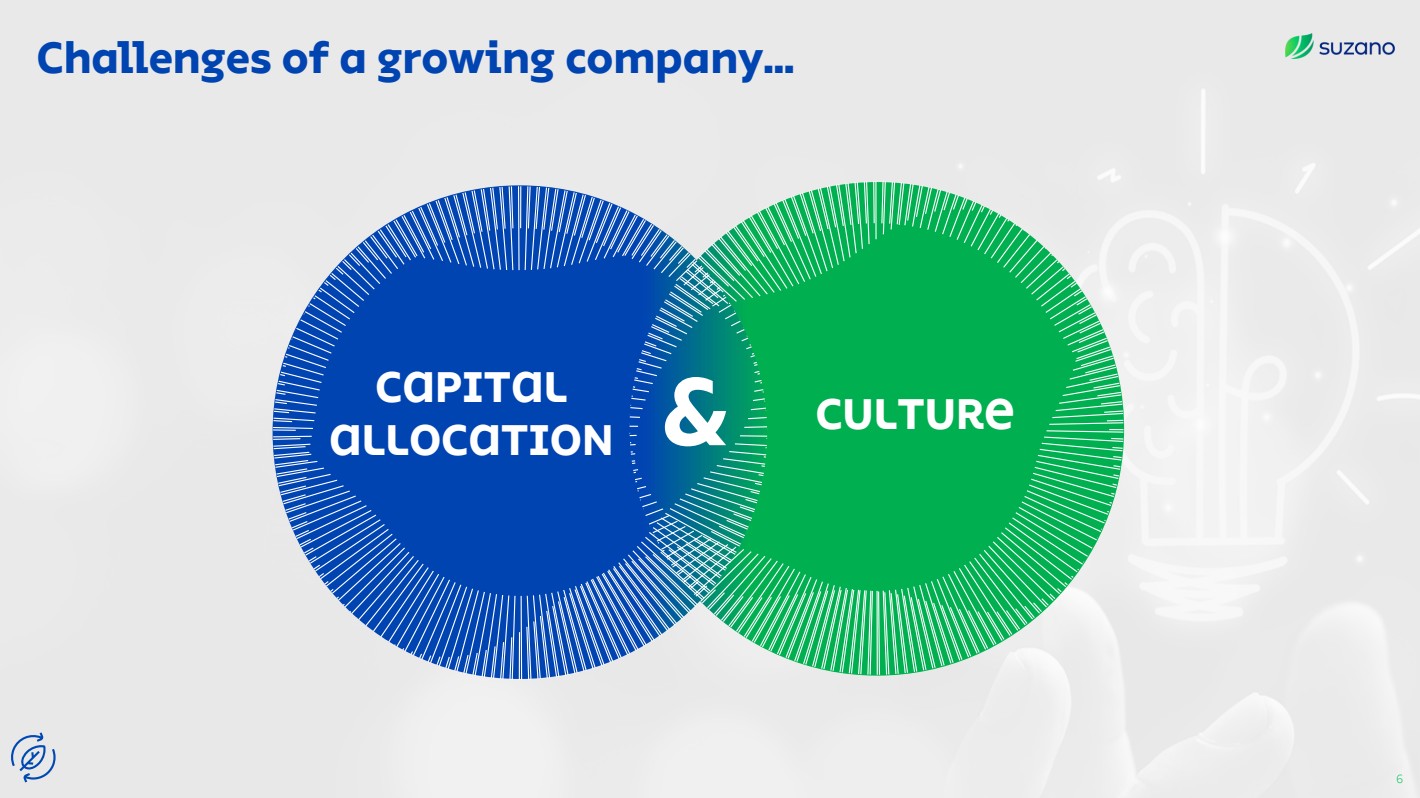
Challenges of a growing company...
CAPITAL
ALLOCATION & CULTURE |

| Source: ¹illustration based on Founder’s Mentality (Bain & Company)
Agility
Trend towards a
more complex
organization
Net benefits of size
Founder’s mentality¹ HIGH
HIGH
LOW
Focus
Purpose:
Culture drivers
It´s only good for
us if it´s good for
the world
People who inspire
and transform
Create and
share value
Renewing life inspired by trees
Processes
streamlining
&
Leadership
development
Value creation through culture development
Innovation Talent
development
7 |
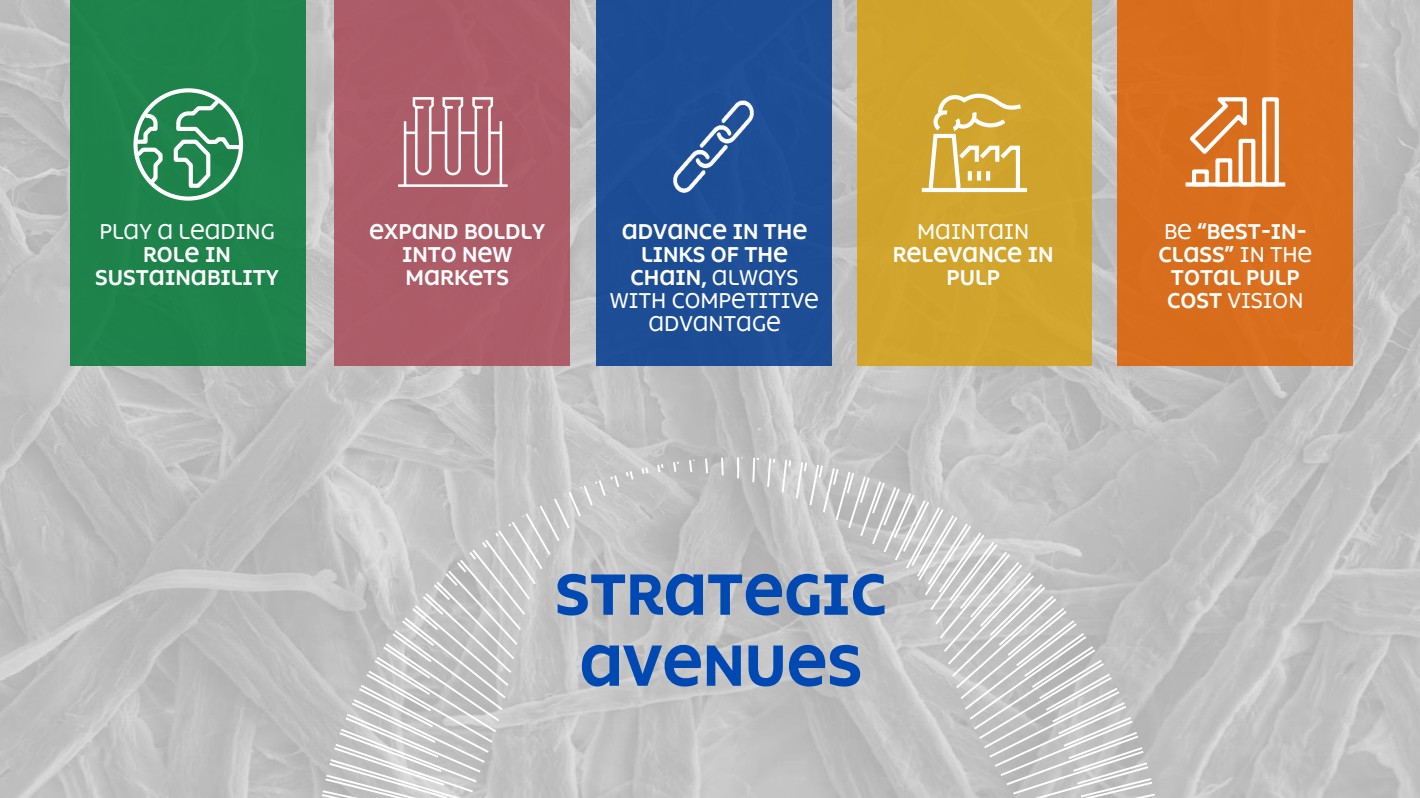
| Strategic
avenues
Play a leading
role in
sustainability
Be “Best-in-Class” in the
Total Pulp
Cost vision
Maintain
relevance in
Pulp
Expand boldly
into New
Markets
Advance in the
links of the
chain, always
with competitive
advantage |

| Expand boldly
into New
Markets |

| New bio businesses development
Textile
& MFC
Lignine Carbon
& Biomas
Bio oil
& Green energy
1 Excluding Consumer Goods. | 2 Operating Cash Generation = Adjusted EBITDA less Sustaining Capex. | 3 Considers Finnvera credit line. | 4 Net Debt / Adjusted EBITDA in the last twelve months. 10 |
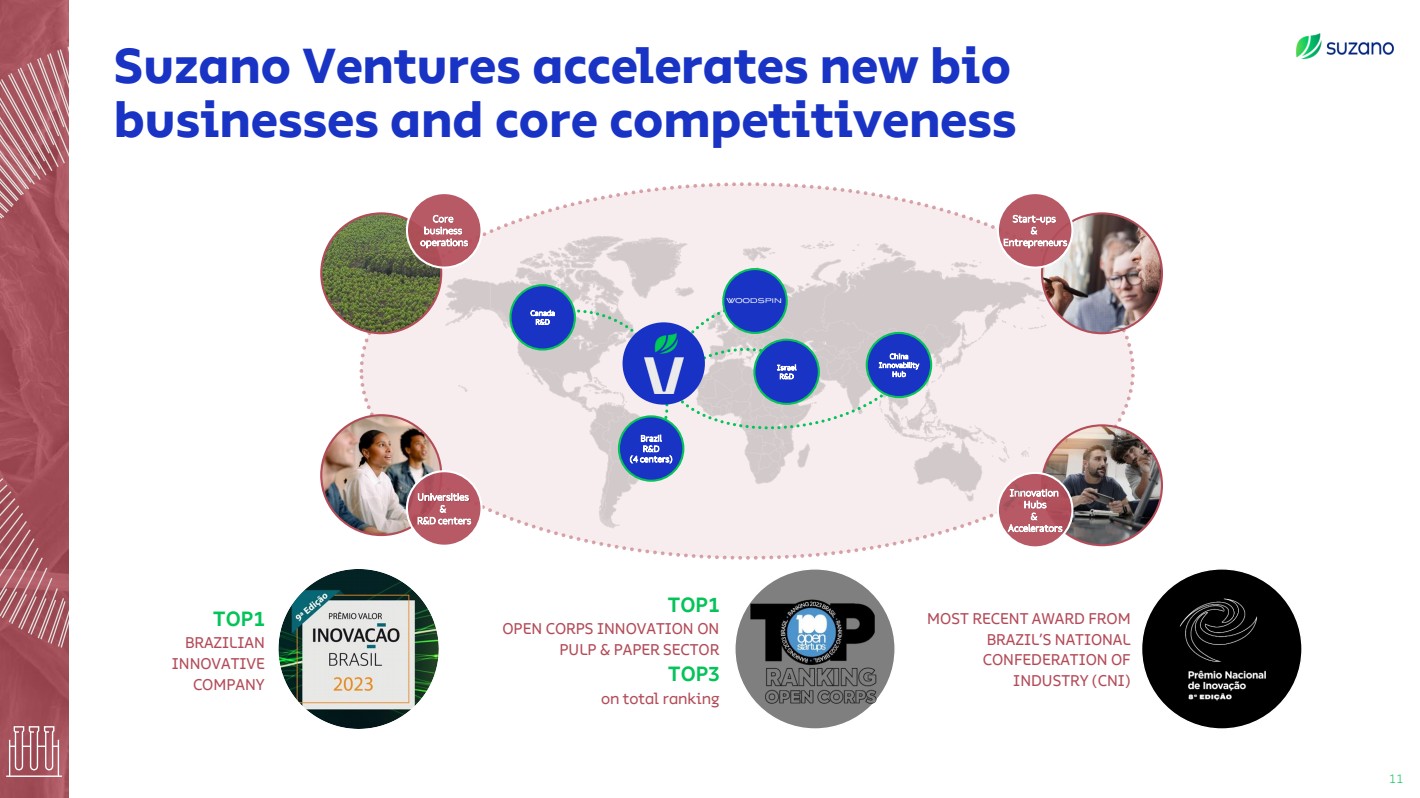
| TOP1
OPEN CORPS INNOVATION ON
PULP & PAPER SECTOR
TOP3
on total ranking
TOP1
BRAZILIAN
INNOVATIVE
COMPANY
MOST RECENT AWARD FROM
BRAZIL’S NATIONAL
CONFEDERATION OF
INDUSTRY (CNI)
Core
business
operations
Universities
&
R&D centers
Start-ups
&
Entrepreneurs
Innovation
Hubs
&
Accelerators
Canada
R&D
Israel
R&D
Brazil
R&D
(4 centers)
China
Innovability
Hub
Suzano Ventures accelerates new bio
businesses and core competitiveness
11 |
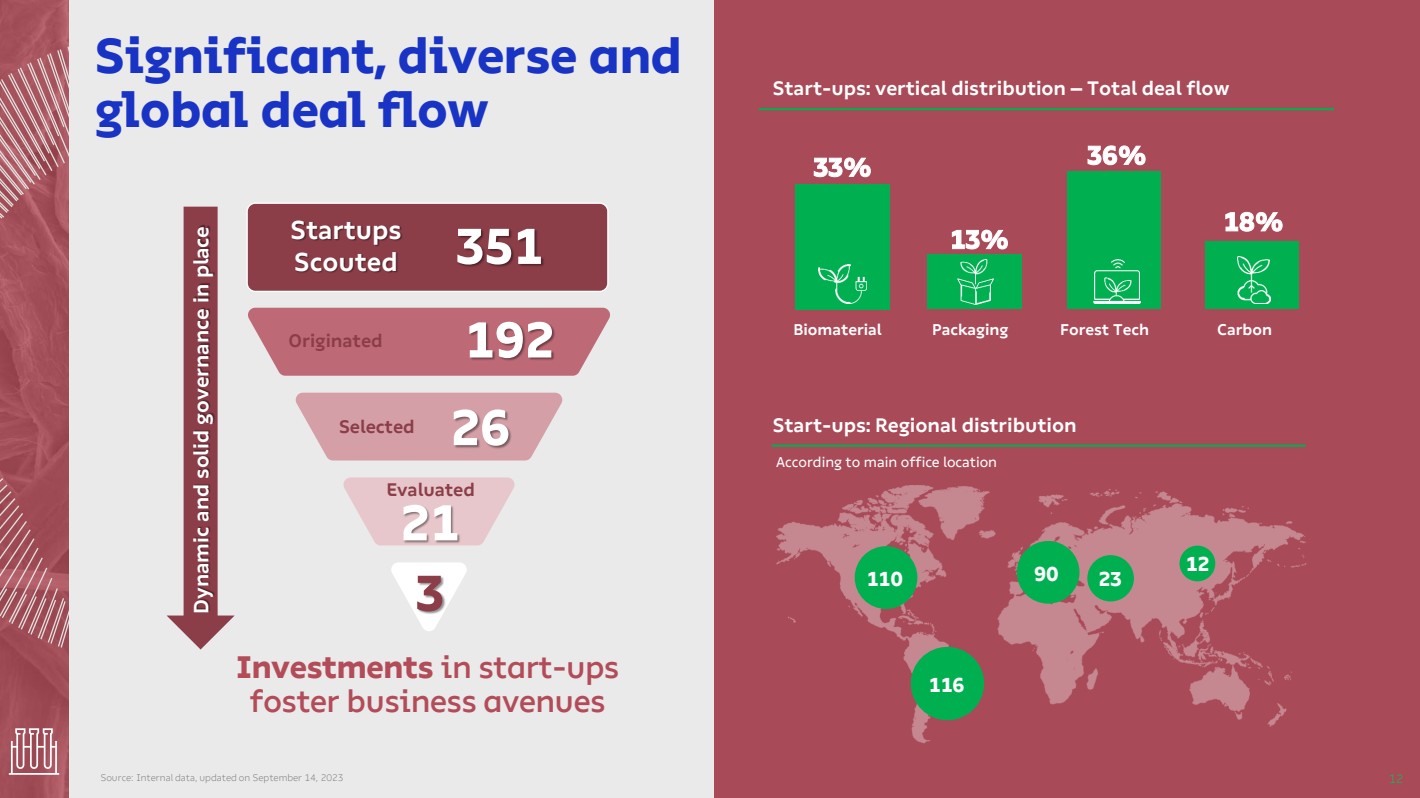
| Significant, diverse and
global deal flow
Source: Internal data, updated on September 14, 2023
Startups
Scouted 351
Investments in start-ups
foster business avenues
Start-ups: vertical distribution – Total deal flow
13%
33% 36%
18%
Biomaterial Packaging Forest Tech Carbon
According to main office location
Start-ups: Regional distribution
110
116
12 90 23
Originated 192
Selected 26
Evaluated
21
Dynamic and solid governance in place
3
12 |
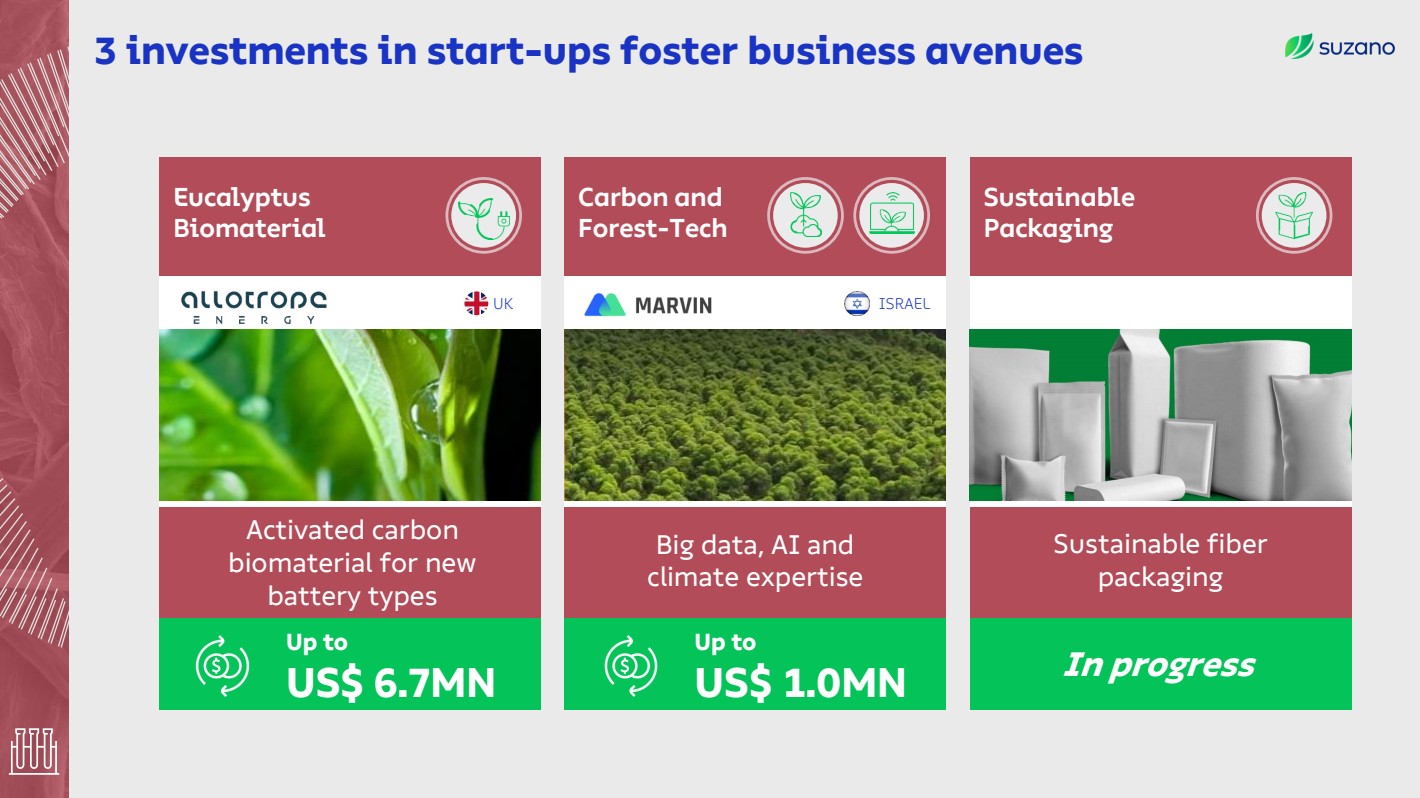
| 3 investments in start-ups foster business avenues
Eucalyptus
Biomaterial
Activated carbon
biomaterial for new
battery types
Up to
US$ 6.7MN
UK
Sustainable
Packaging
Sustainable fiber
packaging
In progress
Carbon and
Forest-Tech
Big data, AI and
climate expertise
Up to
US$ 1.0MN
ISRAEL |

| Be “Best-in-Class”
in the Total Pulp
Cost vision |
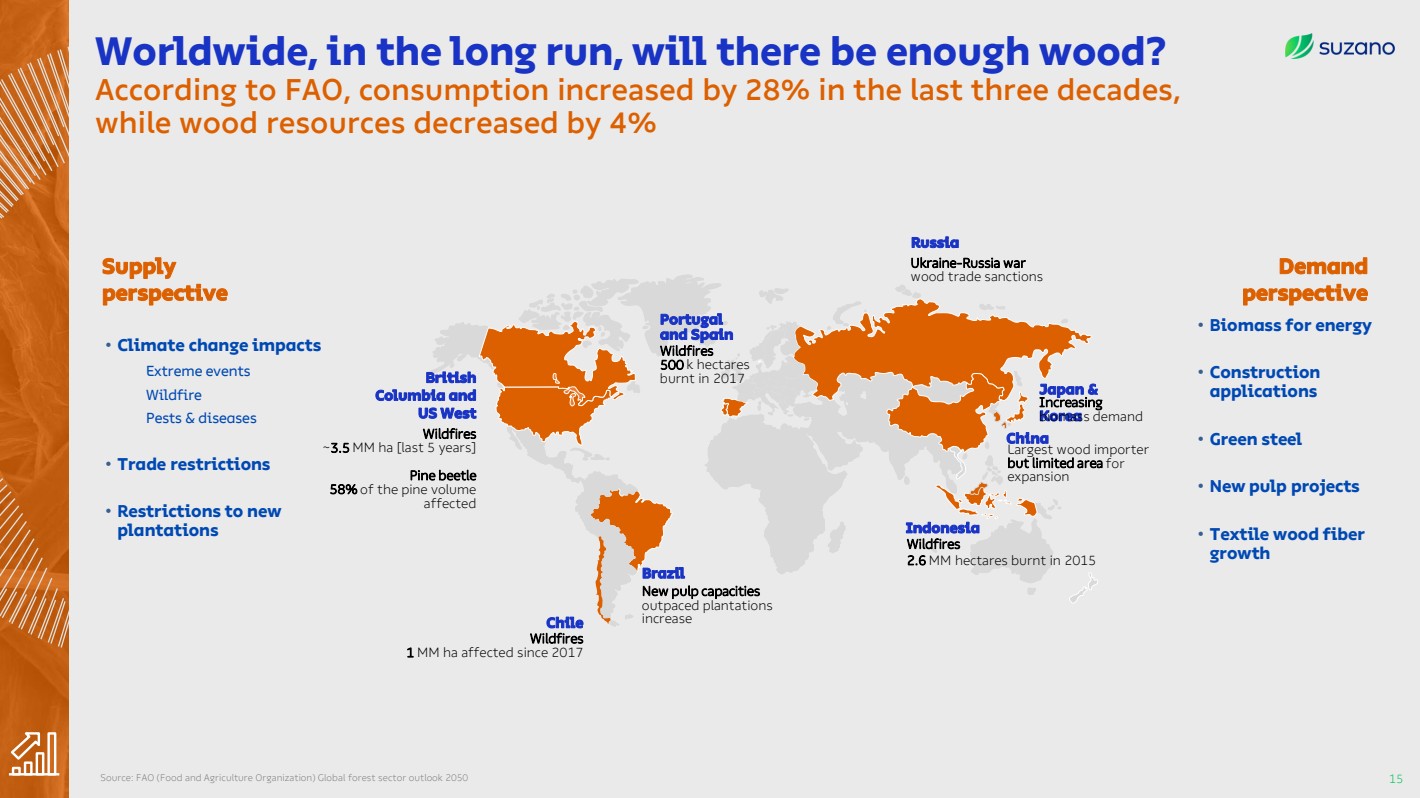
| Worldwide, in the long run, will there be enough wood?
According to FAO, consumption increased by 28% in the last three decades,
while wood resources decreased by 4%
Source: FAO (Food and Agriculture Organization) Global forest sector outlook 2050 15
Supply
perspective
Demand
perspective
Ukraine-Russia war
wood trade sanctions
Largest wood importer
but limited area for
expansion
China
Russia
British
Columbia and
US West
New pulp capacities
outpaced plantations
increase
Brazil
Chile
Wildfires
1 MM ha affected since 2017
Wildfires
500 k hectares
burnt in 2017
Indonesia
Wildfires
2.6 MM hectares burnt in 2015
Portugal
and Spain
Japan &
Korea
Increasing
biomass demand
Wildfires
~3.5 MM ha [last 5 years]
Pine beetle
58% of the pine volume
affected
• Climate change impacts
Extreme events
Wildfire
Pests & diseases
• Trade restrictions
• Restrictions to new
plantations
• Biomass for energy
• Construction
applications
• Green steel
• New pulp projects
• Textile wood fiber
growth |

| In Brazil, eucalyptus planted area has not kept up with
the growing demand for wood-based biomass
16 ¹Ibá - Brazilian Tree Industry | ²IBGE - Brazilian Institute for Geography and Statistics | ³S&P Global Average prices of farmland Reforestation, Pastureland, Grains and Sugarcane, in Real Terms | 4Pöyry/AFRY BRL Price Index Stumpage Over Bark – Real Terms.
199
2018 2019 2020 2021 2022 2023
Pulpwood average BRL market price index
eucalyptus4
(base 100 – 2018)
2018 2021
+10%
6.8
7.5
Eucalyptus planted area¹
Million ha
2018 2021
+26%
138
174
Eucalyptus consumption²
Million m³
• Increasing planting costs
• Climate uncertainty and yield
losses in some regions
• New pulp projects
• Biomass to replace natural gas
• Woodchip to grain drying
• Biomass for corn ethanol mills
Farmland Average BRL Price Index3
(Base 100 – 2018) 162
2018 2019 2020 2021 2022 2023
Rising land prices |
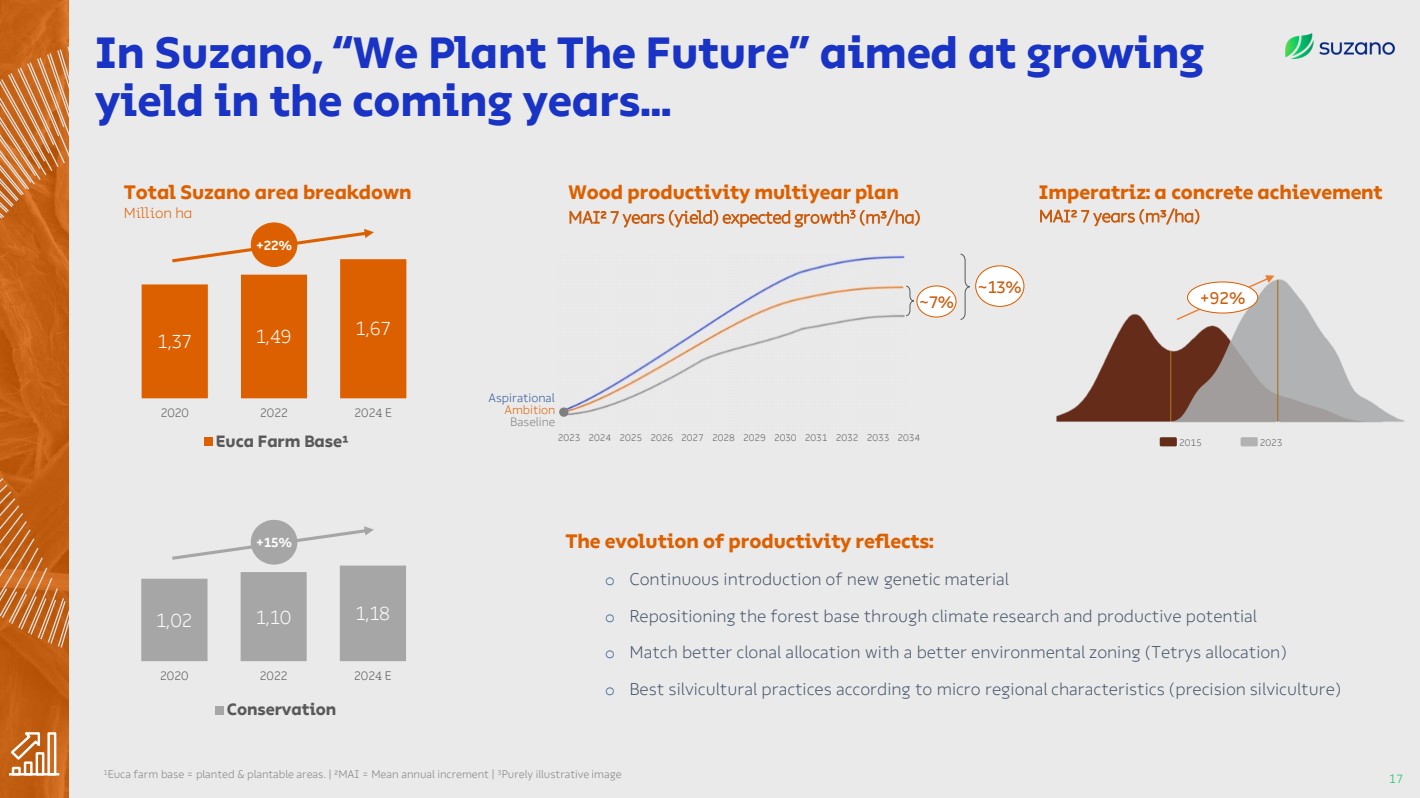
| In Suzano, “We Plant The Future” aimed at growing
yield in the coming years...
17
1Euca farm base = planted & plantable areas. | ²MAI = Mean annual increment | 3Purely illustrative image
1,02 1,10 1,18
2020 2022 2024 E
Conservation
1,37 1,49 1,67
2020 2022 2024 E
Euca Farm Base¹
Total Suzano area breakdown
Million ha
+22%
Wood productivity multiyear plan
MAI² 7 years (yield) expected growth MAI² 7 years (m³/ha) 3
(m³/ha)
~7%
~13%
2023 2024 2025 2026 2027 2028 2029 2030 2031 2032 2033 2034
Aspirational
Ambition
Baseline
+92%
2015 2023
Imperatriz: a concrete achievement
The evolution of productivity reflects:
o Continuous introduction of new genetic material
o Repositioning the forest base through climate research and productive potential
o Match better clonal allocation with a better environmental zoning (Tetrys allocation)
o Best silvicultural practices according to micro regional characteristics (precision silviculture)
+15% |
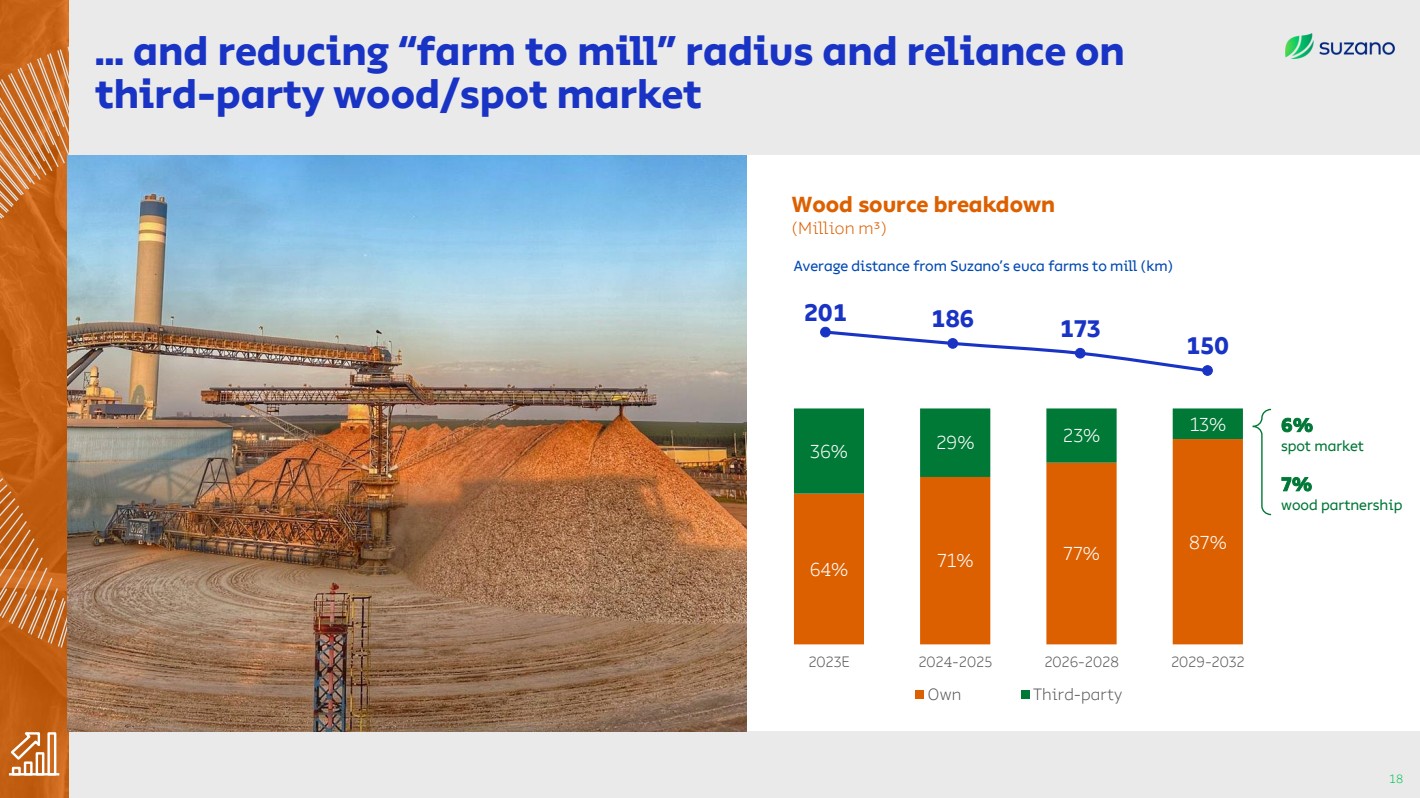
| … and reducing “farm to mill” radius and reliance on
third-party wood/spot market
18
64% 71% 77% 87%
36% 29% 23% 13%
2023E 2024-2025 2026-2028 2029-2032
Own Third-party
Average distance from Suzano’s euca farms to mill (km)
Wood source breakdown
(Million m³)
6%
spot market
7%
wood partnership
201 186 173
150 |
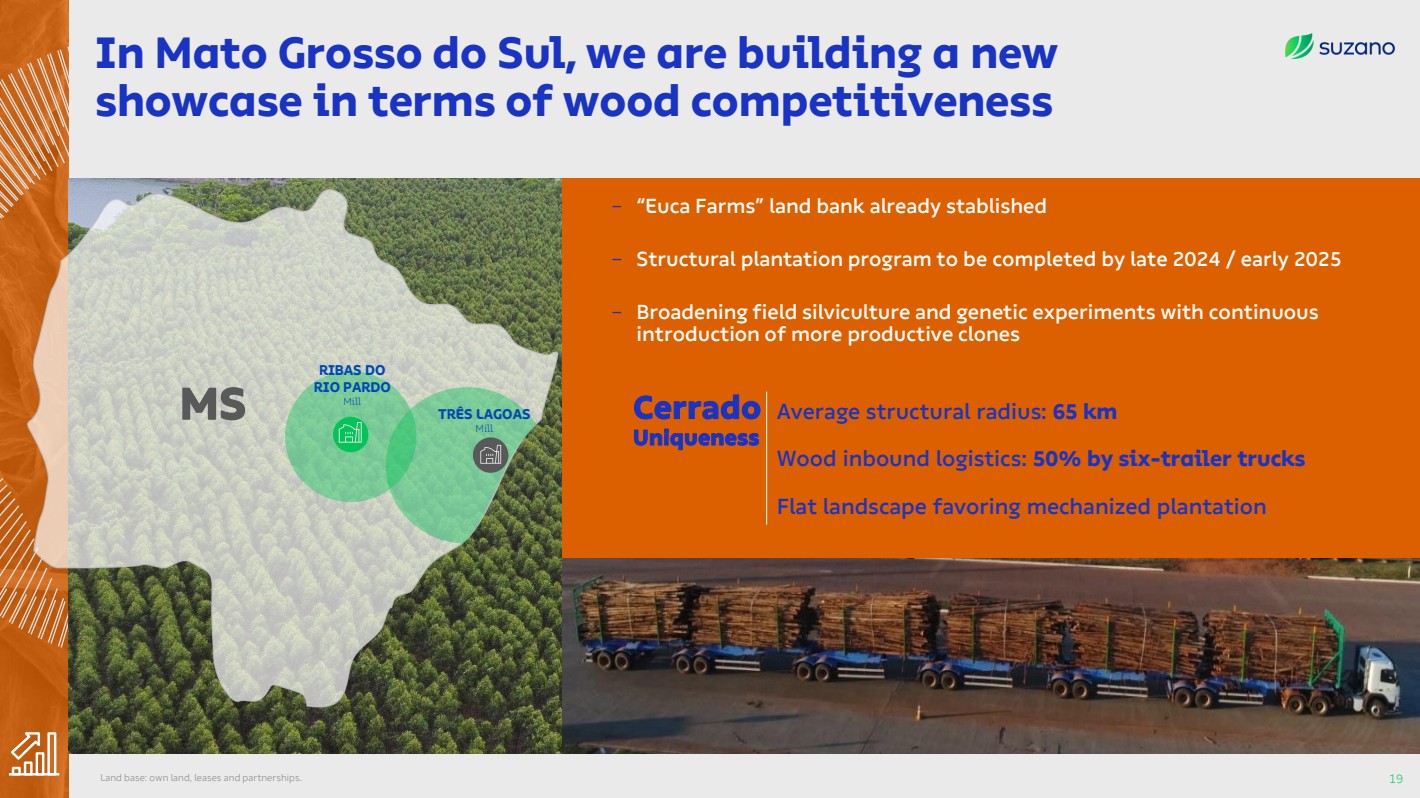
| MS TRÊS LAGOAS
Mill
RIBAS DO
RIO PARDO
Mill
In Mato Grosso do Sul, we are building a new
showcase in terms of wood competitiveness
19
− “Euca Farms” land bank already stablished
− Structural plantation program to be completed by late 2024 / early 2025
− Broadening field silviculture and genetic experiments with continuous
introduction of more productive clones
Cerrado
Uniqueness
Average structural radius: 65 km
Wood inbound logistics: 50% by six-trailer trucks
Flat landscape favoring mechanized plantation
Land base: own land, leases and partnerships. |
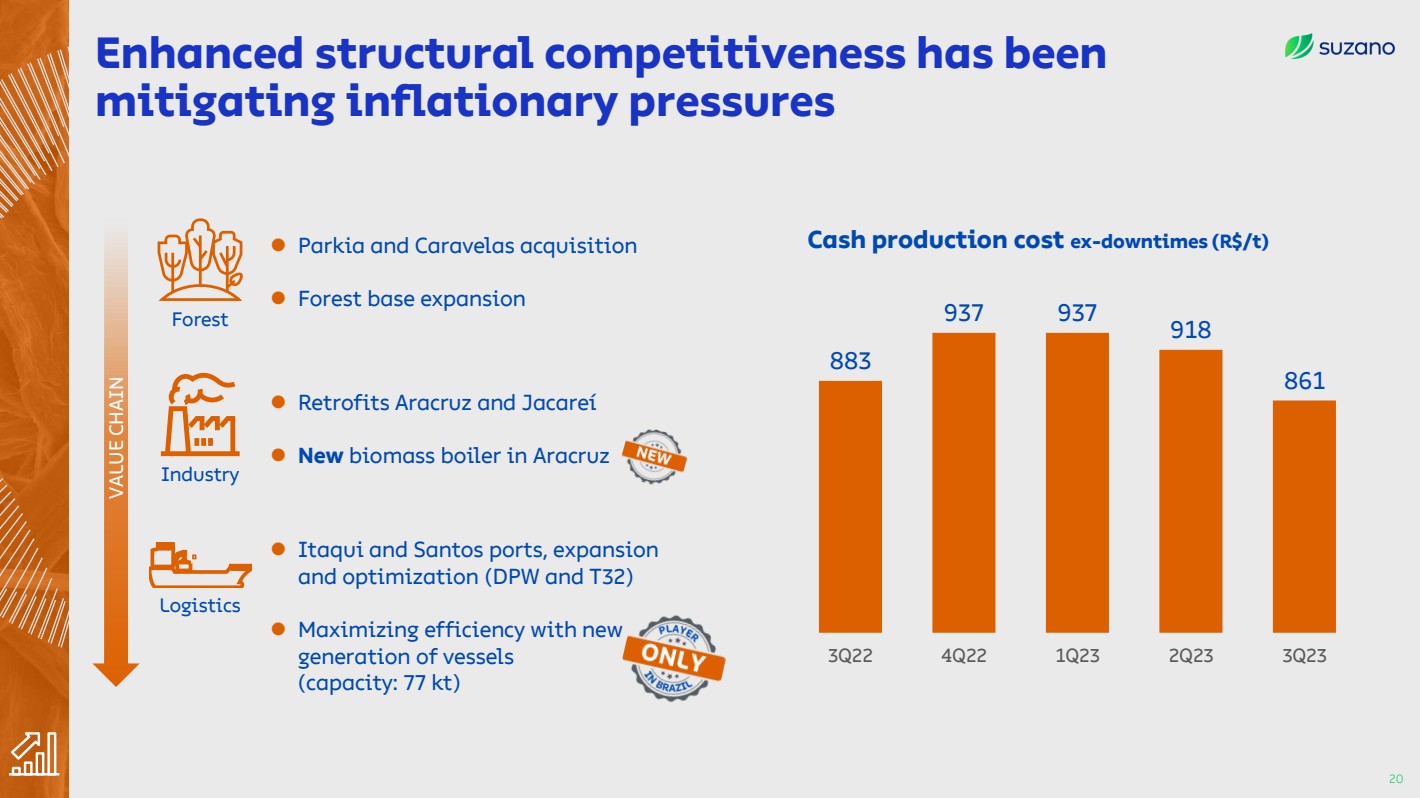
| Enhanced structural competitiveness has been
mitigating inflationary pressures
20
Forest
Industry
Logistics
⚫ Parkia and Caravelas acquisition
⚫ Forest base expansion
⚫ Retrofits Aracruz and Jacareí
⚫ New biomass boiler in Aracruz
⚫ Itaqui and Santos ports, expansion
and optimization (DPW and T32)
⚫ Maximizing efficiency with new
generation of vessels
(capacity: 77 kt)
883
937 937 918
861
3Q22 4Q22 1Q23 2Q23 3Q23
Cash production cost ex-downtimes (R$/t)
VALUE CHAIN |
| Maintain
relevance
in Pulp |
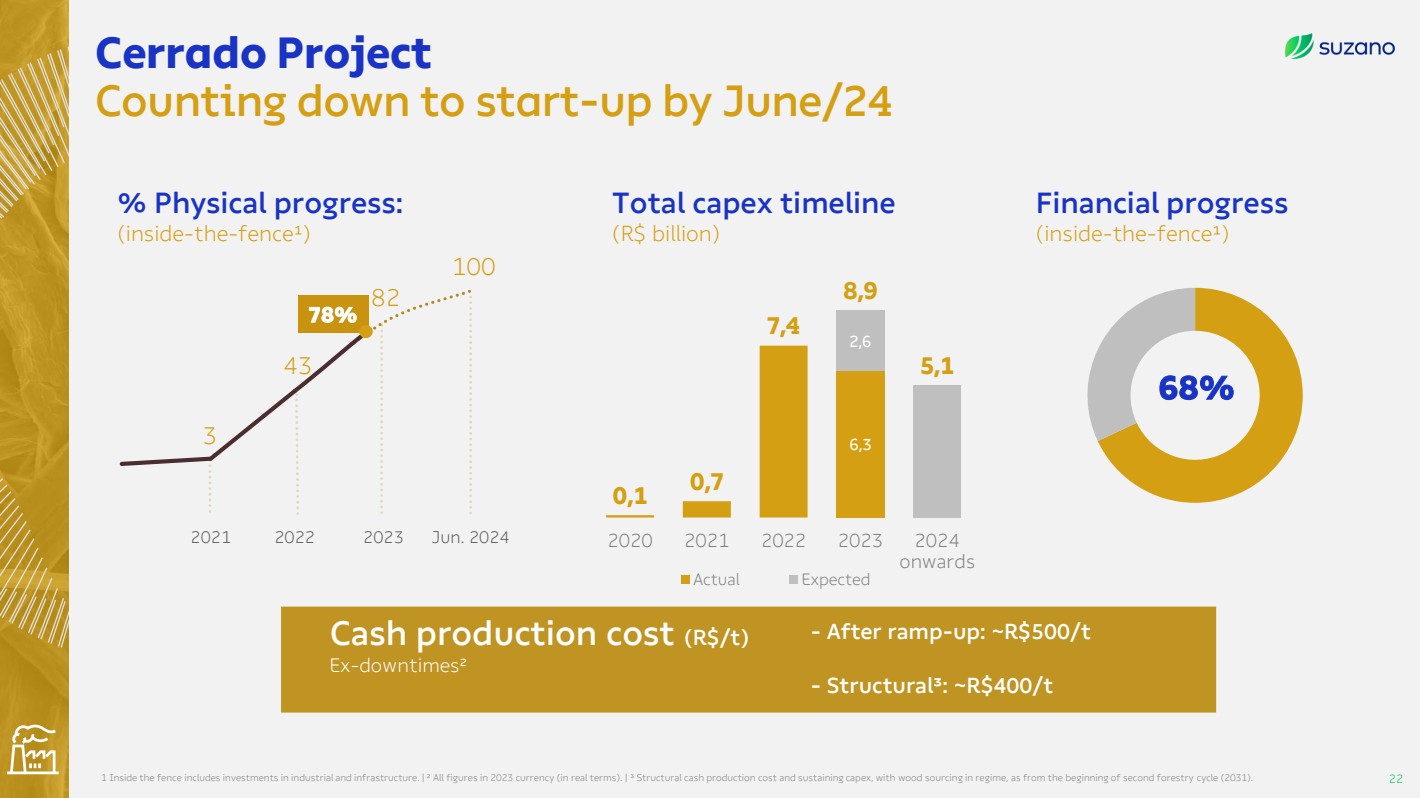
| Cerrado Project
Counting down to start-up by June/24
22
% Physical progress:
(inside-the-fence¹)
3
43
82
100
2021 2022 2023 Jun. 2024
78%
1 Inside the fence includes investments in industrial and infrastructure. | ² All figures in 2023 currency (in real terms). | ³ Structural cash production cost and sustaining capex, with wood sourcing in regime, as from the beginning of second forestry cycle (2031).
68%
Total capex timeline
(R$ billion)
6,3
2,6
0,1 0,7
7,4
8,9
5,1
2020 2021 2022 2023 2024
onwards
Actual Expected
Financial progress
(inside-the-fence¹)
Cash production cost (R$/t)
Ex-downtimes²
- After ramp-up: ~R$500/t
- Structural³: ~R$400/t |

| Cerrado Project
Counting down to a well executed learning curve
23
-
50
100
150
200
250
Month 1 Month 2 Month 3 Month 4 Month 5 Month 6 Month 7 Month 8 Month 9 Month
10
Month 11Month 12
Accumulated Monthly
Monthly production rate (t/month)
Learning curve
conclusion
Scheduled
downtime 2 MM t
Learning curve of
~9 months |
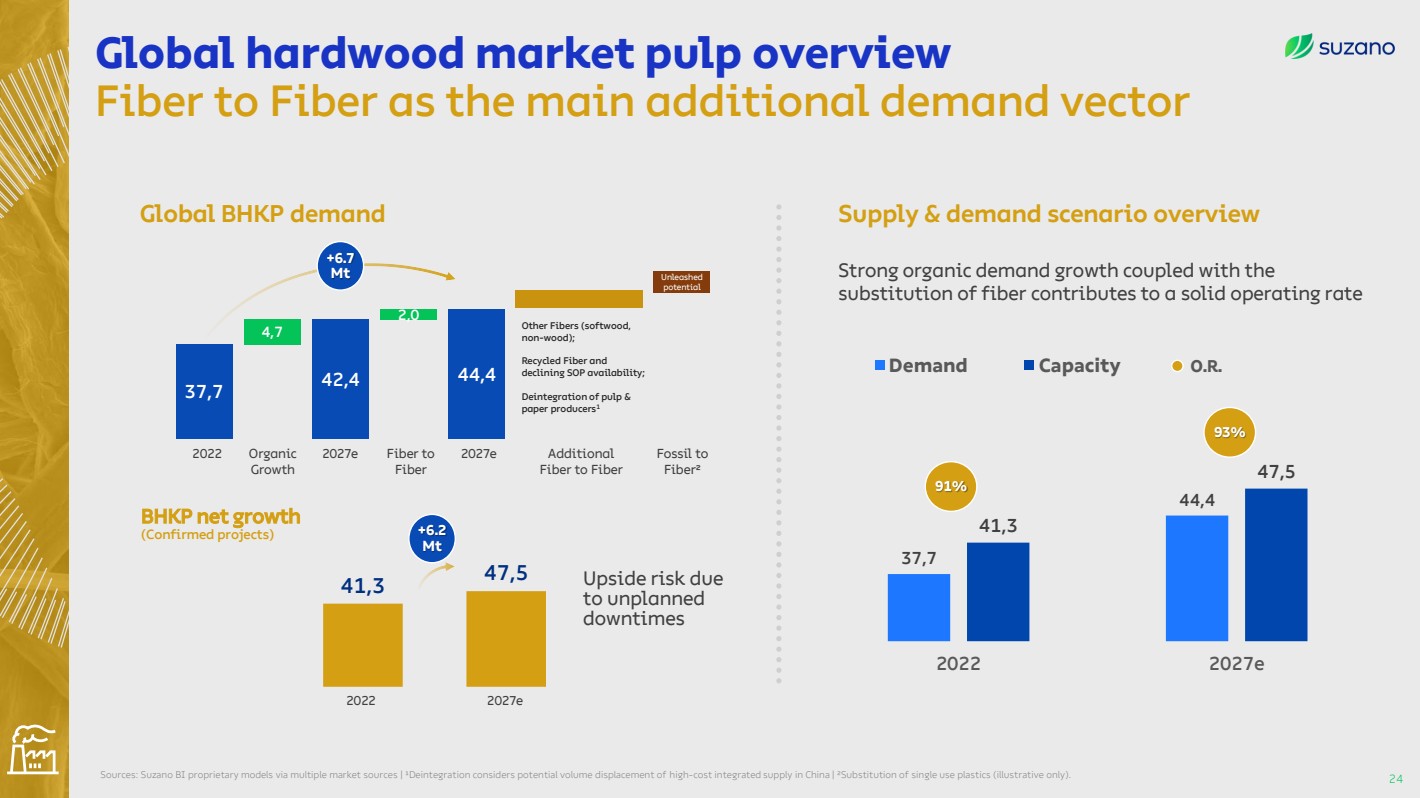
| Global hardwood market pulp overview
Fiber to Fiber as the main additional demand vector
24 Sources: Suzano BI proprietary models via multiple market sources | ¹Deintegration considers potential volume displacement of high-cost integrated supply in China | ²Substitution of single use plastics (illustrative only).
BHKP net growth
(Confirmed projects)
2022 2027e
41,3 47,5
+6.2
Mt
Upside risk due
to unplanned
downtimes
37,7
44,4
41,3
47,5
2022 2027e
Demand Capacity
91%
93%
O.R.
Supply & demand scenario overview
Strong organic demand growth coupled with the
substitution of fiber contributes to a solid operating rate
37,7 42,4 44,4
4,7
2,0
Global BHKP demand
2022 Organic
Growth
2027e Additional
Fiber to Fiber
2027e Fossil to
Fiber²
Fiber to
Fiber
Unleashed
potential
Other Fibers (softwood,
non-wood);
Recycled Fiber and
declining SOP availability;
Deintegration of pulp &
paper producers1
+6.7
Mt |
| 37,7
42,4 44,4
4,7
2,0 Other Fibers
(softwood,
non-wood);
Recycled Fiber
and declining
SOP
availability;
Deintegration
of pulp & paper
producers1
Unleashed
potential
Additional
2022 Organic
Growth
2027e Additional
Fiber to
Fiber
2027e Fossil to
Fiber²
Fossil to
Fiber
Global
BHKP Demand
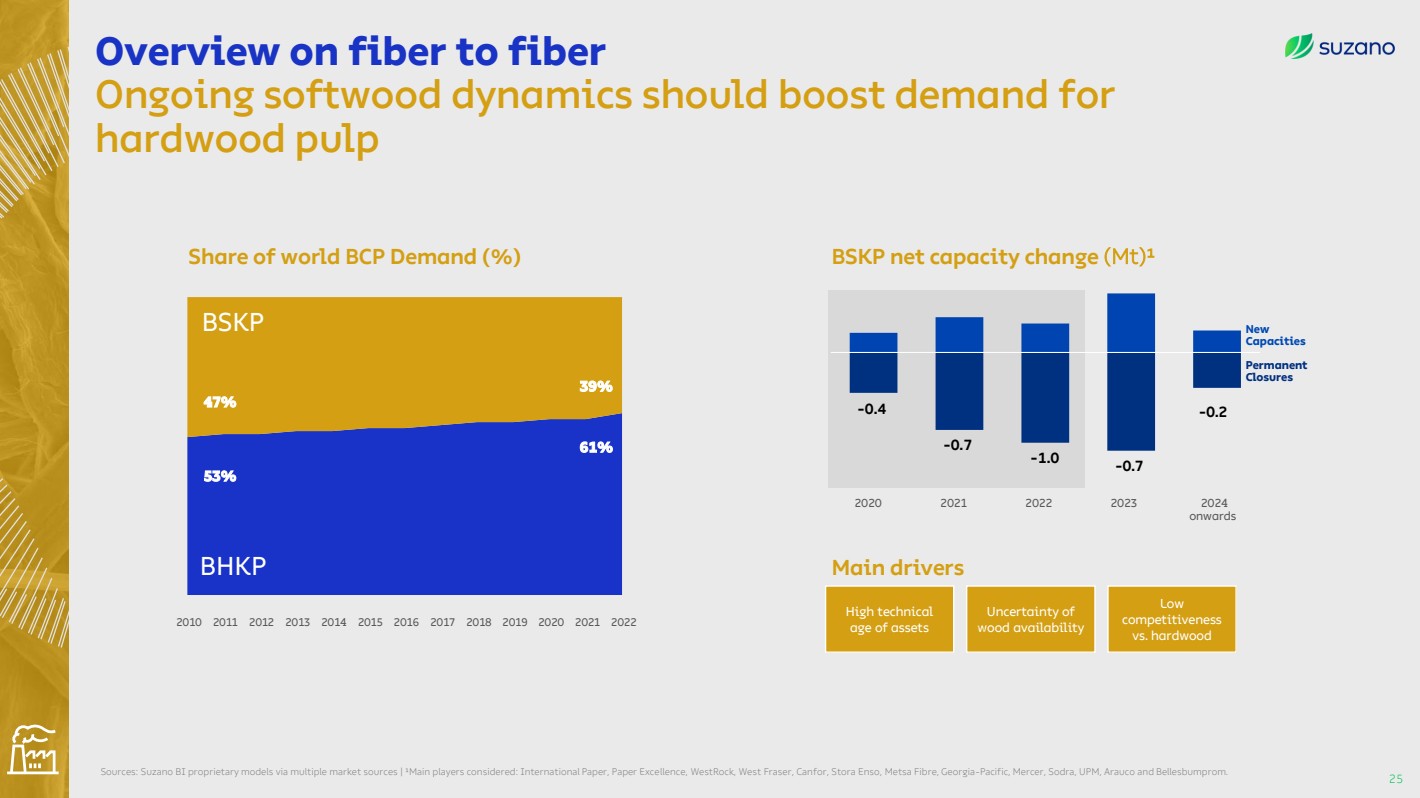
Overview on fiber to fiber
Ongoing softwood dynamics should boost demand for
hardwood pulp
25 Sources: Suzano BI proprietary models via multiple market sources | ¹Main players considered: International Paper, Paper Excellence, WestRock, West Fraser, Canfor, Stora Enso, Metsa Fibre, Georgia-Pacific, Mercer, Sodra, UPM, Arauco and Bellesbumprom.
At least ≈ 6.7 Mt
2010 2011 2012 2013 2014 2015 2016 2017 2018 2019 2020 2021 2022
BSKP
BHKP
Share of world BCP Demand (%)
53%
61%
47%
39%
BSKP net capacity change (Mt)¹
0.3
-0.7
0.6
-1.3
0.5
-1.5
1.0
-1.2
0.4
-0.6
-0.7
-0.2
New
Capacities
Permanent
Closures
Main drivers
High technical
age of assets
Uncertainty of
wood availability
Low
competitiveness
vs. hardwood
2020 2021 2022 2023 2024
onwards
-0.4
-0.7
-1.0 |
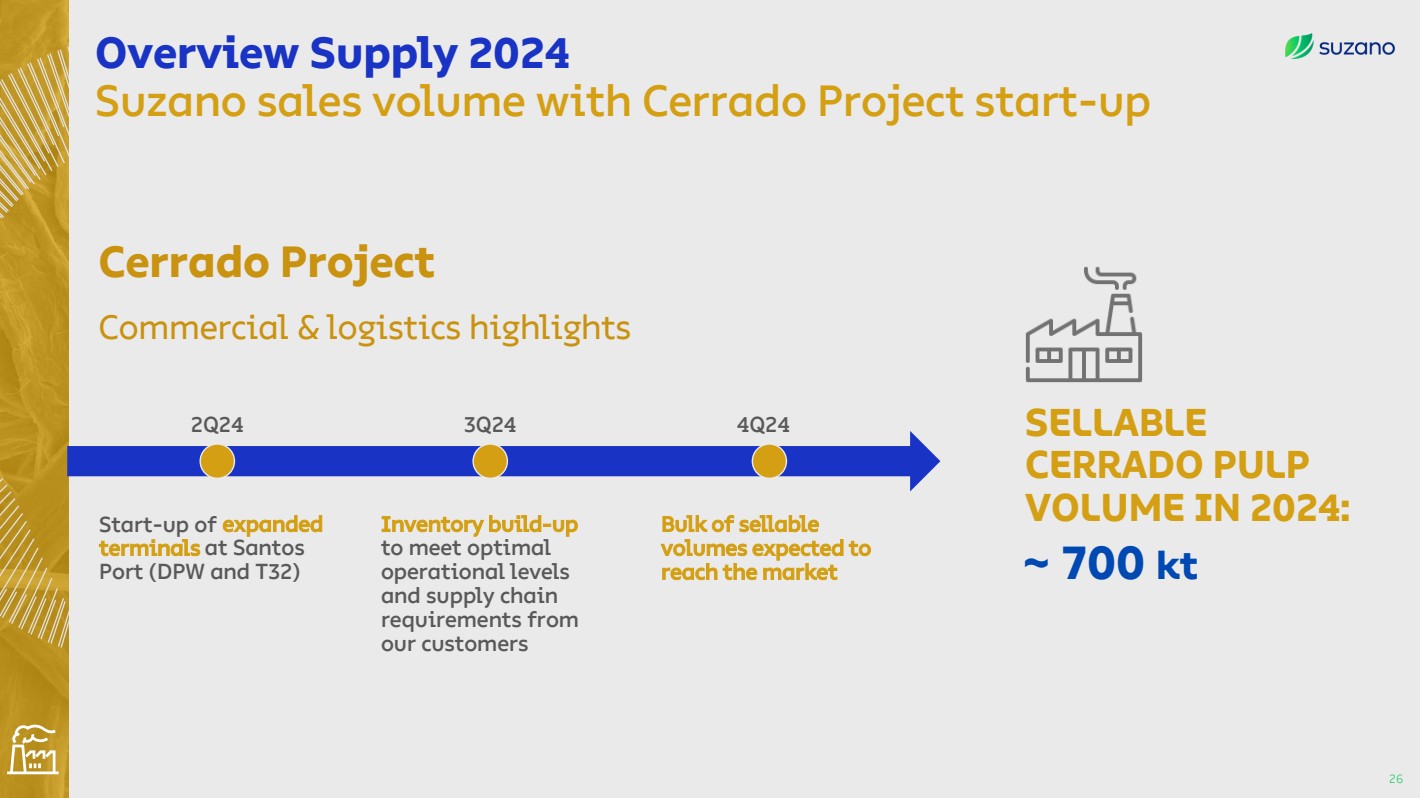
| Overview Supply 2024
Suzano sales volume with Cerrado Project start-up
26
~ 700 kt
SELLABLE
CERRADO PULP
VOLUME IN 2024:
Cerrado Project
Commercial & logistics highlights
2Q24 3Q24
Start-up of expanded
terminals at Santos
Port (DPW and T32)
Inventory build-up
to meet optimal
operational levels
and supply chain
requirements from
our customers
4Q24
Bulk of sellable
volumes expected to
reach the market |

| Marginal Cash Costs
27 Sources: Hawkins Wright and Suzano BI | | 1Avg. Quarterly PIX China calculated using only end of the month values within the quarter | 2Marginal Cash Cost analysis conducted by Hawkins Wright considering only market BHKP
Over the next five years, market volatility could play an important role,
however price valleys should continue to be anchored by marginal cash costs
350
400
450
500
550
600
650
700
750
800
850
900
1Q14 1Q15 1Q16 1Q17 1Q18 1Q19 1Q20 1Q21 1Q22 1Q23 1Q24
BHKP Price1
Marginal Cash Cost2
3Q23
533 USD/t
3Q23
575 USD/t
4Q24
560 USD/t
Commodities and
Wood availability
can influence future
costs |

| Marginal Cash Costs
28
Current price cycle has fostered an increase in market-related downtimes
69%
31%
FY2021
60%
40%
FY2022
44%
56%
YDE 2023e
(visible full year effect)
1.0
1.3
1.4
Other
Market-related
BHKP unexpected downtimes3
(Market Pulp)
300
350
400
450
500
550
600
650
700
750
800
850
900
1Q14 1Q15 1Q16 1Q17 1Q18 1Q19 1Q20 1Q21 1Q22 1Q23 1Q24
BHKP Price
Marginal Cash Cost
US$ per ton - CIF China
Global BHKP marginal cost of production, CIF China (Market Pulp)
3Q23
533 USD/t
4Q24
560
USD/t
3Q23
575 USD/t
Sources: Hawkins Wright and Suzano BI | | 1Avg. Quarterly PIX China calculated using only end of the month values within the quarter | 2Marginal Cash Cost analysis conducted by Hawkins Wright considering only market BHKP |
3Downtimes for FY21 and FY22 according with RISI and YTD23 by Suzano Market Intel. |
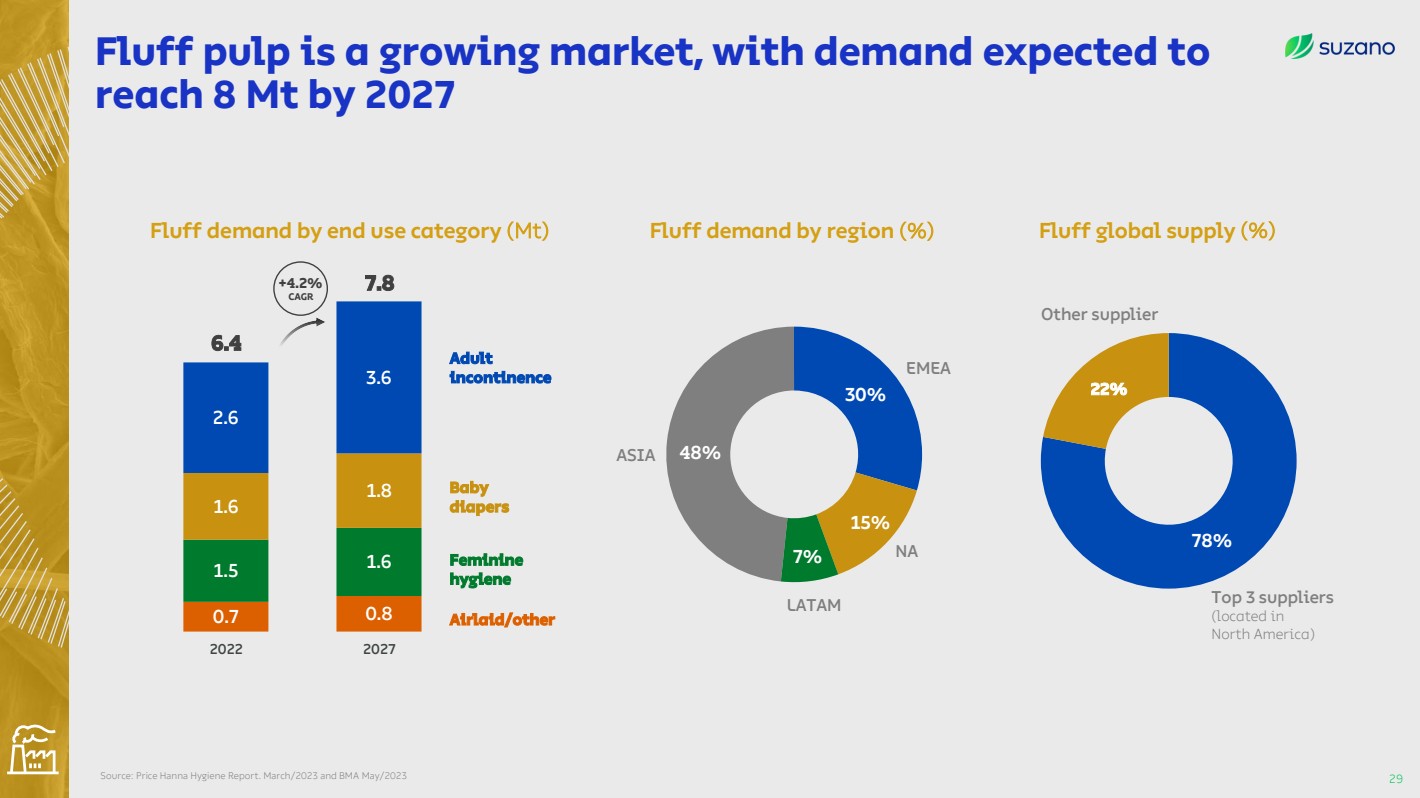
| Fluff pulp is a growing market, with demand expected to
reach 8 Mt by 2027
29 Source: Price Hanna Hygiene Report. March/2023 and BMA May/2023
0.7 0.8
1.5 1.6
1.6
1.8
2.6
3.6
6.4
7.8
2022 2027
Adult
incontinence
Baby
diapers
Feminine
hygiene
Airlaid/other
78%
Top 3 suppliers
(located in
North America)
Other supplier
22%
48%
30%
15%
7%
EMEA
ASIA
NA
LATAM
+4.2%
CAGR
Fluff demand by end use category (Mt) Fluff demand by region (%) Fluff global supply (%) |
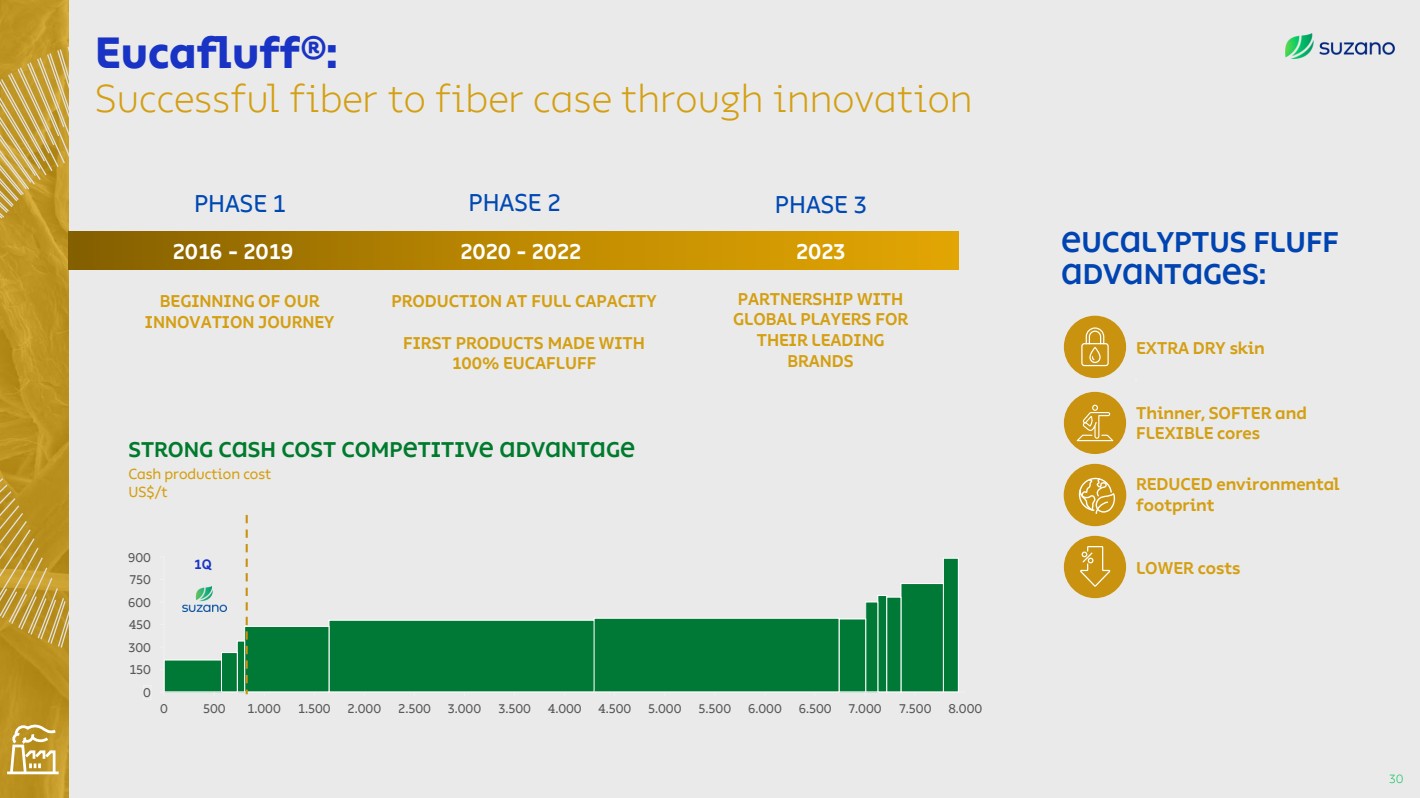
| Eucafluff®:
Successful fiber to fiber case through innovation
30
LOWER costs
REDUCED environmental
footprint
Thinner, SOFTER and
FLEXIBLE cores
Eucalyptus fluff
advantages:
EXTRA DRY skin
0 500 1.000
0
450
8.000
600
150
750
7.000
900
1.500 2.000 2.500 3.000 3.500 4.000 4.500 5.000 5.500 6.000 6.500 7.500
300
1Q
STRONG CASH COST COMPETITIVE ADVANTAGE
Cash production cost
US$/t
BEGINNING OF OUR
INNOVATION JOURNEY
2016 - 2019 2020 - 2022 2023
PARTNERSHIP WITH
GLOBAL PLAYERS FOR
THEIR LEADING
BRANDS
PHASE 1 PHASE 2
PRODUCTION AT FULL CAPACITY
FIRST PRODUCTS MADE WITH
100% EUCAFLUFF
PHASE 3 |
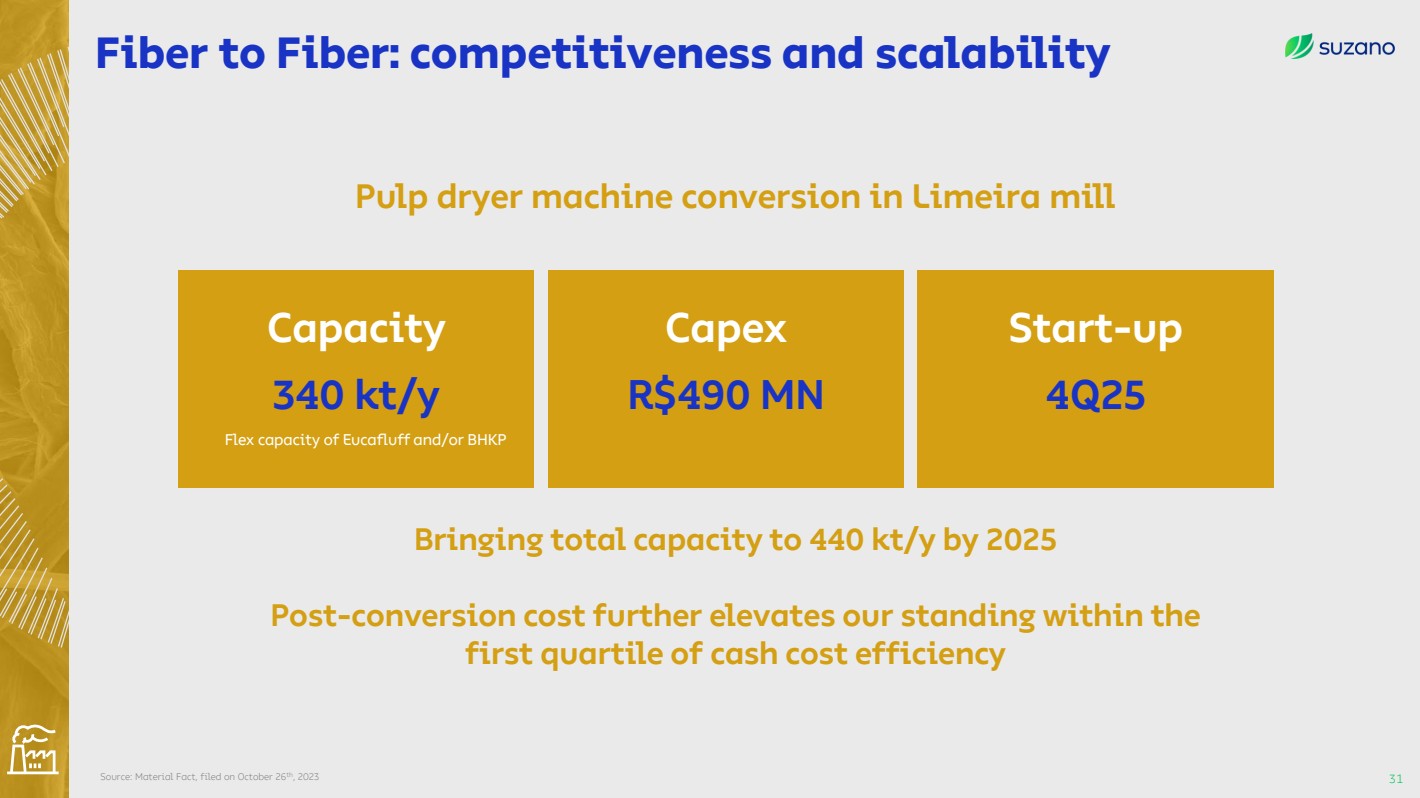
| Source: Material Fact, filed on October 26th, 2023
Fiber to Fiber: competitiveness and scalability
31
Pulp dryer machine conversion in Limeira mill
Capacity
340 kt/y
Flex capacity of Eucafluff and/or BHKP
Bringing total capacity to 440 kt/y by 2025
Post-conversion cost further elevates our standing within the
first quartile of cash cost efficiency
Capex
R$490 MN
Start-up
4Q25 |

| Advance in the
links of the
chain, always
with competitive
advantage |

| Paper &
Packaging |
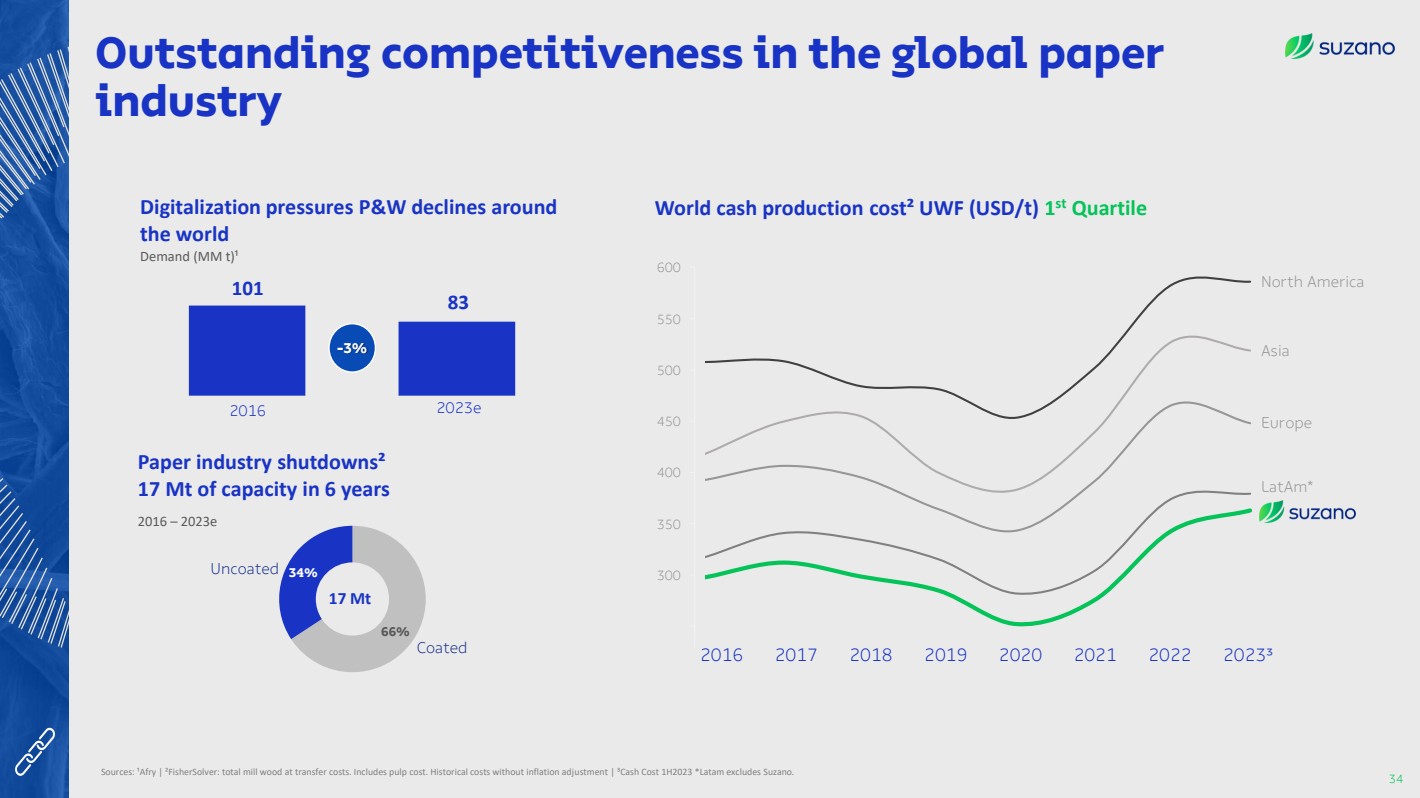
| Sources: ¹Afry | ²FisherSolver: total mill wood at transfer costs. Includes pulp cost. Historical costs without inflation adjustment | ³Cash Cost 1H2023 *Latam excludes Suzano.
2016 2023e
101
83
66%
Coated
Uncoated 34%
Digitalization pressures P&W declines around
the world
17 Mt
2016 – 2023e
Demand (MM t)¹
2016 2017 2018 2019 2020 2021 2022 2023³
300
350
400
450
500
550
600
Europe
LatAm*
North America
Asia
World cash production cost² UWF (USD/t) 1
st Quartile
Paper industry shutdowns²
17 Mt of capacity in 6 years
Outstanding competitiveness in the global paper
industry
34
-3% |
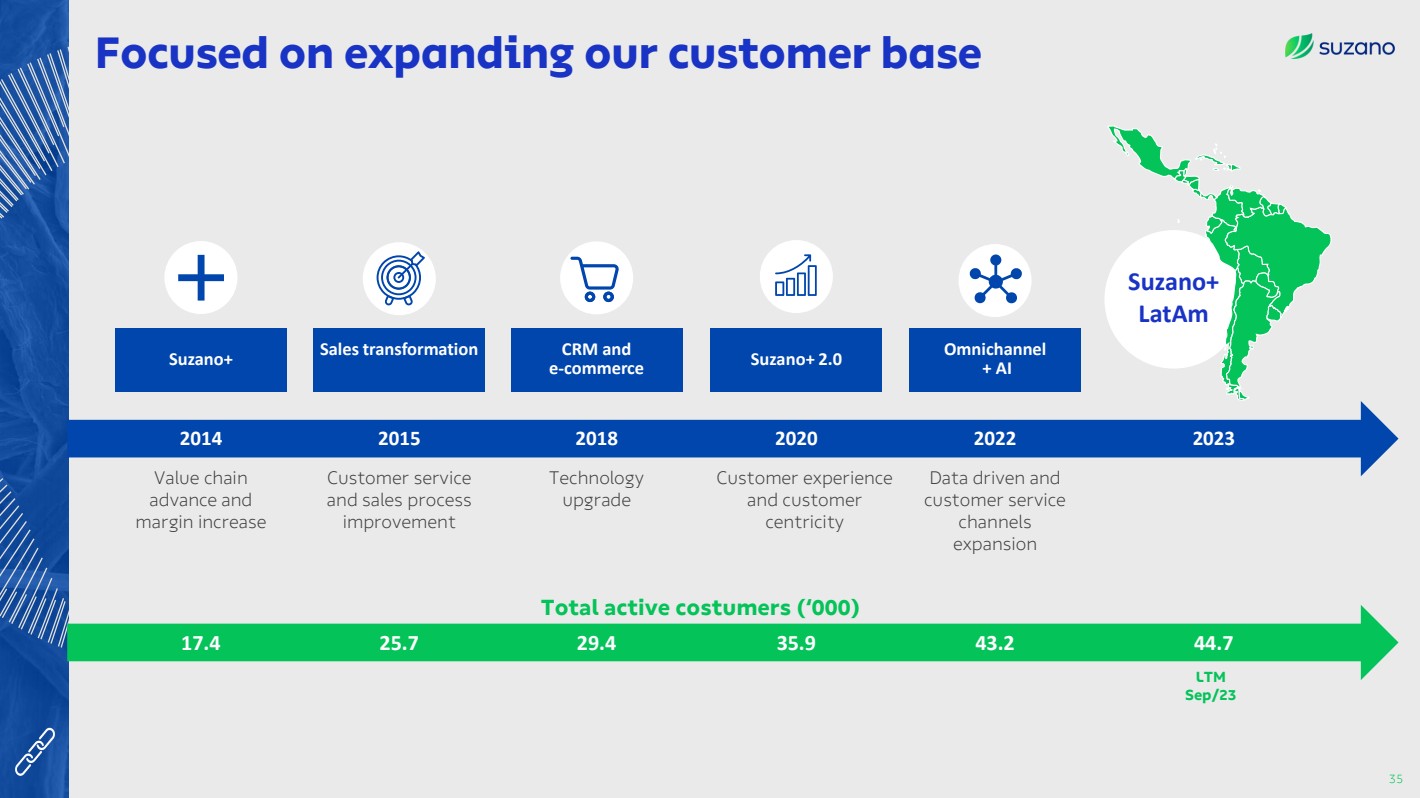
| Sales transformation Suzano+ CRM and
e-commerce
Suzano+ 2.0 Omnichannel
+ AI
Suzano+
LatAm
Value chain
advance and
margin increase
Customer service
and sales process
improvement
Technology
upgrade
Data driven and
customer service
channels
expansion
Customer experience
and customer
centricity
2014 2015 2018 2020 2022 2023
Focused on expanding our customer base
35
Total active costumers (‘000)
17.4 25.7 29.4 35.9 43.2 44.7
LTM
Sep/23 |
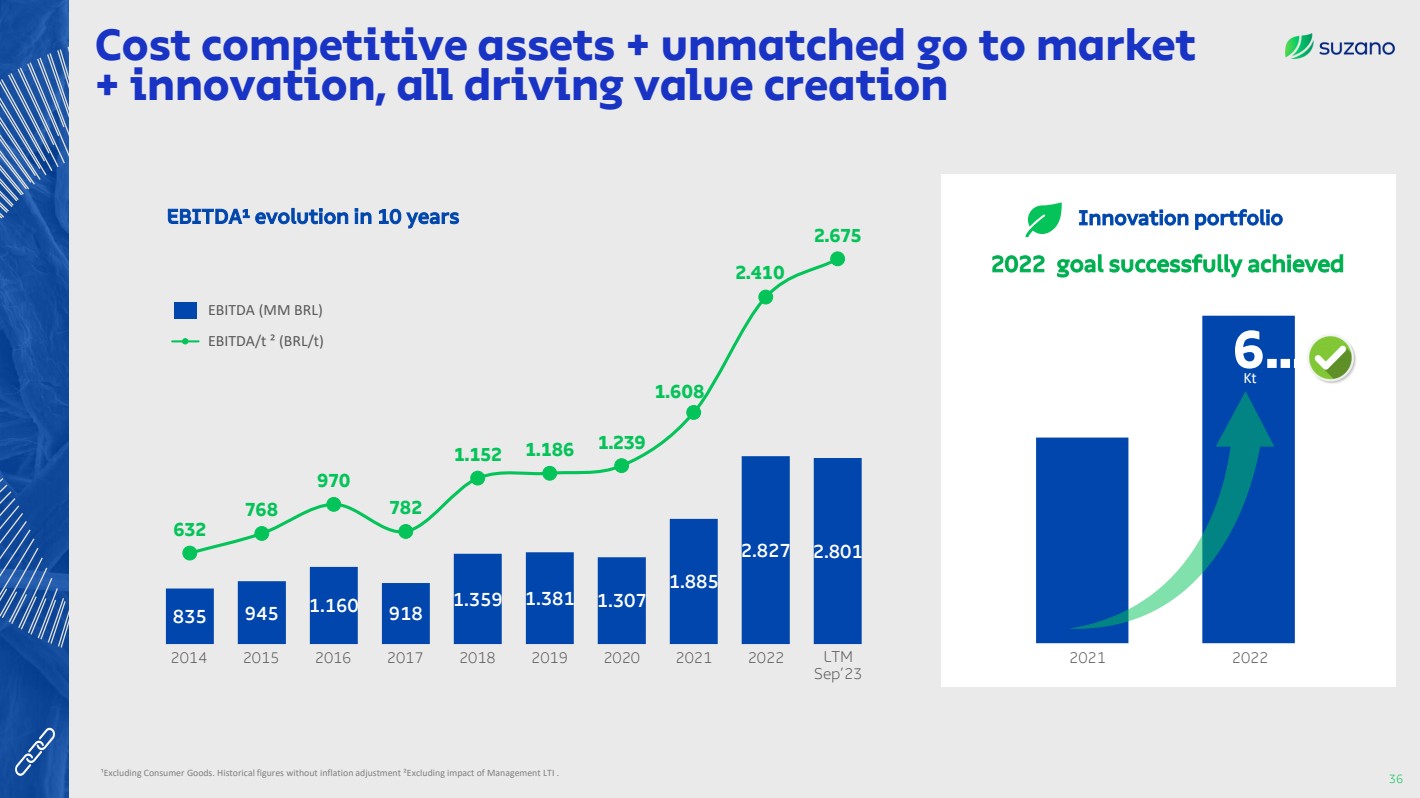
| Cost competitive assets + unmatched go to market
+ innovation, all driving value creation
36
2014 2015 2016 2017 2018 2019 2020 2021 2022
¹Excluding Consumer Goods. Historical figures without inflation adjustment ²Excluding impact of Management LTI .
Innovation portfolio
2022 goal successfully achieved
6…
2021 2022
Kt
835 945 1.160 918
1.359 1.381 1.307
1.885
2.827 2.801
632
768
970
782
1.152 1.186 1.239
1.608
2.410
2.675
EBITDA (MM BRL)
EBITDA/t ² (BRL/t)
EBITDA¹ evolution in 10 years
LTM
Sep’23 |
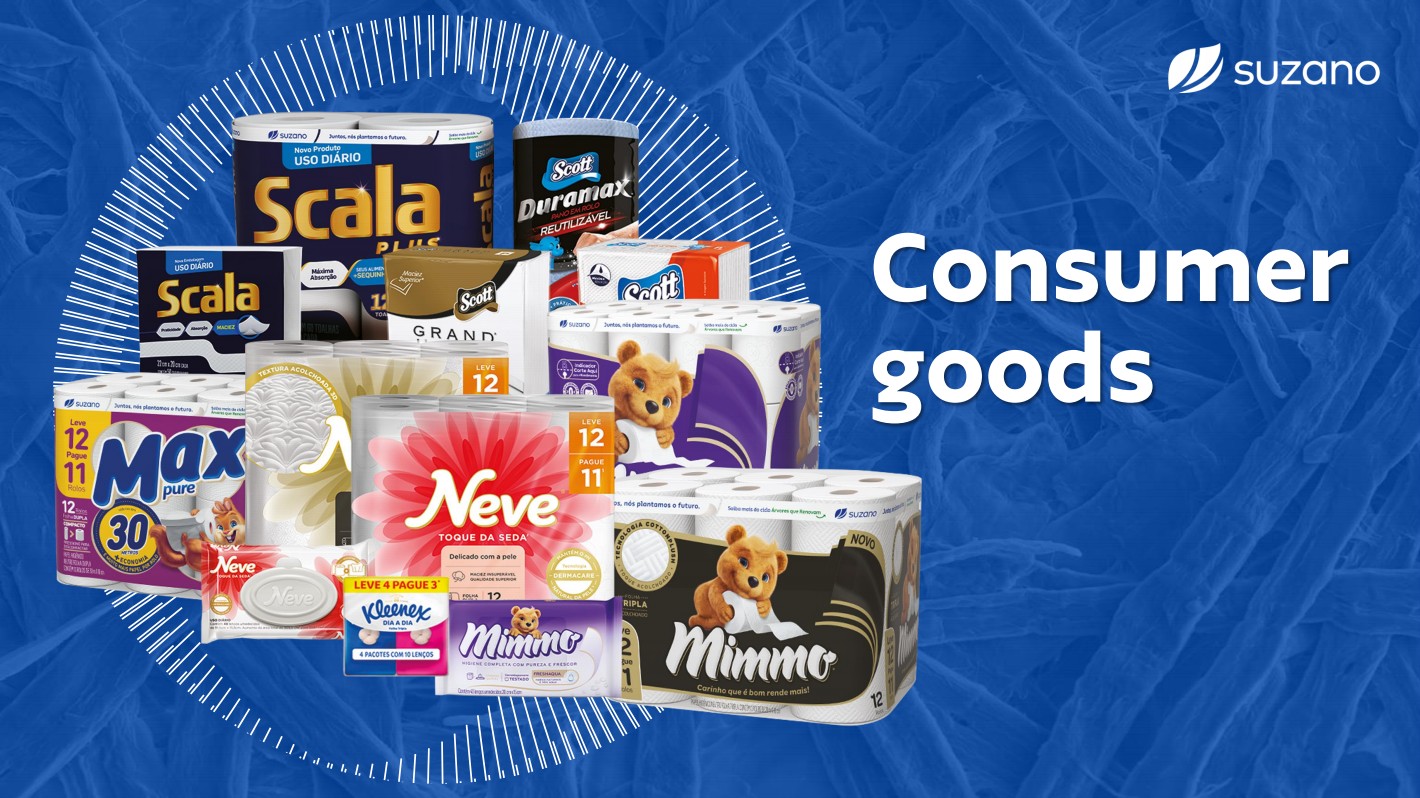
| Consumer
goods |
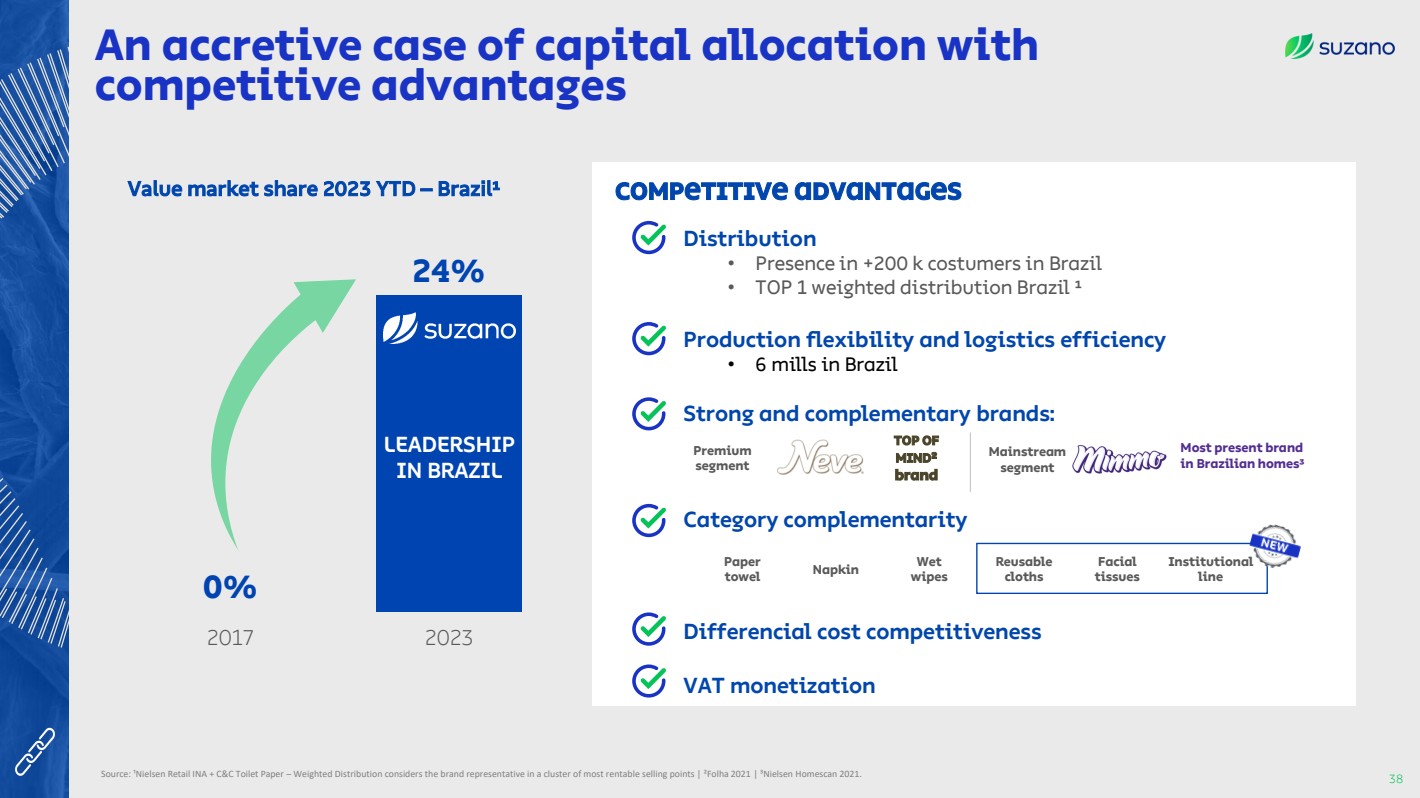
| An accretive case of capital allocation with
competitive advantages
38 Source: ¹Nielsen Retail INA + C&C Toilet Paper – Weighted Distribution considers the brand representative in a cluster of most rentable selling points | ²Folha 2021 | ³Nielsen Homescan 2021.
0%
24%
2017 2023
Value market share 2023 YTD – Brazil¹
LEADERSHIP
IN BRAZIL
COMPETITIVE ADVANTAGES
Distribution
• Presence in +200 k costumers in Brazil
• TOP 1 weighted distribution Brazil ¹
Production flexibility and logistics efficiency
• 6 mills in Brazil
Strong and complementary brands:
Category complementarity
Differencial cost competitiveness
VAT monetization
Most present brand
in Brazilian homes³
Premium
segment
Mainstream
segment
TOP OF
MIND²
brand
Paper
towel Napkin Reusable
cloths
Wet
wipes
Facial
tissues
Institutional
line |
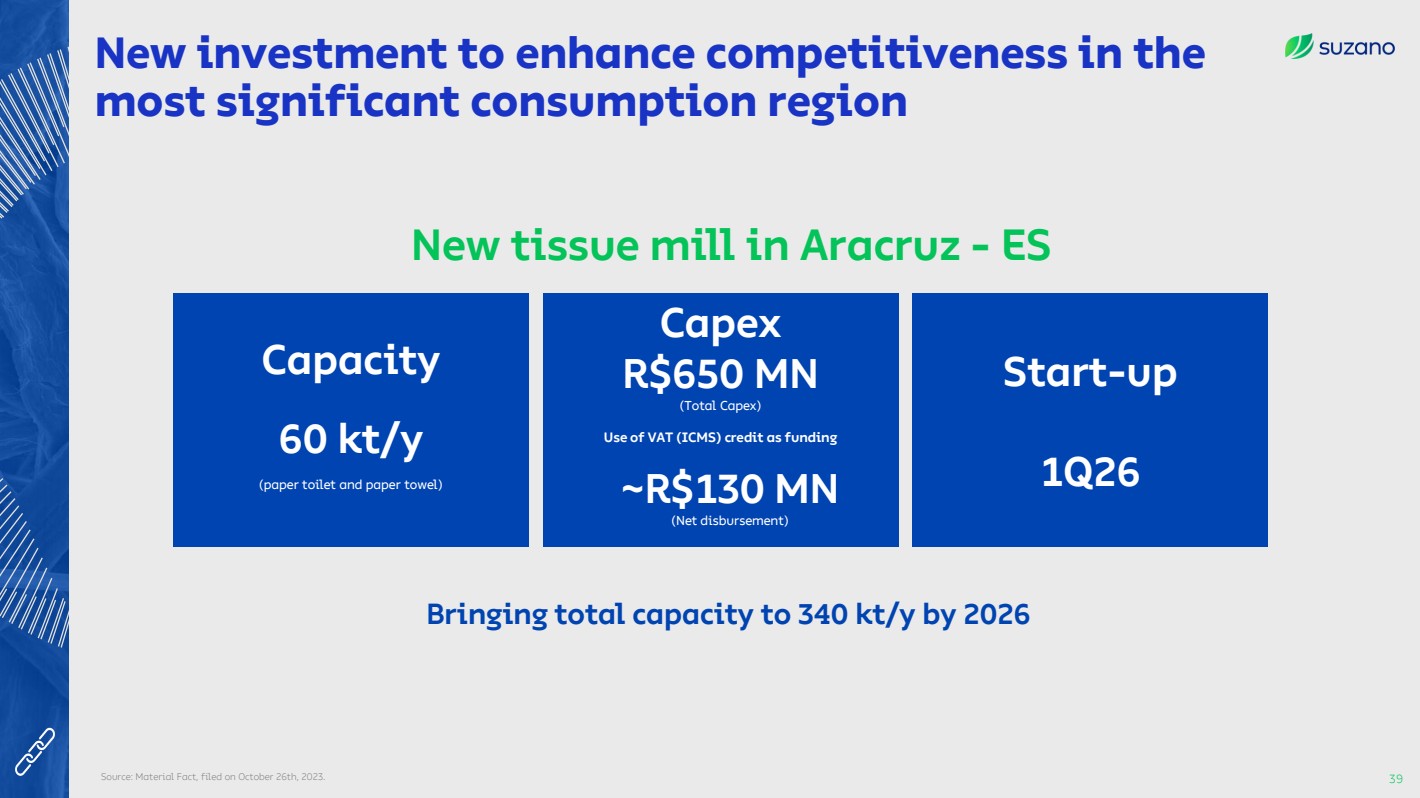
| New investment to enhance competitiveness in the
most significant consumption region
Source: Material Fact, filed on October 26th, 2023. 39
Capacity
60 kt/y
(paper toilet and paper towel)
Bringing total capacity to 340 kt/y by 2026
Start-up
1Q26
Capex
R$650 MN
(Total Capex)
Use of VAT (ICMS) credit as funding
~R$130 MN
(Net disbursement)
New tissue mill in Aracruz - ES |

| Play a
leading role in
sustainability |
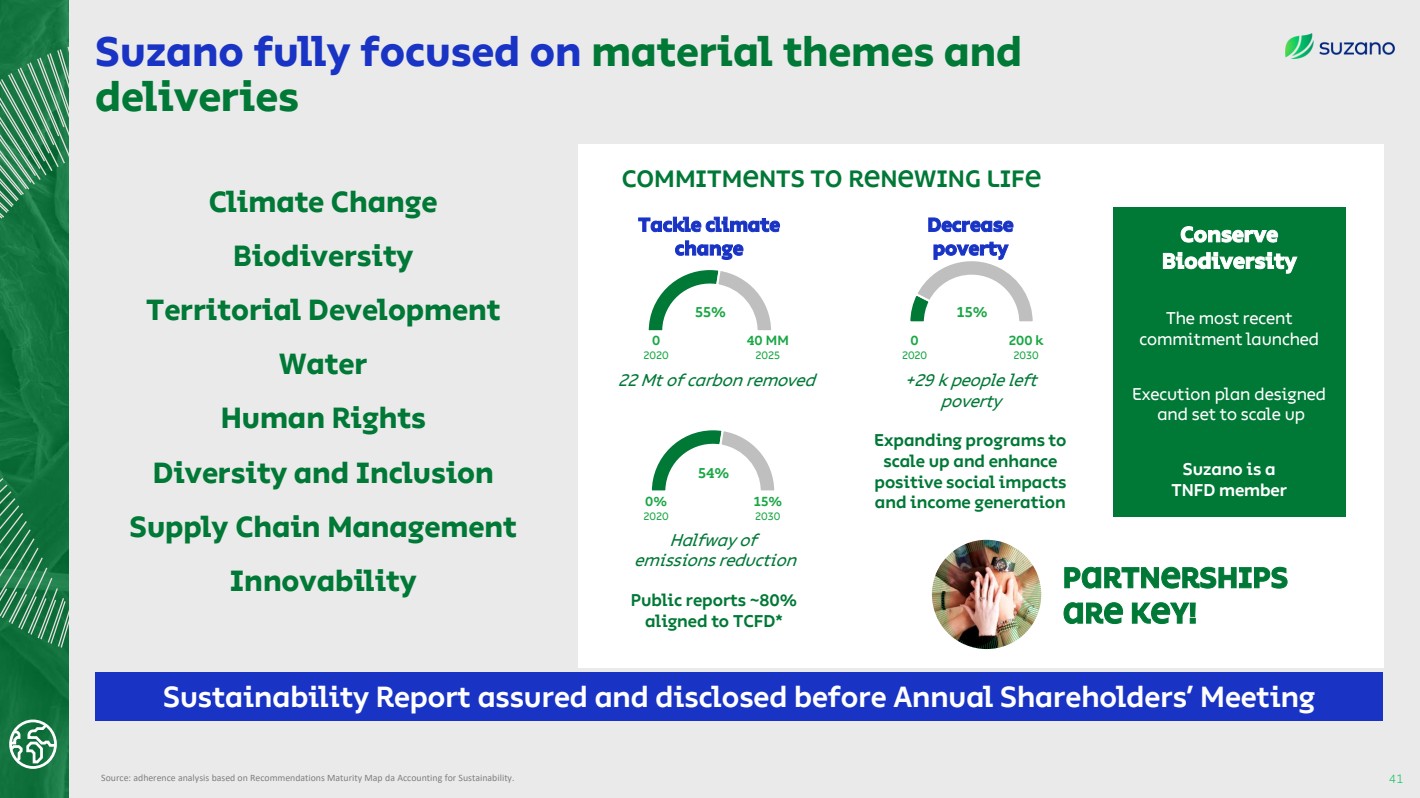
| Suzano fully focused on material themes and
deliveries
41
Climate Change
Biodiversity
Territorial Development
Water
Human Rights
Diversity and Inclusion
Supply Chain Management
Innovability
Commitments to Renewing Life
Source: adherence analysis based on Recommendations Maturity Map da Accounting for Sustainability.
Tackle climate
change
Decrease
poverty
Public reports ~80%
aligned to TCFD*
Expanding programs to
scale up and enhance
positive social impacts
and income generation
Conserve
Biodiversity
Execution plan designed
and set to scale up
Suzano is a
TNFD member
The most recent
commitment launched
Partnerships
are key!
Sustainability Report assured and disclosed before Annual Shareholders’ Meeting
Halfway of
emissions reduction
54%
15%
2030
0%
2020
55% 15%
+29 k people left
poverty
22 Mt of carbon removed
40 MM
2025
0
2020
200 k
2030
0
2020 |
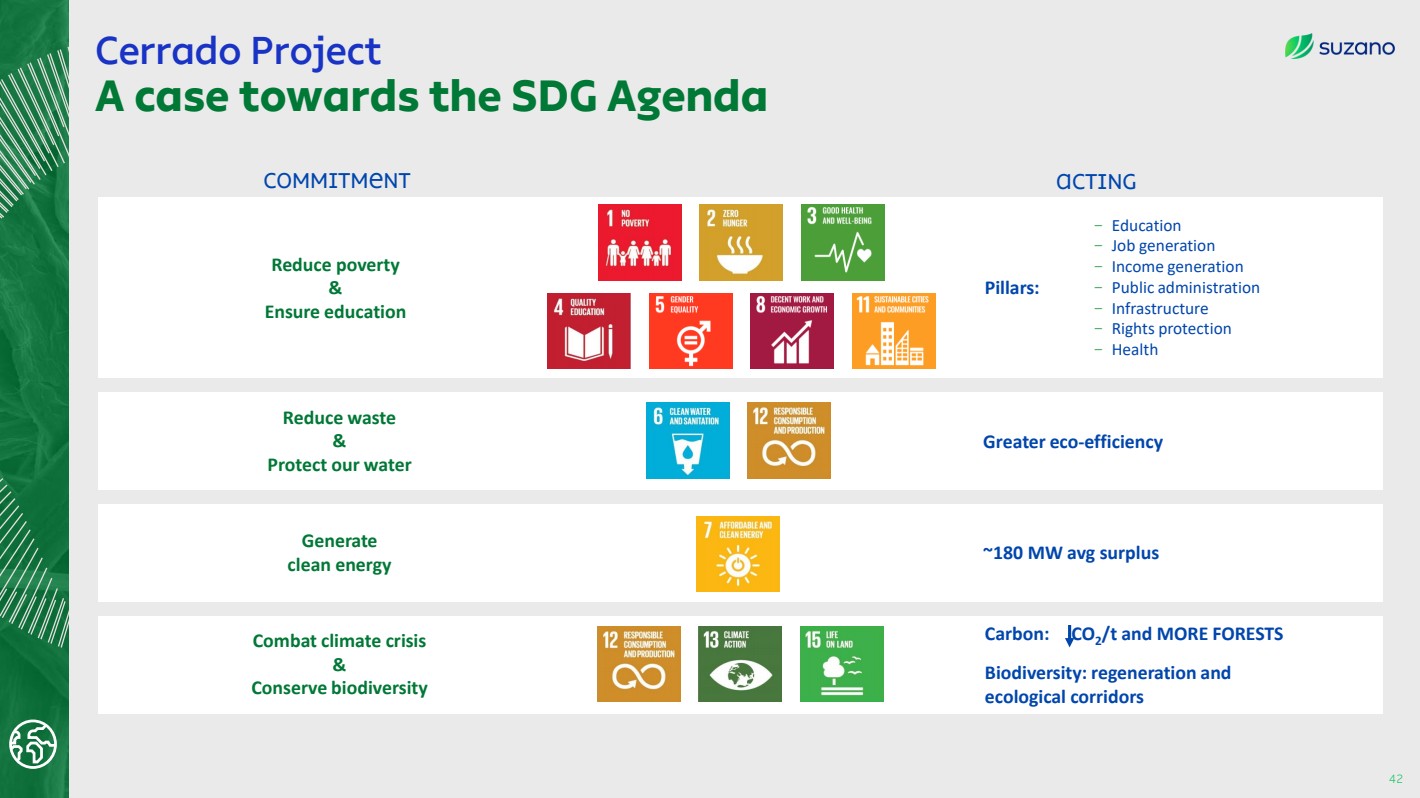
| Cerrado Project
A case towards the SDG Agenda
42
COMMITMENT
Generate
clean energy
Combat climate crisis
&
Conserve biodiversity
Reduce poverty
&
Ensure education
Reduce waste
&
Protect our water
Acting
Pillars:
− Education
− Job generation
− Income generation
− Public administration
− Infrastructure
− Rights protection
− Health
~180 MW avg surplus
Carbon: CO2
/t and MORE FORESTS
Biodiversity: regeneration and
ecological corridors
Greater eco-efficiency |
| agenda
Financial
Management |
| 0
50
100
150
200
250
ECA - Finnvera IFC Local Debentures
(Average)
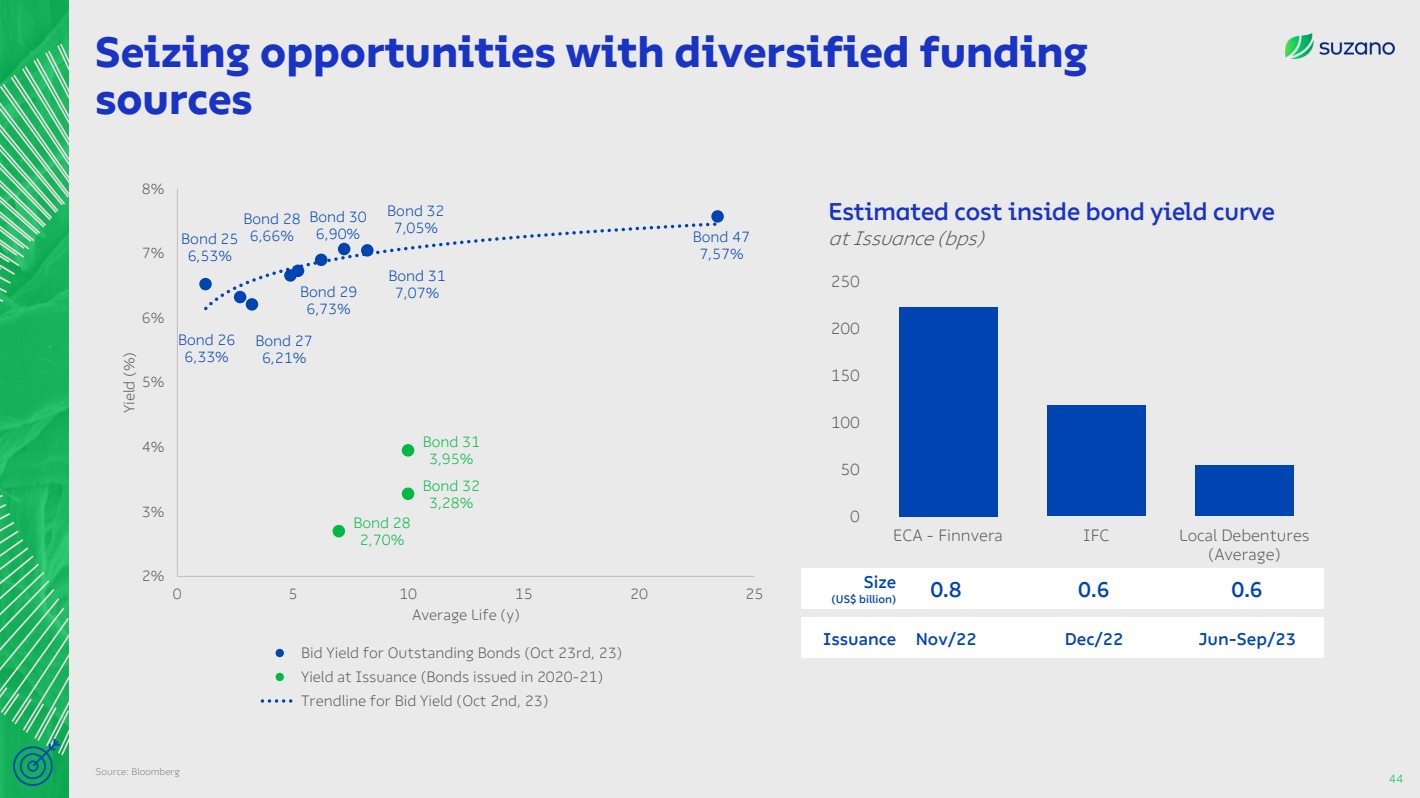
Source: Bloomberg
Seizing opportunities with diversified funding
sources
44
Estimated cost inside bond yield curve
at Issuance (bps)
0.8 0.6 0.6 Size
(US$ billion)
Issuance Nov/22 Dec/22 Jun-Sep/23
Bond 25
6,53%
Bond 26
6,33%
Bond 27
6,21%
Bond 28
6,66%
Bond 29
6,73%
Bond 30
6,90%
Bond 31
7,07%
Bond 32
7,05% Bond 47
7,57%
Bond 31
3,95%
Bond 32
3,28%
Bond 28
2,70%
2%
3%
4%
5%
6%
7%
8%
0 5 10 15 20 25
Yield (%)
Average Life (y)
Bid Yield for Outstanding Bonds (Oct 23rd, 23)
Yield at Issuance (Bonds issued in 2020-21)
Trendline for Bid Yield (Oct 2nd, 23) |
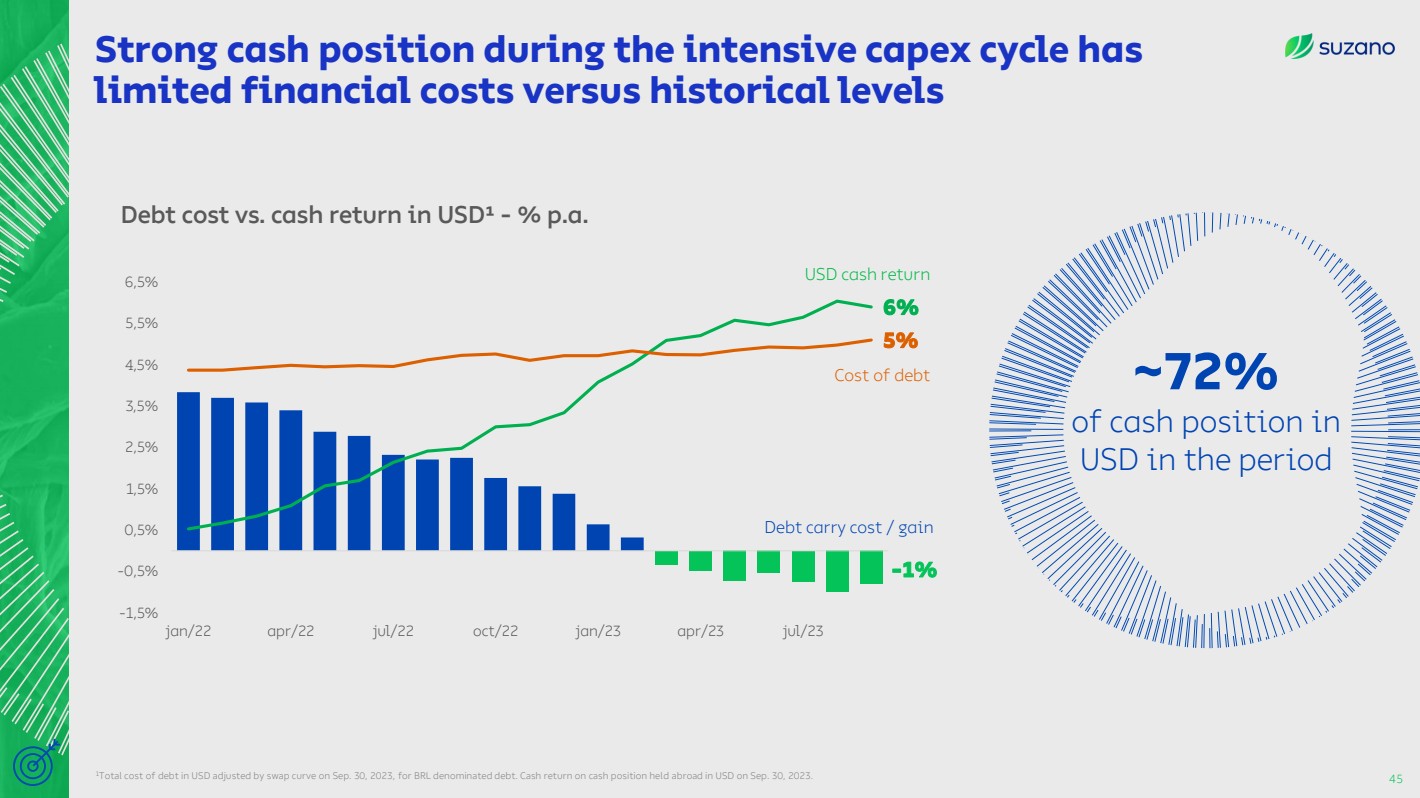
| -1%
6%
5%
-1,5%
-0,5%
0,5%
1,5%
2,5%
3,5%
4,5%
5,5%
6,5%
jan/22 apr/22 jul/22 oct/22 jan/23 apr/23 jul/23
1Total cost of debt in USD adjusted by swap curve on Sep. 30, 2023, for BRL denominated debt. Cash return on cash position held abroad in USD on Sep. 30, 2023.
USD cash return
Cost of debt ~72%
of cash position in
USD in the period
Debt cost vs. cash return in USD¹ - % p.a.
Strong cash position during the intensive capex cycle has
limited financial costs versus historical levels
45
Debt carry cost / gain |
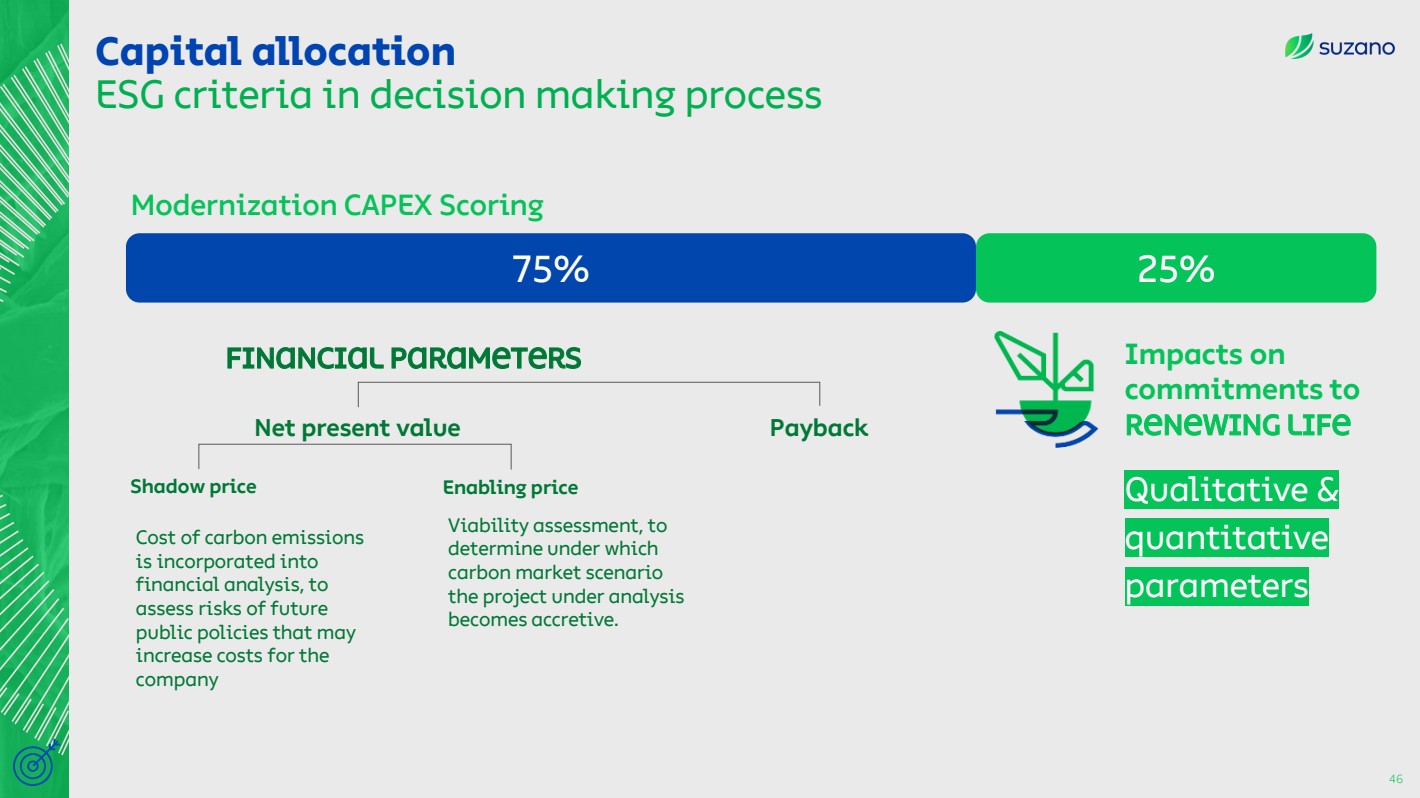
| Cost of carbon emissions
is incorporated into
financial analysis, to
assess risks of future
public policies that may
increase costs for the
company
Financial parameters
Net present value Payback
Shadow price Enabling price
Viability assessment, to
determine under which
carbon market scenario
the project under analysis
becomes accretive.
75%
Capital allocation
ESG criteria in decision making process
46
Modernization CAPEX Scoring
Impacts on
commitments to
Renewing Life
Qualitative &
quantitative
parameters
25% |
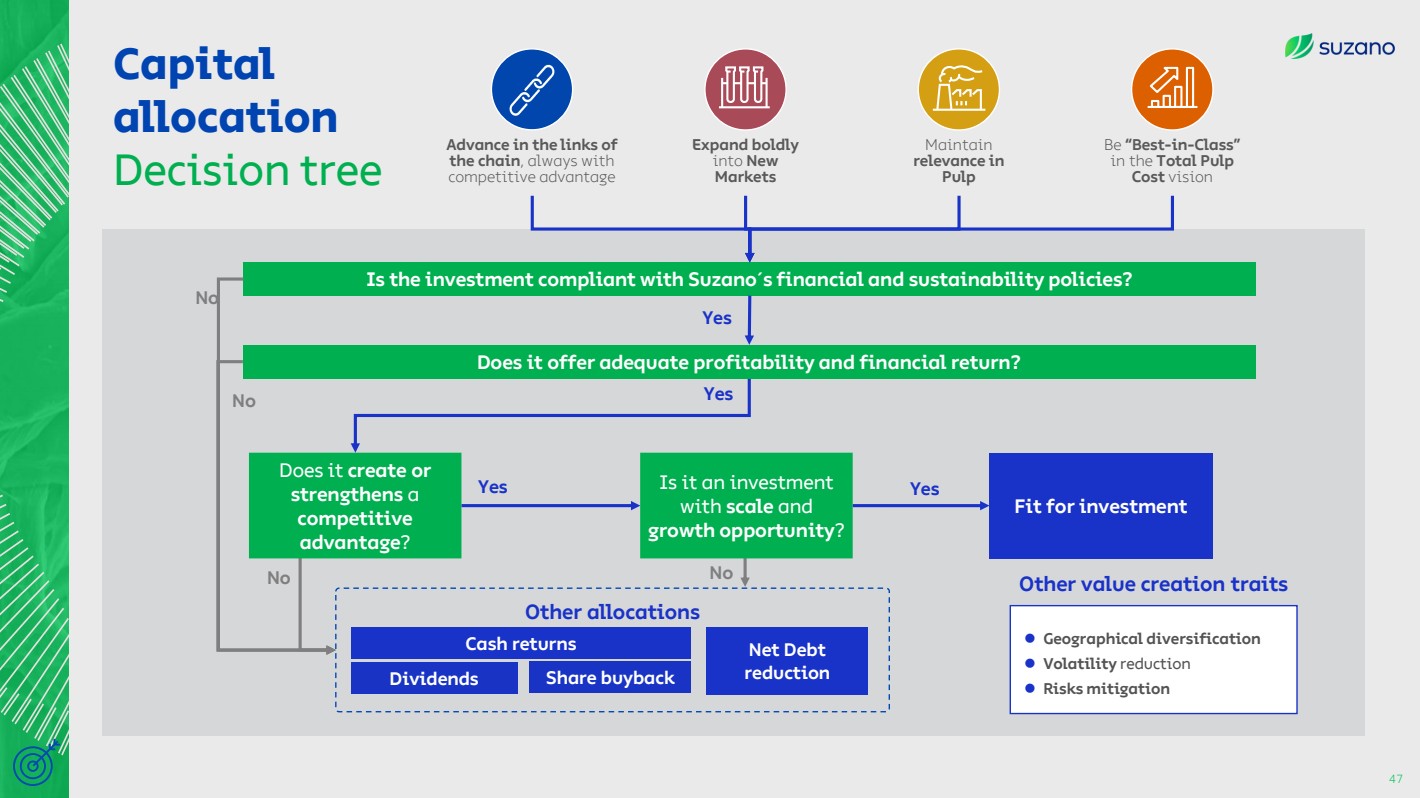
| Capital
allocation
Decision tree
Expand boldly
into New
Markets
Be “Best-in-Class”
in the Total Pulp
Cost vision
Advance in the links of
the chain, always with
competitive advantage
Maintain
relevance in
Pulp
Is it an investment
with scale and
growth opportunity?
⚫ Geographical diversification
⚫ Volatility reduction
⚫ Risks mitigation
No
Does it create or
strengthens a
competitive
advantage?
Share buyback
Cash returns Net Debt
reduction
Other allocations
Yes
Yes Yes
Fit for investment
No Other value creation traits No
Does it offer adequate profitability and financial return?
Is the investment compliant with Suzano´s financial and sustainability policies?
Yes
No
47
Dividends |
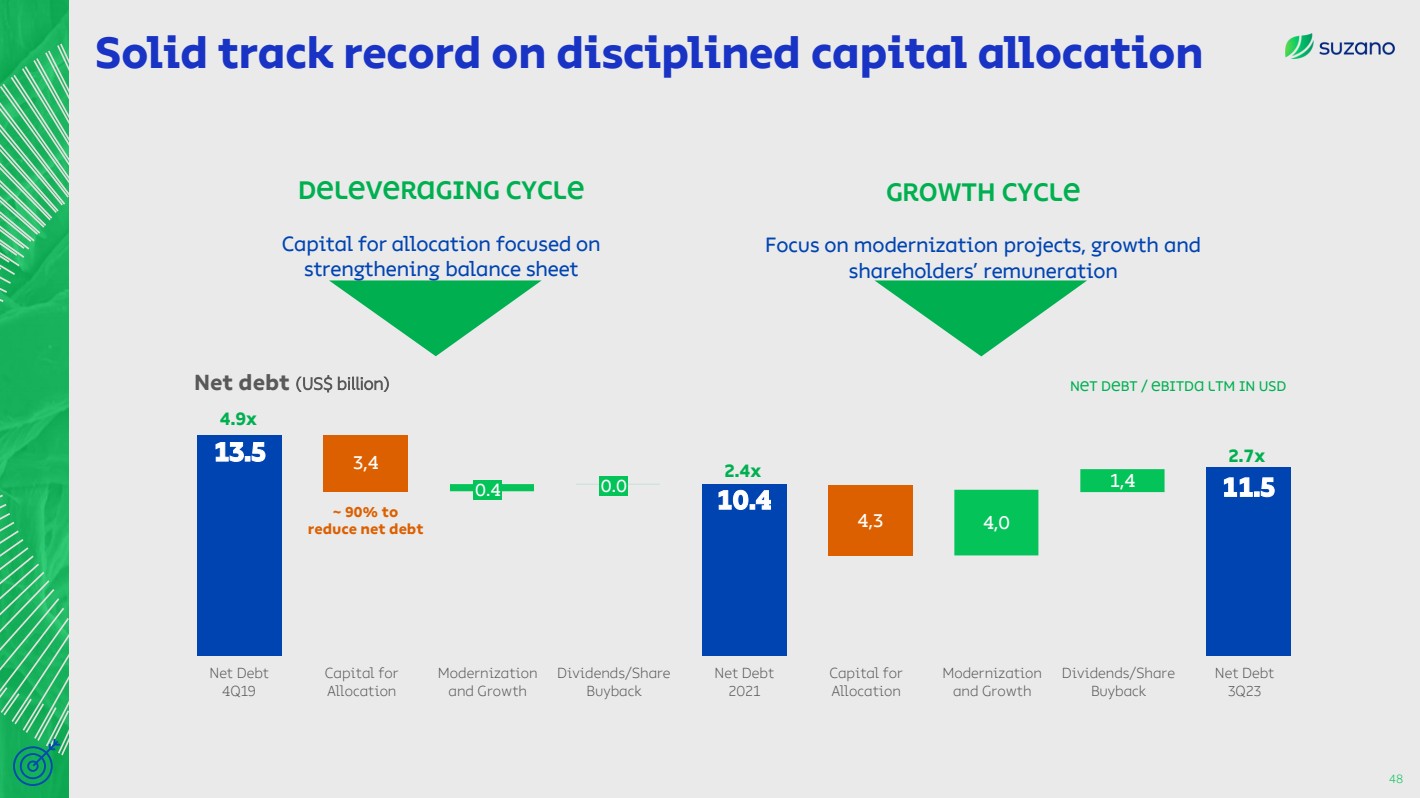
| 13.5
10.4 11.5
3,4
4,3 4,0
1,4
Capital for
Allocation
Dividends/Share
Buyback
Modernization
and Growth
0.4 0.0
Capital for
Allocation
Modernization
and Growth
Dividends/Share
Buyback
Net Debt
3Q23
Net debt (US$ billion)
Deleveraging cycle
Capital for allocation focused on
strengthening balance sheet
Growth cycle
Focus on modernization projects, growth and
shareholders’ remuneration
4.9x
2.4x
2.7x
Net Debt / EBITDA LTM in USD
Solid track record on disciplined capital allocation
48
~ 90% to
reduce net debt
Net Debt
2021
Net Debt
4Q19 |

| 46.40
54.40
Average buyback
price
Share price
Oct/231
:
17%
return
Share buyback program adding value to
shareholders
49 1Closing price of 10/23/2023
Share price (R$)
Buyback volume
60 million
shares
1
st program
(avg. price
R$48.33)
2
nd program
(avg. price
R$46.84)
3
rd program
(avg. price
R$44.02)
2021 2022 2023
35
40
45
50
55
60
65
70
75 |

| How we reached the first 100 years
and will move forward...
Q&A
Financial discipline
Culture and innovability
Accretive capital allocation track record
Recurring investments in competitiveness
Addressable markets expansion
Higher cash generation level, post Cerrado
Shared value as core to business strategy |
| Eucalyptus fiber
ir.suzano.com.br |
Suzano (NYSE:SUZ)
過去 株価チャート
から 4 2024 まで 5 2024

Suzano (NYSE:SUZ)
過去 株価チャート
から 5 2023 まで 5 2024
