REINSURANCE GROUP OF AMERICA INC false 0000898174 0000898174 2024-06-13 2024-06-13 0000898174 rga:CommonStockOutstandingMember 2024-06-13 2024-06-13 0000898174 rga:M5.75FixedToFloatingRateSubordinatedDebenturesDue2056Member 2024-06-13 2024-06-13 0000898174 rga:M7.125FixedRateResetSubordinatedDebenturesDue2052Member 2024-06-13 2024-06-13
UNITED STATES
SECURITIES AND EXCHANGE COMMISSION
Washington, D.C. 20549
FORM 8-K
CURRENT REPORT
Pursuant to Section 13 or 15(d)
of the Securities Exchange Act of 1934
Date of Report (Date of Earliest Event Reported): June 13, 2024
REINSURANCE GROUP OF AMERICA, INCORPORATED
(Exact Name of Registrant as Specified in its Charter)
|
|
|
|
|
| Missouri |
|
1-11848 |
|
43-1627032 |
| (State or Other Jurisdiction of Incorporation) |
|
(Commission File Number) |
|
(IRS Employer Identification No.) |
16600 Swingley Ridge Road, Chesterfield, Missouri 63017
(Address of Principal Executive Offices, and Zip Code)
Registrant’s telephone number, including area code: (636) 736-7000
Check the appropriate box below if the Form 8-K filing is intended to simultaneously satisfy the filing obligation of the registrant under any of the following provisions:
| |
☐ |
Written communications pursuant to Rule 425 under the Securities Act (17 CFR 230.425) |
| |
☐ |
Soliciting material pursuant to Rule 14a-12 under the Exchange Act (17 CFR 240.14a-12) |
| |
☐ |
Pre-commencement communications pursuant to Rule 14d-2(b) under the Exchange Act (17 CFR 240.14d-2(b)) |
| |
☐ |
Pre-commencement communications pursuant to Rule 13e-4(c) under the Exchange Act (17 CFR 240.13e-4(c)) |
Securities registered pursuant to Section 12(b) of the Act:
|
|
|
|
|
| Title of each class |
|
Trading
Symbol(s) |
|
Name of each exchange on which registered |
| Common Stock, par value $0.01 |
|
RGA |
|
New York Stock Exchange |
| 5.75% Fixed-To-Floating Rate Subordinated Debentures due 2056 |
|
RZB |
|
New York Stock Exchange |
| 7.125% Fixed-Rate Reset Subordinated Debentures due 2052 |
|
RZC |
|
New York Stock Exchange |
Indicate by check mark whether the registrant is an emerging growth company as defined in Rule 405 of the Securities Act of 1933 (§230.405 of this chapter) or Rule 12b-2 of the Securities Exchange Act of 1934 (§240.12b-2 of this chapter):
☐ Emerging growth company
☐ If an emerging growth company, indicate by check mark if the registrant has elected not to use the extended transition period for complying with any new or revised financial accounting standards provided pursuant to Section 13(a) of the Exchange Act.
| Item 7.01 |
Regulation FD Disclosure. |
As previously reported in a Current Report on Form 8-K furnished on May 16, 2024, Reinsurance Group of America, Incorporated (the “Company”) announced that it will host a conference for institutional investors and analysts in New York City on Thursday, June 13, 2024 from 8:30 a.m. to 11:00 a.m. Eastern time. A live audio webcast of the presentation will be accessible on the Company’s website at www.rgare.com under the Investors tab. Copies of the slides used in the presentation will be available on the Company’s website at www.rgare.com through the link on the Investors tab, and are attached hereto as Exhibit 99.1 and incorporated herein by reference. An audio recording of the presentation will be made available and posted to Company’s website after the event.
The information in this Item 7.01 and the exhibit attached hereto will not be deemed to be “filed” for the purposes of Section 18 of the Securities Exchange Act of 1934 (the “Exchange Act”), or otherwise subject to the liabilities of such section, nor will such information or exhibit be deemed incorporated by reference in any filing under the Securities Act of 1933 or the Exchange Act, except as may be expressly set forth by specific reference in such filing.
| Item 9.01 |
Financial Statements and Exhibits. |
(d) Exhibits.
SIGNATURE
Pursuant to the requirements of the Securities Exchange Act of 1934, the registrant has duly caused this report to be signed on its behalf by the undersigned hereunto duly authorized.
|
|
|
|
|
|
|
|
|
|
|
REINSURANCE GROUP OF AMERICA, INCORPORATED |
|
|
|
|
| Date: June 13, 2024 |
|
|
|
By: |
|
/s/ Todd C. Larson |
|
|
|
|
|
|
Todd C. Larson |
|
|
|
|
|
|
Senior Executive Vice President and Chief Financial Officer |

Exhibit 99.1 Trusted partner. Proven results. RGA Investor Day 2024 June
13, 2024
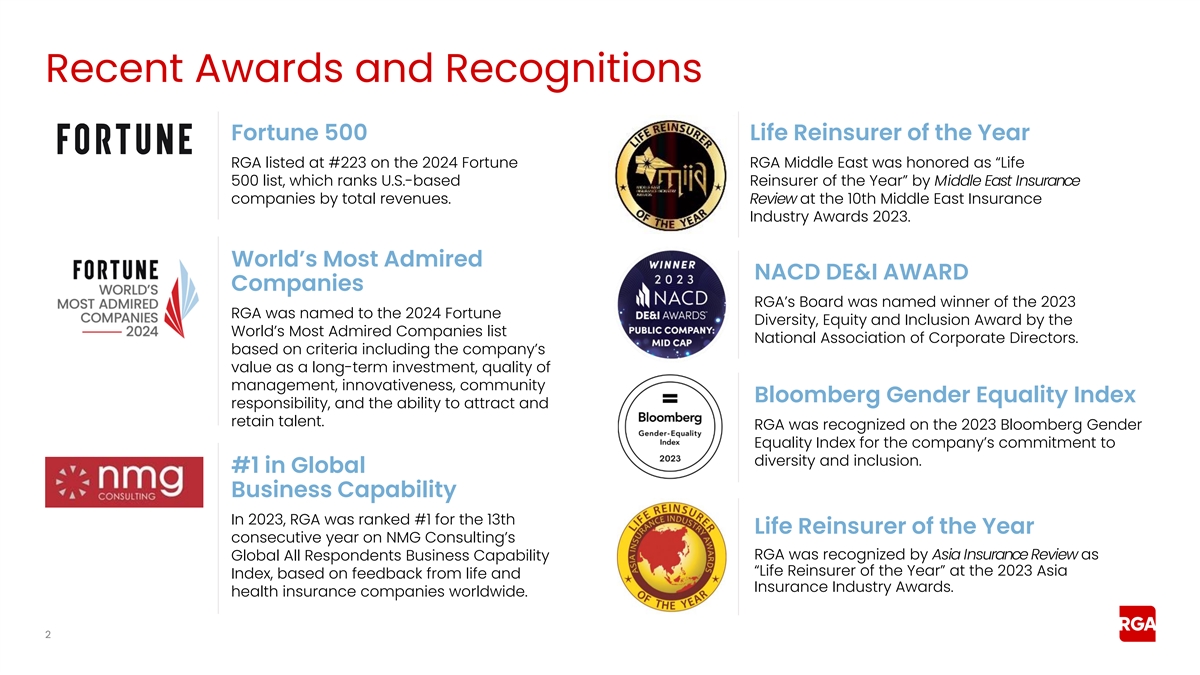
Recent Awards and Recognitions Fortune 500 Life Reinsurer of the Year
RGA listed at #223 on the 2024 Fortune RGA Middle East was honored as “Life 500 list, which ranks U.S.-based Reinsurer of the Year” by Middle East Insurance companies by total revenues. Review at the 10th Middle East Insurance Industry
Awards 2023. World’s Most Admired NACD DE&I AWARD Companies RGA’s Board was named winner of the 2023 RGA was named to the 2024 Fortune Diversity, Equity and Inclusion Award by the World’s Most Admired Companies list National
Association of Corporate Directors. based on criteria including the company’s value as a long-term investment, quality of management, innovativeness, community Bloomberg Gender Equality Index responsibility, and the ability to attract and
retain talent. RGA was recognized on the 2023 Bloomberg Gender Equality Index for the company’s commitment to diversity and inclusion. #1 in Global Business Capability In 2023, RGA was ranked #1 for the 13th Life Reinsurer of the Year
consecutive year on NMG Consulting’s RGA was recognized by Asia Insurance Review as Global All Respondents Business Capability “Life Reinsurer of the Year” at the 2023 Asia Index, based on feedback from life and Insurance Industry
Awards. health insurance companies worldwide. 2
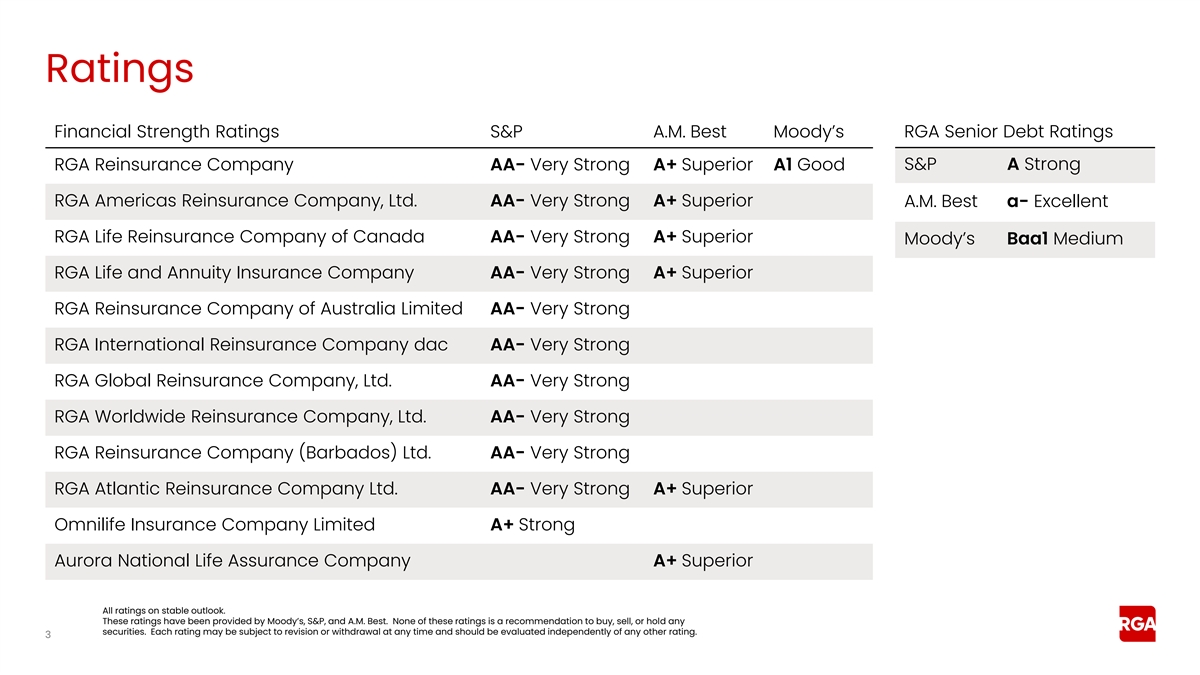
Ratings Financial Strength Ratings S&P A.M. Best Moody’s RGA
Senior Debt Ratings S&P A Strong RGA Reinsurance Company AA- Very Strong A+ Superior A1 Good RGA Americas Reinsurance Company, Ltd. AA- Very Strong A+ Superior A.M. Best a- Excellent RGA Life Reinsurance Company of Canada AA- Very Strong A+
Superior Moody’s Baa1 Medium RGA Life and Annuity Insurance Company AA- Very Strong A+ Superior RGA Reinsurance Company of Australia Limited AA- Very Strong RGA International Reinsurance Company dac AA- Very Strong RGA Global Reinsurance
Company, Ltd. AA- Very Strong RGA Worldwide Reinsurance Company, Ltd. AA- Very Strong RGA Reinsurance Company (Barbados) Ltd. AA- Very Strong RGA Atlantic Reinsurance Company Ltd. AA- Very Strong A+ Superior Omnilife Insurance Company Limited A+
Strong Aurora National Life Assurance Company A+ Superior All ratings on stable outlook. These ratings have been provided by Moody’s, S&P, and A.M. Best. None of these ratings is a recommendation to buy, sell, or hold any securities. Each
rating may be subject to revision or withdrawal at any time and should be evaluated independently of any other rating. 3
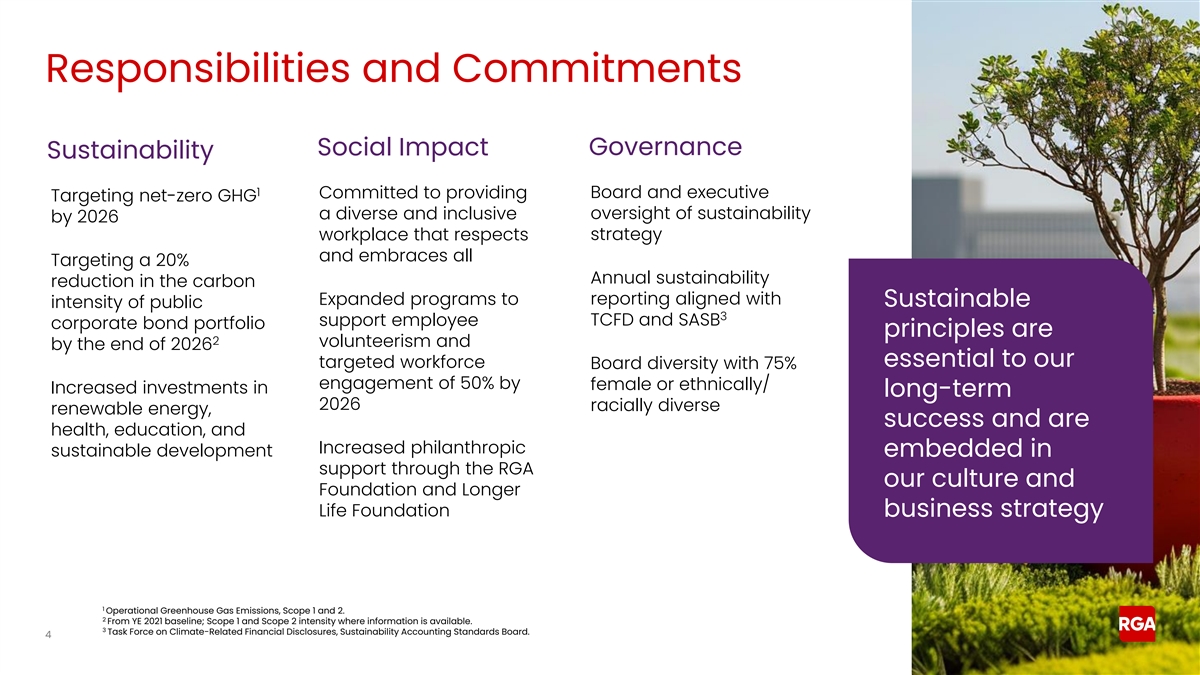
Responsibilities and Commitments Governance Social Impact Sustainability
1 Committed to providing Board and executive Targeting net-zero GHG oversight of sustainability a diverse and inclusive by 2026 workplace that respects strategy and embraces all Targeting a 20% Annual sustainability reduction in the carbon Expanded
programs to reporting aligned with Sustainable intensity of public 3 support employee TCFD and SASB corporate bond portfolio principles are 2 volunteerism and by the end of 2026 essential to our targeted workforce Board diversity with 75% engagement
of 50% by female or ethnically/ Increased investments in long-term 2026 racially diverse renewable energy, success and are health, education, and Increased philanthropic sustainable development embedded in support through the RGA our culture and
Foundation and Longer Life Foundation business strategy 1 Operational Greenhouse Gas Emissions, Scope 1 and 2. 2 From YE 2021 baseline; Scope 1 and Scope 2 intensity where information is available. 3 Task Force on Climate-Related Financial
Disclosures, Sustainability Accounting Standards Board. 4
Tony Cheng FIAA Jonathan Porter FSA, FCIA President and Chief Executive
Officer Executive Vice President, Reinsurance Group of America, Incorporated Global Chief Risk Officer Reinsurance Group of America, Incorporated Tony Cheng is President and Chief Executive Officer of Reinsurance Group of America, Incorporated
(RGA). He assumed the role of CEO Jonathan Porter is Executive Vice President and Global Chief Risk on January 1, 2024, and of President on January 4, 2023. Tony is also Officer for Reinsurance Group of America, Incorporated (RGA). He a member of
RGA's Board of Directors. Tony previously served as leads RGA’s global enterprise risk management efforts and directs Executive Vice President, Head of EMEA, Asia, and Australia, where he corporate pricing oversight. He is a member of
RGA’s Executive provided executive oversight for RGA's operations in those regions. Committee. Tony joined RGA in 1997 as Chief Actuary of Malaysian Life Jonathan has deep insights into RGA’s global business, having Reinsurance Group
Berhad, RGA’s joint venture with the Life previously served as Chief Pricing Actuary of International Markets, Insurance Association of Malaysia. In 2004, Tony was named Chief and more recently as Senior Vice President, Global Analytics and
In- Executive Officer of RGA’s Hong Kong office, responsible for all Force Management. business activity in Hong Kong and Southeast Asia, and in 2011, he was named Senior Vice President, Asia, an expanded role Before joining RGA in 2008,
Jonathan worked for Manulife Financial incorporating overall management of RGA Asia. for almost 15 years, where his last position was Chief Financial Officer, U.S. Life Insurance. He received his Bachelor of Economics (B.Ec.) degree from Macquarie
University in Sydney, Australia, and his M.B.A. from Jonathan received a Bachelor of Mathematics degree from the Washington University in St. Louis’ John M. Olin School of Business. He University of Waterloo. He is a Fellow of the Society of
Actuaries (FSA) is a Fellow of the Institute of Actuaries of Australia (FIAA). An active and a Fellow of the Canadian Institute of Actuaries (FCIA). participant and past President of the Actuarial Society of Hong Kong, he has also served as a
council member of the Society and as a past Chair of its Experience and Life Committees. 5
Leslie Barbi Todd C. Larson Executive Vice President, Senior Executive
Vice President, Chief Investment Officer Chief Financial Officer Reinsurance Group of America, Incorporated Reinsurance Group of America, Incorporated Leslie Barbi is Executive Vice President and Chief Investment Officer Todd C. Larson is Senior
Executive Vice President and Chief of Reinsurance Group of America, Incorporated (RGA). She leads Financial Officer of Reinsurance Group of America, Incorporated (RGA). Named to this post in May 2016, he is responsible for RGA’s RGA’s
Investment Management team, directs the company’s financial and capital management as well as for its financial investment policy and strategy, and oversees the global asset reporting functions. These functions include: oversight of portfolio.
She is a member of RGA’s Executive Committee. enterprise financial management and controls; capital market Leslie joined RGA in 2020, bringing more than 25 years of experience issuances by the company; development and submission of all filings
required by the Securities and Exchange Commission and in investment management, including 15 years of investment other regulatory bodies; and communication of corporate and leadership in the insurance industry. Most recently, she was with financial
information to the rating and investment communities. Northwestern Mutual Life Insurance Company, where she served as Executive Officer – Senior Vice President, Head of Public He is a member of RGA’s Executive Committee. Investments. In
this role, she led a team that actively managed $120 Previously, Todd was Executive Vice President, Chief Risk Officer billion in fixed income portfolios, directing portfolio management, of RGA, a role that incorporated management of RGA’s
global research, trading, strategy, and the asset/liability management enterprise risk and corporate pricing oversight. Prior to that, he and derivatives team. In addition, she served on multiple strategic committees, including the Investment
Committee, and was a board was Executive Vice President, Corporate Finance and Treasurer, member of Northwestern Mutual’s Wealth Management Company. responsible for coordinating external reporting, management of financial reporting for
RGA’s various operating segments and subsidiaries, and RGA’s capital management and treasury Prior to Northwestern Mutual, Leslie was Senior Managing Director, functions. Head of Public Fixed Income at The Guardian Life Insurance Company
of America. In this role, she managed $36 billion in fixed income assets and was responsible for oversight of the investment Todd joined RGA in 1995 as Vice President and Controller. Previously, he was Assistant Controller for Northwestern Mutual
process, which included a focus on process improvement, talent Life Insurance Company. He started his career with KPMG Peat development and retention, strategy development for portfolio Marwick LLP in Chicago, where he was a senior manager in the
construction, and risk management. Earlier in her career, Leslie held senior positions at Goldman Sachs Asset Management and at audit practice. Pacific Investment Management Company (PIMCO). Todd received his Bachelor of Science (B.S.) degree in
Accountancy from Northern Illinois University. He is a board Leslie received her Bachelor of Arts (A.B.) degree in economics from member of the SSM Health Hospice and Home Health Harvard University and her M.B.A. degree in finance from the
University of Chicago. Active in the industry, she served for eight Foundation, St. Louis, Missouri. years on the advisory board of the Fixed Income Forum, an industry organization comprising heads of fixed income or chief investment officers of
approximately 50 buy-side firms. 6
Ron Herrmann CFP Dustin Hetzler FSA, MAAA Executive Vice President,
Executive Vice President, Head of the Americas Global Financial Solutions Reinsurance Group of America, Incorporated Reinsurance Group of America, Incorporated Ron Herrmann is Executive Vice President, Head of the Americas for Dustin Hetzler is
Executive Vice President, Global Financial RGA. He oversees the company's business lines across North and Solutions (GFS), a unit of RGA. Dustin leads the global GFS team South America, which include U.S. Individual Life, U.S. Individual and
oversees all GFS product lines. He is also a member of RGA’s Health, U.S. Group Reinsurance, RGA Canada, RGA Latin America, Executive Committee. GFS Americas, and TAI. He is also a member of RGA's Executive Committee. During his three decades
of service with RGA, Dustin has led risk management, marketing, and transaction services for GFS, and Ron's extensive insurance industry career includes more than 25 the pricing of reinsurance transactions globally within all GFS lines years of
senior-level experience at major life and multi-line of business, including Capital Solutions, Asset-Intensive, Longevity, insurance companies. Prior to joining RGA in 2020, he was Head of Stable Value, Acquisitions, and Pension Risk Transfer.
Individual Life and Employee Benefits at Equitable and was also a member of the company's Operating Committee. With more than 30 years of reinsurance and insurance actuarial experience, Dustin has served in positions with various actuarial Over the
course of his career, Ron has had extensive corporate and management responsibilities. These responsibilities include transactional experience and played strategic roles in mergers, strategy, risk management, pricing, valuation, product spin-offs,
and acquisitions with both the acquiring and acquired development, talent development, and marketing. Some specific entities. In addition, he has held senior sales and sales areas of extensive involvement for Dustin include reinsurance management
roles for three large national and international solution construction, longevity, economic capital model insurance companies. development, treaty negotiation, and asset and liability model construction. These roles and responsibilities cover life,
health, Ron is a member of the American Council of Life Insurers (ACLI) and annuity products both domestically and internationally. Board of Directors and serves on the Council's CEO Steering Committees for Prudential Issues and Taxation, as well as
its Dustin received a Bachelor of Science (B.S.) degree in Reinsurance Executive Council. In addition, he is a member of the mathematics from Iowa State University. He is a Fellow of the LL Global Board of Directors and is actively involved with
FINSECA. Society of Actuaries (FSA) and a Member of the American Academy of Actuaries (MAAA). Ron graduated from Penn State University with a Bachelor of Science degree in finance and is a Certified Financial Planner®. 7
Arthur Ozeki Simon Wainwright FCIB Executive Vice President, Executive
Vice President, Head of Asia Pacific Head of EMEA Reinsurance Group of America, Incorporated Reinsurance Group of America, Incorporated Arthur Ozeki is Executive Vice President, Head of Asia Pacific, based in Simon Wainwright is Executive Vice
President, Head of EMEA. Simon is Hong Kong. Prior to his current role, he served as Senior Vice President, responsible for leading the management and growth of RGA’s China and Japan Markets. Since joining RGA in 2016 as Chief Executive
businesses and operations in the U.K. and Ireland, Continental Officer for RGA Reinsurance Company Japan Branch, Arthur has Europe, the Middle East, and Africa. He is a member of RGA’s played a pivotal role in strengthening RGA’s
presence and market Executive Committee. capabilities to serve the growing customer demand for innovative solutions in the Japan market. He is a member of RGA’s Executive Simon has more than 30 years of strategic and global leadership
Committee. experience in financial services. Prior to joining RGA in 2012 he worked for HSBC for 15 years in roles as varied as CEO HSBC Bank Arthur has more than 30 years of experience in international financial Ireland during the GFC, COO, Global
Commercial & Corporate services, and he has led mergers and acquisitions (M&A) and banking Banking, and Managing Director Insurance, EMEA. He has also held teams for global investment banks in Japan and Singapore for more executive
leadership roles with Lloyds Banking Group and than 20 of those years. He has advised many leading Japanese and Nationwide Building Society. multinational institutions on highly strategic and transformational transactions, particularly in the
automotive, industrial, healthcare, and He holds several directorships with both RGA and external financial services sectors. organizations. Simon is a graduate of The University of Reading and received a Diploma in Management Studies (DMS) from
Oxford, as Prior to joining RGA, Arthur was with the Macquarie Group in Japan well as an M.B.A. from Henley Management School. In addition, he is and Singapore, as Country Head, Branch Manager, and Chairman for a Fellow of the Chartered Institute of
Bankers (now The Institute of Japan. During this period, he oversaw the development of Macquarie’s Financial Services), and a Chartered Company Director and Fellow business in Japan across multiple areas, including investment of the Institute
of Directors. banking, capital-raising, and principal investments. In addition, Arthur has held senior leadership positions at UBS Securities and Lazard Frères in Japan, and with J.P. Morgan in both Japan and the United States. Arthur received
a Bachelor of Science (B.S.) in Computer Science and Engineering from the Massachusetts Institute of Technology and an MBA from the University of Chicago’s Graduate School of Business. 8
J. Jeffrey Hopson CFA Senior Vice President, Investor Relations
Reinsurance Group of America, Incorporated J. Jeffrey (Jeff) Hopson is Senior Vice President, Investor Relations for RGA. He is responsible for managing RGA’s financial communications with the investment community. Jeff, who came to RGA in
September 2013, has several decades of experience in the field of investment analysis, following a wide range of life and property-casualty insurance and asset management firms. A ten-time All-Star Analyst in The Wall Street Journal’s annual
Best of the Street poll, Jeff is also a member of the Journal’s Analysts Hall of Fame. Prior to joining RGA, Jeff was a Managing Director and Senior Analyst with the St. Louis-based brokerage and investment firm of Stifel, Nicolaus &
Company. Previously, he served in a variety of roles with the St. Louis-based regional brokerage firm of A.G. Edwards & Sons, Inc., culminating as Vice President, Senior Analyst and Group Leader, Financial Services. Jeff’s Bachelor of Arts
(B.A.) and M.B.A. degrees in Finance are from Saint Louis University. He is a Chartered Financial Analyst (CFA). 9

Welcome Jeff Hopson Senior Vice President, Investor Relations
10
Safe Harbor This document contains forward-looking statements within
the meaning of the Private Securities Litigation Reform Act of 1995 and federal securities laws including, among others, statements relating to projections of the future operations, strategies, earnings, revenues, income or loss, ratios, financial
performance and growth potential of Reinsurance Group of America, Incorporated (the “Company”). Forward-looking statements often contain words and phrases such as “anticipate,” “assume,” “believe,”
“continue,” “could,” “estimate,” “expect,” “if,” “intend,” “likely,” “may,” “plan,” “potential,” “pro forma,”
“project,” “should,” “will,” “would,” and other words and terms of similar meaning or that are otherwise tied to future periods or future performance, in each case in all derivative forms.
Forward-looking statements are based on management’s current expectations and beliefs concerning future developments and their potential effects on the Company. Forward-looking statements are not a guarantee of future performance and are
subject to risks and uncertainties, some of which cannot be predicted or quantified. Future events and actual results, performance, and achievements could differ materially from those set forth in, contemplated by or underlying the forward-looking
statements. Factors that could also cause results or events to differ, possibly materially, from those expressed or implied by forward-looking statements, include, among others: (1) adverse changes in mortality, morbidity, lapsation or claims
experience, (2) inadequate risk analysis and underwriting, (3) adverse capital and credit market conditions and their impact on the Company’s liquidity, access to capital and cost of capital, (4) changes in the Company’s financial
strength and credit ratings and the effect of such changes on the Company’s future results of operations and financial condition, (5) the availability and cost of collateral necessary for regulatory reserves and capital, (6) requirements to
post collateral or make payments due to declines in the market value of assets subject to the Company’s collateral arrangements, (7) action by regulators who have authority over the Company’s reinsurance operations in the jurisdictions
in which it operates, (8) the effect of the Company parent’s status as an insurance holding company and regulatory restrictions on its ability to pay principal of and interest on its debt obligations, (9) general economic conditions or a
prolonged economic downturn affecting the demand for insurance and reinsurance in the Company’s current and planned markets, (10) the impairment of other financial institutions and its effect on the Company’s business, (11) fluctuations
in U.S. or foreign currency exchange rates, interest rates, or securities and real estate markets, (12) market or economic conditions that adversely affect the value of the Company’s investment securities or result in the impairment of all or
a portion of the value of certain of the Company’s investment securities that in turn could affect regulatory capital, (13) market or economic conditions that adversely affect the Company’s ability to make timely sales of investment
securities, (14) risks inherent in the Company’s risk management and investment strategy, including changes in investment portfolio yields due to interest rate or credit quality changes, (15) the fact that the determination of allowances and
impairments taken on the Company’s investments is highly subjective, (16) the stability of and actions by governments and economies in the markets in which the Company operates, including ongoing uncertainties regarding the amount of U.S.
sovereign debt and the credit ratings thereof, (17) the Company’s dependence on third parties, including those insurance companies and reinsurers to which the Company cedes some reinsurance, third-party investment managers and others, (18)
financial performance of the Company’s clients, (19) the threat of natural disasters, catastrophes, terrorist attacks, pandemics, epidemics or other major public health issues anywhere in the world where the Company or its clients do business,
(20) competitive factors and competitors’ responses to the Company’s initiatives, (21) development and introduction of new products and distribution opportunities, (22) execution of the Company’s entry into new markets, (23)
integration of acquired blocks of business and entities, (24) interruption or failure of the Company’s telecommunication, information technology or other operational systems, or the Company’s failure to maintain adequate security to
protect the confidentiality or privacy of personal or sensitive data and intellectual property stored on such systems, (25) adverse developments with respect to litigation, arbitration or regulatory investigations or actions, (26) the adequacy of
reserves, resources and accurate information relating to settlements, awards and terminated and discontinued lines of business, (27) changes in laws, regulations, and accounting standards applicable to the Company or its business, including
Long-Duration Targeted Improvement accounting changes and (28) other risks and uncertainties described in this document and in the Company’s filings with the Securities and Exchange Commission (“SEC”). Forward-looking statements
should be evaluated together with the many risks and uncertainties that affect the Company’s business, including those mentioned in this document and described in the periodic reports the Company files with the SEC. These forward-looking
statements speak only as of the date on which they are made. The Company does not undertake any obligation to update these forward-looking statements, even though the Company’s situation may change in the future, except as required under
applicable securities law. For a discussion of the risks and uncertainties that could cause actual results to differ materially from those contained in the forward-looking statements, you are advised to see Item 1A – “Risk Factors”
in the Company’s Annual Report on Form 10-K for the year ended December 31, 2023, as may be supplemented by Item 1A - “Risk Factors” in the Company’s subsequent Quarterly Reports on Form 10-Q and in our other periodic and
current reports filed with the SEC. 11
Use of Non-GAAP Financial Measures Non-GAAP Financial Measures
Reinsurance Group of America, Incorporated (the “Company”) discloses certain financial measures that are not determined in accordance with U.S. GAAP. The Company principally uses such non-GAAP financial measures in evaluating performance
because the Company believes that such measures, when reviewed in conjunction with relevant U.S. GAAP measures, present a clearer picture of our operating performance and assist the Company in the allocation of its resources. The Company believes
that these non-GAAP financial measures provide investors and other third parties with a better understanding of the Company’s results of operations, financial statements and the underlying profitability drivers and trends of the
Company’s businesses by excluding specified items which may not be indicative of the Company’s ongoing operating performance and may fluctuate significantly from period to period. These measures should be considered supplementary to the
Company’s financial results that are presented in accordance with U.S. GAAP and should not be viewed as a substitute for U.S. GAAP measures. Other companies may use similarly titled non-GAAP financial measures that are calculated differently
from the way the Company calculates such measures. Consequently, the Company’s non-GAAP financial measures may not be comparable to similar measures used by other companies. The following non-GAAP financial measures are used in this document
or in other public disclosures made by the Company from time to time: 1. Adjusted operating income, on a pre-tax and after-tax basis, and adjusted operating income per diluted share. The Company uses these measures as a basis for analyzing financial
results because the Company believes that such measures better reflect the ongoing profitability and underlying trends of the Company’s continuing operations. Adjusted operating income is calculated as net income available to the
Company’s shareholders (or, in the case of pre-tax adjusted operating income, income before income taxes) excluding, as applicable: • substantially all of the effect of net investment related gains and losses; • changes in the fair
value of certain embedded derivatives; • changes in the fair value of contracts that provide market risk benefits; • non-economic losses at contract inception for direct pension risk transfer single premium business (which are amortized
into adjusted operating income within claims and other policy benefits over the estimated lives of the contracts); • any net gain or loss from discontinued operations; • the cumulative effect of any accounting changes; • the impact
of certain tax-related items; and • any other items that the Company believes are not indicative of the Company’s ongoing operations as such items can be volatile and may not reflect the underlying performance of the Company’s
business. In addition, adjusted operating income per diluted share is calculated as adjusted operating income divided by weighted average diluted shares outstanding. These measures also serve as a basis for establishing target levels and awards
under the Company’s management incentive programs. 2. Adjusted operating income (on a pre-tax and after-tax basis), excluding notable items. Notable items are items the Company believes may not be indicative of its ongoing operating
performance which are excluded from adjusted operating income to provide investors and other third parties with a better understanding of the Company’s results. Such items may be unexpected, unknown when the Company prepares its business plan
or otherwise. Notable items presented may include the financial impact of the Company’s assumption reviews on business subject to the Financial Accounting Standards Board’s Accounting Standards Update No. 2018-12, “Targeted
Improvements to the Accounting for Long-Duration Contracts” and related amendments, reflected in future policy benefits remeasurement gains or losses. 3. Adjusted operating revenue. This measure excludes the effects of net realized capital
gains and losses, and changes in the fair value of certain embedded derivatives. 4. Shareholders’ equity position excluding the impact of accumulated other comprehensive income (loss) (“AOCI”), shareholders’ average equity
position excluding AOCI, and book value per share excluding the impact of AOCI. The Company believes that these measures provide useful information since such measures exclude AOCI-related items that are not permanent and can fluctuate significantly
from period to period, and may not reflect the impact of the underlying performance of the Company’s businesses on shareholders’ equity and book value per share. AOCI primarily relates to changes in interest rates, credit spreads on its
investment securities, future policy benefits discount rate measurement gains (losses), market risk benefits instrument-specific credit risk remeasurement gains (losses) and foreign currency fluctuations. The Company also discloses the following
non-GAAP financial measures: • Shareholders’ average equity position excluding AOCI and B36, where B36 refers to the cumulative change in fair value of funds withheld embedded derivatives; • Shareholders’ average equity
position excluding AOCI and notable items; and • Shareholders’ average equity position excluding AOCI, B36 and notable items. 5. Adjusted operating return on equity. This measure is calculated as adjusted operating income divided by
average shareholders’ equity excluding AOCI. Adjusted operating return on equity also serves as a basis for establishing target levels and awards under the Company’s management incentive programs. The Company also discloses the following
non-GAAP financial measures: • Adjusted operating return on equity excluding AOCI and B36; • Adjusted operating return on equity excluding AOCI and notable items, which is calculated as adjusted operating income excluding notable items
divided by average shareholders’ equity excluding notable items and AOCI; and • Adjusted operating return on equity excluding AOCI, B36 and notable items. 6. Adjusted operating return on equity by sources of earnings . These measure are
calculated utilizing adjusted operating income for each source of earnings divided by average shareholders’ equity excluding AOCI. The Company discloses the return on equity for the following earnings categories: • Investment margin
– Investment margin represents net investment income and certain investment related gains (losses) less interest accrued on liabilities for future policy benefits, and interest credited on interest sensitive liabilities. A portion of net
investment income and investment related gains (losses) is allocated to expense and financing to cover the Company’s cost of capital. • Fee income – Fee income represents fees earned on capital solutions and financial reinsurance
transactions that do not qualify for reinsurance under U.S. GAAP due to the remote-risks nature of the transactions. • Underwriting margin & other income – Underwriting margin and other income represents premiums and policyholder
related fees and charges less policyholder benefits, future policy benefits remeasurement (gains) losses, and policy acquisition costs and other insurance expenses. • Capital, tax, financing & management expenses – Capital, tax,
financing and management expenses represents an allocation of net investment income and investment related gains (losses) less other operating expenses, interest on long-term debt, and income taxes. Reconciliations of the foregoing non-GAAP
financial measures (to the extent disclosed in this document) to the most comparable GAAP financial measures are provided in the Appendix at the end of this document. 12

Jeff Hopson Welcome Agenda Senior Vice President, Investor Relations
Tony Cheng CEO Comments President and Chief Executive Officer Jonathan Porter Risk Management Executive Vice President, Global Chief Risk Officer Leslie Barbi Investments Executive Vice President, Chief Investment Officer Todd Larson Financial
Overview Senior Executive Vice President, Chief Financial Officer Break Tony Cheng Q&A President and Chief Executive Officer 13

CEO Comments Tony Cheng President and Chief Executive Officer
14
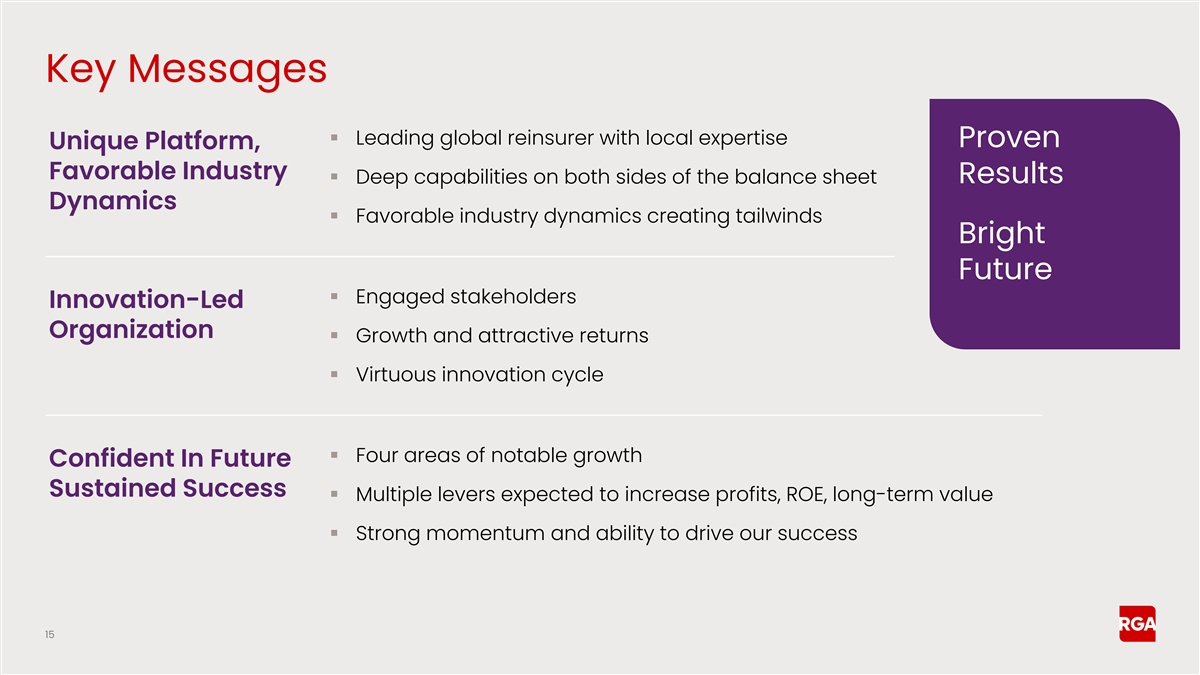
Key Messages ▪ Leading global reinsurer with local expertise
Proven Unique Platform, Favorable Industry ▪ Deep capabilities on both sides of the balance sheet Results Dynamics ▪ Favorable industry dynamics creating tailwinds Bright Future ▪ Engaged stakeholders Innovation-Led Organization
▪ Growth and attractive returns ▪ Virtuous innovation cycle ▪ Four areas of notable growth Confident In Future Sustained Success ▪ Multiple levers expected to increase profits, ROE, long-term value ▪ Strong momentum and
ability to drive our success 15
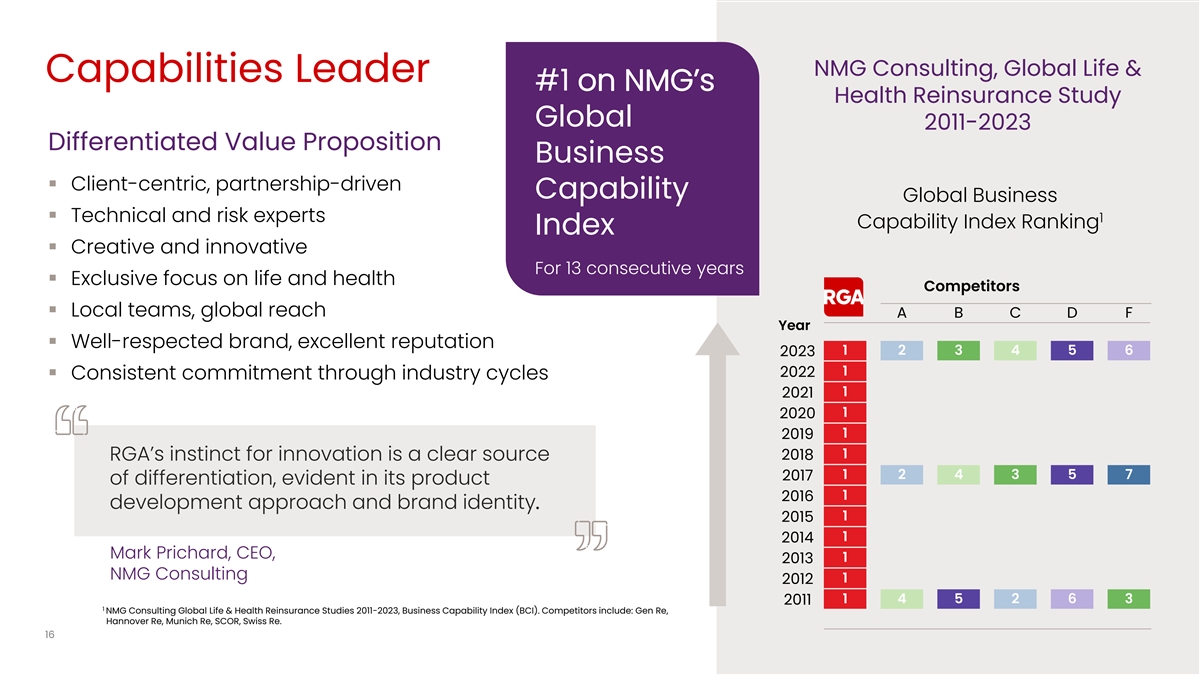
NMG Consulting, Global Life & Capabilities Leader #1 on NMG’s
Health Reinsurance Study Global 2011-2023 Differentiated Value Proposition Business ▪ Client-centric, partnership-driven Capability Global Business ▪ Technical and risk experts 1 Capability Index Ranking Index ▪ Creative and
innovative For 13 consecutive years ▪ Exclusive focus on life and health Competitors ▪ Local teams, global reach A B C D F Year ▪ Well-respected brand, excellent reputation 1 2 3 4 5 6 2023 1 2022 ▪ Consistent commitment
through industry cycles 1 2021 1 2020 1 2019 1 2018 RGA’s instinct for innovation is a clear source 1 2 4 3 5 7 2017 of differentiation, evident in its product 1 2016 development approach and brand identity. 1 2015 1 2014 Mark Prichard, CEO, 1
2013 NMG Consulting 1 2012 1 4 5 2 6 3 2011 1 NMG Consulting Global Life & Health Reinsurance Studies 2011-2023, Business Capability Index (BCI). Competitors include: Gen Re, Hannover Re, Munich Re, SCOR, Swiss Re. 16
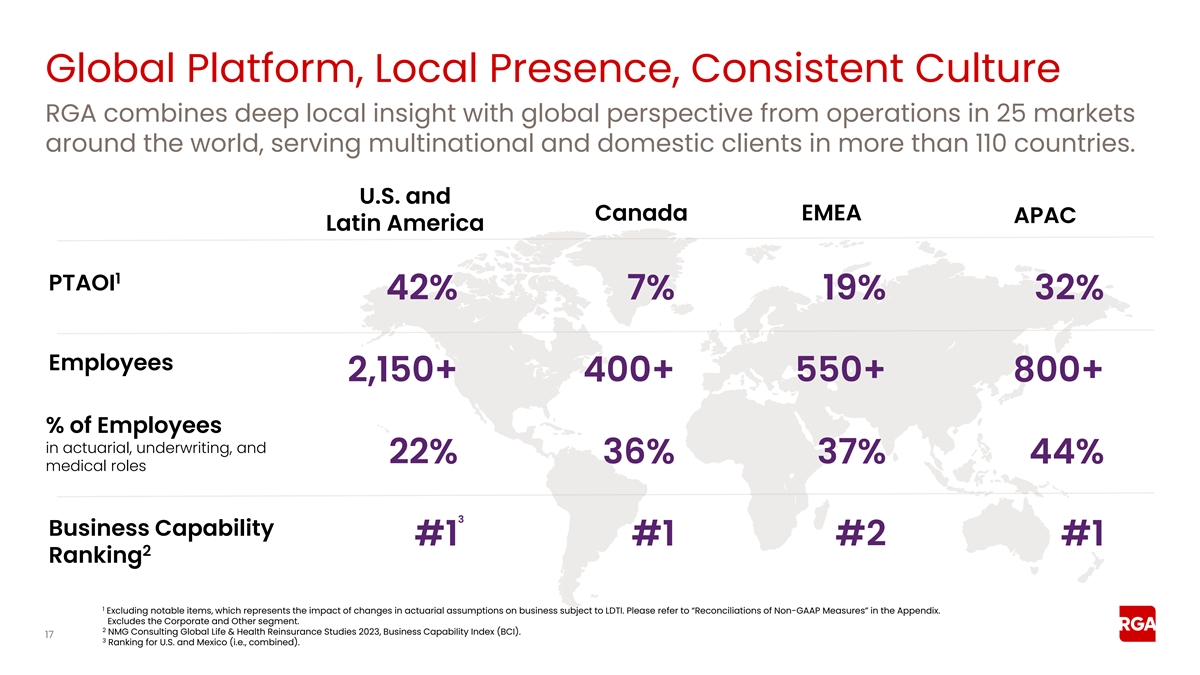
Global Platform, Local Presence, Consistent Culture RGA combines deep
local insight with global perspective from operations in 25 markets around the world, serving multinational and domestic clients in more than 110 countries. U.S. and EMEA Canada APAC Latin America 1 PTAOI 42% 7% 19% 32% Employees 2,150+ 400+ 550+
800+ % of Employees in actuarial, underwriting, and 22% 36% 37% 44% medical roles 3 Business Capability #1 #1 #2 #1 2 Ranking 1 Excluding notable items, which represents the impact of changes in actuarial assumptions on business subject to LDTI.
Please refer to “Reconciliations of Non-GAAP Measures” in the Appendix. Excludes the Corporate and Other segment. 2 NMG Consulting Global Life & Health Reinsurance Studies 2023, Business Capability Index (BCI). 17 3 Ranking for U.S.
and Mexico (i.e., combined).
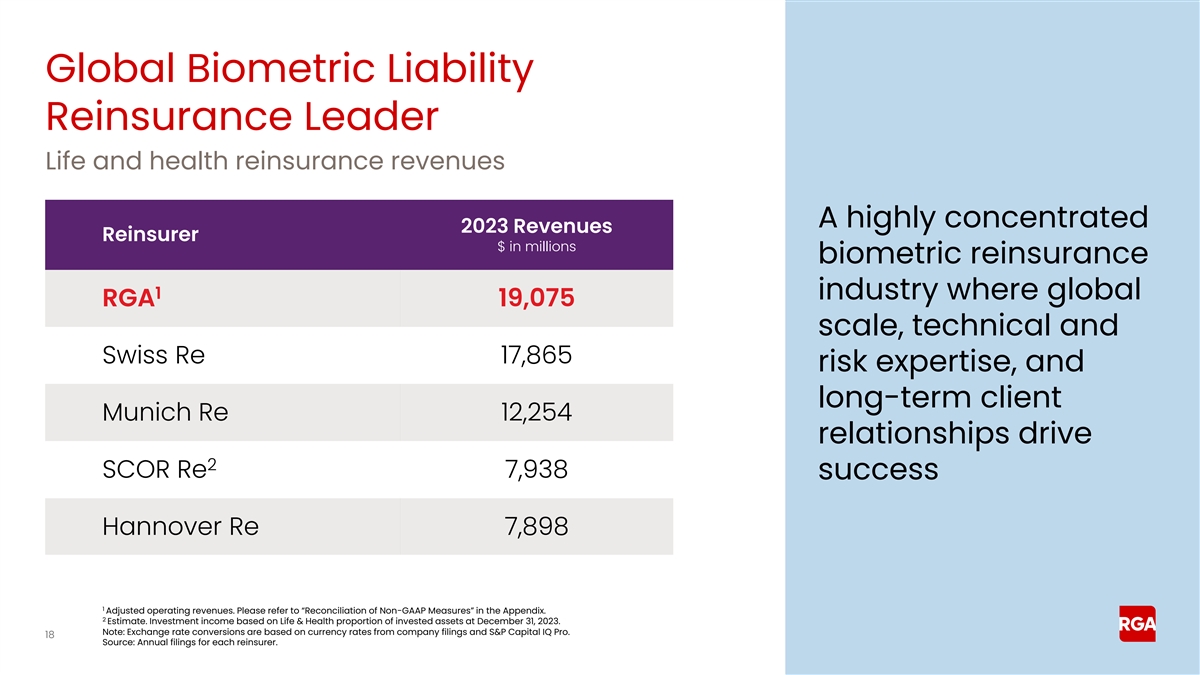
Global Biometric Liability Reinsurance Leader Life and health
reinsurance revenues A highly concentrated 2023 Revenues Reinsurer $ in millions biometric reinsurance 1 industry where global RGA 19,075 scale, technical and Swiss Re 17,865 risk expertise, and long-term client Munich Re 12,254 relationships drive
2 SCOR Re 7,938 success Hannover Re 7,898 1 Adjusted operating revenues. Please refer to “Reconciliation of Non-GAAP Measures” in the Appendix. 2 Estimate. Investment income based on Life & Health proportion of invested assets at
December 31, 2023. Note: Exchange rate conversions are based on currency rates from company filings and S&P Capital IQ Pro. 18 Source: Annual filings for each reinsurer.
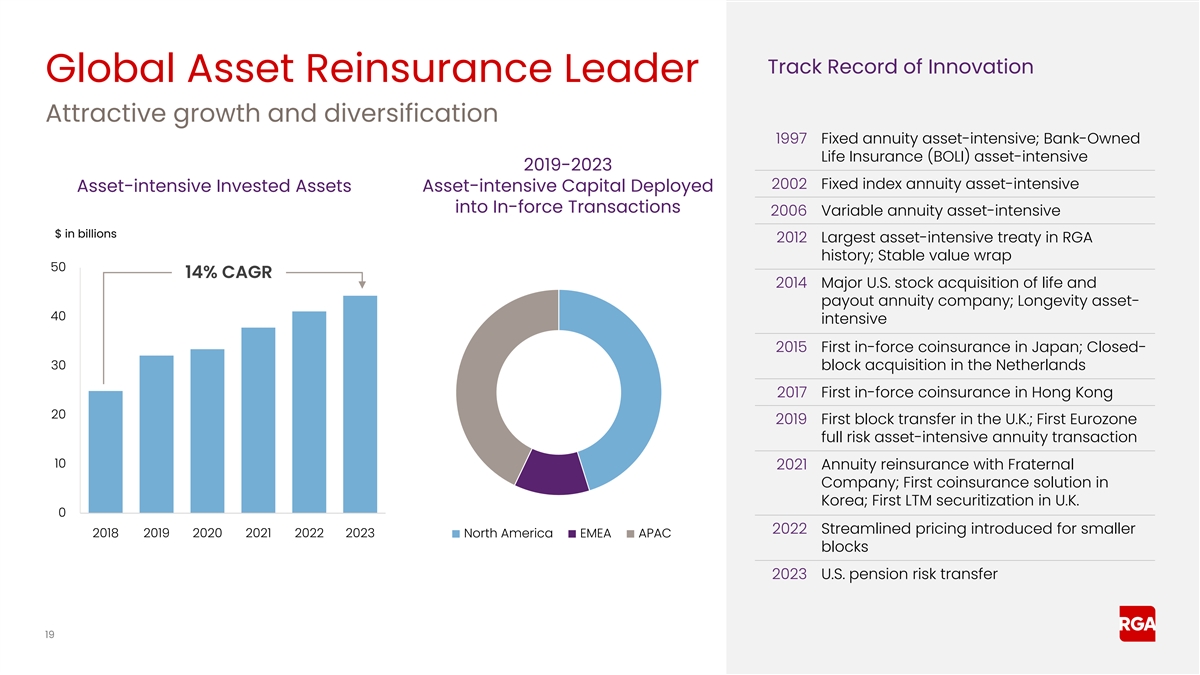
Track Record of Innovation Global Asset Reinsurance Leader Attractive
growth and diversification 1997 Fixed annuity asset-intensive; Bank-Owned Life Insurance (BOLI) asset-intensive 2019-2023 2002 Fixed index annuity asset-intensive Asset-intensive Invested Assets Asset-intensive Capital Deployed into In-force
Transactions 2006 Variable annuity asset-intensive $ in billions 2012 Largest asset-intensive treaty in RGA history; Stable value wrap 50 14% CAGR 2014 Major U.S. stock acquisition of life and payout annuity company; Longevity asset- 40 intensive
2015 First in-force coinsurance in Japan; Closed- 30 block acquisition in the Netherlands 2017 First in-force coinsurance in Hong Kong 20 2019 First block transfer in the U.K.; First Eurozone full risk asset-intensive annuity transaction 10 2021
Annuity reinsurance with Fraternal Company; First coinsurance solution in Korea; First LTM securitization in U.K. 0 2022 Streamlined pricing introduced for smaller 2018 2019 2020 2021 2022 2023 North America EMEA APAC blocks 2023 U.S. pension risk
transfer 19
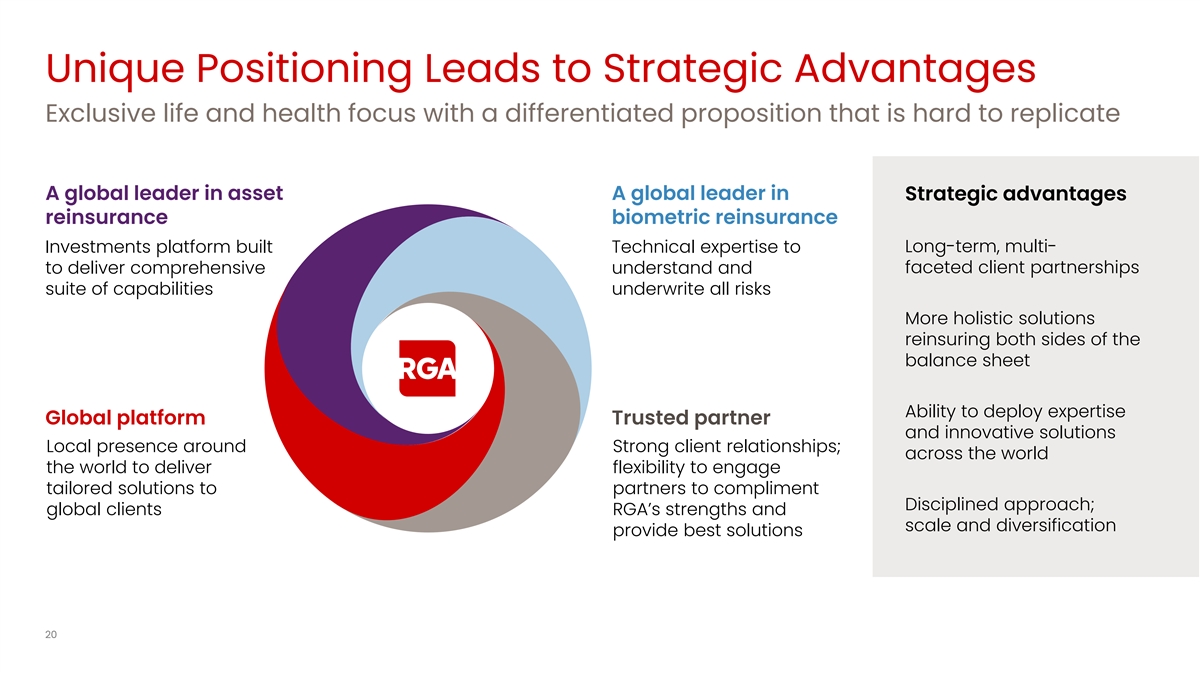
Unique Positioning Leads to Strategic Advantages Exclusive life and
health focus with a differentiated proposition that is hard to replicate A global leader in asset A global leader in Strategic advantages reinsurance biometric reinsurance Investments platform built Technical expertise to Long-term, multi- to
deliver comprehensive understand and faceted client partnerships suite of capabilities underwrite all risks More holistic solutions reinsuring both sides of the balance sheet Ability to deploy expertise Global platform Trusted partner and innovative
solutions Local presence around Strong client relationships; across the world the world to deliver flexibility to engage tailored solutions to partners to compliment Disciplined approach; global clients RGA’s strengths and scale and
diversification provide best solutions 20
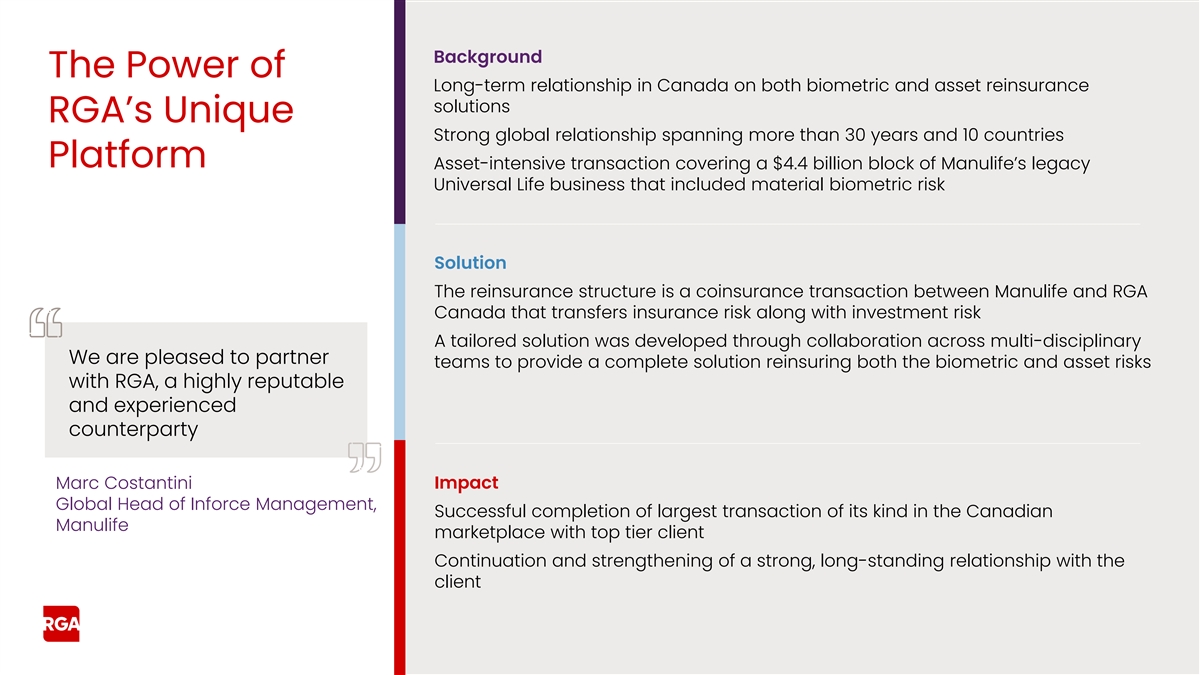
Background The Power of Long-term relationship in Canada on both
biometric and asset reinsurance solutions RGA’s Unique Strong global relationship spanning more than 30 years and 10 countries Platform Asset-intensive transaction covering a $4.4 billion block of Manulife’s legacy Universal Life
business that included material biometric risk Solution The reinsurance structure is a coinsurance transaction between Manulife and RGA Canada that transfers insurance risk along with investment risk A tailored solution was developed through
collaboration across multi-disciplinary We are pleased to partner teams to provide a complete solution reinsuring both the biometric and asset risks with RGA, a highly reputable and experienced counterparty Marc Costantini Impact Global Head of
Inforce Management, Successful completion of largest transaction of its kind in the Canadian Manulife marketplace with top tier client Continuation and strengthening of a strong, long-standing relationship with the client
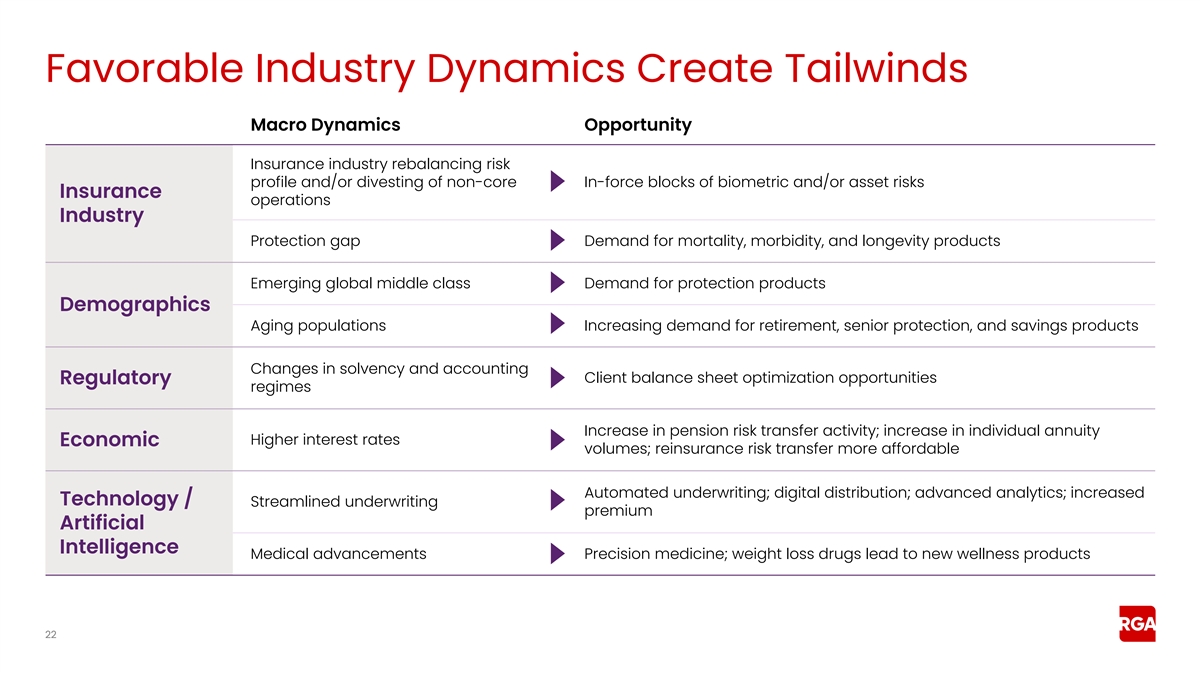
Favorable Industry Dynamics Create Tailwinds Macro Dynamics Opportunity
Insurance industry rebalancing risk profile and/or divesting of non-core In-force blocks of biometric and/or asset risks Insurance operations Industry Protection gap Demand for mortality, morbidity, and longevity products Emerging global middle
class Demand for protection products Demographics Aging populations Increasing demand for retirement, senior protection, and savings products Changes in solvency and accounting Client balance sheet optimization opportunities Regulatory regimes
Increase in pension risk transfer activity; increase in individual annuity Higher interest rates Economic volumes; reinsurance risk transfer more affordable Automated underwriting; digital distribution; advanced analytics; increased Technology /
Streamlined underwriting premium Artificial Intelligence Medical advancements Precision medicine; weight loss drugs lead to new wellness products 22
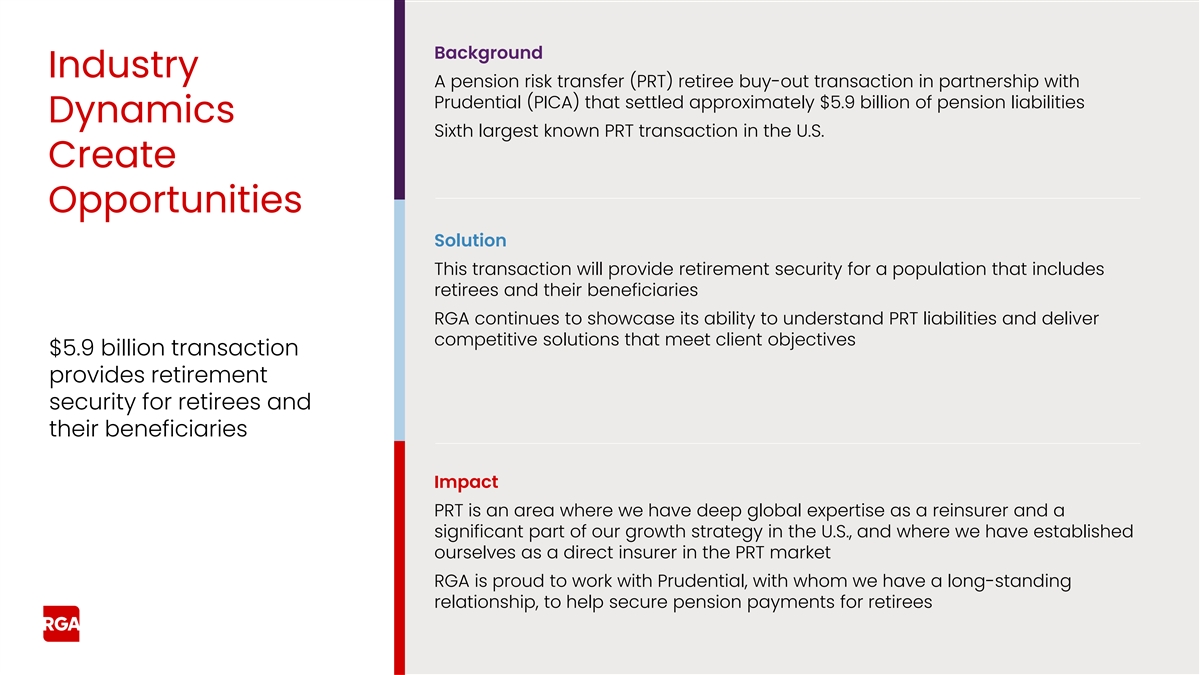
Background Industry A pension risk transfer (PRT) retiree buy-out
transaction in partnership with Prudential (PICA) that settled approximately $5.9 billion of pension liabilities Dynamics Sixth largest known PRT transaction in the U.S. Create Opportunities Solution This transaction will provide retirement security
for a population that includes retirees and their beneficiaries RGA continues to showcase its ability to understand PRT liabilities and deliver competitive solutions that meet client objectives $5.9 billion transaction provides retirement security
for retirees and their beneficiaries Impact PRT is an area where we have deep global expertise as a reinsurer and a significant part of our growth strategy in the U.S., and where we have established ourselves as a direct insurer in the PRT market
RGA is proud to work with Prudential, with whom we have a long-standing relationship, to help secure pension payments for retirees
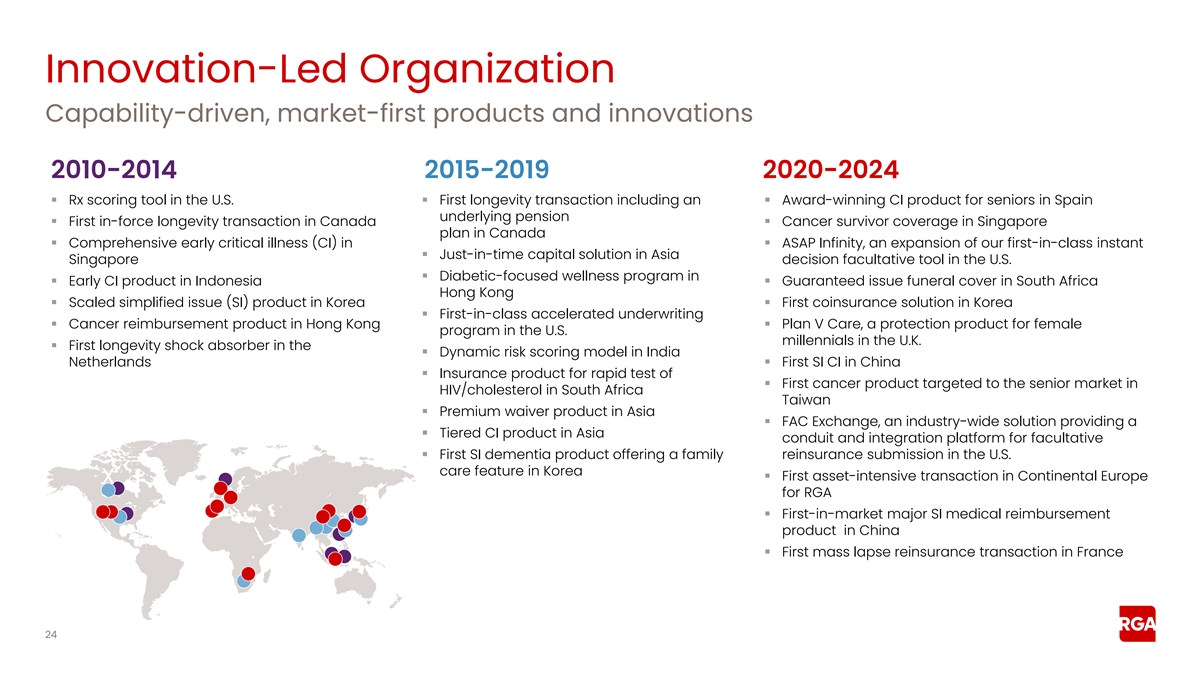
Innovation-Led Organization Capability-driven, market-first products
and innovations 2010-2014 2015-2019 2020-2024 ▪ Rx scoring tool in the U.S.▪ First longevity transaction including an ▪ Award-winning CI product for seniors in Spain underlying pension ▪ First in-force longevity transaction
in Canada▪ Cancer survivor coverage in Singapore plan in Canada ▪ Comprehensive early critical illness (CI) in ▪ ASAP Infinity, an expansion of our first-in-class instant ▪ Just-in-time capital solution in Asia Singapore
decision facultative tool in the U.S. ▪ Diabetic-focused wellness program in ▪ Early CI product in Indonesia▪ Guaranteed issue funeral cover in South Africa Hong Kong ▪ Scaled simplified issue (SI) product in Korea▪
First coinsurance solution in Korea ▪ First-in-class accelerated underwriting ▪ Cancer reimbursement product in Hong Kong▪ Plan V Care, a protection product for female program in the U.S. millennials in the U.K. ▪ First
longevity shock absorber in the ▪ Dynamic risk scoring model in India Netherlands▪ First SI CI in China ▪ Insurance product for rapid test of ▪ First cancer product targeted to the senior market in HIV/cholesterol in South
Africa Taiwan ▪ Premium waiver product in Asia ▪ FAC Exchange, an industry-wide solution providing a ▪ Tiered CI product in Asia conduit and integration platform for facultative ▪ First SI dementia product offering a family
reinsurance submission in the U.S. care feature in Korea ▪ First asset-intensive transaction in Continental Europe X for RGA ` ▪ First-in-market major SI medical reimbursement product in China ▪ First mass lapse reinsurance
transaction in France 24
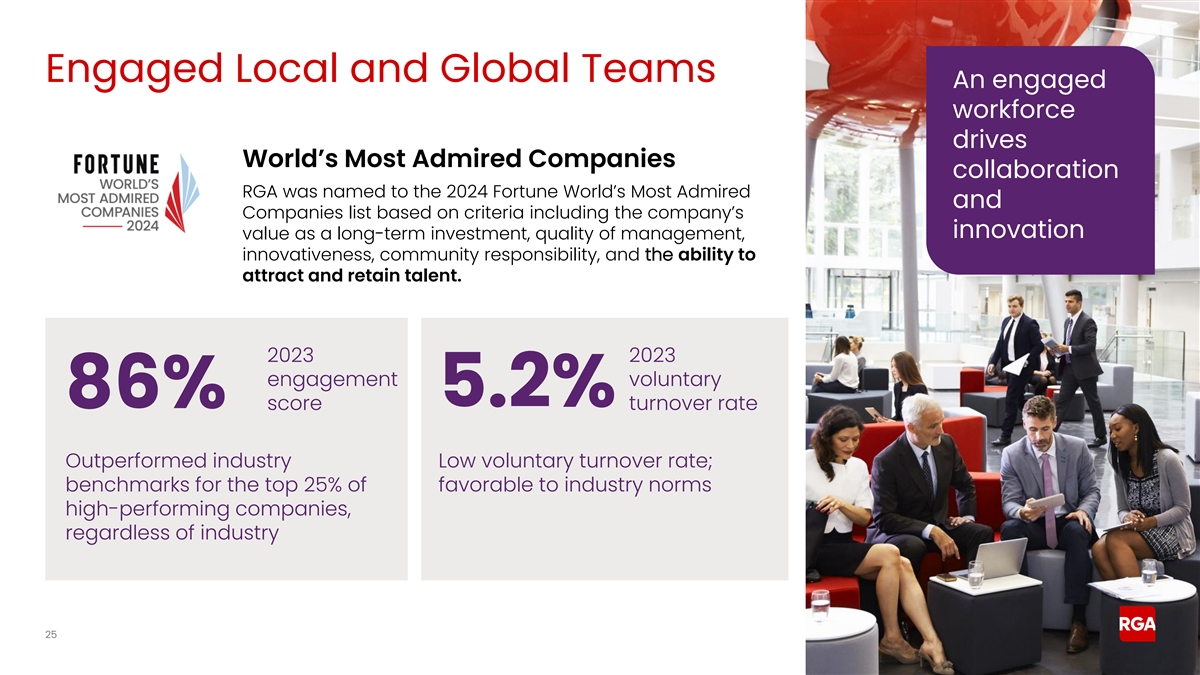
Engaged Local and Global Teams An engaged workforce drives
World’s Most Admired Companies collaboration RGA was named to the 2024 Fortune World’s Most Admired and Companies list based on criteria including the company’s innovation value as a long-term investment, quality of management,
innovativeness, community responsibility, and the ability to attract and retain talent. 2023 2023 engagement voluntary 5.2% 86% score turnover rate Outperformed industry Low voluntary turnover rate; benchmarks for the top 25% of favorable to
industry norms high-performing companies, regardless of industry 25
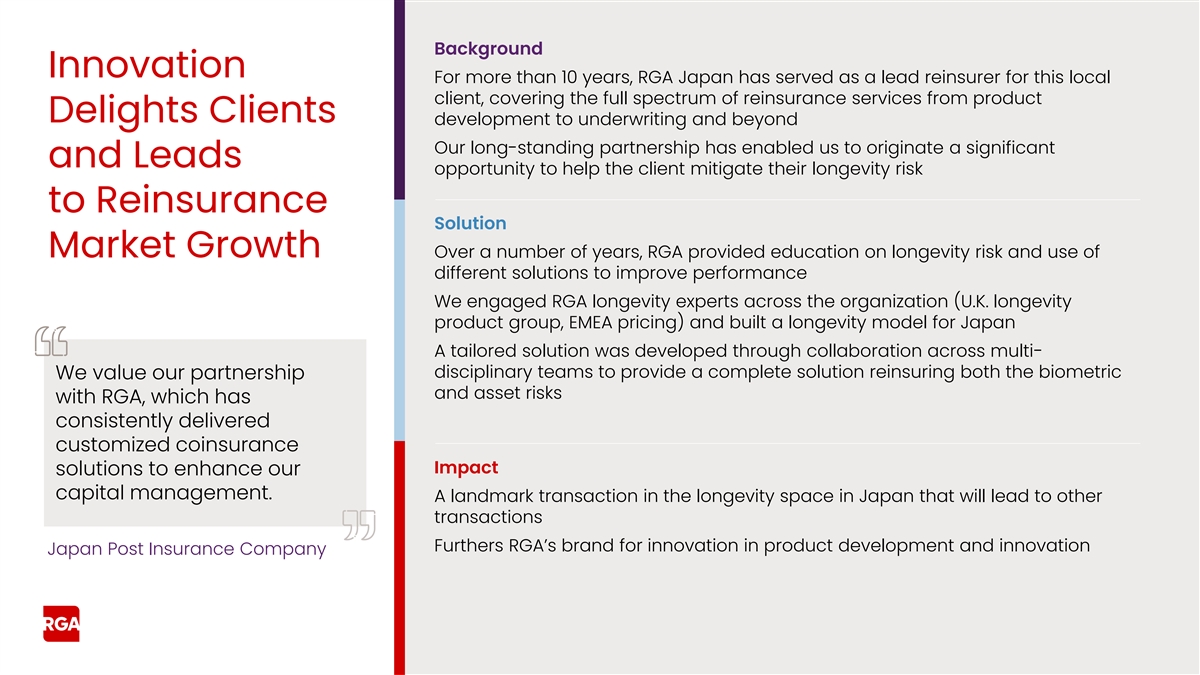
Background Innovation For more than 10 years, RGA Japan has served as a
lead reinsurer for this local client, covering the full spectrum of reinsurance services from product Delights Clients development to underwriting and beyond Our long-standing partnership has enabled us to originate a significant and Leads
opportunity to help the client mitigate their longevity risk to Reinsurance Solution Market Growth Over a number of years, RGA provided education on longevity risk and use of different solutions to improve performance We engaged RGA longevity
experts across the organization (U.K. longevity product group, EMEA pricing) and built a longevity model for Japan A tailored solution was developed through collaboration across multi- disciplinary teams to provide a complete solution reinsuring
both the biometric We value our partnership and asset risks with RGA, which has consistently delivered customized coinsurance Impact solutions to enhance our capital management. A landmark transaction in the longevity space in Japan that will lead
to other transactions Furthers RGA’s brand for innovation in product development and innovation Japan Post Insurance Company
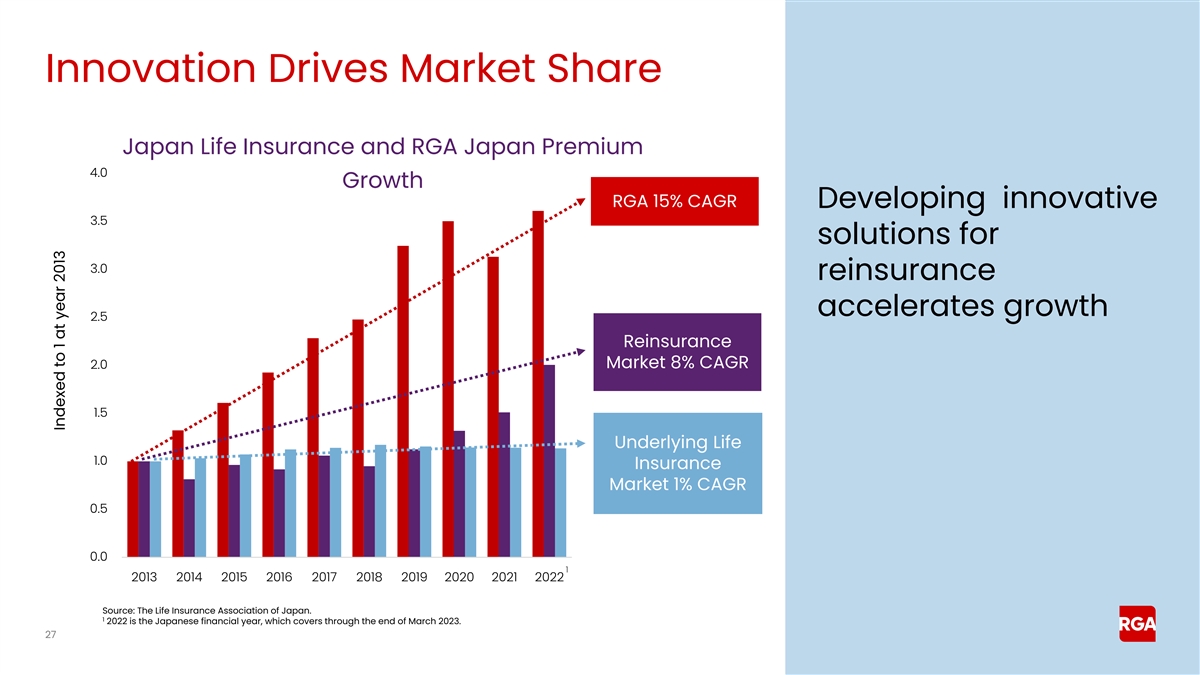
Innovation Drives Market Share Japan Life Insurance and RGA Japan
Premium 4.0 Growth RGA 15% CAGR Developing innovative 3.5 solutions for 3.0 reinsurance accelerates growth 2.5 Reinsurance 2.0 Market 8% CAGR 1.5 Underlying Life 1.0 Insurance Market 1% CAGR 0.5 0.0 1 2013 2014 2015 2016 2017 2018 2019 2020 2021
2022 Source: The Life Insurance Association of Japan. 1 2022 is the Japanese financial year, which covers through the end of March 2023. 27 Indexed to 1 at year 2013
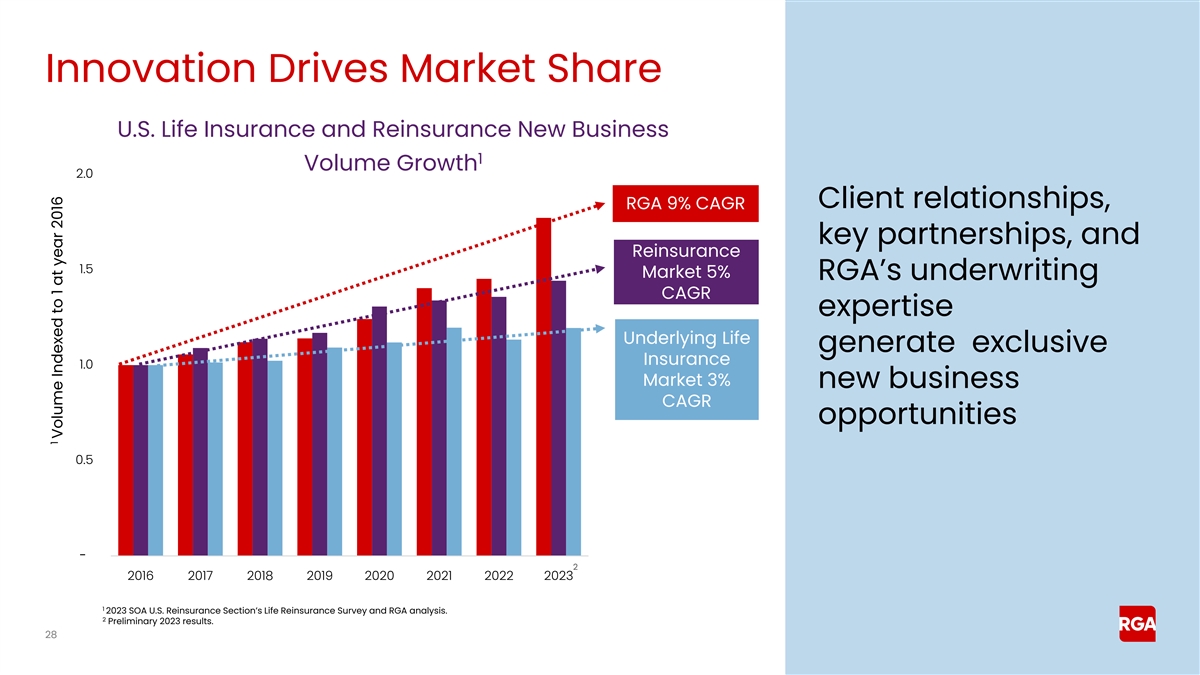
Innovation Drives Market Share U.S. Life Insurance and Reinsurance New
Business 1 Volume Growth 2.0 Client relationships, RGA 9% CAGR key partnerships, and Reinsurance 1.5 Market 5% RGA’s underwriting CAGR expertise Underlying Life generate exclusive Insurance 1.0 Market 3% new business CAGR opportunities 0.5 - 2
2016 2017 2018 2019 2020 2021 2022 2023 1 2023 SOA U.S. Reinsurance Section’s Life Reinsurance Survey and RGA analysis. 2 Preliminary 2023 results. 28 1 Volume Indexed to 1 at year 2016
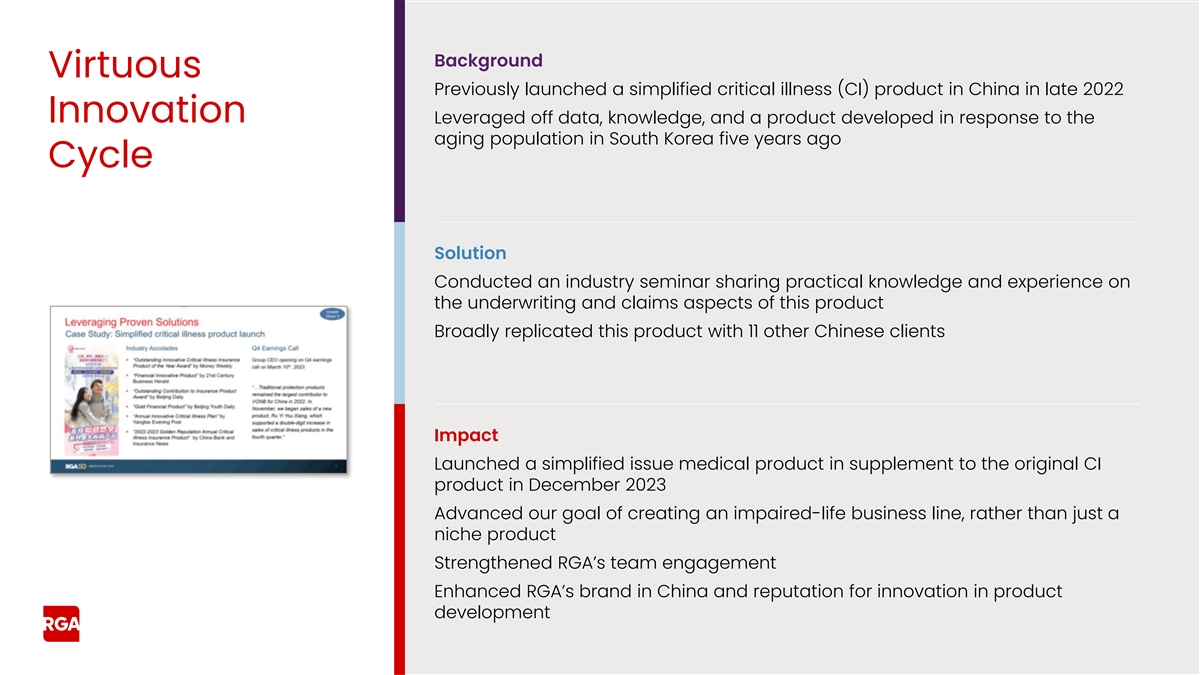
Background Virtuous Previously launched a simplified critical illness
(CI) product in China in late 2022 Innovation Leveraged off data, knowledge, and a product developed in response to the aging population in South Korea five years ago Cycle Solution Conducted an industry seminar sharing practical knowledge and
experience on the underwriting and claims aspects of this product Broadly replicated this product with 11 other Chinese clients Impact Launched a simplified issue medical product in supplement to the original CI product in December 2023 Advanced our
goal of creating an impaired-life business line, rather than just a niche product Strengthened RGA’s team engagement Enhanced RGA’s brand in China and reputation for innovation in product development
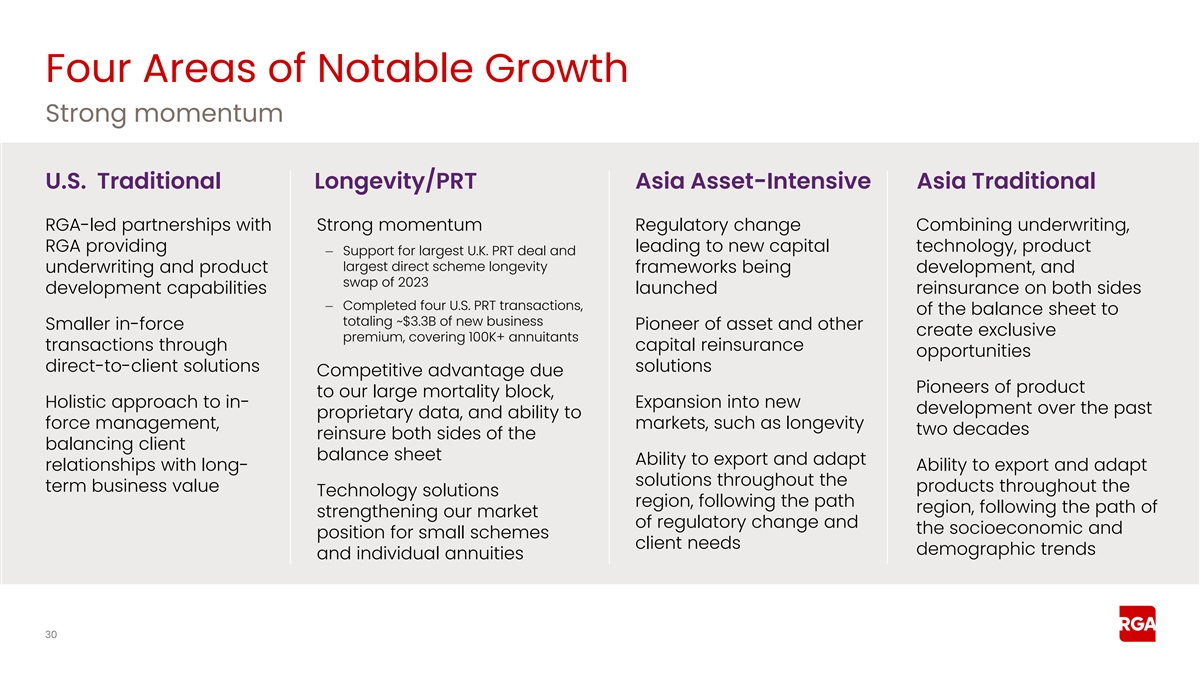
Four Areas of Notable Growth Strong momentum U.S. Traditional
Longevity/PRT Asia Asset-Intensive Asia Traditional RGA-led partnerships with Strong momentum Regulatory change Combining underwriting, RGA providing leading to new capital technology, product – Support for largest U.K. PRT deal and largest
direct scheme longevity underwriting and product frameworks being development, and swap of 2023 development capabilities launched reinsurance on both sides – Completed four U.S. PRT transactions, of the balance sheet to totaling ~$3.3B of new
business Smaller in-force Pioneer of asset and other create exclusive premium, covering 100K+ annuitants transactions through capital reinsurance opportunities direct-to-client solutions solutions Competitive advantage due Pioneers of product to our
large mortality block, Holistic approach to in- Expansion into new development over the past proprietary data, and ability to force management, markets, such as longevity two decades reinsure both sides of the balancing client balance sheet Ability
to export and adapt relationships with long- Ability to export and adapt solutions throughout the term business value products throughout the Technology solutions region, following the path region, following the path of strengthening our market of
regulatory change and the socioeconomic and position for small schemes client needs demographic trends and individual annuities 30
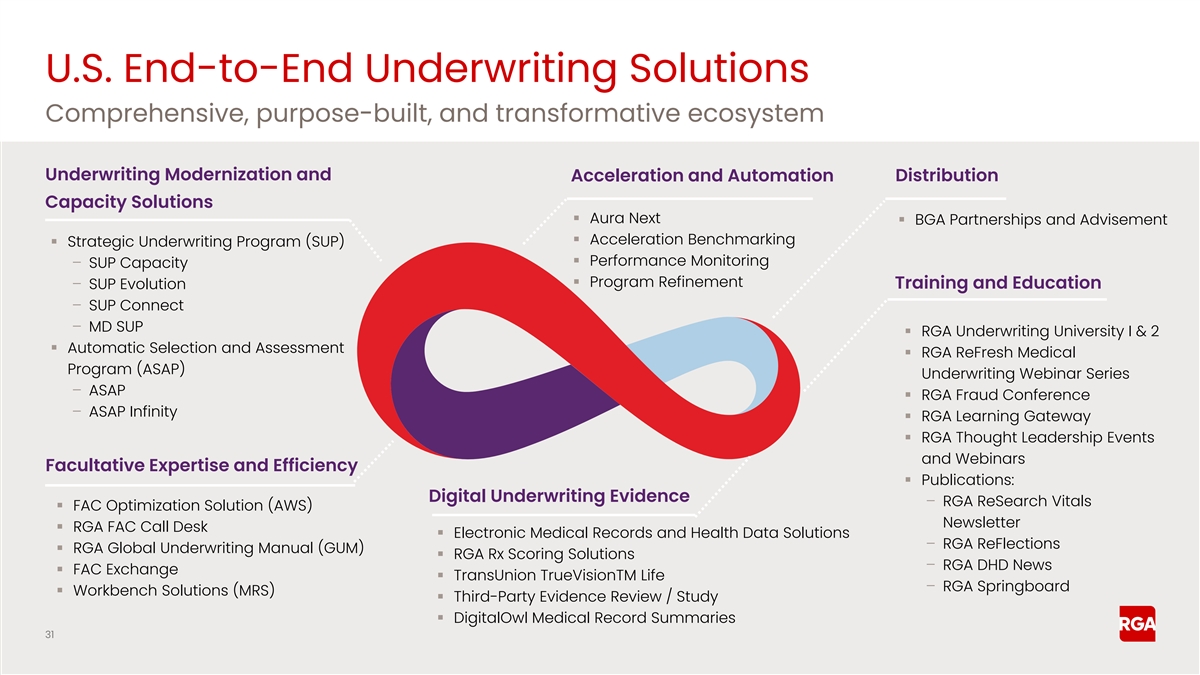
U.S. End-to-End Underwriting Solutions Comprehensive, purpose-built,
and transformative ecosystem Underwriting Modernization and Acceleration and Automation Distribution Capacity Solutions ▪ Aura Next ▪ BGA Partnerships and Advisement ▪ Acceleration Benchmarking ▪ Strategic Underwriting
Program (SUP) ▪ Performance Monitoring – SUP Capacity ▪ Program Refinement – SUP Evolution Training and Education – SUP Connect – MD SUP ▪ RGA Underwriting University I & 2 ▪ Automatic Selection
and Assessment ▪ RGA ReFresh Medical Program (ASAP) Underwriting Webinar Series – ASAP ▪ RGA Fraud Conference – ASAP Infinity ▪ RGA Learning Gateway ▪ RGA Thought Leadership Events and Webinars Facultative
Expertise and Efficiency ▪ Publications: Digital Underwriting Evidence – RGA ReSearch Vitals ▪ FAC Optimization Solution (AWS) Newsletter ▪ RGA FAC Call Desk ▪ Electronic Medical Records and Health Data Solutions
– RGA ReFlections ▪ RGA Global Underwriting Manual (GUM) ▪ RGA Rx Scoring Solutions – RGA DHD News ▪ FAC Exchange ▪ TransUnion TrueVisionTM Life – RGA Springboard ▪ Workbench Solutions (MRS) ▪
Third-Party Evidence Review / Study ▪ DigitalOwl Medical Record Summaries 31
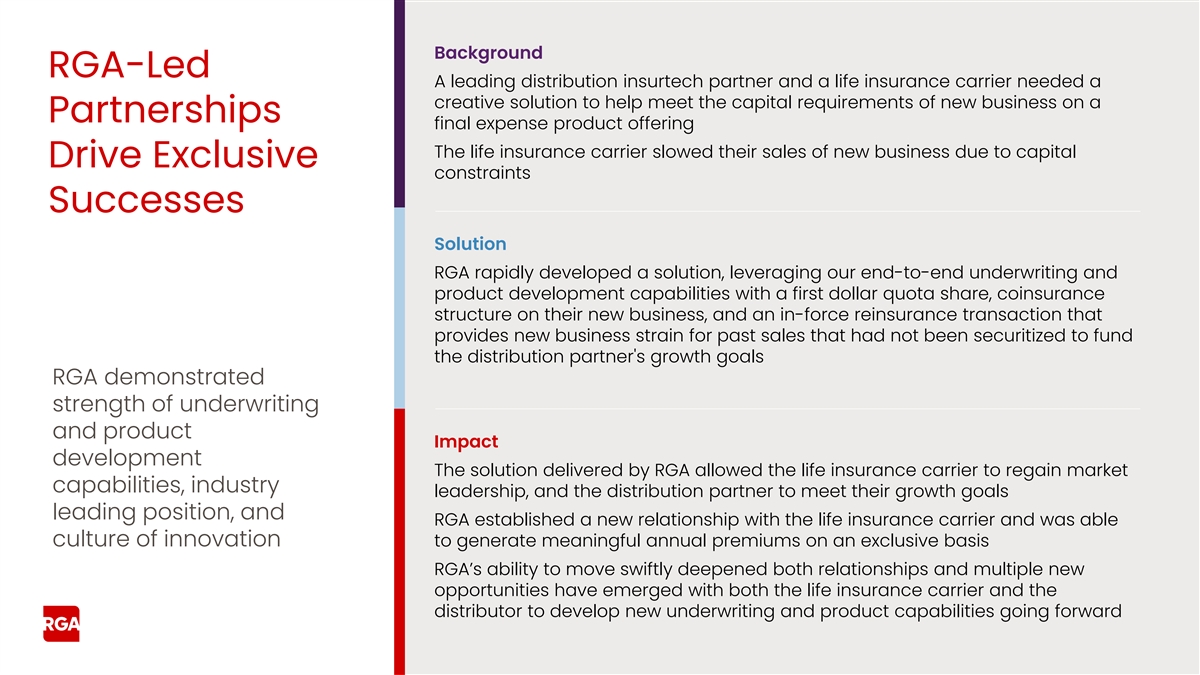
Background RGA-Led A leading distribution insurtech partner and a life
insurance carrier needed a creative solution to help meet the capital requirements of new business on a Partnerships final expense product offering The life insurance carrier slowed their sales of new business due to capital Drive Exclusive
constraints Successes Solution RGA rapidly developed a solution, leveraging our end-to-end underwriting and product development capabilities with a first dollar quota share, coinsurance structure on their new business, and an in-force reinsurance
transaction that provides new business strain for past sales that had not been securitized to fund the distribution partner's growth goals RGA demonstrated strength of underwriting and product Impact development The solution delivered by RGA allowed
the life insurance carrier to regain market capabilities, industry leadership, and the distribution partner to meet their growth goals leading position, and RGA established a new relationship with the life insurance carrier and was able culture of
innovation to generate meaningful annual premiums on an exclusive basis RGA’s ability to move swiftly deepened both relationships and multiple new opportunities have emerged with both the life insurance carrier and the distributor to develop
new underwriting and product capabilities going forward
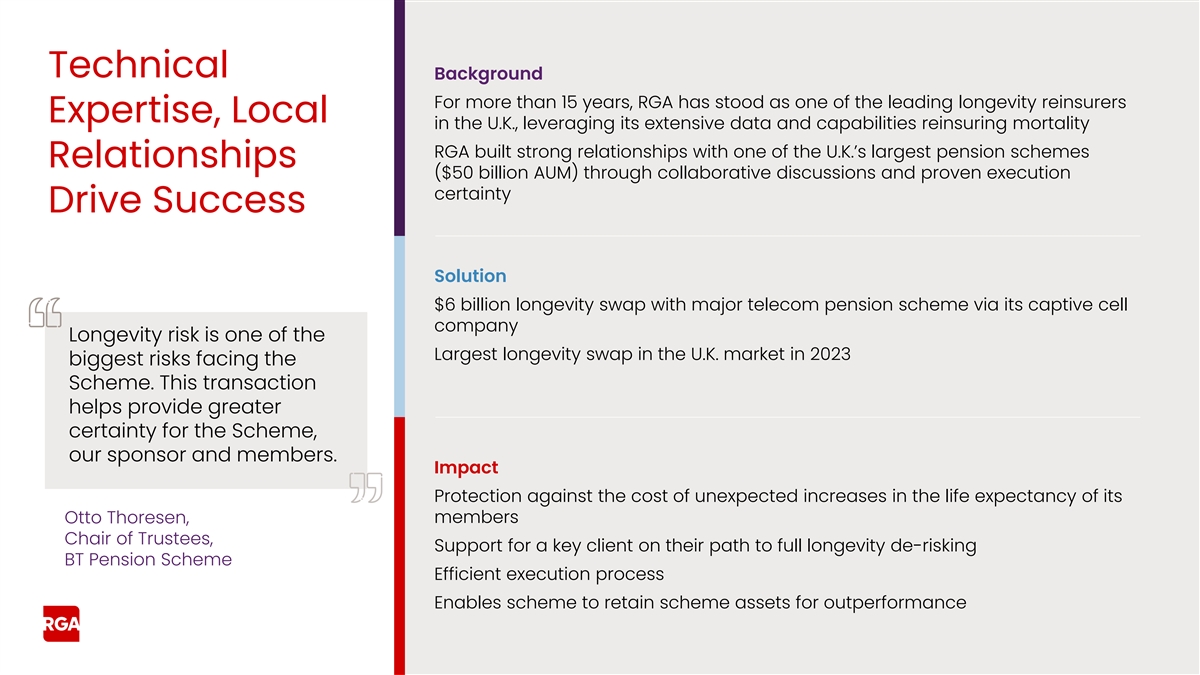
Technical Background For more than 15 years, RGA has stood as one of
the leading longevity reinsurers Expertise, Local in the U.K., leveraging its extensive data and capabilities reinsuring mortality RGA built strong relationships with one of the U.K.’s largest pension schemes Relationships ($50 billion AUM)
through collaborative discussions and proven execution certainty Drive Success Solution $6 billion longevity swap with major telecom pension scheme via its captive cell company Longevity risk is one of the Largest longevity swap in the U.K. market
in 2023 biggest risks facing the Scheme. This transaction helps provide greater certainty for the Scheme, our sponsor and members. Impact Protection against the cost of unexpected increases in the life expectancy of its Otto Thoresen, members Chair
of Trustees, Support for a key client on their path to full longevity de-risking BT Pension Scheme Efficient execution process Enables scheme to retain scheme assets for outperformance
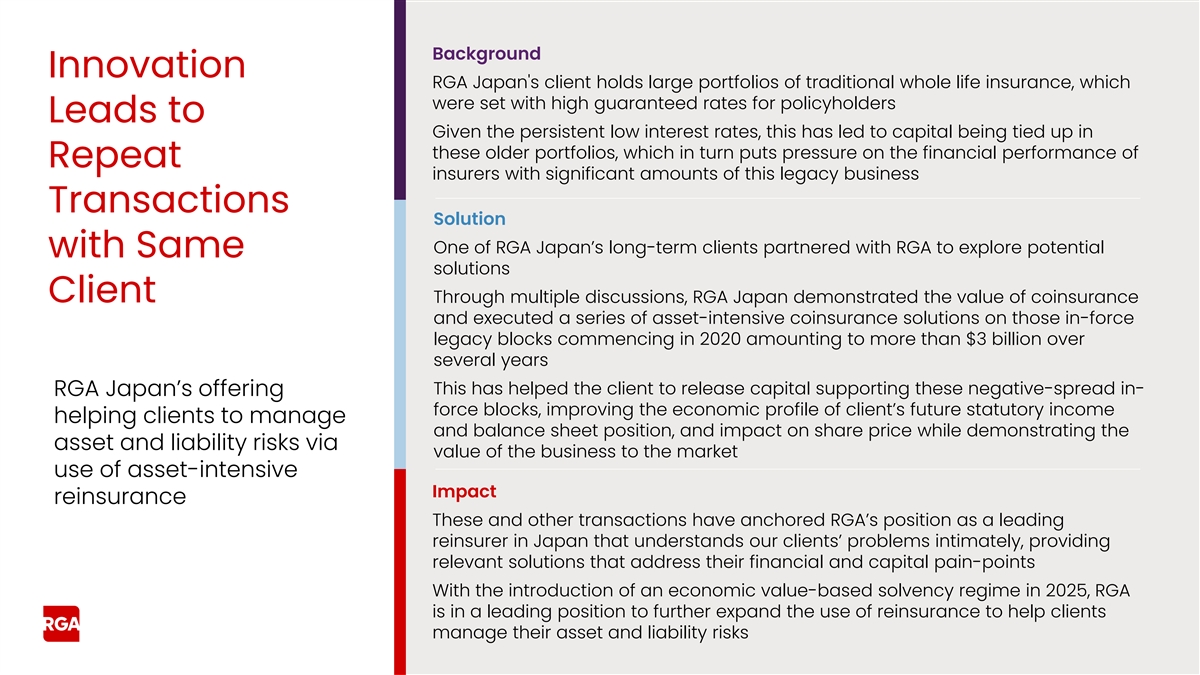
Background Innovation RGA Japan's client holds large portfolios of
traditional whole life insurance, which were set with high guaranteed rates for policyholders Leads to Given the persistent low interest rates, this has led to capital being tied up in these older portfolios, which in turn puts pressure on the
financial performance of Repeat insurers with significant amounts of this legacy business Transactions Solution One of RGA Japan’s long-term clients partnered with RGA to explore potential with Same solutions Client Through multiple
discussions, RGA Japan demonstrated the value of coinsurance and executed a series of asset-intensive coinsurance solutions on those in-force legacy blocks commencing in 2020 amounting to more than $3 billion over several years This has helped the
client to release capital supporting these negative-spread in- RGA Japan’s offering force blocks, improving the economic profile of client’s future statutory income helping clients to manage and balance sheet position, and impact on
share price while demonstrating the asset and liability risks via value of the business to the market use of asset-intensive Impact reinsurance These and other transactions have anchored RGA’s position as a leading reinsurer in Japan that
understands our clients’ problems intimately, providing relevant solutions that address their financial and capital pain-points With the introduction of an economic value-based solvency regime in 2025, RGA is in a leading position to further
expand the use of reinsurance to help clients manage their asset and liability risks
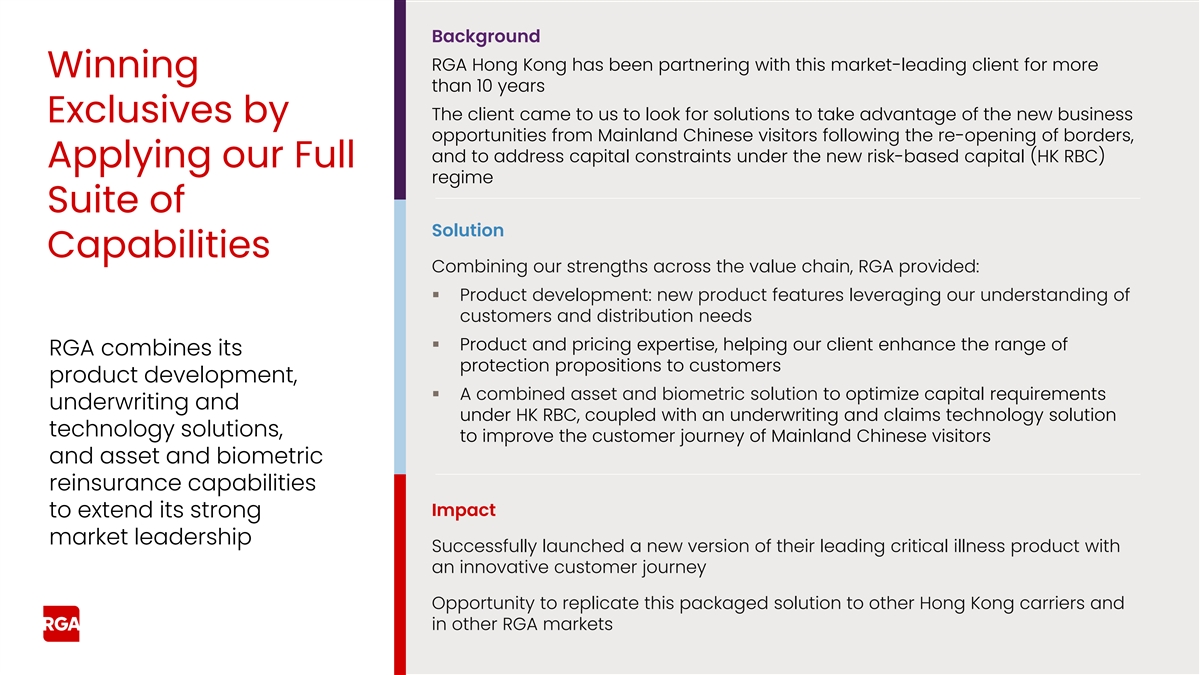
Background RGA Hong Kong has been partnering with this market-leading
client for more Winning than 10 years The client came to us to look for solutions to take advantage of the new business Exclusives by opportunities from Mainland Chinese visitors following the re-opening of borders, and to address capital
constraints under the new risk-based capital (HK RBC) Applying our Full regime Suite of Solution Capabilities Combining our strengths across the value chain, RGA provided: ▪ Product development: new product features leveraging our
understanding of customers and distribution needs ▪ Product and pricing expertise, helping our client enhance the range of RGA combines its protection propositions to customers product development, ▪ A combined asset and biometric
solution to optimize capital requirements underwriting and under HK RBC, coupled with an underwriting and claims technology solution technology solutions, to improve the customer journey of Mainland Chinese visitors and asset and biometric
reinsurance capabilities Impact to extend its strong market leadership Successfully launched a new version of their leading critical illness product with an innovative customer journey Opportunity to replicate this packaged solution to other Hong
Kong carriers and in other RGA markets
Management Actions, Enhancing Value ▪ Partnership and holistic
management of in-force blocks Creating value through optimizing ▪ Continued pursuit of alternative sources of capital our balance sheet ▪ Prioritization of key resources (people, capital, and resource collateral, etc.) to highest
returning businesses allocation ▪ Opportunistic reinvestment to enhance yield, extend duration, and optimize investment portfolio ▪ Opportunities for additional fee income 36
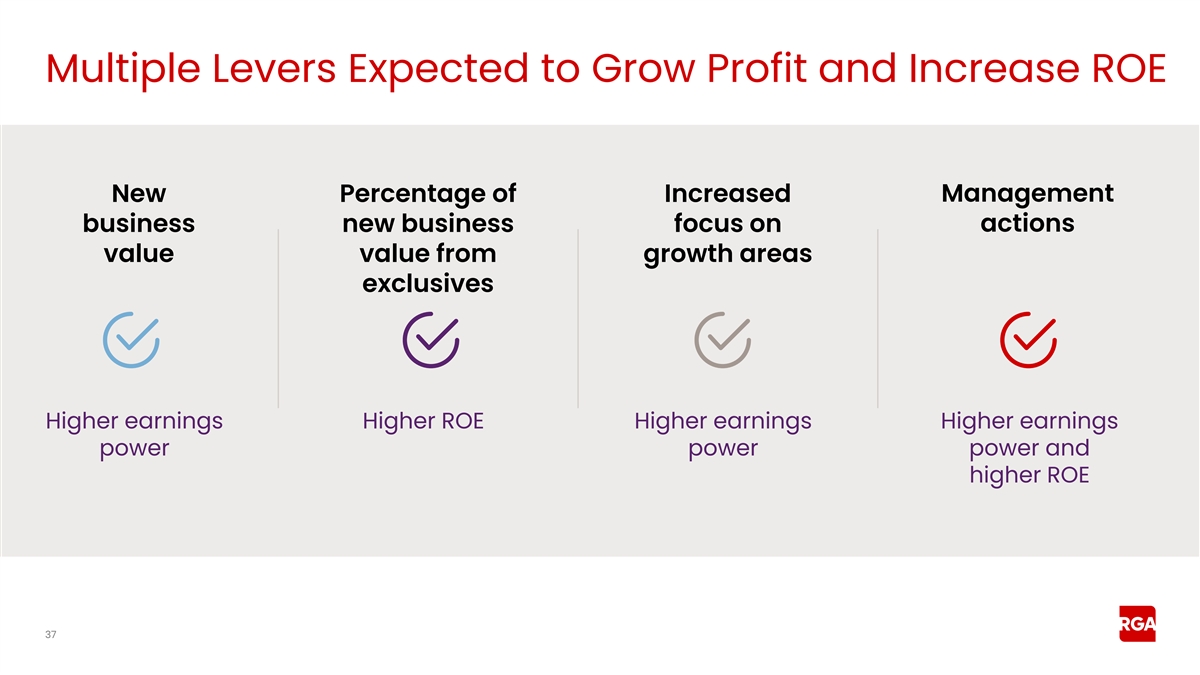
Multiple Levers Expected to Grow Profit and Increase ROE New Percentage
of Increased Management business new business focus on actions value value from growth areas exclusives Higher earnings Higher ROE Higher earnings Higher earnings power power power and higher ROE 37
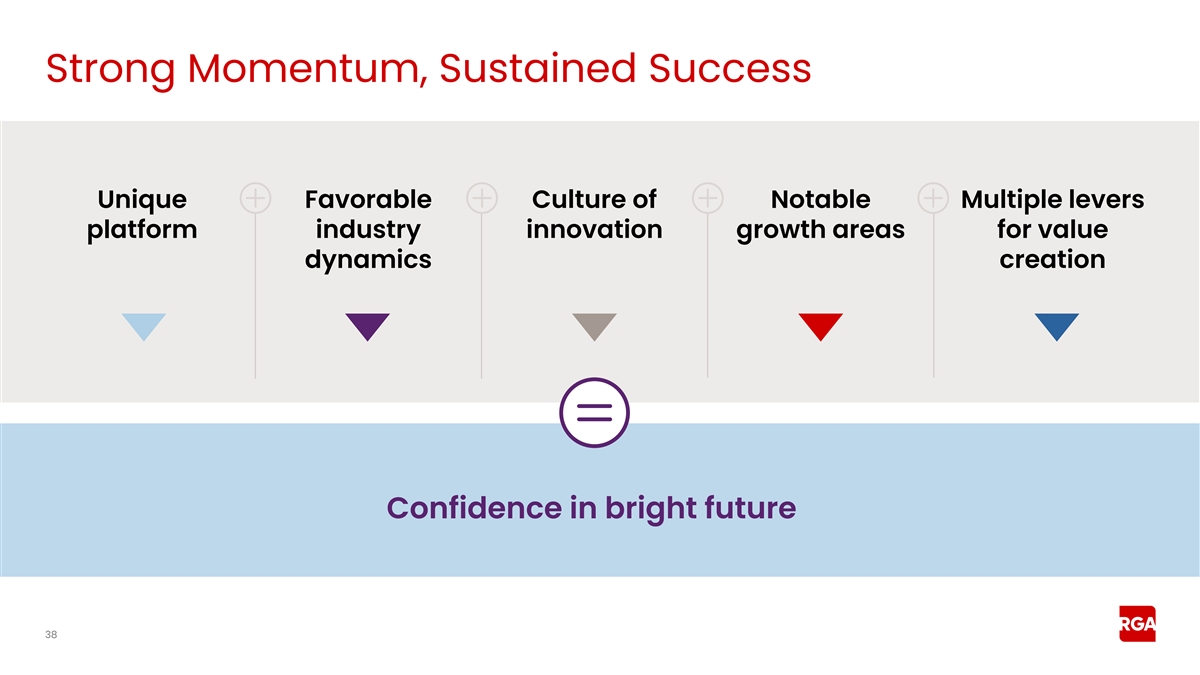
Strong Momentum, Sustained Success Unique Favorable Culture of Notable
Multiple levers platform industry innovation growth areas for value dynamics creation Confidence in bright future 38
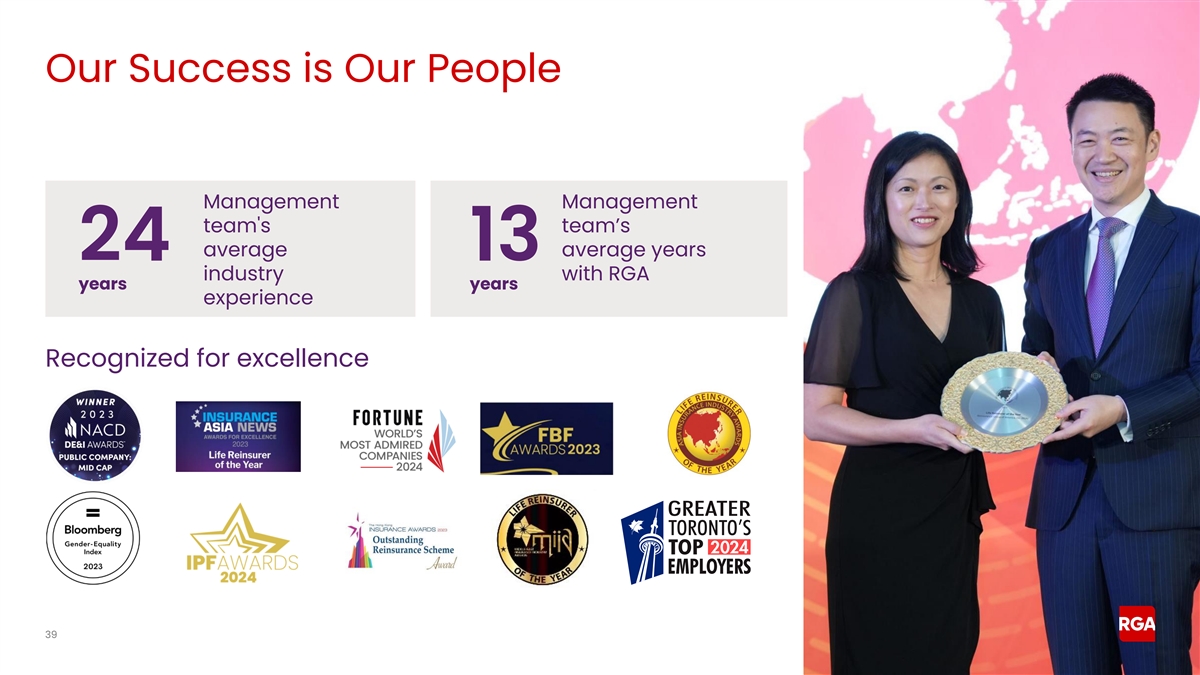
Our Success is Our People Management Management team's team’s
average average years 24 13 industry with RGA years years experience Recognized for excellence 39
Risk Management Jonathan Porter Executive Vice President, Global Chief
Risk Officer 40
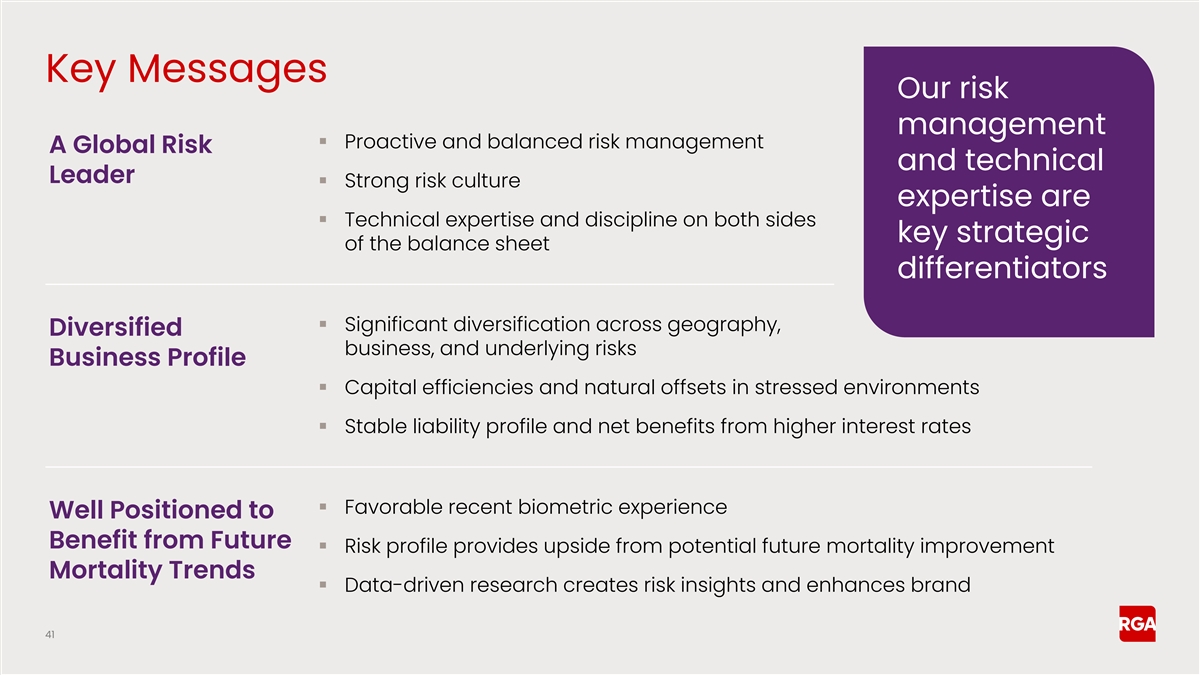
Key Messages Our risk management ▪ Proactive and balanced risk
management A Global Risk and technical Leader ▪ Strong risk culture expertise are ▪ Technical expertise and discipline on both sides key strategic of the balance sheet differentiators ▪ Significant diversification across geography,
Diversified business, and underlying risks Business Profile ▪ Capital efficiencies and natural offsets in stressed environments ▪ Stable liability profile and net benefits from higher interest rates ▪ Favorable recent biometric
experience Well Positioned to Benefit from Future ▪ Risk profile provides upside from potential future mortality improvement Mortality Trends ▪ Data-driven research creates risk insights and enhances brand 41
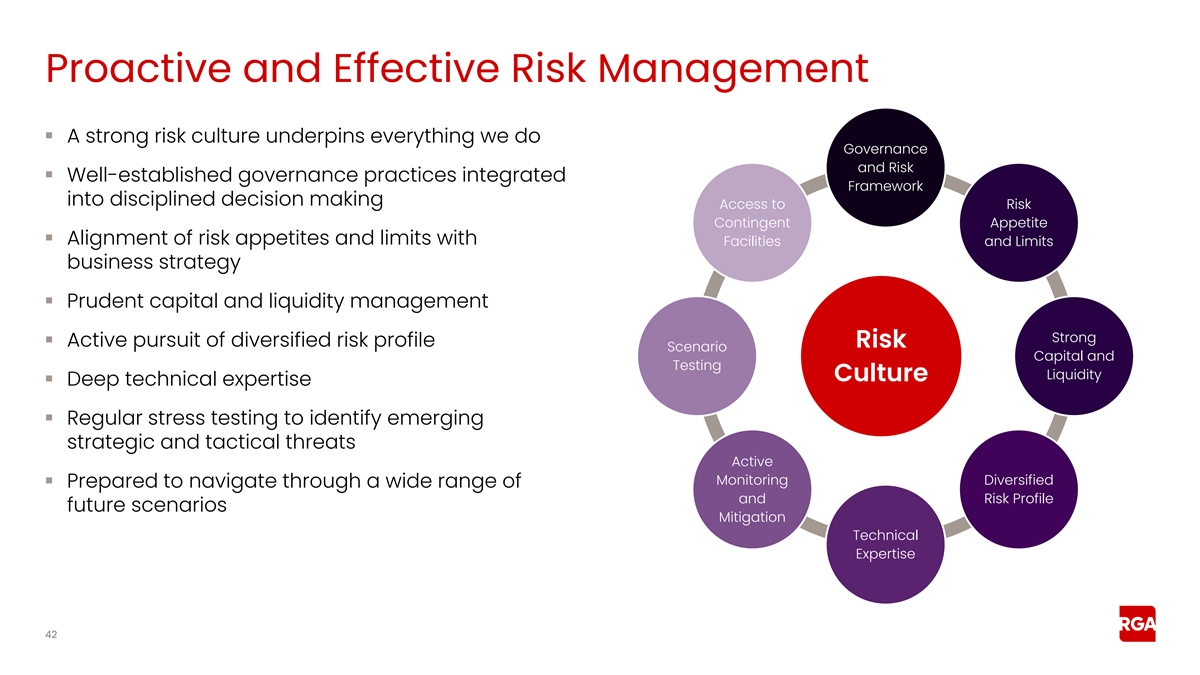
Proactive and Effective Risk Management ▪ A strong risk culture
underpins everything we do Governance and Risk ▪ Well-established governance practices integrated Framework into disciplined decision making Access to Risk Contingent Appetite ▪ Alignment of risk appetites and limits with Facilities and
Limits business strategy ▪ Prudent capital and liquidity management Strong ▪ Active pursuit of diversified risk profile Risk Scenario Capital and Testing Liquidity Culture ▪ Deep technical expertise ▪ Regular stress testing
to identify emerging strategic and tactical threats Active Monitoring Diversified ▪ Prepared to navigate through a wide range of and Risk Profile future scenarios Mitigation Technical Expertise 42
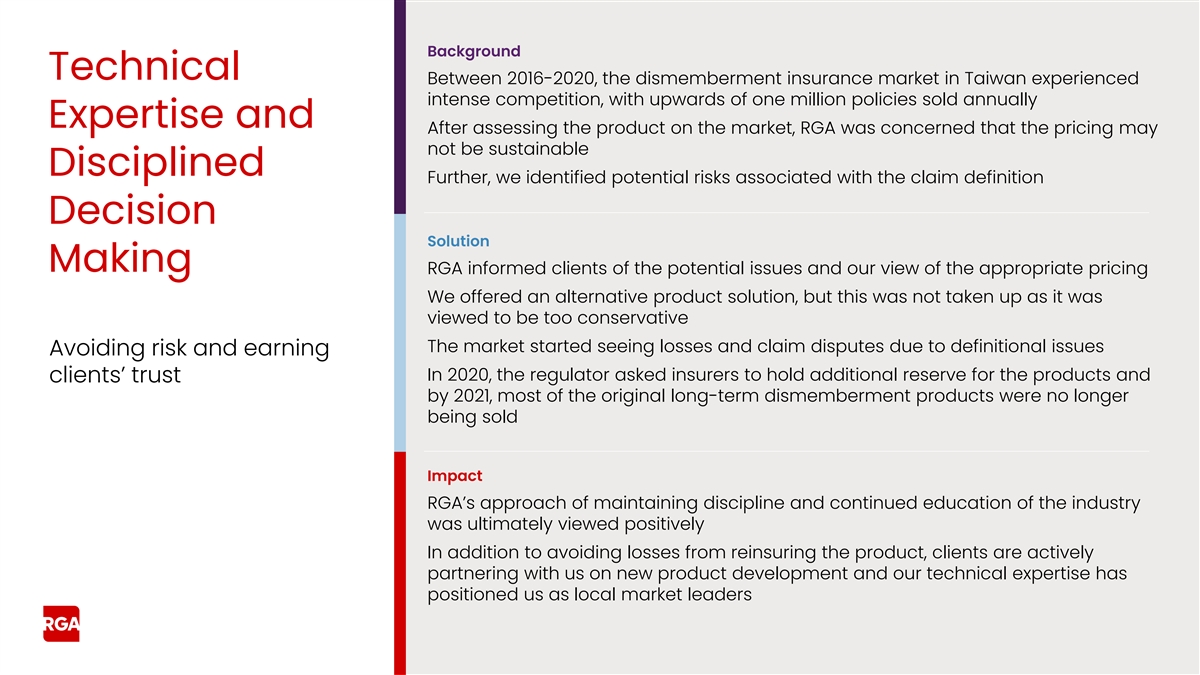
Background Technical Between 2016-2020, the dismemberment insurance
market in Taiwan experienced intense competition, with upwards of one million policies sold annually Expertise and After assessing the product on the market, RGA was concerned that the pricing may not be sustainable Disciplined Further, we
identified potential risks associated with the claim definition Decision Solution Making RGA informed clients of the potential issues and our view of the appropriate pricing We offered an alternative product solution, but this was not taken up as it
was viewed to be too conservative The market started seeing losses and claim disputes due to definitional issues Avoiding risk and earning In 2020, the regulator asked insurers to hold additional reserve for the products and clients’ trust by
2021, most of the original long-term dismemberment products were no longer being sold Impact RGA’s approach of maintaining discipline and continued education of the industry was ultimately viewed positively In addition to avoiding losses from
reinsuring the product, clients are actively partnering with us on new product development and our technical expertise has positioned us as local market leaders
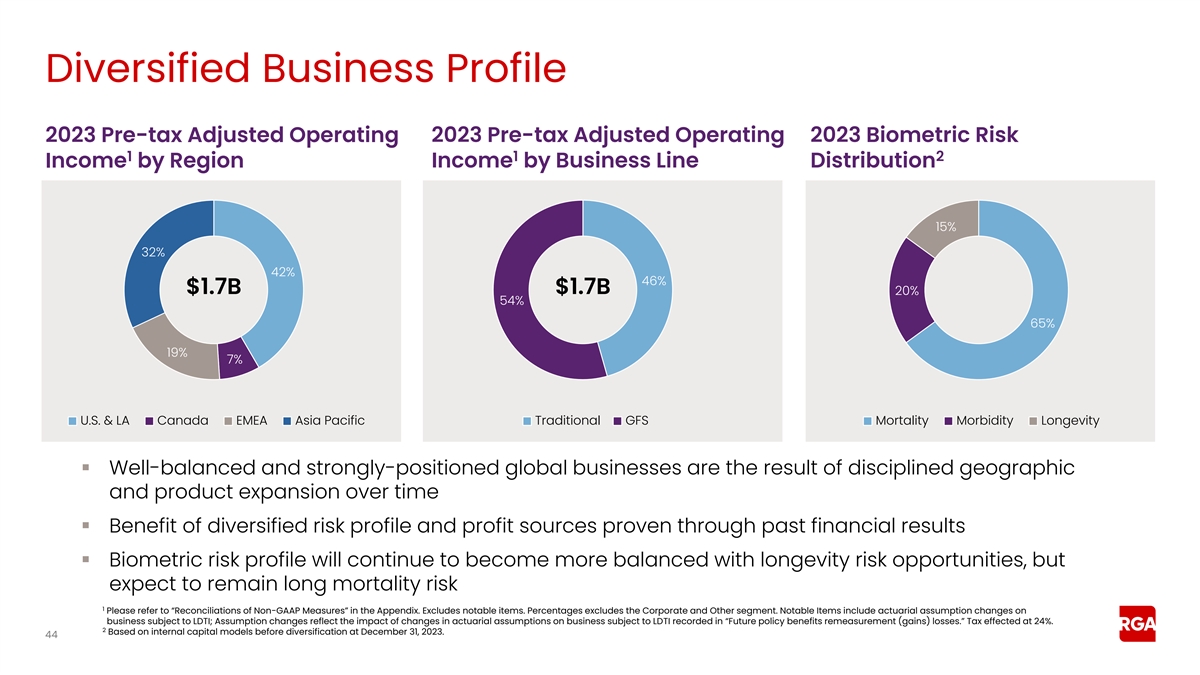
Diversified Business Profile 2023 Pre-tax Adjusted Operating 2023
Pre-tax Adjusted Operating 2023 Biometric Risk 1 1 2 Income by Region Income by Business Line Distribution 15% 32% 42% 46% $1.7B $1.7B 20% 54% 65% 19% 7% U.S. & LA Canada EMEA Asia Pacific Traditional GFS Mortality Morbidity Longevity ▪
Well-balanced and strongly-positioned global businesses are the result of disciplined geographic and product expansion over time ▪ Benefit of diversified risk profile and profit sources proven through past financial results ▪ Biometric
risk profile will continue to become more balanced with longevity risk opportunities, but expect to remain long mortality risk 1 Please refer to “Reconciliations of Non-GAAP Measures” in the Appendix. Excludes notable items. Percentages
excludes the Corporate and Other segment. Notable Items include actuarial assumption changes on business subject to LDTI; Assumption changes reflect the impact of changes in actuarial assumptions on business subject to LDTI recorded in “Future
policy benefits remeasurement (gains) losses.” Tax effected at 24%. 2 Based on internal capital models before diversification at December 31, 2023. 44
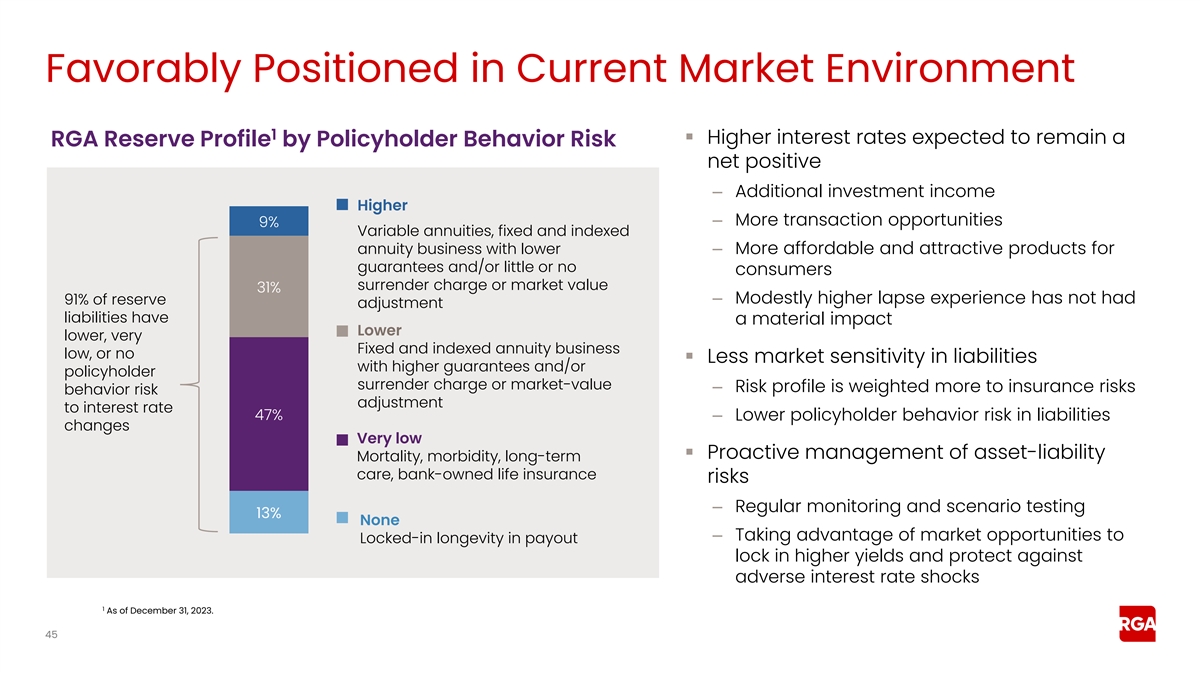
Favorably Positioned in Current Market Environment 1 ▪ Higher
interest rates expected to remain a RGA Reserve Profile by Policyholder Behavior Risk net positive – Additional investment income Higher – More transaction opportunities 9% Variable annuities, fixed and indexed annuity business with
lower – More affordable and attractive products for guarantees and/or little or no consumers surrender charge or market value 31% – Modestly higher lapse experience has not had 91% of reserve adjustment liabilities have a material impact
Lower lower, very Fixed and indexed annuity business low, or no ▪ Less market sensitivity in liabilities with higher guarantees and/or policyholder surrender charge or market-value – Risk profile is weighted more to insurance risks
behavior risk adjustment to interest rate 47% – Lower policyholder behavior risk in liabilities changes Very low ▪ Proactive management of asset-liability Mortality, morbidity, long-term care, bank-owned life insurance risks –
Regular monitoring and scenario testing 13% None – Taking advantage of market opportunities to Locked-in longevity in payout lock in higher yields and protect against adverse interest rate shocks 1 As of December 31, 2023. 45
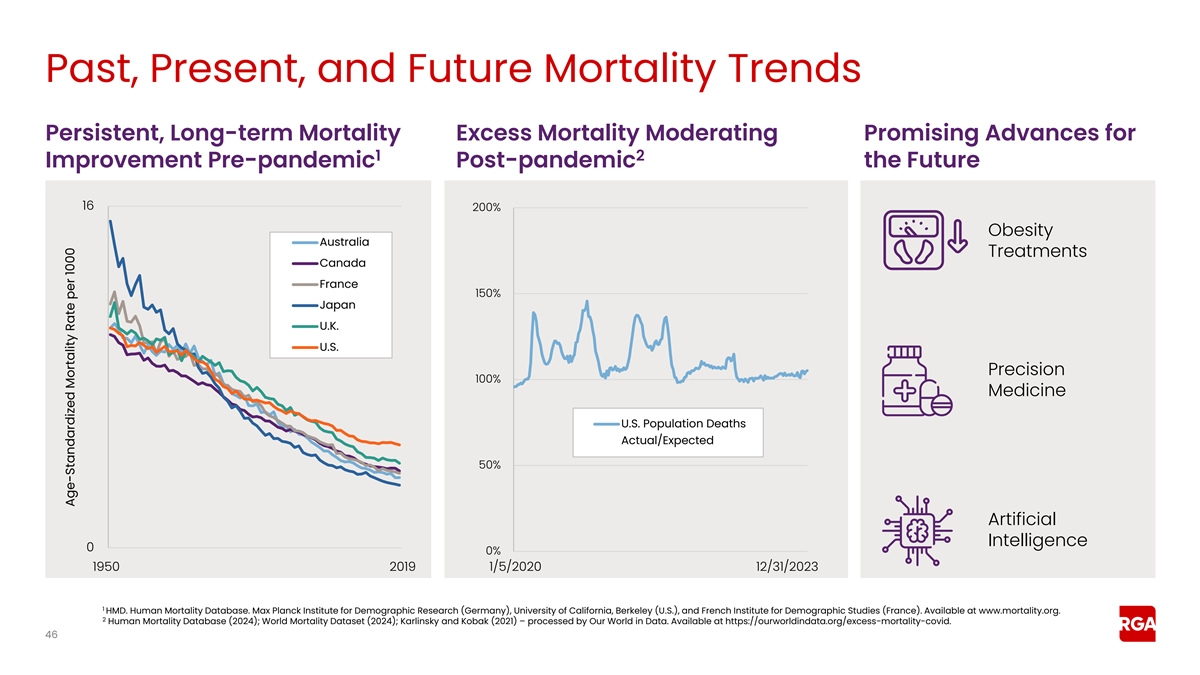
Past, Present, and Future Mortality Trends Persistent, Long-term
Mortality Excess Mortality Moderating Promising Advances for 1 2 Improvement Pre-pandemic Post-pandemic the Future 16 200% Obesity Australia Treatments Canada France 150% Japan U.K. U.S. Precision 100% Medicine U.S. Population Deaths Actual/Expected
50% Artificial Intelligence 0 0% 1950 2019 1/5/2020 12/31/2023 1 HMD. Human Mortality Database. Max Planck Institute for Demographic Research (Germany), University of California, Berkeley (U.S.), and French Institute for Demographic Studies
(France). Available at www.mortality.org. 2 Human Mortality Database (2024); World Mortality Dataset (2024); Karlinsky and Kobak (2021) – processed by Our World in Data. Available at https://ourworldindata.org/excess-mortality-covid. 46
Age-Standardized Mortality Rate per 1000
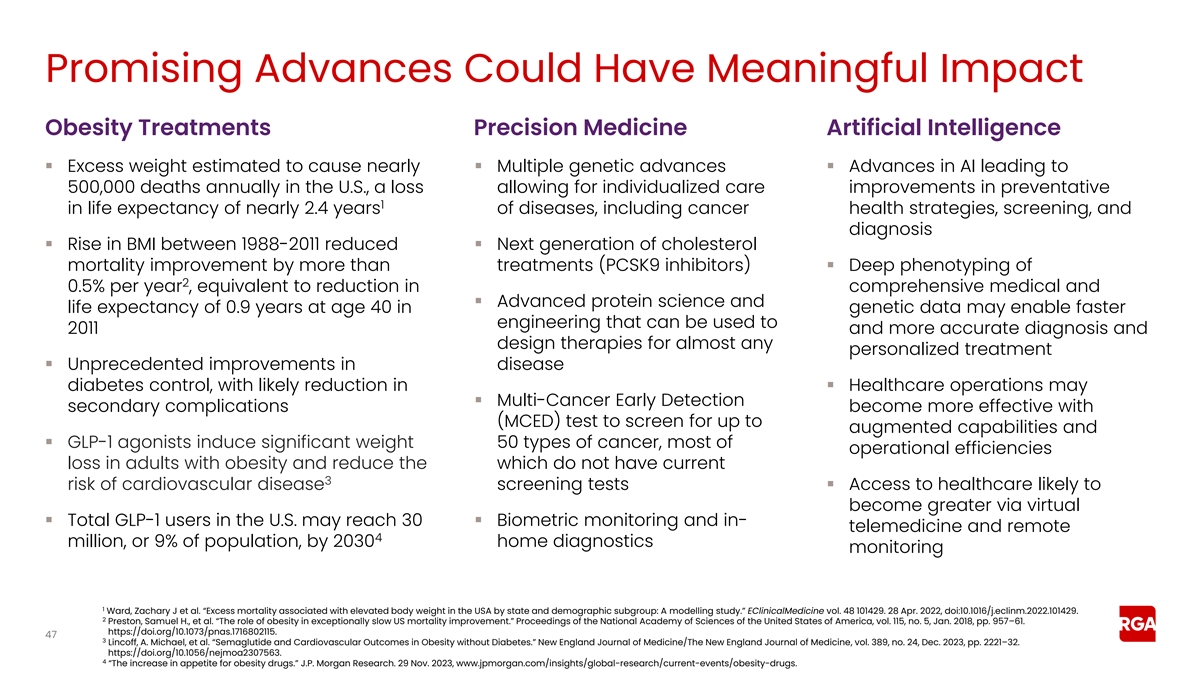
Promising Advances Could Have Meaningful Impact Obesity Treatments
Precision Medicine Artificial Intelligence ▪ Excess weight estimated to cause nearly ▪ Multiple genetic advances ▪ Advances in AI leading to 500,000 deaths annually in the U.S., a loss allowing for individualized care improvements
in preventative 1 in life expectancy of nearly 2.4 years of diseases, including cancer health strategies, screening, and diagnosis ▪ Rise in BMI between 1988-2011 reduced ▪ Next generation of cholesterol mortality improvement by more
than treatments (PCSK9 inhibitors)▪ Deep phenotyping of 2 0.5% per year , equivalent to reduction in comprehensive medical and ▪ Advanced protein science and life expectancy of 0.9 years at age 40 in genetic data may enable faster
engineering that can be used to 2011 and more accurate diagnosis and design therapies for almost any personalized treatment ▪ Unprecedented improvements in disease diabetes control, with likely reduction in ▪ Healthcare operations may
▪ Multi-Cancer Early Detection secondary complications become more effective with (MCED) test to screen for up to augmented capabilities and ▪ GLP-1 agonists induce significant weight 50 types of cancer, most of operational efficiencies
loss in adults with obesity and reduce the which do not have current 3 risk of cardiovascular disease screening tests▪ Access to healthcare likely to become greater via virtual ▪ Total GLP-1 users in the U.S. may reach 30 ▪
Biometric monitoring and in- telemedicine and remote 4 million, or 9% of population, by 2030 home diagnostics monitoring 1 Ward, Zachary J et al. “Excess mortality associated with elevated body weight in the USA by state and demographic
subgroup: A modelling study.” EClinicalMedicine vol. 48 101429. 28 Apr. 2022, doi:10.1016/j.eclinm.2022.101429. 2 Preston, Samuel H., et al. “The role of obesity in exceptionally slow US mortality improvement.” Proceedings of the
National Academy of Sciences of the United States of America, vol. 115, no. 5, Jan. 2018, pp. 957–61. https://doi.org/10.1073/pnas.1716802115. 47 3 Lincoff, A. Michael, et al. “Semaglutide and Cardiovascular Outcomes in Obesity without
Diabetes.” New England Journal of Medicine/The New England Journal of Medicine, vol. 389, no. 24, Dec. 2023, pp. 2221–32. https://doi.org/10.1056/nejmoa2307563. 4 “The increase in appetite for obesity drugs.” J.P. Morgan
Research. 29 Nov. 2023, www.jpmorgan.com/insights/global-research/current-events/obesity-drugs.
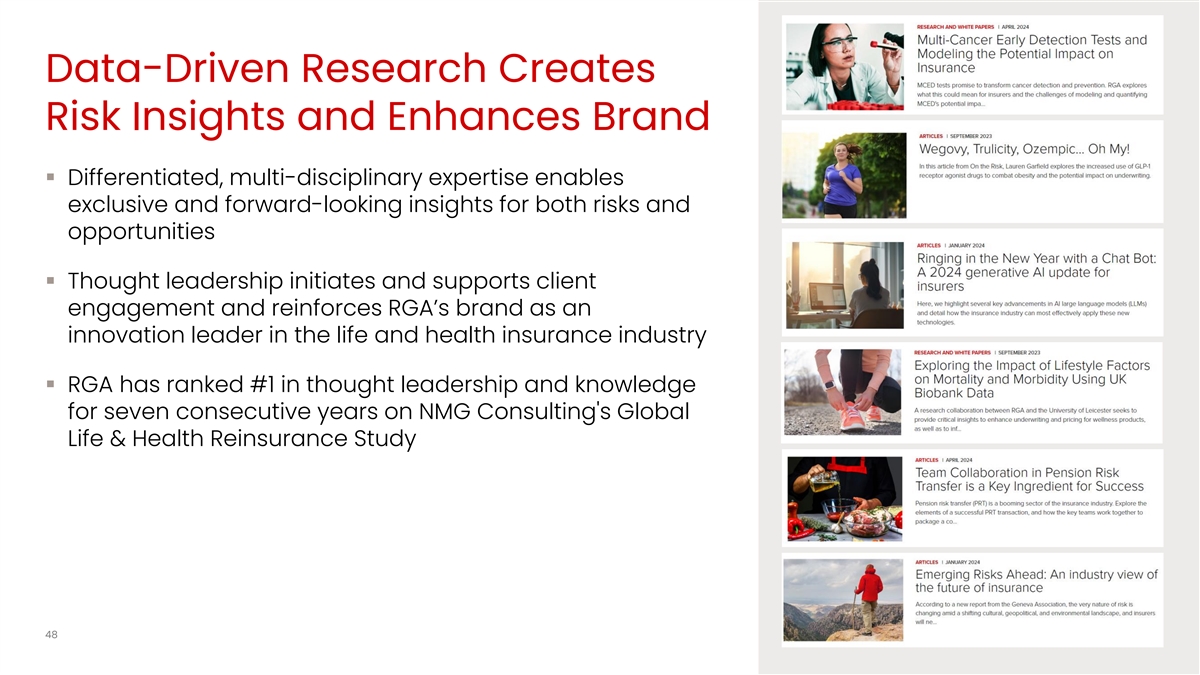
Data-Driven Research Creates Risk Insights and Enhances Brand ▪
Differentiated, multi-disciplinary expertise enables exclusive and forward-looking insights for both risks and opportunities ▪ Thought leadership initiates and supports client engagement and reinforces RGA’s brand as an innovation leader
in the life and health insurance industry ▪ RGA has ranked #1 in thought leadership and knowledge for seven consecutive years on NMG Consulting's Global Life & Health Reinsurance Study 48
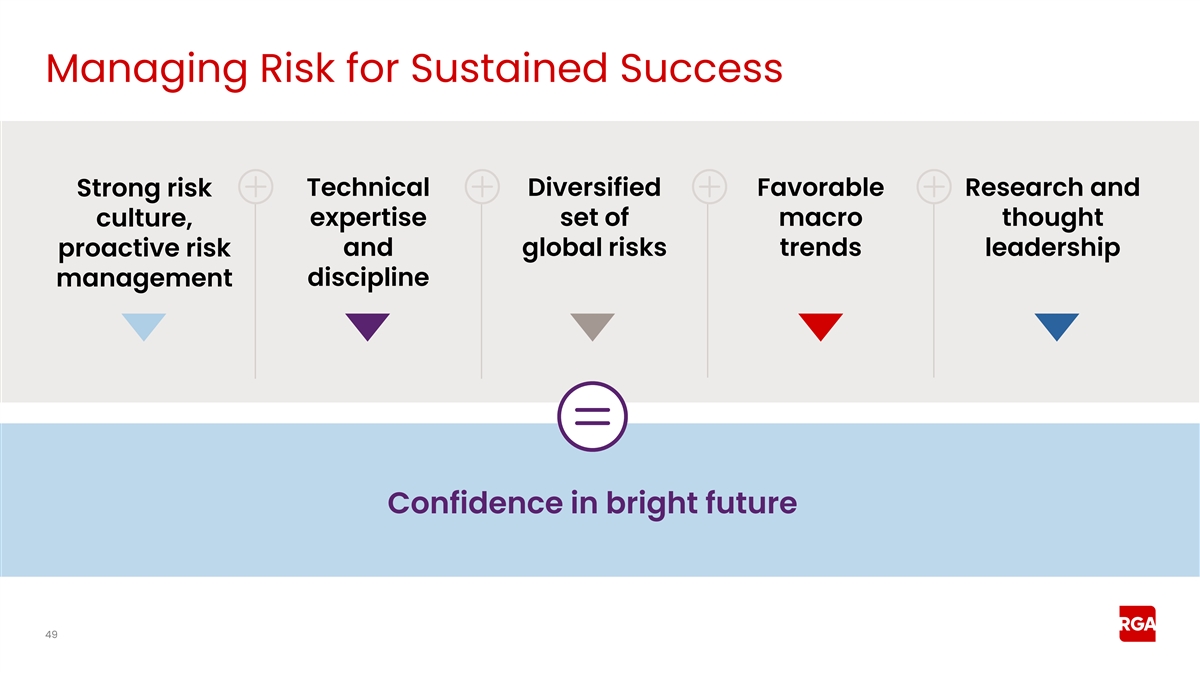
Managing Risk for Sustained Success Strong risk Technical Diversified
Favorable Research and culture, expertise set of macro thought proactive risk and global risks trends leadership management discipline Confidence in bright future 49

Investments Leslie Barbi Executive Vice President, Chief Investment
Officer 50
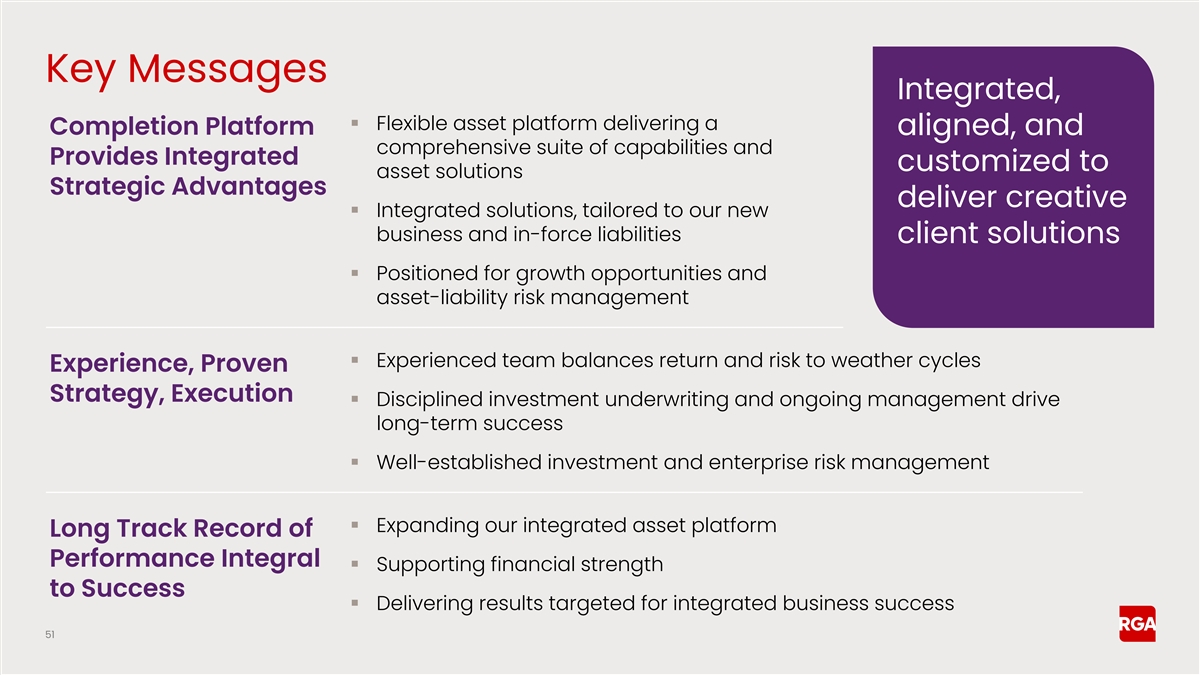
Key Messages Integrated, ▪ Flexible asset platform delivering a
Completion Platform aligned, and comprehensive suite of capabilities and Provides Integrated customized to asset solutions Strategic Advantages deliver creative ▪ Integrated solutions, tailored to our new business and in-force liabilities
client solutions ▪ Positioned for growth opportunities and asset-liability risk management ▪ Experienced team balances return and risk to weather cycles Experience, Proven Strategy, Execution ▪ Disciplined investment underwriting
and ongoing management drive long-term success ▪ Well-established investment and enterprise risk management ▪ Expanding our integrated asset platform Long Track Record of Performance Integral ▪ Supporting financial strength to
Success ▪ Delivering results targeted for integrated business success 51
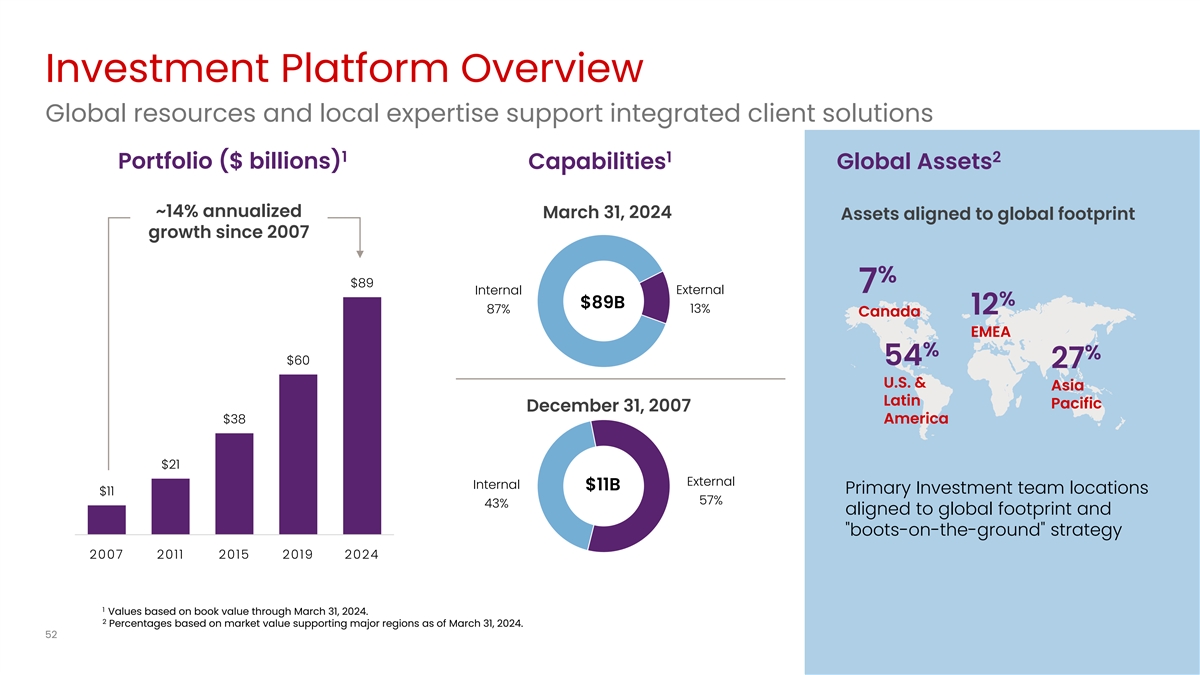
Investment Platform Overview Global resources and local expertise
support integrated client solutions 1 1 2 Portfolio ($ billions) Capabilities Global Assets ~14% annualized March 31, 2024 Assets aligned to global footprint growth since 2007 % $89 External 7 Internal % $89B 13% 87% 12 Canada EMEA % % $60 54 27
U.S. & Asia Latin Pacific December 31, 2007 $38 America $21 External Internal $11B Primary Investment team locations $11 57% 43% aligned to global footprint and boots-on-the-ground strategy 2007 2011 2015 2019 2024 1 Values based on book value
through March 31, 2024. 2 Percentages based on market value supporting major regions as of March 31, 2024. 52
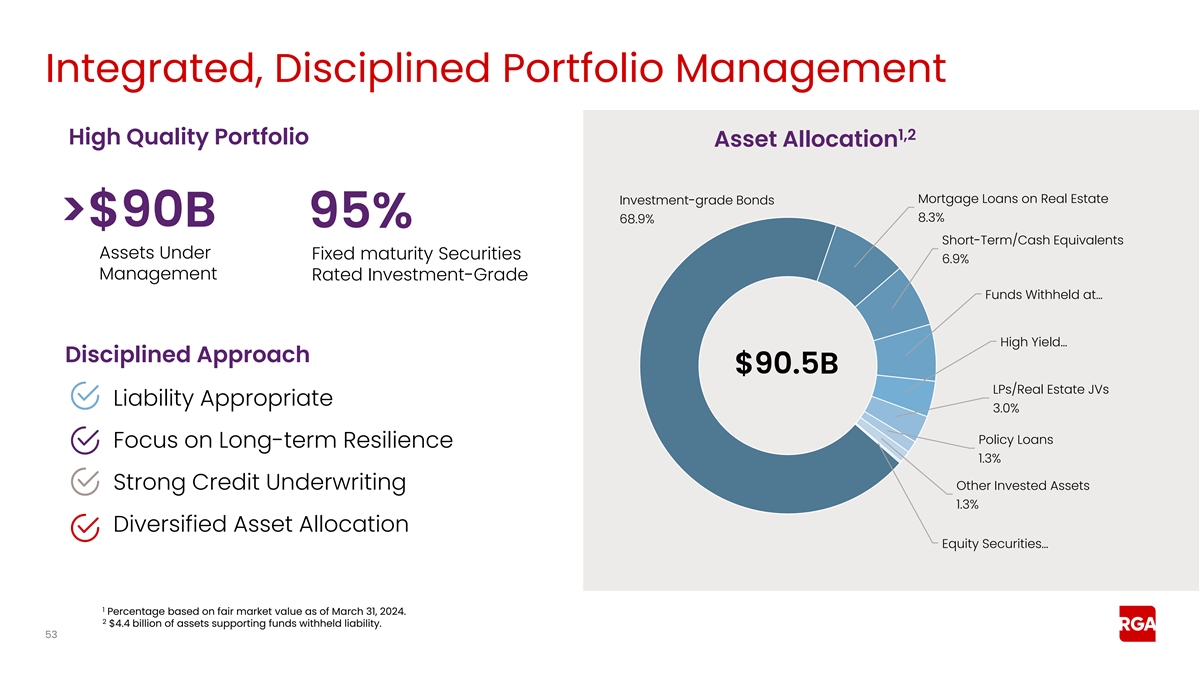
Integrated, Disciplined Portfolio Management 1,2 High Quality Portfolio
Asset Allocation Mortgage Loans on Real Estate Investment-grade Bonds 8.3% 68.9% >$90B 95% Short-Term/Cash Equivalents Assets Under Fixed maturity Securities 6.9% Management Rated Investment-Grade Funds Withheld at … High Yield …
Disciplined Approach $90.5B LPs/Real Estate JVs Liability Appropriate 3.0% Policy Loans Focus on Long-term Resilience 1.3% Strong Credit Underwriting Other Invested Assets 1.3% Diversified Asset Allocation Equity Securities… 1 Percentage based
on fair market value as of March 31, 2024. 2 $4.4 billion of assets supporting funds withheld liability. 53
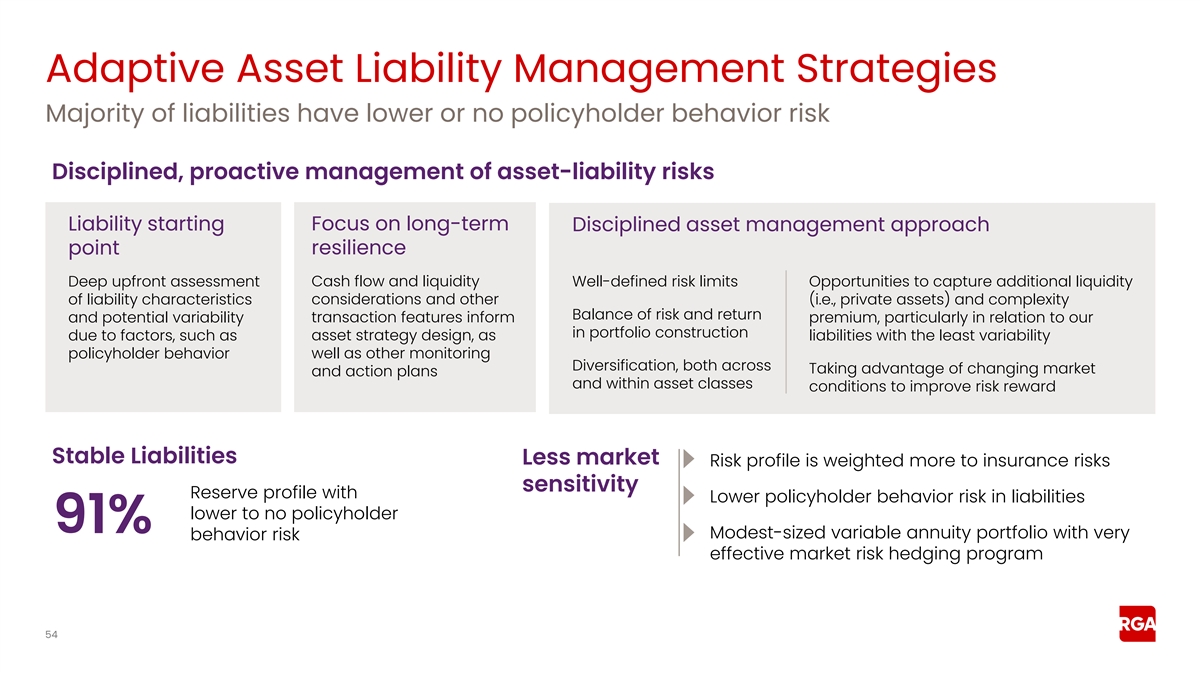
Adaptive Asset Liability Management Strategies Majority of liabilities
have lower or no policyholder behavior risk Disciplined, proactive management of asset-liability risks Focus on long-term Liability starting Disciplined asset management approach point resilience Deep upfront assessment Cash flow and liquidity
Well-defined risk limits Opportunities to capture additional liquidity of liability characteristics considerations and other (i.e., private assets) and complexity Balance of risk and return and potential variability transaction features inform
premium, particularly in relation to our in portfolio construction asset strategy design, as due to factors, such as liabilities with the least variability policyholder behavior well as other monitoring Diversification, both across Taking advantage
of changing market and action plans and within asset classes conditions to improve risk reward Stable Liabilities Less market Risk profile is weighted more to insurance risks sensitivity Reserve profile with Lower policyholder behavior risk in
liabilities lower to no policyholder 91% Modest-sized variable annuity portfolio with very behavior risk effective market risk hedging program 54
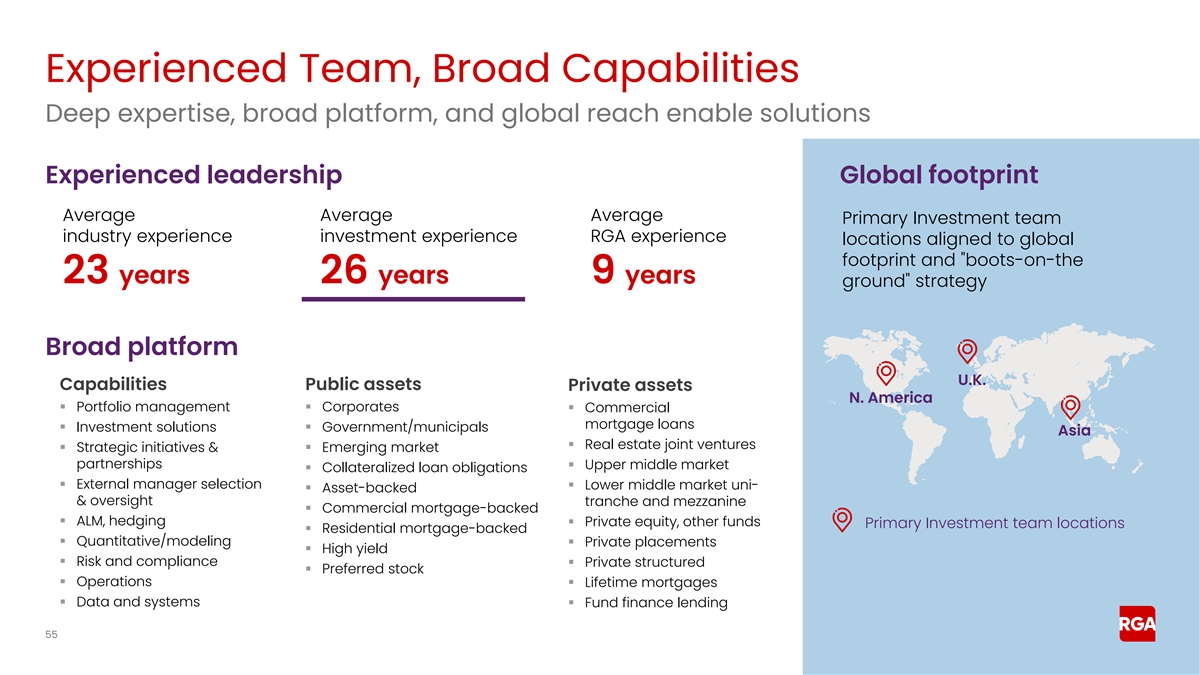
Experienced Team, Broad Capabilities Deep expertise, broad platform,
and global reach enable solutions Experienced leadership Global footprint Average Average Average Primary Investment team industry experience investment experience RGA experience locations aligned to global footprint and boots-on-the 23 years 26
years 9 years ground strategy Broad platform U.K. Capabilities Public assets Private assets N. America ▪ Portfolio management▪ Corporates ▪ Commercial mortgage loans ▪ Investment solutions▪ Government/municipals Asia
▪ Real estate joint ventures ▪ Strategic initiatives & ▪ Emerging market partnerships ▪ Upper middle market ▪ Collateralized loan obligations ▪ External manager selection ▪ Lower middle market uni-
▪ Asset-backed & oversight tranche and mezzanine ▪ Commercial mortgage-backed ▪ ALM, hedging▪ Private equity, other funds Primary Investment team locations ▪ Residential mortgage-backed ▪
Quantitative/modeling▪ Private placements ▪ High yield ▪ Risk and compliance ▪ Private structured ▪ Preferred stock ▪ Operations ▪ Lifetime mortgages ▪ Data and systems ▪ Fund finance lending
55
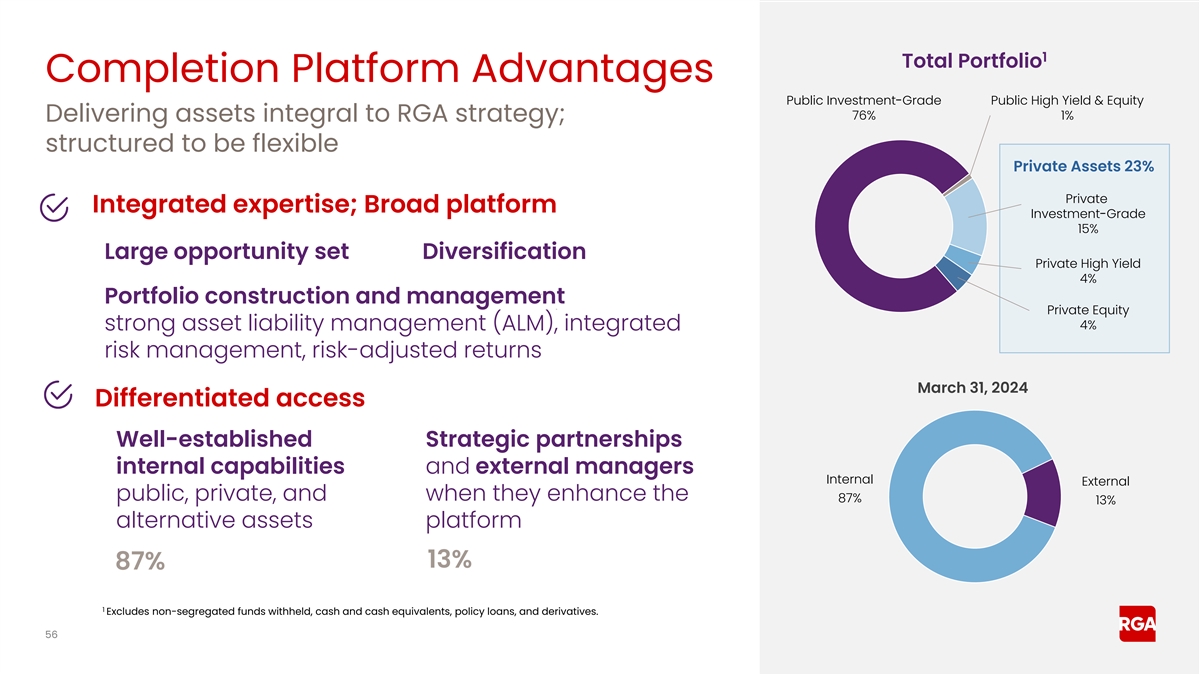
1 Total Portfolio Completion Platform Advantages Public
Investment-Grade Public High Yield & Equity 76% 1% Delivering assets integral to RGA strategy; structured to be flexible Private Assets 23% Private Integrated expertise; Broad platform Investment-Grade 15% Large opportunity set Diversification
Private High Yield 4% Portfolio construction and management Private Equity 4% strong asset liability management (ALM), integrated risk management, risk-adjusted returns March 31, 2024 Differentiated access Well-established Strategic partnerships
internal capabilities and external managers Internal External public, private, and when they enhance the 87% 13% alternative assets platform 13% 87% 1 Excludes non-segregated funds withheld, cash and cash equivalents, policy loans, and derivatives.
56
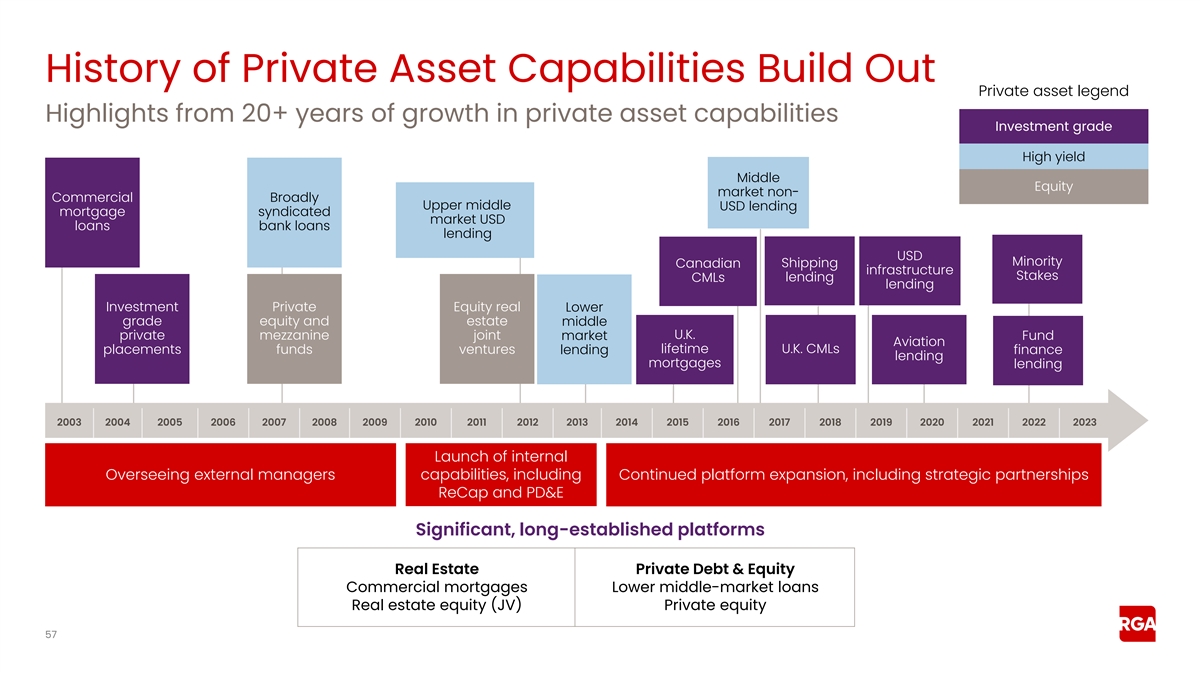
History of Private Asset Capabilities Build Out Private asset legend
Highlights from 20+ years of growth in private asset capabilities Investment grade High yield Middle Equity market non- Commercial Broadly Upper middle USD lending mortgage syndicated market USD loans bank loans lending USD Minority Canadian
Shipping infrastructure Stakes lending CMLs lending Investment Private Equity real Lower grade equity and estate middle U.K. private mezzanine joint market Fund Aviation placements funds ventures lending lifetime U.K. CMLs finance lending mortgages
lending 2003 2004 2005 2006 2007 2008 2009 2010 2011 2012 2013 2014 2015 2016 2017 2018 2019 2020 2021 2022 2023 Launch of internal Overseeing external managers capabilities, including Continued platform expansion, including strategic partnerships
ReCap and PD&E Significant, long-established platforms Real Estate Private Debt & Equity Commercial mortgages Lower middle-market loans Real estate equity (JV) Private equity 57
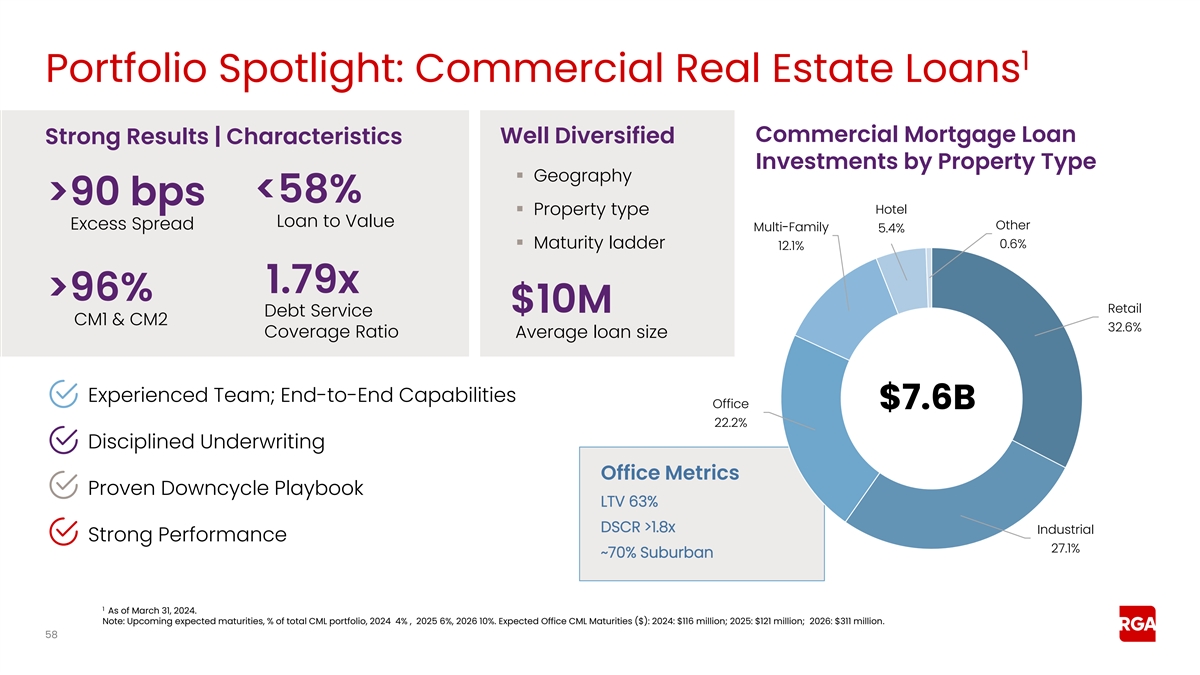
1 Portfolio Spotlight: Commercial Real Estate Loans Commercial Mortgage
Loan Strong Results | Characteristics Well Diversified Investments by Property Type ▪ Geography <58% >90 bps Hotel ▪ Property type Loan to Value Excess Spread Other Multi-Family 5.4% ▪ Maturity ladder 0.6% 12.1% 1.79x >96%
$10M Retail Debt Service CM1 & CM2 32.6% Coverage Ratio Average loan size Experienced Team; End-to-End Capabilities Office $7.6B 22.2% Disciplined Underwriting Office Metrics Proven Downcycle Playbook LTV 63% DSCR >1.8x Industrial Strong
Performance 27.1% ~70% Suburban 1 As of March 31, 2024. Note: Upcoming expected maturities, % of total CML portfolio, 2024 4% , 2025 6%, 2026 10%. Expected Office CML Maturities ($): 2024: $116 million; 2025: $121 million; 2026: $311 million.
58
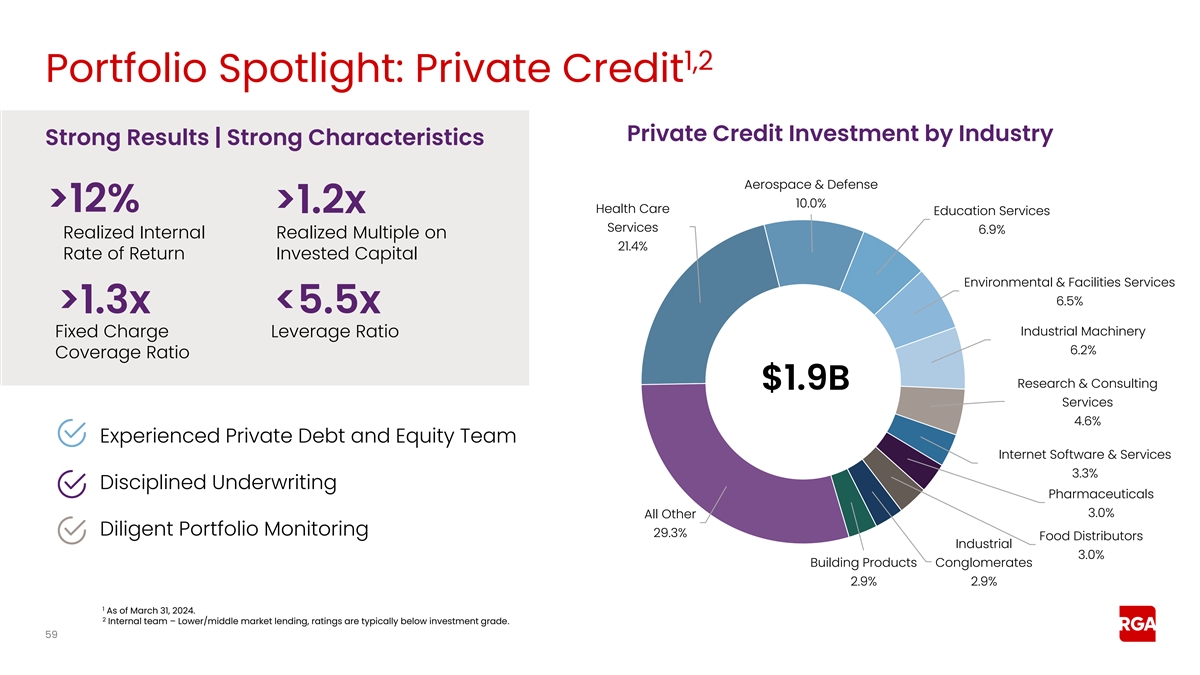
1,2 Portfolio Spotlight: Private Credit Private Credit Investment by
Industry Strong Results | Strong Characteristics Aerospace & Defense 10.0% >12% >1.2x Health Care Education Services Services 6.9% Realized Internal Realized Multiple on 21.4% Rate of Return Invested Capital Environmental & Facilities
Services 6.5% >1.3x <5.5x Industrial Machinery Fixed Charge Leverage Ratio 6.2% Coverage Ratio Research & Consulting $1.9B Services 4.6% Experienced Private Debt and Equity Team Internet Software & Services 3.3% Disciplined
Underwriting Pharmaceuticals 3.0% All Other Diligent Portfolio Monitoring 29.3% Food Distributors Industrial 3.0% Building Products Conglomerates 2.9% 2.9% 1 As of March 31, 2024. 2 Internal team – Lower/middle market lending, ratings are
typically below investment grade. 59
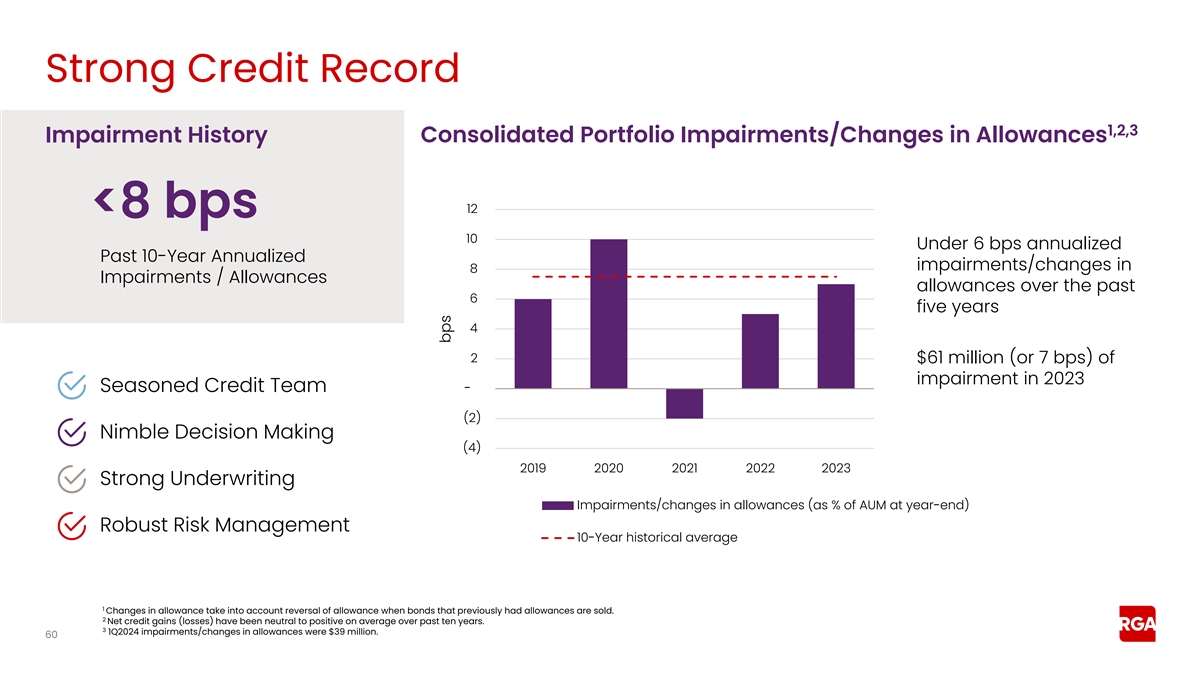
Strong Credit Record 1,2,3 Impairment History Consolidated Portfolio
Impairments/Changes in Allowances 12 <8 bps 10 Under 6 bps annualized Past 10-Year Annualized impairments/changes in 8 Impairments / Allowances allowances over the past 6 five years 4 2 $61 million (or 7 bps) of impairment in 2023 Seasoned Credit
Team - (2) Nimble Decision Making (4) 2019 2020 2021 2022 2023 Strong Underwriting Impairments/changes in allowances (as % of AUM at year-end) Robust Risk Management 10-Year historical average 1 Changes in allowance take into account reversal of
allowance when bonds that previously had allowances are sold. 2 Net credit gains (losses) have been neutral to positive on average over past ten years. 3 1Q2024 impairments/changes in allowances were $39 million. 60 bps
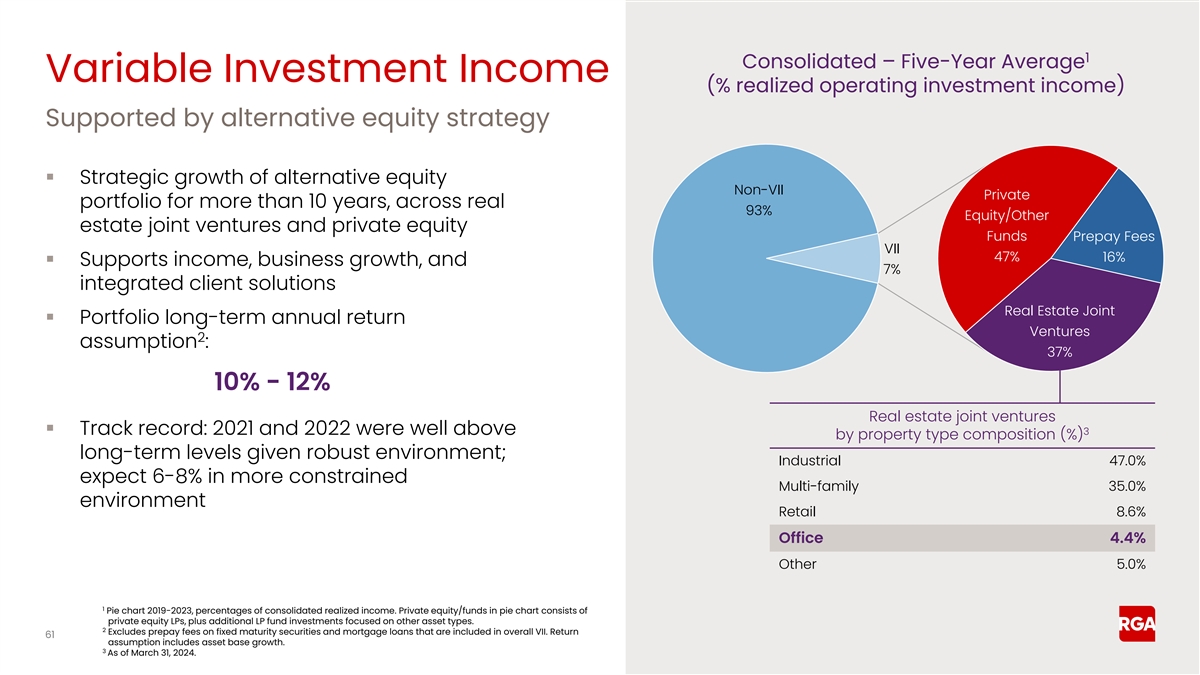
1 Consolidated – Five-Year Average Variable Investment Income (%
realized operating investment income) Supported by alternative equity strategy ▪ Strategic growth of alternative equity Non-VII Private portfolio for more than 10 years, across real 93% Equity/Other estate joint ventures and private equity
Funds Prepay Fees VII 47% 16% ▪ Supports income, business growth, and 7% integrated client solutions Real Estate Joint ▪ Portfolio long-term annual return Ventures 2 assumption : 37% 10% - 12% Real estate joint ventures ▪ Track
record: 2021 and 2022 were well above 3 by property type composition (%) long-term levels given robust environment; Industrial 47.0% expect 6-8% in more constrained Multi-family 35.0% environment Retail 8.6% Office 4.4% Other 5.0% 1 Pie chart
2019-2023, percentages of consolidated realized income. Private equity/funds in pie chart consists of private equity LPs, plus additional LP fund investments focused on other asset types. 2 Excludes prepay fees on fixed maturity securities and
mortgage loans that are included in overall VII. Return 61 assumption includes asset base growth. 3 As of March 31, 2024.
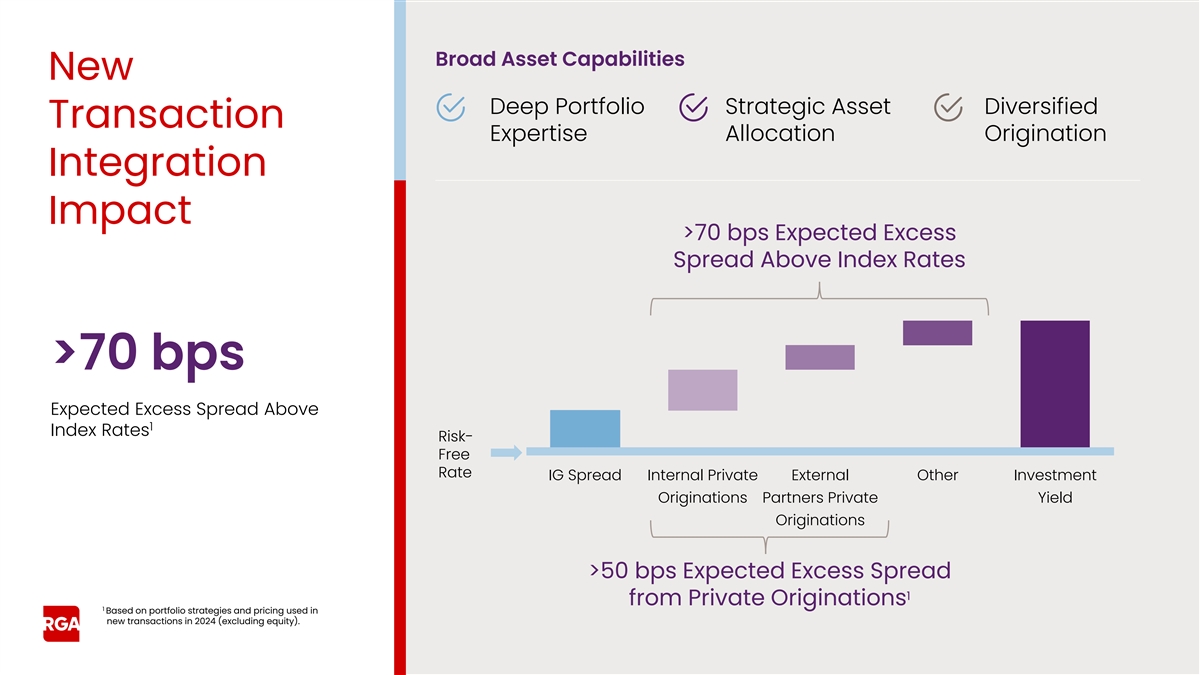
Broad Asset Capabilities New Deep Portfolio Strategic Asset Diversified
Transaction Expertise Allocation Origination Integration Impact >70 bps Expected Excess Spread Above Index Rates >70 bps Expected Excess Spread Above 1 Index Rates Risk- Free Rate IG Spread Internal Private External Other Investment
Originations Partners Private Yield Originations >50 bps Expected Excess Spread 1 from Private Originations 1 Based on portfolio strategies and pricing used in new transactions in 2024 (excluding equity).
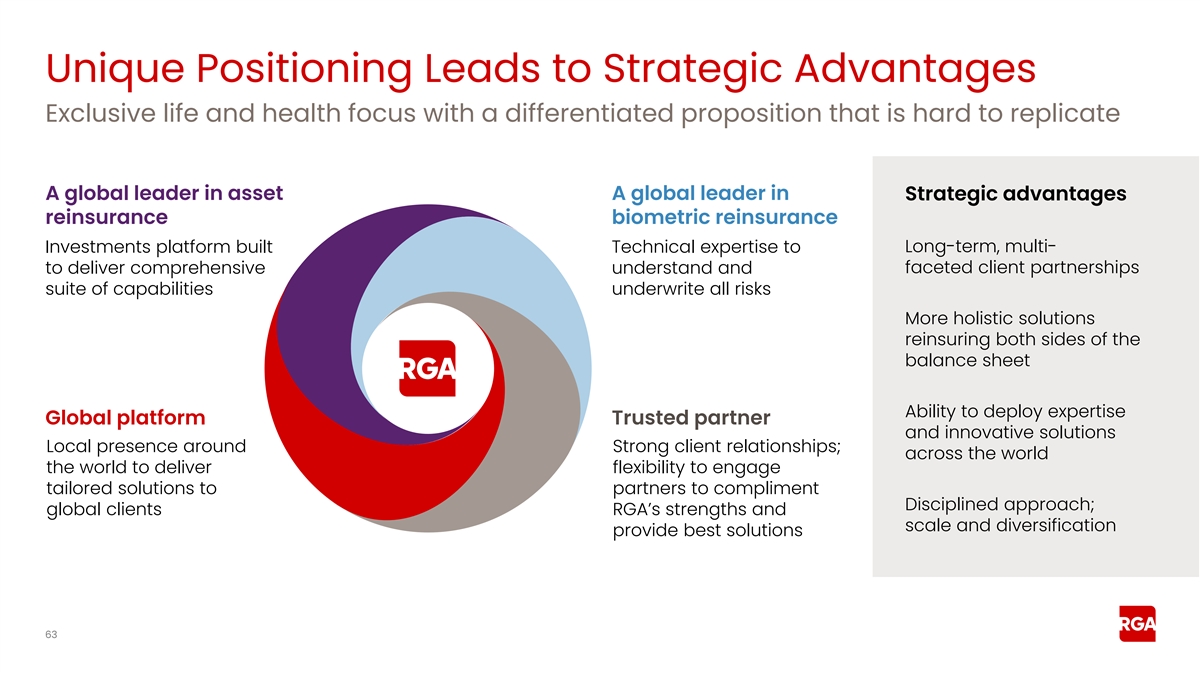
Unique Positioning Leads to Strategic Advantages Exclusive life and
health focus with a differentiated proposition that is hard to replicate A global leader in asset A global leader in Strategic advantages reinsurance biometric reinsurance Investments platform built Technical expertise to Long-term, multi- to
deliver comprehensive understand and faceted client partnerships suite of capabilities underwrite all risks More holistic solutions reinsuring both sides of the balance sheet Ability to deploy expertise Global platform Trusted partner and innovative
solutions Local presence around Strong client relationships; across the world the world to deliver flexibility to engage tailored solutions to partners to compliment Disciplined approach; global clients RGA’s strengths and scale and
diversification provide best solutions 63
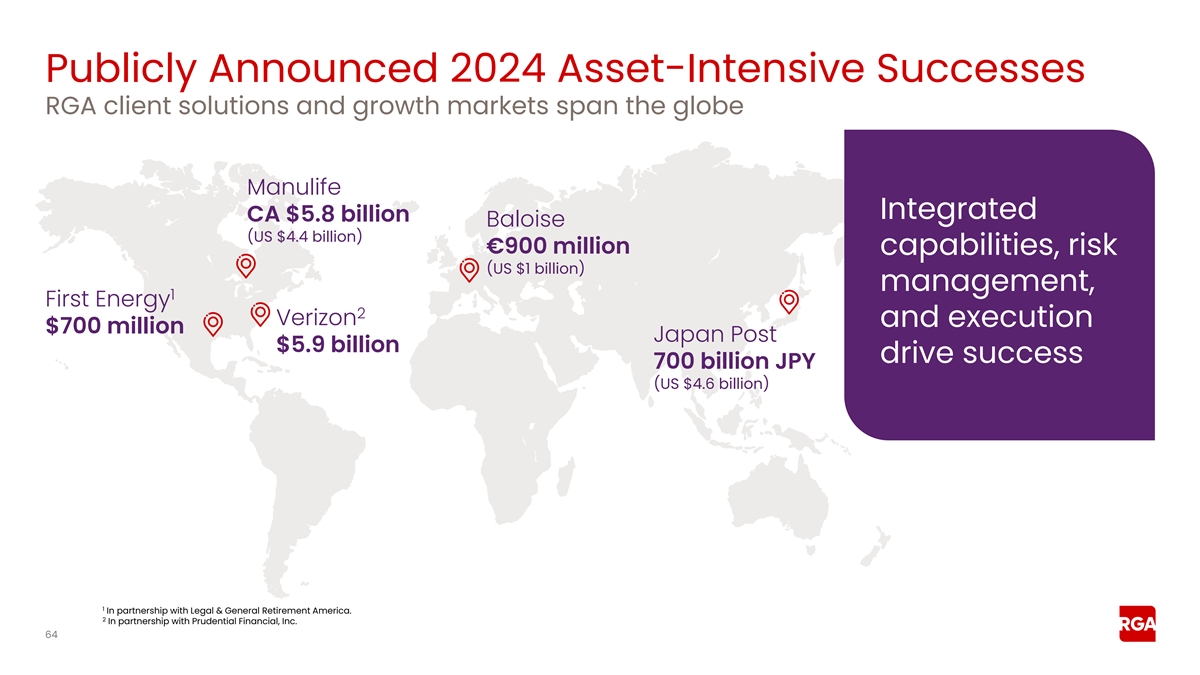
Publicly Announced 2024 Asset-Intensive Successes RGA client solutions
and growth markets span the globe Manulife Integrated CA $5.8 billion Baloise (US $4.4 billion) €900 million capabilities, risk (US $1 billion) management, 1 First Energy 2 Verizon and execution $700 million Japan Post $5.9 billion drive
success 700 billion JPY (US $4.6 billion) 1 In partnership with Legal & General Retirement America. 2 In partnership with Prudential Financial, Inc. 64
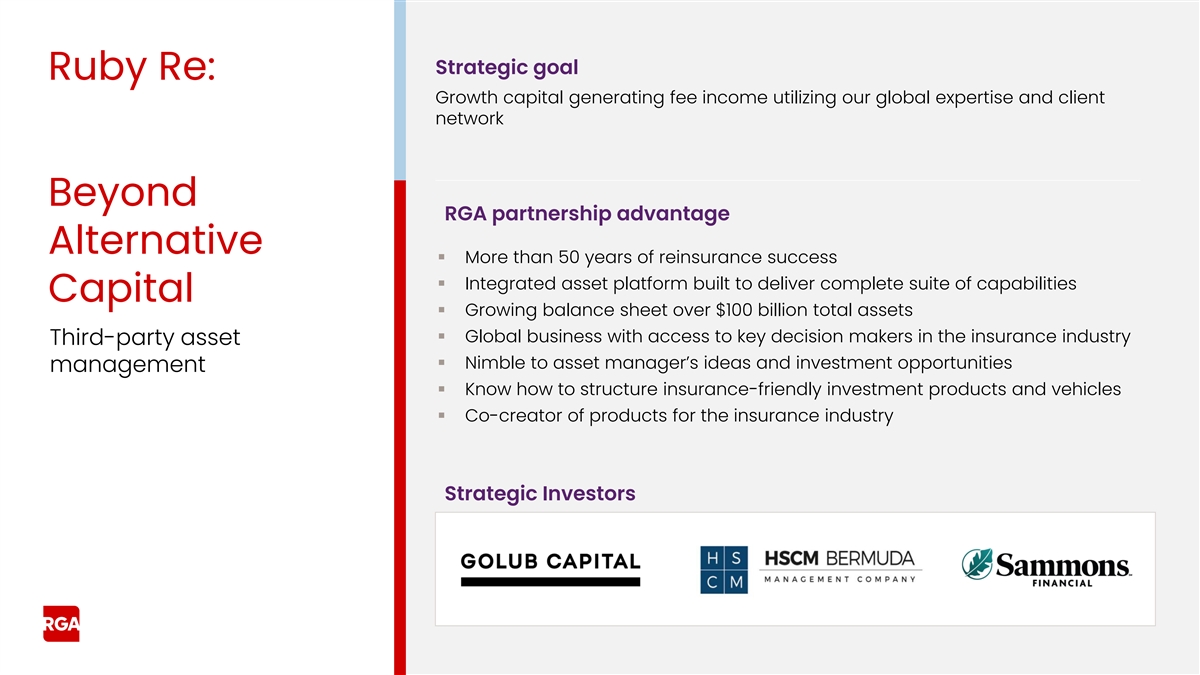
Strategic goal Ruby Re: Growth capital generating fee income utilizing
our global expertise and client network Beyond RGA partnership advantage Alternative ▪ More than 50 years of reinsurance success ▪ Integrated asset platform built to deliver complete suite of capabilities Capital ▪ Growing balance
sheet over $100 billion total assets ▪ Global business with access to key decision makers in the insurance industry Third-party asset ▪ Nimble to asset manager’s ideas and investment opportunities management ▪ Know how to
structure insurance-friendly investment products and vehicles ▪ Co-creator of products for the insurance industry Strategic Investors
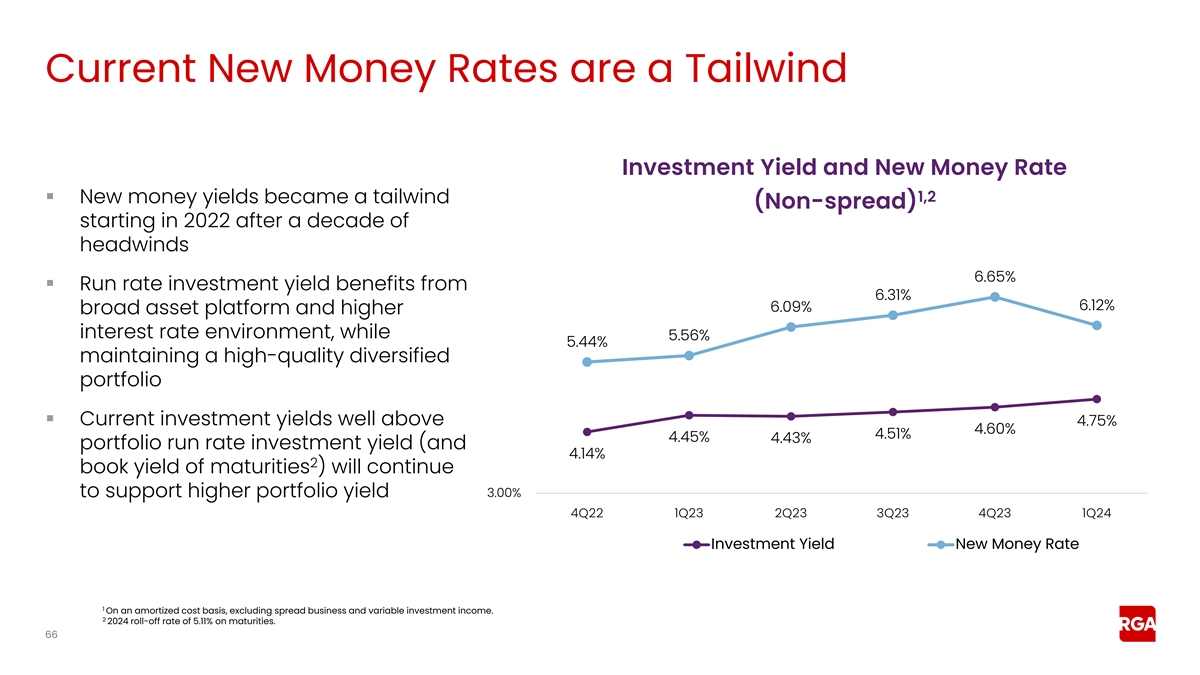
Current New Money Rates are a Tailwind Investment Yield and New Money
Rate 1,2 ▪ New money yields became a tailwind (Non-spread) starting in 2022 after a decade of headwinds 6.65% ▪ Run rate investment yield benefits from 6.31% 6.12% 6.09% broad asset platform and higher interest rate environment, while
5.56% 5.44% maintaining a high-quality diversified portfolio ▪ Current investment yields well above 4.75% 4.60% 4.51% 4.45% 4.43% portfolio run rate investment yield (and 4.14% 2 book yield of maturities ) will continue to support higher
portfolio yield 3.00% 4Q22 1Q23 2Q23 3Q23 4Q23 1Q24 Investment Yield New Money Rate 1 On an amortized cost basis, excluding spread business and variable investment income. 2 2024 roll-off rate of 5.11% on maturities. 66
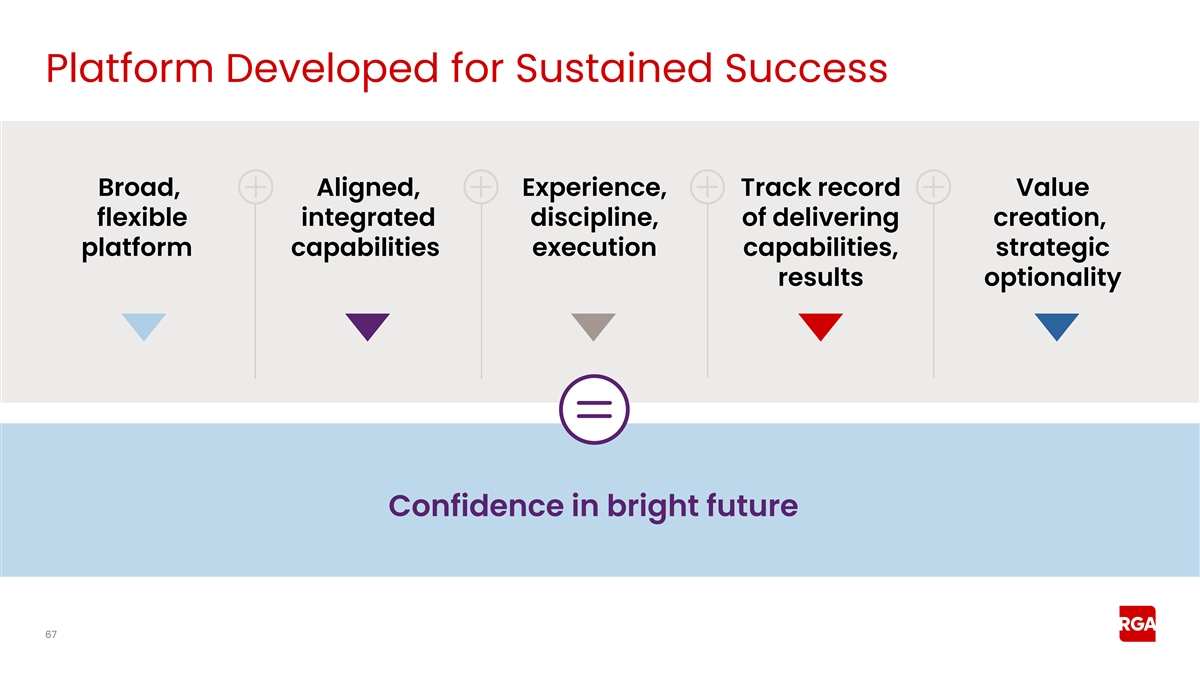
Platform Developed for Sustained Success Broad, Aligned, Experience,
Track record Value flexible integrated discipline, of delivering creation, platform capabilities execution capabilities, strategic results optionality Confidence in bright future 67

Financial Overview Todd Larson Senior Executive Vice President, Chief
Financial Officer 68
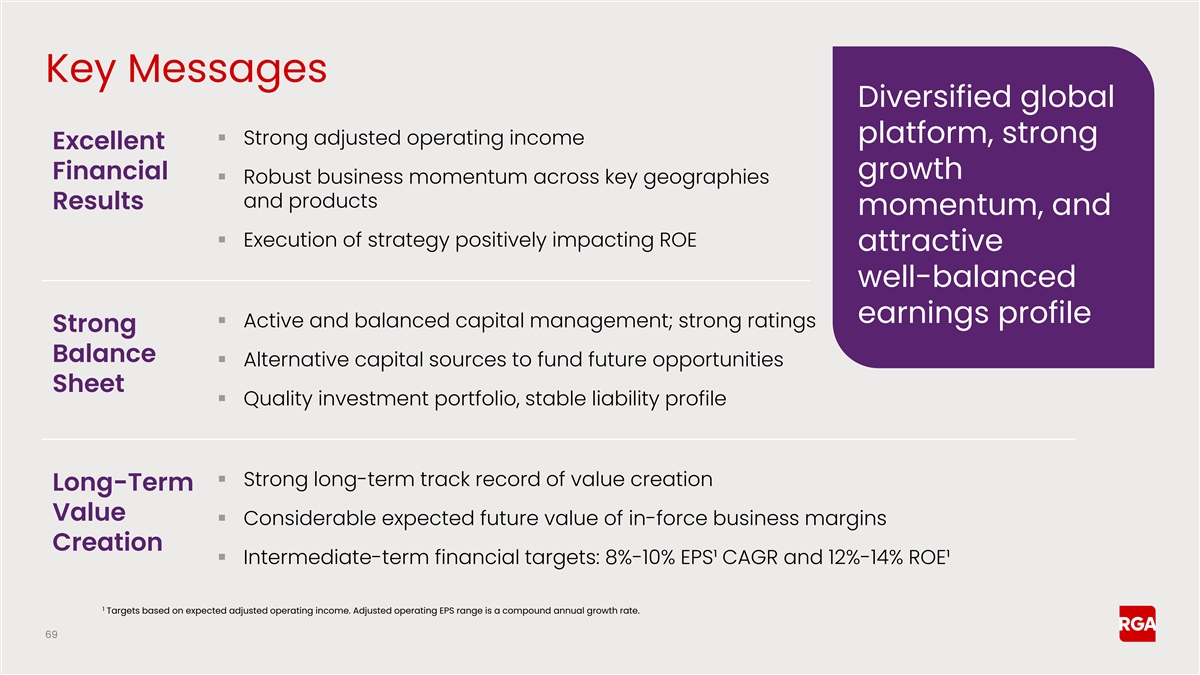
Key Messages Diversified global platform, strong ▪ Strong
adjusted operating income Excellent growth Financial ▪ Robust business momentum across key geographies and products Results momentum, and ▪ Execution of strategy positively impacting ROE attractive well-balanced earnings profile ▪
Active and balanced capital management; strong ratings Strong Balance ▪ Alternative capital sources to fund future opportunities Sheet ▪ Quality investment portfolio, stable liability profile ▪ Strong long-term track record of
value creation Long-Term Value ▪ Considerable expected future value of in-force business margins Creation ▪ Intermediate-term financial targets: 8%-10% EPS¹ CAGR and 12%-14% ROE¹ 1 Targets based on expected adjusted operating
income. Adjusted operating EPS range is a compound annual growth rate. 69
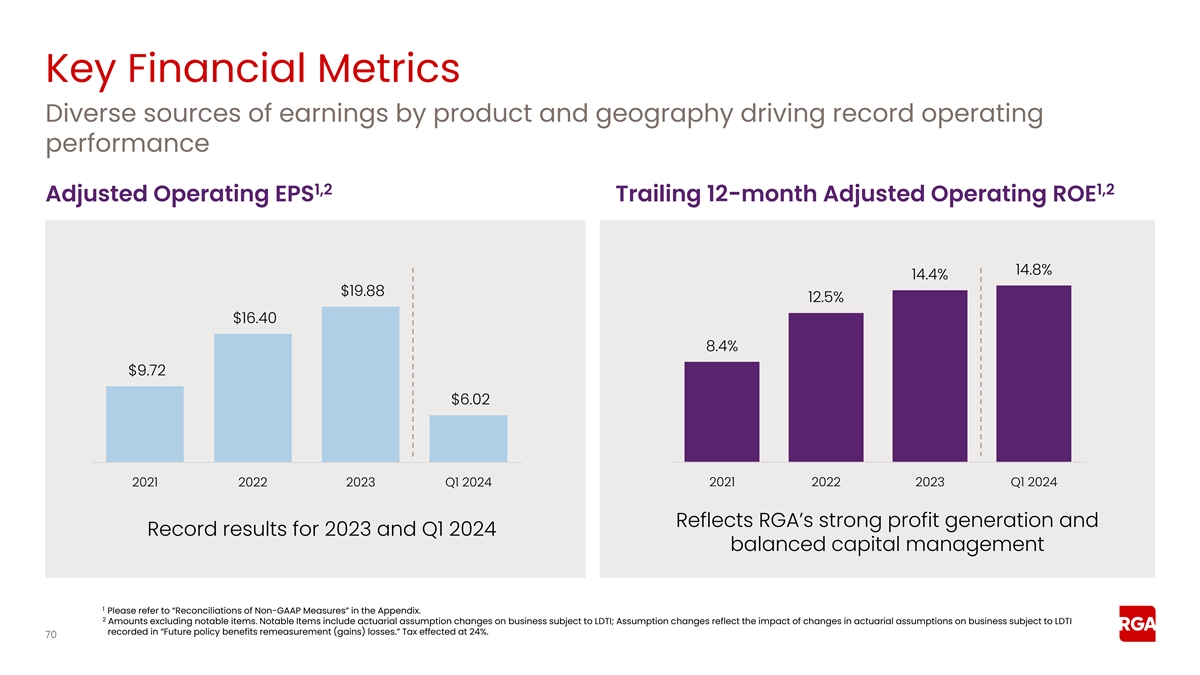
Key Financial Metrics Diverse sources of earnings by product and
geography driving record operating performance 1,2 1,2 Adjusted Operating EPS Trailing 12-month Adjusted Operating ROE 14.8% 14.4% $19.88 12.5% $16.40 8.4% $9.72 $6.02 2021 2022 2023 Q1 2024 2021 2022 2023 Q1 2024 Reflects RGA’s strong profit
generation and Record results for 2023 and Q1 2024 balanced capital management 1 Please refer to “Reconciliations of Non-GAAP Measures” in the Appendix. 2 Amounts excluding notable items. Notable Items include actuarial assumption
changes on business subject to LDTI; Assumption changes reflect the impact of changes in actuarial assumptions on business subject to LDTI recorded in “Future policy benefits remeasurement (gains) losses.” Tax effected at 24%.
70
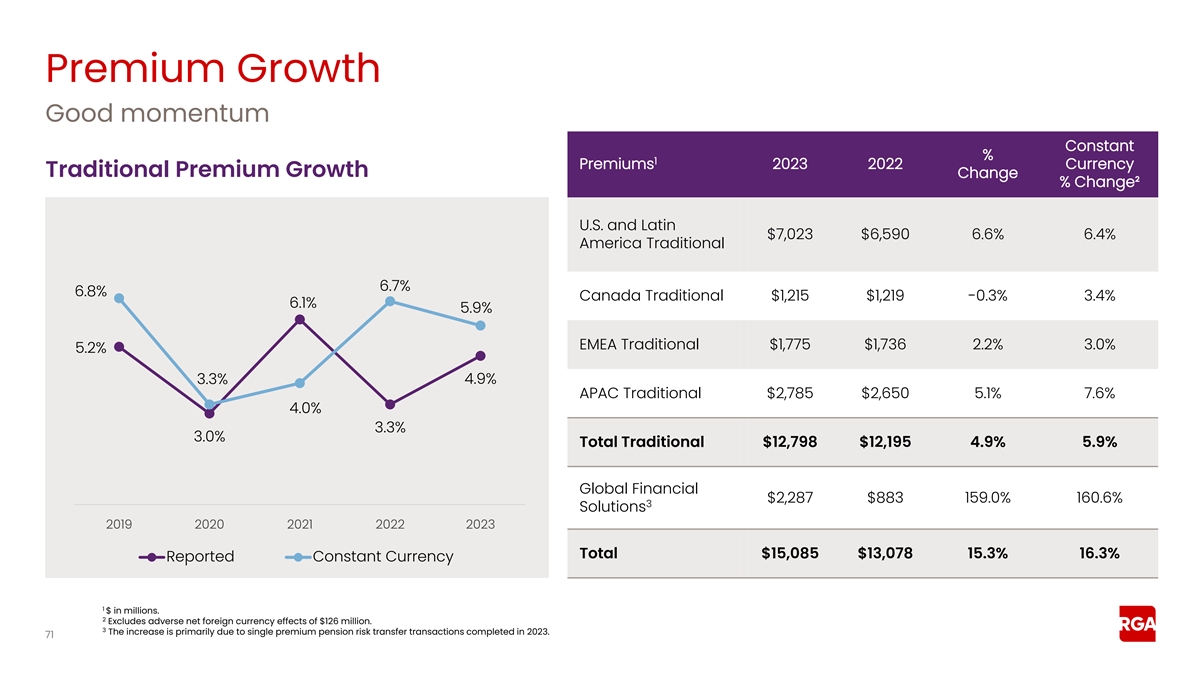
Premium Growth Good momentum Constant % 1 Premiums 2023 2022 Currency
Traditional Premium Growth Change % Change² U.S. and Latin $7,023 $6,590 6.6% 6.4% America Traditional 6.7% 6.8% Canada Traditional $1,215 $1,219 -0.3% 3.4% 6.1% 5.9% EMEA Traditional $1,775 $1,736 2.2% 3.0% 5.2% 3.3% 4.9% APAC Traditional
$2,785 $2,650 5.1% 7.6% 4.0% 3.3% 3.0% Total Traditional $12,798 $12,195 4.9% 5.9% Global Financial $2,287 $883 159.0% 160.6% 3 Solutions 2019 2020 2021 2022 2023 Total $15,085 $13,078 15.3% 16.3% Reported Constant Currency 1 $ in millions. 2
Excludes adverse net foreign currency effects of $126 million. 3 The increase is primarily due to single premium pension risk transfer transactions completed in 2023. 71
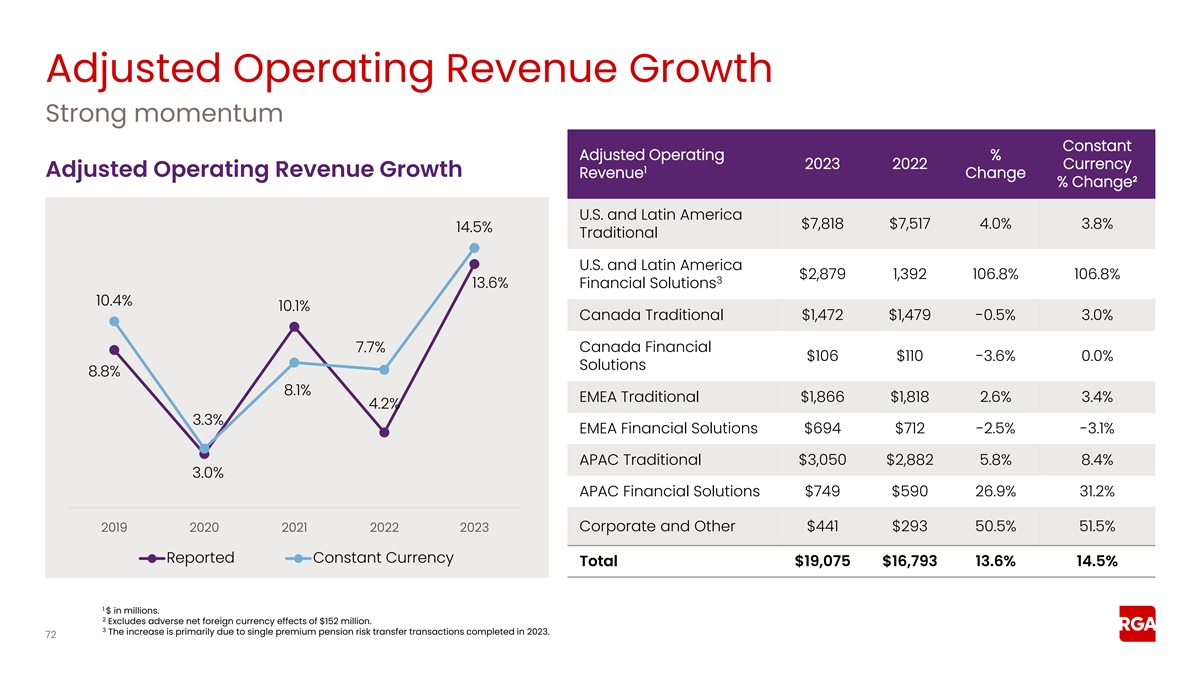
Adjusted Operating Revenue Growth Strong momentum Constant Adjusted
Operating % 2023 2022 Currency 1 Adjusted Operating Revenue Growth Revenue Change % Change² U.S. and Latin America $7,818 $7,517 4.0% 3.8% 14.5% Traditional U.S. and Latin America $2,879 1,392 106.8% 106.8% 3 13.6% Financial Solutions 10.4%
10.1% Canada Traditional $1,472 $1,479 -0.5% 3.0% 7.7% Canada Financial $106 $110 -3.6% 0.0% Solutions 8.8% 8.1% EMEA Traditional $1,866 $1,818 2.6% 3.4% 4.2% 3.3% EMEA Financial Solutions $694 $712 -2.5% -3.1% APAC Traditional $3,050 $2,882 5.8%
8.4% 3.0% APAC Financial Solutions $749 $590 26.9% 31.2% Corporate and Other $441 $293 50.5% 51.5% 2019 2020 2021 2022 2023 Reported Constant Currency Total $19,075 $16,793 13.6% 14.5% 1 $ in millions. 2 Excludes adverse net foreign currency effects
of $152 million. 3 The increase is primarily due to single premium pension risk transfer transactions completed in 2023. 72
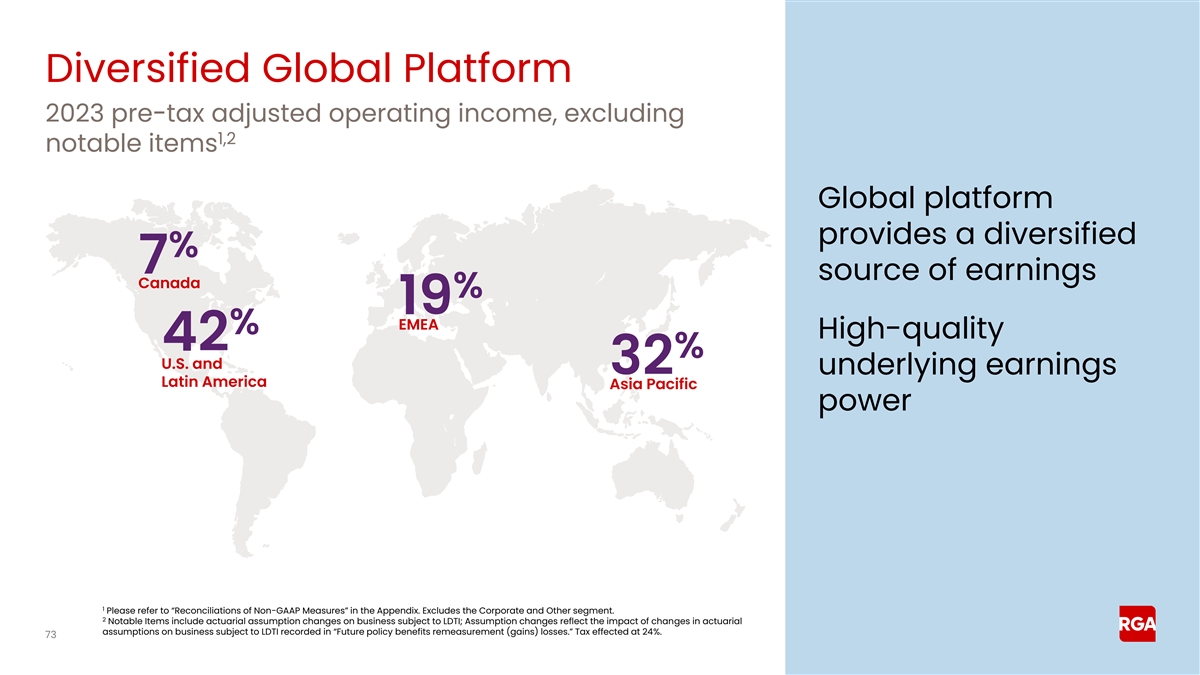
Diversified Global Platform 2023 pre-tax adjusted operating income,
excluding 1,2 notable items Global platform provides a diversified % 7 source of earnings Canada % 19 EMEA % High-quality 42 % U.S. and 32 underlying earnings Latin America Asia Pacific power 1 Please refer to “Reconciliations of Non-GAAP
Measures” in the Appendix. Excludes the Corporate and Other segment. 2 Notable Items include actuarial assumption changes on business subject to LDTI; Assumption changes reflect the impact of changes in actuarial assumptions on business
subject to LDTI recorded in “Future policy benefits remeasurement (gains) losses.” Tax effected at 24%. 73
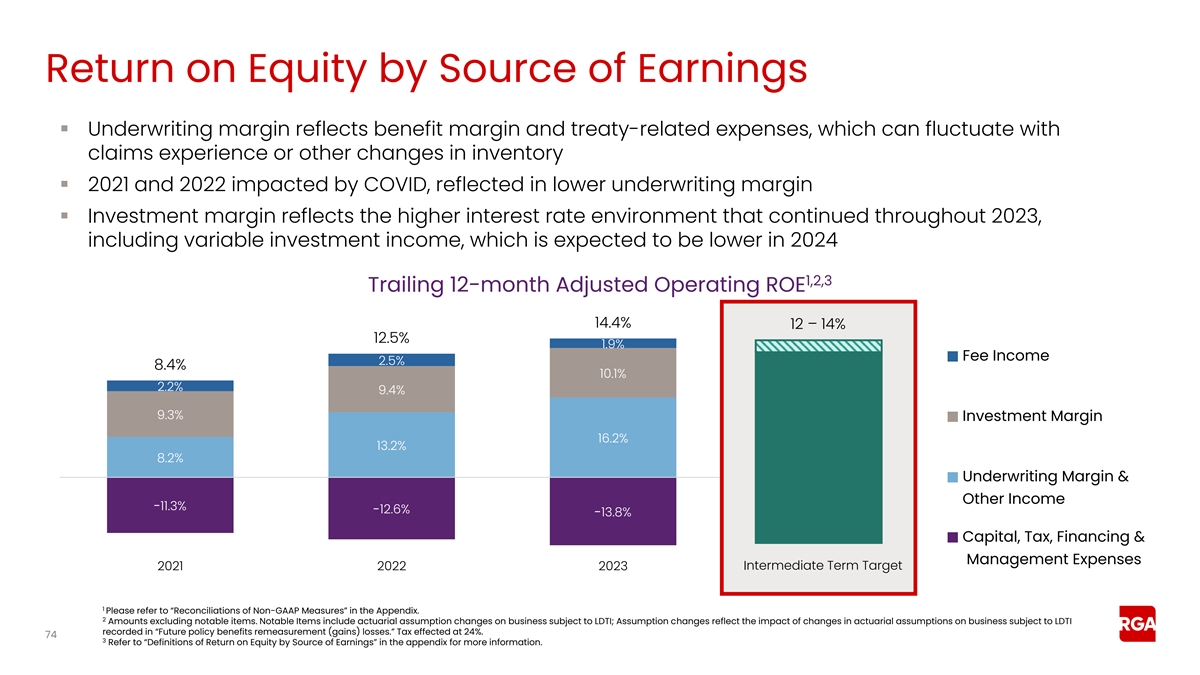
Return on Equity by Source of Earnings ▪ Underwriting margin
reflects benefit margin and treaty-related expenses, which can fluctuate with claims experience or other changes in inventory ▪ 2021 and 2022 impacted by COVID, reflected in lower underwriting margin ▪ Investment margin reflects the
higher interest rate environment that continued throughout 2023, including variable investment income, which is expected to be lower in 2024 1,2,3 Trailing 12-month Adjusted Operating ROE 14.4% 12 – 14% 12.5% 1.9% Fee Income 2.5% 8.4% 10.1%
2.2% 9.4% 9.3% Investment Margin 16.2% 13.2% 8.2% Underwriting Margin & Other Income -11.3% -12.6% -13.8% Capital, Tax, Financing & Management Expenses 2021 2022 2023 Intermediate Term Target 1 Please refer to “Reconciliations of
Non-GAAP Measures” in the Appendix. 2 Amounts excluding notable items. Notable Items include actuarial assumption changes on business subject to LDTI; Assumption changes reflect the impact of changes in actuarial assumptions on business
subject to LDTI recorded in “Future policy benefits remeasurement (gains) losses.” Tax effected at 24%. 74 3 Refer to “Definitions of Return on Equity by Source of Earnings” in the appendix for more information.
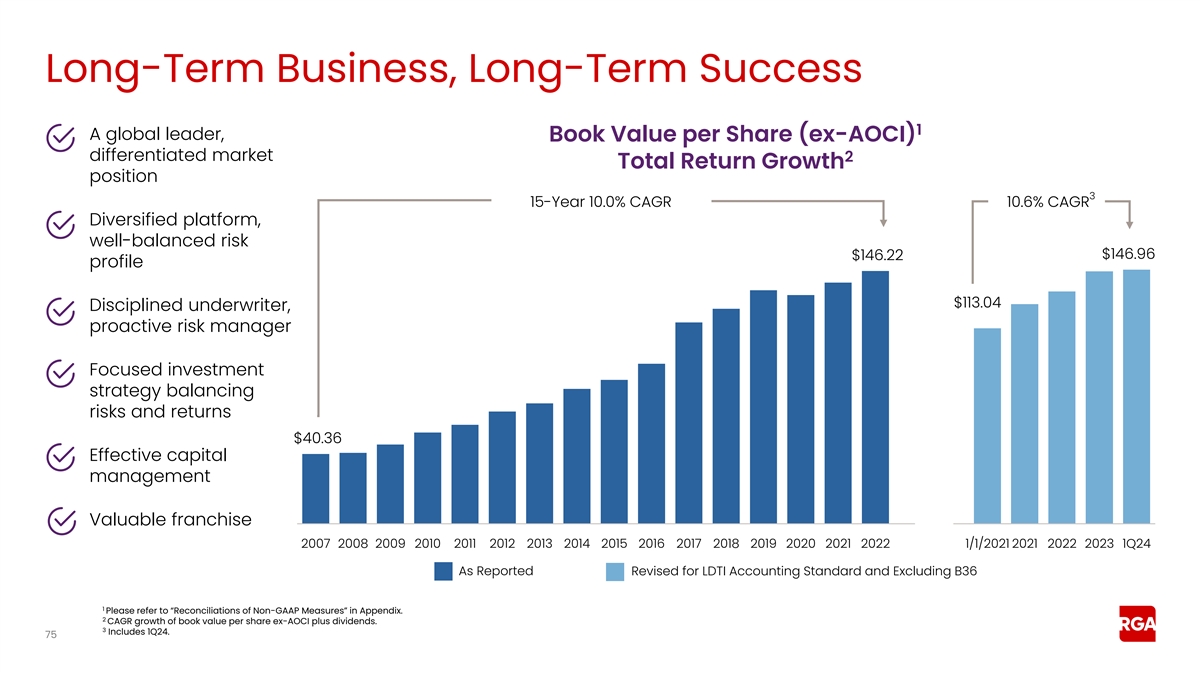
Long-Term Business, Long-Term Success 1 A global leader, Book Value per
Share (ex-AOCI) differentiated market 2 Total Return Growth position 3 15-Year 10.0% CAGR 10.6% CAGR Diversified platform, well-balanced risk $146.96 $146.22 profile $113.04 Disciplined underwriter, proactive risk manager Focused investment strategy
balancing risks and returns $40.36 Effective capital management Valuable franchise 2007 2008 2009 2010 2011 2012 2013 2014 2015 2016 2017 2018 2019 2020 2021 2022 1/1/2021 2021 2022 2023 1Q24 As Reported Revised for LDTI Accounting Standard and
Excluding B36 1 Please refer to “Reconciliations of Non-GAAP Measures” in Appendix. 2 CAGR growth of book value per share ex-AOCI plus dividends. 3 Includes 1Q24. 75
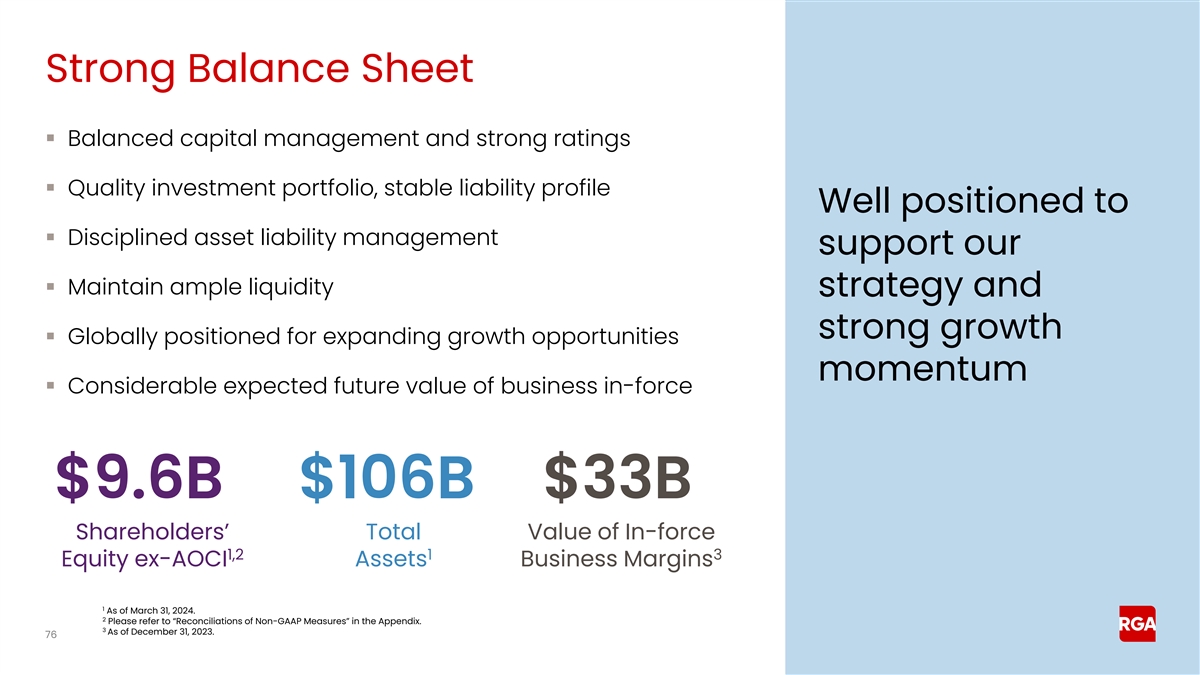
Strong Balance Sheet ▪ Balanced capital management and strong
ratings ▪ Quality investment portfolio, stable liability profile Well positioned to ▪ Disciplined asset liability management support our ▪ Maintain ample liquidity strategy and strong growth ▪ Globally positioned for
expanding growth opportunities momentum ▪ Considerable expected future value of business in-force $9.6B $106B $33B Shareholders’ Total Value of In-force 1,2 1 3 Equity ex-AOCI Assets Business Margins 1 As of March 31, 2024. 2 Please
refer to “Reconciliations of Non-GAAP Measures” in the Appendix. 3 As of December 31, 2023. 76
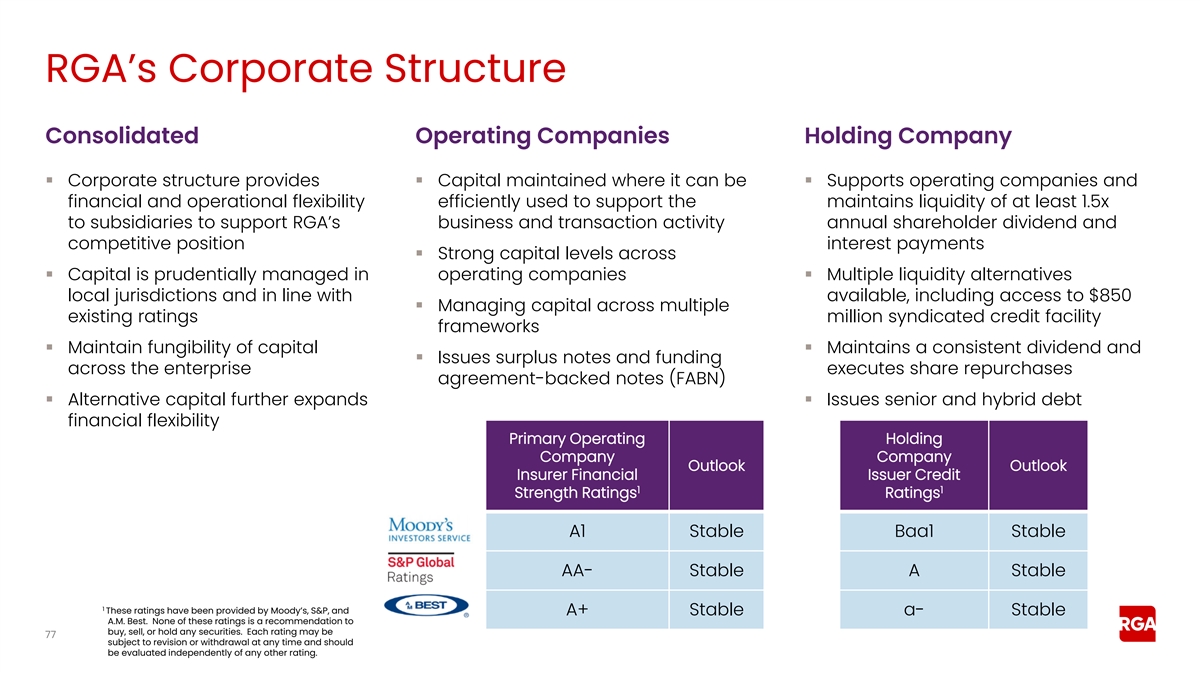
RGA’s Corporate Structure Consolidated Operating Companies
Holding Company ▪ Corporate structure provides ▪ Capital maintained where it can be ▪ Supports operating companies and financial and operational flexibility efficiently used to support the maintains liquidity of at least 1.5x to
subsidiaries to support RGA’s business and transaction activity annual shareholder dividend and competitive position interest payments ▪ Strong capital levels across ▪ Capital is prudentially managed in operating companies▪
Multiple liquidity alternatives local jurisdictions and in line with available, including access to $850 ▪ Managing capital across multiple existing ratings million syndicated credit facility frameworks ▪ Maintain fungibility of capital
▪ Maintains a consistent dividend and ▪ Issues surplus notes and funding across the enterprise executes share repurchases agreement-backed notes (FABN) ▪ Alternative capital further expands ▪ Issues senior and hybrid debt
financial flexibility Primary Operating Holding Company Company Outlook Outlook Insurer Financial Issuer Credit 1 1 Strength Ratings Ratings A1 Stable Baa1 Stable AA- Stable A Stable 1 These ratings have been provided by Moody’s, S&P, and
A+ Stable a- Stable A.M. Best. None of these ratings is a recommendation to buy, sell, or hold any securities. Each rating may be 77 subject to revision or withdrawal at any time and should be evaluated independently of any other rating.
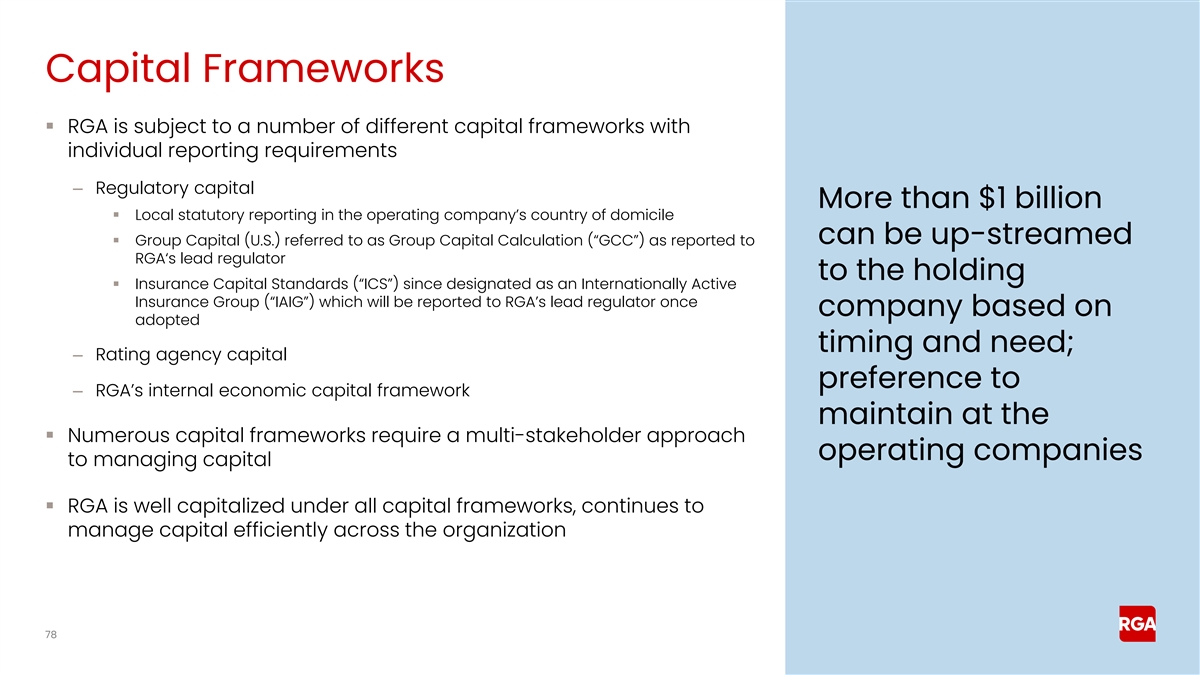
Capital Frameworks ▪ RGA is subject to a number of different
capital frameworks with individual reporting requirements – Regulatory capital More than $1 billion ▪ Local statutory reporting in the operating company’s country of domicile can be up-streamed ▪ Group Capital (U.S.) referred
to as Group Capital Calculation (“GCC”) as reported to RGA‘s lead regulator to the holding ▪ Insurance Capital Standards (“ICS”) since designated as an Internationally Active Insurance Group (“IAIG”)
which will be reported to RGA’s lead regulator once company based on adopted timing and need; – Rating agency capital preference to – RGA’s internal economic capital framework maintain at the ▪ Numerous capital
frameworks require a multi-stakeholder approach operating companies to managing capital ▪ RGA is well capitalized under all capital frameworks, continues to manage capital efficiently across the organization 78
Alternative Forms of Capital Expanding financial flexibility across the
organization ▪ Continuing to further enhance our capital management strategy and flexibility through traditional and alternative forms of capital ▪ Substantial experience optimizing and managing capital across RGA’s operations
▪ Efficient at executing alternative capital solutions applicable to a variety of capital frameworks ▪ Recent alternative capital actions include surplus note issuances, embedded value securitizations, and strategic retrocessions ▪
Established new third-party capital vehicle, Ruby Reinsurance Company (“Ruby Re”) – Retrocession of seed block completed in 2023 – Executing second round of investors 79
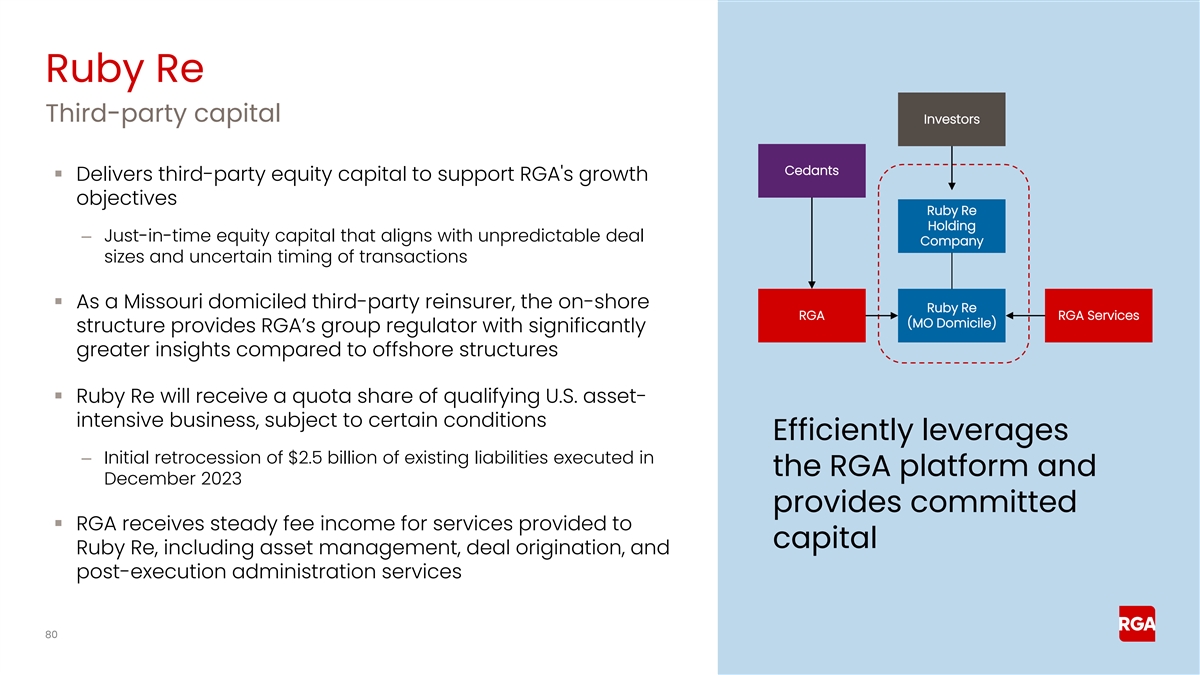
Ruby Re Third-party capital Investors Cedants ▪ Delivers
third-party equity capital to support RGA's growth objectives Ruby Re Holding – Just-in-time equity capital that aligns with unpredictable deal Company sizes and uncertain timing of transactions ▪ As a Missouri domiciled third-party
reinsurer, the on-shore Ruby Re RGA RGA Services (MO Domicile) structure provides RGA’s group regulator with significantly greater insights compared to offshore structures ▪ Ruby Re will receive a quota share of qualifying U.S. asset-
intensive business, subject to certain conditions Efficiently leverages – Initial retrocession of $2.5 billion of existing liabilities executed in the RGA platform and December 2023 provides committed ▪ RGA receives steady fee income for
services provided to capital Ruby Re, including asset management, deal origination, and post-execution administration services 80
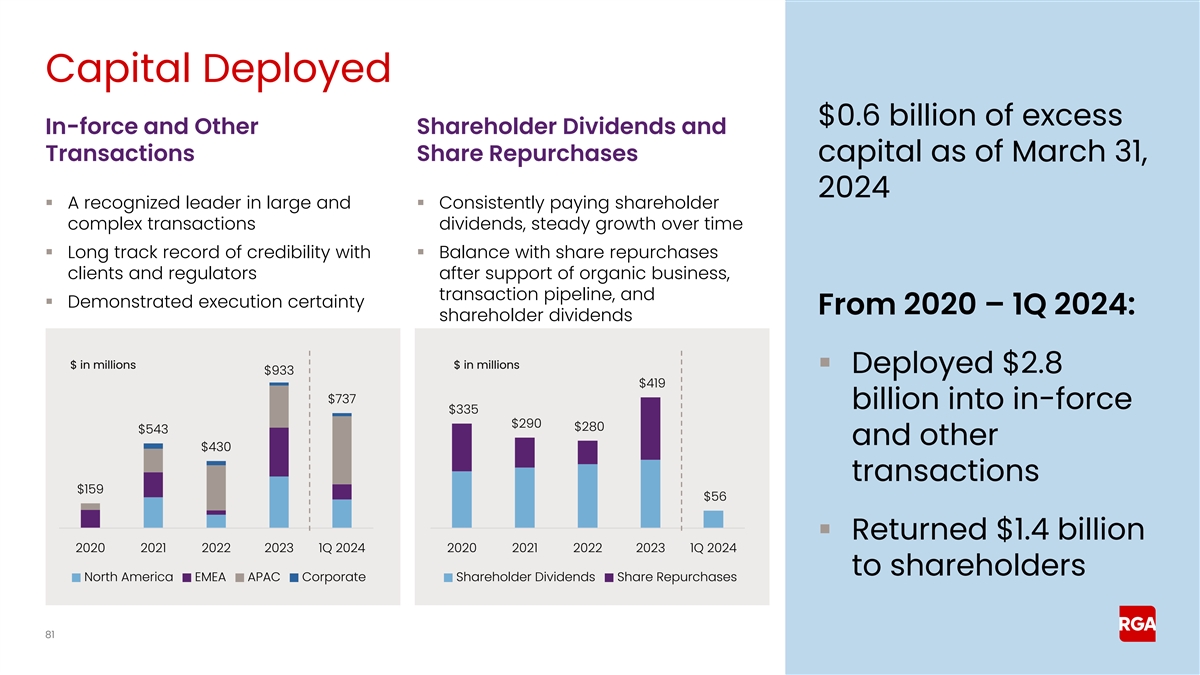
Capital Deployed $0.6 billion of excess In-force and Other Shareholder
Dividends and Transactions Share Repurchases capital as of March 31, 2024 ▪ A recognized leader in large and ▪ Consistently paying shareholder complex transactions dividends, steady growth over time ▪ Long track record of
credibility with ▪ Balance with share repurchases clients and regulators after support of organic business, transaction pipeline, and ▪ Demonstrated execution certainty From 2020 – 1Q 2024: shareholder dividends $ in millions $ in
millions ▪ Deployed $2.8 $933 $419 $737 billion into in-force $335 $290 $280 $543 and other $430 transactions $159 $56 ▪ Returned $1.4 billion 2020 2021 2022 2023 1Q 2024 2020 2021 2022 2023 1Q 2024 to shareholders North America EMEA
APAC Corporate Shareholder Dividends Share Repurchases 81
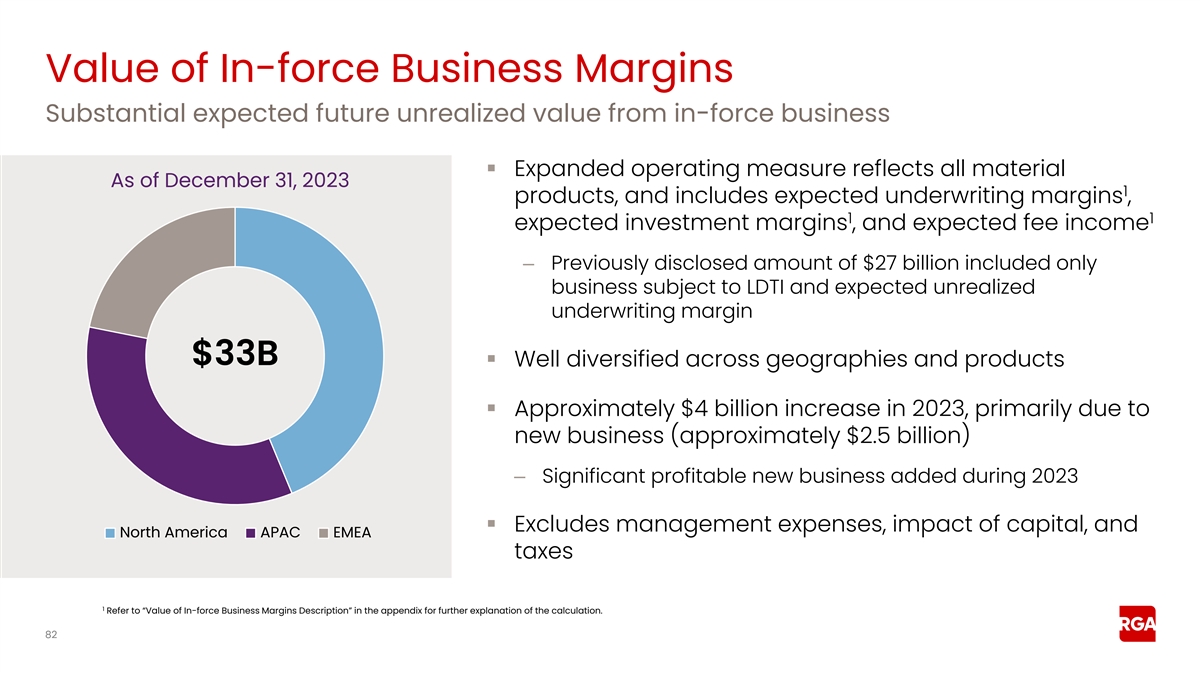
Value of In-force Business Margins Substantial expected future
unrealized value from in-force business ▪ Expanded operating measure reflects all material As of December 31, 2023 1 products, and includes expected underwriting margins , 1 1 expected investment margins , and expected fee income –
Previously disclosed amount of $27 billion included only business subject to LDTI and expected unrealized underwriting margin $33B ▪ Well diversified across geographies and products ▪ Approximately $4 billion increase in 2023, primarily
due to new business (approximately $2.5 billion) – Significant profitable new business added during 2023 ▪ Excludes management expenses, impact of capital, and North America APAC EMEA taxes 1 Refer to “Value of In-force Business
Margins Description” in the appendix for further explanation of the calculation. 82
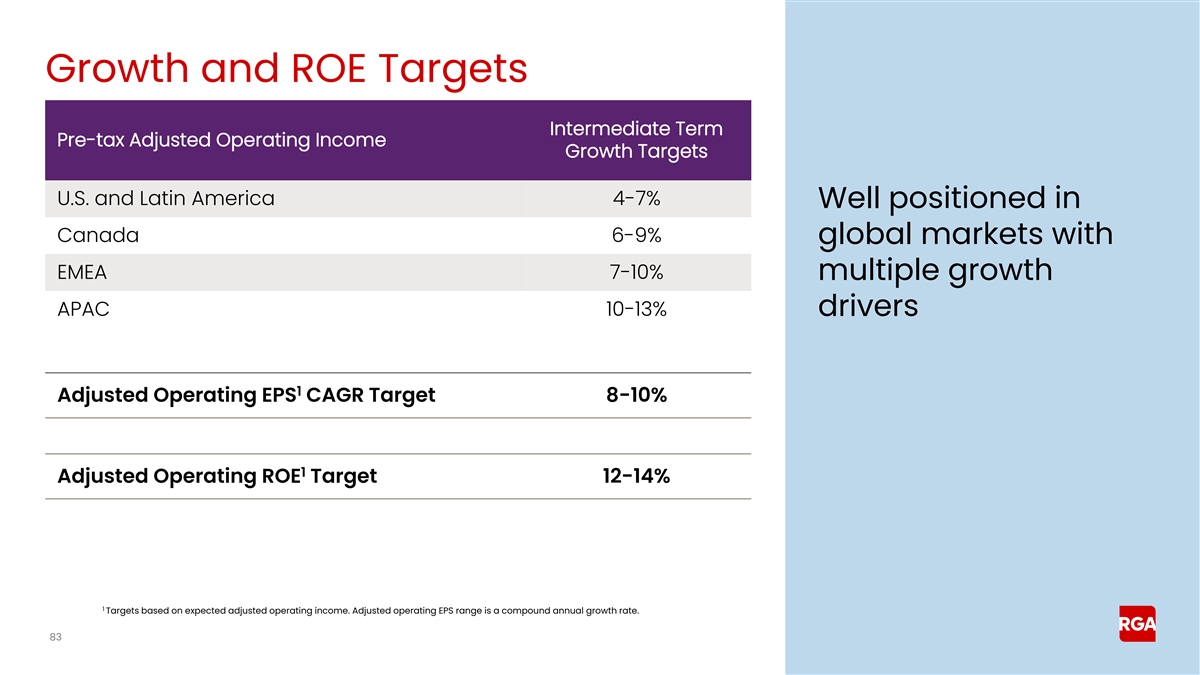
Growth and ROE Targets Intermediate Term Pre-tax Adjusted Operating
Income Growth Targets U.S. and Latin America 4-7% Well positioned in Canada 6-9% global markets with EMEA 7-10% multiple growth APAC 10-13% drivers 1 Adjusted Operating EPS CAGR Target 8-10% 1 Adjusted Operating ROE Target 12-14% 1 Targets based on
expected adjusted operating income. Adjusted operating EPS range is a compound annual growth rate. 83 83
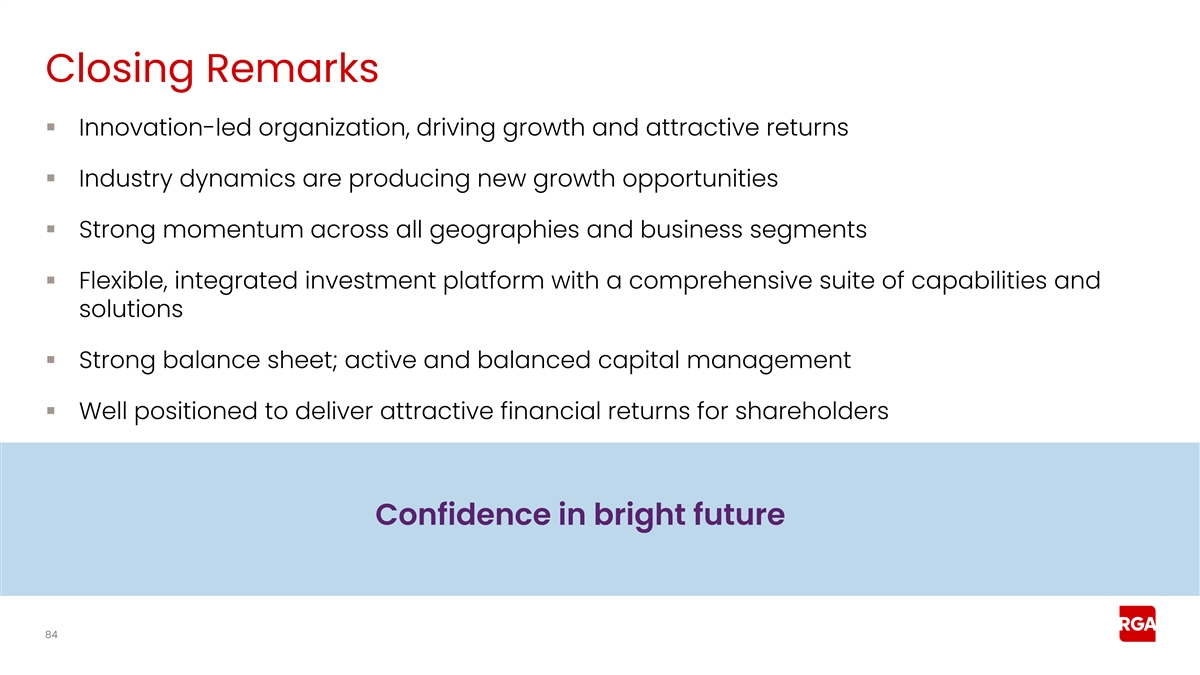
Closing Remarks ▪ Innovation-led organization, driving growth and
attractive returns ▪ Industry dynamics are producing new growth opportunities ▪ Strong momentum across all geographies and business segments ▪ Flexible, integrated investment platform with a comprehensive suite of capabilities and
solutions ▪ Strong balance sheet; active and balanced capital management ▪ Well positioned to deliver attractive financial returns for shareholders Confidence in bright future 84

Break 85

Appendix 86
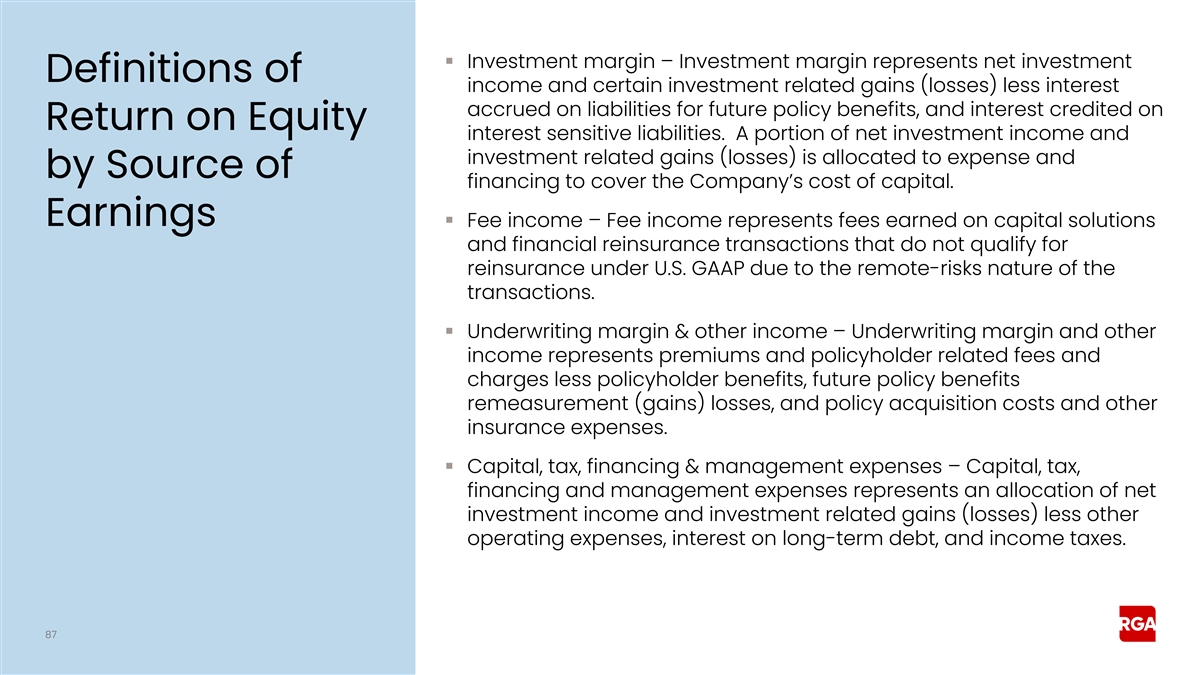
▪ Investment margin – Investment margin represents net
investment Definitions of income and certain investment related gains (losses) less interest accrued on liabilities for future policy benefits, and interest credited on Return on Equity interest sensitive liabilities. A portion of net investment
income and investment related gains (losses) is allocated to expense and by Source of financing to cover the Company’s cost of capital. Earnings ▪ Fee income – Fee income represents fees earned on capital solutions and financial
reinsurance transactions that do not qualify for reinsurance under U.S. GAAP due to the remote-risks nature of the transactions. ▪ Underwriting margin & other income – Underwriting margin and other income represents premiums and
policyholder related fees and charges less policyholder benefits, future policy benefits remeasurement (gains) losses, and policy acquisition costs and other insurance expenses. ▪ Capital, tax, financing & management expenses –
Capital, tax, financing and management expenses represents an allocation of net investment income and investment related gains (losses) less other operating expenses, interest on long-term debt, and income taxes. 87
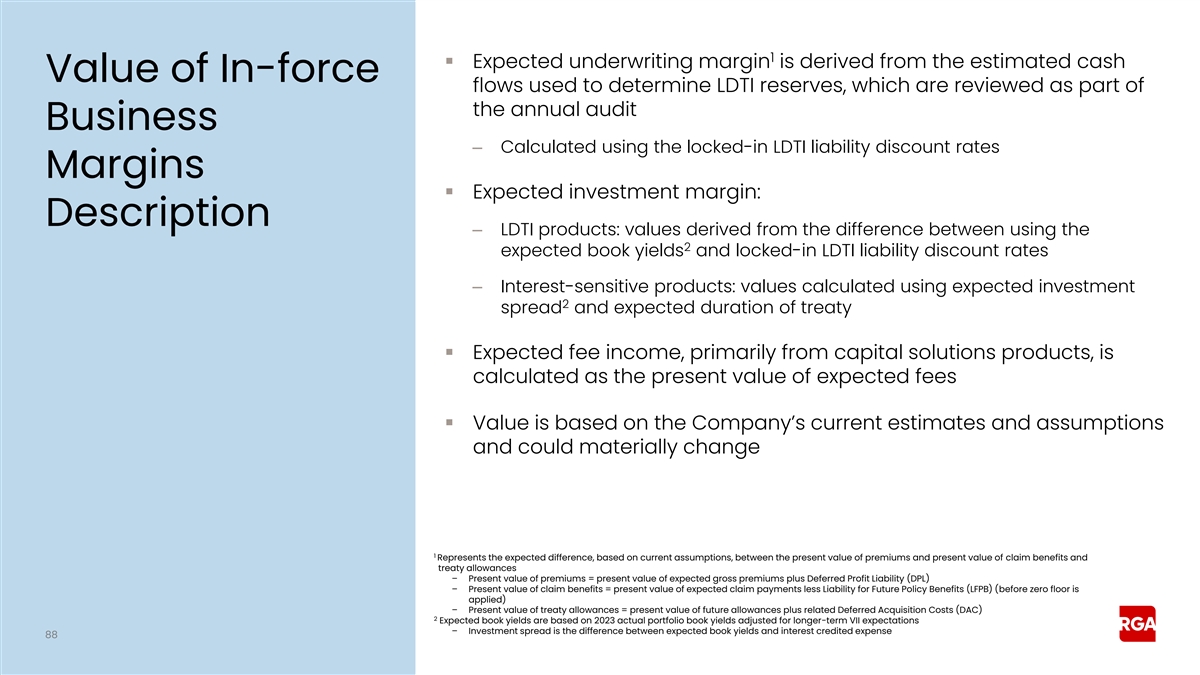
1 ▪ Expected underwriting margin is derived from the estimated
cash Value of In-force flows used to determine LDTI reserves, which are reviewed as part of the annual audit Business – Calculated using the locked-in LDTI liability discount rates Margins ▪ Expected investment margin: Description
– LDTI products: values derived from the difference between using the 2 expected book yields and locked-in LDTI liability discount rates – Interest-sensitive products: values calculated using expected investment 2 spread and expected
duration of treaty ▪ Expected fee income, primarily from capital solutions products, is calculated as the present value of expected fees ▪ Value is based on the Company’s current estimates and assumptions and could materially
change 1 Represents the expected difference, based on current assumptions, between the present value of premiums and present value of claim benefits and treaty allowances – Present value of premiums = present value of expected gross premiums
plus Deferred Profit Liability (DPL) – Present value of claim benefits = present value of expected claim payments less Liability for Future Policy Benefits (LFPB) (before zero floor is applied) – Present value of treaty allowances =
present value of future allowances plus related Deferred Acquisition Costs (DAC) 2 Expected book yields are based on 2023 actual portfolio book yields adjusted for longer-term VII expectations – Investment spread is the difference between
expected book yields and interest credited expense 88
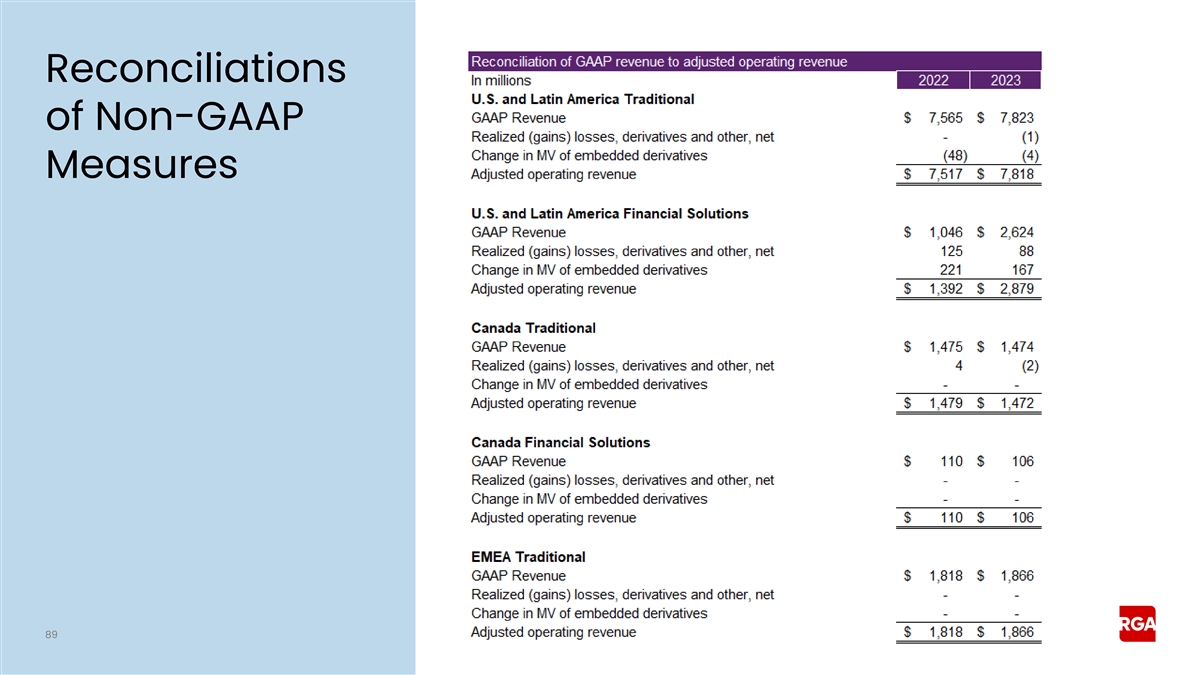
Reconciliations of Non-GAAP Measures 89
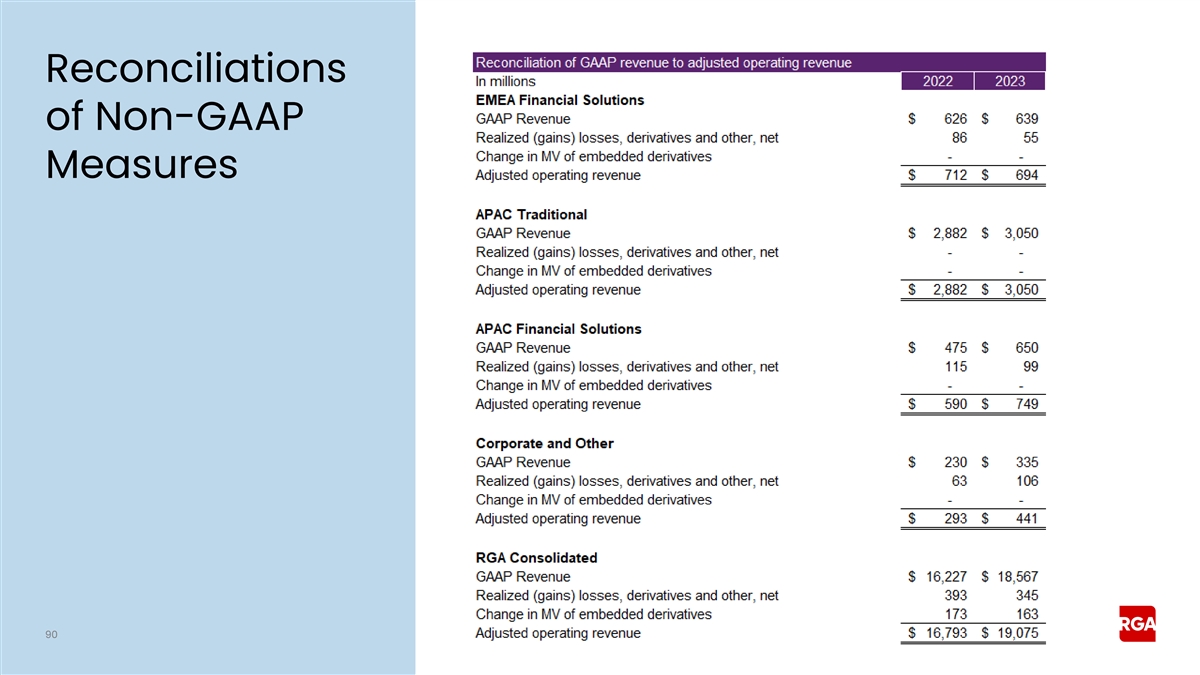
Reconciliations of Non-GAAP Measures 90
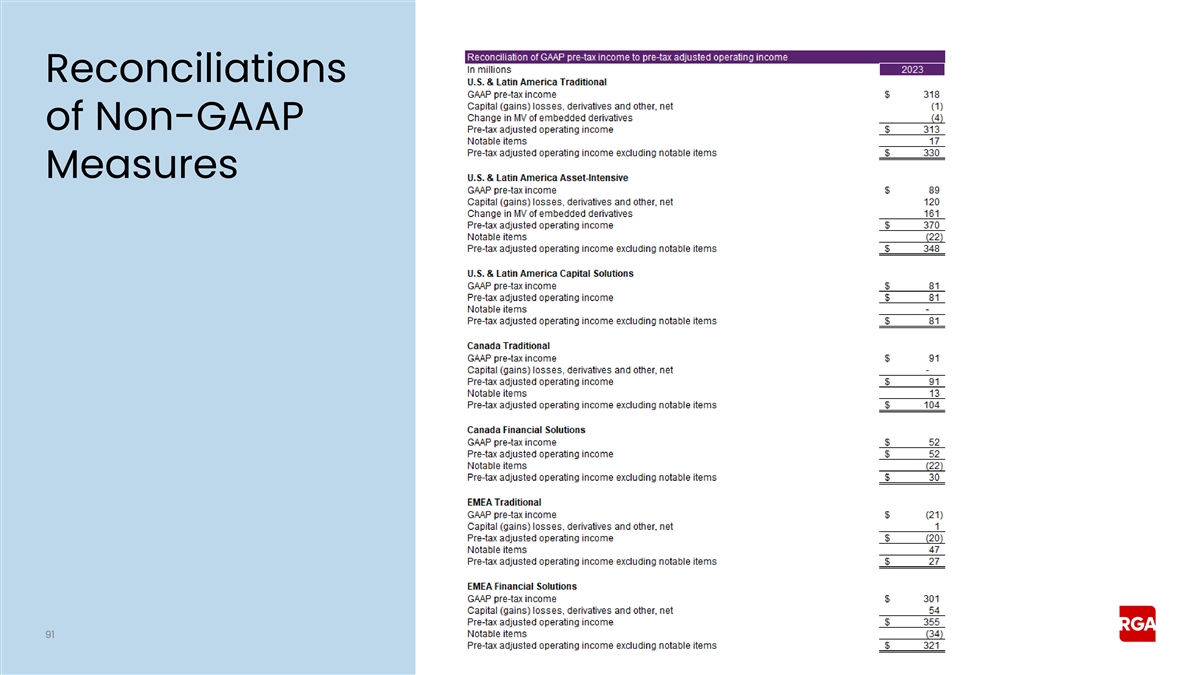
Reconciliations of Non-GAAP Measures 91
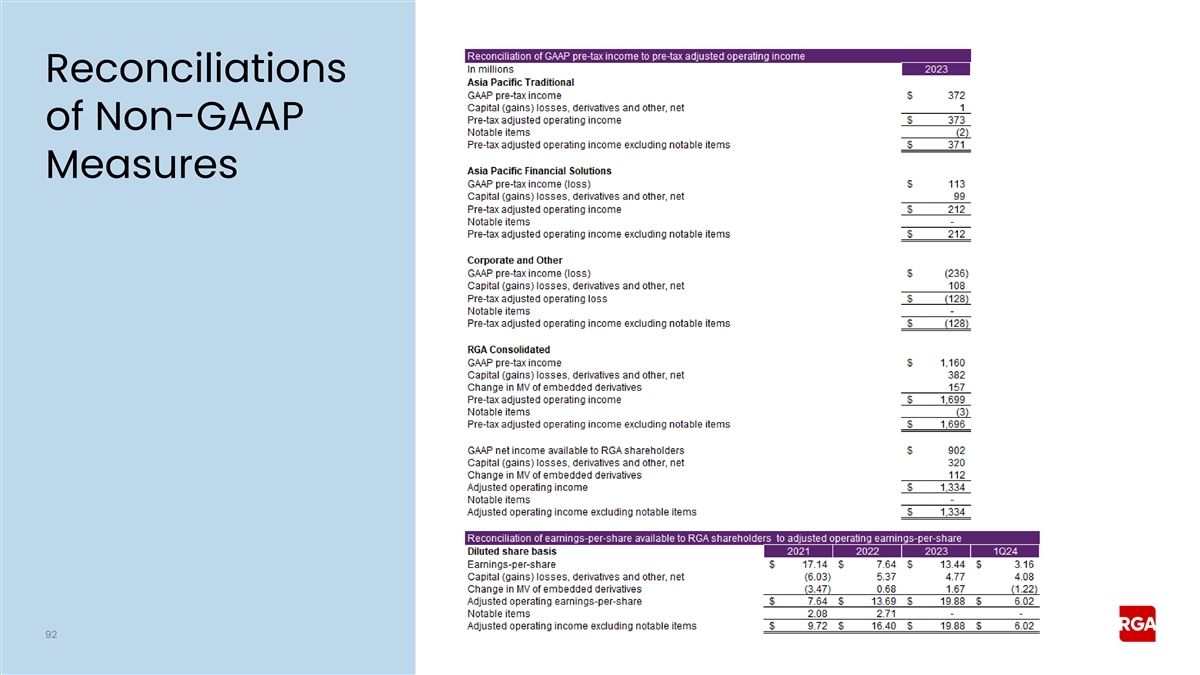
Reconciliations of Non-GAAP Measures 92
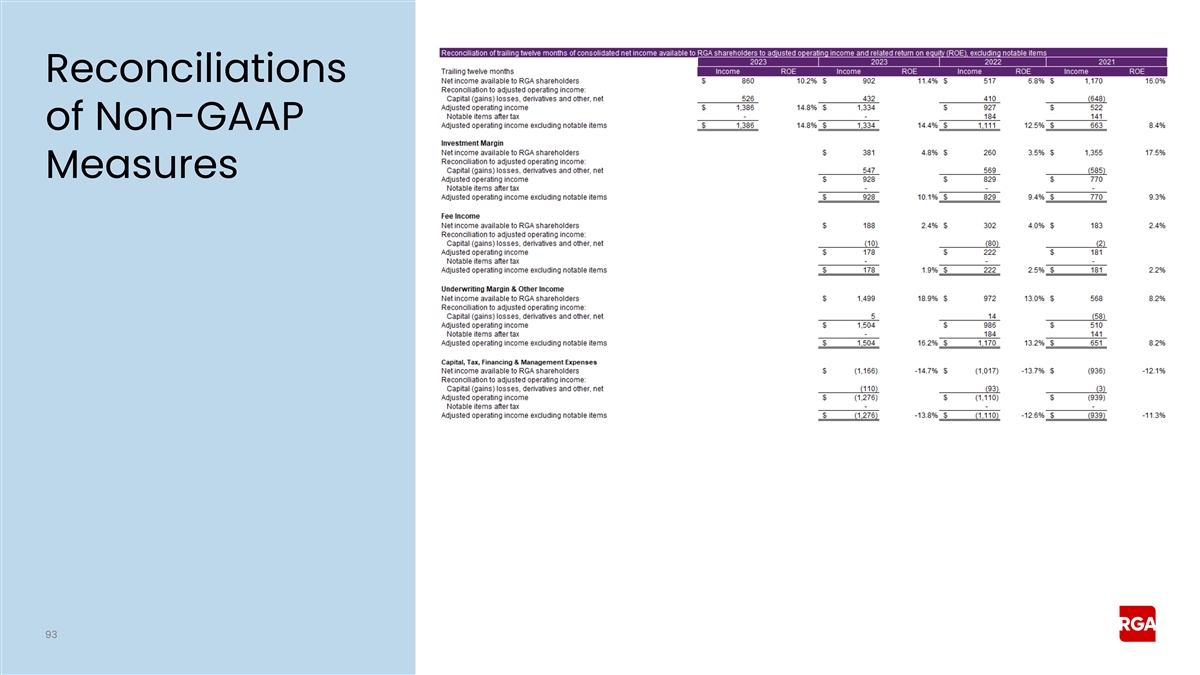
Reconciliations of Non-GAAP Measures 93
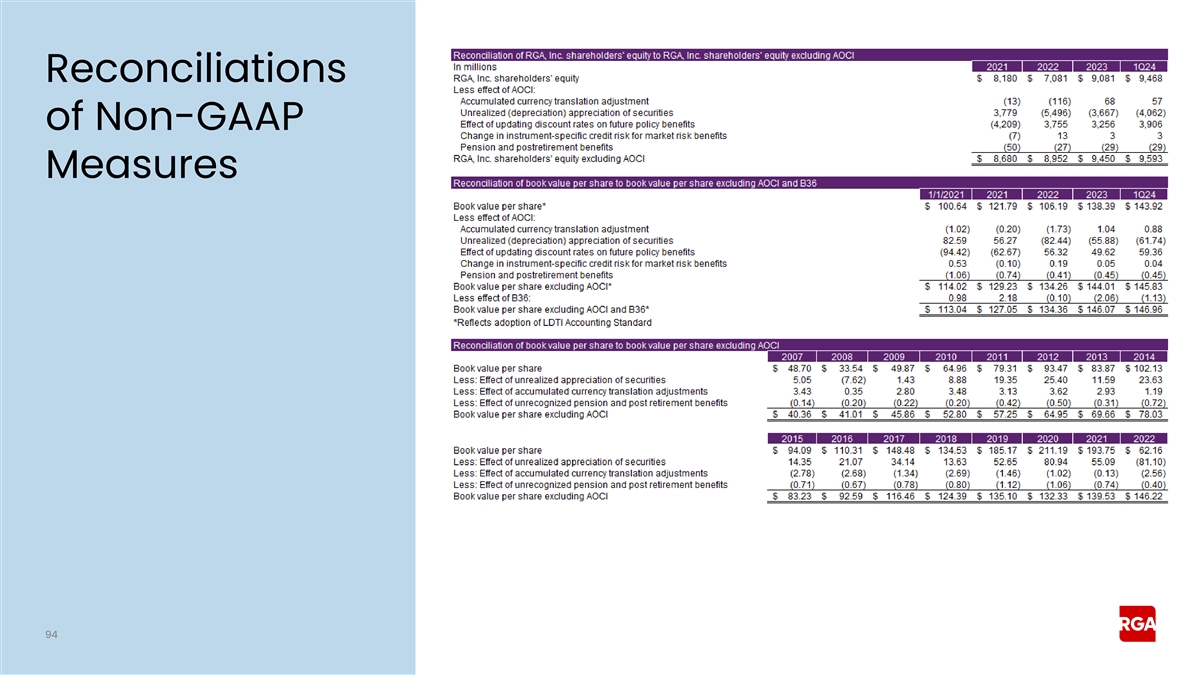
Reconciliations of Non-GAAP Measures 94
©2024 RGA. All rights reserved. No part of this publication may be
reproduced in any form without the prior permission of RGA. The information in this publication is for the exclusive, internal use of the recipient and may not be relied upon by any other party other than the recipient and its affiliates, or
published, quoted or disseminated to any party other than the recipient without the prior written consent of RGA.
v3.24.1.1.u2
| X |
- DefinitionBoolean flag that is true when the XBRL content amends previously-filed or accepted submission.
| Name: |
dei_AmendmentFlag |
| Namespace Prefix: |
dei_ |
| Data Type: |
xbrli:booleanItemType |
| Balance Type: |
na |
| Period Type: |
duration |
|
| X |
- DefinitionFor the EDGAR submission types of Form 8-K: the date of the report, the date of the earliest event reported; for the EDGAR submission types of Form N-1A: the filing date; for all other submission types: the end of the reporting or transition period. The format of the date is YYYY-MM-DD.
| Name: |
dei_DocumentPeriodEndDate |
| Namespace Prefix: |
dei_ |
| Data Type: |
xbrli:dateItemType |
| Balance Type: |
na |
| Period Type: |
duration |
|
| X |
- DefinitionThe type of document being provided (such as 10-K, 10-Q, 485BPOS, etc). The document type is limited to the same value as the supporting SEC submission type, or the word 'Other'.
| Name: |
dei_DocumentType |
| Namespace Prefix: |
dei_ |
| Data Type: |
dei:submissionTypeItemType |
| Balance Type: |
na |
| Period Type: |
duration |
|
| X |
- DefinitionAddress Line 1 such as Attn, Building Name, Street Name
| Name: |
dei_EntityAddressAddressLine1 |
| Namespace Prefix: |
dei_ |
| Data Type: |
xbrli:normalizedStringItemType |
| Balance Type: |
na |
| Period Type: |
duration |
|
| X |
- Definition
+ References
+ Details
| Name: |
dei_EntityAddressCityOrTown |
| Namespace Prefix: |
dei_ |
| Data Type: |
xbrli:normalizedStringItemType |
| Balance Type: |
na |
| Period Type: |
duration |
|
| X |
- DefinitionCode for the postal or zip code
| Name: |
dei_EntityAddressPostalZipCode |
| Namespace Prefix: |
dei_ |
| Data Type: |
xbrli:normalizedStringItemType |
| Balance Type: |
na |
| Period Type: |
duration |
|
| X |
- DefinitionName of the state or province.
| Name: |
dei_EntityAddressStateOrProvince |
| Namespace Prefix: |
dei_ |
| Data Type: |
dei:stateOrProvinceItemType |
| Balance Type: |
na |
| Period Type: |
duration |
|
| X |
- DefinitionA unique 10-digit SEC-issued value to identify entities that have filed disclosures with the SEC. It is commonly abbreviated as CIK. Reference 1: http://www.xbrl.org/2003/role/presentationRef
-Publisher SEC
-Name Exchange Act
-Number 240
-Section 12
-Subsection b-2
| Name: |
dei_EntityCentralIndexKey |
| Namespace Prefix: |
dei_ |
| Data Type: |
dei:centralIndexKeyItemType |
| Balance Type: |
na |
| Period Type: |
duration |
|
| X |
- DefinitionIndicate if registrant meets the emerging growth company criteria. Reference 1: http://www.xbrl.org/2003/role/presentationRef
-Publisher SEC
-Name Exchange Act
-Number 240
-Section 12
-Subsection b-2
| Name: |
dei_EntityEmergingGrowthCompany |
| Namespace Prefix: |
dei_ |
| Data Type: |
xbrli:booleanItemType |
| Balance Type: |
na |
| Period Type: |
duration |
|
| X |
- DefinitionCommission file number. The field allows up to 17 characters. The prefix may contain 1-3 digits, the sequence number may contain 1-8 digits, the optional suffix may contain 1-4 characters, and the fields are separated with a hyphen.
| Name: |
dei_EntityFileNumber |
| Namespace Prefix: |
dei_ |
| Data Type: |
dei:fileNumberItemType |
| Balance Type: |
na |
| Period Type: |
duration |
|
| X |
- DefinitionTwo-character EDGAR code representing the state or country of incorporation.
| Name: |
dei_EntityIncorporationStateCountryCode |
| Namespace Prefix: |
dei_ |
| Data Type: |
dei:edgarStateCountryItemType |
| Balance Type: |
na |
| Period Type: |
duration |
|
| X |
- DefinitionThe exact name of the entity filing the report as specified in its charter, which is required by forms filed with the SEC. Reference 1: http://www.xbrl.org/2003/role/presentationRef
-Publisher SEC
-Name Exchange Act
-Number 240
-Section 12
-Subsection b-2
| Name: |
dei_EntityRegistrantName |
| Namespace Prefix: |
dei_ |
| Data Type: |
xbrli:normalizedStringItemType |
| Balance Type: |
na |
| Period Type: |
duration |
|
| X |
- DefinitionThe Tax Identification Number (TIN), also known as an Employer Identification Number (EIN), is a unique 9-digit value assigned by the IRS. Reference 1: http://www.xbrl.org/2003/role/presentationRef
-Publisher SEC
-Name Exchange Act
-Number 240
-Section 12
-Subsection b-2
| Name: |
dei_EntityTaxIdentificationNumber |
| Namespace Prefix: |
dei_ |
| Data Type: |
dei:employerIdItemType |
| Balance Type: |
na |
| Period Type: |
duration |
|
| X |
- DefinitionLocal phone number for entity.
| Name: |
dei_LocalPhoneNumber |
| Namespace Prefix: |
dei_ |
| Data Type: |
xbrli:normalizedStringItemType |
| Balance Type: |
na |
| Period Type: |
duration |
|
| X |
- DefinitionBoolean flag that is true when the Form 8-K filing is intended to satisfy the filing obligation of the registrant as pre-commencement communications pursuant to Rule 13e-4(c) under the Exchange Act. Reference 1: http://www.xbrl.org/2003/role/presentationRef
-Publisher SEC
-Name Exchange Act
-Number 240
-Section 13e
-Subsection 4c
| Name: |
dei_PreCommencementIssuerTenderOffer |
| Namespace Prefix: |
dei_ |
| Data Type: |
xbrli:booleanItemType |
| Balance Type: |
na |
| Period Type: |
duration |
|
| X |
- DefinitionBoolean flag that is true when the Form 8-K filing is intended to satisfy the filing obligation of the registrant as pre-commencement communications pursuant to Rule 14d-2(b) under the Exchange Act. Reference 1: http://www.xbrl.org/2003/role/presentationRef
-Publisher SEC
-Name Exchange Act
-Number 240
-Section 14d
-Subsection 2b
| Name: |
dei_PreCommencementTenderOffer |
| Namespace Prefix: |
dei_ |
| Data Type: |
xbrli:booleanItemType |
| Balance Type: |
na |
| Period Type: |
duration |
|
| X |
- DefinitionTitle of a 12(b) registered security. Reference 1: http://www.xbrl.org/2003/role/presentationRef
-Publisher SEC
-Name Exchange Act
-Number 240
-Section 12
-Subsection b
| Name: |
dei_Security12bTitle |
| Namespace Prefix: |
dei_ |
| Data Type: |
dei:securityTitleItemType |
| Balance Type: |
na |
| Period Type: |
duration |
|
| X |
- DefinitionName of the Exchange on which a security is registered. Reference 1: http://www.xbrl.org/2003/role/presentationRef
-Publisher SEC
-Name Exchange Act
-Number 240
-Section 12
-Subsection d1-1
| Name: |
dei_SecurityExchangeName |
| Namespace Prefix: |
dei_ |
| Data Type: |
dei:edgarExchangeCodeItemType |
| Balance Type: |
na |
| Period Type: |
duration |
|
| X |
- DefinitionBoolean flag that is true when the Form 8-K filing is intended to satisfy the filing obligation of the registrant as soliciting material pursuant to Rule 14a-12 under the Exchange Act. Reference 1: http://www.xbrl.org/2003/role/presentationRef
-Publisher SEC
-Name Exchange Act
-Section 14a
-Number 240
-Subsection 12
| Name: |
dei_SolicitingMaterial |
| Namespace Prefix: |
dei_ |
| Data Type: |
xbrli:booleanItemType |
| Balance Type: |
na |
| Period Type: |
duration |
|
| X |
- DefinitionTrading symbol of an instrument as listed on an exchange.
| Name: |
dei_TradingSymbol |
| Namespace Prefix: |
dei_ |
| Data Type: |
dei:tradingSymbolItemType |
| Balance Type: |
na |
| Period Type: |
duration |
|
| X |
- DefinitionBoolean flag that is true when the Form 8-K filing is intended to satisfy the filing obligation of the registrant as written communications pursuant to Rule 425 under the Securities Act. Reference 1: http://www.xbrl.org/2003/role/presentationRef
-Publisher SEC
-Name Securities Act
-Number 230
-Section 425
| Name: |
dei_WrittenCommunications |
| Namespace Prefix: |
dei_ |
| Data Type: |
xbrli:booleanItemType |
| Balance Type: |
na |
| Period Type: |
duration |
|
| X |
- Details
| Name: |
us-gaap_StatementClassOfStockAxis=rga_CommonStockOutstandingMember |
| Namespace Prefix: |
|
| Data Type: |
na |
| Balance Type: |
|
| Period Type: |
|
|
| X |
- Details
| Name: |
us-gaap_StatementClassOfStockAxis=rga_M5.75FixedToFloatingRateSubordinatedDebenturesDue2056Member |
| Namespace Prefix: |
|
| Data Type: |
na |
| Balance Type: |
|
| Period Type: |
|
|
| X |
- Details
| Name: |
us-gaap_StatementClassOfStockAxis=rga_M7.125FixedRateResetSubordinatedDebenturesDue2052Member |
| Namespace Prefix: |
|
| Data Type: |
na |
| Balance Type: |
|
| Period Type: |
|
|
Reinsurance Group of Ame... (NYSE:RZC)
過去 株価チャート
から 5 2024 まで 6 2024

Reinsurance Group of Ame... (NYSE:RZC)
過去 株価チャート
から 6 2023 まで 6 2024
