| 16
BALANCE SHEET
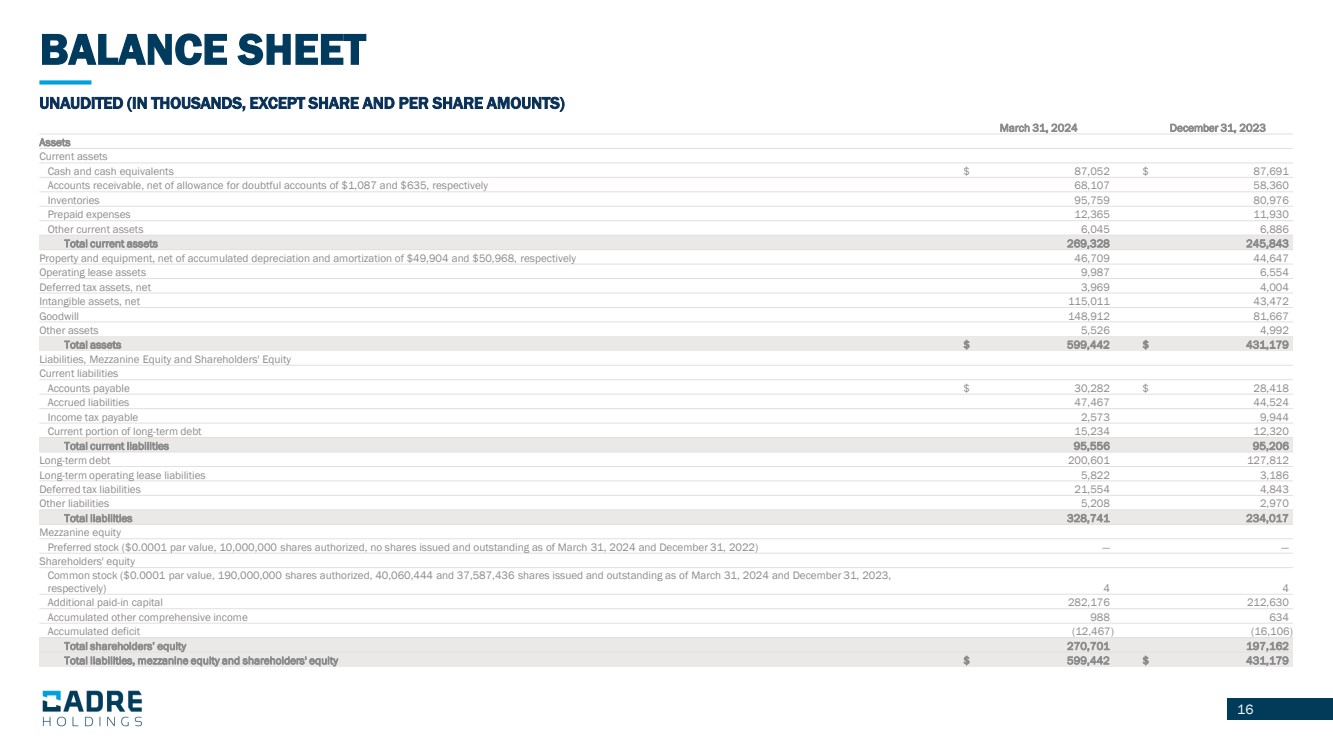
UNAUDITED (IN THOUSANDS, EXCEPT SHARE AND PER SHARE AMOUNTS)
March 31, 2024 December 31, 2023
Assets
Current assets
Cash and cash equivalents $ 87,052 $ 87,691
Accounts receivable, net of allowance for doubtful accounts of $1,087 and $635, respectively 68,107 58,360
Inventories 95,759 80,976
Prepaid expenses 12,365 11,930
Other current assets 6,045 6,886
Total current assets 269,328 245,843
Property and equipment, net of accumulated depreciation and amortization of $49,904 and $50,968, respectively 46,709 44,647
Operating lease assets 9,987 6,554
Deferred tax assets, net 3,969 4,004
Intangible assets, net 115,011 43,472
Goodwill 148,912 81,667
Other assets 5,526 4,992
Total assets $ 599,442 $ 431,179
Liabilities, Mezzanine Equity and Shareholders' Equity
Current liabilities
Accounts payable $ 30,282 $ 28,418
Accrued liabilities 47,467 44,524
Income tax payable 2,573 9,944
Current portion of long-term debt 15,234 12,320
Total current liabilities 95,556 95,206
Long-term debt 200,601 127,812
Long-term operating lease liabilities 5,822 3,186
Deferred tax liabilities 21,554 4,843
Other liabilities 5,208 2,970
Total liabilities 328,741 234,017
Mezzanine equity
Preferred stock ($0.0001 par value, 10,000,000 shares authorized, no shares issued and outstanding as of March 31, 2024 and December 31, 2022) — —
Shareholders' equity
Common stock ($0.0001 par value, 190,000,000 shares authorized, 40,060,444 and 37,587,436 shares issued and outstanding as of March 31, 2024 and December 31, 2023,
respectively) 4 4
Additional paid-in capital 282,176 212,630
Accumulated other comprehensive income 988 634
Accumulated deficit (12,467) (16,106)
Total shareholders’ equity 270,701 197,162
Total liabilities, mezzanine equity and shareholders' equity $ 599,442 $ 431,179 |