 US Market News
2週前
US Market News
2週前
Corporación América Airports S.A. Reports May 2026 Passenger TrafficJune 18, 2026 4:31 PM
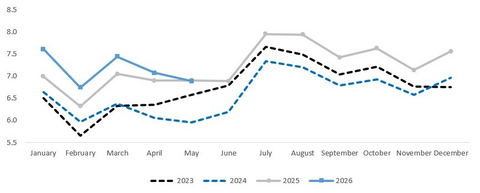
Business Wire Total passenger traffic broadly stable YoY International passenger traffic up 7.3% YoY; up 7.2% YoY in Argentina Corporación América Airports S.A. (NYSE: CAAP), (“CAAP” or the “Company”), one of the world’s leading private airport operators, reported today a 0.2% year-on-year (YoY) decrease in passenger traffic in May 2026. This press release features multimedia. View the full release here: https://www.businesswire.com/news/home/20260618355808/en/Monthly Passenger Traffic Performance (In million PAX) Passenger Traffic, Cargo Volume and Aircraft Movements Highlights (2026 vs. 2025) Statistics May'26 May'25 % Var. YTD’26 YTD’25 % Var. Domestic Passengers (thousands) 3,206 3,502 -8.5% 17,267 17,671 -2.3% International Passengers (thousands) 2,991 2,787 7.3% 14,850 13,366 11.1% Transit Passengers (thousands) 691 614 12.5% 3,646 3,132 16.4% Total Passengers (thousands) 6,888 6,903 -0.2% 35,762 34,169 4.7% Cargo Volume (thousand tons) 33 34 -2.7% 166 162 2.3% Total Aircraft Movements (thousands) 71 71 -1.1% 355 349 1.7% Passenger Traffic Overview Total passenger traffic decreased slightly by 0.2% in May compared to the same month in 2025. Domestic traffic declined by 8.5% year over year, primarily driven by lower traffic in Argentina. International traffic, meanwhile, increased by 7.3%, with all operating countries contributing positively on a year-over-year basis except Brazil. Growth was supported by mid- to high-single-digit increases in Uruguay, Argentina, Italy, and Ecuador, as well as double-digit growth in Armenia, despite traffic being partially affected by disruptions related to the conflict in Iran, which resulted in flight cancellations and airspace restrictions across the region. In Argentina, total passenger traffic decreased by 5.7% year over year in May, as growth in international traffic was more than offset by a decline in domestic traffic volumes. Domestic traffic declined by 12.2% year over year, mainly driven by reduced capacity at Flybondi, which operated only three aircraft during the month, and JetSMART, which experienced lower activity due to scheduled maintenance. This was partially offset by increased activity from Aerolíneas Argentinas. The top three domestic destinations were Córdoba, Mendoza and Iguazú. International traffic remained robust, increasing by 7.2% year over year, supported by strong performance at Córdoba Airport and increased capacity from LATAM Airlines, which recorded double-digit year-over-year growth. During May, Arajet announced a new Mendoza–Punta Cana route with three weekly frequencies, while Plus Ultra announced a new Madrid–Ezeiza route with two weekly frequencies, scheduled to commence operations on July 2. The top three international destinations in May were Santiago de Chile, São Paulo, and Madrid. In Italy, passenger traffic increased by 5.6% year over year, reflecting growth across both the international and domestic segments. International traffic, which represented more than 80% of total passenger volumes, grew by 6.6%, supported by strong demand at both airports, led by Pisa International Airport. Domestic traffic also expanded, rising by 1.3%, with positive contributions from both Pisa and Florence airports. In Brazil, total passenger traffic increased by 3.6% year over year. Domestic traffic, which accounted for almost 60% of total traffic, declined by 1.9% year over year, while transit passengers increased by a strong 14.7% year over year. Brasília International Airport continues to benefit from its position as a key secondary hub within the domestic network. In Uruguay, total passenger traffic, predominantly international, increased by 7.0% year over year. Among other developments, Azul Linhas Aéreas Brasileiras recently launched a new Montevideo–Belo Horizonte route, operating two weekly frequencies. In Ecuador, passenger traffic increased by 2.6% year over year despite ongoing security concerns. International traffic grew by 5.5%, reflecting strong demand on U.S. routes and increased frequencies operated by American Airlines, Avianca, and LATAM Airlines. Domestic traffic remained broadly stable, as elevated airfares continued to constrain travel demand. In Armenia, passenger traffic increased by a strong 12.7% year over year, despite disruptions related to the conflict in Iran, which resulted in flight cancellations and airspace restrictions across the region. However, the impact was more limited than initially expected, with traffic from Western and Eastern Europe, Asia, and Russia supporting overall growth. The new Wizz Air base at Zvartnots International Airport, launched in late 2025, continued to support connectivity with Europe. Cargo Volume and Aircraft Movements Cargo volume, decreased by 2.7% year over year, as growth in Argentina and Armenia was more than offset by declines in Italy, Ecuador, Uruguay, and Brazil. By country, performance was as follows: Argentina (+3.4%), Armenia (+0.6%), Brazil (-2.1%), Italy (-10.8%), Ecuador (-17.7%), and Uruguay (-18.9%). Argentina, Brazil, and Ecuador accounted for nearly 80% of total cargo volumes in May. Aircraft movements declined by 1.1% year over year, as positive contributions from Armenia, Italy, and Brazil were more than offset by declines in Ecuador, Argentina, and Uruguay. Performance by country was as follows: Armenia (+7.9%), Italy (+2.6%), Brazil (+2.2%), Uruguay (-0.8%), Argentina (-3.4%), and Ecuador (-4.4%). Argentina, Brazil, and Italy accounted for more than 80% of total aircraft movements in May. Summary Passenger Traffic, Cargo Volume and Aircraft Movements (2026 vs. 2025) May'26 May'25 % Var. YTD'26 YTD'25 % Var. Passenger Traffic (thousands) Argentina 3,340 3,540 -5.7% 19,823 19,366 2.4% Italy 1,034 979 5.6% 3,736 3,507 6.5% Brazil 1,405 1,357 3.6% 6,981 6,414 8.8% Uruguay 181 169 7.0% 1,046 1,013 3.2% Ecuador 401 390 2.6% 2,050 1,926 6.4% Armenia 527 468 12.7% 2,127 1,942 9.6% TOTAL 6,888 6,903 -0.2% 35,762 34,169 4.7% Cargo Volume (tons) Argentina 17,482 16,909 3.4% 88,957 84,103 5.8% Italy 955 1,071 -10.8% 4,416 5,344 -17.4% Brazil 5,434 5,553 -2.1% 25,703 26,158 -1.7% Uruguay 2,780 3,427 -18.9% 13,770 14,651 -6.0% Ecuador 2,815 3,420 -17.7% 13,973 15,439 -9.5% Armenia 3,233 3,216 0.6% 18,752 16,093 16.5% TOTAL 32,700 33,595 -2.7% 165,571 161,787 2.3% Aircraft Movements Argentina 35,975 37,259 -3.4% 196,791 195,577 0.6% Italy 9,225 8,995 2.6% 33,358 31,717 5.2% Brazil 12,884 12,602 2.2% 62,389 59,425 5.0% Uruguay 2,461 2,480 -0.8% 15,338 15,387 -0.3% Ecuador 6,108 6,390 -4.4% 31,296 32,020 -2.3% Armenia 3,885 3,600 7.9% 15,886 15,168 4.7% TOTAL 70,538 71,326 -1.1% 355,058 349,294 1.7% About Corporación América Airports Corporación América Airports acquires, develops and operates airport concessions. Currently, the Company operates 52 airports in 6 countries across Latin America and Europe (Argentina, Brazil, Uruguay, Ecuador, Armenia and Italy). In 2025, Corporación América Airports served 86.7 million passengers, 9.8% above the 79.0 million passengers served in 2024. The Company is listed on the New York Stock Exchange where it trades under the ticker “CAAP”. For more information, visit http://investors.corporacionamericaairports.com. View source version on businesswire.com: https://www.businesswire.com/news/home/20260618355808/en/ Investor Relations Contact
Patricio Iñaki Esnaola
Email: patricio.esnaola @robins Original: Corporación América Airports S.A. Reports May 2026 Passenger Traffic
US Market News
1月前
Corporación América Airports S.A. Reports April 2026 Passenger TrafficMay 20, 2026 4:31 PM
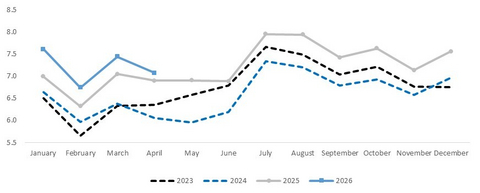
Business Wire Total passenger traffic up 2.6% YoY in April International passenger traffic up 7.6% YoY in April; up 8.6% YoY in Argentina Corporación América Airports S.A. (NYSE: CAAP), (“CAAP” or the “Company”), one of the world’s leading private airport operators, reported today a 2.6% year-on-year (YoY) increase in passenger traffic in April 2026. This press release features multimedia. View the full release here: https://www.businesswire.com/news/home/20260520446478/en/Monthly Passenger Traffic Performance (In million PAX) Passenger Traffic, Cargo Volume and Aircraft Movements Highlights (2026 vs. 2025) Statistics Apr'26 Apr'25 % Var. YTD’26 YTD’25 % Var. Domestic Passengers (thousands) 3,405 3,529 -3.5% 14,057 14,169 -0.8% International Passengers (thousands) 2,952 2,745 7.6% 11,859 10,579 12.1% Transit Passengers (thousands) 718 624 15.0% 2,955 2,518 17.4% Total Passengers (thousands) 7,075 6,898 2.6% 28,870 27,266 5.9% Cargo Volume (thousand tons) – Excl. Argentina1 15.3 15.1 1.3% 61.4 61.0 0.7% Total Aircraft Movements (thousands) 70.9 71.7 -1.1% 284.5 278.0 2.3% 1 In Argentina, cargo volume data remains under review to ensure consistency and accuracy. Passenger Traffic Overview Total passenger traffic increased by 2.6% in April compared to the same month in 2025. Domestic traffic decreased by 3.5% year over year, primarily driven by a decline in Argentina. International traffic, meanwhile, grew by 7.6%, with all operating countries contributing positively on a year-over-year basis except Brazil and Uruguay. This included high single-digit growth in Argentina, Italy, and Armenia, as well as double-digit growth in Ecuador. Traffic performance in Armenia during March and April was partially impacted by disruptions related to the conflict in Iran, which resulted in flight cancellations and airspace restrictions across the region. However, the impact was more limited than initially expected. In Argentina, total passenger traffic decreased slightly by 0.4% year over year in April, as growth in international traffic was more than offset by a decline in domestic traffic volumes. Domestic travel declined by 5.0% year over year, reflecting reduced capacity from Flybondi, partially offset by increased activity from Aerolíneas Argentinas and JetSMART. The top three domestic destinations were Iguazú, Córdoba, and Bariloche. International traffic remained robust, rising by 8.6% year over year, supported by double-digit growth in seat capacity, mainly driven by Central and North America. In fact, Argentina is the South American country with the highest growth in seat capacity for the first half of 2026. Outbound traffic was primarily supported by destinations within the region and the Caribbean, while the recovery in inbound traffic was mainly driven by routes from Brazil and the U.S./Canada. The top three international destinations in April were Santiago de Chile, São Paulo, and Rio de Janeiro. In Italy, passenger traffic increased by 6.4% year over year, driven by high single-digit growth in the international segment, partially offset by a slight decline in domestic traffic. International passenger traffic, which accounted for more than 80% of total traffic, rose by 8.0% year over year, reflecting solid performance at both Florence Airport and Pisa International Airport. Domestic passenger traffic declined slightly by 0.9% year over year, primarily due to lower volumes at Pisa airport, partially offset by modest growth at Florence airport. In Brazil, total passenger traffic increased by 5.1% year over year, reflecting improved traffic trends following a prolonged period of challenges in the aviation environment. Domestic traffic, which accounted for more than 50% of total traffic, declined slightly by 0.9% year over year, while transit passengers increased by a strong 18.1% year over year. Brasília International Airport continues to benefit from its position as a key secondary hub within the domestic network. In Uruguay, total passenger traffic, predominantly international, decreased by 1.1% year over year and was negatively impacted by the calendar shift of the Easter holidays. Among other developments, Azul Linhas Aéreas Brasileiras recently launched a new Montevideo–Belo Horizonte route, operating two weekly frequencies. In Ecuador, where security concerns persist, passenger traffic performed well, increasing by 8.0% year over year. International traffic rose by a strong 15.6% year over year, mainly supported by solid performance on routes to the U.S., driven by an increased number of frequencies operated by American Airlines, Avianca, and LATAM Airlines. Domestic traffic increased by 1.2% year over year, although high airfares continued to weigh on travel demand. In Armenia, passenger traffic increased by 8.7% year over year, despite disruptions related to the conflict in Iran, which resulted in flight cancellations and airspace restrictions across the region. However, the impact was more limited than initially expected, with traffic from Western and Eastern Europe, Asia, and Russia supporting overall growth. The new Wizz Air base at Zvartnots International Airport, launched in late 2025, continued to support connectivity with Europe. Cargo Volume and Aircraft Movements Cargo volume, excluding Argentina, increased by 1.3% year-over-year, driven by strong double-digit growth in Uruguay and mid-single-digit growth in Armenia, partially offset by declines in Italy, Ecuador, and Brazil. By country, performance was as follows: Uruguay (+28.4%), Armenia (+4.1%), Brazil (-3.6%), Ecuador (-8.1%), and Italy (-16.0%). In Argentina, cargo volume data remains under review to ensure consistency and accuracy. Aircraft movements declined by 1.1% YoY, as positive contributions from Italy, Brazil, Ecuador, and Armenia were more than offset by declines in Uruguay and Argentina. Performance by country was as follows: Italy (+4.9%), Brazil (+4.3%), Ecuador (+1.8%), Armenia (+0.9%), Argentina (-3.5%), and Uruguay (-16.5%). Argentina, Brazil, and Italy accounted for more than 80% of total aircraft movements in April. Summary Passenger Traffic, Cargo Volume and Aircraft Movements (2026 vs. 2025) Apr'26 Apr'25 % Var. YTD'26 YTD'25 % Var. Passenger Traffic (thousands) Argentina 3,643 3,658 -0.4% 16,479 15,826 4.1% Italy 956 899 6.4% 2,702 2,528 6.8% Brazil 1,399 1,331 5.1% 5,576 5,057 10.3% Uruguay 188 190 -1.1% 865 844 2.5% Ecuador 434 402 8.0% 1,649 1,536 7.4% Armenia 455 418 8.7% 1,600 1,474 8.6% TOTAL 7,075 6,898 2.6% 28,870 27,266 5.9% Cargo Volume (tons) Argentina1 u.r. 17,147 u.r. u.r. 67,194 u.r. Italy 882 1,050 -16.0% 3,460 4,274 -19.0% Brazil 5,134 5,328 -3.6% 20,269 20,605 -1.6% Uruguay 2,999 2,335 28.4% 10,990 11,224 -2.1% Ecuador 2,814 3,061 -8.1% 11,158 12,018 -7.2% Armenia 3,459 3,324 4.1% 15,519 12,877 20.5% TOTAL Excl Argentina 15,288 15,098 1.3% 61,396 60,998 0.7% 1 In Argentina, cargo volume data remains under review to ensure consistency and accuracy Aircraft Movements Argentina 37,541 38,891 -3.5% 160,758 158,318 1.5% Italy 8,345 7,955 4.9% 24,133 22,722 6.2% Brazil 12,762 12,240 4.3% 49,505 46,823 5.7% Uruguay 2,503 2,996 -16.5% 12,877 12,907 -0.2% Ecuador 6,501 6,387 1.8% 25,188 25,630 -1.7% Armenia 3,263 3,233 0.9% 12,001 11,568 3.7% TOTAL 70,915 71,702 -1.1% 284,462 277,968 2.3% About Corporación América Airports Corporación América Airports acquires, develops and operates airport concessions. Currently, the Company operates 52 airports in 6 countries across Latin America and Europe (Argentina, Brazil, Uruguay, Ecuador, Armenia and Italy). In 2025, Corporación América Airports served 86.7 million passengers, 9.8% above the 79.0 million passengers served in 2024. The Company is listed on the New York Stock Exchange where it trades under the ticker “CAAP”. For more information, visit http://investors.corporacionamericaairports.com. View source version on businesswire.com: https://www.businesswire.com/news/home/20260520446478/en/ Investor Relations Contact
Patricio Iñaki Esnaola
Email: patricio.esnaola @robins Original: Corporación América Airports S.A. Reports April 2026 Passenger Traffic
US Market News
2月前
Corporación América Airports S.A. Reports March 2026 Passenger TrafficApril 21, 2026 4:31 PM
Business Wire
Total passenger traffic up 5.5% YoY in March
International passenger traffic up 12.2% YoY in March; up 15.6% YoY in Argentina
Corporación América Airports S.A. (NYSE: CAAP), (“CAAP” or the “Company”), one of the world’s leading private airport operators, reported today a 5.5% year-on-year (YoY) increase in passenger traffic in March 2026.
This press release features multimedia. View the full release here: https://www.businesswire.com/news/home/20260421313653/en/Monthly Passenger Traffic Performance (In million PAX)
Passenger Traffic, Cargo Volume and Aircraft Movements Highlights (2026 vs. 2025)
Statistics
Mar'26
Mar'25
% Var.
YTD’26
YTD’25
% Var.
Domestic Passengers (thousands)
3,686
3,775
-2.4%
10,652
10,639
0.1%
International Passengers (thousands)
3,000
2,675
12.2%
8,907
7,835
13.7%
Transit Passengers (thousands)
755
601
25.6%
2,237
1,894
18.1%
Total Passengers (thousands)
7,441
7,051
5.5%
21,795
20,368
7.0%
Cargo Volume (thousand tons) – Excl. Argentina1
17.4
16.8
3.5%
46.1
45.9
0.5%
Total Aircraft Movements (thousands)
73.9
71.5
3.3%
213.5
206.3
3.5%
1 In Argentina, cargo volume data remains under review to ensure consistency and accuracy.
Passenger Traffic Overview
Total passenger traffic increased by 5.5% in March compared to the same month in 2025. Domestic traffic decreased by 2.4% YoY, mainly driven by a decline in Argentina, partially offset by YoY improvements in Brazil and Ecuador. International traffic, meanwhile, grew by 12.2%, with all operating countries contributing positively on a YoY basis except Brazil, including double-digit growth in Argentina, Italy, and Ecuador. March performance in Armenia was partially impacted by disruptions related to the conflict in Iran, which led to flight cancellations and airspace restrictions across the region.
In Argentina, total passenger traffic increased by 2.7% year-over-year in March, driven by strong international demand, which more than offset a decline in domestic traffic amid a tough comparison base following a strong 2025. Domestic traffic declined by 4.3% year-over-year, reflecting reduced capacity from Aerolíneas Argentinas and Flybondi, partially offset by increased activity from JetSMART. The top three domestic destinations were Bariloche, Iguazú, and Córdoba. International traffic remained robust, rising by 15.6% year-over-year, supported by low-cost carriers such as JetSMART, Flybondi, Copa, Arajet, and LEVEL. The top three international destinations in March were Rio de Janeiro, Santiago, and São Paulo.
In Italy, passenger traffic increased by 9.3% YoY, driven by double-digit growth in the international segment, partially offset by a decline in domestic traffic. International passenger traffic, which accounted for nearly 80% of total traffic, rose by 12.4% YoY, reflecting solid performance at both Florence and Pisa airports. Domestic passenger traffic declined slightly by 0.3% YoY, primarily due to lower volumes at Florence airport, partially offset by increases at Pisa airport.
In Brazil, total passenger traffic increased by 12.2% year-over-year, reflecting improved traffic trends following a sustained period of challenges in the aviation environment. Domestic traffic, which accounted for nearly 60% of total traffic, rose by 2.5% year-over-year, while transit passengers increased by a strong 29.9% year-over-year. Growth was also supported by a post-Carnival rebound in corporate demand, with Brasília benefiting from its position as a key secondary hub within the domestic network.
In Uruguay, total passenger traffic, predominantly international, increased by 7.6% year-over-year, following a strong summer season, including higher frequencies and the addition of temporary routes. Among other developments, Azul launched a new Montevideo–Belo Horizonte route, operating two weekly frequencies.
In Ecuador, where security concerns persist, passenger traffic performed well, increasing by 8.0% YoY. International traffic increased by 13.7% YoY, supported by strong performance on routes to Europe. Domestic traffic rose by 3.3% YoY, although high airfares continued to weigh on travel demand.
In Armenia, passenger traffic increased by 4.4% year-over-year, driven by the addition of new airlines and routes, as well as increased frequencies. Notably, in October 2025, Wizz Air established a new base at Yerevan’s Zvartnots Airport, deploying two aircraft and launching ten new direct routes to Europe. March performance was partially impacted by disruptions related to the conflict in Iran, which led to flight cancellations and airspace restrictions across the region.
Cargo Volume and Aircraft Movements
Cargo volume, excluding Argentina, increased by 3.5% year-over-year, driven by strong double-digit growth in Armenia and Brazil, which was partially offset by declines in Italy, Uruguay, and Ecuador. By country, performance was as follows: Armenia (+24.5%), Brazil (+18.6%), Uruguay (-16.8%), Ecuador (-14.6%), and Italy (-20.0%). In Argentina, cargo volume data remains under review to ensure consistency and accuracy.
Aircraft movements increased by 3.3% YoY, with positive contributions from all countries of operation except Ecuador, which recorded a slight decline. Performance by country was as follows: Italy (+11.8%), Brazil (+10.3%), Armenia (+1.3%), Argentina (+1.0%), Uruguay (+1.0%), and Ecuador (-0.3%). Argentina, Brazil, and Italy accounted for more than 80% of total aircraft movements in March.
Summary Passenger Traffic, Cargo Volume and Aircraft Movements (2026 vs. 2025)
Mar'26
Mar'25
% Var.
YTD'26
YTD'25
% Var.
Passenger Traffic (thousands)
Argentina
4,263
4,152
2.7%
12,835
12,168
5.5%
Italy
699
640
9.3%
1,746
1,630
7.1%
Brazil
1,427
1,272
12.2%
4,177
3,726
12.1%
Uruguay
218
203
7.6%
677
654
3.5%
Ecuador
450
417
8.0%
1,215
1,134
7.2%
Armenia
385
368
4.4%
1,145
1,055
8.5%
TOTAL
7,441
7,051
5.5%
21,795
20,368
7.0%
Cargo Volume (tons)
Argentina1
u.r.
17,558
u.r.
u.r.
50,047
u.r.
Italy
909
1,136
-20.0%
2,578
3,224
-20.0%
Brazil
6,557
5,530
18.6%
15,135
15,277
-0.9%
Uruguay
2,685
3,226
-16.8%
7,991
8,889
-10.1%
Ecuador
2,937
3,439
-14.6%
8,344
8,957
-6.8%
Armenia
4,262
3,425
24.5%
12,060
9,554
26.2%
TOTAL Excl Argentina
17,350
16,756
3.5%
46,109
45,900
0.5%
1 In Argentina, cargo volume data remains under review to ensure consistency and accuracy
Aircraft Movements
Argentina
41,785
41,370
1.0%
123,217
119,427
3.2%
Italy
6,331
5,662
11.8%
15,788
14,767
6.9%
Brazil
13,369
12,117
10.3%
36,743
34,583
6.2%
Uruguay
3,092
3,060
1.0%
10,374
9,911
4.7%
Ecuador
6,416
6,434
-0.3%
18,687
19,243
-2.9%
Armenia
2,863
2,826
1.3%
8,738
8,335
4.8%
TOTAL
73,856
71,469
3.3%
213,547
206,266
3.5%
About Corporación América Airports
Corporación América Airports acquires, develops and operates airport concessions. Currently, the Company operates 52 airports in 6 countries across Latin America and Europe (Argentina, Brazil, Uruguay, Ecuador, Armenia and Italy). In 2025, Corporación América Airports served 86.7 million passengers, 9.8% above the 79.0 million passengers served in 2024. The Company is listed on the New York Stock Exchange where it trades under the ticker “CAAP”. For more information, visit http://investors.corporacionamericaairports.com.
View source version on businesswire.com: https://www.businesswire.com/news/home/20260421313653/en/
Investor Relations Contact
Patricio Iñaki Esnaola
Email: patricio.esnaola@caairports.com
Phone: +5411 4899-6716
Original: Corporación América Airports S.A. Reports March 2026 Passenger Traffic
US Market News
4月前
Corporación América Airports S.A. Reports Fourth Quarter and Full Year 2025 ResultsMarch 17, 2026 7:30 AM
Business Wire
Solid traffic performance supported by record highs in Argentina, Armenia, Italy and Uruguay
Achieved double-digit YoY growth in Adjusted EBITDA ex-IFRIC with margin expanding 4.6pp, ex-one-off impacts
Maintained robust liquidity with $593 million in Cash & Cash Equivalents and Net Debt to LTM Adjusted EBITDA of 0.7x
Corporación América Airports S.A. (NYSE: CAAP), (“CAAP” or the “Company”) one of the leading private airport operators in the world, reported today its unaudited, consolidated results for the three-month period ended December 31, 2025, and audited results for the full year 2025. Financial results are expressed in millions of U.S. dollars and are prepared in accordance with International Financial Reporting Standards (IFRS) as issued by the International Accounting Standards Board (“IASB”).
Commencing 3Q18, the Company began reporting results of its Argentinean subsidiaries applying Hyperinflation Accounting, in accordance with IFRS rule IAS 29 (“IAS 29”), as detailed in Section “Hyperinflation Accounting in Argentina” on page 24.
Fourth Quarter 2025 Highlights
Consolidated Revenues ex-IFRIC12 reached $464.8 million, up 17.3% year-over-year (YoY), driven by increases of 17.4% and 16.3% in Aeronautical and Commercial revenues, respectively. Excluding rule IAS 29, consolidated revenues ex-IFRIC12 increased 16.7% YoY to $461.0 million.
Key operating metrics:
9.1% increase in passenger traffic to 22.3 million.
1.0% decrease in cargo volume to 117.1 thousand tons.
5.6% increase in aircraft movements to 225.5 thousand.
Operating Income of $128.0 million, compared with $108.4 million in 4Q24.
Adjusted EBITDA ex-IFRIC12 increased 39.8% to $210.7 million, from $150.8 million in the year-ago period. Excluding the impact of rule IAS 29, Adjusted EBITDA ex-IFRIC12 rose 38.6% to $208.5 million. Excluding one-offs in 4Q24 and 4Q25, Adjusted EBITDA ex-IFRIC12 rose 33.3%.
Adjusted EBITDA margin ex-IFRIC12 expanded 7.3 percentage points to 45.3% from 38.0% in 4Q24. Adjusting for rule IAS 29, Adjusted EBITDA margin ex-IFRIC12 increased to 45.2% from 38.1% in the prior-year quarter. Excluding one-offs, Adjusted EBITDA margin ex-IFRIC12 expanded by 4.6 percentage points.
Maintained strong liquidity position with $592.8 million in Cash & Cash equivalents as of December 31, 2025.
Net debt to LTM Adjusted EBITDA of 0.7x as of December 31, 2025, reflecting continued financial discipline and solid Adjusted EBITDA growth.
Full Year 2025 Highlights
Consolidated Revenues ex-IFRIC12 increased 8.4% YoY to $1,756.4 million, reflecting increases of 10.1% and 6.6% in Commercial and Aeronautical Revenues, respectively. Excluding rule IAS 29, consolidated revenues ex-IFRIC12 increased 16.5% YoY to $1,788.5 million.
Key operating metrics:
9.8% increase in passenger traffic to 86.7 million.
1.4% increase in cargo volume to 403.7 thousand tons.
6.4% increase in aircraft movements to 876.4 thousand.
Operating Income of $488.3 million, compared with $447.3 million in 2024.
Adjusted EBITDA ex-IFRIC12 increased 15.0% to $715.5 million, from $622.2 million in 2024. Excluding the impact of rule IAS 29, Adjusted EBITDA ex-IFRIC12 rose 25.6% to $730.0 million. Excluding one-offs in 4Q24 and 4Q25, Adjusted EBITDA ex-IFRIC12 rose 12.9%.
Adjusted EBITDA margin ex-IFRIC12 expanded 2.3 percentage points to 40.7% from 38.4% in 2024. Adjusting for rule IAS 29, Adjusted EBITDA margin ex-IFRIC12 increased to 40.8% from 37.9% in the prior year. Excluding one-offs, Adjusted EBITDA margin ex-IFRIC12 expanded by 1.5 percentage points.
Maintained strong liquidity position with $592.8 million in Cash & Cash equivalents as of December 31, 2025.
Net debt to LTM Adjusted EBITDA of 0.7x as of December 31, 2025, reflecting continued financial discipline and solid Adjusted EBITDA growth.
CEO Message
Commenting on the results for the quarter Mr. Martín Eurnekian, CEO of Corporación América Airports, noted: “We closed the year with a very strong fourth quarter, achieving record traffic for both the quarter and the full year, supported by broad-based growth across our network. Passenger traffic increased 9% year-over-year in the quarter, reaching full-year record levels in Argentina, Armenia, Italy and Uruguay, reflecting resilient demand and continued connectivity expansion. Revenue increased 17% year-over-year excluding construction services, once again outpacing traffic growth and driven by solid performance across both aeronautical and commercial revenues. This translated into meaningful operating leverage. Adjusted EBITDA excluding IFRIC 12 increased nearly 40% year-over-year, with reported margins expanding by more than 7 percentage points. Even excluding one-off impacts in both periods, Adjusted EBITDA margin improved 4.6 percentage points year-over-year, underscoring the structural improvement in our profitability profile.
Argentina delivered an outstanding performance, supported by double-digit international traffic growth and disciplined cost management, while Armenia continued to benefit from expanded connectivity and commercial initiatives. Across the portfolio, revenue per passenger and commercial execution remain central to strengthening the quality and resilience of our business.
We ended the year with one of the strongest balance sheets in our history. Net leverage declined to 0.7x, supported by Adjusted EBITDA growth, disciplined capital allocation and cash generation. Our liquidity position provides flexibility to fund committed investments and take advantage of future growth opportunities, while preserving financial discipline.
Strategically, recent developments further enhance the long-term visibility of our platform. In November, we signed an award agreement with the Government of Iraq to operate Baghdad International Airport, and in December, we were awarded the concession to operate Luanda’s new international airport in Angola, both of which offer attractive long-term growth fundamentals. On January 23, 2026, we secured an important milestone in Armenia, where our subsidiary entered into an amendment agreement with the Government of the Republic of Armenia. This amendment includes extending the concession by 35 years through 2067, committing to a $425 million investment program and establishing a clear investment and tariff framework, which created significant value. Shortly thereafter, on January 27, 2026, we executed an addendum to the Galápagos concession in Ecuador, rebalancing the agreement, restoring economic equilibrium and extending its term by six years. In addition, in January, Sociedad Aeroportuaria Kuntur Wasi S.A. received the payment related to the ICSID final arbitration award for the Chinchero concession in Peru, which had a positive impact of $32.5 million on our EBITDA in 4Q25. This outcome resolves a long-standing process and reinforces our commitment to defending our contractual rights while further strengthening our financial position.
As we enter 2026, our focus remains on disciplined execution and value creation, balancing traffic growth, commercial optimization, prudent capital investment and financial strength across our global network. We are also closely monitoring the evolving geopolitical situation in the Middle East and remain attentive to any potential implications for our operations and international travel.”
Operating & Financial Highlights
(In millions of U.S. dollars, unless otherwise noted)
4Q25 as
reported
4Q24 as
reported
% Var as
reported
IAS 29
4Q25
4Q25 ex
IAS 29
4Q24 ex
IAS 29
% Var ex
IAS 29
Passenger Traffic (Million Passengers)
22.3
20.5
9.1%
22.3
20.5
9.1%
Revenue
545.4
461.1
18.3%
1.3
544.1
461.6
17.9%
Aeronautical Revenues
248.4
211.6
17.4%
1.7
246.7
212.7
16.0%
Non-Aeronautical Revenues
297.0
249.5
19.0%
-0.5
297.5
248.9
19.5%
Revenue excluding construction service
464.8
396.2
17.3%
3.8
461.0
395.2
16.7%
Operating Income / (Loss)
128.0
108.4
18.1%
-27.9
156.0
134.7
15.7%
Operating Margin
23.5%
23.5%
-4
0.0%
28.6%
29.2%
-53
Net Income Attributable to Owners of the Parent
106.3
34.4
208.7%
-76.3
182.6
21.3
757.0%
Basic EPS (US$)
0.65
0.21
204.8%
-0.47
1.12
0.13
746.3%
Adjusted EBITDA
215.0
155.4
38.3%
2.2
212.8
155.1
37.2%
Adjusted EBITDA Margin
39.4%
33.7%
5.7pp
-
39.1%
33.6%
5.5pp
Adjusted EBITDA Margin excluding Construction Service
45.3%
38.0%
7.3pp
-
45.2%
38.1%
7.1pp
Net Debt to LTM Adjusted EBITDA
0.7x
1.1x
-
-
-
-
-
Net Debt to LTM Adjusted EBITDA excl. impairment on intangible assets (1)
0.7x
1.1x
-
-
-
-
-
Note: Figures in historical dollars (excluding IAS29) are included for comparison purposes.
1)
LTM Adjusted EBITDA excluding impairments of intangible assets.
Operating & Financial Highlights
(In millions of U.S. dollars, unless otherwise noted)
2025 as
reported
2024 as
reported
% Var as
reported
IAS 29
2025
2025 ex
IAS 29
2024 ex
IAS 29
% Var ex
IAS 29
Passenger Traffic (Million Passengers)
86.7
79.0
9.8%
86.7
79.0
9.8%
Revenue
1,962.1
1,843.3
6.4%
-41.5
2,003.6
1,749.2
14.5%
Aeronautical Revenues
934.7
876.7
6.6%
-20.6
955.3
828.9
15.3%
Non-Aeronautical Revenues
1,027.4
966.5
6.3%
-20.9
1,048.3
920.3
13.9%
Revenue excluding construction service
1,756.4
1,619.9
8.4%
-32.2
1,788.5
1,534.6
16.5%
Operating Income / (Loss)
488.3
447.3
9.2%
-131.6
619.9
506.5
22.4%
Operating Margin
24.9%
24.3%
62
-
30.9%
29.0%
198
Net (Loss) / Income Attributable to Owners of the Parent
247.7
282.7
-12.4%
-65.1
312.9
214.0
46.2%
EPS (US$)
1.53
1.76
-13.1%
-0.40
1.93
1.33
45.0%
Adjusted EBITDA
727.8
628.7
15.8%
-14.5
742.3
588.0
26.3%
Adjusted EBITDA Margin
37.1%
34.1%
3.0pp
-
37.0%
33.6%
3.4pp
Adjusted EBITDA Margin excluding Construction Service
40.7%
38.4%
2.3pp
-
40.8%
37.9%
2.9pp
Net Debt to LTM Adjusted EBITDA
0.7x
1.1x
-
-
-
-
-
Net Debt to LTM Adjusted EBITDA excl. impairment on intangible assets (1)
0.7x
1.1x
-
-
-
-
-
Note: Figures in historical dollars (excluding IAS29) are included for comparison purposes.
1)
LTM Adjusted EBITDA excluding impairments of intangible assets.
To obtain the full text of this earnings release and the earnings presentation, please click on the following link: http://investors.corporacionamericaairports.com/Results-Center
4Q25 EARNINGS CONFERENCE CALL
When:
09:00 a.m. Eastern Time, March 17, 2026
Who:
Mr. Martín Eurnekian, Chief Executive Officer
Mr. Jorge Arruda, Chief Financial Officer
Mr. Patricio Iñaki Esnaola, Head of Investor Relations
Dial-in:
1-800-549-8228 (North America, Toll Free); 1-289-819-1520 (Other locations); Conference ID: 11551
Webcast:
CAAP 4Q25 Earnings Conference Call
Replay:
1-888-660-6264 (North America, Toll Free); 1-289-819-1325 (Other locations); Playback Passcode: 11551 #
Use of Non-IFRS Financial Measures
This announcement includes certain references to Adjusted EBITDA, Adjusted EBITDA Margin, Adjusted EBITDA excluding Construction Service and Adjusted EBITDA Margin excluding Construction service, as well as Net Debt:
Adjusted EBITDA is defined as income for the period before financial income, financial loss, income tax expense, depreciation and amortization.
Adjusted EBITDA Margin is calculated by dividing Adjusted EBITDA by total revenues.
Adjusted EBITDA excluding Construction Service (“Adjusted EBITDA ex-IFRIC”) is defined as income for the period before construction services revenue and cost, financial income, financial loss, income tax expense, depreciation and amortization.
Adjusted EBITDA Margin excluding Construction Service (“Adjusted EBITDA Margin ex-IFRIC12”) excludes the effect of IFRIC 12 with respect to the construction or improvements to assets under the concession and is calculated by dividing Adjusted EBITDA excluding Construction Service revenue and cost, by total revenues less Construction service revenue.
Adjusted EBITDA, Adjusted EBITDA Margin, Adjusted EBITDA excluding Construction Service and Adjusted EBITDA Margin excluding Construction Service are not measures recognized under IFRS and should not be considered as an alternative to, or more meaningful than, consolidated net income for the year as determined in accordance with IFRS or as indicators of our operating performance from continuing operations. Accordingly, readers are cautioned not to place undue reliance on this information and should note that these measures as calculated by the Company, may differ materially from similarly titled measures reported by other companies. We believe that the presentation of Adjusted EBITDA and Adjusted EBITDA excluding Construction Service enhances an investor’s understanding of our performance and are useful for investors to assess our operating performance by excluding certain items that we believe are not representative of our core business. In addition, Adjusted EBITDA and Adjusted EBITDA excluding Construction Service are useful because they allow us to more effectively evaluate our operating performance and compare the results of our operations from period to period without regard to our financing methods, capital structure or income taxes and construction services (when applicable).
Net debt is calculated by deducting “Cash and cash equivalents” from total financial debt.
Figures ex-IAS 29 result from dividing nominal Argentine pesos for the Argentine Segment, by the average foreign exchange rate of the Argentine Peso against the US dollar in the period. Percentage variations ex-IAS 29 figures compare results as presented in the prior year quarter before IAS 29 came into effect, against ex-IAS 29 results for this quarter as described above. For comparison purposes, the impact of adopting IAS 29 in Aeropuertos Argentina 2000, the Company’s largest subsidiary in Argentina, is presented separately in each of the applicable sections of this earnings release, in a column denominated “IAS 29”. The impact from “Hyperinflation Accounting in Argentina” is described in more detail page 24 of this report.
Definitions and Concepts
Commercial Revenues: CAAP derives commercial revenue principally from fees resulting from warehouse usage (which includes cargo storage, stowage and warehouse services and related international cargo services), services and retail stores, duty free shops, car parking facilities, catering, hangar services, food and beverage services, retail stores, including royalties collected from retailers’ revenue, and rent of space, advertising, fuel, airport counters, VIP lounges and fees collected from other miscellaneous sources, such as telecommunications, car rentals and passenger services.
Construction Service revenue and cost: Investments related to improvements and upgrades to be performed in connection with concession agreements are treated under the intangible asset model established by IFRIC 12. As a result, all expenditures associated with investments required by the concession agreements are treated as revenue generating activities given that they ultimately provide future benefits, and subsequent improvements and upgrades made to the concession are recognized as intangible assets based on the principles of IFRIC 12. The revenue and expense are recognized as profit or loss when the expenditures are performed. The cost for such additions and improvements to concession assets is based on actual costs incurred by CAAP in the execution of the additions or improvements, considering the investment requirements in the concession agreements. Through bidding processes, the Company contracts third parties to carry out such construction or improvement services. The amount of revenues for these services is equal to the amount of costs incurred plus a reasonable margin, which is estimated at an average of 3.0% to 5.0%.
About Corporación América Airports
Corporación América Airports acquires, develops and operates airport concessions. Currently, the Company operates 52 airports in 6 countries across Latin America and Europe (Argentina, Brazil, Uruguay, Ecuador, Armenia and Italy). In 2025, Corporación América Airports served 86.7 million passengers, 9.8% above the 79.0 million passengers served in 2024. The Company is listed on the New York Stock Exchange where it trades under the ticker “CAAP”. For more information, visit http://investors.corporacionamericaairports.com.
Forward Looking Statements
Statements relating to our future plans, projections, events or prospects are forward-looking statements within the meaning of the Private Securities Litigation Reform Act of 1995. Forward-looking statements include all statements that are not historical facts and can be identified by terms such as “believes,” “continue,” “could,” “potential,” “remain,” “will,” “would” or similar expressions and the negatives of those terms. Forward-looking statements involve known and unknown risks, uncertainties and other factors that may cause our actual results, performance or achievements to be materially different from any future results, performance or achievements expressed or implied by the forward-looking statements. Many factors could cause our actual activities or results to differ materially from the activities and results anticipated in forward-looking statements, including, but not limited to: delays or unexpected casualties related to construction under our investment plan and master plans, our ability to generate or obtain the requisite capital to fully develop and operate our airports, general economic, political, demographic and business conditions in the geographic markets we serve, decreases in passenger traffic, changes in the fees we may charge under our concession agreements, inflation, depreciation and devaluation of the AR$, EUR, BRL, UYU or the AMD against the U.S. dollar, the early termination, revocation or failure to renew or extend any of our concession agreements, the right of the Argentine Government to buy out the AA2000 Concession Agreement, changes in our investment commitments or our ability to meet our obligations thereunder, existing and future governmental regulations, natural disaster-related losses which may not be fully insurable, terrorism in the international markets we serve, epidemics, pandemics and other public health crises and changes in interest rates or foreign exchange rates. The Company encourages you to review the ‘Cautionary Statement’ and the ‘Risk Factor’ sections of our annual report on Form 20-F for the year ended December 31, 2019 and any of CAAP’s other applicable filings with the Securities and Exchange Commission for additional information concerning factors that could cause those differences.
View source version on businesswire.com: https://www.businesswire.com/news/home/20260317703139/en/
Investor Relations Contact
Patricio Iñaki Esnaola
Email: patricio.esnaola@caairports.com
Phone: +5411 4899-6716
Original: Corporación América Airports S.A. Reports Fourth Quarter and Full Year 2025 Results
 Hot Features

 iHub News
4月前
iHub News
4月前
 ClayTrader
6年前
ClayTrader
6年前
 conix
8年前
conix
8年前
 T695
8年前
T695
8年前
 Ache Shoe Alley
8年前
Ache Shoe Alley
8年前

 メールアドレスで登録


