 US Market News
2月前
US Market News
2月前
Soluna Reports Q1'26 Results; Revenue Grows 58% Year-Over-Year and 4th Consecutive Quarter SequentiallyMay 18, 2026 7:30 AM
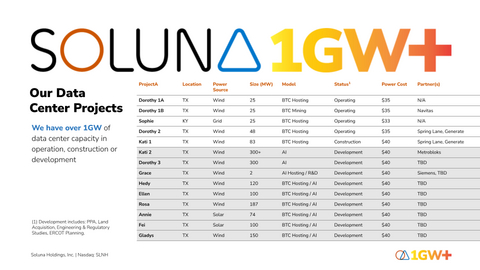
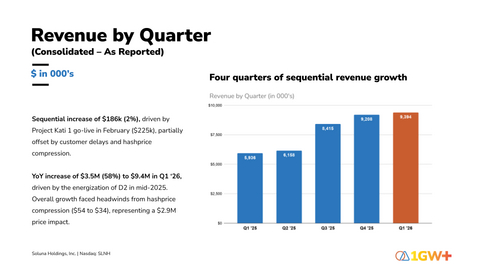
Business Wire Completes Kati 1A Ahead of Schedule, Advances Kati 2 AI JV Soluna Holdings, Inc. (“Soluna” or the “Company”) (NASDAQ: SLNH), a developer of green data centers for intensive computing applications, including Bitcoin mining and AI, announced its financial results for the first quarter ended March 31, 2026. This press release features multimedia. View the full release here: https://www.businesswire.com/news/home/20260518023353/en/Soluna Holdings, Inc. Reports Q1 2026 Revenue by Quarter “Our fourth consecutive quarter of sequential revenue growth and 58% year-over-year increase reflects the operating leverage we're building across the portfolio. With Kati 1 now contributing, Dorothy 1A back at full capacity, and Dorothy 2 fully ramped, we're entering the next phase of Soluna's growth from a position of operational strength,” said John Belizaire, CEO of Soluna Holdings. “Our AI expansion at Kati 2 is well underway, while Briscoe Wind now vertically integrates the power layer supporting Dorothy 3. Together with the full acquisition of Dorothy 1A, these milestones position Soluna for sustained growth and accelerating momentum,” Belizaire continued. Q1 2026 Operational and Corporate Highlights: Project Kati 1A Reaches Completion Ahead of Schedule – All three phases of Project Kati 1A, totaling 48 MW, reached completion ahead of schedule, supported by $10.9 million in project-level financing from Spring Lane Capital. Project Kati 2 Advances with AI Partnership – Soluna partnered with Metrobloks to unlock 100+ MW of AI and HPC capacity, secured 500+ acres of additional land, advanced Phase 1 to 30% schematic design, and began procurement of long-lead equipment for the up to 300 MW+ site. Project Dorothy 1A Fleet Upgrade Completed – Soluna completed a 20 MW fleet upgrade at Dorothy 1A, returning the site to full capacity and improving fleet-wide efficiency. Expanded Blockware Partnership at Project Dorothy 1A – Soluna expanded its hosting relationship with Blockware, adding 6 MW at Project Dorothy 1A, strengthening utilization at the site. Development Pipeline Surpasses 4.3 GW – Soluna's pipeline grew to 4.3 GW through new and expanded IPP partnerships, anchored by an AI-focused pipeline including Kati 2 (300 MW+), Dorothy 3 (300 MW+), and early-stage greenfield sites across the U.S. Michael Picchi Appointed Chief Financial Officer – Soluna appointed Michael Picchi as CFO, effective April 1, 2026. First Quarter Financial Highlights: Revenue increased sequentially for the fourth consecutive quarter from $9.2 million to $9.4 million. On a year-over-year basis, revenue increased 58%, driven by Dorothy 2 energization, Dorothy 1A revenue growth, and Kati 1 going live, partially offset by hashprice compression at Dorothy 1B. Net loss increased ($10.5 million) YoY to ($17.9 million), driven by higher equity compensation, interest, and financing expenses, partially offset by site-level operating improvement. EBITDA loss declined ($9.4 million) YoY to ($12.4 million) on the same drivers. After adjusting for stock-based compensation, SEPA commitment fees, and minor asset sale gains, Adjusted EBITDA loss fell modestly ($444 thousand) YoY to ($2.1 million). Revenue for the three months increased by 2% or $186 thousand from Q4 2025 to Q1 2026 – driven by Project Kati 1 going live in February and new Dorothy 1A customer additions, partially offset by an -18% hashprice decline ($42 to $34) on proprietary mining and profit share revenue. Q1 2026 Gross Profit increased sequentially from $1.8 million to $1.9 million, driven by higher hosting revenue, partially offset by higher site-level depreciation as Kati 1 assets were placed in service. Dorothy 1A, Dorothy 2, and Sophie delivered strong gross margins of 36%, 41%, and 37%, respectively. Dorothy 1B generated a (15%) gross margin loss, driven by hashprice compression. Kati 1 reported a $262 thousand loss in its first quarter of operations, reflecting ramp-up costs ahead of meaningful revenue. (Dollars in thousands) Three Months Ended
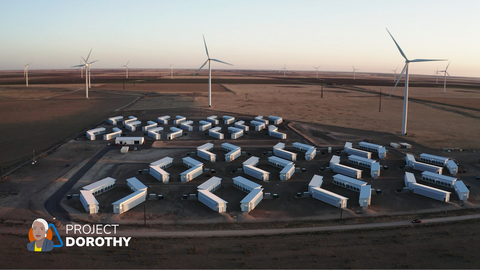
March 31, 2026 2025 Net loss $ (17,902 ) $ (7,354 ) Interest expense 1,481 838 Income tax benefit (624 ) (425 ) Depreciation and amortization 4,603 3,879 EBITDA (12,442 ) (3,062 ) Adjustments: Non-cash items Stock-based compensation costs 10,222 1,847 Gain on sale of fixed assets (32 ) — Right of first refusal amortization gain (90 ) — SEPA commitment fee 250 — Fair value adjustment loss — 118 Gain on debt extinguishment and revaluation, net — (551 ) Adjusted EBITDA $ (2,092 ) $ (1,648 ) Net loss for Q1 2026 increased $1 million sequentially to $17.9 million. However, adjusted EBITDA loss improved from Q4 2025 to Q1 2026 to ($2.1 million) – increased by $1.9M (47%) sequentially, driven by lower compensation and professional fee expenses alongside stable gross profit from Dorothy 2 and Kati 1. Adjusted EBITDA loss declined from Q1 2025 to Q1 2026 by ($444 thousand) – primarily due to non-recurring costs associated with legal and transaction costs from the Briscoe acquisition. Q1 2026 Revenue & Cost of Revenue by Project Site Soluna Digital (Dollars in thousands) Project Dorothy 1B Project Dorothy 1A Project Dorothy 2 Project Sophie Project Kati 1 Other Total Cryptocurrency mining revenue $ 2,169 $ — $ — $ — $ — $ — $ 2,169 Data hosting revenue 11 2,044 3,171 1,237 225 — 6,688 Demand response services 144 130 263 — — — 537 Total revenue 2,324 2,174 3,434 1,237 225 — 9,394 Cost of cryptocurrency mining, exclusive of depreciation 1,658 — — — — — 1,658 Cost of data hosting revenue, exclusive of depreciation 4 1,107 1,423 581 394 110 3,619 Cost of cryptocurrency mining revenue- depreciation 1,011 — — — — — 1,011 Cost of data hosting revenue- depreciation — 288 606 204 93 — 1,191 Total cost of revenue 2,673 1,395 2,029 785 487 110 7,479 Gross profit $ (349 ) $ 779 $ 1,405 $ 452 $ (262 ) $ (110 ) $ 1,915 Q1 2025 Revenue & Cost of Revenue by Project Site Soluna Digital Soluna Cloud (Dollars in thousands) Project Dorothy 1B Project Dorothy 1A Project Sophie Other Soluna Digital Subtotal Project Ada Total Cryptocurrency mining revenue $ 2,999 $ — $ — $ — $ 2,999 $ — $ 2,999 Data hosting revenue — 1,371 1,031 — 2,402 — 2,402 Demand response services 269 238 — — 507 — 507 High-performance computing services — — — — — 28 28 Total revenue 3,268 1,609 1,031 — 5,908 28 5,936 Cost of cryptocurrency mining, exclusive of depreciation 1,954 — — — 1,954 — 1,954 Cost of data hosting revenue, exclusive of depreciation — 885 372 70 1,327 — 1,327 Cost of high-performance computing service revenue — — — — — 7 7 Cost of cryptocurrency mining revenue- depreciation 1,074 — — — 1,074 — 1,074 Cost of data hosting revenue- depreciation — 295 106 — 401 — 401 Total cost of revenue 3,028 1,180 478 70 4,756 7 4,763 Gross (loss) profit $ 240 $ 429 $ 553 $ (70 ) $ 1,152 $ 21 $ 1,173 Subsequent Events: Acquired 150 MW Briscoe Wind Farm for $53 Million – Soluna acquired the Briscoe Wind Farm, achieving full vertical integration at Project Dorothy and securing the energy foundation for the planned 300 MW Dorothy 3 AI campus. Financed through $12.5 million from Generate Capital and cash on hand, the acquisition is projected to generate $6 million to $11 million in Year-One Adjusted EBITDA and $20.0 million to $24.4 million in annualized revenue. Acquired Full Equity of Project Dorothy 1A – On April 15, 2026, Soluna purchased 85.4% of the issued and outstanding Class B Membership Interests in the Dorothy 1A bitcoin mining project for $16.5 million, paid in two installments and partially funded by $12 million in unsecured debt. With this acquisition, Soluna now wholly owns Project Dorothy 1A. Project Kati 1B Underway – Cormint containers have arrived on-site with the first 12 MW phase installation now underway, advancing the buildout at the Kati complex. Launched Development for Dorothy 3 AI Campus – Soluna began marketing Project Dorothy 3, a planned 300+ MW AI/HPC campus adjacent to its Dorothy 1, Dorothy 2, and Briscoe Wind Farm assets near Silverton, Texas. The project represents the next phase of Soluna's vertically integrated renewable computing strategy. KPMG Named as Independent Auditor – Soluna appointed KPMG as its new independent registered public accounting firm. The unaudited financial statements and Quarterly Report on Form 10-Q for the three months ended March 31, 2026, filed with the U.S. Securities and Exchange Commission (“SEC”) on May 15, 2026, are available online. Our current Investor Presentation is available here. Soluna’s glossary of terms is available here. Safe Harbor Statement This announcement contains forward-looking statements. These statements are made under the "safe harbor" provisions of the U.S. Private Securities Litigation Reform Act of 1995. These forward-looking statements can be identified by terminology such as "will," "expects," "anticipates," "future," "intends," "plans," "believes," "estimates," "confident," and similar statements. Other examples of forward-looking statements may include, but are not limited to, (i) statements of Company's plans and objectives, including the deployment at Kati 2, (ii) statements of future economic performance, (iii) statements regarding financial projections of the Company, and (iv) statements of assumptions underlying other statements about the Company or its business. Soluna may also make written or oral forward-looking statements in its periodic reports to the SEC, in its annual report to shareholders, in press releases and other written materials, and in oral statements made by its officers, directors, or employees to third parties. Statements that are not historical facts, including but not limited to statements about Soluna’s beliefs and expectations, are forward-looking statements. Forward-looking statements involve inherent risks and uncertainties, further information regarding which is included in the Company's filings with the SEC. All information provided in this press release is as of the date of the press release, and Soluna undertakes no duty to update such information, except as required under applicable law. Non-GAAP Measures In addition to figures prepared in accordance with generally accepted accounting principles (“GAAP”), Soluna from time to time may present alternative non-GAAP performance measures, e.g., EBITDA, adjusted EBITDA, adjusted net profit/loss, adjusted earnings per share, free cash flow, both on a company basis and on a project-level basis, among others. EBITDA is defined as earnings before interest, taxes, and depreciation and amortization. Adjusted EBITDA is defined as EBITDA adjusted for stock-based compensation costs, gain on sale of fixed assets and right of first refusal amortization, SEPA commitment fee, fair value adjustment loss, and gain on debt extinguishment and revaluation, net. Project-level measures may not take into account a full allocation of corporate expenses. These measures should be considered in addition to, but not as a substitute for, the information prepared in accordance with GAAP. Alternative performance measures are not subject to GAAP or any other generally accepted accounting principles. Other companies may define these terms in different ways. See our annual report on Form 10-K for the year ended December 31, 2025, for an explanation of how management uses these measures in evaluating its operations. Investors should review the non-GAAP reconciliations provided above and not rely on any single financial measure to evaluate the Company’s business. About Soluna Holdings, Inc. (Nasdaq: SLNH) Soluna is on a mission to make renewable energy a global superpower using computing as a catalyst. The company designs, develops, and operates digital infrastructure that transforms surplus renewable energy into global computing resources. Soluna’s pioneering data centers are strategically co-located with wind, solar, or hydroelectric power plants to support high-performance computing applications, including Bitcoin Mining, Generative AI, and other compute-intensive applications. Soluna’s proprietary software MaestroOS(™) helps energize a greener grid while delivering cost-effective and sustainable computing solutions and superior returns. To learn more, visit solunacomputing.com and follow us on: LinkedIn: https://www.linkedin.com/company/solunaholdings/
X (formerly Twitter): x.com/solunaholdings
YouTube: youtube.com/c/solunacomputing
Newsletter: bit.ly/solunasubscribe
Resource Center: solunacomputing.com/resources Soluna regularly posts important information on its website and encourages investors and potential investors to consult the Soluna investor relations and investor resources sections of its website regularly. Soluna Holdings, Inc. and Subsidiaries Condensed Consolidated Balance Sheets As of March 31, 2026 (Unaudited) and December 31, 2025 (Dollars in thousands, except per share) March 31, 2026 December 31, 2025 Assets Current Assets: Cash $ 68,572 $ 76,423 Restricted cash 9,493 4,500 Accounts receivable, net (allowance for expected credit losses of $0 at March 31, 2026 and $244 at December 31, 2025) 5,456 5,522 Prepaid expenses and other current assets 4,178 2,664 Loan commitment assets 3,018 3,018 Total Current Assets 90,717 92,127 Restricted cash, noncurrent 7,920 7,920 Other assets 963 978 Deposits and credits on equipment 3,333 1,377 Property, plant and equipment, net 79,516 74,783 Intangible assets, net 5,932 8,261 Operating lease right-of-use assets 244 252 Financing lease right-of-use assets 1,795 2,246 Total Assets $ 190,420 $ 187,944 Liabilities and Equity Current Liabilities: Accounts payable $ 4,218 $ 4,859 Accrued liabilities 15,568 13,182 Accrued interest payable 346 303 Contract termination liability 19,348 19,348 Current portion of debt 10,041 8,858 Income tax payable 129 123 Deferred revenue 537 518 Customer deposits- current 1,640 1,913 Operating lease liability 62 65 Financing lease liability 22 20 Total Current Liabilities 51,911 49,189 Other liabilities 946 743 Customer deposits- long-term 3,061 2,533 Long-term debt 15,910 17,899 Operating lease liability 182 187 Financing lease liability 1,775 2,236 Deferred tax liability, net 2,279 2,911 Total Liabilities 76,064 75,698 Commitments and Contingencies (Note 10) Mezzanine Equity: Placement agent warrants 1,313 1,313 Equity: 9.0% Series A Cumulative Perpetual Preferred Stock, par value $0.001 per share, $25.00 liquidation preference; authorized 6,040,000; 4,920,045 shares issued and outstanding as of March 31, 2026 and 4,928,545 shares issued and outstanding as of December 31, 2025 5 5 Series B Preferred Stock, par value $0.0001 per share, authorized 187,500; 57,190 shares issued and outstanding as of March 31, 2026 and 62,500 shares issued and outstanding as of December 31, 2025 — — Common stock, par value $0.001 per share, authorized 375,000,000; 111,803,635 shares issued and 111,717,040 shares outstanding as of March 31, 2026 and 102,617,684 shares issued and 102,531,089 shares outstanding as of December 31, 2025 112 103 Additional paid-in capital 446,183 435,030 Accumulated deficit (385,181 ) (367,715 ) Common stock in treasury, at cost, 86,595 shares at March 31, 2026 and December 31, 2025 (13,873 ) (13,873 ) Total Soluna Holdings, Inc. Stockholders’ Equity (Deficit) 47,246 53,550 Non-Controlling Interest 65,797 57,383 Total Equity 113,043 110,933 Total Liabilities, Mezzanine Equity, and Equity $ 190,420 $ 187,944 The accompanying notes are an integral part of these unaudited condensed consolidated financial statements. Soluna Holdings, Inc. and Subsidiaries Condensed Consolidated Statements of Operations (Unaudited) For the Three Months Ended March 31, 2026 and 2025 (Dollars in thousands, except per share) Three Months Ended
March 31, 2026 2025 Cryptocurrency mining revenue $ 2,169 $ 2,999 Data hosting revenue 6,688 2,402 Demand response service revenue 537 507 High-performance computing service revenue — 28 Total revenue 9,394 5,936 Operating costs: Cost of cryptocurrency mining revenue, exclusive of depreciation 1,658 1,954 Cost of data hosting revenue, exclusive of depreciation 3,619 1,327 Cost of high-performance computing services — 7 Cost of cryptocurrency mining revenue- depreciation 1,011 1,074 Cost of data hosting revenue- depreciation 1,191 401 Total costs of revenue 7,479 4,763 Operating expenses: General and administrative expenses, exclusive of depreciation and amortization 16,140 5,946 Depreciation and amortization associated with general and administrative expenses 2,401 2,404 Total general and administrative expenses 18,541 8,350 Operating loss (16,626 ) (7,177 ) Interest expense (1,481 ) (838 ) Gain on debt extinguishment and revaluation, net — 551 Gain on sale of fixed assets 32 — Fair value adjustment loss — (118 ) Other financing expense (564 ) (201 ) Other income, net 113 4 Loss before income taxes (18,526 ) (7,779 ) Income tax benefit, net 624 425 Net loss (17,902 ) (7,354 ) (Less) Net loss (income) attributable to non-controlling interest 436 (202 ) Net loss attributable to Soluna Holdings, Inc. $ (17,466 ) $ (7,556 ) Basic and Diluted loss per common share: Basic & Diluted loss per share $ (0.24 ) $ (1.21 ) Weighted average shares outstanding (Basic and Diluted) 84,101,320 8,719,351 The accompanying notes are an integral part of these unaudited condensed consolidated financial statements. Soluna Holdings, Inc. and Subsidiaries Condensed Consolidated Statements of Cash Flows (Unaudited) For the Three Months Ended March 31, 2026 and 2025 Three Months Ended March 31, (Dollars in thousands) 2026 2025 Operating Activities Net loss $ (17,902 ) $ (7,354 ) Adjustments to reconcile net loss to net cash used in operating activities: Depreciation expense 2,229 1,506 Amortization expense 2,374 2,373 Stock-based compensation 10,222 1,847 Deferred income taxes (632 ) (437 ) Right of first refusal amortization gain (90 ) — Amortization of operating and finance lease asset 56 15 Gain on debt extinguishment and revaluation, net — (551 ) Amortization of deferred financing costs and discount on notes 436 153 Fair value adjustments, including SEPA — 118 SEPA commitment cost 250 — Gain on sale of fixed assets (32 ) — Changes in operating assets and liabilities: Accounts receivable 66 329 Prepaid expenses and other current assets (1,514 ) (197 ) Other long-term assets — 1,606 Accounts payable (2,085 ) 481 Contract termination liability — (667 ) Deferred revenue 161 — Operating lease liabilities (8 ) (15 ) Other liabilities and customer deposits 406 374 Accrued liabilities and interest payable (309 ) 242 Net cash used in operating activities (6,372 ) (177 ) Investing Activities Purchases of property, plant, and equipment (2,565 ) (3,534 ) Purchases of intangible assets (45 ) (45 ) Proceeds from sale of property, plant, and equipment 32 — Deposits on equipment (3,646 ) (61 ) Net cash used in investing activities (6,224 ) (3,640 ) Financing Activities Proceeds from common stock warrant exercises 8 — Proceeds from sale of common stock on SEPA — 2,005 Proceeds from notes — 5,000 Payments on notes and deferred financing costs (1,001 ) (1,978 ) Payments on financing lease liabilities (56 ) — Contributions from non-controlling interest 10,918 4,310 Distributions to non-controlling interest (131 ) (1,525 ) Net cash provided by financing activities 9,738 7,812 (Decrease) increase in cash & restricted cash (2,858 ) 3,995 Cash & restricted cash – beginning of period 88,843 10,453 Cash & restricted cash – end of period $ 85,985 $ 14,448 Supplemental Disclosure of Cash Flow Information Interest paid on debt 892 285 Construction in progress included in accounts payable and accrued liabilities 2,707 — Noncash deferred financing cost accrual — 97 Noncash membership distribution accrual 1,937 949 Warrant adjustment 682 — Noncash activity right-of-use assets adjustment 430 — The accompanying notes are an integral part of these unaudited condensed consolidated financial statements. Segments: The following table details revenue, cost of revenues, and other operating costs for the Company’s reportable segments for three months ended March 31, 2026 and 2025, and reconciles to net loss on the consolidated statements of operations: For the three months ended March 31, 2026 Cryptocurrency Mining Data Center Hosting High- Performance Computing Services Total Segment Revenue: Revenue from external customers $ 2,169 $ 6,688 $ — $ 8,857 Reconciliation of revenue Demand response service revenue (a) 537 Total consolidated revenue 9,394 Less: Segment cost of revenue Utility costs 1,132 1,792 — 2,924 Wages, benefits, and employee related costs 243 962 — 1,205 Facilities and Equipment costs 228 674 — 902 Cost of revenue- depreciation 1,011 1,191 — 2,202 Other cost of revenue* 119 508 — 627 Total segment cost of revenue 2,733 5,127 — 7,860 General and administrative expenses 44 462 506 Segment operating (loss) income $ (608 ) $ 1,099 $ — $ 491 For the three months ended March 31, 2025 Cryptocurrency Mining Data Center Hosting High- Performance Computing Services Total Segment Revenue: Revenue from external customers $ 2,999 2,402 $ 28 $ 5,429 Reconciliation of revenue Demand response service revenue (a) 507 5,936 Less: Segment cost of revenue Utility costs 1,412 389 — 1,801 Wages, benefits, and employee related costs 219 470 7 696 Facilities and Equipment costs 207 365 — 572 Cost of revenue- depreciation 1,074 401 — 1,475 Other cost of revenue* 140 144 — 284 Total segment cost of revenue 3,052 1,769 7 4,828 General and administrative expenses 14 90 159 263 Segment operating (loss) income $ (67 ) $ 543 $ (138 ) $ 338 (a) Demand response service revenue is included as a reconciling item of total revenue and not included as part of segment gross profit or loss. * Other cost of revenue includes insurance, outside service costs and margins, and general costs. The following table presents the reconciliation of segment operating income to net loss before taxes: For the three months ended March 31, 2026 2025 Segment operating income (loss) $ 491 $ 338 Reconciling Items: Elimination of intercompany costs 381 65 Other revenue (a) 537 507 General and administrative, exclusive of depreciation and amortization (b) (15,634 ) (5,683 ) General and administrative, depreciation and amortization (2,401 ) (2,404 ) Interest expense (1,481 ) (838 ) Gain on debt extinguishment and revaluation, net — 551 Other financing expense (564 ) (201 ) Gain on sale of fixed assets 32 — Fair value adjustment loss — (118 ) Other income, net 113 4 Net loss before taxes $ (18,526 ) $ (7,779 ) (a) Demand response service revenue is included as a reconciling item of total revenue and not included as part of segment gross profit or loss. (b) The reconciling general and administrative expense, exclusive of depreciation and amortization represent corporate and unallocated general and administrative expenses for the three months ended March 31, 2026 and 2025. Gross Profit breakout: The following table summarizes the balances for the project sites for cryptocurrency mining revenue, data hosting revenue, high-performance computing service revenue, demand response revenue, cost of cryptocurrency mining revenue, exclusive of depreciation, cost of data hosting revenue, exclusive of depreciation, cost of high-performance computing services, and cost of depreciation during the three months ended March 31, 2026: Soluna Digital (Dollars in thousands) Project Dorothy 1B Project Dorothy 1A Project Dorothy 2 Project Sophie Project Kati 1 Other Total Cryptocurrency mining revenue $ 2,169 $ — $ — $ — $ — $ — $ 2,169 Data hosting revenue 11 2,044 3,171 1,237 225 — 6,688 Demand response services 144 130 263 — — — 537 Total revenue 2,324 2,174 3,434 1,237 225 — 9,394 Cost of cryptocurrency mining, exclusive of depreciation 1,658 — — — — — 1,658 Cost of data hosting revenue, exclusive of depreciation 4 1,107 1,423 581 394 110 3,619 Cost of cryptocurrency mining revenue- depreciation 1,011 — — — — — 1,011 Cost of data hosting revenue- depreciation — 288 606 204 93 — 1,191 Total cost of revenue 2,673 1,395 2,029 785 487 110 7,479 Gross profit $ (349 ) $ 779 $ 1,405 $ 452 $ (262 ) $ (110 ) $ 1,915 The following table summarizes the balances for the project sites for cryptocurrency mining revenue, data hosting revenue, high-performance computing service revenue, demand response revenue, cost of cryptocurrency mining revenue, exclusive of depreciation, cost of data hosting revenue, exclusive of depreciation, cost of high-performance computing services, and cost of depreciation during the three months ended March 31, 2025: Soluna Digital Soluna Cloud (Dollars in thousands) Project Dorothy 1B Project Dorothy 1A Project Sophie Other Soluna Digital Subtotal Project Ada Total Cryptocurrency mining revenue $ 2,999 $ — $ — $ — $ 2,999 $ — $ 2,999 Data hosting revenue — 1,371 1,031 — 2,402 — 2,402 Demand response services 269 238 — — 507 — 507 High-performance computing services — — — — — 28 28 Total revenue 3,268 1,609 1,031 — 5,908 28 5,936 Cost of cryptocurrency mining, exclusive of depreciation 1,954 — — — 1,954 — 1,954 Cost of data hosting revenue, exclusive of depreciation — 885 372 70 1,327 — 1,327 Cost of high-performance computing service revenue — — — — — 7 7 Cost of cryptocurrency mining revenue- depreciation 1,074 — — — 1,074 — 1,074 Cost of data hosting revenue- depreciation — 295 106 — 401 — 401 Total cost of revenue 3,028 1,180 478 70 4,756 7 4,763 Gross (loss) profit $ 240 $ 429 $ 553 $ (70 ) $ 1,152 $ 21 $ 1,173 EBITDA and Adjusted EBITDA Tables: Reconciliations of EBITDA and Adjusted EBITDA to net loss, the most comparable GAAP financial metric, for historical periods are presented in the table below: (Dollars in thousands) Three Months Ended
March 31, 2026 2025 Net loss $ (17,902 ) $ (7,354 ) Interest expense 1,481 838 Income tax benefit (624 ) (425 ) Depreciation and amortization 4,603 3,879 EBITDA (12,442 ) (3,062 ) Adjustments: Non-cash items Stock-based compensation costs 10,222 1,847 Gain on sale of fixed assets (32 ) — Right of first refusal amortization gain (90 ) — SEPA commitment fee 250 — Fair value adjustment loss — 118 Gain on debt extinguishment and revaluation, net — (551 ) Adjusted EBITDA $ (2,092 ) $ (1,648 ) The following table represents the Adjusted EBITDA activity between each three-month period from January 1, 2025 through December 31, 2025. (Dollars in thousands) Three months
ended
March 31, 2025 Three months
ended
June 30, 2025 Three months
ended
September 30, 2025 Three months
ended
December 31, 2025 Net loss $ (7,354 ) $ (7,780 ) $ (25,787 ) $ (16,070 ) Interest expense, net 838 1,196 1,212 1,589 Income tax benefit (425 ) (608 ) (666 ) (617 ) Depreciation and amortization 3,879 3,989 4,119 4,358 EBITDA (3,062 ) (3,203 ) (21,122 ) (10,740 ) Adjustments: Non-cash items Stock-based compensation costs 1,847 1,942 1,882 4,895 Loss on sale of fixed assets and credit on equipment deposits — 22 780 349 Fair value on placement agent warrant and financing fees — — 146 — Fair value adjustment loss 118 — 22,047 1,516 Impairment on fixed assets — 12 — — Gain on debt extinguishment and revaluation, net (551 ) — (10,107 ) — Adjusted EBITDA $ (1,648 ) $ (1,227 ) $ (6,374 ) $ (3,980 ) View source version on businesswire.com: https://www.businesswire.com/news/home/20260518023353/en/ Contact Information
Investor Relations
Soluna Holdings, Inc.
ir@soluna.io Original: Soluna Reports Q1'26 Results; Revenue Grows 58% Year-Over-Year and 4th Consecutive Quarter Sequentially
US Market News
3月前
Soluna Reports Record 2025 Growth: Pipeline Hits 4.3GW, Raises $142 Million, and Launches AI InfrastructureMarch 30, 2026 7:30 AM
Business Wire
Strong Capital Formation, Expanded Operations Position Company for an Accelerated 2026 Despite Q4 Hashprice Headwinds
Soluna Holdings, Inc. (“Soluna Holdings” or the “Company”) (NASDAQ: SLNH), a developer of green data centers for intensive computing applications, including Bitcoin mining and AI, announced financial results for the full year ended December 31, 2025.
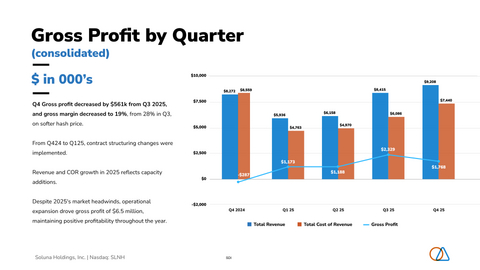
This press release features multimedia. View the full release here: https://www.businesswire.com/news/home/20260330987013/en/Soluna Reports 2025 Gross Profit by Quarter
“2025 was a transformational year for Soluna. We doubled our operating capacity, grew our power pipeline to 4.3GW, added two new project-level capital partners, and launched our AI infrastructure initiative — all while building a strong balance sheet to fund our next phase of growth,” said John Belizaire, CEO of Soluna Holdings.
“The completion of Dorothy 2, the commissioning of Kati 1, and our co-development partnership for Kati 2 are clear proof points of our ability to execute. We enter 2026 as Soluna 2.0 with significant momentum and a platform built to scale,” continued John Belizaire.
2025 Operational and Corporate Highlights:
Surpassed 1 GW of Renewable-Powered Computing – With the addition of Projects Gladys and Fei in August, Soluna crossed 1 GW of renewable-powered computing in operation, construction, and development, a notable milestone reflecting the scalability of its behind-the-meter model.
Dorothy 2 Completed, Powered Up, and Operational – We completed and fully energized Project Dorothy 2 (48MW) in November 2025, enhancing the profitability and operational efficiency of our operating data centers, while diversifying our customer mix and improving overall customer satisfaction. Dorothy 2 is now fully marketed and contracted.
Construction of Kati 1 started in the third quarter of 2025 – In February 2026, we received approval from ERCOT to commence the initial energization and phased commissioning of Project Kati 1. We expect to begin generating revenue from this 83MW facility as capacity is ramped up throughout the first half of 2026.
Kati 2 AI Development Underway — Soluna is advancing Project Kati 2 in Texas as a planned AI and HPC data center campus. In 2025, the Company signed an MOU with Metrobloks for an initial 100+ MW critical IT development, with a roadmap to expand to over 300 MW.
Power Pipeline Grows to 4.3+ GW — The long-term power pipeline expanded to 4.3+ GW, driven by new curtailment assessments, active term sheet discussions, and launches of six new development-stage projects, positioning Soluna as a scalable infrastructure platform.
“Our 2025 financial results reflect the significant investment we made in building the foundation for long-term growth. We raised approximately $142 million in capital, grew our total cash position by 750% to $88.8 million, and added two new project-level financing partners,” said David Michaels, interim CFO of Soluna Holdings.
“While Bitcoin headwinds negatively impacted revenue, our balance sheet strengthened. Our current ratio improved to 1.9x, and we are well-capitalized to execute on our pipeline development and AI infrastructure initiatives heading into 2026,” continued David Michaels.
Fourth Quarter 2025 Financial Results
Revenue in Q4 2025 grew sequentially from Q3 – it grew by 9% from $8.4 million to $9.2 million on volume growth from operational expansion, offset by headwinds on lower hashprice.
Q4 2025 gross profit decreased sequentially from $2.3 million to $1.8 million – driven by a softening of hashprice due to the challenging Bitcoin environment offset, in part, by an increase in volume from completing Dorothy 2.
Stronger liquidity position in Q4 2025 – Total cash grew $28.4 million (47%) from $60.5 million in Q3 to $88.8 million in Q4 from equity raises, further bolstering our reserves for future investment opportunities.
Fiscal Year 2025 Financial Results:
Significant Capital Formation in 2025 – totaling ~$142 million from debt issuances, SEPA draws, RDOs, and ATM transactions. We added two new project-level financing partners: Generate Capital ($17M) and Galaxy Digital, LLC ($5M). Spring Lane Capital ($30M) continues its support of our data center projects. The Generate Credit Facility is Soluna’s largest and most strategically significant financing arrangement to date, providing up to $100M of scalable, project-level capital to fund construction across the pipeline.
Outstanding Unrestricted Cash Growth – Unrestricted cash reached $76 million at the end of FY 2025. Total cash increased 750% from $10.5 million to $88.8 million. The significant cash infusion enabled us to expand our pipeline, optimize our current Bitcoin assets, and initiate a launch into AI.
PP&E growth reflects project investments – Our net PP&E increased from $47.3 million to $74.8 million (+58%) in 2025, echoing the current development of our pipeline projects. For example, the energization of D2 has doubled the capacity at our Dorothy campus, and construction of Kati 1 is currently underway.
Revenue negatively impacted by Bitcoin hashprice – 2025 Revenue declined by -21.8%, to $29.7 million, compared to $38.0 million in 2024 (~$6 million was directly related to hash price impacting prop mining; with ~$2 million indirectly related to hashprice from contract mix). Hashprice declined 30.8% in 2025, from $54.45 at the start of the year to $37.68 at the end.
2025 Cost of Revenue, including electricity, overhead, and depreciation, decreased by $5.4 million from $28.6 million to $23.3 million – driven by the termination of the HPE contract, which accounted for $5.7 million in year-over-year savings. Power costs decreased by approximately $2 million. These savings were partially offset by an $0.8 million increase in personnel and overhead expenses, reflecting our ongoing operational expansion.
2025 Gross Profit declined – The $2.9 million decline in gross profit in 2025 was primarily driven by weaker hashprice. Capacity expanded significantly following the completion of the Dorothy 2 facility. While gross margin dropped from 25% in 2024 to 22% in 2025, primarily due to a softening of hashprice in late 2025, our core operations continued to generate positive gross margins despite the hashprice environment, resulting in gross profit of $6.5 million and maintaining positive profitability throughout the year.
SG&A Spend for Growth – SG&A increased $11.9 million year-over-year, with spending strategically directed toward future growth. The increase was driven by $5.2 million in stock-based compensation, $4.3 million in people costs, $1.7 million in legal fees related to Project Kati financing, and $0.7 million for enhancing our investor relations engagement and business development.
FY 2025 Revenue & Cost of Revenue by Project Site
Soluna Digital
Soluna Cloud
(Dollars in thousands)
Project Dorothy 1B
Project Dorothy 1A
Project Dorothy 2
Project Sophie
Other
Soluna Digital Subtotal
Project Ada
Total
Cryptocurrency mining revenue
$
11,406
–
–
–
–
$
11,406
–
$
11,406
Data hosting revenue
–
6,176
5,662
5,160
-
16,998
-
16,998
High-performance computing services
–
–
–
–
–
–
28
28
Demand response services
561
579
145
–
–
1,285
–
1,285
Total revenue
$
11,967
$
6,755
$
5,807
$
5,160
-
$
29,689
$
28
$
29,717
Cost of cryptocurrency mining, exclusive of depreciation
$
7,411
–
–
–
–
$
7,411
–
$
7,411
Cost of data hosting revenue, exclusive of depreciation
–
3,064
3,852
1,629
559
9,104
–
9,104
Cost of high-performance computing service revenue
–
–
–
–
–
–
7
7
Cost of cryptocurrency mining revenue- depreciation
4,304
–
–
–
–
4,304
–
4,304
Cost of data hosting revenue- depreciation
–
1,099
864
470
–
2,433
–
2,433
Total cost of revenue
11,715
4,163
4,716
2,099
559
23,252
7
23,259
Gross profit (loss)
$
252
$
2,592
$
1,091
$
3,061
$
(559
)
$
6,437
$
21
$
6,458
FY 2024 Revenue & Cost of Revenue by Project Site
Soluna Digital
Soluna Cloud
(Dollars in thousands)
Project Dorothy 1B
Project Dorothy 1A
Project Dorothy 2
Project Sophie
Other
Soluna Digital Subtotal
Project Ada
Total
Cryptocurrency mining revenue
$
17,027
-
-
-
-
$
17,027
-
$
17,027
Data hosting revenue
-
13,742
-
5,096
-
18,838
-
18,838
High-performance computing services
-
-
-
-
-
-
16
16
Demand response services
152
139
-
-
1,849
2,140
-
2,140
Total revenue
$
17,179
$
13,881
-
$
5,096
$
1,849
$
38,005
$
16
$
38,021
Cost of cryptocurrency mining, exclusive of depreciation
$
7,499
-
-
-
-
$
7,499
-
$
7,499
Cost of data hosting revenue, exclusive of depreciation
-
7,252
-
2,059
66
9,377
-
9,377
Cost of high-performance computing service revenue
-
-
-
-
-
-
5,724
5,724
Cost of cryptocurrency mining revenue- depreciation
4,292
-
-
-
-
4,292
-
4,292
Cost of data hosting revenue- depreciation
-
1,162
-
573
-
1,735
-
1,735
Total cost of revenue
11,791
8,414
-
2,632
66
22,903
5,724
28,627
Gross profit (loss)
$
5,388
$
5,467
-
$
2,464
$
1,783
$
15,102
$
(5,708
)
$
9,394
Revenue decreased by $8.3 million YoY – Hashprice declined 21.5% year-over-year, and Bitcoin mined fell sharply from 274 in 2024 to 113.2 in 2025. A 20MW client exit in December 2024 added further headwinds, as the replacement with profit-sharing clients generated lower baseline yields than the prior fixed-fee contracts. These impacts were partially offset by the energization and ramp-up of Dorothy 2 throughout 2025.
Net loss in 2025 was $57.0 million compared to net loss in 2024 of $58.3 million.
Adjusted EBITDA declined – 2025 EBITDA decreased $14.2 million from +$942k to -$13.2 million. The decrease was driven by a $8.3 million year-over-year drop in revenue due to the challenging Bitcoin hashprice. In addition, increases in SG&A expenses due to higher personnel costs, professional/legal fees, and investor relations costs.
The audited financial statements and 10K are available online. A narrative overview of our 2025 highlights is available on our website.
Safe Harbor Statement
This announcement contains forward-looking statements. These statements are made under the “safe harbor” provisions of the U.S. Private Securities Litigation Reform Act of 1995. These forward-looking statements can be identified by terminology such as “will,” “expects,” “anticipates,” “future,” “intends,” “plans,” “believes,” “estimates,” “confident” and similar statements. Other examples of forward-looking statements may include, but are not limited to, (i) statements of Company plans and objectives, including the completion and commissioning of Project Kati 1 and Project Kati 2, our expectations regarding the timing and amount of revenue generation from these projects, the expected amount of renewable energy capacity Projects Kati 1 and Kati 2 will deliver, the development and growth of our AI data center business, and our business strategy with respect to Bitcoin mining and AI infrastructure, (ii) statements of future economic performance, and (iii) statements of assumptions underlying other statements about the Company or its business. Soluna Holdings may also make written or oral forward-looking statements in its periodic reports to the U.S. Securities and Exchange Commission (“SEC”), in its annual report to shareholders, in press releases and other written materials and in oral statements made by its officers, directors or employees to third parties. Forward-looking statements involve inherent risks and uncertainties, further information regarding which is included in the Company’s filings with the SEC. All information provided in this press release is as of the date of the press release, and Soluna Holdings undertakes no duty to update such information, except as required under applicable law.
Non-GAAP Measures
In addition to figures prepared in accordance with GAAP, Soluna Holdings from time to time presents alternative non-GAAP performance measures, e.g., EBITDA and Adjusted EBITDA. EBITDA is defined as earnings before interest, taxes, and depreciation and amortization. Adjusted EBITDA is defined as EBITDA adjusted for stock-based compensation costs, loss on sale of fixed assets and credit on equipment deposit, loss on debt extinguishment and revaluation, fair value adjustment losses, placement agent release expense, fair value on placement agent warrant, loss on contract, provision for credit losses, convertible note inducement expense and impairment on fixed assets. Management believes EBITDA and Adjusted EBITDA are useful to investors because they provide a supplemental measure of operating performance that excludes non-cash charges and items that are not indicative of the Company's core recurring operations, facilitating period-over-period comparisons. EBITDA and Adjusted EBITDA are provided in addition to and should not be considered to be substitutes for, or superior to net income, the comparable measure calculated in accordance with GAAP. Further, EBITDA and Adjusted EBITDA should not be considered as alternatives to revenue growth, net income, or any other performance measure calculated in accordance with GAAP, or as alternatives to cash flow from operating activities as a measure of our liquidity. Alternative performance measures are not subject to GAAP or any other generally accepted accounting principle. Other companies may define these terms in different ways. See our annual report on Form 10-K for the year ended December 31, 2025, for an explanation of how management uses these measures in evaluating its operations. Investors should review the non-GAAP reconciliations provided below and not rely on any single financial measure to evaluate the Company’s business.
About Soluna Holdings, Inc (Nasdaq: SLNH)
Soluna is on a mission to make renewable energy a global superpower, using computing as a catalyst. The Company designs, develops, and operates digital infrastructure that transforms surplus renewable energy into global computing resources. Soluna’s pioneering data centers are strategically co-located with wind, solar, or hydroelectric power plants to support high-performance computing applications, including Bitcoin Mining, Generative AI, and other compute-intensive applications. Soluna’s proprietary software MaestroOS(™) helps energize a greener grid while delivering cost-effective and sustainable computing solutions and superior returns. To learn more, visit solunacomputing.com and follow us on:
LinkedIn: https://www.linkedin.com/company/solunaholdings/
X (formerly Twitter): x.com/solunaholdings
YouTube: youtube.com/c/solunacomputing
Newsletter: bit.ly/solunasubscribe
Resource Center: solunacomputing.com/resources
Soluna regularly posts important information on its website and encourages investors and potential investors to consult the Soluna investor relations and investor resources sections of its website regularly.
Soluna Holdings, Inc. and Subsidiaries
Consolidated Balance Sheets
As of December 31, 2025, and December 31, 2024
(Dollars in thousands, except per share)
December 31, 2025
December 31, 2024
Assets
Current Assets:
Cash
$
76,423
$
7,843
Restricted cash
4,500
1,150
Accounts receivable, net (allowance for expected credit losses $244 as of December 31, 2025 and December 31, 2024)
5,522
2,693
Loan commitment assets
3,018
—
Prepaid expenses and other current assets
2,664
1,781
Equipment held for sale
—
28
Total Current Assets
92,127
13,495
Restricted cash, noncurrent
7,920
1,460
Other assets
978
2,724
Deposits and credits on equipment
1,377
5,145
Property, plant and equipment, net
74,783
47,283
Intangible assets, net
8,261
17,620
Operating lease right-of-use assets
252
313
Financing lease right-of-use assets
2,246
—
Total Assets
$
187,944
$
88,040
Liabilities and Stockholders’ Equity
Current Liabilities:
Accounts payable
$
4,859
$
2,840
Accrued liabilities
13,182
6,785
Accrued interest
303
2,275
Contract liability
19,348
20,015
Current portion of debt
8,858
14,444
Income tax payable
123
37
Customer deposits-current
1,913
1,416
Deferred revenue
518
—
Operating lease liability
65
61
Financing lease liability
20
—
Total Current Liabilities
49,189
47,873
Other liabilities
743
235
Customer deposits- long-term
2,533
-
Long-term debt
17,899
7,061
Operating lease liability
187
252
Financing lease liability
2,236
—
Deferred tax liability, net
2,911
5,257
Total Liabilities
75,698
60,678
Commitments and Contingencies (Note 13)
Mezzanine equity:
Placement agent warrants
1,313
—
Stockholders’ Equity:
9.00% Series A Cumulative Perpetual Preferred Stock, par value $0.001 per share, $25.00 liquidation preference; authorized 6,040,000; 4,928,545 and 4,953,545 shares issued and outstanding as of December 31, 2025 and December 31, 2024
5
5
Series B Preferred Stock, par value $0.0001 per share, authorized 187,500; 62,500 shares issued and outstanding as of December 31, 2025 and December 31, 2024
—
—
Common stock, par value $0.001 per share, authorized 375,000,000; 102,617,684 shares issued and 102,531,089 shares outstanding as of December 31, 2025 and 10,647,761 shares issued and 10,607,020 shares outstanding as of December 31, 2024
103
11
Additional paid-in capital
435,030
315,607
Accumulated deficit
(367,715
)
(314,304
)
Common stock in treasury, at cost, 86,595 shares at December 31, 2025 and 40,741 shares at December 31, 2024
(13,873
)
(13,798
)
Total Soluna Holdings, Inc. Stockholders’ Equity (Deficit)
53,550
(12,479
)
Non-Controlling Interest
57,383
39,841
Total Stockholders’ Equity
110,933
27,362
Total Liabilities, Mezzanine Equity, and Stockholders’ Equity
$
187,944
$
88,040
The accompanying notes are an integral part of these consolidated financial statements.
Soluna Holdings, Inc. and Subsidiaries
Consolidated Statements of Operations
As of December 31, 2025 and December 31, 2024
Year Ended
December 31,
(Dollars in thousands, except per share)
2025
2024
Cryptocurrency mining revenue
$
11,406
$
17,027
Data hosting revenue
16,998
18,838
High-performance computing service revenue
28
16
Demand response service revenue
1,285
2,140
Total revenue
29,717
38,021
Operating costs:
Cost of cryptocurrency mining revenue, exclusive of depreciation
7,411
7,499
Cost of data hosting revenue, exclusive of depreciation
9,104
9,377
Cost of high-performance computing services
7
5,724
Cost of cryptocurrency mining revenue- depreciation
4,304
4,292
Cost of data hosting revenue- depreciation
2,433
1,735
Total cost of revenue
23,259
28,627
Operating expenses:
General and administrative expenses, exclusive of depreciation and amortization
30,519
18,581
Depreciation and amortization associated with general and administrative expenses
9,608
9,613
Total general and administrative expenses
40,127
28,194
Loss on contract
—
28,593
Impairment on fixed assets
12
130
Operating loss
(33,681
)
(47,523
)
Interest expense
(4,835
)
(2,527
)
Gain (loss) on debt extinguishment and revaluation, net
10,658
(1,644
)
Fair value adjustment loss
(23,681
)
(5,705
)
Loss on sale of fixed assets and credit on equipment deposit
(1,151
)
(31
)
Other financing expense
(5,917
)
(3,661
)
Other (expense) income, net
(700
)
304
Loss before income taxes
(59,307
)
(60,787
)
Income tax benefit, net
2,316
2,487
Net loss
(56,991
)
(58,300
)
(Less) Net loss (income) attributable to non-controlling interest, net
3,580
(5,034
)
Net loss attributable to Soluna Holdings, Inc.
$
(53,411
)
$
(63,334
)
Basic and Diluted loss per common share:
Basic & Diluted loss per share
$
(2.38
)
$
(14.94
)
Weighted average shares outstanding (Basic and Diluted)
29,048,848
5,109,339
The accompanying notes are an integral part of these consolidated financial statements.
Soluna Holdings, Inc. and Subsidiaries
Consolidated Statements of Cash Flows
For the Year Ended December 31, 2025 and 2024
(Dollars in thousands)
Year Ended December 31,
(Dollars in thousands)
2025
2024
Operating Activities
Net loss
$
(56,991
)
$
(58,300
)
Adjustments to reconcile net loss to net cash used in operating activities:
Depreciation expense
6,852
6,152
Amortization expense
9,493
9,488
Stock-based compensation
10,566
5,311
Deferred income taxes
(2,339
)
(2,522
)
Impairment on fixed assets
12
130
Provision for credit losses
—
760
Amortization of operating lease asset and financing lease
189
133
Debt issuance costs
—
2,011
(Gain) loss on debt extinguishment and revaluation, net
(10,658
)
1,644
Loss on contract
—
28,593
Amortization on deferred financing costs and discount on notes
1,114
351
Fair value adjustments, including SEPA
23,680
5,705
Fair value on placement agent warrant financing cost
146
—
Loss on sale of fixed assets and credit on equipment deposit
1,151
31
Conversion inducement expense
—
388
Changes in operating assets and liabilities:
Accounts receivable
(2,829
)
(505
)
Prepaid expenses and other current assets
(884
)
(3,296
)
Other long-term assets
1,704
(4,842
)
Accounts payable
2,012
741
Contract liability
(667
)
—
Deferred revenue
1,012
—
Operating lease liabilities
(61
)
(138
)
Other liabilities and customer deposits
3,044
(1,671
)
Accrued liabilities and accrued interest payable
4,305
4,767
Net cash used in operating activities
(9,149
)
(5,069
)
Investing Activities
Purchases of property, plant, and equipment
(28,065
)
(8,853
)
Purchases of intangible assets
(134
)
(101
)
Proceeds from disposal on property, plant, and equipment
—
215
Deposits of equipment
(3,654
)
(4,424
)
Net cash used in investing activities
(31,853
)
(13,163
)
Financing Activities
Proceeds from common stock warrant exercises
10,272
2,332
Proceeds from sale of common stock on SEPA
6,176
—
Proceeds from notes and debt issuance
23,885
14,470
Net proceeds from sale of common stock on ATM
34,153
—
Net proceeds from July equity issuance
4,364
—
Net proceeds from December equity issuance
29,748
—
Payments on notes
(6,676
)
(2,675
)
Payments on debt issuance costs
(2,790
)
(899
)
Payments on other financing costs
—
(1,375
)
Payments on warrant redemptions
(452
)
—
Payments on financing lease liabilities
(118
)
—
Costs on treasury stock
(75
)
—
Contributions from non-controlling interest
29,559
14,735
Distributions to non-controlling interest
(8,654
)
(8,270
)
Net cash provided by financing activities
119,392
18,318
Increase in cash & restricted cash
78,390
86
Cash & restricted cash – beginning of period
10,453
10,367
Cash & restricted cash – end of period
$
88,843
$
10,453
Supplemental Disclosure of Cash Flow Information
Cash paid during the period for:
Interest paid on debt
1,976
527
Non-cash investing and financing activities:
Fair value consideration for Green Cloud issuance of shares
810
—
Noncash financing cost accrual
766
—
Noncash deferred financing cost accrual
828
—
Warrant consideration in relation to Generate Common Warrant
2,635
—
Warrant consideration in relation to convertible notes, Cloud notes, and revaluation of warrant liability
—
6,362
Notes converted to common stock
—
9,001
Noncash membership distribution accrual
3,637
1,179
SEPA commitment payment
—
275
Placement agent release payment
—
1,000
Fair value consideration on placement agent warrants
1,313
—
Noncash non-controlling interest contributions
2,675
2,160
Noncash activity right-of-use assets obtained in exchange for lease obligations
2,303
146
The accompanying notes are an integral part of these consolidated financial statements.
Segment Information
The following table details revenue, cost of revenues, and other operating costs for the Company’s reportable segments for years ended December 31, 2025 and 2024, and reconciles to net income (loss) on the consolidated statements of operations:
For the year ended December 31, 2025
Cryptocurrency Mining
Data Center Hosting
High-Performance
Computing Services
Total
Segment Revenue: Revenue from external customers
$
11,406
$
16,998
$
28
$
28,432
Reconciliation of revenue
Demand response revenue (a)
1,285
Total consolidated revenue
29,717
Less: Segment cost of revenue
Utility costs
5,418
3,492
—
8,910
Wages, benefits, and employee related costs
873
2,853
7
3,733
Facilities and Equipment costs
862
2,141
—
3,003
Cost of revenue- depreciation
4,304
2,433
—
6,737
Other cost of revenue*
517
1,355
—
1,872
Total segment cost of revenue
11,974
12,274
7
24,255
General and administrative expenses
62
2,035
270
2,367
Loss on contract
—
—
—
—
Impairment on fixed assets
—
12
—
12
Segment operating (loss) income
$
(630
)
$
2,677
$
(249
)
$
1,798
For the year ended December 31, 2024
Cryptocurrency Mining
Data Center Hosting
High-Performance
Computing Services
Total
Segment Revenue: Revenue from external customers
$
17,027
$
18,838
$
16
$
35,881
Reconciliation of revenue
Demand response revenue (a)
2,140
38,021
Less: Segment cost of revenue
Utility costs
5,381
5,437
—
10,818
Wages, benefits, and employee related costs
849
2,087
6
2,942
Facilities and Equipment costs
944
1,406
5,718
8,068
Cost of revenue- depreciation
4,292
1,735
—
6,027
Other cost of revenue*
623
779
—
1,402
Total segment cost of revenue
12,089
11,444
5,724
29,257
General and administrative expenses
169
1,058
410
1,637
Loss on contract
—
—
28,593
28,593
Impairment on fixed assets
130
—
—
130
Segment operating income (loss)
$
4,639
$
6,336
$
(34,711
)
$
(23,736
)
(a)
Demand service revenue is included as a reconciling item of total revenue and not included as part of segment gross profit or loss.
*
Other cost of revenue includes Insurance, outside service costs and margins, and general costs.
The following table presents the reconciliation of segment operating income (loss) to net income (loss) before taxes:
Year ended December 31,
2025
2024
Segment operating income (loss)
$
1,798
$
(23,736
)
Reconciling Items:
Elimination of intercompany costs
996
630
Other revenue (a)
1,285
2,140
General and administrative, exclusive of depreciation and amortization (b)
(28,152
)
(16,944
)
General and administrative, depreciation and amortization
(9,608
)
(9,613
)
Interest expense
(4,835
)
(2,527
)
Gain (loss) on debt extinguishment and revaluation, net
10,658
(1,644
)
Loss on sale of fixed assets and credit on equipment deposit
(1,151
)
(31
)
Fair value adjustment loss
(23,681
)
(5705
)
Other financing expense
(5,917
)
(3,661
)
Other (expense) income, net
(700
)
304
Net loss before taxes
$
(59,307
)
$
(60,787
)
(a)
Demand service revenue is included as a reconciling item of total revenue and not included as part of segment gross profit or loss
(b)
The reconciling general and administrative expense, exclusive of depreciation and amortization represent corporate and unallocated general and administrative expenses for the year.
Gross Profit Breakout:
The following table summarizes the balances for the Project sites for cryptocurrency mining revenue, data hosting revenue, high-performance computing service revenue, demand response revenue, cost of cryptocurrency mining revenue, exclusive of depreciation, cost of data hosting revenue, exclusive of depreciation, cost of high-performance computing services, and cost of depreciation during the year ended December 31, 2025:
Soluna Digital
Soluna Cloud
(Dollars in thousands)
Project Dorothy 1B
Project Dorothy 1A
Project Dorothy 2
Project Sophie
Other
Soluna Digital Subtotal
Project
Ada
Total
Cryptocurrency mining revenue
$
11,406
$
—
$
—
$
—
$
—
$
11,406
$
—
$
11,406
Data hosting revenue
—
6,176
5,662
5,160
—
16,998
—
16,998
High-performance computing services
—
—
—
—
—
—
28
28
Demand response services
561
579
145
—
—
1,285
—
1,285
Total revenue
11,967
6,755
5,807
5,160
—
29,689
28
29,717
Cost of cryptocurrency mining, exclusive of depreciation
$
7,411
$
—
$
—
$
—
$
—
$
7,411
$
—
$
7,411
Cost of data hosting revenue, exclusive of depreciation
—
3,064
3,852
1,629
559
9,104
—
9,104
Cost of high-performance computing service revenue
—
—
—
—
—
—
7
7
Cost of cryptocurrency mining revenue- depreciation
4,304
—
—
—
—
4,304
—
4,304
Cost of data hosting revenue- depreciation
—
1,099
864
470
—
2,433
—
2,433
Total cost of revenue
11,715
4,163
4,716
2,099
559
23,252
7
23,259
Gross profit (loss)
$
252
$
2,592
$
1,091
$
3,061
$
(559
)
$
6,437
$
21
$
6,458
The following table summarizes the balances for the Project sites for cryptocurrency mining revenue, data hosting revenue, high-performance computing service revenue, demand response revenue, cost of cryptocurrency mining revenue, exclusive of depreciation, cost of data hosting revenue, exclusive of depreciation, cost of high-performance computing services, and cost of depreciation during the year ended December 31, 2024:
Soluna Digital
Soluna Cloud
(Dollars in thousands)
Project Dorothy 1B
Project Dorothy 1A
Project Dorothy 2
Project Sophie
Other
Soluna Digital Subtotal
Project
Ada
Total
Cryptocurrency mining revenue
$
17,027
$
—
$
—
$
—
$
—
$
17,027
$
—
$
17,027
Data hosting revenue
—
13,742
—
5,096
—
18,838
—
18,838
High-performance computing services
—
—
—
—
—
—
16
16
Demand response services
152
139
—
—
1,849
2,140
—
2,140
Total revenue
17,179
13,881
—
5,096
1,849
38,005
16
38,021
Cost of cryptocurrency mining, exclusive of depreciation
$
7,499
$
—
$
—
$
—
$
—
$
7,499
$
—
$
7,499
Cost of data hosting revenue, exclusive of depreciation
—
7,252
—
2,059
66
9,377
—
9,377
Cost of high-performance computing service revenue
—
—
—
—
—
—
5,724
5,724
Cost of cryptocurrency mining revenue- depreciation
4,292
—
—
—
—
4,292
—
4,292
Cost of data hosting revenue- depreciation
—
1,162
—
573
—
1,735
—
1,735
Total cost of revenue
11,791
8,414
—
2,632
66
22,903
5,724
28,627
Gross profit (loss)
$
5,388
$
5,467
$
—
$
2,464
$
1,783
$
15,102
$
(5,708
)
$
9,394
EBITDA and Adjusted EBITDA Tables:
Reconciliations of EBITDA and Adjusted EBITDA to net loss, the most comparable GAAP financial metric, for historical periods are presented in the table below:
(Dollars in thousands)
Years Ended
December 31,
2025
2024
Net loss from continuing operations
$
(56,991
)
$
(58,300
)
Interest expense
4,835
2,527
Income tax (benefit) expense
(2,316
)
(2,487
)
Depreciation and amortization
16,345
15,640
EBITDA
(38,127
)
(42,620
)
Adjustments: Non-cash items
Stock-based compensation costs
10,566
5,311
Loss on sale of fixed assets and credit on equipment deposit
1,151
31
(Gain) loss on debt extinguishment and revaluation, net
(10,658
)
1,644
Placement agent release expense
—
1,000
Fair value on placement agent warrant
146
—
Fair value adjustment loss
23,681
5,705
Loss on contract
—
28,593
Provision for credit losses
—
760
Convertible note inducement expense
—
388
Impairment on fixed assets
12
130
Adjusted EBITDA
$
(13,229
)
$
942
The following table represents the EBITDA and Adjusted EBITDA activity between each three-month period from January 1, 2025 through December 31, 2025.
(Dollars in thousands)
Three months ended
March 31,
2025
Three months ended
June 30,
2025
Three months ended
September 30,
2025
Three months ended
December 31,
2025
Year ended
December 31,
2025
Net loss from continuing operations
$
(7,354
)
$
(7,780
)
$
(25,787
)
$
(16,070
)
$
(56,991
)
Interest expense, net
838
1,196
1,212
1,589
4,835
Income tax (benefit) expense from continuing operations
(425
)
(608
)
(666
)
(617
)
(2,316
)
Depreciation and amortization
3,879
3,989
4,119
4,358
16,345
EBITDA
(3,062
)
(3,203
)
(21,122
)
(10,740
)
(38,127
)
Adjustments: Non-cash items
Stock-based compensation costs
1,847
1,942
1,882
4,895
10,566
Loss on sale of fixed assets and credit on equipment deposits
—
22
780
349
1,151
Fair value on placement agent warrant and financing fees
—
—
146
—
146
Fair value adjustment loss
118
—
22,047
1,516
23,681
Impairment on fixed assets
—
12
—
—
12
Gain on debt extinguishment and revaluation, net
(551
)
—
(10,107
)
—
(10,658
)
Adjusted EBITDA
$
(1,648
)
$
(1,227
)
$
(6,374
)
$
(3,980
)
$
(13,229
)
The following table represents the EBITDA and Adjusted EBITDA activity between each three-month period from January 1, 2024 through December 31, 2024.
(Dollars in thousands)
Three months ended
March 31,
2024
Three months ended
June 30,
2024
Three months ended
September 30,
2024
Three months ended
December 31,
2024
Year ended
December 31,
2024
Net loss from continuing operations
$
(2,544
)
$
(9,145
)
$
(8,093
)
$
(38,518
)
$
(58,300
)
Interest expense, net
424
449
821
833
2,527
Income tax (benefit) expense from continuing operations
(548
)
(649
)
(547
)
(743
)
(2,487
)
Depreciation and amortization
3,926
3,909
3,916
3,889
15,640
EBITDA
1,258
(5,436
)
(3,903
)
(34,539
)
(42,620
)
Adjustments: Non-cash items
Stock-based compensation costs
661
1,368
1,257
2,025
5,311
Loss on sale of fixed assets
1
21
—
9
31
Provision for credit losses
—
244
367
149
760
Convertible note inducement expense
—
—
—
388
388
Placement agent release expense
—
—
—
1,000
1,000
Loss on contract
—
—
—
28,593
28,593
Impairment on fixed assets
130
—
—
—
130
Fair value loss (gain) adjustment
4,333
1,600
(328
)
100
5,705
(Gain) loss on debt extinguishment and revaluation, net
(1,236
)
4,000
(875
)
(245
)
1,644
Adjusted EBITDA
$
5,147
$
1,797
$
(3,482
)
$
(2,520
)
$
942
View source version on businesswire.com: https://www.businesswire.com/news/home/20260330987013/en/
Contact Information
Investor Relations
Soluna Holdings, Inc.
ir@soluna.io
Original: Soluna Reports Record 2025 Growth: Pipeline Hits 4.3GW, Raises $142 Million, and Launches AI Infrastructure
 Hot Features


 Molonlabe461
2月前
Molonlabe461
2月前
 BIOCHEMUP
2月前
BIOCHEMUP
2月前
 glenn1919
2月前
glenn1919
2月前
 Oleblue
2月前
Oleblue
2月前
 AKATITUS
5月前
AKATITUS
5月前

 メールアドレスで登録


