0000854560
false
0000854560
2023-08-07
2023-08-07
iso4217:USD
xbrli:shares
iso4217:USD
xbrli:shares
UNITED STATES
SECURITIES AND EXCHANGE COMMISSION
Washington, D.C. 20549
FORM 8-K
CURRENT REPORT
Pursuant to Section 13
or 15(d) of the Securities Exchange Act of 1934
Date of Report (Date of
earliest event reported): August 7,
2023
GREAT
SOUTHERN BANCORP, INC.
(Exact name of registrant as specified in
its charter)
| Maryland |
|
0-18082 |
|
43-1524856 |
(State or other jurisdiction of
incorporation) |
|
(Commission File Number) |
|
(IRS
Employer Identification No.) |
| 1451
East Battlefield, Springfield,
Missouri |
|
65804 |
| (Address of principal executive offices) |
|
(Zip Code) |
Registrant's telephone number,
including area code: (417)
887-4400
Not Applicable
(Former name or former address, if changed
since last report)
Check the appropriate box below if the Form 8-K filing is intended
to simultaneously satisfy the filing obligation of the registrant under any of the following provisions:
| ¨ | Written communications pursuant to Rule 425 under the
Securities Act (17 CFR 230.425) |
| | |
| ¨ | Soliciting material pursuant to Rule 14a-12 under the
Exchange Act (17 CFR 240.14a-12) |
| | |
| ¨ | Pre-commencement communications pursuant to Rule 14d-2(b)
under the Exchange Act (17 CFR 240.14d-2(b)) |
| | |
| ¨ | Pre-commencement communications pursuant to Rule 13e-4(c)
under the Exchange Act (17 CFR 240.13e-4(c)) |
Securities registered pursuant to Section 12(b) of the Act:
| Title
of each class |
Trading
Symbol(s) |
Name
of each exchange on which registered |
| Common Stock, par value $0.01 per share |
GSBC |
The NASDAQ Stock Market LLC |
Indicate by check mark whether the registrant
is an emerging growth company as defined in Rule 405 of the Securities Act of 1933 (§230.405 of this chapter) or Rule
12b-2 of the Securities Exchange Act of 1934 (§240.12b-2 of this chapter).
Emerging growth company ¨
| If an emerging growth company, indicate by check mark if the registrant has elected not to use the extended transition period for complying
with any new or revised financial accounting standards provided pursuant to Section 13(a) of the Exchange Act. |
¨ |
Item 7.01 Regulation FD Disclosure.
Set forth below is presentation material of Great
Southern Bancorp, Inc., the holding company for Great Southern Bank.

AUGUST 2023
Forward - Looking Statements When used in this presentation and in other documents filed or furnished by Great Southern Bancorp, Inc. (the “Company”) wit h t he Securities and Exchange Commission (the “SEC”), in the Company's press releases or other public or stockholder communications, and in oral statements made with the a ppr oval of an authorized executive officer, the words or phrases “may,” “might,” “could,” “should,” "will likely result," "are expected to," "will continue," "is anticipated ," “believe,” "estimate," "project," "intends" or similar expressions are intended to identify "forward - looking statements" within the meaning of the Private Securities Litigation Reform Act of 1995. Forward - looking statements also include, but are not limited to, statements regarding plans, objectives, expectations or consequences of announced transactio ns, known trends and statements about future performance, operations, products and services of the Company. The Company’s ability to predict results or the actual effects of future plans or strategies is inherently uncertain, and the Company’s actual results could differ materially from those contained in the forward - looking statements. Factors that could cause or contribute to such differences include, but are not limited to: ( i ) expected revenues, cost savings, earnings accretion, synergies and other benefits from the Company's merger and acquisition activities might not be realized within the anticipated time frames or at all, and cos ts or difficulties relating to integration matters, including but not limited to customer and employee retention, might be greater than expected; (ii) changes in economic condit ion s, either nationally or in the Company's market areas; (iii) the remaining effects of the COVID - 19 pandemic on general economic and financial market conditions and on pu blic health; (iv) fluctuations in interest rates, the effects of inflation or a potential recession, whether caused by Federal Reserve actions or otherwise; (v) the impact of ban k failures or adverse developments at other banks and related negative press about the banking industry in general on investor and depositor sentiment; (vi) slower economic gr owt h caused by changes in energy prices, supply chain disruptions or other factors; (vii) the risks of lending and investing activities, including changes in the level and d ire ction of loan delinquencies and write - offs and changes in estimates of the adequacy of the allowance for credit losses; (viii) the possibility of realized or unrealized losses on s ecu rities held in the Company's investment portfolio; (ix) the Company's ability to access cost - effective funding and maintain sufficient liquidity; (x) fluctuations in real estate values and both residential and commercial real estate market conditions; (xi) the ability to adapt successfully to technological changes to meet customers' needs and developments in the marketplace; (xii) the possibility that security measures implemented might not be sufficient to mitigate the risk of a cyber - attack or cyber theft, and that such secur ity measures might not protect against systems failures or interruptions; (xiii) legislative or regulatory changes that adversely affect the Company's business; (xiv) chang es in accounting policies and practices or accounting standards; (xv) results of examinations of the Company and Great Southern Bank by their regulators, including the possibility th at the regulators may, among other things, require the Company to limit its business activities, change its business mix, increase its allowance for credit losses, writ e - d own assets or increase its capital levels, or affect its ability to borrow funds or maintain or increase deposits, which could adversely affect its liquidity and earnings; (xvi) cost s a nd effects of litigation, including settlements and judgments; (xvii) competition; (xviii) the transition from LIBOR to new interest rate benchmarks; and (xix) natural disasters , w ar, terrorist activities or civil unrest and their effects on economic and business environments in which the Company operates. The Company wishes to advise readers that the fa cto rs listed above and other risks described in the Company’s most recent Annual Report on Form 10 - K, including, without limitation, those described under “Item 1A. Risk Fac tors,” subsequent Quarterly Reports on Form 10 - Q and other documents filed or furnished from time to time by the Company with the SEC (which are available on our website at www.greatsouthernbank.com and the SEC’s website at www.sec.gov), could affect the Company's financial performance and cause the Company's actual results for future p eri ods to differ materially from any opinions or statements expressed with respect to future periods in any current statements. The Company does not undertake - and specifically declines any obligation - to publicly release the result of any revisions which m ay be made to any forward - looking statements to reflect events or circumstances after the date of such statements or to reflect the occurrence of anticipated or unanticip ate d events. 2
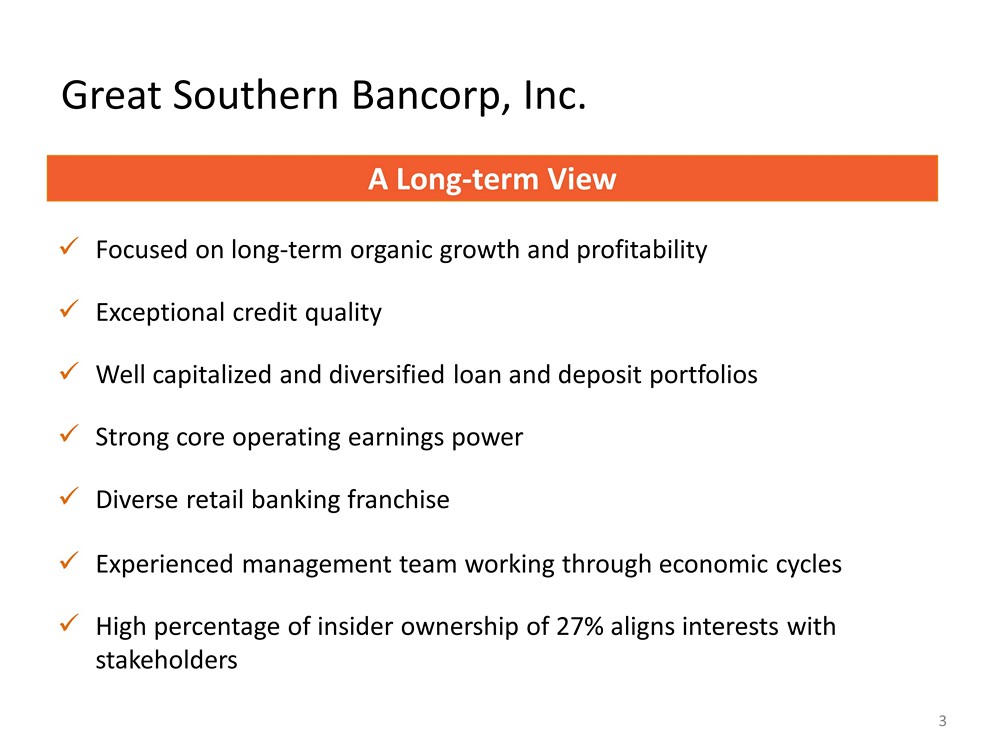
Great Southern Bancorp, Inc. x Focused on long - term organic growth and profitability x Exceptional credit quality x Well capitalized and diversified loan and deposit portfolios x Strong core operating earnings power x Diverse retail banking franchise x Experienced management team working through economic cycles x High percentage of insider ownership of 27% aligns interests with stakeholders 3 A Long - term View
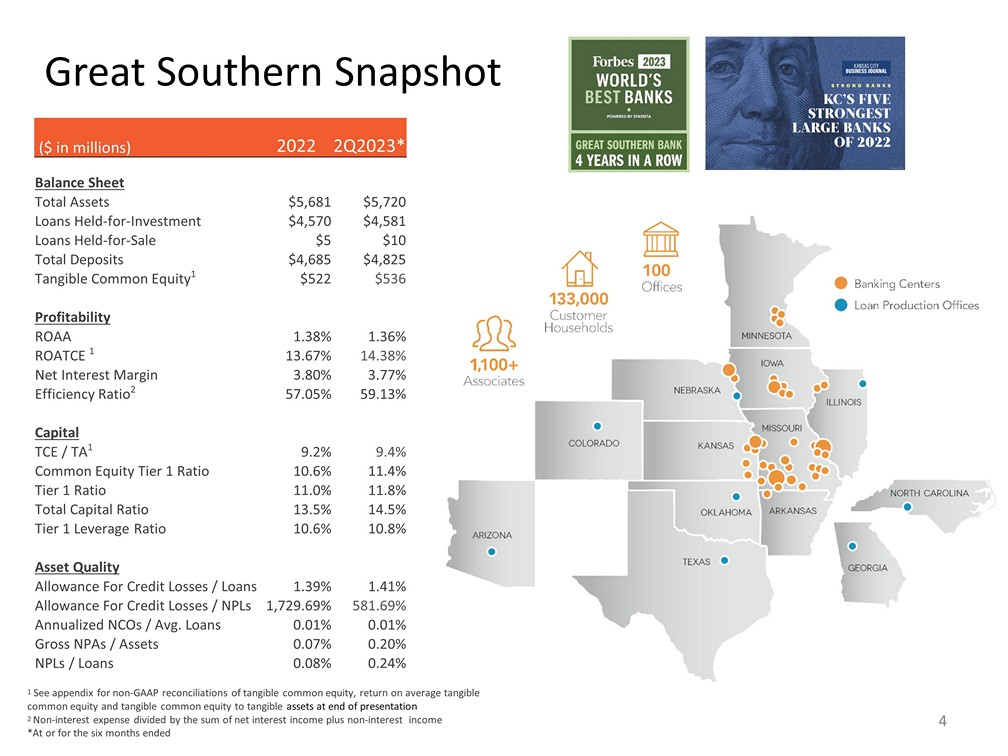
Great Southern Snapshot ($ in millions) 2022 2Q2023* Balance Sheet Total Assets $5,681 $5,720 Loans Held - for - Investment $4,570 $4,581 Loans Held - for - Sale $5 $10 Total Deposits $4,685 $4,825 Tangible Common Equity 1 $522 $536 Profitability ROAA 1.38% 1.36% ROATCE 1 13.67% 14.38% Net Interest Margin 3.80% 3.77% Efficiency Ratio 2 57.05% 59.13% Capital TCE / TA 1 9.2% 9.4% Common Equity Tier 1 Ratio 10.6% 11.4% Tier 1 Ratio 11.0% 11.8% Total Capital Ratio 13.5% 14.5% Tier 1 Leverage Ratio 10.6% 10.8% Asset Quality Allowance For Credit Losses / Loans 1.39% 1.41% Allowance For Credit Losses / NPLs 1,729.69% 581.69% Annualized NCOs / Avg. Loans 0.01% 0.01% Gross NPAs / Assets 0.07% 0.20% NPLs / Loans 0.08% 0.24% 1 See appendix for non - GAAP reconciliations of tangible common equity, return on average tangible common equity and tangible common equity to tangible assets at end of presentation 2 Non - interest expense divided by the sum of net interest income plus non - interest income *At or for the six months ended 4
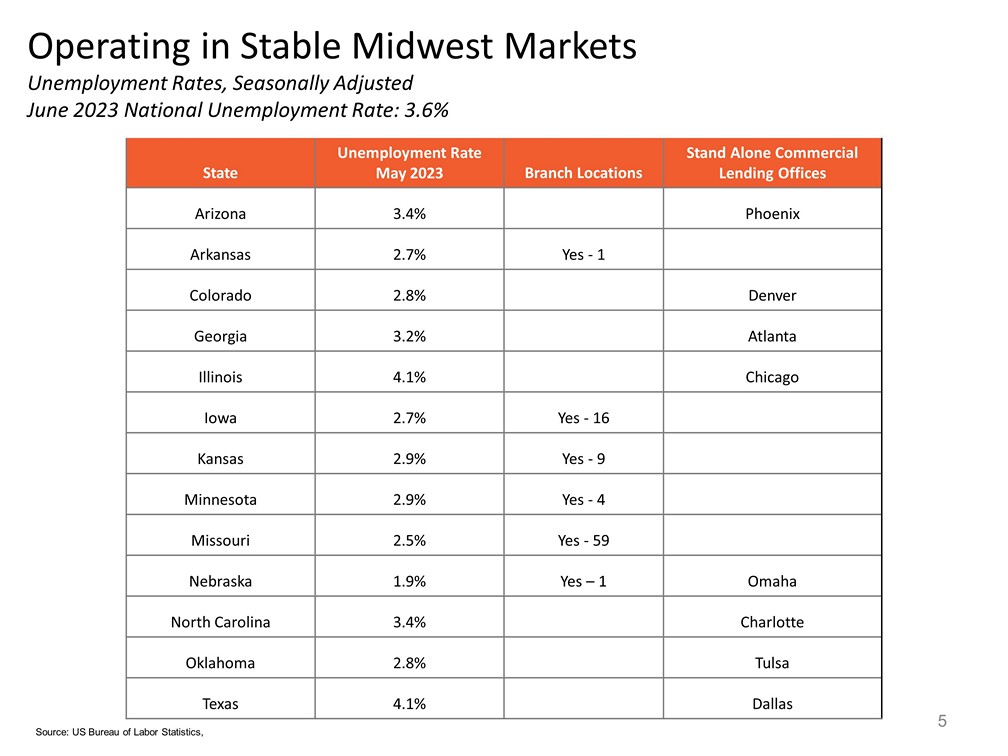
Operating in Stable Midwest Markets Unemployment Rates, Seasonally Adjusted June 2023 National Unemployment Rate: 3.6% 5 Source: US Bureau of Labor Statistics, State Unemployment Rate May 2023 Branch Locations Stand Alone Commercial Lending Offices Arizona 3.4% Phoenix Arkansas 2.7% Yes - 1 Colorado 2.8% Denver Georgia 3.2% Atlanta Illinois 4.1% Chicago Iowa 2.7% Yes - 16 Kansas 2.9% Yes - 9 Minnesota 2.9% Yes - 4 Missouri 2.5% Yes - 59 Nebraska 1.9% Yes – 1 Omaha North Carolina 3.4% Charlotte Oklahoma 2.8% Tulsa Texas 4.1% Dallas
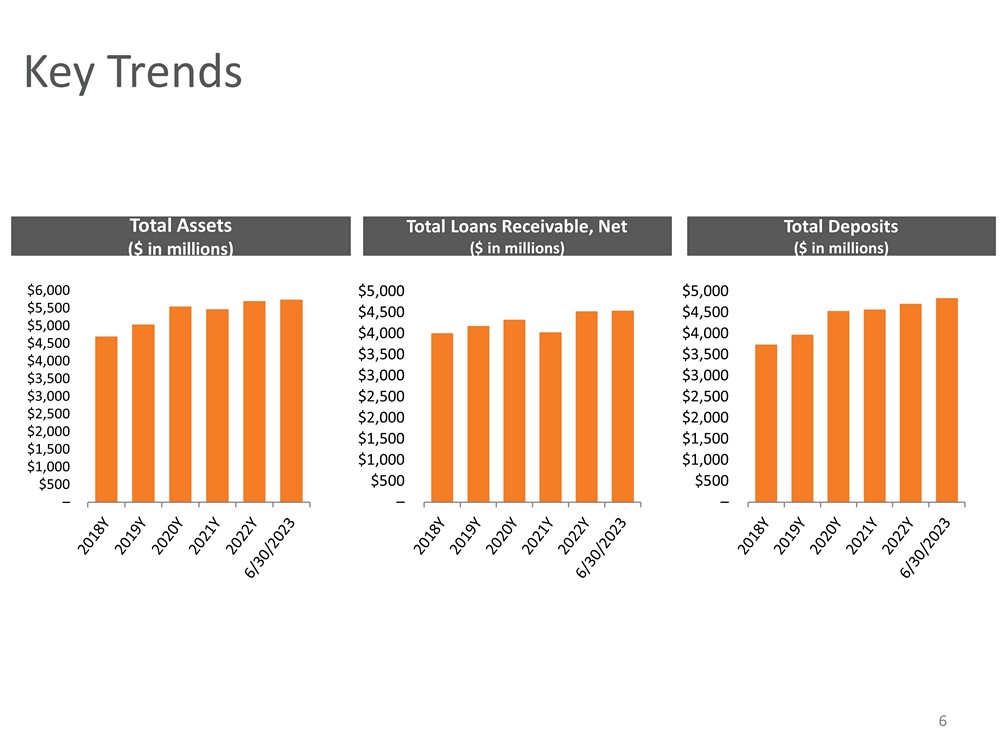
– $500 $1,000 $1,500 $2,000 $2,500 $3,000 $3,500 $4,000 $4,500 $5,000 $5,500 $6,000 – $500 $1,000 $1,500 $2,000 $2,500 $3,000 $3,500 $4,000 $4,500 $5,000 Total Assets ($ in millions) Total Loans Receivable, Net ($ in millions) Key Trends – $500 $1,000 $1,500 $2,000 $2,500 $3,000 $3,500 $4,000 $4,500 $5,000 Total Deposits ($ in millions) 6

7 Profitability Pre - Provision Net Revenue Efficiency Ratio 1 56.41% 54.48% 58.07% 59.03% 57.05% 59.13% 2018Y 2019Y 2020Y 2021Y 2022Y 2Q2023 ROATCE 2 ROAA 13.74% 13.08% 9.65% 12.02% 13.67% 14.38% 2018Y 2019Y 2020Y 2021Y 2022Y 2Q2023 1.49% 1.52% 1.11% 1.36% 1.38% 1.36% 2018Y 2019Y 2020Y 2021Y 2022Y 2Q2023 1 Non - interest expense divided by the sum of net interest income plus non - interest income 2 See appendix for non - GAAP reconciliation of return on average tangible common equity at end of presentation *At or for the six months ended $89.1 $96.2 $89.0 $88.6 $100.4 $46.3 $47.8 Net Income/Diluted EPS $67.1 $73.6 $59.3 $74.6 $75.9 $35.2 $38.8 $4.71 $5.14 $4.21 $5.46 $6.02 $2.73 $3.19 $0.00 $6.00 $12.00 $0.0 $80.0 In millions, except diluted earnings per common share * * * * *
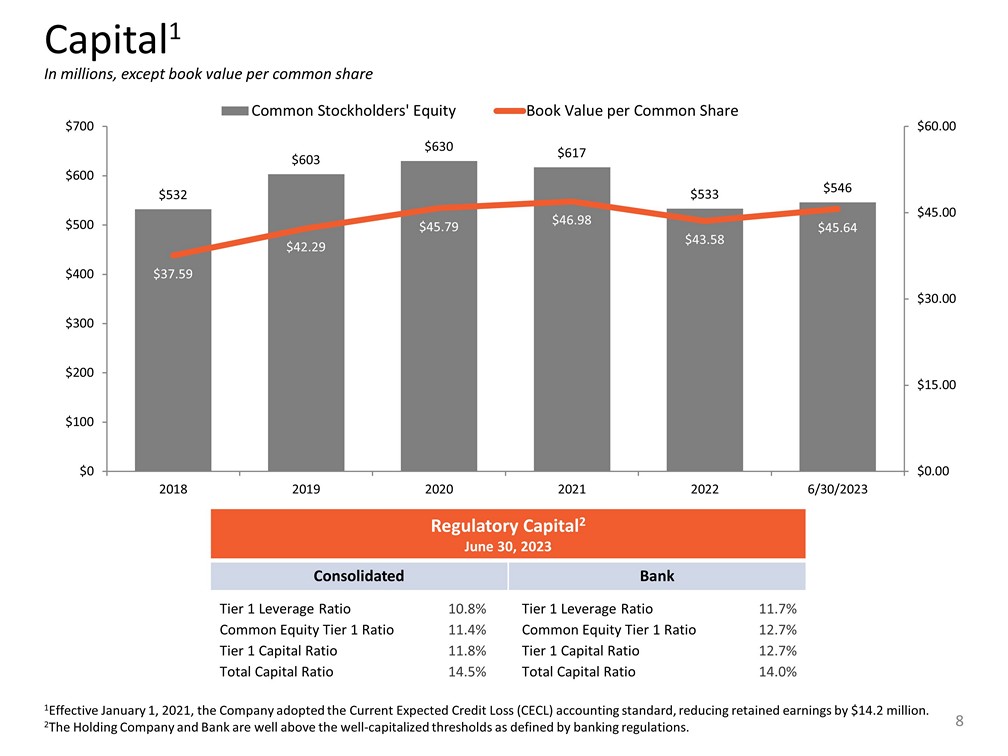
$532 $603 $630 $617 $533 $546 $37.59 $42.29 $45.79 $46.98 $43.58 $45.64 $0.00 $15.00 $30.00 $45.00 $60.00 $0 $100 $200 $300 $400 $500 $600 $700 2018 2019 2020 2021 2022 6/30/2023 Common Stockholders' Equity Book Value per Common Share 8 Capital 1 In millions, except book value per common share Tier 1 Leverage Ratio 10.8% Common Equity Tier 1 Ratio 11.4% Tier 1 Capital Ratio 11.8% Total Capital Ratio 14.5% Tier 1 Leverage Ratio 11.7% Common Equity Tier 1 Ratio 12.7% Tier 1 Capital Ratio 12.7% Total Capital Ratio 14.0% 1 Effective January 1, 2021, the Company adopted the Current Expected Credit Loss (CECL) accounting standard, reducing retained ea rnings by $14.2 million. 2 The Holding Company and Bank are well above the well - capitalized thresholds as defined by banking regulations. Regulatory Capital 2 June 30, 2023 Consolidated Bank
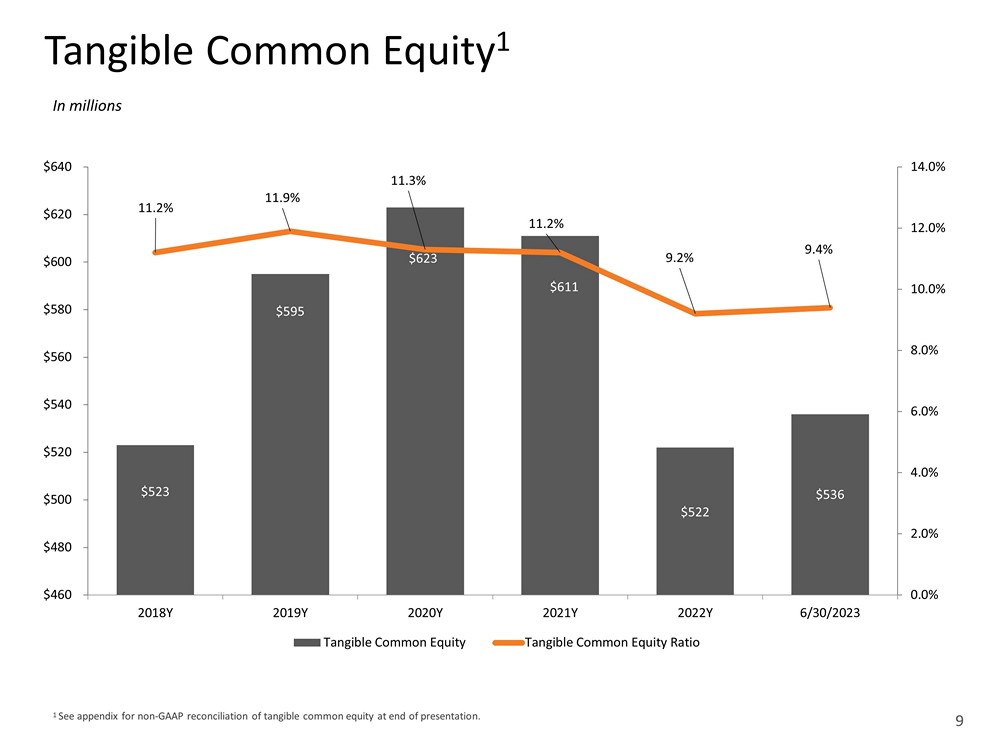
$523 $595 $623 $611 $522 $536 11.2% 11.9% 11.3% 11.2% 9.2% 9.4% 0.0% 2.0% 4.0% 6.0% 8.0% 10.0% 12.0% 14.0% $460 $480 $500 $520 $540 $560 $580 $600 $620 $640 2018Y 2019Y 2020Y 2021Y 2022Y 6/30/2023 Tangible Common Equity Tangible Common Equity Ratio 1 See appendix for non - GAAP reconciliation of tangible common equity at end of presentation . Tangible Common Equity 1 In millions 9

10 $0.40 $0.00 $0.05 $0.10 $0.15 $0.20 $0.25 $0.30 $0.35 $0.40 $0.45 2004 2005 2006 2007 2008 2009 2010 2011 2012 2013 2014 2015 2016 2017 2018 2019 2020 2021 2022 2023 Q1 Q2 Q3 Q4 Regular Quarterly Cash Dividends Declared on Common Stock Special Cash Dividends Declared on Common Stock January 2019 – $0.75 per common share January 2020 – $1.00 per common share 134 Consecutive Quarterly Cash Dividends
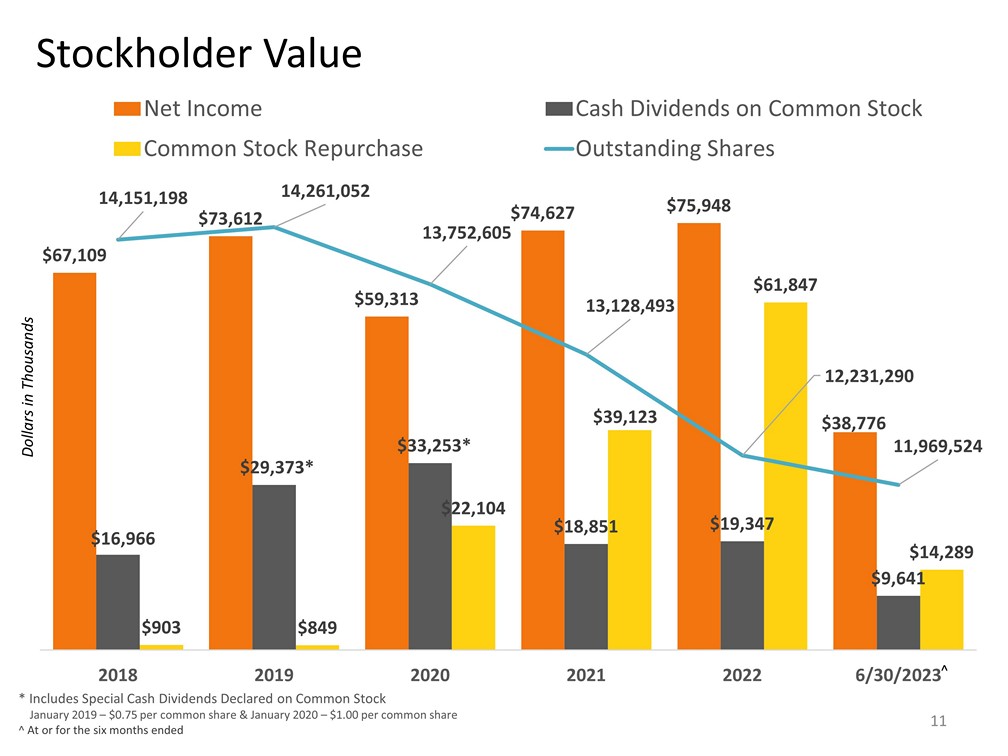
Stockholder Value * Includes Special Cash Dividends Declared on Common Stock January 2019 – $0.75 per common share & January 2020 – $1.00 per common share ^ At or for the six months ended $67,109 $73,612 $59,313 $74,627 $75,948 $38,776 $16,966 $29,373 * $33,253 * $18,851 $19,347 $9,641 $903 $849 $22,104 $39,123 $61,847 $14,289 14,151 ,198 14,261 ,052 13,752 ,605 13,128 ,493 12,231 ,290 11,969,524 2018 2019 2020 2021 2022 6/30/2023 Net Income Cash Dividends on Common Stock Common Stock Repurchase Outstanding Shares Dollars in Thousands 11 ^
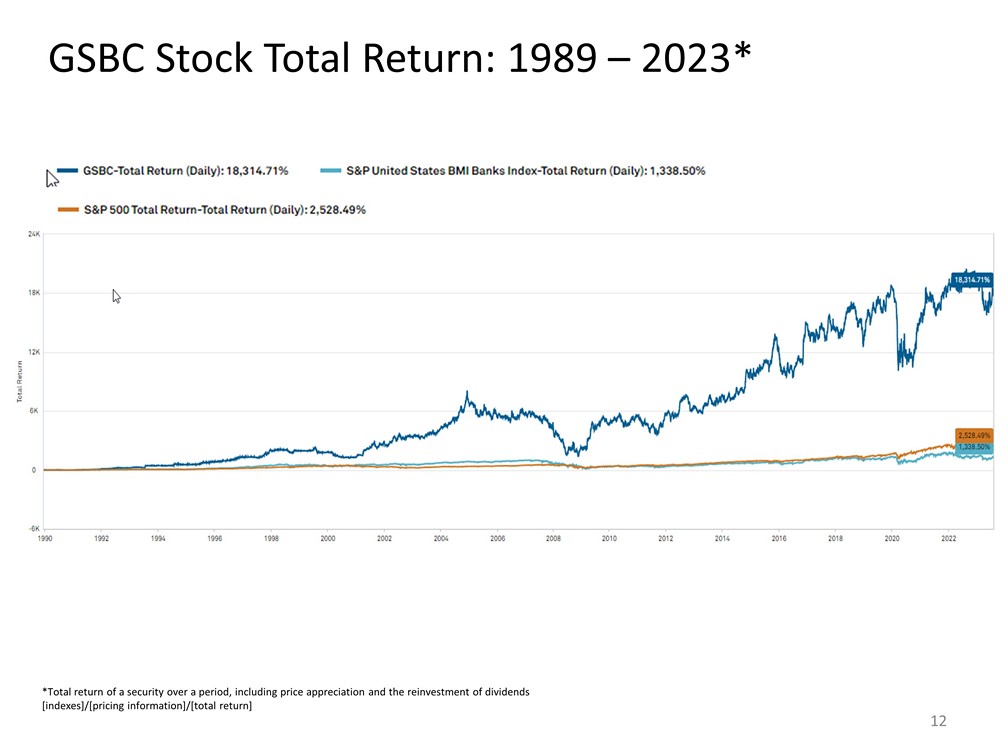
GSBC Stock Total Return: 1989 – 2023* *Total return of a security over a period, including price appreciation and the reinvestment of dividends [indexes]/[pricing information]/[total return] 12
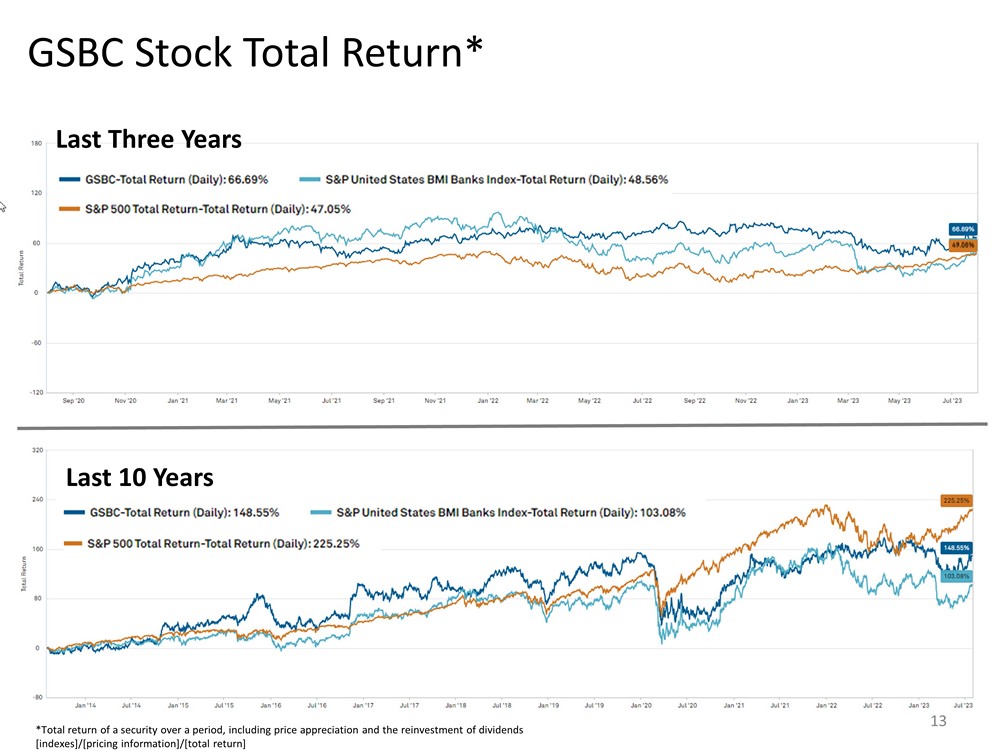
GSBC Stock Total Return* *Total return of a security over a period, including price appreciation and the reinvestment of dividends [indexes]/[pricing information]/[total return] Last 10 Years Last Three Years 13
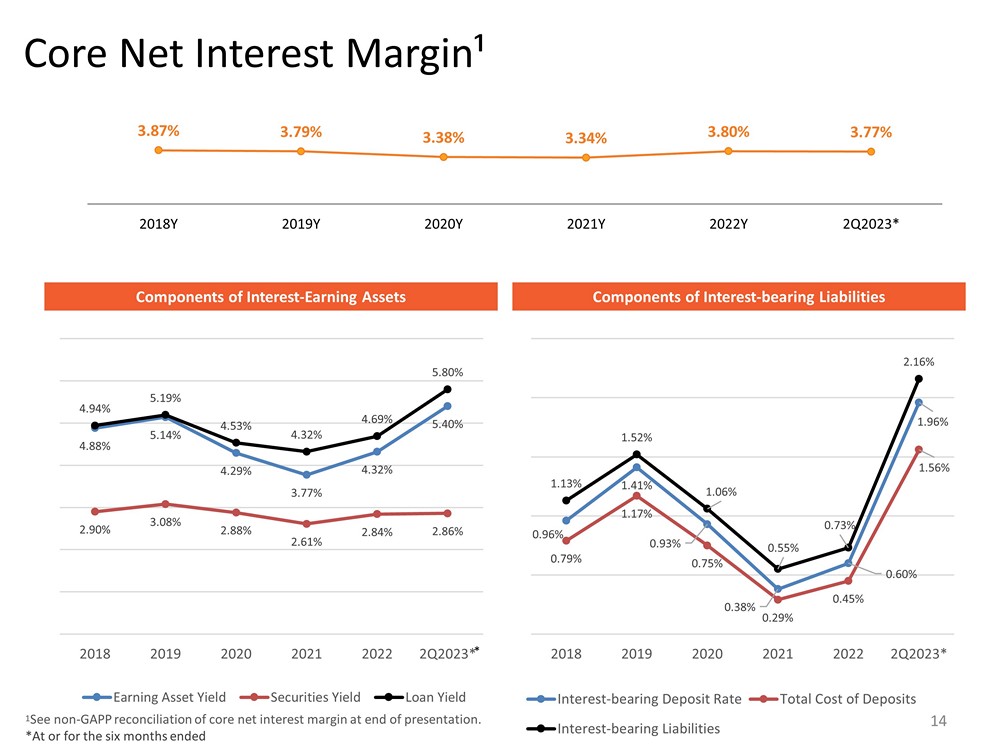
Core Net Interest Margin¹ 3.87% 3.79% 3.38% 3.34% 3.80% 3.77% 2018Y 2019Y 2020Y 2021Y 2022Y 2Q2023* 1 See non - GAPP reconciliation of core net interest margin at end of presentation. *At or for the six months ended Components of Interest - Earning Assets Components of Interest - bearing Liabilities 4.88% 5.14% 4.29% 3.77% 4.32% 5.40% 2.90% 3.08% 2.88% 2.61% 2.84% 2.86% 4.94% 5.19% 4.53% 4.32% 4.69% 5.80% 2018 2019 2020 2021 2022 2Q2023* Earning Asset Yield Securities Yield Loan Yield 0.96% 1.41% 0.93% 0.38% 0.60% 1.96% 0.79% 1.17% 0.75% 0.29% 0.45% 1.56% 1.13% 1.52% 1.06% 0.55% 0.73% 2.16% 2018 2019 2020 2021 2022 2Q2023* Interest-bearing Deposit Rate Total Cost of Deposits Interest-bearing Liabilities 14 *
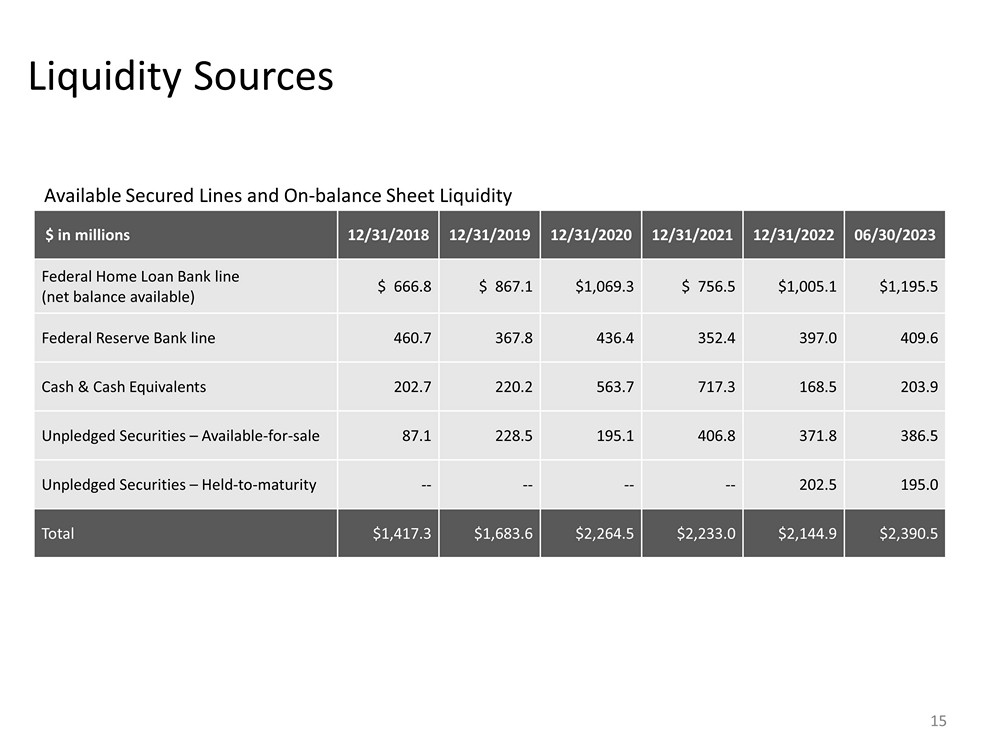
Liquidity Sources $ in millions 12/31/2018 12/31/2019 12/31/2020 12/31/2021 12/31/2022 06/30/2023 Federal Home Loan Bank line (net balance available) $ 666.8 $ 867.1 $1,069.3 $ 756.5 $1,005.1 $1,195.5 Federal Reserve Bank line 460.7 367.8 436.4 352.4 397.0 409.6 Cash & Cash Equivalents 202.7 220.2 563.7 717.3 168.5 203.9 Unpledged Securities – Available - for - sale 87.1 228.5 195.1 406.8 371.8 386.5 Unpledged Securities – Held - to - maturity -- -- -- -- 202.5 195.0 Total $1,417.3 $1,683.6 $2,264.5 $2,233.0 $2,144.9 $2,390.5 Available Secured Lines and On - balance Sheet Liquidity 15

Securities Portfolio In thousands, as of 6/30/2023 Available - for - sale Securities Par Value Book Value Market Value Tax - equiv. Yield Effective Duration Mortgage Backed Securities (incl. Multi - family) $327,257 $319,236 $278,493 2.56% 6.26 GNMA Multi - family Coll. Mortgage Obligations 87,575 87,777 76,500 2.19% 5.53 States & Political Subdivisions 56,624 59,403 56,723 3.87% 5.55 SBA Pools 72,691 72,740 65,194 3.00% 4.93 Total $544,147 $539,156 $476,910 2.70% Held - to - maturity Securities Par Value Book Value Market Value Tax - equiv. Yield Effective Duration Mortgage Backed Securities (incl. Multi - family) $ 72,412 $ 73,195 $ 63,161 3.35% 6.29 GNMA Multi - family Coll. Mortgage Obligations 119,000 118,932 104,919 2.21% 5.65 States & Political Subdivisions 6,080 6,213 5,534 2.27% 6.63 Total $197,492 $198,340 $173,614 2.63% 16

17 Deposit Mix By Type By Region Data as of June 30, 2023 Interest Checking/Savings 45.5% Non - interest Checking 20.3% CDs 20.1% Brokered CDs 13.9% IntraFI Network CDs 0.2% Springfield MO Metro 43.7% All Other Missouri 15.1% St. Louis Metro 13.0% Kansas City Metro 5.0% All Other Kansas 3.5% Sioux City IA Metro 7.0% Des Moines Metro/Central Iowa 5.9% Quad Cities IA Metro 2.6% Northwest Arkansas 0.7% Minnesota 3.5% $4.8 Billion ~ 234,000 deposit accounts ~ $24,000 average account balance ~ 15% u ninsured deposits (excludes internal subsidiary accounts) Top 30 largest deposit relationships (including public funds) represent only 8% of total deposits
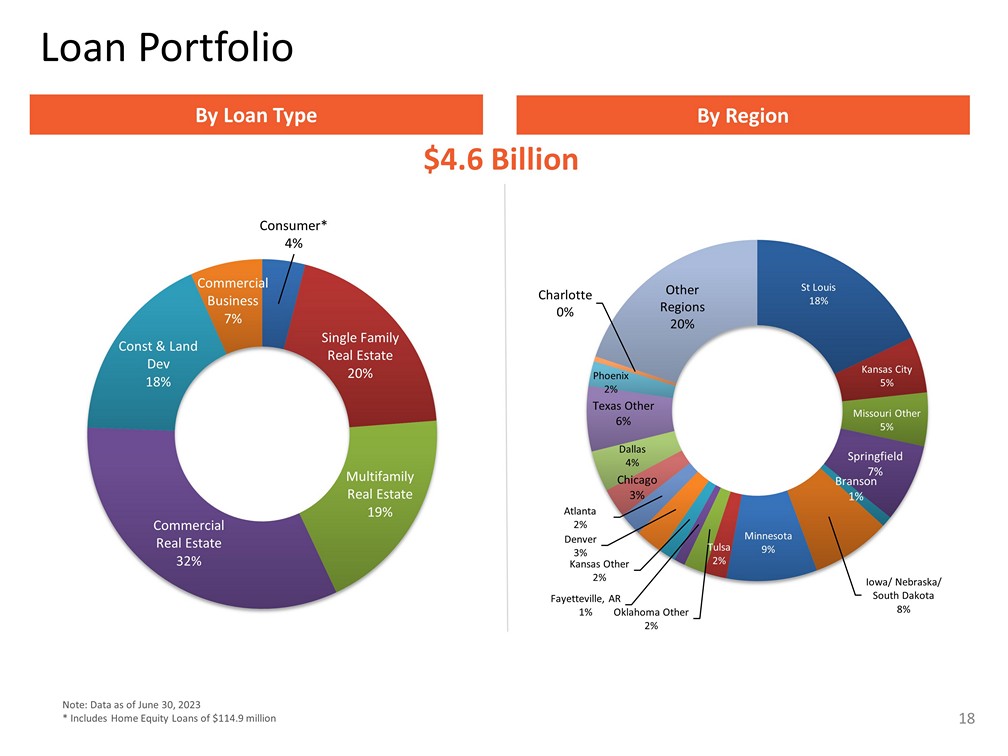
Portfolio Diversification $4.6 Billion *Includes Home Equity Loans of $110,237 18 Consumer* 4% Single Family Real Estate 20% Multifamily Real Estate 19% Commercial Real Estate 32% Const & Land Dev 18% Commercial Business 7% Note: Data as of June 30, 2023 * Includes Home Equity Loans of $114.9 million Loan Portfolio By Loan Type By Region St Louis 18% Kansas City 5% Missouri Other 5% Springfield 7% Branson 1% Iowa/ Nebraska/ South Dakota 8% Minnesota 9% Tulsa 2% Oklahoma Other 2% Fayetteville, AR 1% Kansas Other 2% Denver 3% Atlanta 2% Chicago 3% Dallas 4% Texas Other 6% Phoenix 2% Charlotte 0% Other Regions 20%
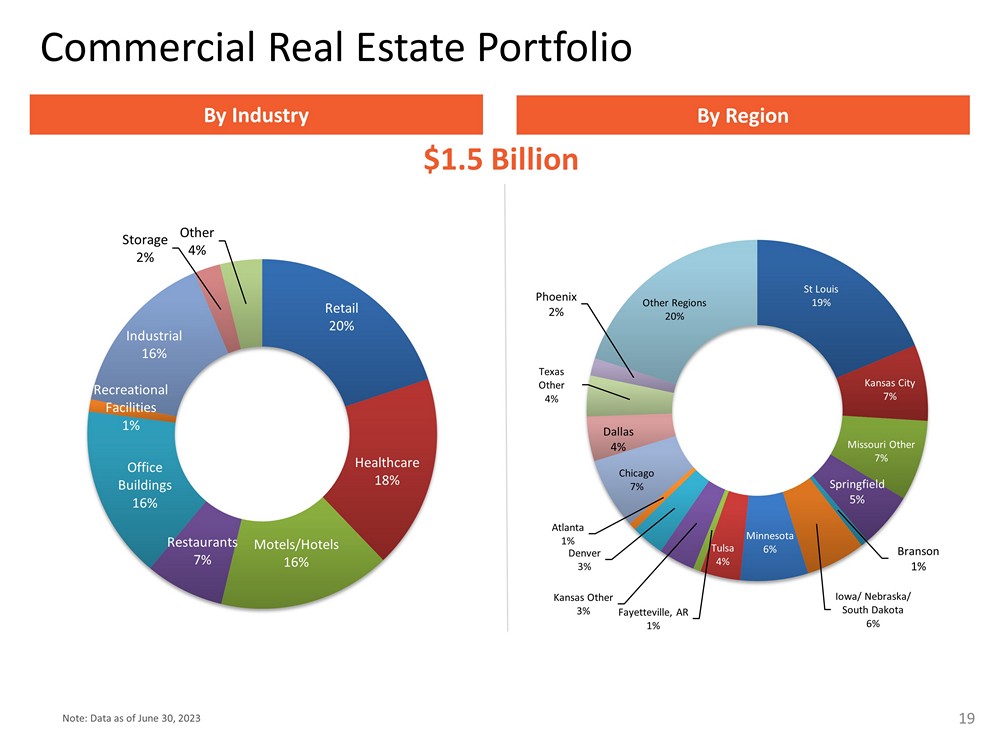
Portfolio Diversification $1.5 Billion *Includes Home Equity Loans of $110,237 19 Retail 20% Healthcare 18% Motels/Hotels 16% Restaurants 7% Office Buildings 16% Recreational Facilities 1% Industrial 16% Storage 2% Other 4% Note: Data as of June 30, 2023 Commercial Real Estate Portfolio By Industry By Region St Louis 19% Kansas City 7% Missouri Other 7% Springfield 5% Branson 1% Iowa/ Nebraska/ South Dakota 6% Minnesota 6% Tulsa 4% Fayetteville, AR 1% Kansas Other 3% Denver 3% Atlanta 1% Chicago 7% Dallas 4% Texas Other 4% Phoenix 2% Other Regions 20%
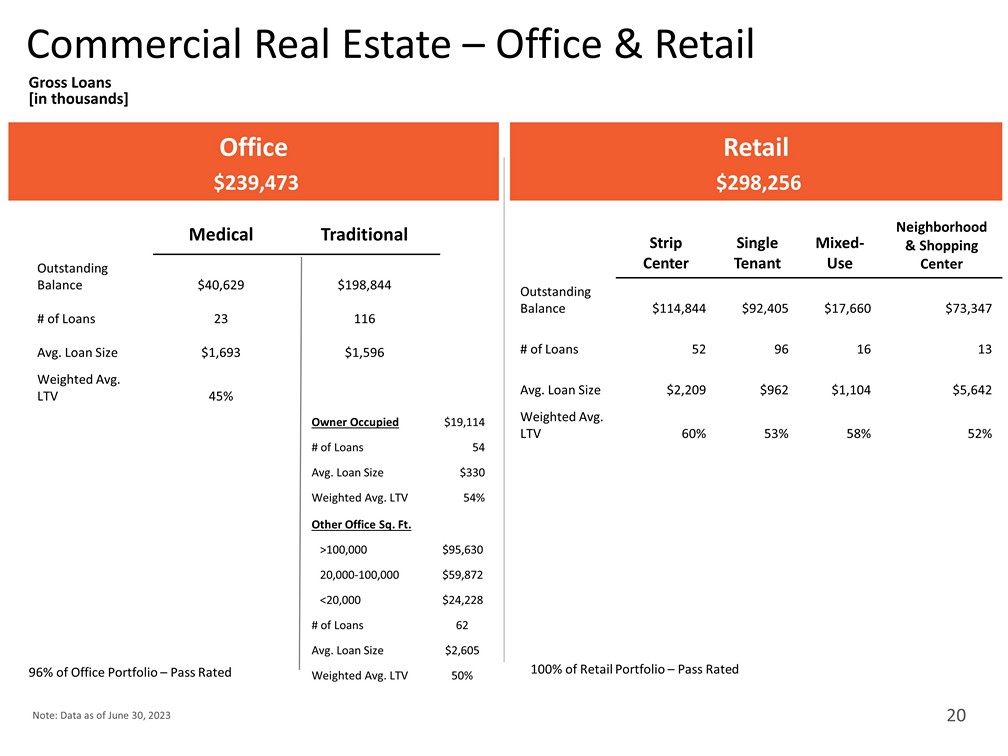
Commercial Real Estate – Office & Retail Gross Loans [in thousands] 20 Office $239,473 Retail $298,256 Medical Traditional Outstanding Balance $40,629 $198,844 # of Loans 23 116 Avg. Loan Size $1,693 $1,596 Weighted Avg. LTV 45% 96% of Office Portfolio – Pass Rated Strip Center Single Tenant Mixed - Use Neighborhood & Shopping Center Outstanding Balance $114,844 $92,405 $17,660 $73,347 # of Loans 52 96 16 13 Avg. Loan Size $2,209 $962 $1,104 $5,642 Weighted Avg. LTV 60% 53% 58% 52% 100% of Retail Portfolio – Pass Rated Owner Occupied $19,114 # of Loans 54 Avg. Loan Size $330 Weighted Avg. LTV 54% Other Office Sq. Ft. >100,000 $95,630 20,000 - 100,000 $59,872 <20,000 $24,228 # of Loans 62 Avg. Loan Size $2,605 Weighted Avg. LTV 50% Note: Data as of June 30, 2023 20
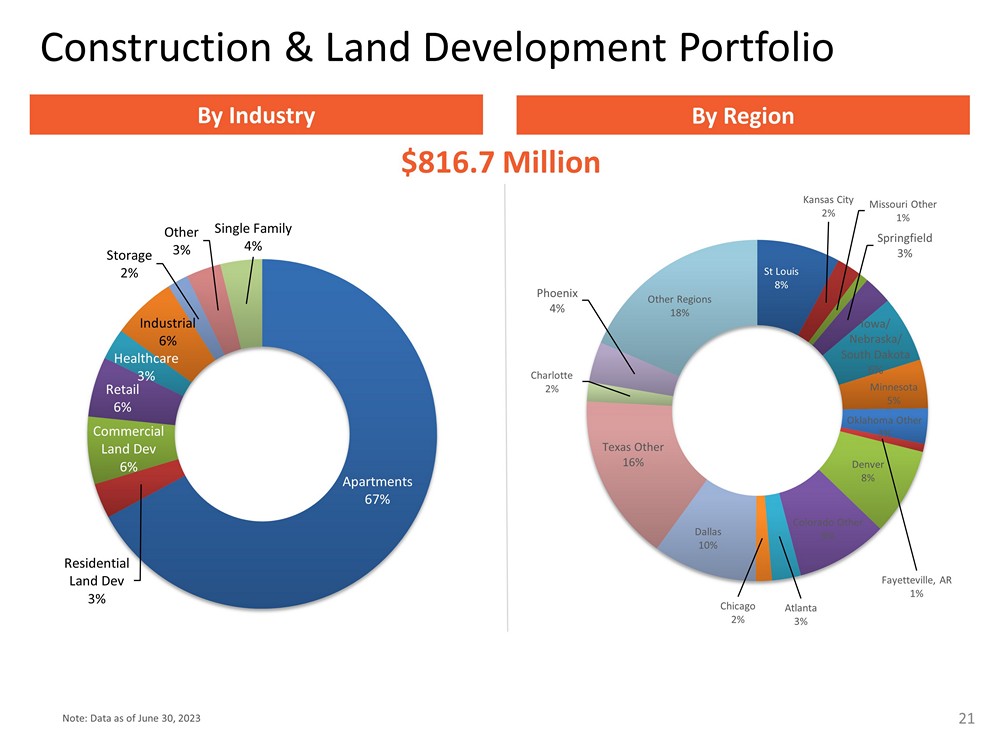
Portfolio Diversification $816.7 Million *Includes Home Equity Loans of $110,237 21 Apartments 67% Residential Land Dev 3% Commercial Land Dev 6% Retail 6% Healthcare 3% Industrial 6% Storage 2% Other 3% Single Family 4% Note: Data as of June 30, 2023 Construction & Land Development Portfolio By Industry By Region St Louis 8% Kansas City 2% Missouri Other 1% Springfield 3% Iowa/ Nebraska/ South Dakota 6% Minnesota 5% Oklahoma Other 3% Fayetteville, AR 1% Denver 8% Colorado Other 9% Atlanta 3% Chicago 2% Dallas 10% Texas Other 16% Charlotte 2% Phoenix 4% Other Regions 18%
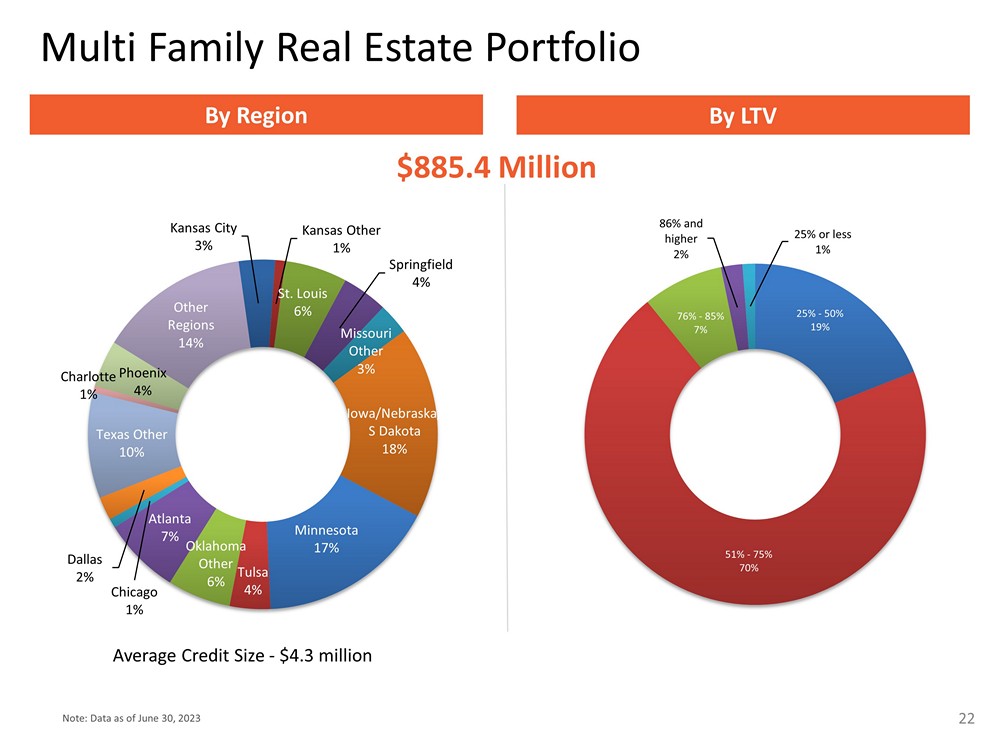
Portfolio Diversification $885.4 Million *Includes Home Equity Loans of $110,237 22 Kansas City 3% Kansas Other 1% St. Louis 6% Springfield 4% Missouri Other 3% Iowa/Nebraska/ S Dakota 18% Minnesota 17% Tulsa 4% Oklahoma Other 6% Atlanta 7% Chicago 1% Dallas 2% Texas Other 10% Charlotte 1% Phoenix 4% Other Regions 14% Note: Data as of June 30, 2023 Multi Family Real Estate Portfolio By Region By LTV 25% - 50% 19% 51% - 75% 70% 76% - 85% 7% 86% and higher 2% 25% or less 1% Average Credit Size - $4.3 million
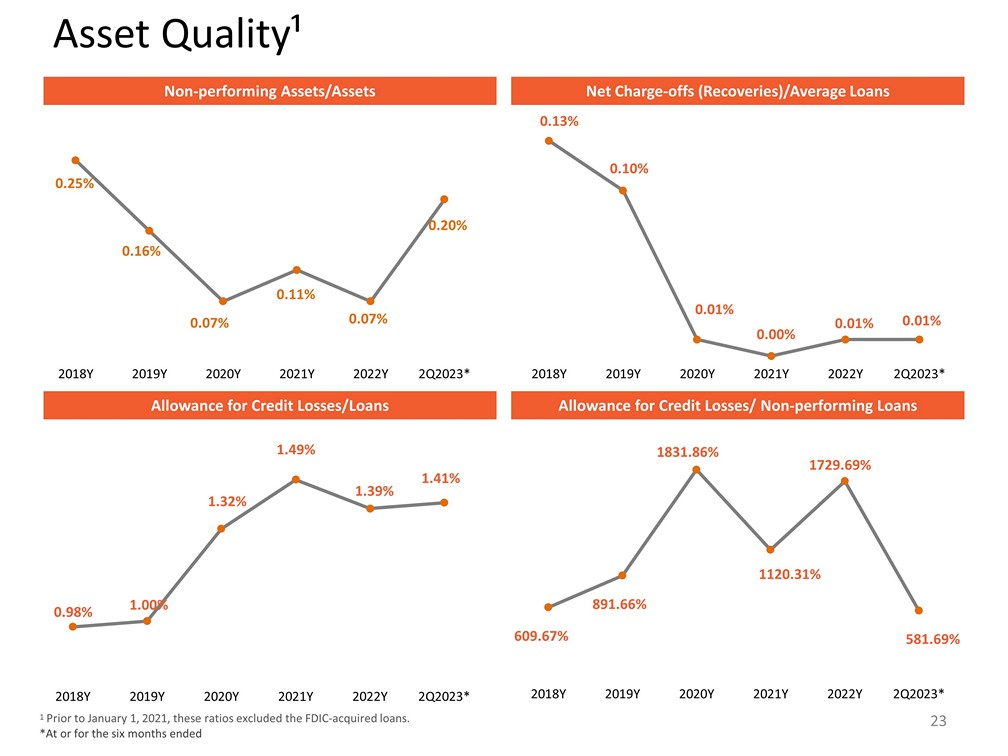
23 Asset Quality¹ Non - performing Assets/Assets Net Charge - offs (Recoveries)/Average Loans Allowance for Credit Losses/Loans Allowance for Credit Losses/ Non - performing Loans 1 Prior to January 1, 2021, these ratios excluded the FDIC - acquired loans. *At or for the six months ended 0.25% 0.16% 0.07% 0.11% 0.07% 0.20% 2018Y 2019Y 2020Y 2021Y 2022Y 2Q2023* 0.13% 0.10% 0.01% 0.00% 0.01% 0.01% 2018Y 2019Y 2020Y 2021Y 2022Y 2Q2023* 0.98% 1.00% 1.32% 1.49% 1.39% 1.41% 2018Y 2019Y 2020Y 2021Y 2022Y 2Q2023* 609.67% 891.66% 1831.86% 1120.31% 1729.69% 581.69% 2018Y 2019Y 2020Y 2021Y 2022Y 2Q2023*
24 Thank You For more information: x Visit our Web site: www.GreatSouthernBank.com x Sign up for e - mail notification to get the latest Great Southern news x Call us with questions: 417.895.5242

Appendix 25
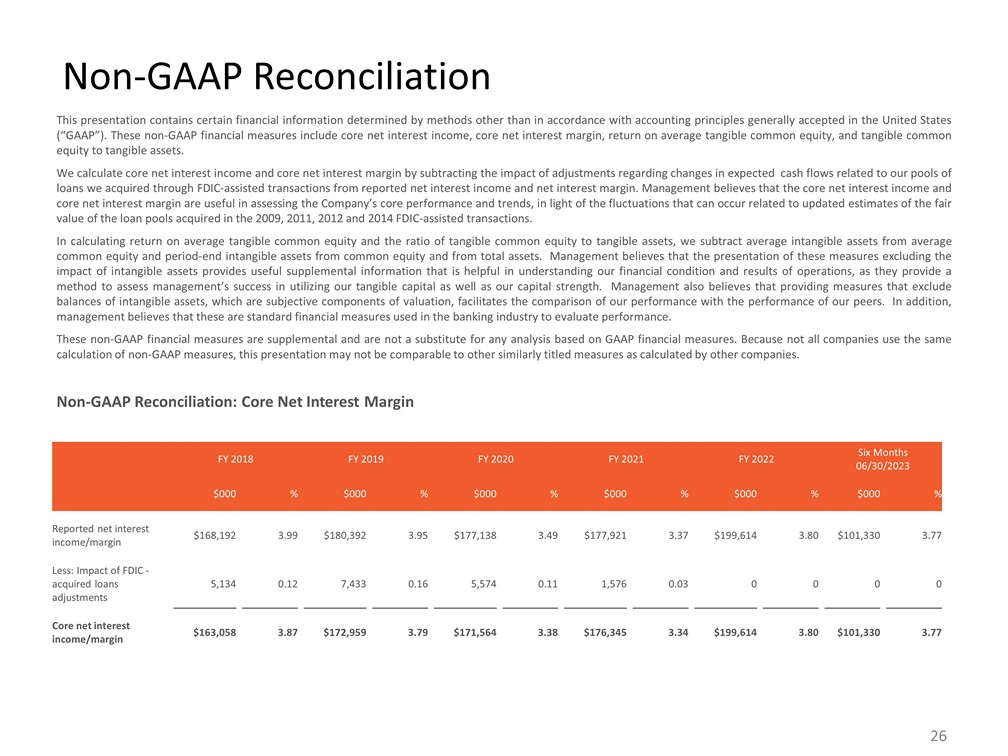
Non - GAAP Reconciliation: Core Net Interest Margin This presentation contains certain financial information determined by methods other than in accordance with accounting principles generally accepted in the United States (“GAAP”) . These non - GAAP financial measures include core net interest income, core net interest margin, return on average tangible common equity, and tangible common equity to tangible assets . We calculate core net interest income and core net interest margin by subtracting the impact of adjustments regarding changes in expected cash flows related to our pools of loans we acquired through FDIC - assisted transactions from reported net interest income and net interest margin . Management believes that the core net interest income and core net interest margin are useful in assessing the Company’s core performance and trends, in light of the fluctuations that can occur related to updated estimates of the fair value of the loan pools acquired in the 2009 , 2011 , 2012 and 2014 FDIC - assisted transactions . In calculating return on average tangible common equity and the ratio of tangible common equity to tangible assets, we subtract average intangible assets from average common equity and period - end intangible assets from common equity and from total assets . Management believes that the presentation of these measures excluding the impact of intangible assets provides useful supplemental information that is helpful in understanding our financial condition and results of operations, as they provide a method to assess management’s success in utilizing our tangible capital as well as our capital strength . Management also believes that providing measures that exclude balances of intangible assets, which are subjective components of valuation, facilitates the comparison of our performance with the performance of our peers . In addition, management believes that these are standard financial measures used in the banking industry to evaluate performance . These non - GAAP financial measures are supplemental and are not a substitute for any analysis based on GAAP financial measures . Because not all companies use the same calculation of non - GAAP measures, this presentation may not be comparable to other similarly titled measures as calculated by other companies . Non - GAAP Reconciliation FY 2018 FY 2019 FY 2020 FY 2021 FY 2022 Six Months 06/30/2023 $000 % $000 % $000 % $000 % $000 % $000 % Reported net interest income/margin $168,192 3.99 $180,392 3.95 $177,138 3.49 $177,921 3.37 $199,614 3.80 $101,330 3.77 Less: Impact of FDIC - acquired loans adjustments 5,134 0.12 7,433 0.16 5,574 0.11 1,576 0.03 0 0 0 0 Core net interest income/margin $163,058 3.87 $172,959 3.79 $171,564 3.38 $176,345 3.34 $199,614 3.80 $101,330 3.77 26
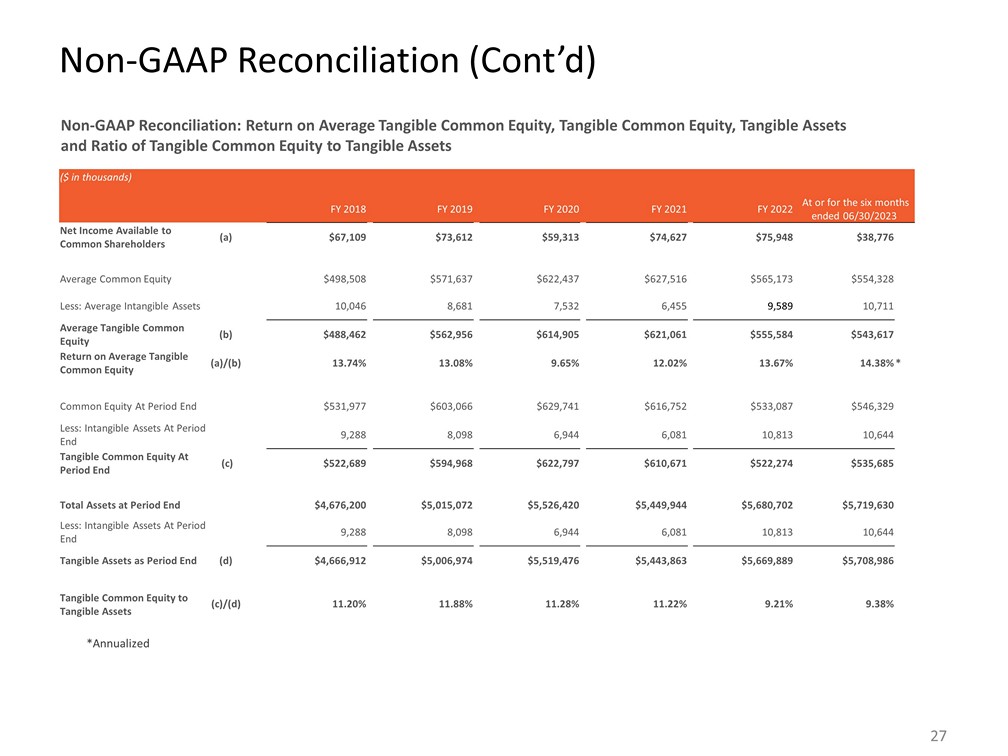
Non - GAAP Reconciliation: Return on Average Tangible Common Equity, Tangible Common Equity, Tangible Assets and Ratio of Tangible Common Equity to Tangible Assets ($ in thousands) FY 2018 FY 2019 FY 2020 FY 2021 FY 2022 At or for the six months ended 06/30/2023 Net Income Available to Common Shareholders (a) $67,109 $73,612 $59,313 $74,627 $75,948 $38,776 Average Common Equity $498,508 $571,637 $622,437 $627,516 $565,173 $554,328 Less: Average Intangible Assets 10,046 8,681 7,532 6,455 9,589 10,711 Average Tangible Common Equity (b) $488,462 $562,956 $614,905 $621,061 $555,584 $543,617 Return on Average Tangible Common Equity (a)/(b) 13.74% 13.08% 9.65% 12.02% 13.67% 14.38% * Common Equity At Period End $531,977 $603,066 $629,741 $616,752 $533,087 $546,329 Less: Intangible Assets At Period End 9,288 8,098 6,944 6,081 10,813 10,644 Tangible Common Equity At Period End (c) $522,689 $594,968 $622,797 $610,671 $522,274 $535,685 Total Assets at Period End $4,676,200 $5,015,072 $5,526,420 $5,449,944 $5,680,702 $5,719,630 Less: Intangible Assets At Period End 9,288 8,098 6,944 6,081 10,813 10,644 Tangible Assets as Period End (d) $4,666,912 $5,006,974 $5,519,476 $5,443,863 $5,669,889 $5,708,986 Tangible Common Equity to Tangible Assets (c)/(d) 11.20% 11.88% 11.28% 11.22% 9.21% 9.38% *Annualized 27 Non - GAAP Reconciliation (Cont’d)
SIGNATURES
Pursuant to the requirements of the Securities
Exchange Act of 1934, the registrant has duly caused this report to be signed on its behalf by the undersigned hereunto duly authorized.
| |
|
|
GREAT SOUTHERN BANCORP, INC. |
|
| |
|
|
|
|
| |
|
|
|
|
| Date: August 7, 2023 |
|
By: |
/s/ Joseph W. Turner |
|
| |
|
|
Joseph W. Turner, President and Chief Executive Officer |
|
v3.23.2
| X |
- DefinitionBoolean flag that is true when the XBRL content amends previously-filed or accepted submission.
| Name: |
dei_AmendmentFlag |
| Namespace Prefix: |
dei_ |
| Data Type: |
xbrli:booleanItemType |
| Balance Type: |
na |
| Period Type: |
duration |
|
| X |
- DefinitionFor the EDGAR submission types of Form 8-K: the date of the report, the date of the earliest event reported; for the EDGAR submission types of Form N-1A: the filing date; for all other submission types: the end of the reporting or transition period. The format of the date is YYYY-MM-DD.
| Name: |
dei_DocumentPeriodEndDate |
| Namespace Prefix: |
dei_ |
| Data Type: |
xbrli:dateItemType |
| Balance Type: |
na |
| Period Type: |
duration |
|
| X |
- DefinitionThe type of document being provided (such as 10-K, 10-Q, 485BPOS, etc). The document type is limited to the same value as the supporting SEC submission type, or the word 'Other'.
| Name: |
dei_DocumentType |
| Namespace Prefix: |
dei_ |
| Data Type: |
dei:submissionTypeItemType |
| Balance Type: |
na |
| Period Type: |
duration |
|
| X |
- DefinitionAddress Line 1 such as Attn, Building Name, Street Name
| Name: |
dei_EntityAddressAddressLine1 |
| Namespace Prefix: |
dei_ |
| Data Type: |
xbrli:normalizedStringItemType |
| Balance Type: |
na |
| Period Type: |
duration |
|
| X |
- Definition
+ References
+ Details
| Name: |
dei_EntityAddressCityOrTown |
| Namespace Prefix: |
dei_ |
| Data Type: |
xbrli:normalizedStringItemType |
| Balance Type: |
na |
| Period Type: |
duration |
|
| X |
- DefinitionCode for the postal or zip code
| Name: |
dei_EntityAddressPostalZipCode |
| Namespace Prefix: |
dei_ |
| Data Type: |
xbrli:normalizedStringItemType |
| Balance Type: |
na |
| Period Type: |
duration |
|
| X |
- DefinitionName of the state or province.
| Name: |
dei_EntityAddressStateOrProvince |
| Namespace Prefix: |
dei_ |
| Data Type: |
dei:stateOrProvinceItemType |
| Balance Type: |
na |
| Period Type: |
duration |
|
| X |
- DefinitionA unique 10-digit SEC-issued value to identify entities that have filed disclosures with the SEC. It is commonly abbreviated as CIK. Reference 1: http://www.xbrl.org/2003/role/presentationRef
-Publisher SEC
-Name Exchange Act
-Number 240
-Section 12
-Subsection b-2
| Name: |
dei_EntityCentralIndexKey |
| Namespace Prefix: |
dei_ |
| Data Type: |
dei:centralIndexKeyItemType |
| Balance Type: |
na |
| Period Type: |
duration |
|
| X |
- DefinitionIndicate if registrant meets the emerging growth company criteria. Reference 1: http://www.xbrl.org/2003/role/presentationRef
-Publisher SEC
-Name Exchange Act
-Number 240
-Section 12
-Subsection b-2
| Name: |
dei_EntityEmergingGrowthCompany |
| Namespace Prefix: |
dei_ |
| Data Type: |
xbrli:booleanItemType |
| Balance Type: |
na |
| Period Type: |
duration |
|
| X |
- DefinitionCommission file number. The field allows up to 17 characters. The prefix may contain 1-3 digits, the sequence number may contain 1-8 digits, the optional suffix may contain 1-4 characters, and the fields are separated with a hyphen.
| Name: |
dei_EntityFileNumber |
| Namespace Prefix: |
dei_ |
| Data Type: |
dei:fileNumberItemType |
| Balance Type: |
na |
| Period Type: |
duration |
|
| X |
- DefinitionTwo-character EDGAR code representing the state or country of incorporation.
| Name: |
dei_EntityIncorporationStateCountryCode |
| Namespace Prefix: |
dei_ |
| Data Type: |
dei:edgarStateCountryItemType |
| Balance Type: |
na |
| Period Type: |
duration |
|
| X |
- DefinitionThe exact name of the entity filing the report as specified in its charter, which is required by forms filed with the SEC. Reference 1: http://www.xbrl.org/2003/role/presentationRef
-Publisher SEC
-Name Exchange Act
-Number 240
-Section 12
-Subsection b-2
| Name: |
dei_EntityRegistrantName |
| Namespace Prefix: |
dei_ |
| Data Type: |
xbrli:normalizedStringItemType |
| Balance Type: |
na |
| Period Type: |
duration |
|
| X |
- DefinitionThe Tax Identification Number (TIN), also known as an Employer Identification Number (EIN), is a unique 9-digit value assigned by the IRS. Reference 1: http://www.xbrl.org/2003/role/presentationRef
-Publisher SEC
-Name Exchange Act
-Number 240
-Section 12
-Subsection b-2
| Name: |
dei_EntityTaxIdentificationNumber |
| Namespace Prefix: |
dei_ |
| Data Type: |
dei:employerIdItemType |
| Balance Type: |
na |
| Period Type: |
duration |
|
| X |
- DefinitionLocal phone number for entity.
| Name: |
dei_LocalPhoneNumber |
| Namespace Prefix: |
dei_ |
| Data Type: |
xbrli:normalizedStringItemType |
| Balance Type: |
na |
| Period Type: |
duration |
|
| X |
- DefinitionBoolean flag that is true when the Form 8-K filing is intended to satisfy the filing obligation of the registrant as pre-commencement communications pursuant to Rule 13e-4(c) under the Exchange Act. Reference 1: http://www.xbrl.org/2003/role/presentationRef
-Publisher SEC
-Name Exchange Act
-Number 240
-Section 13e
-Subsection 4c
| Name: |
dei_PreCommencementIssuerTenderOffer |
| Namespace Prefix: |
dei_ |
| Data Type: |
xbrli:booleanItemType |
| Balance Type: |
na |
| Period Type: |
duration |
|
| X |
- DefinitionBoolean flag that is true when the Form 8-K filing is intended to satisfy the filing obligation of the registrant as pre-commencement communications pursuant to Rule 14d-2(b) under the Exchange Act. Reference 1: http://www.xbrl.org/2003/role/presentationRef
-Publisher SEC
-Name Exchange Act
-Number 240
-Section 14d
-Subsection 2b
| Name: |
dei_PreCommencementTenderOffer |
| Namespace Prefix: |
dei_ |
| Data Type: |
xbrli:booleanItemType |
| Balance Type: |
na |
| Period Type: |
duration |
|
| X |
- DefinitionTitle of a 12(b) registered security. Reference 1: http://www.xbrl.org/2003/role/presentationRef
-Publisher SEC
-Name Exchange Act
-Number 240
-Section 12
-Subsection b
| Name: |
dei_Security12bTitle |
| Namespace Prefix: |
dei_ |
| Data Type: |
dei:securityTitleItemType |
| Balance Type: |
na |
| Period Type: |
duration |
|
| X |
- DefinitionName of the Exchange on which a security is registered. Reference 1: http://www.xbrl.org/2003/role/presentationRef
-Publisher SEC
-Name Exchange Act
-Number 240
-Section 12
-Subsection d1-1
| Name: |
dei_SecurityExchangeName |
| Namespace Prefix: |
dei_ |
| Data Type: |
dei:edgarExchangeCodeItemType |
| Balance Type: |
na |
| Period Type: |
duration |
|
| X |
- DefinitionBoolean flag that is true when the Form 8-K filing is intended to satisfy the filing obligation of the registrant as soliciting material pursuant to Rule 14a-12 under the Exchange Act. Reference 1: http://www.xbrl.org/2003/role/presentationRef
-Publisher SEC
-Name Exchange Act
-Section 14a
-Number 240
-Subsection 12
| Name: |
dei_SolicitingMaterial |
| Namespace Prefix: |
dei_ |
| Data Type: |
xbrli:booleanItemType |
| Balance Type: |
na |
| Period Type: |
duration |
|
| X |
- DefinitionTrading symbol of an instrument as listed on an exchange.
| Name: |
dei_TradingSymbol |
| Namespace Prefix: |
dei_ |
| Data Type: |
dei:tradingSymbolItemType |
| Balance Type: |
na |
| Period Type: |
duration |
|
| X |
- DefinitionBoolean flag that is true when the Form 8-K filing is intended to satisfy the filing obligation of the registrant as written communications pursuant to Rule 425 under the Securities Act. Reference 1: http://www.xbrl.org/2003/role/presentationRef
-Publisher SEC
-Name Securities Act
-Number 230
-Section 425
| Name: |
dei_WrittenCommunications |
| Namespace Prefix: |
dei_ |
| Data Type: |
xbrli:booleanItemType |
| Balance Type: |
na |
| Period Type: |
duration |
|
Great Southern Bancorp (NASDAQ:GSBC)
過去 株価チャート
から 4 2024 まで 5 2024

Great Southern Bancorp (NASDAQ:GSBC)
過去 株価チャート
から 5 2023 まで 5 2024
