 US Market News
2月前
US Market News
2月前
CRITEO REPORTS FIRST QUARTER 2026 RESULTSMay 6, 2026 7:00 AM
PR Newswire (US) Q1 Activated Media Spend Surpasses $1 Billion for the First Time
Deployed $31 Million to Repurchase Shares in Q1 2026NEW YORK, May 6, 2026 /PRNewswire/ -- Criteo S.A. (NASDAQ: CRTO) ("Criteo" or the "Company"), the global commerce intelligence platform, today announced financial results for the first quarter ended March 31, 2026.First Quarter 2026 Financial Highlights:The following table summarizes our consolidated financial results for the three months ended March 31, 2026:
Three Months Ended
March 31,
2026
2025
YoY Change
(in millions, except EPS data)GAAP Results
Revenue$425
$451
(6) %Gross Profit$223
$237
(6) %Net Income$9
$40
(79) %Gross Profit margin52 %
52 %
0 pptDiluted EPS$0.15
$0.66
(77) %Cash from operating activities$48
$62
(23) %Cash and cash equivalents$320
$286
12 %
Non-GAAP Results1
Contribution ex-TAC$250
$264
(5) %Adjusted EBITDA$65
$92
(30) %Adjusted diluted EPS$0.73
$1.10
(34) %Free Cash Flow (FCF)$16
$45
(65) %FCF / Adjusted EBITDA25 %
49 %
(24) ppt"We delivered a solid start to 2026 with disciplined execution and meaningful progress against our strategy," said Michael Komasinski, Chief Executive Officer of Criteo. "While the near-term outlook reflects a more challenging environment, we are advancing our AI roadmap, strengthening our commercial organization, and scaling our AI-driven solutions across Performance Media and Retail Media. We remain confident in our path to reacceleration and the opportunity ahead."Operating HighlightsCriteo became the first advertising technology partner integrating with OpenAI's advertising solution.We expanded our GO platform with full self-service access and agentic onboarding for small and mid-sized businesses (SMBs).Criteo's media spend2 was $4.4 billion in the last 12 months and $1.0 billion in Q1 2026, up 8% year-over-year at constant currency3.Retail Media Contribution ex-TAC was down (32)% year-over-year at constant currency3, as expected, reflecting the impact of previously communicated scope changes with two specific Retail Media clients. Excluding this impact, Contribution ex-TAC grew 24% in Q1 across the underlying client base.We expanded our DoorDash partnership in Canada and added Hyundai Department Store in APAC, further strengthening our Retail Media footprint.Performance Media Contribution ex-TAC was down (2)% year-over-year at constant currency3.We deployed $31 million of capital for share repurchases in the first three months of 2026.We received overwhelming shareholder support to redomicile from France to Luxembourg, with completion expected in the third quarter of 2026.___________________________________________________1 Contribution ex-TAC, Adjusted EBITDA, Adjusted EBITDA margin, Adjusted diluted EPS and Free Cash Flow are not measures calculated in accordance with U.S. GAAP.2 Media spend is defined as working media spend allocated to Retail Media campaigns and media spend activated on behalf of Performance Media clients.3 Constant currency measures exclude the impact of foreign currency fluctuations and is computed by applying the prior year monthly exchange rates to transactions denominated in settlement or billing currencies other than the U.S. dollar.Financial SummaryRevenue for Q1 2026 was $425 million, gross profit was $223 million and Contribution ex-TAC was $250 million. Net income for Q1 2026 was $9 million, representing $0.15 per share on a diluted basis. Adjusted EBITDA for Q1 2026 was $65 million, resulting in an adjusted diluted EPS of $0.73. As reported, revenue for Q1 decreased (6)%, gross profit decreased (6)% and Contribution ex-TAC decreased (5)%. At constant currency, revenue for Q1 2026 decreased (9)% and Contribution ex-TAC decreased (9)%. Cash flow from operating activities was $48 million in Q1 2026 and Free Cash Flow was $16 million in Q1 2026. As of March 31, 2026, we had $371 million in cash and marketable securities on our balance sheet.Sarah Glickman, Chief Financial Officer, said, "Our first quarter results reflect strong execution, while our outlook incorporates macro volatility, including geopolitical tensions in the Middle East and the lower marketing budgets for certain large Performance Media U.S. clients so far in the second quarter. We are taking a prudent approach, with a continued focus on execution and cost discipline."First Quarter 2026 ResultsRevenue, Gross Profit and Contribution ex-TACRevenue decreased (6)% year-over-year in Q1 2026, or decreased (9)% at constant currency, to $425 million (Q1 2025: $451 million). Gross profit decreased (6)% year-over-year in Q1 2026 to $223 million (Q1 2025: $237 million). Gross profit as a percentage of revenue, or gross profit margin, was 52% (Q1 2025: 52%). Contribution ex-TAC in the first quarter decreased (5)% year-over-year, or decreased (9)% at constant currency, to $250 million (Q1 2025: $264 million).Retail Media revenue decreased (31)%, or (32)% at constant currency, and Retail Media Contribution ex-TAC decreased (31)%, or (32)% at constant currency, reflecting a $27 million headwind from previously communicated scope changes with two specific Retail Media clients, partially offset by strong growth across the broader retail partner base. Excluding this impact, Contribution ex-TAC grew 24% in Q1 across the underlying client base.Performance Media revenue decreased (2)%, or decreased (6)% at constant currency, and Performance Media Contribution ex-TAC increased 2%, or decreased (2)% at constant currency, reflecting mixed trends in Commerce Growth, continued momentum in our SSP, and improvement in AdTech services.Net Income and Adjusted Net IncomeNet income was $9 million in Q1 2026 (Q1 2025: net income: $40 million). Net income allocated to shareholders of Criteo was $8 million, or $0.15 per share on a diluted basis (Q1 2025: net income allocated to shareholders of $38 million, or $0.66 per share on a diluted basis).Adjusted net income, a non-GAAP financial measure, was $37 million, or $0.73 per share on a diluted basis (Q1 2025: $63 million, or $1.10 per share on a diluted basis).Adjusted EBITDA and Operating ExpensesAdjusted EBITDA was $65 million (Q1 2025: $92 million), reflecting lower Contribution ex-TAC due to the temporary impact of previously communicated scope changes with two specific Retail Media clients, along with planned growth investments in a seasonally low quarter. Adjusted EBITDA as a percentage of Contribution ex-TAC, or Adjusted EBITDA margin, was 26% (Q1 2025: 35%).Operating expenses increased 12% year-over-year to $212 million (Q1 2025: $189 million), mostly driven by planned growth investments. Non-GAAP operating expenses increased 10% year-over-year to $165 million (Q1 2025: $151 million).Cash Flow, Cash and Financial Liquidity PositionCash flow from operating activities was $48 million in Q1 2026 (Q1 2025: $62 million).Free Cash Flow was $16 million in Q1 2026 (Q1 2025: $45 million). On a trailing 12-month basis, Free Cash Flow was $181 million.Cash and cash equivalents, and marketable securities, were $371 million, a $(17) million decrease compared to December 31, 2025, after spending $31 million on share repurchases in the three months ended March 31, 2026.As of March 31, 2026, the Company had total financial liquidity of approximately $889 million, including $320 million of cash and cash equivalents, $51 million of marketable securities, $468 million available through its revolving credit facility, and $49 million of treasury shares reserved for M&A. Subsequent to March 31, 2026, the Company cancelled 1.9 million of M&A treasury shares in April, representing approximately $39 million.2026 Business OutlookThe following forward-looking statements reflect Criteo's expectations as of May 6, 2026, including current macro-economic conditions, ongoing geopolitical tensions in the Middle East, and a prudent approach to guidance based on quarter-to-date trends.Fiscal year 2026 guidance:We now expect Contribution ex-TAC to decrease low-single-digit at constant currency.We continue to expect an Adjusted EBITDA margin of approximately 32% to 34% of Contribution ex-TAC.Second quarter 2026 guidance:We expect Contribution ex-TAC between $260 million and $264 million, or -11% to -9% year-over-year at constant-currency.We expect Adjusted EBITDA between $67 million and $71 million.The Company's second quarter 2026 guidance reflects the temporary impact of previously communicated scope changes with two specific Retail Media clients.The above guidance for the fiscal year ending December 31, 2026 assumes the following exchange rates for the main currencies impacting our business: a U.S. dollar-euro rate of 0.862, a U.S. dollar-Japanese Yen rate of 154, a U.S. dollar-British Pound rate of 0.750, a U.S. dollar-Korean Won rate of 1,500 and a U.S. dollar-Brazilian Real rate of 5.300.The above guidance assumes that no acquisitions and dispositions are completed during the second quarter of 2026 or the fiscal year ended December 31, 2026.Reconciliations of Contribution ex-TAC, Adjusted EBITDA and Adjusted EBITDA margin guidance to the closest corresponding U.S. GAAP measures are not available without unreasonable efforts on a forward-looking basis due to the high variability, complexity and low visibility with respect to the charges excluded from these non-GAAP measures; in particular, the measures and effects of equity awards compensation expense specific to equity compensation awards that are directly impacted by unpredictable fluctuations in our share price. The variability of the above charges could potentially have a significant impact on our future U.S. GAAP financial results.Non-GAAP Financial MeasuresThis press release and its attachments include the following financial measures defined as non-GAAP financial measures by the U.S. Securities and Exchange Commission ("SEC"): Contribution ex-TAC, Adjusted EBITDA, Adjusted EBITDA margin, Adjusted Net Income, Adjusted diluted EPS, Free Cash Flow and Non-GAAP Operating Expenses. These measures are not calculated in accordance with U.S. GAAP.Contribution ex-TAC is a profitability measure akin to gross profit. It is calculated by deducting traffic acquisition costs from revenue and reconciled to gross profit through the exclusion of other costs of revenue. Contribution ex-TAC is not a measure calculated in accordance with U.S. GAAP. We have included Contribution ex-TAC because it is a key measure used by our management and board of directors to evaluate operating performance, generate future operating plans and make strategic decisions. In particular, we believe that this measure can provide useful measures for period-to-period comparisons of our business. Accordingly, we believe that Contribution ex-TAC provides useful information to investors and others in understanding and evaluating our results of operations in the same manner as our management and board of directors.Adjusted EBITDA is our consolidated earnings before financial income (expense), income taxes, depreciation and amortization, adjusted to eliminate the impact of equity related compensation, which includes employee equity awards compensation and director fees for share purchases, pension service costs, certain acquisition costs, certain restructuring and related costs, integration and transformation costs, and other nonrecurring or noncash items impacting net income that we do not consider indicative of our ongoing business performance. Adjusted EBITDA and Adjusted EBITDA margin are key measures used by our management and board of directors to understand and evaluate our core operating performance and trends, to prepare and approve our annual budget and to develop short- and long-term operational plans. In particular, we believe that Adjusted EBITDA and Adjusted EBITDA margin can provide useful measures for period-to-period comparisons of our business. Accordingly, we believe that Adjusted EBITDA and Adjusted EBITDA margin provide useful information to investors and the market generally in understanding and evaluating our results of operations in the same manner as our management and board of directors.Adjusted Net Income is our net income adjusted to eliminate the impact of equity related compensation, which includes employee equity awards compensation and director fees for share purchases, amortization of acquisition-related assets, certain restructuring and related costs, integration and transformation costs, certain acquisition costs, other nonrecurring or noncash items impacting net income that we do not consider indicative of our ongoing business performance, and the tax impact of these adjustments. Adjusted Net Income and Adjusted diluted EPS are key measures used by our management and board of directors to evaluate operating performance, generate future operating plans and make strategic decisions regarding the allocation of capital. In particular, we believe that Adjusted Net Income and Adjusted diluted EPS can provide useful measures for period-to-period comparisons of our business. Accordingly, we believe that Adjusted Net Income and Adjusted diluted EPS provide useful information to investors and the market generally in understanding and evaluating our results of operations in the same manner as our management and board of directors.Free Cash Flow is defined as cash flow from operating activities less net acquisition of intangible assets, property, and equipment. Free Cash Flow Conversion is defined as free cash flow divided by Adjusted EBITDA. Free Cash Flow and Free Cash Flow Conversion are key measures used by our management and board of directors to evaluate the Company's ability to generate cash. Accordingly, we believe that Free Cash Flow and Free Cash Flow Conversion permit a more complete and comprehensive analysis of our available cash flows.Non-GAAP Operating Expenses are our consolidated operating expenses adjusted to eliminate depreciation and amortization, equity related compensation, which includes employee equity awards compensation and director fees for share purchases, pension service costs, certain restructuring and related costs, integration and transformation costs, certain acquisition costs, and other nonrecurring or noncash items. The Company uses Non-GAAP Operating Expenses to understand and compare operating results across accounting periods, for internal budgeting and forecasting purposes, for short-term and long-term operational plans, and to assess and measure our financial performance and the ability of our operations to generate cash. We believe Non-GAAP Operating Expenses reflects our ongoing operating expenses in a manner that allows for meaningful period-to-period comparisons and analysis of trends in our business. As a result, we believe that Non-GAAP Operating Expenses provides useful information to investors in understanding and evaluating our core operating performance and trends in the same manner as our management and in comparing financial results across periods. In addition, Non-GAAP Operating Expenses is a key component in calculating Adjusted EBITDA, which is one of the key measures the Company uses to provide its quarterly and annual business outlook to the investment community.Please refer to the supplemental financial tables provided in the appendix of this press release for a reconciliation of Contribution ex-TAC to gross profit, Adjusted EBITDA to net income, Adjusted Net Income to net income, Free Cash Flow to cash flow from operating activities, and Non-GAAP Operating Expenses to operating expenses, in each case, the most comparable U.S. GAAP measure. Our use of non-GAAP financial measures has limitations as an analytical tool, and you should not consider such non-GAAP measures in isolation or as a substitute for analysis of our financial results as reported under U.S. GAAP. Some of these limitations are: 1) other companies, including companies in our industry which have similar business arrangements, may address the impact of TAC differently; and 2) other companies may report Contribution ex-TAC, Contribution ex-TAC margin, Adjusted EBITDA, Adjusted Net Income, Free Cash Flow, Non-GAAP Operating Expenses or similarly titled measures but calculate them differently or over different regions, which reduces their usefulness as comparative measures. Because of these and other limitations, you should consider these measures alongside our U.S. GAAP financial results, including revenue and net income.Forward-Looking Statements DisclosureThis press release contains forward-looking statements, including projected financial results for the quarter ending December 31, 2026 and the year ending December 31, 2026, our expectations regarding our market opportunity and future growth prospects and other statements that are not historical facts and involve risks and uncertainties that could cause actual results to differ materially. Factors that might cause or contribute to such differences include, but are not limited to: failure related to our technology and our ability to innovate and respond to changes in technology, including our use and expected use of AI; uncertainty regarding our ability to access a consistent supply of internet display advertising inventory and expand access to such inventory; investments in new business opportunities and the timing of these investments, whether the projected benefits of acquisitions or strategic transactions, including the redomiciliation from France to Luxembourg (the "Conversion"), materialize as expected; uncertainty regarding our international operations and expansion, including related to changes in a specific country's or region's political or economic conditions or policies and related uncertainties (such as the imposition and enforceability of tariffs); the impact of competition or client in-housing; uncertainty regarding legislative, regulatory or self-regulatory developments regarding data privacy matters and the impact of efforts by other participants in our industry to comply therewith; our ability to obtain and utilize certain data as a result of consumer concerns regarding data collection and sharing, as well as potential limitations in accessing data from third parties; failure to enhance our brand cost-effectively, recent growth rates not being indicative of future growth; client flexibility to increase or decrease spend; our ability to manage growth, potential fluctuations in operating results, our ability to grow our base of clients, and the financial impact of maximizing Contribution ex-TAC, as well as risks related to future opportunities and plans, including the uncertainty of expected future financial performance and results; changes in general political, economic and competitive conditions and specific market conditions; adverse changes in the advertising industry; changes in applicable laws or accounting practices; the Conversion not being completed; the impact or outcome of any legal proceedings or regulatory actions that may be instituted against us in connection with the Conversion; failure to list our shares on Nasdaq following the Conversion or maintain our listing thereafter; inability to take advantage of the potential strategic opportunities provided by, and realize the potential benefits of, the Conversion; the disruption of current plans and operations by the Conversion; the disruption to the Company's relationships, including with employees, landowners, suppliers, lenders, partners, governments and shareholders; the future financial performance of Criteo following the Conversion, including our anticipated growth rate and market opportunity; changes in shareholders' rights as a result of the Conversion; inability to terminate the deposit agreement and withdraw our ordinary shares from the depositary so as to terminate our ADS program in connection with the Conversion; difficulty in adapting to operating under the laws of Luxembourg; following the completion of the Conversion, a delay or failure in our ability to redomicile to the United States via the merger into a newly incorporated and wholly-owned U.S. subsidiary for any reason; costs or taxes related to the Conversion; and those risks detailed from time-to-time under the caption "Risk Factors" and elsewhere in the Company's SEC filings and reports, including the Company's Annual Report on Form 10-K for the fiscal year ended December 31, 2025, filed with the SEC on February 26, 2026, and in subsequent Quarterly Reports on Form 10-Q, as well as future filings and reports by the Company. Importantly, at this time, macro-economic conditions including inflation and fluctuating interest rates in the U.S. have impacted and may continue to impact Criteo's business, financial condition, cash flow and results of operations. Accordingly, a forward-looking statement is neither a prediction nor a guarantee of future events or circumstances and those future events or circumstances may not occur. You should not place undue reliance on the forward-looking statements, which speak only as of the date of this release.Except as required by law, the Company undertakes no duty or obligation to update any forward-looking statements contained in this release as a result of new information, future events, changes in expectations or otherwise.Conference Call InformationCriteo's senior management team will discuss the Company's earnings on a call that will take place today, May 6, 2026, at 8:00 AM ET, 2:00 PM CET. The conference call will be webcast live on the Company's website at https://criteo.investorroom.com/ and will subsequently be available for replay.United States: +1 800 836 8184International: +1 646 357 8785France 080-094-5120Please ask to be joined into the "Criteo" call.About CriteoCriteo (NASDAQ: CRTO) is the global commerce intelligence platform that drives performance for brands, agencies, retailers, and publishers. Built on proprietary commerce data from more than $1 trillion in annual sales and two decades of AI innovation, Criteo helps companies across the ecosystem make smarter decisions and achieve better outcomes, while delivering more relevant experiences for shoppers. With thousands of clients and deep partnerships across global retail and digital commerce, Criteo provides the technology and insights businesses need to compete and grow. For more information, please visit www.criteo.com. ContactsInvestor Relations & Corporate Communications
Melanie Dambre, m.dambre@criteo.com Public Relations
Jessica Meyers, j.meyers@criteo.com Financial information to followCRITEO S.A.Consolidated Statement of Financial Position(U.S. dollars in thousands, unaudited)
March 31, 2026
December 31, 2025Assets
Current assets:
Cash and cash equivalents$ 319,981
$ 342,038Trade receivables, net of allowances of $ 23.2 million and $ 25.9 million at March 31, 2026 and December 31, 2025, respectively448,275
582,102Income taxes12,985
14,233Other taxes61,100
57,050Marketable securities - current portion28,348
23,242Prepaid expenses and other current assets69,597
53,210Total current assets940,286
1,071,875Property and equipment, net155,502
139,330Intangible assets, net148,724
151,853Goodwill532,525
535,761Right of use assets - operating leases128,692
134,205Marketable securities - noncurrent portion22,996
23,500Noncurrent financial assets8,193
8,314Deferred tax assets88,355
90,689Other noncurrent assets46,777
45,680 Total noncurrent assets1,131,764
1,129,332Total assets$ 2,072,050
$ 2,201,207
Liabilities and shareholders' equity
Current liabilities:
Trade payables$ 448,472
$ 566,046Contingencies - current portion11,390
9,229Income taxes21,943
27,528Financial liabilities - current portion10,626
11,360Lease liability - operating - current portion34,475
33,085Other taxes12,820
14,713Employee - related payables119,297
114,416Other current liabilities78,025
68,277Total current liabilities737,048
844,654Deferred tax liabilities5,179
5,285Defined benefit plans5,725
5,707Lease liability - operating - noncurrent portion99,221
105,277Contingencies - noncurrent portion23,039
22,729Other noncurrent liabilities32,403
31,826 Total noncurrent liabilities165,567
170,824Total liabilities902,615
1,015,478
Shareholders' equity:
Common shares, €0.025 par value, 55,659,895 and 55,659,895 shares authorized and issued, and 50,098,139 and 51,151,866 outstanding at March 31, 2026 and December 31, 2025, respectively.1,871
1,871Treasury stock, 5,561,756 and 4,508,029 shares at cost as of March 31, 2026 and December 31, 2025, respectively.(126,390)
(120,853)Additional paid-in capital698,717
706,321Accumulated other comprehensive loss(77,319)
(68,879)Retained earnings635,935
630,750Equity attributable to the shareholders of Criteo S.A.1,132,814
1,149,210Noncontrolling interests36,621
36,519Total equity1,169,435
1,185,729Total equity and liabilities$ 2,072,050
$ 2,201,207 CRITEO S.A.
Consolidated Statement of Operations
(U.S. dollars in thousands, except share and per share data, unaudited)
Three Months Ended
March 31,
2026
2025
Revenue
$ 424,639
$ 451,434
Cost of revenue
Traffic acquisition cost
174,271
187,062Other cost of revenue
27,626
27,396
Gross profit
222,742
236,976
Operating expenses:
Research and development expenses
69,683
60,749Sales and operations expenses
97,501
88,889General and administrative expenses
45,158
39,171Total operating expenses
212,342
188,809Income from operations
10,400
48,167Financial and other income
1,873
2,302Income before taxes
12,273
50,469Provision for income taxes
3,693
10,458Net income
$ 8,580
$ 40,011
Net income available to shareholders of Criteo S.A.
$ 7,817
$ 37,928Net income available to noncontrolling interests
$ 763
$ 2,083
Weighted average shares outstanding used in computing per share amounts:
Basic
50,352,465
53,979,157Diluted
50,965,933
57,195,898
Net income allocated to shareholders per share:
Basic
$ 0.16
$ 0.70Diluted
$ 0.15
$ 0.66 CRITEO S.A.Consolidated Statement of Cash Flows(U.S. dollars in thousands, unaudited)
Three Months Ended
March 31,
2026
2025Cash flows from operating activities
Net income
$ 8,580
$ 40,011Noncash and nonoperating items
40,266
42,630 - Amortization and provisions
28,569
23,583 - Equity awards compensation expense
13,347
15,409 - Gain (Loss) on disposal of and impairment of long-lived assets
(749)
547 - Change in uncertain tax positions
427
— - Change in deferred taxes
2,007
6,888 - Change in income taxes
(3,692)
(4,288) - Other
357
491Changes in assets and liabilities:
(639)
(20,300) - Trade receivables
131,986
163,943 - Trade payables
(112,841)
(174,331) - Other assets
(24,515)
(8,460) - Other liabilities
3,828
(145) - Operating lease liabilities and right of use assets
903
(1,307)Net cash provided by operating activities
48,207
62,341Cash flows from investing activities
Acquisition of intangible assets, property and equipment
(32,848)
(17,091)Disposal of intangibles assets, property and equipment
641
—Purchases of investment securities
(17,319)
(11,449)Maturities and sales of investment securities
11,613
11,002Net cash used in investing activities
(37,913)
(17,538)Cash flows from financing activities
Proceeds from exercise of stock options
—
1,845Repurchase of treasury stocks
(30,969)
(56,168)Change in other financing activities
(316)
(471)Net cash used in financing activities
(31,285)
(54,794)Effect of exchange rates changes on cash and cash equivalents
(1,066)
5,219Net decrease in cash and cash equivalents and restricted cash
(22,057)
(4,772)Net cash and cash equivalents and restricted cash at the beginning of the period
342,359
290,943Net cash and cash equivalents and restricted cash at the end of the period
$ 320,302
$ 286,171
Reconciliation of cash, cash equivalents, and restricted cash to the consolidated statement of financial position
Cash and cash equivalents
$ 319,981
$ 285,850Restricted cash, included in other current assets
$ 321
$ 321Total cash, cash equivalents, and restricted cash
$ 320,302
$ 286,171
SUPPLEMENTAL DISCLOSURES OF CASH FLOW INFORMATION
Cash paid for taxes, net of refunds
$ (4,951)
$ (5,920)Cash paid for interest
$ (527)
$ (244)Noncash investing and financing activities
Intangible assets, property and equipment acquired through payables
$ 12,204
$ 1,621 CRITEO S.A.Reconciliation of Cash from Operating Activities to Free Cash Flow(U.S. dollars in thousands, unaudited)
Three Months Ended
March 31,
2026
2025
CASH FROM OPERATING ACTIVITIES
$ 48,207
$ 62,341Acquisition of intangible assets, property and equipment
(32,848)
(17,091)Disposal of intangible assets, property and equipment
641
—FREE CASH FLOW (1)
$ 16,000
$ 45,250(1) Free Cash Flow is defined as cash flow from operating activities less acquisition and disposition of intangible assets, property and equipment. CRITEO S.A.Reconciliation of Contribution ex-TAC to Gross Profit (U.S. dollars in thousands, unaudited)
Three Months EndedMarch 31,20262025
Gross Profit222,742236,976
Other Cost of Revenue27,62627,396
Contribution ex-TAC (1)$ 250,368$ 264,372(1) Refer to the "Non-GAAP Financial Measures" section for the definition of this Non-GAAP metric. CRITEO S.A.Segment Information(U.S. dollars in thousands, unaudited)
Three Months Ended
March 31,Segment
2026
2025
YoY
Change
YoY
Change
at
Constant
Currency
(2)Revenue
Retail Media
$ 41,271
$ 59,498
(31) %
(32) %Performance Media
383,368
391,936
(2) %
(6) %Total
424,639
451,434
(6) %
(9) %
Contribution ex-TAC
Retail Media
40,589
58,790
(31) %
(32) %Performance Media
209,779
205,582
2 %
(2) %Total (1)
$ 250,368
$ 264,372
(5) %
(9) %(1) Refer to the Non-GAAP Financial Measures section of this filing for the definition of the Non-GAAP metric.(2) Constant currency measures exclude the impact of foreign currency fluctuations and are computed by applying the prior year monthly exchange rates to transactions denominated in settlement or billing currencies other than the US dollar. CRITEO S.A.Reconciliation of Adjusted EBITDA to Net Income(U.S. dollars in thousands, unaudited)
Three Months Ended
March 31,
2026
2025
YoYChangeNet income
$ 8,580
$ 40,011
(79) %Adjustments:
Financial income
(1,873)
(1,948)
4 %Provision for income taxes
3,693
10,458
(65) %Equity related compensation
13,822
15,880
(13) %Pension service costs
198
183
8 %Depreciation and amortization expense
28,367
25,693
10 %Restructuring, integration and transformation costs
10,162
1,871
443 %Other noncash or nonrecurring events (2)
1,950
—
NMTotal net adjustments
56,319
52,137
8 %Adjusted EBITDA (1)
$ 64,899
$ 92,148
(30) %(1) Refer to the "Non-GAAP Financial Measures" section for the definition of this Non-GAAP metric.(2) Includes costs related to nonrecurring litigation matters. CRITEO S.A.Reconciliation from Non-GAAP Operating Expenses to Operating Expenses under GAAP(U.S. dollars in thousands, unaudited)
Three Months Ended
March 31,
2026
2025
YoY
ChangeResearch and Development expenses
$ 69,683
$ 60,749
15 %Equity related compensation
4,889
4,334
13 %Depreciation and Amortization expense
19,139
16,673
15 %Pension service costs
116
101
15 %Restructuring, integration and transformation costs
315
73
332 %Non-GAAP - Research and Development expenses
45,224
39,568
14 %Sales and Operations expenses
97,501
88,889
10 %Equity related compensation
2,952
5,421
(46) %Depreciation and Amortization expense
1,417
3,339
(58) %Pension service costs
21
24
(13) %Restructuring, integration and transformation costs
4,539
66
NMNon-GAAP - Sales and Operations expenses
88,572
80,039
11 %General and Administrative expenses
45,158
39,171
15 %Equity related compensation
5,981
6,125
(2) %Depreciation and Amortization expense
380
333
14 %Pension service costs
61
58
5 %Restructuring, integration and transformation costs
5,308
1,732
206 %Other noncash or nonrecurring events (2)
1,950
—
NMNon-GAAP - General and Administrative expenses
31,478
30,923
2 %Total Operating expenses
212,342
188,809
12 %Equity related compensation
13,822
15,880
(13) %Depreciation and Amortization expense
20,936
20,345
3 %Pension service costs
198
183
8 %Restructuring, integration and transformation costs
10,162
1,871
443 %Other noncash or nonrecurring events (2)
1,950
—
NMTotal Non-GAAP Operating expenses (1)
$ 165,274
$ 150,530
10 %(1) Refer to the "Non-GAAP Financial Measures" section for the definition of this Non-GAAP metric.(2) Includes costs related to nonrecurring litigation matters. CRITEO S.A.
Reconciliation of Adjusted Net Income to Net Income (Loss)
(U.S. dollars in thousands except share and per share data, unaudited)
Three Months Ended
March 31,
2026
2025
YoY
Change
Net income
$ 8,580
$ 40,011
(79) %Adjustments:
Equity related compensation
13,822
15,880
(13) %Amortization of acquisition-related intangible assets
6,635
8,998
(26) %Restructuring, integration and transformation costs
10,162
1,871
443 %Other noncash or nonrecurring events (2)
1,950
—
NMTax impact of the above adjustments (3)
(4,021)
(3,930)
(2) %Total net adjustments
28,548
22,819
25 %Adjusted net income (1)
$ 37,128
$ 62,830
(41) %
Weighted average shares outstanding
- Basic
50,352,465
53,979,157
- Diluted
50,965,933
57,195,898
Adjusted net income per share
- Basic
$ 0.74
$ 1.16
(36) % - Diluted
$ 0.73
$ 1.10
(34) %(1) Refer to the "Non-GAAP Financial Measures" section for the definition of this Non-GAAP metric.(2) Includes costs related to nonrecurring litigation matters.(3) We consider the nature of the adjustment to determine its tax treatment in the various tax jurisdictions we operate in. The tax impact is calculated by applying the actual tax rate for the entity and period to which the adjustment relates. CRITEO S.A.Constant Currency Reconciliation(1)(U.S. dollars in thousands, unaudited)
Three Months Ended
March 31,
2026
2025
YoYChange
Gross Profit as reported
$ 222,742
$ 236,976
(6) %
Other cost of revenue as reported
27,626
27,396
1 %
Contribution ex-TAC as reported(2)
250,368
264,372
(5) %Conversion impact U.S. dollar/other currencies
(9,474)
—
Contribution ex-TAC at constant currency
240,894
264,372
(9) %
Traffic acquisition costs as reported
174,271
187,062
(7) %Conversion impact U.S. dollar/other currencies
(5,692)
—
Traffic acquisition costs at constant currency
168,579
187,062
(10) %
Revenue as reported
424,639
451,434
(6) %Conversion impact U.S. dollar/other currencies
(15,166)
—
Revenue at constant currency
$ 409,473
$ 451,434
(9) %(1) Constant currency measures exclude the impact of foreign currency fluctuations and are computed by applying the prior year monthly exchange rates to transactions denominated in settlement or billing currencies other than the U.S. dollar.(2) Refer to the "Non-GAAP Financial Measures" section for the definition of this Non-GAAP metric. CRITEO S.A.Information on Share Count(unaudited)
Three Months Ended
2026
2025Shares outstanding as at January 1,
51,151,866
54,277,422Weighted-average effect of changes in shares outstanding during the period
(799,401)
(298,265)Basic number of shares - Basic EPS basis
50,352,465
53,979,157Dilutive effect of share-based awards - Treasury method
613,468
3,216,741Diluted number of shares - Diluted EPS basis
50,965,933
57,195,898
Shares issued as at March 31, before Treasury stocks
55,659,895
57,854,895Treasury stocks as of March 31,
(5,561,756)
(4,285,178)Shares outstanding as of March 31, after Treasury stocks
50,098,139
53,569,717 CRITEO S.A.Supplemental Financial Information and Operating Metrics(U.S. dollars in thousands except where stated, unaudited)
YoYChangeQoQ ChangeQ12026Q42025Q32025Q22025Q12025Q42024Q32024Q22024Q12024
Clients(3) %(2) %16,52816,78616,97717,14217,08417,26917,16217,74417,767
Revenue (6) %(22) %424,639541,136469,660482,671451,434553,035458,892471,307450,055Americas(18) %(34) %158,629241,987201,978199,797192,908274,620206,816212,374198,365EMEA6 %(14) %175,330202,901174,335185,955164,861183,372161,745168,496162,842APAC(3) %(6) %90,68096,24893,34796,91993,66595,04390,33190,43788,848
Revenue(6) %(22) %424,639541,136469,660482,671451,434553,035458,892471,307450,055Retail Media(31) %(46) %41,27176,34767,11460,91359,49891,88960,76554,77750,872Performance Media(2) %(18) %383,368464,789402,546421,758391,936461,146398,127416,530399,183
TAC(7) %(17) %174,271211,094181,526190,602187,062218,636192,789204,214196,167Retail Media (4) %(61) %6821,7278499047081,6611,182911703Performance Media(7) %(17) %173,589209,367180,677189,698186,354216,975191,607203,303195,464
Contribution ex-TAC (1)(5) %(24) %250,368330,042288,134292,069264,372334,399266,103267,093253,888Retail Media (31) %(46) %40,58974,62066,26560,00958,79090,22859,58353,86650,169Performance Media2 %(18) %209,779255,422221,869232,060205,582244,171206,520213,227203,719
Cash flow from (used for) operating activities (23) %(70) %48,207160,68889,600(1,397)62,341169,45457,50317,18714,017
Capital expenditures88 %22 %32,20726,49522,25834,88217,09123,39418,89921,11913,224
Net cash position 12 %(6) %320,302342,359255,335206,024286,171290,943283,990291,698341,862
Headcount1 %(3) %3,5533,6493,6503,6213,5333,5073,5043,4983,559
Days Sales Outstanding (days - end of month)(8) days3 days605764656862656466(1) Refer to the "Non-GAAP Financial Measures" section for the definition of this Non-GAAP metric. View original content:https://www.prnewswire.com/news-releases/criteo-reports-first-quarter-2026-results-302763512.htmlSOURCE Criteo Corp Original: CRITEO REPORTS FIRST QUARTER 2026 RESULTS
US Market News
4月前
CRITEO REPORTS FOURTH QUARTER 2025 RESULTSFebruary 11, 2026 7:00 AM
PR Newswire (US)
Deployed $152 Million to Repurchase Shares in 2025Remaining Share Buyback Authorization Increased up to $200 MillionNEW YORK, Feb. 11, 2026 /PRNewswire/ -- Criteo S.A. (NASDAQ: CRTO) ("Criteo" or the "Company"), the global platform connecting the commerce ecosystem, today announced financial results for the fourth quarter and fiscal year ended December 31, 2025.Fourth Quarter and Fiscal Year 2025 Financial Highlights:The following table summarizes our consolidated financial results for the three months and twelve months ended December 31, 2025:
Three Months EndedTwelve Months Ended
December 31December 31
2025
2024
YoY Change2025
2024
YoY Change
(in millions, except EPS data)GAAP Results
Revenue$541
$553
(2) %$1,945
$1,933
1 %Gross Profit$297
$301
(1) %$1,049
$983
7 %Net Income$46
$72
(36) %$149
$115
30 %Gross Profit margin55 %
54 %
1ppt54 %
51 %
3pptDiluted EPS$0.90
$1.23
(27) %$2.64
$1.90
39 %Cash from operating activities$161
$169
(5) %$311
$258
21 %Cash and cash equivalents$342
$291
18 %$342
$291
18 %
Non-GAAP Results1
Contribution ex-TAC$330
$334
(1) %$1,175
$1,121
5 %Adjusted EBITDA$120
$144
(17) %$407
$390
4 %Adjusted diluted EPS$1.30
$1.75
(26) %$4.62
$4.57
1 %Free Cash Flow (FCF)$134
$146
(8) %$211
$182
16 %FCF / Adjusted EBITDA112 %
101 %
11ppt52 %
47 %
5ppt"Criteo delivered strong performance for the year," said Michael Komasinski, Chief Executive Officer of Criteo. "We are advancing our position at the forefront of agentic commerce, with differentiated commerce data, AI driven decisioning, and global reach that provide durable advantages and support sustainable growth and long term shareholder value."Operating HighlightsWe introduced Agentic Commerce Recommendation Service, designed to power AI shopping assistants with accurate, relevant product recommendations built on Criteo's commerce intelligence.We launched our Audience Agent to make audience planning smarter and faster, and our Insights Agent to empower platform users to make more strategic, data-driven decisions.Retail Media Contribution ex-TAC grew 2% year-over-year at constant currency2 in 2025 and decreased (18)% in Q4 2025, as expected, reflecting the impact of previously communicated scope changes with two specific Retail Media clients.We added Lidl and JB Hi-Fi to our leading Retail Media footprint.Performance Media Contribution ex-TAC was up 4% year-over-year at constant currency2 in 2025 and up 2% in Q4 2025.Criteo's media spend3 was $4.3 billion in 2025, growing 3% year-over-year at constant currency2 and $1.4 billion in Q4 2025, up 6%.Cash from operating activities increased 21% to $311 million, and Free Cash Flow increased 16% to $211 million, reflecting disciplined execution and our lowest Days Sales Outstanding ("DSO") on record.We deployed $152 million of capital for share repurchases in 2025, and our Board of Directors increased the Company's remaining share repurchase authorization to up to $200 million in February 2026.
1Contribution ex-TAC, Contribution ex-TAC margin, Adjusted EBITDA, Adjusted EBITDA margin, Adjusted diluted EPS and Free Cash Flow are not measures calculated in accordance with U.S. GAAP.2Constant currency measures exclude the impact of foreign currency fluctuations and is computed by applying the prior year monthly exchange rates to transactions denominated in settlement or billing currencies other than the US dollar.3Media spend is defined as working media spend allocated to Retail Media campaigns and media spend activated on behalf of Performance Media clients.Financial SummaryRevenue for Q4 2025 was $541 million, gross profit was $297 million and Contribution ex-TAC was $330 million. Net income for Q4 2025 was $46 million, or $0.90 per share on a diluted basis. Adjusted EBITDA for Q4 was $120 million, resulting in an adjusted diluted EPS of $1.30. As reported, revenue for Q4 decreased (2)%, gross profit decreased (1)% and Contribution ex-TAC decreased (1)%. At constant currency, revenue for Q4 decreased (4)% and Contribution ex-TAC decreased (4)%.Revenue for 2025 was $1.9 billion, gross profit was $1.0 billion and Contribution ex-TAC was $1.2 billion. As reported, revenue for 2025 increased 1%, gross profit increased 7% and Contribution ex-TAC increased 5%. At constant currency, revenue for 2025 decreased (0.5)% and Contribution ex-TAC increased 3%. Net income for 2025 was $149 million, or $2.64 per share on a diluted basis. Adjusted EBITDA for 2025 was $407 million, resulting in an adjusted diluted EPS of $4.62.Cash flow from operating activities was $311 million in 2025 and Free Cash Flow was $211 million in 2025. As of December 31, 2025, we had $389 million in cash and marketable securities on our balance sheet.Sarah Glickman, Chief Financial Officer, said, "We generated strong margins and cash flow in 2025, demonstrating the strength of our operating model. We returned $152 million to shareholders through share repurchases while maintaining a strong balance sheet, highlighting our confidence in the business and commitment to long term shareholder value."Fourth Quarter 2025 ResultsRevenue, Gross Profit and Contribution ex-TACRevenue decreased (2)% year-over-year in Q4 2025, and decreased (4)% at constant currency, to $541 million (Q4 2024: $553 million). Gross profit decreased (1)% year-over-year in Q4 2025 to $297 million (Q4 2024: $301 million). Gross profit as a percentage of revenue, or gross profit margin, was 55% (Q4 2024: 54%). Contribution ex-TAC in the fourth quarter decreased (1)% year-over-year, or decreased (4)% at constant currency, to $330 million (Q4 2024: $334 million).Retail Media revenue decreased (17)%, or (18)% at constant currency, and Retail Media Contribution ex-TAC decreased (17)%, or (18)% at constant currency, reflecting the temporary impact of previously communicated scope changes with two specific Retail Media clients, partially offset by continued strength in Retail Media onsite across the broader client base, new client integrations, and growing offsite activity.Performance Media revenue increased 1%, or decreased (2)% at constant currency, and Performance Media Contribution ex-TAC increased 5%, or 2% at constant currency, driven by the continued traction of full funnel, cross-channel activation, partially offset by lower AdTech services and supply.Net Income and Adjusted Net IncomeNet income was $46 million in Q4 2025 (Q4 2024: net income of $72 million). Net income attributable to shareholders of Criteo was $48 million, or $0.90 per share on a diluted basis (Q4 2024: net income attributable to shareholders of $71 million, or $1.23 per share on a diluted basis).Adjusted net income, a non-GAAP financial measure, was $69 million, or $1.30 per share on a diluted basis (Q4 2024: $101 million, or $1.75 per share on a diluted basis).Adjusted EBITDA and Operating ExpensesAdjusted EBITDA was $120 million, representing a decrease of (17)% year-over-year (Q4 2024: $144 million). This reflects higher non-GAAP operating expenses related to planned growth investments and lower Contribution ex-TAC over the period. Adjusted EBITDA as a percentage of Contribution ex-TAC, or Adjusted EBITDA margin, was 36% (Q4 2024: 43%).Operating expenses increased 9% year-over-year to $225 million (Q4 2024: $206 million), mostly driven by planned growth investments. Non-GAAP operating expenses increased 12% year-over-year to $184 million (Q4 2024: $165 million).Fiscal Year 2025 ResultsRevenue, Gross Profit and Contribution ex-TACRevenue increased 1% year-over-year, or decreased (0.5)% at constant currency, to $1.9 billion (FY 2024: $1.9 billion). Gross profit increased 7% year-over-year to $1,049 million (FY 2024: $983 million). Gross profit as a percentage of revenue, or gross profit margin, was 54% (FY 2024: 51%). Contribution ex-TAC increased 5% year-over-year, or increased 3% at constant currency, to $1.2 billion (FY 2024: $1.1 billion).Retail Media revenue increased 2%, or 2% at constant currency, and Retail Media Contribution ex-TAC increased 2%, or 2% at constant currency, driven by continued strength in Retail Media onsite, new client integrations and growing network effects of the platform, partially offset by the temporary impact of previously communicated scope changes with two specific Retail Media clients.Performance Media revenue was flat, or decreased (1)% at constant currency, and Performance Media Contribution ex-TAC increased 5%, or 4% at constant currency, driven by the traction of full funnel, cross-channel activation, partially offset by lower AdTech services and supply revenue.Net Income and Adjusted Net IncomeNet income was $149 million (FY 2024: $115 million). Net income attributable to shareholders of Criteo was $145 million, or $2.64 per share on a diluted basis (FY 2024: $112 million, or $1.90 per share on a diluted basis).Adjusted net income was $253 million, or $4.62 per share on a diluted basis (FY 2024: $268 million, or $4.57 per share on a diluted basis).Adjusted EBITDA and Operating ExpensesAdjusted EBITDA was $407 million, representing an increase of 4% year-over-year (FY 2024: $390 million). This reflects higher Contribution ex-TAC, partially offset by planned growth investments. Adjusted EBITDA as a percentage of Contribution ex-TAC, or Adjusted EBITDA margin, was 35% (FY 2024: 35%).Operating expenses increased 2% year-over-year to $847 million (FY 2024: $832 million), mostly driven by planned growth investments. Non-GAAP operating expenses increased 7% or $41 million to $668 million (FY 2024: $627 million).Cash Flow, Cash and Financial Liquidity PositionCash flow from operating activities was $161 million in Q4 2025 (Q4 2024: $169 million).Free Cash Flow was $134 million in Q4 2025 (Q4 2024: $146 million).Cash and cash equivalents, and marketable securities, increased $56 million compared to December 31, 2024 to $389 million, after spending $152 million on share repurchases in 2025 (2024: $225 million).As of December 31, 2025, the Company had total financial liquidity of approximately $891 million, including its cash position, marketable securities, revolving credit facility and treasury shares reserved for M&A.Redomiciliation to Luxembourg and Direct ListingFollowing the favorable opinion of the works council, Criteo's Board of Directors has approved the previously announced proposed transfer of the Company's legal domicile from France to Luxembourg via a cross-border conversion (the "Conversion") and the replacement of its American Depositary Shares ("ADSs") structure with ordinary shares to be directly listed on Nasdaq. A general meeting of the Company's shareholders will be held on February 27, 2026, at 10:00 a.m., Paris time, at the Company's registered office at 32 Rue Blanche, 75009 Paris, France to obtain approval by the Company's shareholders for the Conversion and certain related proposals.The expected timing for completion of the Conversion remains the third quarter of 2026, subject to shareholder approval and other customary conditions. As previously announced, following the Conversion, Criteo intends to pursue a subsequent corporate redomiciliation from Luxembourg to the United States if the Board of Directors determines such action is in the best interests of the Company and its shareholders, subject to the prior Company's works council consultation process.2026 Business OutlookThe following forward-looking statements reflect Criteo's expectations as of February 11, 2026.Fiscal year 2026 guidance:Contribution ex-TAC growth of flat to +2% at constant currencyAdjusted EBITDA margin of approximately 32% to 34% of Contribution ex-TACFirst quarter 2026 guidance:Contribution ex-TAC between $245 million and $250 million, or -11% to -9% year-over-year at constant-currencyAdjusted EBITDA between $50 million and $55 millionThe Company's first quarter and full year 2026 guidance reflects the near-term impact of previously communicated scope changes with two specific Retail Media clients. The first quarter of 2026 is expected to represent the low point of the year.The Company's adjusted EBITDA outlook for the first quarter and full year 2026 reflects growth investments in agentic AI, foreign exchange headwinds on euro-based costs, and costs related to certain corporate matters.The above guidance for the first quarter and fiscal year ending December 31, 2026 assumes the following exchange rates for the main currencies impacting our business: a U.S. dollar-euro rate of 0.847, a U.S. dollar-Japanese Yen rate of 154, a U.S. dollar-British pound rate of 0.737, a U.S. dollar-Korean Won rate of 1,450 and a U.S. dollar-Brazilian real rate of 5.40.The above guidance assumes that no acquisitions and dispositions are completed during the first quarter of 2026 or the fiscal year ended December 31, 2026.Reconciliations of Contribution ex-TAC, Adjusted EBITDA and Adjusted EBITDA margin guidance to the closest corresponding U.S. GAAP measures are not available without unreasonable efforts on a forward-looking basis due to the high variability, complexity and low visibility with respect to the charges excluded from these non-GAAP measures; in particular, the measures and effects of equity awards compensation expense specific to equity compensation awards that are directly impacted by unpredictable fluctuations in our share price. The variability of the above charges could potentially have a significant impact on our future U.S. GAAP financial results.Extension of Share Repurchase AuthorizationCriteo's Board of Directors approved an increase of the previously authorized share repurchase program of the Company's outstanding American Depositary Shares. As of February 6, 2026, the remaining share buyback authorization was extended to up to $200 million. The Company intends to use repurchased shares under this extended program to satisfy employee equity obligations in lieu of issuing new shares, which would limit future dilution for its shareholders, as well as to fund potential acquisitions in the future.Under the terms of the authorization, the stock purchases may be made from time to time in compliance with applicable state and federal securities laws and applicable provisions of French corporate law. The timing and amounts of any purchases will be based on market conditions and other factors including price, regulatory requirements and capital availability, as determined by Criteo's management team. The program does not require the purchase of any minimum number of shares and may be suspended, modified or discontinued at any time without prior notice.Non-GAAP Financial MeasuresThis press release and its attachments include the following financial measures defined as non-GAAP financial measures by the U.S. Securities and Exchange Commission ("SEC"): Contribution ex-TAC, Adjusted EBITDA, Adjusted EBITDA margin, Adjusted Net Income, Adjusted diluted EPS, Free Cash Flow and Non-GAAP Operating Expenses. These measures are not calculated in accordance with U.S. GAAP.Contribution ex-TAC is a profitability measure akin to gross profit. It is calculated by deducting traffic acquisition costs from revenue and reconciled to gross profit through the exclusion of other costs of revenue. Contribution ex-TAC is not a measure calculated in accordance with U.S. GAAP. We have included Contribution ex-TAC because it is a key measure used by our management and board of directors to evaluate operating performance, generate future operating plans and make strategic decisions. In particular, we believe that this measure can provide useful measures for period-to-period comparisons of our business. Accordingly, we believe that Contribution ex-TAC provides useful information to investors and others in understanding and evaluating our results of operations in the same manner as our management and board of directors. Adjusted EBITDA is our consolidated earnings before financial income (expense), income taxes, depreciation and amortization, adjusted to eliminate the impact of equity related compensation, which includes employee equity awards compensation and director fees for share purchases, pension service costs, certain acquisition costs, certain restructuring and related costs, integration and transformation costs, and other nonrecurring or noncash items impacting net income that we do not consider indicative of our ongoing business performance. Adjusted EBITDA and Adjusted EBITDA margin are key measures used by our management and board of directors to understand and evaluate our core operating performance and trends, to prepare and approve our annual budget and to develop short- and long-term operational plans. In particular, we believe that Adjusted EBITDA and Adjusted EBITDA margin can provide useful measures for period-to-period comparisons of our business. Accordingly, we believe that Adjusted EBITDA and Adjusted EBITDA margin provide useful information to investors and the market generally in understanding and evaluating our results of operations in the same manner as our management and board of directors.Adjusted Net Income is our net income adjusted to eliminate the impact of equity related compensation, which includes employee equity awards compensation and director fees for share purchases, amortization of acquisition-related assets, certain restructuring and related costs, integration and transformation costs, certain acquisition costs, other nonrecurring or noncash items impacting net income that we do not consider indicative of our ongoing business performance, and the tax impact of these adjustments. Adjusted Net Income and Adjusted diluted EPS are key measures used by our management and board of directors to evaluate operating performance, generate future operating plans and make strategic decisions regarding the allocation of capital. In particular, we believe that Adjusted Net Income and Adjusted diluted EPS can provide useful measures for period-to-period comparisons of our business. Accordingly, we believe that Adjusted Net Income and Adjusted diluted EPS provide useful information to investors and the market generally in understanding and evaluating our results of operations in the same manner as our management and board of directors.Free Cash Flow is defined as cash flow from operating activities less net acquisition of intangible assets, property, and equipment. Free Cash Flow Conversion is defined as free cash flow divided by Adjusted EBITDA. Free Cash Flow and Free Cash Flow Conversion are key measures used by our management and board of directors to evaluate the Company's ability to generate cash. Accordingly, we believe that Free Cash Flow and Free Cash Flow Conversion permit a more complete and comprehensive analysis of our available cash flows.Non-GAAP Operating Expenses are our consolidated operating expenses adjusted to eliminate depreciation and amortization, equity related compensation, which includes employee equity awards compensation and director fees for share purchases, pension service costs, certain restructuring and related costs, integration and transformation costs, certain acquisition costs, and other nonrecurring or noncash items. The Company uses Non-GAAP Operating Expenses to understand and compare operating results across accounting periods, for internal budgeting and forecasting purposes, for short-term and long-term operational plans, and to assess and measure our financial performance and the ability of our operations to generate cash. We believe Non-GAAP Operating Expenses reflects our ongoing operating expenses in a manner that allows for meaningful period-to-period comparisons and analysis of trends in our business. As a result, we believe that Non-GAAP Operating Expenses provides useful information to investors in understanding and evaluating our core operating performance and trends in the same manner as our management and in comparing financial results across periods. In addition, Non-GAAP Operating Expenses is a key component in calculating Adjusted EBITDA, which is one of the key measures the Company uses to provide its quarterly and annual business outlook to the investment community.Please refer to the supplemental financial tables provided in the appendix of this press release for a reconciliation of Contribution ex-TAC to gross profit, Adjusted EBITDA to net income, Adjusted Net Income to net income, Free Cash Flow to cash flow from operating activities, and Non-GAAP Operating Expenses to operating expenses, in each case, the most comparable U.S. GAAP measure. Our use of non-GAAP financial measures has limitations as an analytical tool, and you should not consider such non-GAAP measures in isolation or as a substitute for analysis of our financial results as reported under U.S. GAAP. Some of these limitations are: 1) other companies, including companies in our industry which have similar business arrangements, may address the impact of TAC differently; and 2) other companies may report Contribution ex-TAC, Contribution ex-TAC margin, Adjusted EBITDA, Adjusted Net Income, Free Cash Flow, Non-GAAP Operating Expenses or similarly titled measures but calculate them differently or over different regions, which reduces their usefulness as comparative measures. Because of these and other limitations, you should consider these measures alongside our U.S. GAAP financial results, including revenue and net income.Forward-Looking Statements DisclosureThis press release contains forward-looking statements, including projected financial results for the quarter ending March 31, 2026 and the year ending December 31, 2026, our expectations regarding our market opportunity and future growth prospects and other statements that are not historical facts and involve risks and uncertainties that could cause actual results to differ materially. Factors that might cause or contribute to such differences include, but are not limited to: failure related to our technology and our ability to innovate and respond to changes in technology; uncertainty regarding our ability to access a consistent supply of internet display advertising inventory and expand access to such inventory; investments in new business opportunities and the timing of these investments, whether the projected benefits of acquisitions or strategic transactions, including the Conversion, materialize as expected; uncertainty regarding international operations and expansion (including related to changes in a specific country's or region's political or economic conditions (such as changes in or new tariffs)); the impact of competition or client in-housing; uncertainty regarding legislative, regulatory or self-regulatory developments regarding data privacy matters and the impact of efforts by other participants in our industry to comply therewith; our ability to obtain and utilize certain data as a result of consumer concerns regarding data collection and sharing, as well as potential limitations in accessing data from third parties; failure to enhance our brand cost-effectively, recent growth rates not being indicative of future growth; client flexibility to increase or decrease spend; our ability to manage growth, potential fluctuations in operating results, our ability to grow our base of clients, and the financial impact of maximizing Contribution ex-TAC, as well as risks related to future opportunities and plans, including the uncertainty of expected future financial performance and results; changes in general political, economic and competitive conditions and specific market conditions; adverse changes in the advertising industry; changes in applicable laws or accounting practices; failure to obtain the required shareholder vote to adopt the proposals needed to complete the Conversion; failure to satisfy any of the other conditions to the Conversion, including the condition that the option to withdraw shares for cash in connection with the Conversion is not exercised above a certain threshold; the Conversion not being completed; the impact or outcome of any legal proceedings or regulatory actions that may be instituted against us in connection with the Conversion; failure to list our shares on Nasdaq following the Conversion or maintain our listing thereafter; inability to take advantage of the potential strategic opportunities provided by, and realize the potential benefits of, the Conversion; the disruption of current plans and operations by the Conversion; the disruption to the Company's relationships, including with employees, landowners, suppliers, lenders, partners, governments and shareholders; the future financial performance of Criteo following the Conversion, including our anticipated growth rate and market opportunity; changes in shareholders' rights as a result of the Conversion; inability to terminate the deposit agreement and withdraw our ordinary shares from the depositary so as to terminate our ADS program in connection with the Conversion; difficulty in adapting to operating under the laws of Luxembourg; the deferment or abandonment of the Conversion by our board of directors up to three days prior to the general shareholders' meeting to vote thereon; following the completion of the Conversion, a delay or failure in our ability to redomicile to the United States via the merger into a newly incorporated and wholly-owned U.S. subsidiary for any reason; costs or taxes related to the Conversion; and those risks detailed from time-to-time under the caption "Risk Factors" and elsewhere in the Company's SEC filings and reports, including the Company's Annual Report on Form 10-K filed with the SEC on February 28, 2025, and in subsequent Quarterly Reports on Form 10-Q, the proxy statement/prospectus filed with the SEC under Rule 424(b)(3) on January 22, 2026 in connection with the Conversion, as well as future filings and reports by the Company. Importantly, at this time, macro-economic conditions including inflation and fluctuating interest rates in the U.S. have impacted and may continue to impact Criteo's business, financial condition, cash flow and results of operations. Accordingly, a forward-looking statement is neither a prediction nor a guarantee of future events or circumstances and those future events or circumstances may not occur. You should not place undue reliance on the forward-looking statements, which speak only as of the date of this release.Except as required by law, the Company undertakes no duty or obligation to update any forward-looking statements contained in this release as a result of new information, future events, changes in expectations or otherwise.Conference Call InformationCriteo's senior management team will discuss the Company's earnings on a call that will take place today, February 11, 2026, at 8:00 AM ET, 2:00 PM CET. The conference call will be webcast live on the Company's website at https://criteo.investorroom.com/ and will subsequently be available for replay.United States: +1 800 836 8184International: +1 646 357 8785France 080-094-5120Please ask to be joined into the "Criteo" call.About CriteoCriteo (NASDAQ: CRTO) is the global commerce media company that enables marketers and media owners to drive better commerce outcomes. Its industry leading Commerce Media Platform connects thousands of marketers and media owners to deliver richer consumer experiences from product discovery to purchase. By powering trusted and impactful advertising, Criteo supports an open internet that encourages discovery, innovation, and choice. For more information, please visit www.criteo.com. ContactsInvestor Relations & Corporate Communications
Melanie Dambre, m.dambre@criteo.com Public Relations
Jessica Meyers, j.meyers@criteo.com Financial information to followCRITEO S.A.Consolidated Statement of Financial Position(U.S. dollars in thousands, unaudited)
December 31, 2025
December 31, 2024Assets
Current assets:
Cash and cash equivalents
$ 342,038
$ 290,693Trade receivables, net of allowances of $ 25.9 million and $ 28.6 million as of
December 31, 2025 and December 31, 2024, respectively
582,102
800,859Income taxes
14,233
1,550Other taxes
57,050
53,883Marketable securities - current portion
23,242
26,242Prepaid expenses and other current assets
53,210
50,887Total current assets
1,071,875
1,224,114Property and equipment, net
139,330
107,222Intangible assets, net
151,853
158,384Goodwill
535,761
515,188Right of use asset - operating lease
134,205
99,468Marketable securities - noncurrent portion
23,500
15,584Noncurrent financial assets
8,314
4,332Deferred tax assets
90,689
81,006Other noncurrent assets
45,680
61,151 Total noncurrent assets
1,129,332
1,042,335Total assets
$ 2,201,207
$ 2,266,449
Liabilities and shareholders' equity
Current liabilities:
Trade payables
$ 566,046
$ 802,524Contingencies - current portion
9,229
1,882Income taxes
27,528
34,863Financial liabilities - current portion
11,360
3,325Lease liability - operating - current portion
33,085
25,812Other taxes
14,713
19,148Employee - related payables
114,416
109,227Other current liabilities
68,277
49,819Total current liabilities
844,654
1,046,600Deferred tax liabilities
5,285
4,067Defined benefit plans
5,707
4,709Lease liability - operating - noncurrent portion
105,277
77,584Contingencies - noncurrent portion
22,729
31,939Other noncurrent liabilities
31,826
20,453 Total noncurrent liabilities
170,824
138,752Total liabilities
1,015,478
1,185,352Shareholders' equity:
Common shares, €0.025 par value, 55,659,895 and 57,744,839 shares authorized
and issued, and 51,151,866 and 54,277,422 outstanding at December 31, 2025 and
December 31, 2024, respectively.
1,871
1,931Treasury stock, 4,508,029 and 3,467,417 shares at cost as of December 31, 2025
and December 31, 2024, respectively.
(120,853)
(125,298)Additional paid-in capital
706,321
709,580Accumulated other comprehensive loss
(68,879)
(108,768)Retained earnings
630,750
571,744Equity attributable to shareholders of Criteo S.A.
1,149,210
1,049,189Noncontrolling interests
36,519
31,908Total equity
1,185,729
1,081,097Total equity and liabilities
$ 2,201,207
$ 2,266,449 CRITEO S.A.
Consolidated Statement of Operations
(U.S. dollars in thousands, except share and per share data, unaudited)
Three Months Ended
Twelve Months Ended
December 31
December 31
2025
2024
2025
2024
Revenue
$ 541,136
$ 553,035
$ 1,944,901
$ 1,933,289
Cost of revenue
Traffic acquisition cost
211,094
218,636
770,284
811,806Other cost of revenue
32,639
33,428
125,237
138,512
Gross profit
297,403
300,971
1,049,380
982,971
Operating expenses:
Research and development expenses
75,266
67,559
283,303
279,341Sales and operations expenses
110,271
97,356
394,370
376,090General and administrative expenses
39,352
41,548
168,942
176,138Total operating expenses
224,889
206,463
846,615
831,569Income from operations
72,514
94,508
202,765
151,402Financial and other income
329
2,206
809
3,095Income before taxes
72,843
96,714
203,574
154,497Provision for income taxes
26,472
24,770
54,195
39,784Net income
$ 46,371
$ 71,944
$ 149,379
$ 114,713
Net income attributable to shareholders of Criteo S.A.
$ 47,642
$ 71,095
$ 144,602
$ 111,571Net (loss) income attributable to noncontrolling interests
$ (1,271)
$ 849
$ 4,777
$ 3,142
Weighted average shares outstanding used in computing per share amounts:
Basic
52,234,730
54,695,112
52,934,526
54,817,136Diluted
53,107,946
57,640,779
54,792,540
58,605,529
Net income attributable to shareholders per share:
Basic
$ 0.91
$ 1.30
$ 2.73
$ 2.04Diluted
$ 0.90
$ 1.23
$ 2.64
$ 1.90 CRITEO S.A.Consolidated Statement of Cash Flows(U.S. dollars in thousands, unaudited)
Three Months Ended
Twelve Months Ended
December 31
December 31
2025
2024
2025
2024Cash flows from operating activities
Net income
$ 46,371
$ 71,944
$ 149,379
$ 114,713Noncash and nonoperating items
61,584
56,105
175,203
192,118 - Amortization and provisions
32,327
20,620
129,446
87,754 - Equity awards compensation expense
5,811
20,424
57,848
102,617 - Gain on disposal of and impairment of long-lived assets
1,787
6,494
1,728
7,418 - Change in uncertain tax positions
9,938
(7)
10,359
1,757 - Net change in fair value of earn-out
—
(2,195)
—
1,007 - Change in deferred taxes
(30,920)
(9,670)
(7,533)
(26,040) - Change in income taxes
42,497
28,710
(21,992)
19,389 - Other
144
(8,271)
5,347
(1,784)Changes in assets and liabilities
52,738
41,405
(13,345)
(48,670) - Trade receivables
(15,749)
(167,111)
245,977
(28,516) - Trade payables
34,318
193,703
(265,395)
(17,160) - Other current assets
8,340
10,881
13,665
10,142 - Other current liabilities
24,385
2,925
(7,505)
(11,314) - Change in operating lease liabilities and right of use assets
1,444
1,007
(87)
(1,822)NET CASH PROVIDED BY OPERATING ACTIVITIES
160,693
169,454
311,237
258,161Cash flows from investing activities
Acquisition of intangible assets, property and equipment
(27,429)
(24,159)
(102,739)
(78,112)Disposal of intangibles assets, property and equipment
934
765
2,013
1,476Payment for businesses, net of cash acquired
—
—
—
(527)Purchases of investment securities
(5,257)
(20,950)
(28,436)
(26,688)Maturities and sales of investment securities
(258)
5,409
28,029
5,950NET CASH USED IN INVESTING ACTIVITIES
(32,010)
(38,935)
(101,133)
(97,901)Cash flows from financing activities
Proceeds from exercise of stock options
—
117
1,897
4,550Repurchase of treasury stocks
(36,620)
(67,103)
(152,064)
(224,595)Cash payment for contingent consideration
—
(51,983)
—
(51,983)Change in other financing activities
(475)
2,825
(1,309)
1,529NET CASH USED IN FINANCING ACTIVITIES
(37,095)
(116,144)
(151,476)
(270,499)Effect of exchange rates changes on cash and cash equivalents
(4,564)
(7,422)
(7,212)
(10,159)Net increase (decrease) in cash and cash equivalents and restricted cash
87,024
6,953
51,416
(120,398)Net cash and cash equivalents and restricted cash at the beginning of the period
255,335
283,990
290,943
411,341Net cash and cash equivalents and restricted cash at the end of the period
$ 342,359
$ 290,943
$ 342,359
$ 290,943
SUPPLEMENTAL CASH FLOW INFORMATION
Cash paid for taxes, net of refunds
$ 3,474
$ (4,606)
$ (64,930)
$ (40,705)Cash paid for interest
$ (615)
$ (328)
$ (1,584)
$ (1,360)Non-cash investing and financing activities:
Intangible assets, property, and equipment acquired through payables
$ 18,126
$ 1,758
$ 18,126
$ 1,758 CRITEO S.A.Reconciliation of Cash from Operating Activities to Free Cash Flow(U.S. dollars in thousands, unaudited)
Three Months Ended
Twelve Months Ended
December 31
December 31
2025
2024
2025
2024
CASH FROM OPERATING ACTIVITIES
$ 160,693
$ 169,454
$ 311,237
$ 258,161Acquisition of intangible assets, property and equipment
(27,429)
(24,159)
(102,739)
(78,112)Disposal of intangible assets, property and equipment
934
765
2,013
1,476FREE CASH FLOW (1)
$ 134,198
$ 146,060
$ 210,511
$ 181,525
(1)Free Cash Flow is defined as cash flow from operating activities less net acquisitions of intangible assets, property and equipment. CRITEO S.A.Reconciliation of Contribution ex-TAC to Gross Profit (U.S. dollars in thousands, unaudited)
Three Months Ended
Twelve Months EndedDecember 31
December 312025
2024
YoY Change
2025
2024
YoY ChangeGross Profit297,403
300,971
(1) %
1,049,380
982,971
7 %
Other Cost of Revenue32,639
33,428
(2) %
125,237
138,512
(10) %
Contribution ex-TAC (1)$ 330,042
$ 334,399
(1) %
$ 1,174,617
$ 1,121,483
5 %
(1)Refer to the "Non-GAAP Financial Measures" section for a definition of this Non-GAAP metric. CRITEO S.A.Segment Information(U.S. dollars in thousands, unaudited)
Three Months Ended
Twelve Months Ended
December 31
December 31
Segment
2025
2024
YoY
Change
YoY
Change
at
Constant
Currency (2)
2025
2024
YoY
Change
YoY
Change
at
Constant
Currency (2)Revenue
Retail Media
$ 76,347
$ 91,889
(17) %
(18) %
$ 263,872
$ 258,303
2 %
2 %
Performance Media
464,789
461,146
1 %
(2) %
1,681,029
1,674,986
— %
(1) %
Total
541,136
553,035
(2) %
(4) %
1,944,901
1,933,289
1 %
— %
Contribution ex-TAC
Retail Media
74,620
90,228
(17) %
(18) %
259,684
253,846
2 %
2 %
Performance Media
255,422
244,171
5 %
2 %
914,933
867,637
5 %
4 %
Total (1)
$ 330,042
$ 334,399
(1) %
(4) %
$ 1,174,617
$ 1,121,483
5 %
3 %
(1)Refer to the Non-GAAP Financial Measures section of this filing for a definition of the Non-GAAP metric.(2)Constant currency measures exclude the impact of foreign currency fluctuations and is computed by applying the prior year monthly exchange rates to transactions denominated in settlement or billing currencies other than the U.S. dollar. CRITEO S.A.Reconciliation of Adjusted EBITDA to Net Income(U.S. dollars in thousands, unaudited)
Three Months Ended
Twelve Months Ended
December 31
December 31
2025
2024
YoYChange
2025
2024
YoYChangeNet income
$ 46,371
$ 71,944
(36) %
$ 149,379
$ 114,713
30 %Adjustments:
Financial Income
(329)
(2,206)
85 %
(460)
(3,095)
85 %Provision for income taxes
26,472
24,770
7 %
54,195
39,784
36 %Equity related compensation
7,079
21,710
(67) %
59,573
105,742
(44) %Pension service costs
203
(23)
983 %
786
495
59 %Depreciation and amortization expense (2)
31,092
25,514
22 %
122,320
101,193
21 %Acquisition-related costs
—
(522)
100 %
—
1,439
(100) %Restructuring, integration and transformation costs
9,200
2,821
226 %
18,531
29,847
(38) %Other noncash or nonrecurring events (2) (3)
—
—
NM
2,372
—
NMTotal net adjustments
73,717
72,064
2 %
257,317
275,405
(7) %Adjusted EBITDA (1)
$ 120,088
$ 144,008
(17) %
$ 406,696
$ 390,118
4 %
(1)Refer to the "Non-GAAP Financial Measures" section for the definition of this Non-GAAP metric.(2)During the second quarter of 2025, the Company recorded accelerated amortization of $7.9 million, included in depreciation and amortization expense, and a nonrecurring impairment charge of approximately $0.9 million, recorded in other noncash or nonrecurring events, related to internally developed intangible assets, triggered by Alphabet Inc.'s decision not to proceed with the deprecation of third-party cookies in its Chrome browser.(3)During the third quarter of 2025, the Company agreed to settle with the plaintiffs a legal matter for $7.0 million, subject to court approval, with one of the co-defendants agreeing to indemnify the Company for $5.5 million. Based on these agreements, the Company recorded a net probable loss of $1.5 million as of September 30, 2025. CRITEO S.A.Reconciliation from Non-GAAP Operating Expenses to Operating Expenses under GAAP(U.S. dollars in thousands, unaudited)
Three Months Ended
Twelve Months Ended
December 31
December 31
2025
2024
YoY
Change
2025
2024
YoY
ChangeResearch and Development expenses
$ 75,266
$ 67,559
11 %
$ 283,303
$ 279,341
1 %Equity related compensation
5,397
9,713
(44) %
20,997
54,628
(62) %Depreciation and Amortization expense (2)
21,454
13,740
56 %
82,911
51,936
60 %Pension service costs
112
57
96 %
434
330
32 %Restructuring, integration and transformation costs
537
412
30 %
1,025
8,576
(88) %Other noncash or nonrecurring events(2)
—
—
NM
872
—
NMNon GAAP - Research and Development expenses
47,766
43,637
9 %
177,064
163,871
8 %Sales and Operations expenses
110,271
97,356
13 %
394,370
376,090
5 %Equity related compensation
5,194
6,892
(25) %
19,384
22,985
(16) %Depreciation and Amortization expense
2,193
3,311
(34) %
12,704
12,960
(2) %Pension service costs
26
(110)
124 %
102
(32)
419 %Restructuring, integration and transformation costs
2,269
(26)
NM
2,358
5,467
(57) %Non GAAP - Sales and Operations expenses
100,589
87,289
15 %
359,822
334,710
8 %General and Administrative expenses
39,352
41,548
(5) %
168,942
176,138
(4) %Equity related compensation
(3,512)
5,105
(169) %
19,192
28,129
(32) %Depreciation and Amortization expense
369
391
(6) %
1,433
1,716
(16) %Pension service costs
65
30
117 %
250
197
27 %Acquisition-related costs
—
(522)
100 %
—
1,439
(100) %Restructuring, integration and transformation costs
6,394
2,435
163 %
15,148
15,804
(4) %Other noncash or nonrecurring events (3)
—
—
NM
1,500
—
NMNon GAAP - General and Administrative expenses
36,036
34,109
6 %
131,419
128,853
2 %Total Operating expenses
224,889
206,463
9 %
846,615
831,569
2 %Equity related compensation
7,079
21,710
(67) %
59,573
105,742
(44) %Depreciation and Amortization expense
24,016
17,442
38 %
97,048
66,612
46 %Pension service costs
203
(23)
983 %
786
495
59 %Acquisition-related costs
—
(522)
100 %
—
1,439
(100) %Restructuring, integration and transformation costs
9,200
2,821
226 %
18,531
29,847
(38) %Other noncash or nonrecurring events (2) (3)
$ —
$ —
NM
$ 2,372
$ —
NMTotal Non GAAP Operating expenses (1)
$ 184,391
$ 165,035
12 %
$ 668,305
$ 627,434
7 %
(1)Refer to the "Non-GAAP Financial Measures" section for the definition of this Non-GAAP metric.(2)During the second quarter of 2025, the Company recorded accelerated amortization of $7.9 million, included in depreciation and amortization expense, and a nonrecurring impairment charge of approximately $0.9 million, recorded in other noncash or nonrecurring events, related to internally developed intangible assets, triggered by Alphabet Inc.'s decision not to proceed with the deprecation of third-party cookies in its Chrome browser.(3)During the third quarter of 2025, the Company agreed to settle with the plaintiffs a legal matter for $7.0 million, subject to court approval, with one of the co-defendants agreeing to indemnify the Company for $5.5 million. Based on these agreements, the Company recorded a net probable loss of $1.5 million as of September 30, 2025. CRITEO S.A.Reconciliation of Adjusted Net Income to Net Income(U.S. dollars in thousands except share and per share data, unaudited)
Three Months Ended
Twelve Months Ended
December 31
December 31
2025
2024
YoY
Change
2025
2024
YoY
ChangeNet income
$ 46,371
$ 71,944
(36) %
$ 149,379
$ 114,713
30 %Adjustments:
Equity related compensation
7,079
21,710
(67) %
59,573
105,742
(44) %Amortization of acquisition-related intangible assets
8,530
8,573
(1) %
37,061
34,860
6 %Acquisition related costs
—
(522)
100 %
—
1,439
(100) %Restructuring, integration and transformation costs
9,200
2,821
226 %
18,531
29,847
(38) %Other noncash or nonrecurring events (2) (3)
—
—
NM
2,372
—
NMTax impact of the above adjustments (4)
(2,118)
(3,686)
43 %
(13,931)
(18,734)
26 %Total net adjustments
22,691
28,896
(21) %
103,606
153,154
(32) %Adjusted net income (1)
$ 69,062
$ 100,840
(32) %
$ 252,985
$ 267,867
(6) %
Weighted average shares outstanding
- Basic
52,234,730
54,695,112
52,934,526
54,817,136
- Diluted
53,107,946
57,640,779
54,792,540
58,605,529
Adjusted net income per share
- Basic
$ 1.32
$ 1.84
(28) %
$ 4.78
$ 4.89
(2) % - Diluted
$ 1.30
$ 1.75
(26) %
$ 4.62
$ 4.57
1 %
(1)Refer to the "Non-GAAP Financial Measures" section for the definition of this Non-GAAP metric.(2)During the second quarter of 2025, the Company recorded a nonrecurring impairment charge of approximately $0.9 million related to internally developed intangible assets, triggered by Alphabet Inc.'s decision not to proceed with the deprecation of third-party cookies in its Chrome browser.(3)During the third quarter of 2025, the Company agreed to settle with the plaintiffs a legal matter for $7.0 million, subject to court approval, with one of the co-defendants agreeing to indemnify the Company for $5.5 million. Based on these agreements, the Company recorded a net probable loss of $1.5 million as of September 30, 2025.(4)We consider the nature of the adjustment to determine its tax treatment in the various tax jurisdictions we operate in. The tax impact is calculated by applying the actual tax rate for the entity and period to which the adjustment relates. CRITEO S.A.Constant Currency Reconciliation(1)(U.S. dollars in thousands, unaudited)
Three Months Ended
Twelve Months Ended
December 31
December 31
2025
2024
YoYChange
2025
2024
YoYChangeGross Profit as reported
$ 297,403
$ 300,971
(1) %
$ 1,049,380
$ 982,971
7 %
Other cost of revenue as reported
32,639
33,428
(2) %
125,237
138,512
(10) %
Contribution ex-TAC as reported(2)
330,042
334,399
(1) %
1,174,617
1,121,483
5 %Conversion impact U.S. dollar/other currencies
(8,138)
—
(13,936)
—
Contribution ex-TAC at constant currency
321,904
334,399
(4) %
1,160,681
1,121,483
3 %
Traffic acquisition costs as reported
211,094
218,636
(3) %
770,284
811,806
(5) %Conversion impact U.S. dollar/other currencies
(4,487)
—
(7,198)
—
Traffic acquisition costs at constant currency
206,607
218,636
(6) %
763,086
811,806
(6) %
Revenue as reported
541,136
553,035
(2) %
1,944,901
1,933,289
1 %Conversion impact U.S. dollar/other currencies
(12,625)
—
(21,134)
—
Revenue at constant currency
$ 528,511
$ 553,035
(4) %
$ 1,923,767
$ 1,933,289
— %
(1)Constant currency measures exclude the impact of foreign currency fluctuations and is computed by applying the prior year monthly exchange rates to transactions denominated in settlement or billing currencies other than the U.S. dollar.(2)Refer to the "Non-GAAP Financial Measures" section for a definition of this Non-GAAP metric. CRITEO S.A.Information on Share Count(unaudited)
Twelve Months Ended
2025
2024Shares outstanding as at January 1,
54,277,422
55,765,091Weighted-average effect of changes in shares outstanding during the period
(1,342,896)
(947,955)Basic number of shares - Basic EPS basis
52,934,526
54,817,136Dilutive effect of share-based awards - Treasury method
1,858,014
3,788,393Diluted number of shares - Diluted EPS basis
54,792,540
58,605,529
Shares issued as at December 31, before Treasury stock
55,659,895
57,744,839Treasury stock as of December 31,
(4,508,029)
(3,467,417)Shares outstanding as of December 31, after Treasury stock
51,151,866
54,277,422 CRITEO S.A.Supplemental Financial Information and Operating Metrics(U.S. dollars in thousands except where stated, unaudited)
YoYChangeQoQ ChangeQ42025Q32025Q22025Q12025Q42024Q32024Q22024Q12024Q42023
Clients(3) %(1) %16,78616,97717,14217,08417,26917,16217,74417,76718,197
Revenue (2) %15 %541,136469,660482,671451,434553,035458,892471,307450,055566,302Americas(12) %20 %241,987201,978199,797192,908274,620206,816212,374198,365280,597EMEA11 %16 %202,901174,335185,955164,861183,372161,745168,496162,842189,291APAC1 %3 %96,24893,34796,91993,66595,04390,33190,43788,84896,414
Revenue(2) %15 %541,136469,660482,671451,434553,035458,892471,307450,055566,302Retail Media(17) %14 %76,34767,11460,91359,49891,88960,76554,77750,87276,583Performance Media1 %15 %464,789402,546421,758391,936461,146398,127416,530399,183489,719
TAC(3) %16 %211,094181,526190,602187,062218,636192,789204,214196,167249,926Retail Media4 %103 %1,7278499047081,6611,1829117032,429Performance Media(4) %16 %209,367180,677189,698186,354216,975191,607203,303195,464247,497
Contribution ex-TAC (1)(1) %15 %330,042288,134292,069264,372334,399266,103267,093253,888316,376Retail Media(17) %13 %74,62066,26560,00958,79090,22859,58353,86650,16974,154Performance Media5 %15 %255,422221,869232,060205,582244,171206,520213,227203,719242,222
Cash flow from
(used for) operating
activities (5) %79 %160,68889,600(1,397)62,341169,45457,50317,18714,017161,340
Capital expenditures13 %19 %26,49522,25834,88217,09123,39418,89921,11913,22419,724
Net cash position 18 %34 %342,359255,335206,024286,171290,942283,990291,698341,862411,257
Headcount4 %— %3,6493,6503,6213,5333,5073,5043,4983,5593,563
Days Sales
Outstanding
(days - end of month)(5) days(7) days576465686265646658
(1)Refer to the "Non-GAAP Financial Measures" section for a definition of this Non-GAAP metric.
View original content:https://www.prnewswire.com/news-releases/criteo-reports-fourth-quarter-2025-results-302684484.htmlSOURCE Criteo Corp
Original: CRITEO REPORTS FOURTH QUARTER 2025 RESULTS
 Hot Features

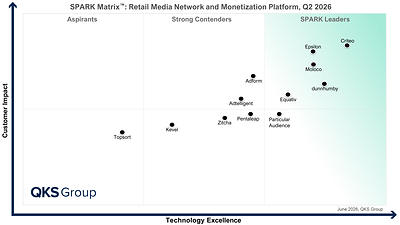

 iHub News
4月前
iHub News
4月前
 whytestocks
6年前
whytestocks
6年前
 DrShocker
7年前
DrShocker
7年前
 conix
7年前
conix
7年前
 ValueInvestor15
9年前
ValueInvestor15
9年前
 Tutu
10年前
Tutu
10年前
 stocktrademan
11年前
stocktrademan
11年前

 メールアドレスで登録


