false
0000913277
0000913277
2024-08-01
2024-08-01
iso4217:USD
xbrli:shares
iso4217:USD
xbrli:shares
United States
Securities and Exchange Commission
Washington, D.C. 20549
Form 8-K
Current Report
Pursuant to Section 13 or 15(d) of the Securities
Exchange Act of 1934
Date of Report (Date of earliest event reported):
August 1, 2024
CLARUS
CORPORATION
(Exact name of registrant as specified in its
charter)
Delaware
(State or other jurisdiction
of incorporation) |
001-34767
(Commission File Number) |
58-1972600
(IRS Employer
Identification Number) |
2084
East 3900 South, Salt Lake City,
Utah
(Address of principal executive offices) |
84124
(Zip Code) |
Registrant’s telephone number, including
area code: (801) 278-5552
N/A
(Former name or former address, if changed since
last report.)
Check the appropriate box below if the Form 8-K
filing is intended to simultaneously satisfy the filing obligation of the registrant under any of the following provisions:
| ¨ | Written
communications pursuant to Rule 425 under the Securities Act (17 CFR 230.425) |
| ¨ | Soliciting
material pursuant to Rule 14a-12 under the Exchange Act (17 CFR 240.14a-12) |
| ¨ | Pre-commencement
communications pursuant to Rule 14d-2(b) under the Exchange Act (17 CFR 240.14d-2(b)) |
| ¨ | Pre-commencement
communications pursuant to Rule 13e-4(c) under the Exchange Act (17 CFR 240.13e-4(c)) |
Indicate by check mark whether the registrant
is an emerging growth company as defined in Rule 405 of the Securities Act of 1933 (§230.405 of this chapter) or Rule 12b-2 of the
Securities Exchange Act of 1934 (§240.12b-2 of this chapter).
| |
¨ |
Emerging growth company |
If an emerging growth company, indicate by check
mark if the registrant has elected not to use the extended transition period for complying with any new or revised financial accounting
standards provided pursuant to Section 13(a) of the Exchange Act. ¨
Securities registered pursuant to Section 12(b) of the Act:
| Title
of each class |
|
Trading
Symbol |
|
Name
of each exchange on which
registered |
| Common
Stock, par value $.0001 per share |
|
CLAR |
|
NASDAQ
Global Select Market |
Item 2.02 Results of Operations and Financial Condition
On August 1, 2024, Clarus Corporation (the “Company”)
issued a press release announcing results for the second quarter ended June 30, 2024 (the “Press Release”). A copy of the
Press Release is furnished as Exhibit 99.1 and incorporated herein by reference. Attached hereto as Exhibit 99.2 and incorporated herein
by reference is a presentation regarding the Company’s financial results for the second quarter ended June 30, 2024 (the “Presentation”).
The Press Release and/or the Presentation contain
the non-GAAP measures: (i) adjusted gross margin and adjusted gross profit, (ii) adjusted (loss) income from continuing operations and
related earnings (loss) per diluted share, (iii) earnings before interest, taxes, other income or expense, depreciation and amortization
(“EBITDA”), EBITDA margin, adjusted EBITDA, and adjusted EBITDA margin, (iv) segment EBITDA and adjusted segment EBITDA, and
(v) free cash flow (defined as net cash provided by operating activities less capital expenditures). The Company believes that the presentation
of certain non-GAAP measures, i.e.: (i) adjusted gross margin and adjusted gross profit, (ii) adjusted (loss) income from continuing operations
and related earnings (loss) per diluted share, (iii) EBITDA, EBITDA margin, adjusted EBITDA and adjusted EBITDA margin, (iv) segment EBITDA
and adjusted segment EBITDA, and (v) free cash flow, provide useful information for the understanding of its ongoing operations and enables
investors to focus on period- over -period operating performance, and thereby enhances the user's overall understanding of the Company's
current financial performance relative to past performance and provides, along with the nearest GAAP measures, a baseline for modeling
future earnings expectations. Non-GAAP measures are reconciled to comparable GAAP financial measures within the Press Release and/or the
Presentation. We do not provide a reconciliation of the following non-GAAP guidance measures: (i) adjusted EBITDA, adjusted EBITDA margin,
and mid-point adjusted EBITDA margin (ii) adjusted corporate costs, and (iii) adjusted free cash flow for the fiscal year ended December
31, 2024 to the most comparable GAAP financial measures, due to the inherent difficulty of forecasting certain types of expenses and gains,
without unreasonable effort. The Company cautions that non-GAAP measures should be considered in addition to, but not as a substitute
for, the Company's reported GAAP results. Additionally, the Company notes that there can be no assurance that the above referenced non-GAAP
financial measures are comparable to similarly titled financial measures used by other publicly traded companies.
The information in Item 2.02 of this Current Report
on Form 8-K (including Exhibits 99.1 and 99.2) shall not be deemed “filed” for purposes of Section 18 of the Securities Act
of 1934, as amended, nor shall it be deemed incorporated by reference in any filing under the Securities Act of 1933, as amended, except
as shall be expressly set forth by specific reference in such filing.
Item 9.01. Financial Statements and Exhibits
(d) Exhibits.
SIGNATURES
Pursuant to the requirements of the Securities Exchange Act of 1934,
as amended, the Company has duly caused this report to be signed on its behalf by the undersigned hereunto duly authorized.
Dated: August 1, 2024
| |
CLARUS CORPORATION |
| |
|
| |
|
| |
By: |
/s/ Michael J. Yates |
| |
Name: Michael J. Yates |
| |
Title: Chief Financial Officer |
Exhibit 99.1

Clarus Reports Second
Quarter 2024 Results
Makes Incremental Progress
Executing Strategic Initiatives to Accelerate Long-Term Growth
Three Veteran Operating
and Sales Executives Added to Adventure Team to Support U.S., International and OEM Markets
Strategic Review Initiated
for PIEPS Snow Safety Brand within the Outdoor Segment
SALT LAKE CITY, August 1, 2024 (GLOBE NEWSWIRE) -- Clarus
Corporation (NASDAQ: CLAR) (“Clarus” and/or the “Company”), a global company focused on the outdoor enthusiast
markets, reported financial results for the second quarter ended June 30, 2024.
Second Quarter 2024 Financial Summary vs. Same
Year-Ago Quarter (adjusted to reflect the reclassification of the Precision Sport segment as discontinued operations)
| · | Sales
of $56.5 million compared to $57.9 million. |
| · | Gross
margin was 36.1% compared to 39.0%; adjusted gross margin of 37.4% compared to 39.0%. |
| · | Net
loss, which includes the impact of discontinued operations, of $5.5 million, or $(0.14) per
diluted share, compared to net loss of $2.1 million, or $(0.06) per diluted share. |
| · | Loss
from continuing operations of $5.5 million, or $(0.14) per diluted share, compared to loss
from continuing operations of $4.3 million, or $(0.12) per diluted share. |
| · | Adjusted
EBITDA from continuing operations of $(1.9) million with an adjusted EBITDA margin of (3.4)%
compared to $1.0 million with an adjusted EBITDA margin of 1.7%. |
Management Commentary
“Against a backdrop of constrained consumers in the
outdoor space, we made incremental progress in the second quarter executing Clarus’ strategic initiatives to seek to create long-term
value,” said Warren Kanders, Clarus’ Executive Chairman. “We are pleased to see continued improvement in the Outdoor
segment, particularly related to simplification and the rationalization of product lines, combined with continued evidence of stabilizing
trends in the North American wholesale market, as we focus on our core products and categories. In the Adventure segment, while revenue
increased year-over-year for the fourth consecutive quarter, the level of sales growth was affected by constrained consumer demand in
the North American market compared to our expectations, and overall profitability was impacted by increased investment aimed at accelerating
long-term growth.”
Mr. Kanders added, “Looking forward, we are confident
that Clarus is well positioned to drive sustainable and profitable growth as a pure-play, ESG-friendly outdoor business, supported by
outstanding leadership and a debt-free balance sheet. We remain in the early stages of our multi-year strategic plan but believe the
investments we have made to date strengthening our teams, enhancing business processes, and ensuring we offer in-demand, premium product
across our key categories will deliver significant long-term benefit. Based on our results through the first half of the year, we are
pleased to reaffirm our full-year revenue guidance. Reflective of market headwinds, as well as our strategic decision to aggressively
invest in the business, we have revised our 2024 adjusted EBITDA expectations.”
Second Quarter 2024 Financial Results
Sales in the second quarter were $56.5 million compared
to $57.9 million in the same year-ago quarter. This decrease was primarily driven by softness in the European wholesale and North American
direct-to-consumer markets at Outdoor, partially offset by a year-over-year increase in Adventure segment sales, specifically the OEM
channel.
Sales in the Adventure segment increased 13.6% to $20.3
million, or $20.5 million on a constant currency basis, compared to $17.9 million in the year-ago quarter, reflecting higher demand from
OEM customers and an increase from the TRED Outdoors acquisition. Sales in the Outdoor segment were $36.2 million, compared to $40.1
million in the year-ago quarter. The decline primarily reflects weakness in our North American direct-to-consumer markets and softness
in our European markets.
Gross margin in the second quarter was 36.1% compared
to 39.0% in the year-ago quarter. The decrease in gross margin was primarily due to an increase in PFAS (Per-and Polyfluoroalkyl Substances)
related inventory reserve expenses, unfavorable product mix due to increased discontinued merchandise sales at the Outdoor segment, as
well as higher inventory and sales return reserve expenses at the Adventure segment. Adjusted gross margin reflecting the PFAS related
inventory reserve was 37.4% for the quarter.
Selling, general and administrative expenses in the second
quarter were $28.1 million compared to $26.9 million in the same year-ago quarter. The increase was primarily due to an increase in higher
investment in marketing initiatives in the Adventure segment, as well as higher employee-related expenses across the Company. These increases
were partially offset by expense reduction initiatives in the Outdoor segment to manage costs, as well as lower intangible amortization.
The loss from continuing operations in the second quarter
of 2024 was $5.5 million, or $(0.14) per diluted share, compared to loss from continuing operations of $4.3 million, or $(0.12) per diluted
share in the year-ago quarter. Loss from continuing operations in the second quarter included $0.4 million of charges relating to legal
cost and regulatory matter expenses and $0.7 million of PFAS inventory reserve.
Adjusted loss from continuing operations in the second
quarter of 2024 was $1.2 million, or $(0.03) per diluted share, compared to adjusted loss from continuing operations of $0.1 million,
or $(0.00) per diluted share, in the year-ago quarter. Adjusted loss from continuing operations excludes legal cost and regulatory matters
expenses, PFAS inventory reserves, contingent consideration benefits, restructuring charges and transaction costs, as well as non-cash
items for intangible amortization and stock-based compensation.
Adjusted EBITDA from continuing operations in the second
quarter was $(1.9) million, or an adjusted EBITDA margin of (3.4)%, compared to adjusted EBITDA from continuing operations of $1.0 million,
or an adjusted EBITDA margin of 1.7%, in the same year-ago quarter.
Net cash generated in operating activities for the three
months ended June 30, 2024, was $0.8 million compared to net cash generated of $14.1 million in the prior year quarter. Capital expenditures
in the second quarter of 2024 were $1.6 million compared to $1.8 million in the prior year quarter. Free cash flow for the second quarter
of 2024 was an outflow of $0.7 million.
Liquidity at June 30, 2024 vs. December 31, 2023
| · | Cash
and cash equivalents totaled $46.2 million compared to $11.3 million. |
| · | Total
debt of $0.0 million compared to $119.8 million. |
Appoints Three Veteran Operating and Sales Executives
to Support Adventure Segment
In July, the Company announced three important strategic
hires to seek to accelerate international growth and global OEM initiatives. Adventure appointed Tripp Wyckoff to the role of General
Manager of the Americas, David Cook as Global Head of OEM and Daniel Bruntsch as Head of EMEA Sales.
Strategic Review of PIEPS
The Company has initiated a review and evaluation of strategic
options for its PIEPS snow safety brand, with the intention of soliciting interest from potential acquirors. This strategic initiative
is aligned with Clarus’ prioritization of simplifying the business and rationalizing our product categories. The Company’s
Board of Directors has not set a timetable to complete this review and evaluation of strategic options nor have any decisions been made
relating to strategic options at this time. There can be no assurance that the review process will result in any transaction that will
be consummated. The Company and the Company’s Board of Directors do not intend to comment further about this strategic review unless
and until they deem further disclosure is appropriate.
2024 Outlook
The Company continues to expect fiscal year 2024 sales
to range between $270 million to $280 million. Due to investments seeking to scale the Adventure segment, particularly in North America,
Europe and through direct marketing initiatives, the Company now expects adjusted EBITDA of approximately $11 million to $14 million,
or an adjusted EBITDA margin of 4.5% at the mid-point of revenue and adjusted EBITDA. In addition, the Company now expects capital expenditures
to range between $6 million to $7 million, of which $0.9 million related to Precision Sport prior to disposal, and adjusted free cash
flow to range between $7 million to $9 million for the full year 2024, excluding $2.0 million of cash outflow related to Precision Sport
prior to disposal.
Net Operating Loss (NOL)
The Company has net operating loss carryforwards (“NOLs”)
for U.S. federal income tax purposes of $7.7 million. None of the NOLs expire until December 31, 2029.
Conference Call
The Company will hold a conference call today at 5:00
p.m. Eastern time to discuss its second quarter 2024 results. To access the call by phone, please dial (833)-630-1956 (domestic) or (412)-317-1837
(international) and ask to be joined into the Clarus Corporation call. The conference call will be broadcast live and available for replay
here and on the Company’s website at www.claruscorp.com.
About Clarus Corporation
Headquartered in Salt Lake City, Utah, Clarus Corporation
is a global leader in the design and development of best-in-class equipment and lifestyle products for outdoor enthusiasts . Driven by
our rich history of engineering and innovation, our objective is to provide safe, simple, effective and beautiful products so that our
customers can maximize their outdoor pursuits and adventures. Each of our brands has a long history of continuous product innovation
for core and everyday users alike. The Company’s products are principally sold globally under the Black Diamond®, Rhino-Rack®,
MAXTRAX®, TRED Outdoors® brand names through outdoor specialty and online retailers, our own websites, distributors, and original
equipment manufacturers.
Use of Non-GAAP Measures
The Company reports its financial results in accordance
with U.S. generally accepted accounting principles (“GAAP”). This press release contains the non-GAAP measures: (i) adjusted
gross margin and adjusted gross profit, (ii) adjusted (loss) income from continuing operations and related earnings (loss) per diluted
share, (iii) earnings before interest, taxes, other income or expense, depreciation and amortization (“EBITDA”), EBITDA margin,
adjusted EBITDA, and adjusted EBITDA margin, and (iv) free cash flow (defined as net cash provided by operating activities less capital
expenditures). The Company believes that the presentation of certain non-GAAP measures, i.e.: (i) adjusted gross margin and adjusted
gross profit, (ii) adjusted (loss) income from continuing operations and related earnings (loss) per diluted share , (iii) EBITDA, EBITDA
margin, adjusted EBITDA and adjusted EBITDA margin, and (iv) free cash flow, provide useful information for the understanding of its
ongoing operations and enables investors to focus on period-over-period operating performance, and thereby enhances the user's overall
understanding of the Company's current financial performance relative to past performance and provides, along with the nearest GAAP measures,
a baseline for modeling future earnings expectations. Non-GAAP measures are reconciled to comparable GAAP financial measures within this
press release. We do not provide a reconciliation of the non-GAAP guidance measures Adjusted EBITDA and/or Adjusted EBITDA Margin for
the fiscal year 2024 to net income for the fiscal year 2024, the most comparable GAAP financial measure, due to the inherent difficulty
of forecasting certain types of expenses and gains, without unreasonable effort, which affect net income but not Adjusted EBITDA and/or
Adjusted EBITDA Margin. The Company cautions that non-GAAP measures should be considered in addition to, but not as a substitute for,
the Company's reported GAAP results. Additionally, the Company notes that there can be no assurance that the above referenced non-GAAP
financial measures are comparable to similarly titled financial measures used by other publicly traded companies.
Forward-Looking Statements
Please note that in this press release we may use words such
as “appears,” “anticipates,” “believes,” “plans,” “expects,” “intends,”
“future,” and similar expressions which constitute forward-looking statements within the meaning of the safe harbor provisions
of the Private Securities Litigation Reform Act of 1995. Forward-looking statements are made based on our expectations and beliefs concerning
future events impacting the Company and therefore involve a number of risks and uncertainties. We caution that forward-looking statements
are not guarantees and that actual results could differ materially from those expressed or implied in the forward-looking statements.
Potential risks and uncertainties that could cause the actual results of operations or financial condition of the Company to differ materially
from those expressed or implied by forward-looking statements in this press release, include, but are not limited to, those risks and
uncertainties more fully described from time to time in the Company's public reports filed with the Securities and Exchange Commission,
including under the section titled “Risk Factors” in the Company's Annual Report on Form 10-K, and/or Quarterly Reports on
Form 10-Q, as well as in the Company’s Current Reports on Form 8-K. All forward-looking statements included in this press release
are based upon information available to the Company as of the date of this press release and speak only as of the date hereof. We assume
no obligation to update any forward- looking statements to reflect events or circumstances after the date of this press release.
Company Contact:
Michael J. Yates
Chief Financial Officer
mike.yates@claruscorp.com
Investor Relations:
The IGB Group
Leon Berman / Matt Berkowitz
Tel 1-212-477-8438 / 1-212-227-7098
lberman@igbir.com /
mberkowitz@igbir.com
CLARUS
CORPORATION
CONDENSED
CONSOLIDATED BALANCE SHEETS
(Unaudited)
(In
thousands, except per share amounts)
| | |
June
30, 2024 | | |
December
31, 2023 | |
| Assets | |
| | | |
| | |
| Current assets | |
| | | |
| | |
| Cash | |
$ | 46,221 | | |
$ | 11,324 | |
| Accounts receivable, less allowance
for | |
| | | |
| | |
| credit losses of $1,566 and $1,412 | |
| 43,721 | | |
| 53,971 | |
| Inventories | |
| 91,456 | | |
| 91,409 | |
| Prepaid and other current assets | |
| 6,018 | | |
| 4,865 | |
| Income tax receivable | |
| 1,371 | | |
| 892 | |
| Assets held for
sale | |
| - | | |
| 137,284 | |
| Total current assets | |
| 188,787 | | |
| 299,745 | |
| | |
| | | |
| | |
| Property and equipment, net | |
| 17,029 | | |
| 16,587 | |
| Other intangible assets, net | |
| 35,779 | | |
| 41,466 | |
| Indefinite-lived intangible assets | |
| 57,694 | | |
| 58,527 | |
| Goodwill | |
| 38,834 | | |
| 39,320 | |
| Deferred income taxes | |
| 17,199 | | |
| 22,869 | |
| Other long-term assets | |
| 14,078 | | |
| 16,824 | |
| Total assets | |
$ | 369,400 | | |
$ | 495,338 | |
| | |
| | | |
| | |
| Liabilities and Stockholders’ Equity | |
| | | |
| | |
| Current liabilities | |
| | | |
| | |
| Accounts payable | |
$ | 9,533 | | |
$ | 20,015 | |
| Accrued liabilities | |
| 23,358 | | |
| 24,580 | |
| Income tax payable | |
| - | | |
| 805 | |
| Current portion of long-term debt | |
| - | | |
| 119,790 | |
| Liabilities held
for sale | |
| - | | |
| 5,744 | |
| Total current liabilities | |
| 32,891 | | |
| 170,934 | |
| | |
| | | |
| | |
| Deferred income taxes | |
| 16,697 | | |
| 18,124 | |
| Other long-term liabilities | |
| 12,529 | | |
| 14,160 | |
| Total liabilities | |
| 62,117 | | |
| 203,218 | |
| | |
| | | |
| | |
| Stockholders’ Equity | |
| | | |
| | |
| Preferred stock, $0.0001 par value per share; 5,000 shares authorized; none
issued | |
| - | | |
| - | |
| Common stock, $0.0001 par value per share; 100,000 shares
authorized; 42,940 and 42,761 issued and 38,298 and 38,149 outstanding, respectively | |
| 4 | | |
| 4 | |
| Additional paid in capital | |
| 694,194 | | |
| 691,198 | |
| Accumulated deficit | |
| (336,261 | ) | |
| (350,739 | ) |
| Treasury stock, at cost | |
| (33,114 | ) | |
| (32,929 | ) |
| Accumulated other comprehensive loss | |
| (17,540 | ) | |
| (15,414 | ) |
| Total stockholders’
equity | |
| 307,283 | | |
| 292,120 | |
| Total liabilities and stockholders’
equity | |
$ | 369,400 | | |
$ | 495,338 | |
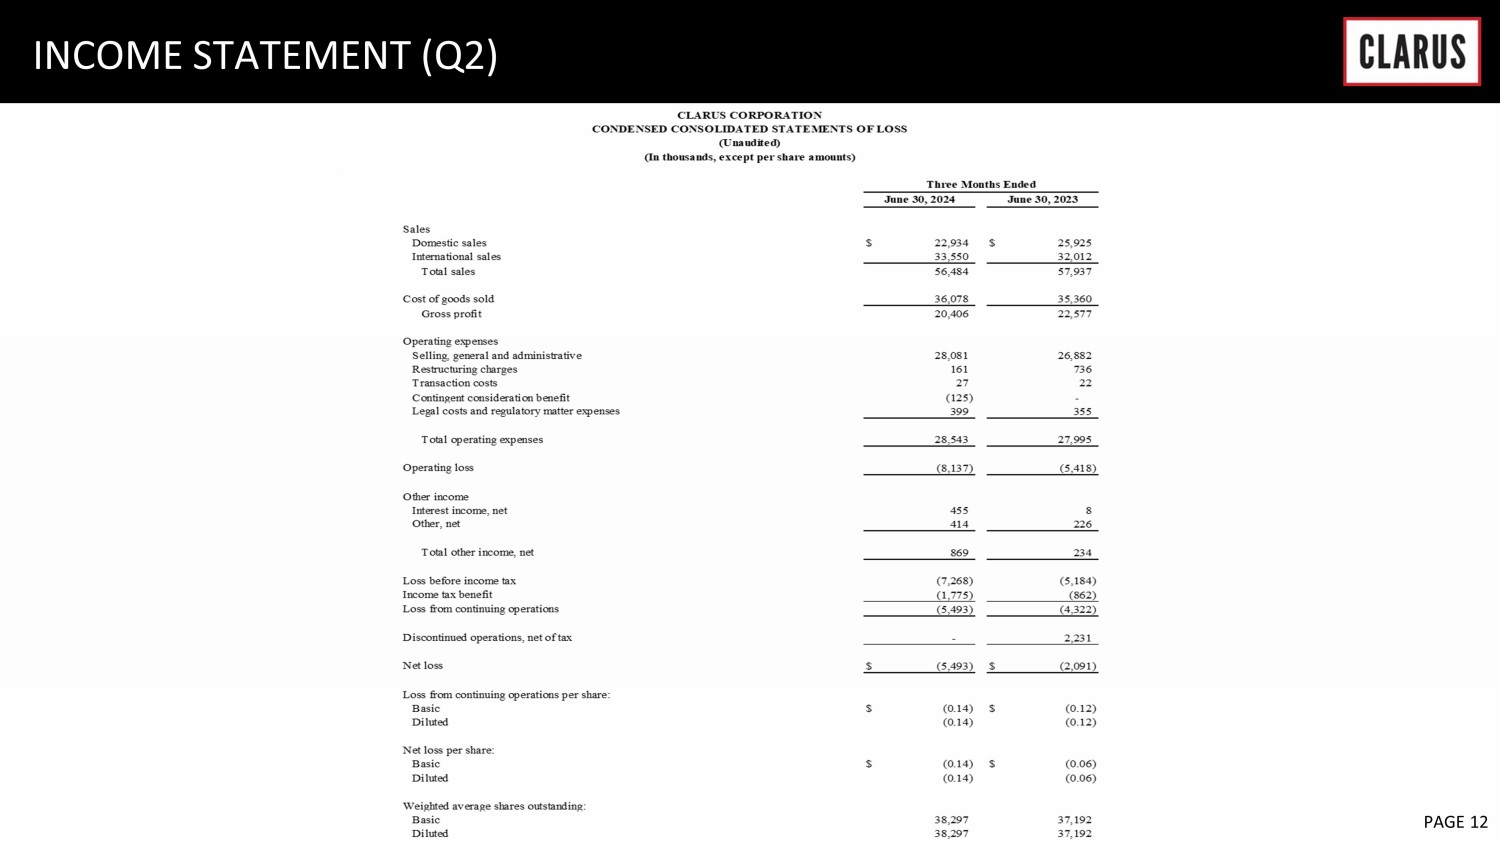
CLARUS
CORPORATION
CONDENSED
CONSOLIDATED STATEMENTS OF LOSS
(Unaudited)
(In
thousands, except per share amounts)
| | |
Three Months
Ended | |
| | |
June 30,
2024 | | |
June 30,
2023 | |
| Sales | |
| | | |
| | |
| Domestic sales | |
$ | 22,934 | | |
$ | 25,925 | |
| International
sales | |
| 33,550 | | |
| 32,012 | |
| Total sales | |
| 56,484 | | |
| 57,937 | |
| | |
| | | |
| | |
| Cost of goods sold | |
| 36,078 | | |
| 35,360 | |
| Gross profit | |
| 20,406 | | |
| 22,577 | |
| | |
| | | |
| | |
| Operating expenses | |
| | | |
| | |
| Selling, general and administrative | |
| 28,081 | | |
| 26,882 | |
| Restructuring charges | |
| 161 | | |
| 736 | |
| Transaction costs | |
| 27 | | |
| 22 | |
| Contingent consideration benefit | |
| (125 | ) | |
| - | |
| Legal costs and
regulatory matter expenses | |
| 399 | | |
| 355 | |
| | |
| | | |
| | |
| Total operating
expenses | |
| 28,543 | | |
| 27,995 | |
| | |
| | | |
| | |
| Operating loss | |
| (8,137 | ) | |
| (5,418 | ) |
| | |
| | | |
| | |
| Other income | |
| | | |
| | |
| Interest income, net | |
| 455 | | |
| 8 | |
| Other, net | |
| 414 | | |
| 226 | |
| | |
| | | |
| | |
| Total other income,
net | |
| 869 | | |
| 234 | |
| | |
| | | |
| | |
| Loss before income tax | |
| (7,268 | ) | |
| (5,184 | ) |
| Income tax benefit | |
| (1,775 | ) | |
| (862 | ) |
| Loss from continuing operations | |
| (5,493 | ) | |
| (4,322 | ) |
| | |
| | | |
| | |
| Discontinued operations, net of tax | |
| - | | |
| 2,231 | |
| | |
| | | |
| | |
| Net loss | |
$ | (5,493 | ) | |
$ | (2,091 | ) |
| | |
| | | |
| | |
| Loss from continuing operations per share: | |
| | | |
| | |
| Basic | |
$ | (0.14 | ) | |
$ | (0.12 | ) |
| Diluted | |
| (0.14 | ) | |
| (0.12 | ) |
| | |
| | | |
| | |
| Net loss per share: | |
| | | |
| | |
| Basic | |
$ | (0.14 | ) | |
$ | (0.06 | ) |
| Diluted | |
| (0.14 | ) | |
| (0.06 | ) |
| | |
| | | |
| | |
| Weighted average shares outstanding: | |
| | | |
| | |
| Basic | |
| 38,297 | | |
| 37,192 | |
| Diluted | |
| 38,297 | | |
| 37,192 | |
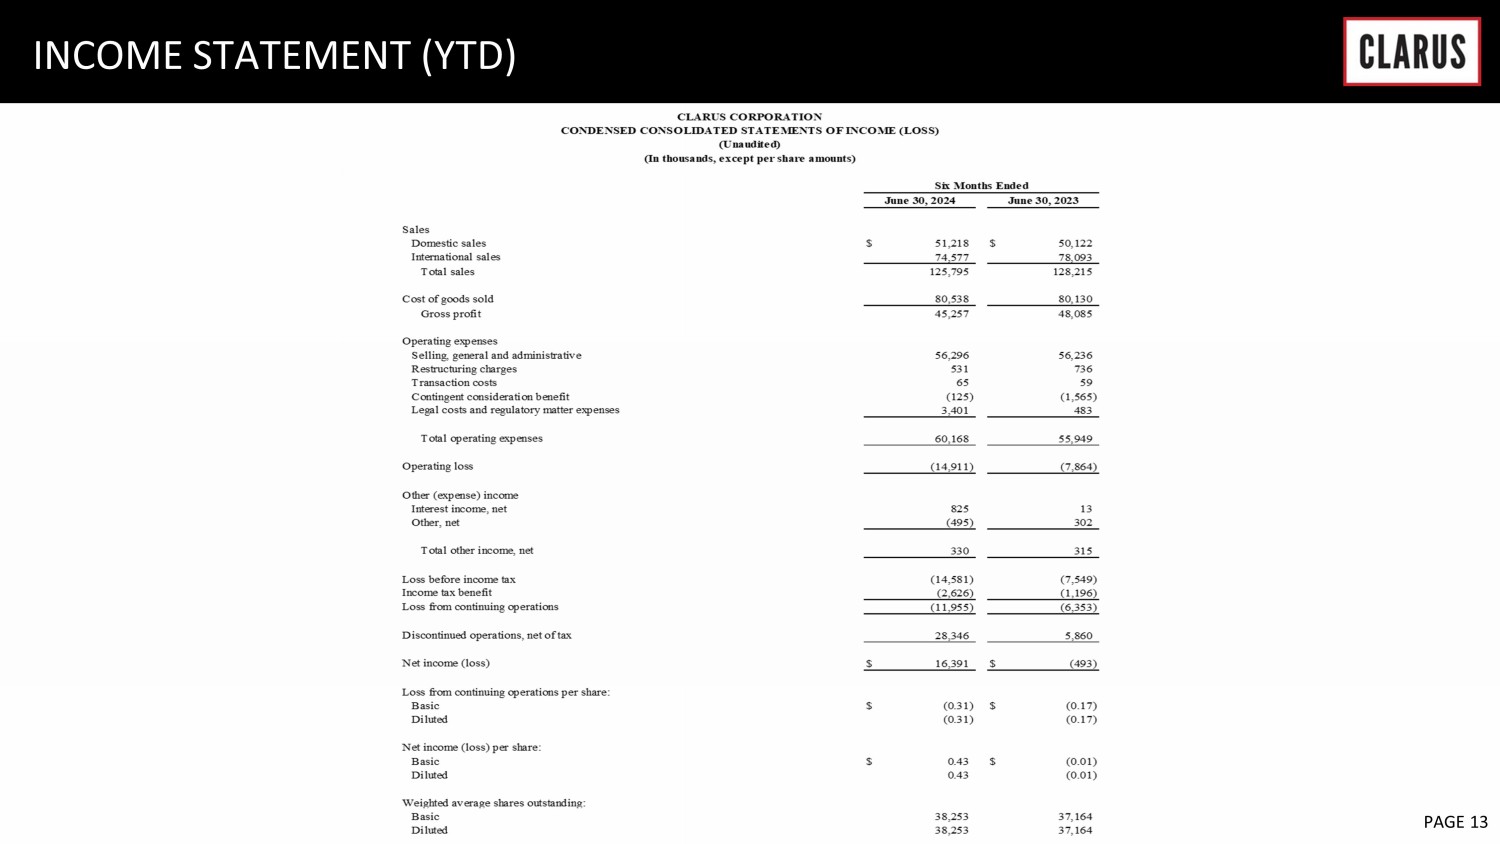
CLARUS
CORPORATION
CONDENSED
CONSOLIDATED STATEMENTS OF INCOME (LOSS)
(Unaudited)
(In
thousands, except per share amounts)
| | |
Six Months
Ended | |
| | |
June 30,
2024 | | |
June 30,
2023 | |
| Sales | |
| | | |
| | |
| Domestic sales | |
$ | 51,218 | | |
$ | 50,122 | |
| International
sales | |
| 74,577 | | |
| 78,093 | |
| Total sales | |
| 125,795 | | |
| 128,215 | |
| | |
| | | |
| | |
| Cost of goods sold | |
| 80,538 | | |
| 80,130 | |
| Gross profit | |
| 45,257 | | |
| 48,085 | |
| | |
| | | |
| | |
| Operating expenses | |
| | | |
| | |
| Selling, general and administrative | |
| 56,296 | | |
| 56,236 | |
| Restructuring charges | |
| 531 | | |
| 736 | |
| Transaction costs | |
| 65 | | |
| 59 | |
| Contingent consideration benefit | |
| (125 | ) | |
| (1,565 | ) |
| Legal costs and
regulatory matter expenses | |
| 3,401 | | |
| 483 | |
| | |
| | | |
| | |
| Total operating
expenses | |
| 60,168 | | |
| 55,949 | |
| | |
| | | |
| | |
| Operating loss | |
| (14,911 | ) | |
| (7,864 | ) |
| | |
| | | |
| | |
| Other (expense) income | |
| | | |
| | |
| Interest income, net | |
| 825 | | |
| 13 | |
| Other, net | |
| (495 | ) | |
| 302 | |
| | |
| | | |
| | |
| Total other income,
net | |
| 330 | | |
| 315 | |
| | |
| | | |
| | |
| Loss before income tax | |
| (14,581 | ) | |
| (7,549 | ) |
| Income tax benefit | |
| (2,626 | ) | |
| (1,196 | ) |
| Loss from continuing operations | |
| (11,955 | ) | |
| (6,353 | ) |
| | |
| | | |
| | |
| Discontinued operations, net of tax | |
| 28,346 | | |
| 5,860 | |
| | |
| | | |
| | |
| Net income (loss) | |
$ | 16,391 | | |
$ | (493 | ) |
| | |
| | | |
| | |
| Loss from continuing operations per share: | |
| | | |
| | |
| Basic | |
$ | (0.31 | ) | |
$ | (0.17 | ) |
| Diluted | |
| (0.31 | ) | |
| (0.17 | ) |
| | |
| | | |
| | |
| Net income (loss) per share: | |
| | | |
| | |
| Basic | |
$ | 0.43 | | |
$ | (0.01 | ) |
| Diluted | |
| 0.43 | | |
| (0.01 | ) |
| | |
| | | |
| | |
| Weighted average shares outstanding: | |
| | | |
| | |
| Basic | |
| 38,253 | | |
| 37,164 | |
| Diluted | |
| 38,253 | | |
| 37,164 | |
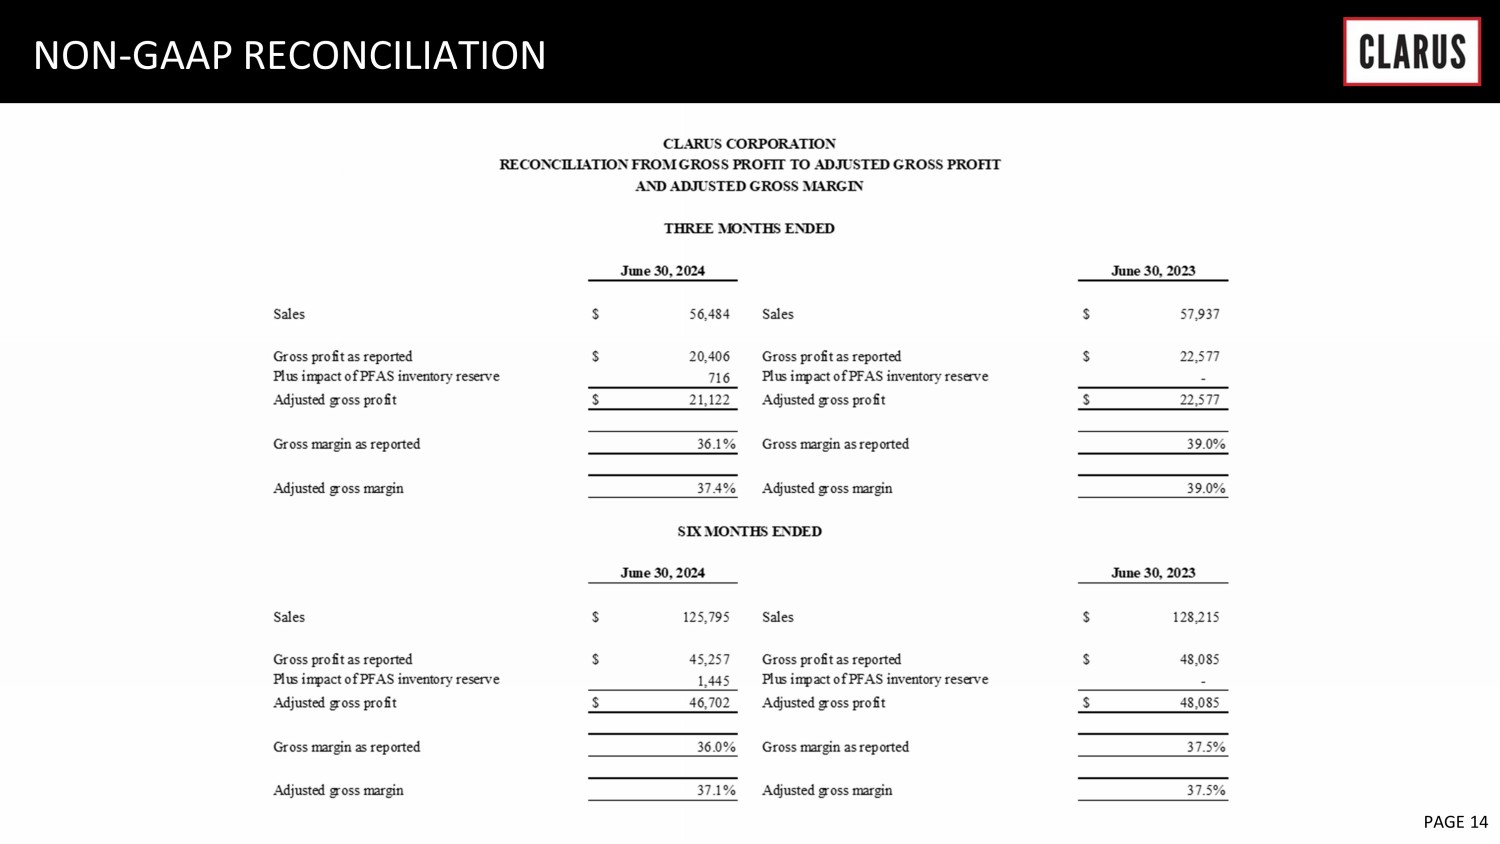
CLARUS
CORPORATION
RECONCILIATION
FROM GROSS PROFIT TO ADJUSTED GROSS PROFIT
AND
ADJUSTED GROSS MARGIN
THREE
MONTHS ENDED
| | |
June 30,
2024 | | |
| |
June 30,
2023 | |
| Sales | |
$ | 56,484 | | |
Sales | |
$ | 57,937 | |
| | |
| | | |
| |
| | |
| Gross profit as reported | |
$ | 20,406 | | |
Gross profit as reported | |
$ | 22,577 | |
| Plus impact of PFAS inventory reserve | |
| 716 | | |
Plus impact of PFAS inventory reserve | |
| - | |
| Adjusted gross profit | |
$ | 21,122 | | |
Adjusted gross profit | |
$ | 22,577 | |
| | |
| | | |
| |
| | |
| Gross margin as reported | |
| 36.1 | % | |
Gross margin as reported | |
| 39.0 | % |
| | |
| | | |
| |
| | |
| Adjusted gross margin | |
| 37.4 | % | |
Adjusted gross margin | |
| 39.0 | % |
SIX MONTHS ENDED
| | |
| June
30, 2024 | | |
| |
| June
30, 2023 | |
| Sales | |
$ | 125,795 | | |
Sales | |
$ | 128,215 | |
| | |
| | | |
| |
| | |
| Gross profit as reported | |
$ | 45,257 | | |
Gross profit as reported | |
$ | 48,085 | |
| Plus impact of PFAS inventory reserve | |
| 1,445 | | |
Plus impact of PFAS inventory reserve | |
| - | |
| Adjusted gross profit | |
$ | 46,702 | | |
Adjusted gross profit | |
$ | 48,085 | |
| | |
| | | |
| |
| | |
| Gross margin as reported | |
| 36.0 | % | |
Gross margin as reported | |
| 37.5 | % |
| | |
| | | |
| |
| | |
| Adjusted gross margin | |
| 37.1 | % | |
Adjusted gross margin | |
| 37.5 | % |
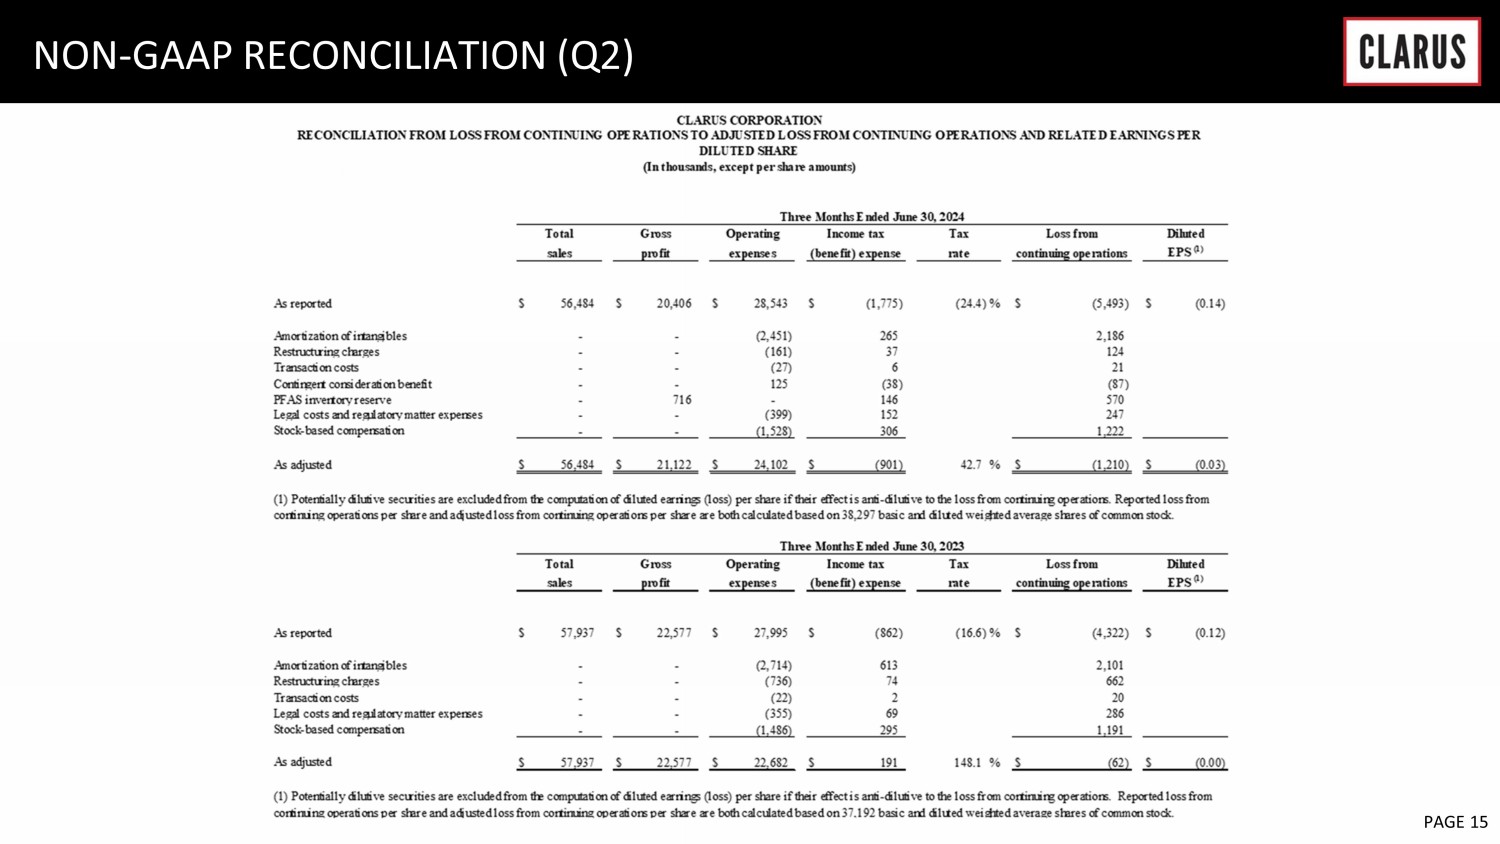
CLARUS
CORPORATION
RECONCILIATION
FROM LOSS FROM CONTINUING OPERATIONS TO ADJUSTED LOSS FROM CONTINUING OPERATIONS AND RELATED EARNINGS PER DILUTED SHARE
(In
thousands, except per share amounts)
| | |
Three
Months Ended June 30, 2024 | |
| | |
Total | | |
Gross | | |
Operating | | |
Income tax | | |
Tax | | |
Loss from | | |
Diluted | |
| | |
sales | | |
profit | | |
expenses | | |
(benefit)
expense | | |
rate | | |
continuing
operations | | |
EPS
(1) | |
| As reported | |
$ | 56,484 | | |
$ | 20,406 | | |
$ | 28,543 | | |
$ | (1,775 | ) | |
| (24.4 | )% | |
$ | (5,493 | ) | |
$ | (0.14 | ) |
| | |
| | | |
| | | |
| | | |
| | | |
| | | |
| | | |
| | |
| Amortization of intangibles | |
| - | | |
| - | | |
| (2,451 | ) | |
| 265 | | |
| | | |
| 2,186 | | |
| | |
| Restructuring charges | |
| - | | |
| - | | |
| (161 | ) | |
| 37 | | |
| | | |
| 124 | | |
| | |
| Transaction costs | |
| - | | |
| - | | |
| (27 | ) | |
| 6 | | |
| | | |
| 21 | | |
| | |
| Contingent consideration benefit | |
| - | | |
| - | | |
| 125 | | |
| (38 | ) | |
| | | |
| (87 | ) | |
| | |
| PFAS inventory reserve | |
| - | | |
| 716 | | |
| - | | |
| 146 | | |
| | | |
| 570 | | |
| | |
| Legal costs and regulatory matter
expenses | |
| - | | |
| - | | |
| (399 | ) | |
| 152 | | |
| | | |
| 247 | | |
| | |
| Stock-based
compensation | |
| - | | |
| - | | |
| (1,528 | ) | |
| 306 | | |
| | | |
| 1,222 | | |
| | |
| | |
| | | |
| | | |
| | | |
| | | |
| | | |
| | | |
| | |
| As adjusted | |
$ | 56,484 | | |
$ | 21,122 | | |
$ | 24,102 | | |
$ | (901 | ) | |
| 42.7 | % | |
$ | (1,210 | ) | |
$ | (0.03 | ) |
(1)
Potentially dilutive securities are excluded from the computation of diluted earnings (loss) per share if their effect is anti-dilutive
to the loss from continuing operations. Reported loss from continuing operations per share and adjusted loss from continuing operations
per share are both calculated based on 38,297 basic and diluted weighted average shares of common stock.
| | |
Three
Months Ended June 30, 2023 | |
| | |
Total | | |
Gross | | |
Operating | | |
Income tax | | |
Tax | | |
Loss from | | |
Diluted | |
| | |
sales | | |
profit | | |
expenses | | |
(benefit)
expense | | |
rate | | |
continuing
operations | | |
EPS
(1) | |
| As reported | |
$ | 57,937 | | |
$ | 22,577 | | |
$ | 27,995 | | |
$ | (862 | ) | |
| (16.6 | )% | |
$ | (4,322 | ) | |
$ | (0.12 | ) |
| | |
| | | |
| | | |
| | | |
| | | |
| | | |
| | | |
| | |
| Amortization of intangibles | |
| - | | |
| - | | |
| (2,714 | ) | |
| 613 | | |
| | | |
| 2,101 | | |
| | |
| Restructuring charges | |
| - | | |
| - | | |
| (736 | ) | |
| 74 | | |
| | | |
| 662 | | |
| | |
| Transaction costs | |
| - | | |
| - | | |
| (22 | ) | |
| 2 | | |
| | | |
| 20 | | |
| | |
| Legal costs and regulatory matter
expenses | |
| - | | |
| - | | |
| (355 | ) | |
| 69 | | |
| | | |
| 286 | | |
| | |
| Stock-based
compensation | |
| - | | |
| - | | |
| (1,486 | ) | |
| 295 | | |
| | | |
| 1,191 | | |
| | |
| | |
| | | |
| | | |
| | | |
| | | |
| | | |
| | | |
| | |
| As adjusted | |
$ | 57,937 | | |
$ | 22,577 | | |
$ | 22,682 | | |
$ | 191 | | |
| 148.1 | % | |
$ | (62 | ) | |
$ | (0.00 | ) |
(1)
Potentially dilutive securities are excluded from the computation of diluted earnings (loss) per share if their effect is anti-dilutive
to the loss from continuing operations. Reported loss from continuing operations per share and adjusted loss from continuing
operations per share are both calculated based on 37,192 basic and diluted weighted average shares of common stock.
CLARUS
CORPORATION
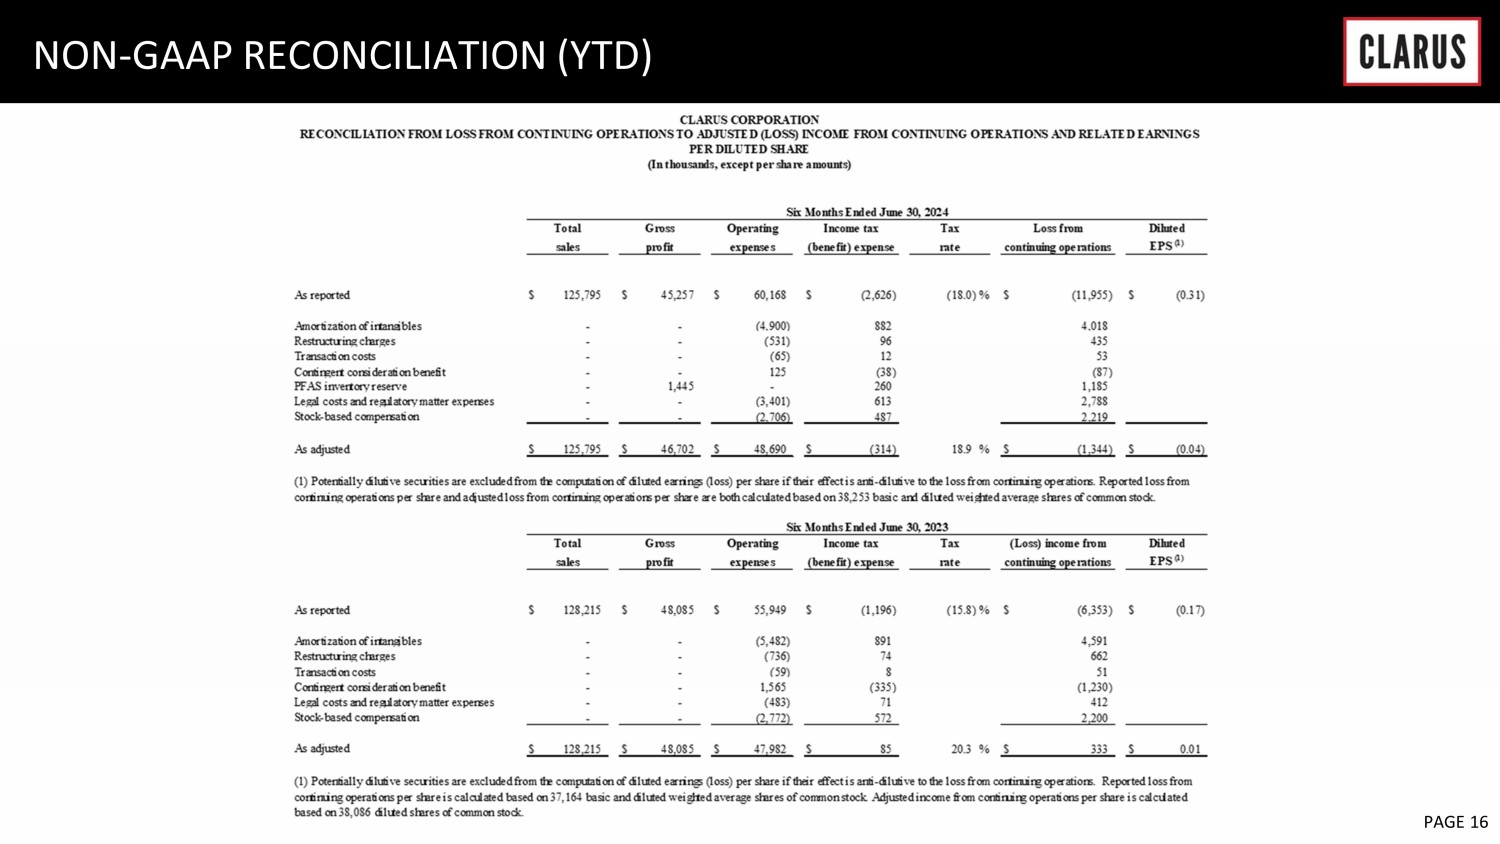
RECONCILIATION
FROM LOSS FROM CONTINUING OPERATIONS TO ADJUSTED (LOSS) INCOME FROM CONTINUING OPERATIONS AND RELATED EARNINGS PER DILUTED SHARE
(In
thousands, except per share amounts)
| | |
Six
Months Ended June 30, 2024 | |
| | |
Total | | |
Gross | | |
Operating | | |
Income tax | | |
Tax | | |
Loss from | | |
Diluted | |
| | |
sales | | |
profit | | |
expenses | | |
(benefit)
expense | | |
rate | | |
continuing
operations | | |
EPS
(1) | |
| As reported | |
$ | 125,795 | | |
$ | 45,257 | | |
$ | 60,168 | | |
$ | (2,626 | ) | |
| (18.0 | )% | |
$ | (11,955 | ) | |
$ | (0.31 | ) |
| | |
| | | |
| | | |
| | | |
| | | |
| | | |
| | | |
| | |
| Amortization of intangibles | |
| - | | |
| - | | |
| (4,900 | ) | |
| 882 | | |
| | | |
| 4,018 | | |
| | |
| Restructuring charges | |
| - | | |
| - | | |
| (531 | ) | |
| 96 | | |
| | | |
| 435 | | |
| | |
| Transaction costs | |
| - | | |
| - | | |
| (65 | ) | |
| 12 | | |
| | | |
| 53 | | |
| | |
| Contingent consideration benefit | |
| - | | |
| - | | |
| 125 | | |
| (38 | ) | |
| | | |
| (87 | ) | |
| | |
| PFAS inventory reserve | |
| - | | |
| 1,445 | | |
| - | | |
| 260 | | |
| | | |
| 1,185 | | |
| | |
| Legal costs and regulatory matter
expenses | |
| - | | |
| - | | |
| (3,401 | ) | |
| 613 | | |
| | | |
| 2,788 | | |
| | |
| Stock-based
compensation | |
| - | | |
| - | | |
| (2,706 | ) | |
| 487 | | |
| | | |
| 2,219 | | |
| | |
| | |
| | | |
| | | |
| | | |
| | | |
| | | |
| | | |
| | |
| As adjusted | |
$ | 125,795 | | |
$ | 46,702 | | |
$ | 48,690 | | |
$ | (314 | ) | |
| 18.9 | % | |
$ | (1,344 | ) | |
$ | (0.04 | ) |
(1)
Potentially dilutive securities are excluded from the computation of diluted earnings (loss) per share if their effect is anti-dilutive
to the loss from continuing operations. Reported loss from continuing operations per share and adjusted loss from continuing operations
per share are both calculated based on 38,253 basic and diluted weighted average shares of common stock.
| | |
Six
Months Ended June 30, 2023 | |
| | |
Total | | |
Gross | | |
Operating | | |
Income tax | | |
Tax | | |
(Loss) income
from | | |
Diluted | |
| | |
sales | | |
profit | | |
expenses | | |
(benefit)
expense | | |
rate | | |
continuing
operations | | |
EPS
(1) | |
| As reported | |
$ | 128,215 | | |
$ | 48,085 | | |
$ | 55,949 | | |
$ | (1,196 | ) | |
| (15.8 | )% | |
$ | (6,353 | ) | |
$ | (0.17 | ) |
| | |
| | | |
| | | |
| | | |
| | | |
| | | |
| | | |
| | |
| Amortization of intangibles | |
| - | | |
| - | | |
| (5,482 | ) | |
| 891 | | |
| | | |
| 4,591 | | |
| | |
| Restructuring charges | |
| - | | |
| - | | |
| (736 | ) | |
| 74 | | |
| | | |
| 662 | | |
| | |
| Transaction costs | |
| - | | |
| - | | |
| (59 | ) | |
| 8 | | |
| | | |
| 51 | | |
| | |
| Contingent consideration benefit | |
| - | | |
| - | | |
| 1,565 | | |
| (335 | ) | |
| | | |
| (1,230 | ) | |
| | |
| Legal costs and regulatory matter
expenses | |
| - | | |
| - | | |
| (483 | ) | |
| 71 | | |
| | | |
| 412 | | |
| | |
| Stock-based
compensation | |
| - | | |
| - | | |
| (2,772 | ) | |
| 572 | | |
| | | |
| 2,200 | | |
| | |
| | |
| | | |
| | | |
| | | |
| | | |
| | | |
| | | |
| | |
| As adjusted | |
$ | 128,215 | | |
$ | 48,085 | | |
$ | 47,982 | | |
$ | 85 | | |
| 20.3 | % | |
$ | 333 | | |
$ | 0.01 | |
(1)
Potentially dilutive securities are excluded from the computation of diluted earnings (loss) per share if their effect is anti-dilutive
to the loss from continuing operations. Reported loss from continuing operations per share is calculated based on 37,164 basic
and diluted weighted average shares of common stock. Adjusted income from continuing operations per share is calculated based on 38,086
diluted shares of common stock.
CLARUS
CORPORATION
RECONCILIATION
FROM LOSS FROM CONTINUING OPERATIONS TO EARNINGS BEFORE INTEREST, TAXES, DEPRECIATION, AND AMORTIZATION (EBITDA), EBITDA MARGIN, ADJUSTED
EBITDA, AND ADJUSTED EBITDA MARGIN
(In
thousands)
| | |
Three Months
Ended | |
| | |
June 30,
2024 | | |
June 30,
2023 | |
| Loss from continuing operations | |
$ | (5,493 | ) | |
$ | (4,322 | ) |
| | |
| | | |
| | |
| Income tax benefit | |
| (1,775 | ) | |
| (862 | ) |
| Other, net | |
| (414 | ) | |
| (226 | ) |
| Interest income, net | |
| (455 | ) | |
| (8 | ) |
| | |
| | | |
| | |
| Operating loss | |
| (8,137 | ) | |
| (5,418 | ) |
| | |
| | | |
| | |
| Depreciation | |
| 1,045 | | |
| 1,080 | |
| Amortization of intangibles | |
| 2,451 | | |
| 2,714 | |
| | |
| | | |
| | |
| EBITDA | |
| (4,641 | ) | |
| (1,624 | ) |
| | |
| | | |
| | |
| Restructuring charges | |
| 161 | | |
| 736 | |
| Transaction costs | |
| 27 | | |
| 22 | |
| Contingent consideration benefit | |
| (125 | ) | |
| - | |
| PFAS inventory reserve | |
| 716 | | |
| - | |
| Legal costs and regulatory matter expenses | |
| 399 | | |
| 355 | |
| Stock-based compensation | |
| 1,528 | | |
| 1,486 | |
| | |
| | | |
| | |
| Adjusted EBITDA | |
$ | (1,935 | ) | |
$ | 975 | |
| | |
| | | |
| | |
| Sales | |
$ | 56,484 | | |
$ | 57,937 | |
| | |
| | | |
| | |
| EBITDA margin | |
| -8.2 | % | |
| -2.8 | % |
| Adjusted EBITDA margin | |
| -3.4 | % | |
| 1.7 | % |
CLARUS
CORPORATION
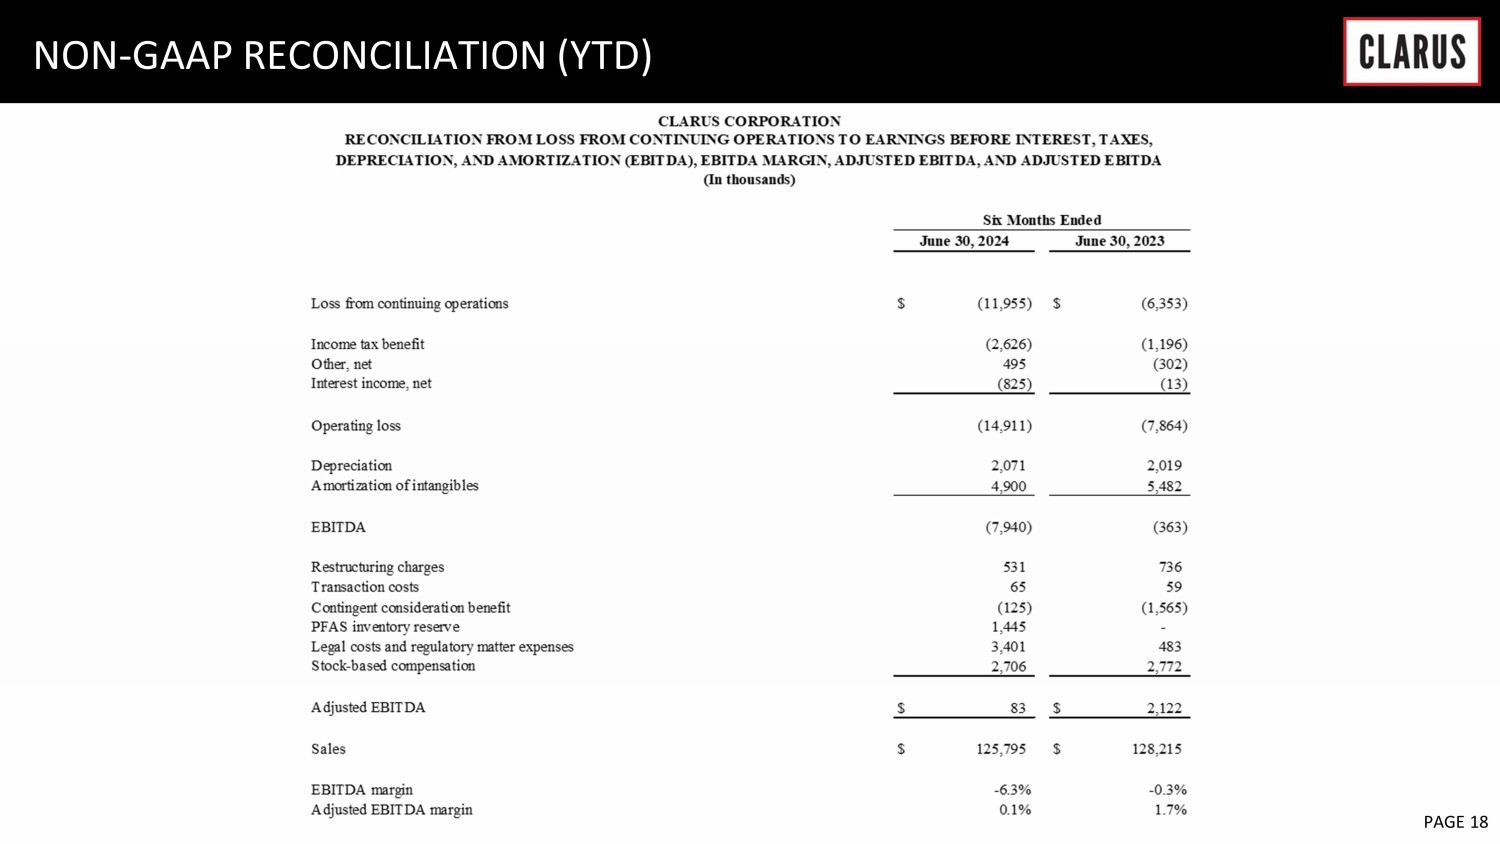
RECONCILIATION
FROM LOSS FROM CONTINUING OPERATIONS TO EARNINGS BEFORE INTEREST, TAXES, DEPRECIATION, AND AMORTIZATION (EBITDA), EBITDA MARGIN, ADJUSTED
EBITDA, AND ADJUSTED EBITDA MARGIN
(In
thousands)
| | |
Six Months
Ended | |
| | |
June 30,
2024 | | |
June 30,
2023 | |
| Loss from continuing operations | |
$ | (11,955 | ) | |
$ | (6,353 | ) |
| | |
| | | |
| | |
| Income tax benefit | |
| (2,626 | ) | |
| (1,196 | ) |
| Other, net | |
| 495 | | |
| (302 | ) |
| Interest income, net | |
| (825 | ) | |
| (13 | ) |
| | |
| | | |
| | |
| Operating loss | |
| (14,911 | ) | |
| (7,864 | ) |
| | |
| | | |
| | |
| Depreciation | |
| 2,071 | | |
| 2,019 | |
| Amortization of intangibles | |
| 4,900 | | |
| 5,482 | |
| | |
| | | |
| | |
| EBITDA | |
| (7,940 | ) | |
| (363 | ) |
| | |
| | | |
| | |
| Restructuring charges | |
| 531 | | |
| 736 | |
| Transaction costs | |
| 65 | | |
| 59 | |
| Contingent consideration benefit | |
| (125 | ) | |
| (1,565 | ) |
| PFAS inventory reserve | |
| 1,445 | | |
| - | |
| Legal costs and regulatory matter expenses | |
| 3,401 | | |
| 483 | |
| Stock-based compensation | |
| 2,706 | | |
| 2,772 | |
| | |
| | | |
| | |
| Adjusted EBITDA | |
$ | 83 | | |
$ | 2,122 | |
| | |
| | | |
| | |
| Sales | |
$ | 125,795 | | |
$ | 128,215 | |
| | |
| | | |
| | |
| EBITDA margin | |
| -6.3 | % | |
| -0.3 | % |
| Adjusted EBITDA margin | |
| 0.1 | % | |
| 1.7 | % |
Exhibit 99.2

Q2 EARNINGS PRESENTATION AUGUST 1 , 2024
6 February 2023 PAGE 2 Forward - Looking Statements Please note that in this presentation we may use words such as “appears,” “anticipates,” “believes,” “plans,” “expects,” “int end s,” “future,” and similar expressions which constitute forward - looking statements within the meaning of the safe harbor provisions of the Private Securities Litigation Reform Act of 1995. Forward - looking statem ents are made based on our expectations and beliefs concerning future events impacting the Company and therefore involve a number of risks and uncertainties. We caution that forward - looking statements are not guarantees and that actual results could differ materially from those expressed or implied in the forward - looking statements. Potential risks and uncertainties that could cause the actual results of operations or financial condition of the Company to differ materially from those expressed or implied by forward - looking statements in this presentation, include, but are not limited to, those risks and uncert ainties more fully described from time to time in the Company's public reports filed with the Securities and Exchange Commission, including under the section titled “Risk Factors” in the Company's Annual Report on Form 10 - K, and/or Quarterly Reports on Form 10 - Q, as well as in the Company’s Current Reports on Form 8 - K. All forward - looking statements included in this presentation are based upon information available t o the Company as of the date of this presentation and speak only as of the date hereof. We assume no obligation to update any forward - looking statements to reflect events or circumstances after the date of t his presentation. Non - GAAP Financial Measures The Company reports its financial results in accordance with U.S. generally accepted accounting principles (“GAAP”). This pre sen tation contains the non - GAAP measures: ( i ) adjusted gross margin and adjusted gross profit, (ii) adjusted (loss) income from continuing operations and related earnings (loss) per diluted share, (iii) ear nin gs before interest, taxes, other income or expense, depreciation and amortization (“EBITDA”), EBITDA margin, adjusted EBITDA, and adjusted EBITDA margin , (iv) segment EBITDA and adjusted segment EBITDA, and (v) free cash flow (defined as net cash provided by operating activities less capital expenditures). The Company believes that the presentation of certain non - GAAP measures, i.e.: ( i ) adjusted gross margin and adjusted gross profit, (ii) adjusted (loss) income from continuing operations and related earnings (loss) per diluted share , (iii) EBITDA, EBITDA margin, adjusted EBITDA and adjusted EBITDA margin, (iv) segment EBITDA and adjusted segment EBITDA, an d (v) free cash flow, provide useful information for the understanding of its ongoing operations and enables investors to focus on period - over - period operating per formance, and thereby enhances the user's overall understanding of the Company's current financial performance relative to past performance and provides, along with the nearest GAAP measures, a ba sel ine for modeling future earnings expectations. Non - GAAP measures are reconciled to comparable GAAP financial measures herein. We do not provide a reconciliation of the non - GAAP guidance measures, i.e.: ( i ) a djusted EBITDA, adjusted EBITDA m argin, and mid - point adjusted EBITDA margin (ii) adjusted corporate costs, and (iii) adjusted free cash flow for the fiscal year 2024 to the most comparab le GAAP financial measure, due to the inherent difficulty of forecasting certain types of expenses and gains, without unreasonable effort. The Company cautions that non - GAAP measures should be considered in addition to, but not as a substitute for, the Company's repo rted GAAP results. Additionally, the Company notes that there can be no assurance that the above referenced non - GAAP financial measures are compara ble to similarly titled financial measures used by other publicly traded companies. Market and Industry Data The market and industry data used throughout this presentation was obtained from various sources, including the Company’s own re search and estimates, surveys or studies conducted by third parties and industry or general publications and forecasts. Industry publications, surveys and forecasts generally state that they have o bta ined information from sources believed to be reliable, but there can be no assurance as to the accuracy and completeness of such information. While the Company believes that each of these surveys, studies, publ ica tions and forecasts is reliable, it has not independently verified such data and the Company is not making any representation as to the accuracy of such information. Similarly, the Company believes its internal re search and estimates are reliable but it has not been verified by any independent sources. In addition, while the Company believes that the industry and market information included herein is generally reliab le, such information is inherently imprecise. While the Company is not aware of any misstatements regarding the industry and market data presented herein, its estimates involve risks and uncertainties and are sub ject to change based on various factors, including those discussed under the heading “Forward - Looking Statements” above. DISCLAIMER

Warren Kanders EXECUTIVE CHAIRMAN Clarus TODAY’S PRESENTERS Mike Yates CFO Clarus Neil Fiske PRESIDENT Black Diamond Equipment Mat Hayward MANAGING DIRECTOR Adventure
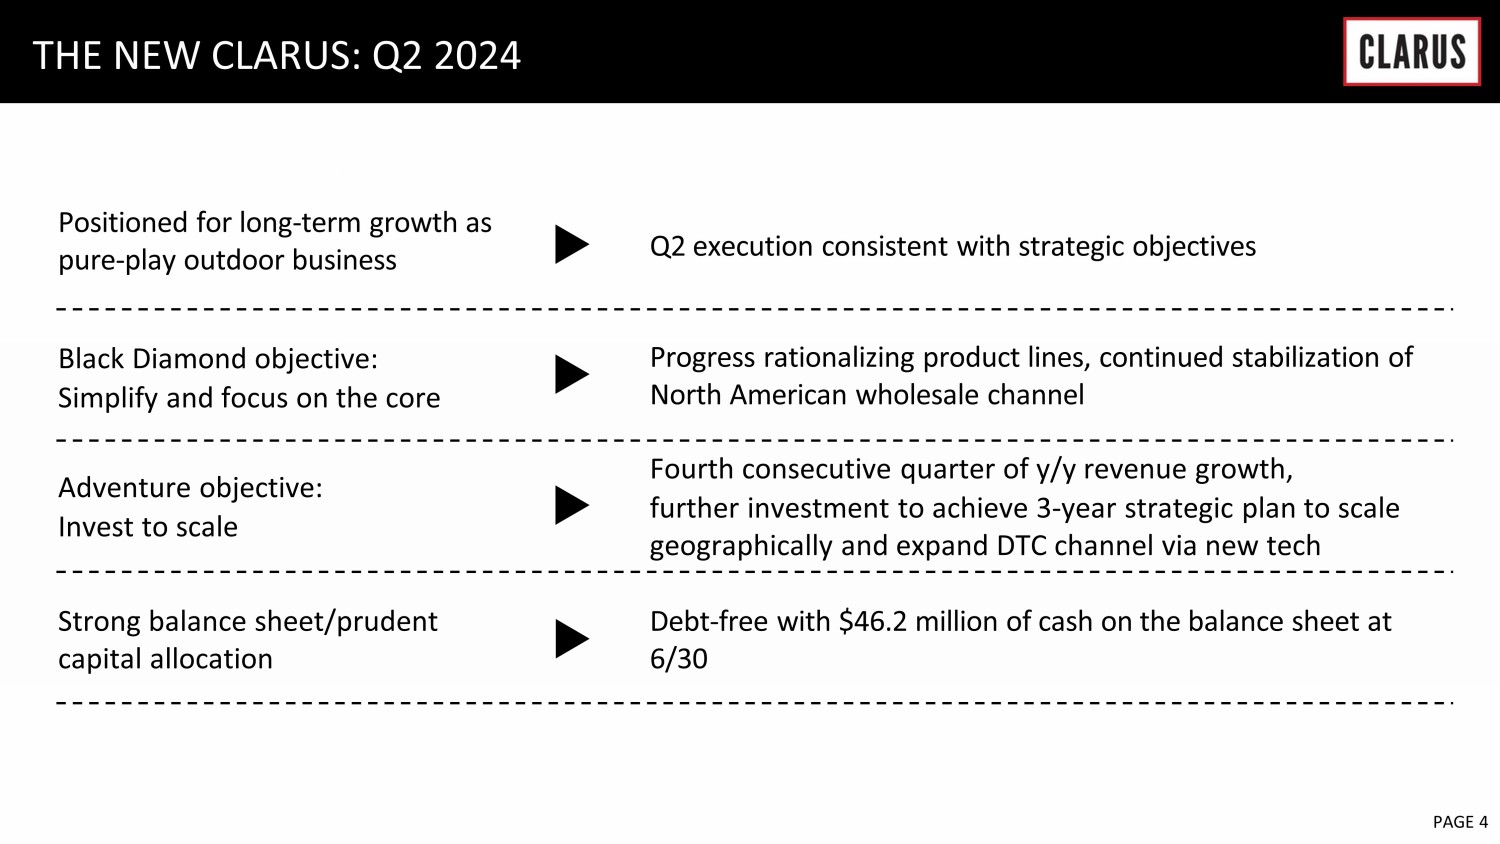
6 February 2023 PAGE 4 THE NEW CLARUS: Q2 2024 Positioned for long - term growth as pure - play outdoor business Q2 execution consistent with strategic objectives Black Diamond objective : Simplify and focus on the core Progress rationalizing product lines, continued stabilization of North American wholesale channel Adventure objective: Invest to scale Fourth consecutive quarter of y/y revenue growth, further investment to achieve 3 - year strategic plan to scale geographically and expand DTC channel via new tech Strong balance sheet/ p rudent capital allocation Debt - free with $46.2 million of cash on the balance sheet at 6/30
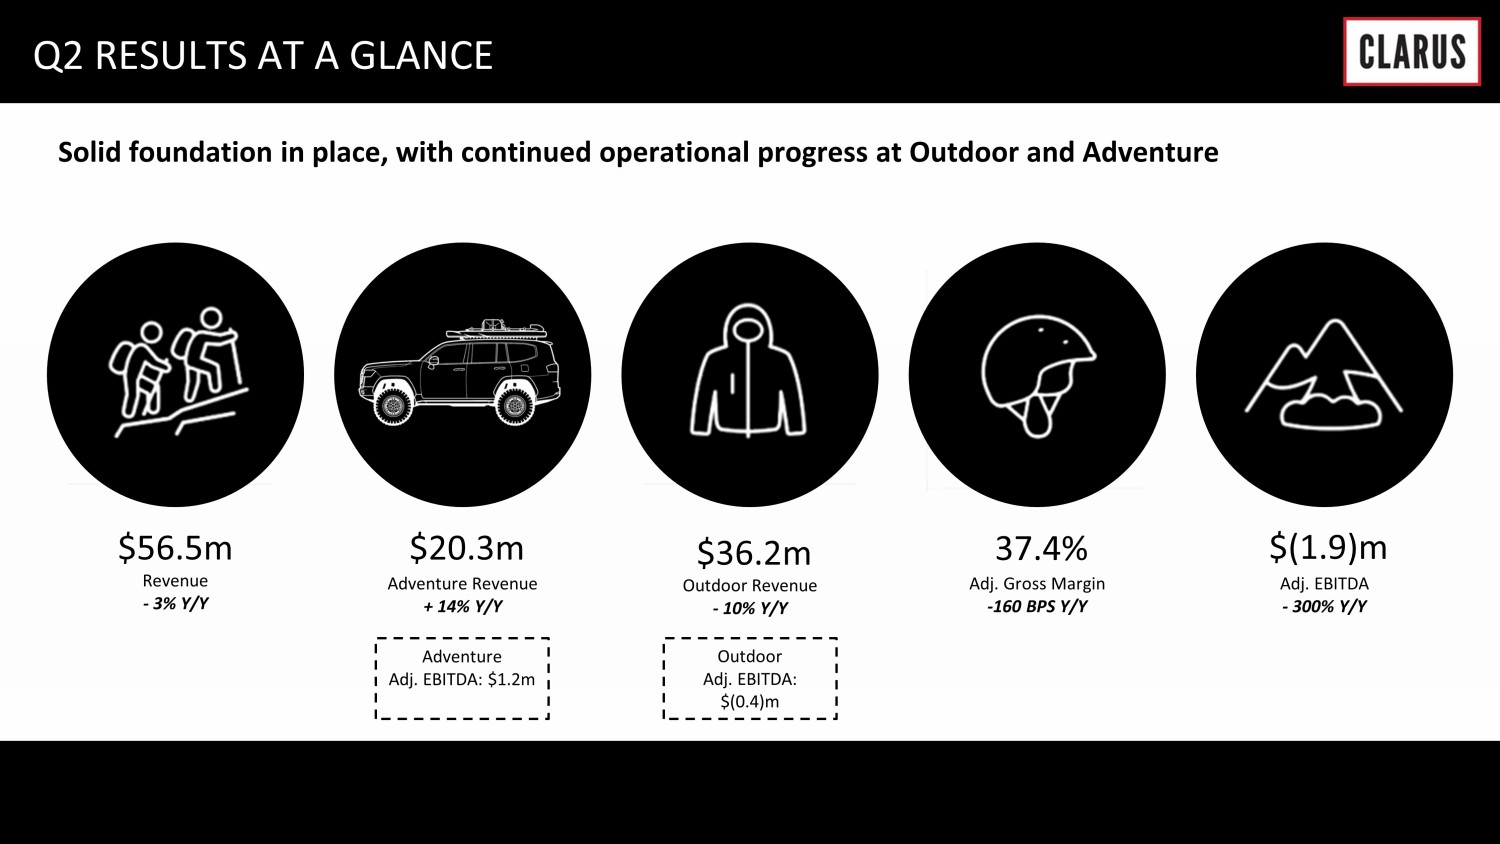
Solid foundation in place, with continued operational progress at Outdoor and Adventure $56 .5m $20.3 m $ 36.2m 37.4 % $( 1.9 ) m Revenue - 3% Y/Y Adventure Revenue + 14% Y/Y Outdoor Revenue - 10% Y/Y Adj. Gross Margin - 160 BPS Y/Y Adj. EBITDA - 300% Y/Y Q2 RESULTS AT A GLANCE Adventure Adj. EBITDA: $1.2m Outdoor Adj. EBITDA: $(0.4)m
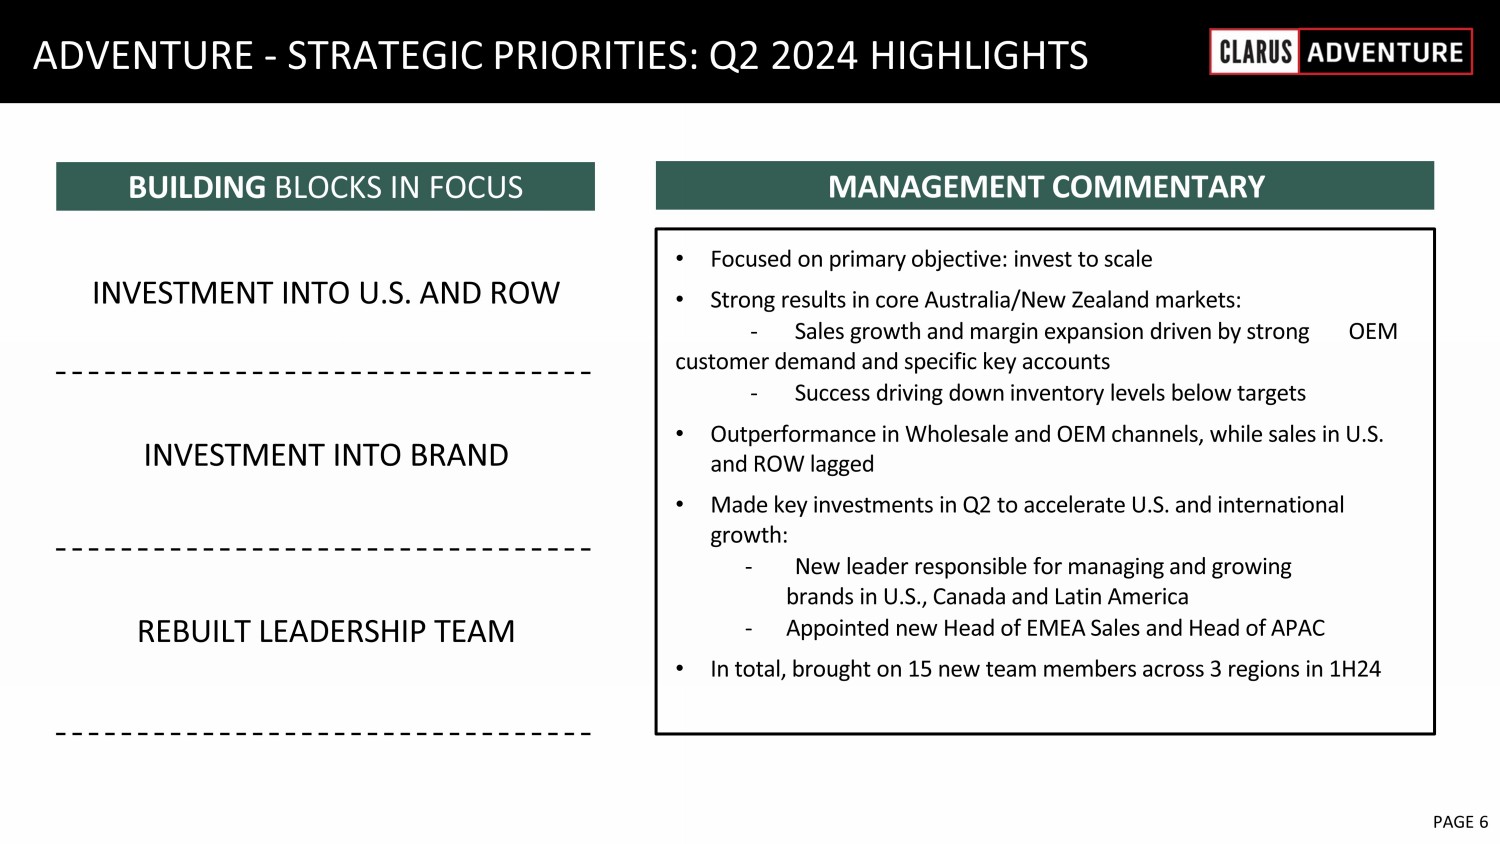
6 February 2023 PAGE 6 ADVENTURE - STRATEGIC PRIORITIES: Q2 2024 HIGHLIGHTS • Focused on primary objective: invest to scale • Strong results in core Australia/New Zealand markets: - Sales growth and margin expansion driven by strong OEM customer demand and specific key accounts - Success driving down inventory levels below targets • Outperformance in Wholesale and OEM channels, while sales in U.S. and ROW lagged • Made key investments in Q2 to accelerate U.S. and international growth: - New leader responsible for managing and growing brands in U.S., Canada and Latin America - Appointed new Head of EMEA Sales and Head of APAC • In total, brought on 15 new team members across 3 regions in 1H24 MANAGEMENT COMMENTARY BUILDING BLOCKS IN FOCUS INVESTMENT INTO U.S. AND ROW INVESTMENT INTO BRAND REBUILT LEADERSHIP TEAM
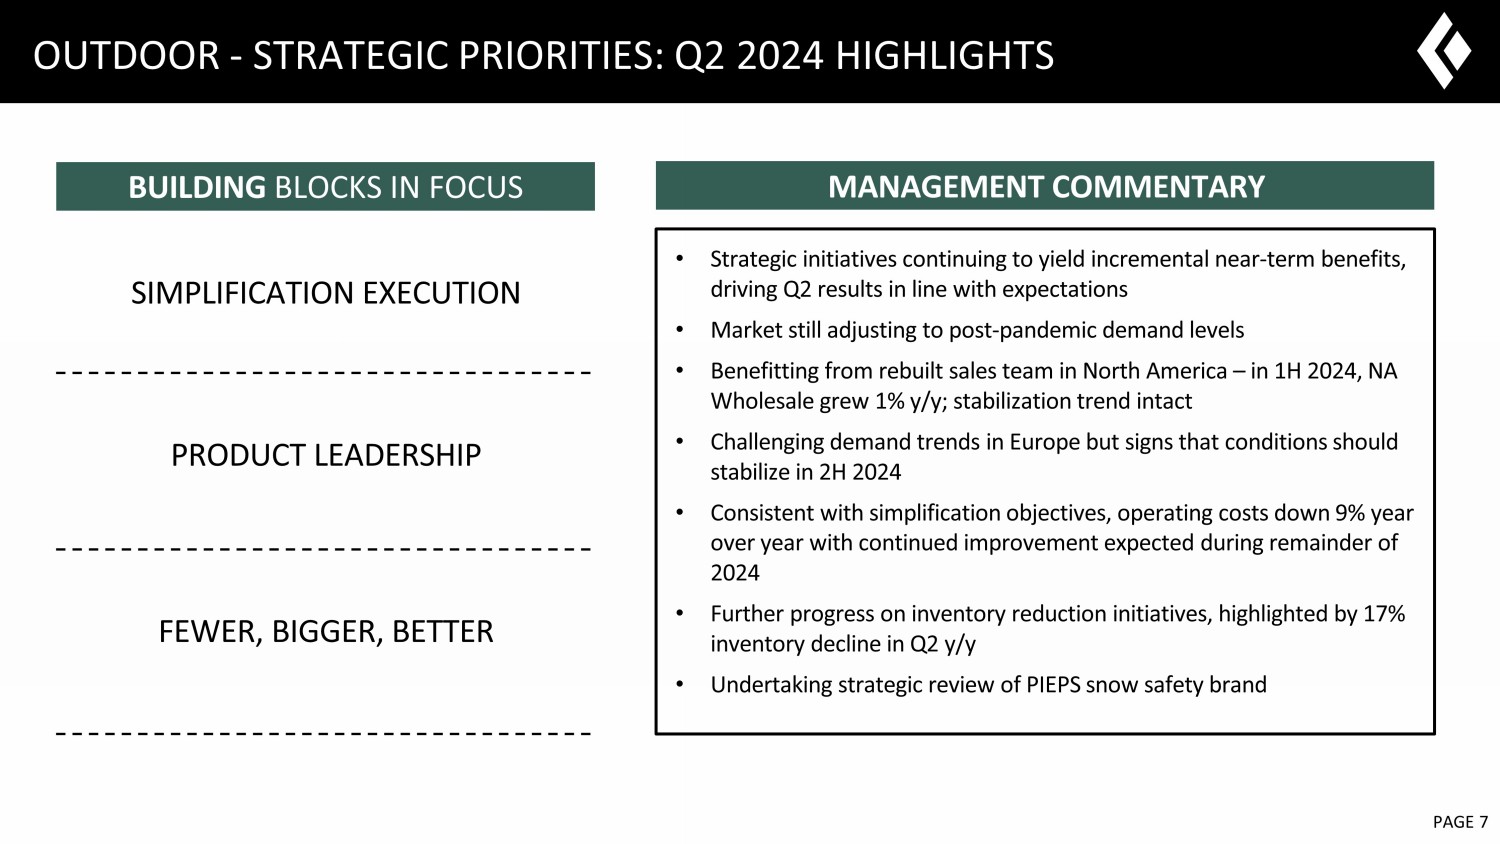
6 February 2023 PAGE 7 OUTDOOR - STRATEGIC PRIORITIES: Q2 2024 HIGHLIGHTS • Strategic initiatives continuing to yield incremental near - term benefits, driving Q2 results in line with expectations • Market still adjusting to post - pandemic demand levels • Benefitting from rebuilt sales team in North America – in 1H 2024, NA Wholesale grew 1% y/y; stabilization trend intact • Challenging demand trends in Europe but signs that conditions should stabilize in 2H 2024 • Consistent with simplification objectives, operating costs down 9% year over year with continued improvement expected during remainder of 2024 • Further progress on inventory reduction initiatives, highlighted by 17% inventory decline in Q2 y/y • Undertaking strategic review of PIEPS snow safety brand MANAGEMENT COMMENTARY BUILDING BLOCKS IN FOCUS SIMPLIFICATION EXECUTION PRODUCT LEADERSHIP FEWER, BIGGER, BETTER
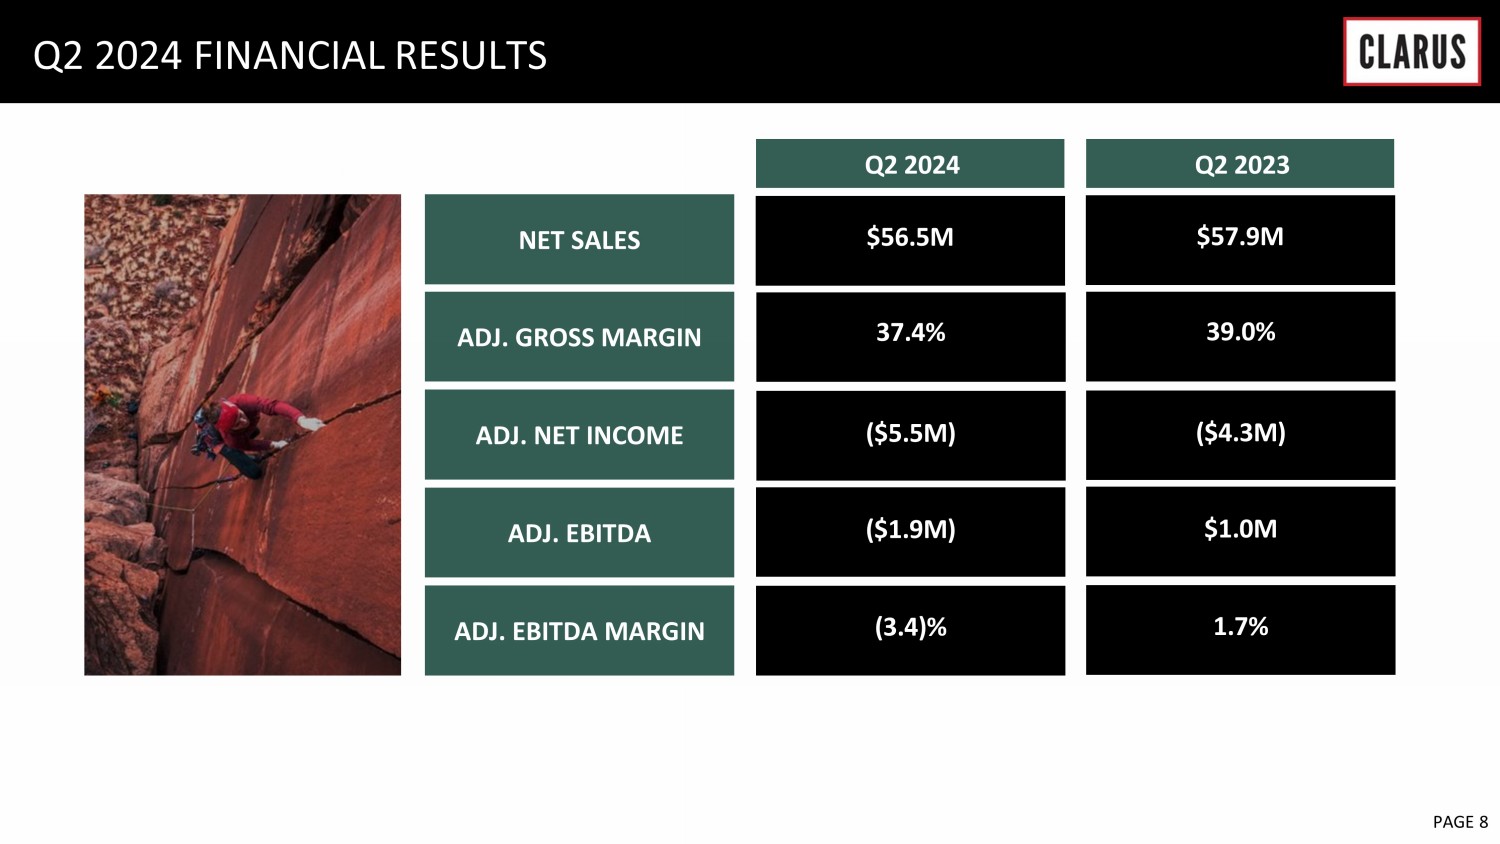
6 February 2023 PAGE 8 NET SALES Q2 2024 FINANCIAL RESULTS Q2 202 4 Q2 2023 ADJ. GROSS MARGIN ADJ. NET INCOME ADJ. EBITDA ADJ. EBITDA MARGIN (3.4)% ( $ 1.9 M) ($5.5M) 37.4 % $56.5M 1.7% $1.0M ($4.3M) 39.0% $ 57.9 M
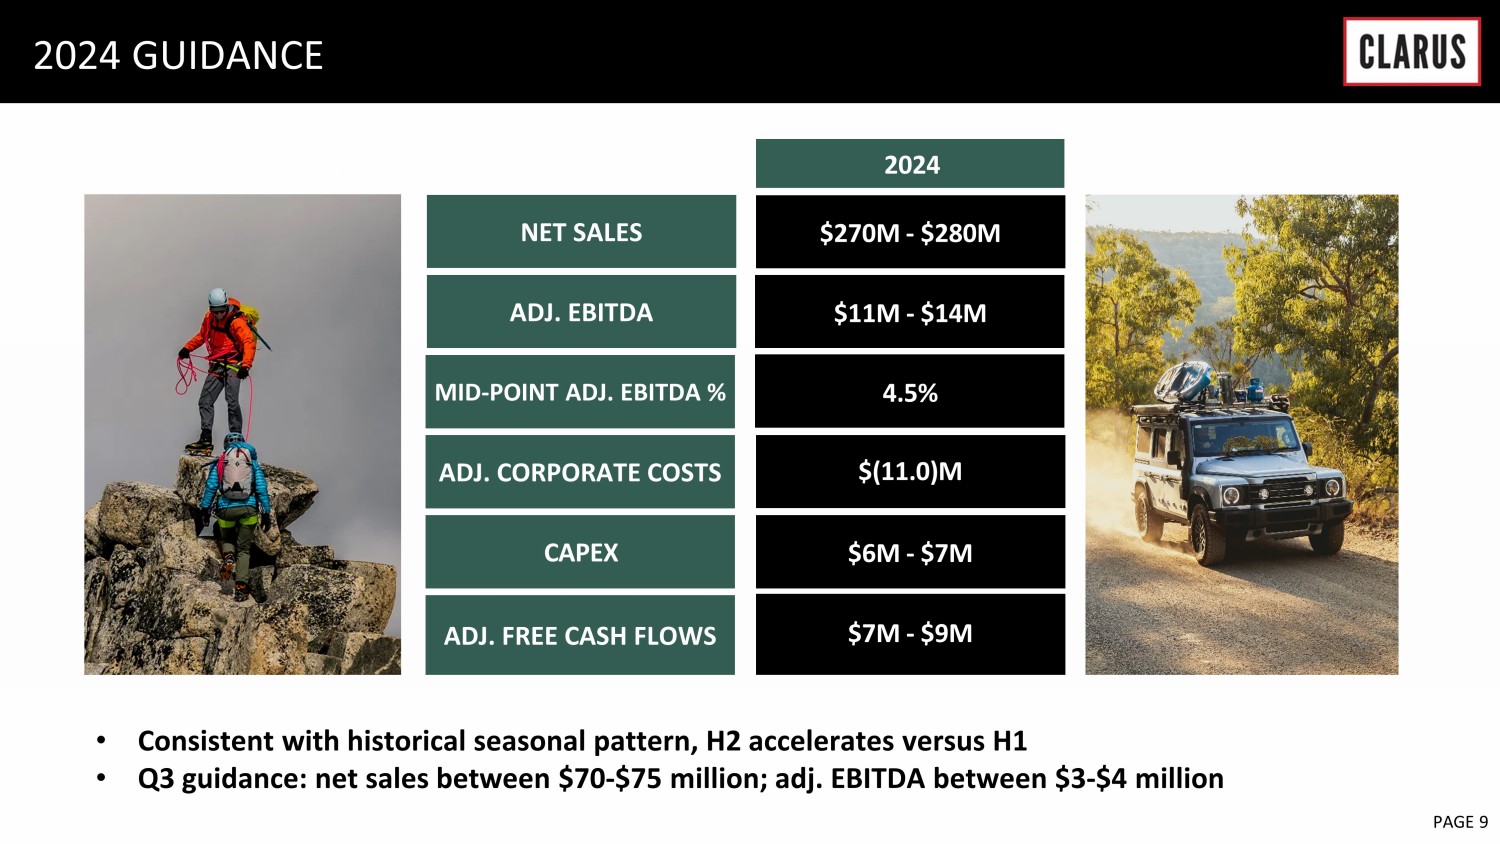
6 February 2023 PAGE 9 NET SALES 2024 GUIDANCE ADJ. CORPORATE COSTS ADJ. EBITDA MID - POINT ADJ. EBITDA % CAPEX ADJ. FREE CASH FLOWS $270M - $280M $6M - $7M $11M - $14M 4 .5% $(11.0)M $7M - $ 9 M 2024 • Consistent with historical seasonal pattern, H 2 accelerates versus H 1 • Q 3 guidance : net sales between $ 70 - $ 75 million ; adj . EBITDA between $ 3 - $ 4 million

APPENDIX
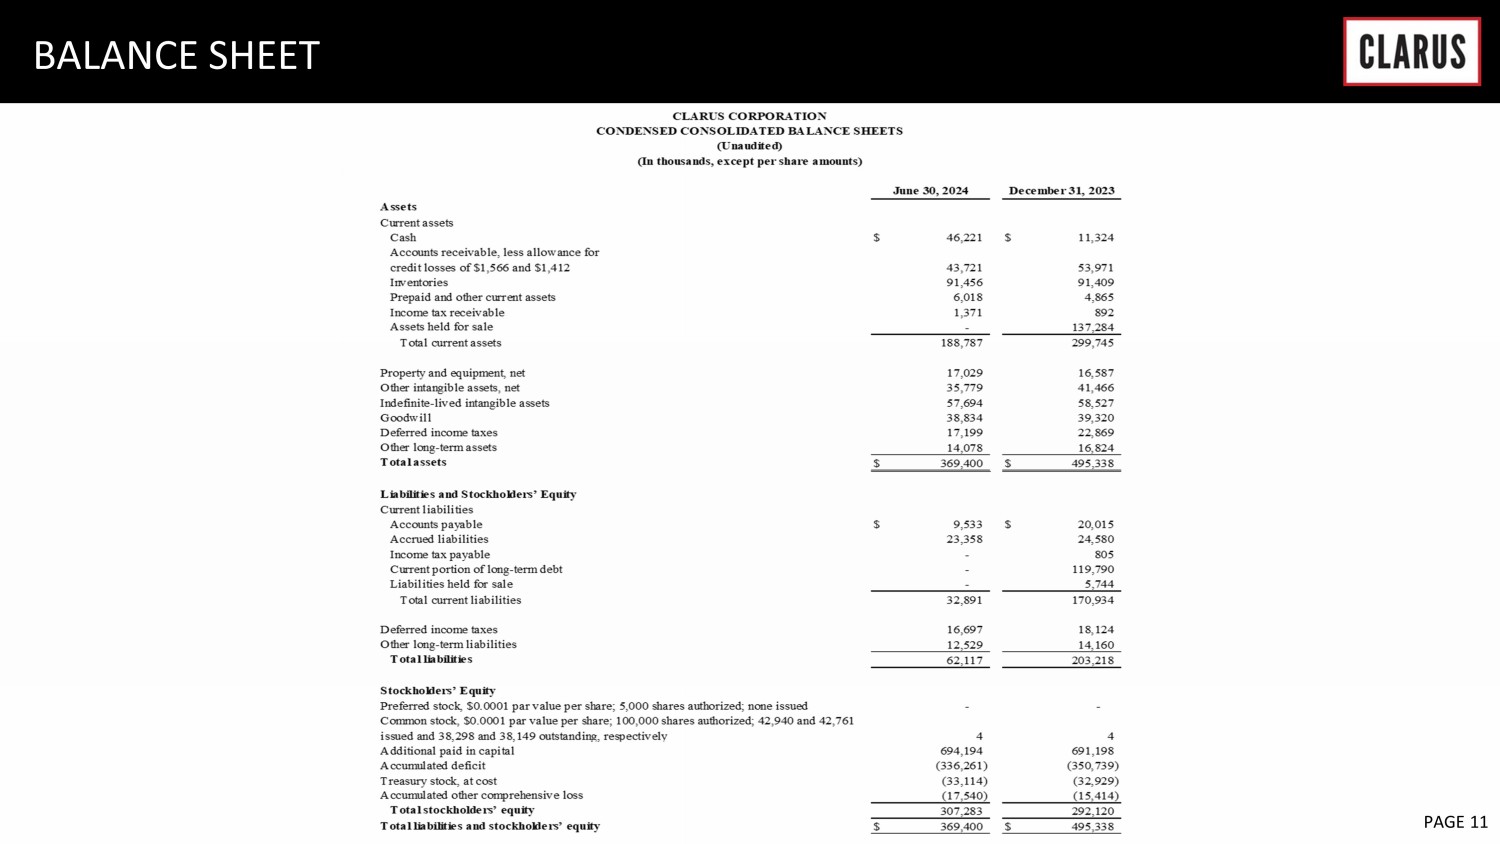
6 February 2023 PAGE 11 BALANCE SHEET
6 February 2023 PAGE 12 INCOME STATEMENT (Q2)
6 February 2023 PAGE 13 INCOME STATEMENT (YTD)
6 February 2023 PAGE 14 NON - GAAP RECONCILIATION
6 February 2023 PAGE 15 NON - GAAP RECONCILIATION (Q2)
6 February 2023 PAGE 16 NON - GAAP RECONCILIATION (YTD)

6 February 2023 PAGE 17 NON - GAAP RECONCILIATION (Q2)
6 February 2023 PAGE 18 NON - GAAP RECONCILIATION (YTD)

6 February 2023 PAGE 19 NON - GAAP RECONCILIATION (Q2) Outdoor Segment Adventure Segment Corporate Costs Total Operating loss (2,395)$ (1,267)$ (4,475)$ (8,137)$ Depreciation 661 384 - 1,045 Amortization of intangibles 285 2,166 - 2,451 EBITDA (1,449) 1,283 (4,475) (4,641) Restructuring charges 146 15 - 161 Transaction costs - - 27 27 Contingent consideration - (125) - (125) PFAS inventory reserve 716 - - 716 Legal costs and regulatory matter expenses 180 - 219 399 Stock-based compensation - - 1,528 1,528 Adjusted EBITDA (407)$ 1,173$ (2,701)$ (1,935)$ Sales 36,187$ 20,297$ -$ 56,484$ EBITDA Margin -4.0% 6.3% -8.2% Adjusted EBITDA Margin -1.1% 5.8% -3.4% CLARUS CORPORATION (In thousands) RECONCILIATION FROM OPERATING LOSS TO SEGMENT EBITDA AND ADJUSTED SEGMENT EBITDA Three Months Ended June 30, 2024
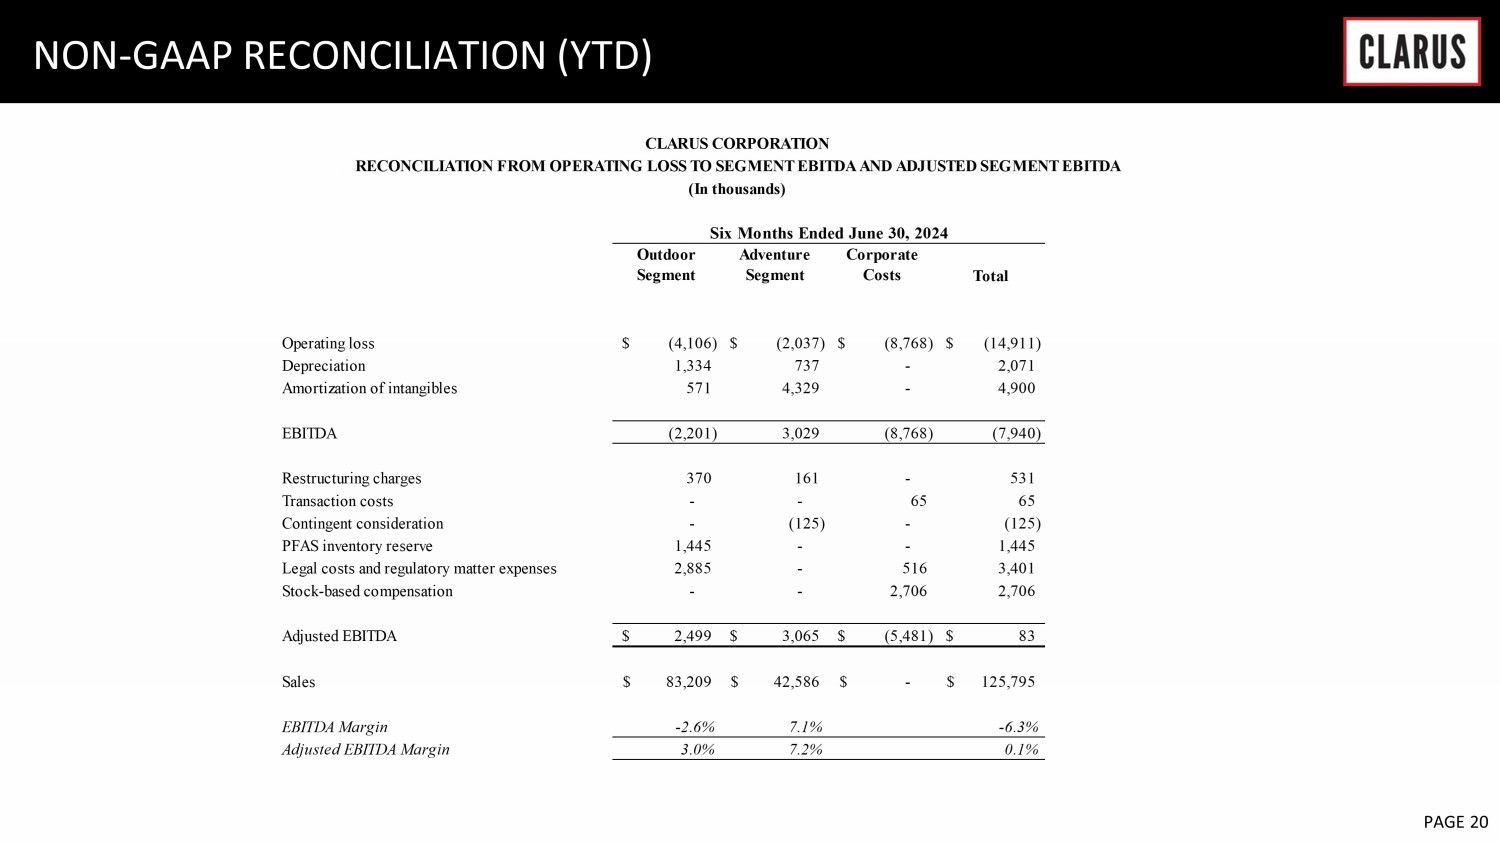
6 February 2023 PAGE 20 NON - GAAP RECONCILIATION (YTD) Outdoor Segment Adventure Segment Corporate Costs Total Operating loss (4,106)$ (2,037)$ (8,768)$ (14,911)$ Depreciation 1,334 737 - 2,071 Amortization of intangibles 571 4,329 - 4,900 EBITDA (2,201) 3,029 (8,768) (7,940) Restructuring charges 370 161 - 531 Transaction costs - - 65 65 Contingent consideration - (125) - (125) PFAS inventory reserve 1,445 - - 1,445 Legal costs and regulatory matter expenses 2,885 - 516 3,401 Stock-based compensation - - 2,706 2,706 Adjusted EBITDA 2,499$ 3,065$ (5,481)$ 83$ Sales 83,209$ 42,586$ -$ 125,795$ EBITDA Margin -2.6% 7.1% -6.3% Adjusted EBITDA Margin 3.0% 7.2% 0.1% CLARUS CORPORATION RECONCILIATION FROM OPERATING LOSS TO SEGMENT EBITDA AND ADJUSTED SEGMENT EBITDA (In thousands) Six Months Ended June 30, 2024
v3.24.2.u1
| X |
- DefinitionBoolean flag that is true when the XBRL content amends previously-filed or accepted submission.
| Name: |
dei_AmendmentFlag |
| Namespace Prefix: |
dei_ |
| Data Type: |
xbrli:booleanItemType |
| Balance Type: |
na |
| Period Type: |
duration |
|
| X |
- DefinitionFor the EDGAR submission types of Form 8-K: the date of the report, the date of the earliest event reported; for the EDGAR submission types of Form N-1A: the filing date; for all other submission types: the end of the reporting or transition period. The format of the date is YYYY-MM-DD.
| Name: |
dei_DocumentPeriodEndDate |
| Namespace Prefix: |
dei_ |
| Data Type: |
xbrli:dateItemType |
| Balance Type: |
na |
| Period Type: |
duration |
|
| X |
- DefinitionThe type of document being provided (such as 10-K, 10-Q, 485BPOS, etc). The document type is limited to the same value as the supporting SEC submission type, or the word 'Other'.
| Name: |
dei_DocumentType |
| Namespace Prefix: |
dei_ |
| Data Type: |
dei:submissionTypeItemType |
| Balance Type: |
na |
| Period Type: |
duration |
|
| X |
- DefinitionAddress Line 1 such as Attn, Building Name, Street Name
| Name: |
dei_EntityAddressAddressLine1 |
| Namespace Prefix: |
dei_ |
| Data Type: |
xbrli:normalizedStringItemType |
| Balance Type: |
na |
| Period Type: |
duration |
|
| X |
- Definition
+ References
+ Details
| Name: |
dei_EntityAddressCityOrTown |
| Namespace Prefix: |
dei_ |
| Data Type: |
xbrli:normalizedStringItemType |
| Balance Type: |
na |
| Period Type: |
duration |
|
| X |
- DefinitionCode for the postal or zip code
| Name: |
dei_EntityAddressPostalZipCode |
| Namespace Prefix: |
dei_ |
| Data Type: |
xbrli:normalizedStringItemType |
| Balance Type: |
na |
| Period Type: |
duration |
|
| X |
- DefinitionName of the state or province.
| Name: |
dei_EntityAddressStateOrProvince |
| Namespace Prefix: |
dei_ |
| Data Type: |
dei:stateOrProvinceItemType |
| Balance Type: |
na |
| Period Type: |
duration |
|
| X |
- DefinitionA unique 10-digit SEC-issued value to identify entities that have filed disclosures with the SEC. It is commonly abbreviated as CIK. Reference 1: http://www.xbrl.org/2003/role/presentationRef
-Publisher SEC
-Name Exchange Act
-Number 240
-Section 12
-Subsection b-2
| Name: |
dei_EntityCentralIndexKey |
| Namespace Prefix: |
dei_ |
| Data Type: |
dei:centralIndexKeyItemType |
| Balance Type: |
na |
| Period Type: |
duration |
|
| X |
- DefinitionIndicate if registrant meets the emerging growth company criteria. Reference 1: http://www.xbrl.org/2003/role/presentationRef
-Publisher SEC
-Name Exchange Act
-Number 240
-Section 12
-Subsection b-2
| Name: |
dei_EntityEmergingGrowthCompany |
| Namespace Prefix: |
dei_ |
| Data Type: |
xbrli:booleanItemType |
| Balance Type: |
na |
| Period Type: |
duration |
|
| X |
- DefinitionCommission file number. The field allows up to 17 characters. The prefix may contain 1-3 digits, the sequence number may contain 1-8 digits, the optional suffix may contain 1-4 characters, and the fields are separated with a hyphen.
| Name: |
dei_EntityFileNumber |
| Namespace Prefix: |
dei_ |
| Data Type: |
dei:fileNumberItemType |
| Balance Type: |
na |
| Period Type: |
duration |
|
| X |
- DefinitionTwo-character EDGAR code representing the state or country of incorporation.
| Name: |
dei_EntityIncorporationStateCountryCode |
| Namespace Prefix: |
dei_ |
| Data Type: |
dei:edgarStateCountryItemType |
| Balance Type: |
na |
| Period Type: |
duration |
|
| X |
- DefinitionThe exact name of the entity filing the report as specified in its charter, which is required by forms filed with the SEC. Reference 1: http://www.xbrl.org/2003/role/presentationRef
-Publisher SEC
-Name Exchange Act
-Number 240
-Section 12
-Subsection b-2
| Name: |
dei_EntityRegistrantName |
| Namespace Prefix: |
dei_ |
| Data Type: |
xbrli:normalizedStringItemType |
| Balance Type: |
na |
| Period Type: |
duration |
|
| X |
- DefinitionThe Tax Identification Number (TIN), also known as an Employer Identification Number (EIN), is a unique 9-digit value assigned by the IRS. Reference 1: http://www.xbrl.org/2003/role/presentationRef
-Publisher SEC
-Name Exchange Act
-Number 240
-Section 12
-Subsection b-2
| Name: |
dei_EntityTaxIdentificationNumber |
| Namespace Prefix: |
dei_ |
| Data Type: |
dei:employerIdItemType |
| Balance Type: |
na |
| Period Type: |
duration |
|
| X |
- DefinitionLocal phone number for entity.
| Name: |
dei_LocalPhoneNumber |
| Namespace Prefix: |
dei_ |
| Data Type: |
xbrli:normalizedStringItemType |
| Balance Type: |
na |
| Period Type: |
duration |
|
| X |
- DefinitionBoolean flag that is true when the Form 8-K filing is intended to satisfy the filing obligation of the registrant as pre-commencement communications pursuant to Rule 13e-4(c) under the Exchange Act. Reference 1: http://www.xbrl.org/2003/role/presentationRef
-Publisher SEC
-Name Exchange Act
-Number 240
-Section 13e
-Subsection 4c
| Name: |
dei_PreCommencementIssuerTenderOffer |
| Namespace Prefix: |
dei_ |
| Data Type: |
xbrli:booleanItemType |
| Balance Type: |
na |
| Period Type: |
duration |
|
| X |
- DefinitionBoolean flag that is true when the Form 8-K filing is intended to satisfy the filing obligation of the registrant as pre-commencement communications pursuant to Rule 14d-2(b) under the Exchange Act. Reference 1: http://www.xbrl.org/2003/role/presentationRef
-Publisher SEC
-Name Exchange Act
-Number 240
-Section 14d
-Subsection 2b
| Name: |
dei_PreCommencementTenderOffer |
| Namespace Prefix: |
dei_ |
| Data Type: |
xbrli:booleanItemType |
| Balance Type: |
na |
| Period Type: |
duration |
|
| X |
- DefinitionTitle of a 12(b) registered security. Reference 1: http://www.xbrl.org/2003/role/presentationRef
-Publisher SEC
-Name Exchange Act
-Number 240
-Section 12
-Subsection b
| Name: |
dei_Security12bTitle |
| Namespace Prefix: |
dei_ |
| Data Type: |
dei:securityTitleItemType |
| Balance Type: |
na |
| Period Type: |
duration |
|
| X |
- DefinitionName of the Exchange on which a security is registered. Reference 1: http://www.xbrl.org/2003/role/presentationRef
-Publisher SEC
-Name Exchange Act
-Number 240
-Section 12
-Subsection d1-1
| Name: |
dei_SecurityExchangeName |
| Namespace Prefix: |
dei_ |
| Data Type: |
dei:edgarExchangeCodeItemType |
| Balance Type: |
na |
| Period Type: |
duration |
|
| X |
- DefinitionBoolean flag that is true when the Form 8-K filing is intended to satisfy the filing obligation of the registrant as soliciting material pursuant to Rule 14a-12 under the Exchange Act. Reference 1: http://www.xbrl.org/2003/role/presentationRef
-Publisher SEC
-Name Exchange Act
-Section 14a
-Number 240
-Subsection 12
| Name: |
dei_SolicitingMaterial |
| Namespace Prefix: |
dei_ |
| Data Type: |
xbrli:booleanItemType |
| Balance Type: |
na |
| Period Type: |
duration |
|
| X |
- DefinitionTrading symbol of an instrument as listed on an exchange.
| Name: |
dei_TradingSymbol |
| Namespace Prefix: |
dei_ |
| Data Type: |
dei:tradingSymbolItemType |
| Balance Type: |
na |
| Period Type: |
duration |
|
| X |
- DefinitionBoolean flag that is true when the Form 8-K filing is intended to satisfy the filing obligation of the registrant as written communications pursuant to Rule 425 under the Securities Act. Reference 1: http://www.xbrl.org/2003/role/presentationRef
-Publisher SEC
-Name Securities Act
-Number 230
-Section 425
| Name: |
dei_WrittenCommunications |
| Namespace Prefix: |
dei_ |
| Data Type: |
xbrli:booleanItemType |
| Balance Type: |
na |
| Period Type: |
duration |
|
Clarus (NASDAQ:CLAR)
過去 株価チャート
から 7 2024 まで 8 2024

Clarus (NASDAQ:CLAR)
過去 株価チャート
から 8 2023 まで 8 2024
