UNITED STATES
SECURITIES AND EXCHANGE COMMISSION
Washington, DC 20549
FORM 6-K
REPORT OF FOREIGN PRIVATE ISSUER
PURSUANT TO RULE 13a-16 OR 15d-16
UNDER THE SECURITIES EXCHANGE ACT OF 1934
For the month of October, 2023.
Commission File Number 001-38755
Suzano S.A.
(Exact name of registrant as specified in its charter)
SUZANO INC.
(Translation of Registrant’s Name into English)
Av. Professor Magalhaes Neto, 1,752
10th Floor, Rooms 1010 and 1011
Salvador, Brazil 41 810-012
(Address of principal executive office)
Indicate by check mark whether the registrant files or will file annual
reports under cover of Form 20-F or Form 40-F.
Form 20-F
x Form 40-F o
Indicate
by check mark if the registrant is submitting the Form 6-K in paper as permitted by Regulation S-T Rule 101(b)(1): o
Indicate
by check mark if the registrant is submitting the Form 6-K in paper as permitted by Regulation S-T Rule 101(b)(7): o
Enclosures:
Exhibit 99.1 – Earnings Release for Third Quarter 2023.
SIGNATURE
Pursuant to the requirements of the Securities Exchange Act of 1934,
the registrant has duly caused this report to be signed on its behalf by the undersigned, thereunto duly authorized.
Date: October 26, 2023
| |
|
SUZANO S.A. |
| |
|
|
| |
By: |
/s/ Marcelo Feriozzi Bacci |
| |
Name: |
Marcelo Feriozzi Bacci |
| |
Title: |
Chief Financial and Investor Relations Officer |
Exhibit 99.1

EBITDA of R$3.7
billion
With
a new drop, cash cost reaches a lower level than in 3Q22
São
Paulo, October 26, 2023. Suzano S.A. (B3:SUZB5 | NYSE: SUZ), one of the world’s largest integrated pulp and paper producers,
announces today its consolidated results for the third quarter of 2023 (3Q23).
HIGHLIGHTS
| · | Pulp
sales of 2,486 thousand tons (-11% vs. 3Q22). |
| · | Paper
sales1 of 331 thousand tons (stable vs. 3Q22). |
| · | Adjusted
EBITDA2 and Operating cash generation3: R$3.7 billion and R$1.9 billion,
respectively. |
| · | Adjusted
EBITDA2/ton from pulp of R$1,172/ton (-57% vs. 3Q22). |
| · | Adjusted
EBITDA2/ton from paper of R$2,366/ton (-16% vs. 3Q22). |
| · | Average
net pulp price in export market: US$547/ton (-33% vs. 3Q22). |
| · | Average
net paper price1 of R$7,085/ton (+3% vs. 3Q22). |
| · | Pulp
cash cost ex-downtime of R$861/ton (-2% vs. 3Q22). |
| · | Leverage
of 2.7 times in USD and 2.6 times in BRL. |
| · | Cerrado
Project completes 78% of physical progress and 68% of financial progress. |
| Financial
Data (R$ million) | |
3Q23 | | |
2Q23 | | |
ΔQ-o-Q | | |
3Q22 | | |
ΔY-o-Y | | |
LTM
3Q23 | |
| Net Revenue | |
| 8,948 | | |
| 9,160 | | |
| -2 | % | |
| 14,199 | | |
| -37 | % | |
| 43,754 | |
| Adjusted
EBITDA2 | |
| 3,695 | | |
| 3,919 | | |
| -6 | % | |
| 8,596 | | |
| -57 | % | |
| 21,944 | |
| Adjusted
EBITDA Margin2 | |
| 41 | % | |
| 43 | % | |
| -2
p.p. | | |
| 61 | % | |
| -20
p.p. | | |
| 50 | % |
| Net Financial Result | |
| (3,494 | ) | |
| 4,536 | | |
| - | | |
| (1,527 | ) | |
| - | | |
| 5,511 | |
| Net Income | |
| (729 | ) | |
| 5,078 | | |
| - | | |
| 5,448 | | |
| - | | |
| 17,051 | |
| Operating
Cash Generation3 | |
| 1,904 | | |
| 2,203 | | |
| -14 | % | |
| 7,155 | | |
| -73 | % | |
| 15,259 | |
| Net
Debt/ Adjusted EBITDA2 (x) (R$) | |
| 2.6 | x | |
| 2.0 | x | |
| 0.6 | x | |
| 2.2 | x | |
| 0.4 | x | |
| 2.6 | x |
| Net
Debt/ Adjusted EBITDA2 (x) (US$) | |
| 2.7 | x | |
| 2.2 | x | |
| 0.5 | x | |
| 2.1 | x | |
| 0.6 | x | |
| 2.7 | x |
| Operational Data ('000 tons) | |
3Q23 | | |
2Q23 | | |
ΔQ-o-Q | | |
3Q22 | | |
ΔY-o-Y | | |
LTM
3Q23 | |
| Sales | |
| 2,817 | | |
| 2,807 | | |
| 0 | % | |
| 3,128 | | |
| -10 | % | |
| 11,457 | |
| Pulp | |
| 2,486 | | |
| 2,513 | | |
| -1 | % | |
| 2,797 | | |
| -11 | % | |
| 10,213 | |
| Paper1 | |
| 331 | | |
| 294 | | |
| 12 | % | |
| 331 | | |
| 0 | % | |
| 1,243 | |
1Considers
the results of the Consumer Goods Unit (tissue). | 2Excluding non-recurring items. | 3Considers Adjusted EBITDA
less sustaining capex (cash basis).


The
consolidated quarterly financial information was prepared in accordance with the standards set by the Securities and Exchange Commission
of Brazil (CVM) and the Accounting Pronouncements Committee (CPC) and complies with the International Financial Reporting Standards (IFRS)
issued by the International Accounting Standards Board (IASB). The operating and financial information is presented on a consolidated
basis and in Brazilian real (R$). Note that figures may present discrepancies due to rounding.
CONTENTS
| | |
|
| EXECUTIVE SUMMARY | |
3 |
| | |
|
| PULP BUSINESS PERFORMANCE | |
4 |
| PULP SALES VOLUME AND REVENUE | |
4 |
| PULP CASH COST | |
6 |
| PULP SEGMENT EBITDA | |
8 |
| OPERATING CASH FLOW FROM THE PULP SEGMENT | |
10 |
| | |
|
| PAPER BUSINESS PERFORMANCE | |
11 |
| PAPER SALES VOLUME AND REVENUE | |
11 |
| PAPER SEGMENT EBITDA | |
14 |
| OPERATING CASH FLOW FROM THE PAPER SEGMENT | |
15 |
| | |
|
| FINANCIAL PERFORMANCE | |
16 |
| NET REVENUE | |
16 |
| CALENDAR OF SCHEDULED MAINTENANCE DOWNTIMES | |
17 |
| COST OF GOODS SOLD (COGS) | |
17 |
| SELLING EXPENSES | |
18 |
| GENERAL AND ADMINISTRATIVE EXPENSES | |
19 |
| ADJUSTED EBITDA | |
19 |
| FINANCIAL RESULT | |
20 |
| DERIVATIVE OPERATIONS | |
22 |
| NET INCOME (LOSS) | |
27 |
| DEBT | |
27 |
| CAPEX | |
31 |
| CERRADO PROJECT | |
32 |
| OPERATING CASH GENERATION | |
32 |
| FREE CASH FLOW | |
33 |
| EVOLUTION OF NET DEBT | |
34 |
| ESG | |
34 |
| TOTAL OPERATIONAL EXPENDITURE - PULP | |
34 |
| | |
|
| CAPITAL MARKETS | |
34 |
| | |
|
| FIXED INCOME | |
36 |
| | |
|
| RATINGS | |
37 |
| | |
|
| UPCOMING EVENTS | |
37 |
| | |
|
| APPENDICES | |
38 |
| APPENDIX 1 – Operating Data | |
38 |
| APPENDIX 2 – Consolidated Statement of Income and Goodwill Amortization | |
40 |
| APPENDIX 3 – Consolidated Balance Sheet | |
41 |
| APPENDIX 4 – Consolidated Statement of Cash Flow | |
43 |
| APPENDIX 5 – EBITDA | |
44 |
| APPENDIX 6 – Segmented Income Statement | |
45 |
| Forward-Looking Statements | |
46 |
EXECUTIVE
SUMMARY
Despite
the drop in average net pulp price, the third quarter of 2023 was marked by improved market sentiment, mainly due to the significant
growth in demand in China. The evolution of fundamentals sustained a sequence of price increases which, however, are not yet fully reflected
in the 3Q23 results. In this context, lower prices combined with practically stable volumes led to the reduction in adjusted EBITDA in
this segment. Cash cost of production excluding scheduled maintenance downtime decreased once again, mainly due to lower consumption
and lower input prices. The paper business unit posted resilient results in the domestic market; however, the decline in export market
prices was the main reason for the decline in EBITDA per ton during the period. Consolidated adjusted EBITDA in the quarter came to R$3.7
billion, while operating cash flow reached R$1.9 billion.
As
for financial management, net debt in USD increased slightly to US$11.5 billion, mainly due to the largest investment cycle in the company’s
history aimed at generating significant and sustainable value in the long term. Leverage in USD stood at 2.7 times, mainly due to the
decrease in Adjusted EBITDA in the last 12 months. The foreign exchange hedging policy continued to play its part, bringing in a positive
cash inflow of R$0.7 billion.
Continuing
the advances made in its strategy, within the context of the “Being an important player in pulp through solid projects” and
“Be best in class in the total pulp cost vision” avenues, the physical progress of Cerrado Project remains as expected, reaching
78%, while financial progress was 68%. The company expects the project to go operational by June 2024, as announced earlier.
As
part of its ambition to the “Be best in class in the total pulp cost vision”, the Company announced the construction of a
new biomass boiler at its pulp mill in Aracruz to replace the current boiler, at an estimated investment of R$520 million. The new biomass
boiler should go operational in foruth quarter of 2025.
Also,
in line with the strategic avenue “Maintain relevance in pulp through good projects”, Suzano announced investments of R$490
million to produce fluff pulp from eucalyptus wood (Eucafluff®), with nominal production capacity of 340 tons a year. The investment
represents the conversion of a pulp drying machine at the Limeira unit, which will give the company full flexibility in producing pulp
for paper or fluff after the investment is concluded in 4Q25.
Finally,
in line with its strategic avenue of “Advance in the links of the chain”, complementing the Notice to the Market disclosed
on 06/30/2022, the Company announced the construction of a mill in the municipality of Aracruz, Espírito Santo, for the production
of tissue paper and for conversion into toilet paper and paper towel. The mill, with annual production capacity of 60 thousand tons,
received total investments estimated at R$650 million and is slated to go operational in 1Q26. Suzano plans to use the balance of ICMS
credits it has in the state in the investments, which should reduce the estimated net disbursement to R$130 million.
PULP
BUSINESS PERFORMANCE
PULP
SALES VOLUME AND REVENUE
In
3Q23, the sentiment in the hardwood pulp market improved gradually, especially in China, due to the growth in demand for paper, the purchase
of pulp by integrated producers and restocking by buyers.
During
the period, China also witnessed a brisk pace of production of sanitary paper, driven by solid domestic demand, such as increased “away
from home” consumption, growth of online sales channels, higher exports and supply of pulp required for the start-up of new paper
machines. The paperboard segment also registered a brisk pace of production in the quarter, despite the increase in capacities throughout
the year. Production of printing & writing paper, especially uncoated paper, grew on the back of stronger demand resulting from
the rebound in economic activity. Added to this, prices increased in almost all lines of paper products during the quarter, further underlining
the positive signals from the Chinese market.
In
August, Europe witnessed an uptick in orders for printing & writing and special papers, and the signs of destocking coming to
an end across the chain, which gradually helped reverse the scenario across the region. Nevertheless, due to high inventory levels at
the start of the quarter and the challenging macroeconomic situation in the region, local prices declined sharply early in the quarter
but changed course since September. Production of sanitary paper remained at healthy levels in both Europe and the U.S. markets during
the quarter.
Since
market prices remained below costs for high-cost hardwood pulp producers, unscheduled downtimes continued. Average PIX/FOEX prices of
hardwood pulp in the quarter increased 3% in China but decreased 24% in Europe compared to 2Q23. The price difference between softwood
and hardwood fibers was USD133/t in China and USD339/t in Europe (a record), which fueled the migration of consumption between the fibers.
Suzano's
pulp sales remained practically stable in relation to the previous quarter due to restricted production volumes, as disclosed
in the Material Fact notice of June 2, 2023, and to low inventory levels, which totaled 2,486 thousand tons, down 1% from 2Q23 and
11% from 3Q22.
Average
net price in USD of pulp sold by Suzano was US$544/t, decreasing 5% from 2Q23 and 33% from 3Q22. In the export market, average net
price charged by the Company was US$547/t, down 3% and 33%, respectively, in the same comparison basis. Average net price in BRL
was R$2,657/ton in 3Q23, down 6% from 2Q23, due to price scenario in China and Europe, and the decline in average USD against average
BRL (-1%). Compared to 3Q22, the 38% decrease was mainly due to lower net average price in USD during the period.
Net
revenue from pulp decreased 7% from 2Q23, due to the lower net average price in USD (-5%), the decline in average USD against average
BRL (-1%) and lower sales volume in the period (-1%). Compared to 3Q22, revenue decreased 45% due to lower net average price in USD (-33%),
lower sales volume (-11%) and the decline in average USD against average BRL (-7%).

PULP
CASH COST
Cash
cost excluding downtime in 3Q23 stood at R$861/t, decreasing 6% from 2Q23, due to: i) the lower consumption of inputs (especially
natural gas and chlorine dioxide) as a result of greater operational efficiency of mills and the start of benefits reaped from the higher
energy efficiency project at the Jacareí mill; ii) lower chemical prices (especially of caustic soda caused by lower international
prices - HIS); iii) lower fixed costs, mainly due to lesser maintenance expenses resulting from fewer scheduled downtimes during the
period; and iv) the weakening of average USD versus average BRL (-1%).
Wood
costs remained practically stable. The bigger average supply radius, supply mix effect and price increases by suppliers were almost fully
offset by lower specific consumption and better operational performance in the harvesting and transportation activities.
1Excludes
the impact of maintenance and administrative downtimes.
Cash
cost excluding downtime in 3Q23 was 2% lower than in 3Q22, due to: i) lower prices of inputs, especially energy (lower natural gas
prices due to the decline in Brent prices) and lower chemical prices (especially of caustic soda due to lower international prices (IHS));
ii) the lower consumption of inputs (especially natural gas and chlorine dioxide) as a result of greater operational efficiency of mills
and the start of benefits reaped from the higher energy efficiency project at the Jacareí mill; and iii) the decline in average
USD versus BRL (-7%).
The
positive effects on cash cost were partially offset by: i) higher fixed costs resulting from lower dilution on account of higher labor
costs, higher expenditure on maintenance (related to more frequent scheduled downtimes at Três Lagoas and Mucuri) and lower production
volume; ii) higher wood costs resulting from adjustments in labor and third-party agreements, which affected both harvest and logistics,
higher average supply radius and the supply mix effect, all of which were partially offset by lower costs with diesel during the period;
and iii) lower revenue from utilities due to lower export volume, in turn, caused by lower production volume.

1Excludes
the impact of maintenance and administrative downtimes.
1Based
on cash cost excluding downtimes. Excludes energy sales.
PULP
SEGMENT EBITDA
| Pulp Segment | |
3Q23 | | |
2Q23 | | |
ΔQ-o-Q | | |
3Q22 | | |
ΔY-o-Y | | |
| LTM
3Q23 | |
| Adjusted EBITDA (R$ million)1 | |
| 2,912 | | |
| 3,190 | | |
| -9 | % | |
| 7,665 | | |
| -62 | % | |
| 18,712 | |
| Sales volume (k ton) | |
| 2,486 | | |
| 2,513 | | |
| -1 | % | |
| 2,797 | | |
| -11 | % | |
| 10,213 | |
| Pulp adjusted1 EBITDA (R$/ton) | |
| 1,172 | | |
| 1,269 | | |
| -8 | % | |
| 2,741 | | |
| -57 | % | |
| 1,832 | |
1Excludes
non-recurring items.
Adjusted
EBITDA from pulp decreased 9% from 2Q23 due to: i) the lower net pulp price in USD (-5%); ii) the decline in average USD against
average BRL (-1%); and iii) lower sales volume in the period (-1%). These factors were partially offset by lower COGS cash basis
(-6%), mainly due to lower cash cost of production excluding downtimes, as explained earlier. The 8% decline in adjusted EBITDA per
ton is explained by the same factors, except the volume effect.
Compared
to 3Q22, the 62% decrease in Adjusted EBITDA from pulp reflects: i) the lower net pulp price in USD (-33%); ii) lower sales volume
(-11%); and iii) the decline in average USD against average BRL (-7%). These factors were marginally offset by lower cash cost of production.
Adjusted EBITDA per ton fell 57% due to the same factors, ex-volumes.
1Excludes
non-recurring items.

OPERATING
CASH FLOW FROM THE PULP SEGMENT
Pulp
Segment
(R$ million) | |
3Q23 | | |
2Q23 | | |
Δ
Q-o-Q | | |
3Q22 | | |
Δ
Y-o-Y | | |
LTM
3Q23 | |
| Adjusted
EBITDA1 | |
| 2,912 | | |
| 3,190 | | |
| -9 | % | |
| 7,665 | | |
| -62 | % | |
| 18,712 | |
| Maintenance
Capex2 | |
| (1,612 | ) | |
| (1,547 | ) | |
| 4 | % | |
| (1,314 | ) | |
| 23 | % | |
| (6,051 | ) |
| Operating
Cash Flow | |
| 1,301 | | |
| 1,642 | | |
| -21 | % | |
| 6,351 | | |
| -80 | % | |
| 12,661 | |
1Excludes
non-recurring items.
2Cash
basis.
Operating
cash flow per ton in the pulp segment was 20% lower than in 2Q23 and 77% lower than in 3Q22, due to lower EBITDA per ton and higher
sustaining capex per ton.
PAPER
BUSINESS PERFORMANCE
The
following data and analyses incorporate the joint results of the consumer goods and paper businesses (tissue).
PAPER
SALES VOLUME AND REVENUE
According
to data published by Brazil's Forestry Industry Association (IBÁ), demand for printing & writing paper in Brazil, including
imports, decreased 14% in the first two months of 3Q23 compared to the same period last year. Considering the first eight months of the
year, domestic demand for printing & writing paper decreased 11% from the same period in 2022.
The
impact of the drop in domestic demand remains concentrated in coated paper destined for the promotional segment, which is still affected
by the decline in inventories and continued changes in consumption patterns driven by digitalization. As for uncoated paper lines, which
account for the bulk of Suzano's sales volume, demand has been more resilient, only decreasing slightly year on year as a result of seasonal
and inventory adjustments.
Across
the international markets, demand for printing & writing paper was affected by inventory adjustments across the chain and by
macroeconomic uncertainties, which restrict economic activity. In this context, the coated paper segment is the worst affected, especially
in the U.S. and Western European markets, where digitalization is in a more advanced stage. In Latin America (excluding Brazil), demand
continues to perform better than in mature markets, especially in the uncoated paper, as well as school and office stationery (cut size
paper) segments.
Demand
for paperboard in Brazil, Suzano’s flagship market for this product line, declined 4% in the first two months of 3Q23 compared
to the same period last year, reflecting inventory adjustments across the chain, while demand for packaging remained stable during the
period.
Consolidating
the market segments mentioned above (paper market accessible to Suzano), domestic sales fell 11% in the first two months of 3Q23 compared
to 3Q22. Despite a more challenging scenario, Suzano has been ramping up initiatives aimed at delivering solid results: through a unique
go-to-market model and by advancing on its strategy of acquiring new customers. At the end of 3Q23, the Company achieved a record 45,000
active clients in the last 12 months. Furthermore, we continue to push ahead with our digital transformation initiatives and invest in
our portfolio of innovative products intended for the packaging and substitute for single-use plastic segments
With
the acquisition of Kimberly Clark's tissue business in Brazil, the consumer goods segment will account for a bigger share of the paper
business results starting from 3Q23.
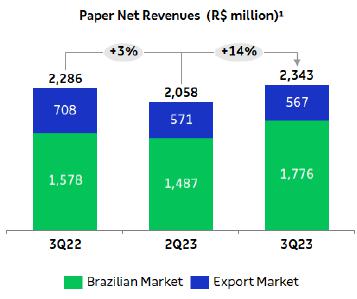
Suzano’s
paper sales (printing & writing, paperboard and tissue) in the domestic market totaled 235 thousand tons in 3Q23, up
12% from the previous quarter, due to new volumes as a result of the acquisition of Kimberly Clark’s tissue business in Brazil
and to the increase in paperboard sales, partially offset by the drop in priting & writing paper sales volume. Compared to 3Q22,
the 3% decrease follows the market decline associated with a restocking strategy, despite higher sales in the consumer goods business.
Export
paper sales totaled 96 thousand tons, up 14% and 9%, respectively, from 2Q23 and 3Q22, accounting for 29% of total sales volume
in 3Q23. The greater volume of exports in comparison with both periods is due to the commercial strategy of allocating volumes between
external and internal markets.

1Includes
the Consumer Goods Unit.
Average
net price increased 1% from the previous quarter, due to the allocation strategy among markets and segments, despite less favorable
market conditions, in addition to the effect of the acquisition of Kimberly Clark’s tissue business in Brazil. Compared to 3Q22,
the 3% increase was due to paperboard and tissue price increases in the period, which was influenced by the effect of the acquisition
of tissue business mentioned earlier.
Net
revenue from paper sales amounted to R$2,343 million, up 14% from 2Q23, mainly reflecting the higher volume (+12%) and higher net
average price in the domestic market (+7%), partially offset by the 13% decrease in net sales price in the export market. Compared to
3Q22, the increase of 3% was due to price increases in the domestic market (+17%), partially offset by lower revenue in the export market
(-27%).
1Includes
the Consumer Goods Unit.
PAPER
SEGMENT EBITDA
| Paper Segment | |
3Q23 | | |
2Q23 | | |
Δ Q-o-Q | | |
3Q22 | | |
Δ Y-o-Y | | |
LTM 3Q23 | |
| Adjusted EBITDA (R$ million) 1 | |
| 783 | | |
| 729 | | |
| 7 | % | |
| 931 | | |
| -16 | % | |
| 3,231 | |
| Sales volume (k ton) | |
| 331 | | |
| 294 | | |
| 12 | % | |
| 331 | | |
| 0 | % | |
| 1,243 | |
| Paper adjusted1 EBITDA (R$/ton) | |
| 2,366 | | |
| 2,481 | | |
| -5 | % | |
| 2,812 | | |
| -16 | % | |
| 2,599 | |
1Excludes
non-recurring items.
Adjusted
EBITDA from paper increased 7% from 2Q23, mainly due to net revenue growth driven by higher sales volume (+12%) and higher net average
price (+1%), though partially offset mainly by higher SG&A (variable compensation and due to incorporation of expenses with the acquisition
of Kimberly Clark’s tissue business in Brazil). Adjusted EBITDA per ton decreased 5%, mainly due to higher SG&A expenses,
partially offset by the price effect.
Compared
to 3Q22, despite increased volumes and better prices (+3%), the 16% decrease was caused by higher SG&A expenses, depreciation of
the average USD against the BRL (7%) and higher cash COGS. The decrease in adjusted EBITDA per ton is explained by the same factors.


OPERATING
CASH FLOW FROM THE PAPER SEGMENT
Paper Segment
(R$ million) | |
3Q23 | | |
2Q23 | | |
Δ Q-o-Q | | |
3Q22 | | |
Δ Y-o-Y | | |
LTM 3Q23 | |
| Adjusted EBITDA1 | |
| 783 | | |
| 729 | | |
| 7 | % | |
| 931 | | |
| -16 | % | |
| 3,231 | |
| Maintenance Capex2 | |
| (187 | ) | |
| (169 | ) | |
| 11 | % | |
| (128 | ) | |
| 47 | % | |
| (641 | ) |
| Operating Cash Flow | |
| 595 | | |
| 560 | | |
| 6 | % | |
| 803 | | |
| -26 | % | |
| 2,590 | |
1Excludes
non-recurring items.
2Cash
basis.
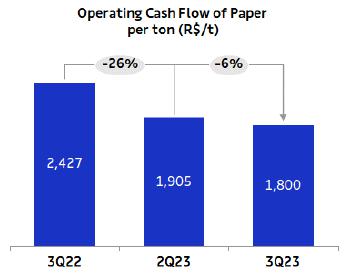
Operating
cash flow per ton from the paper segment was R$1,800/t in 3Q23, down 6% from 2Q23, due to lower EBITDA per ton. Compared to the same
period in 2022, the decrease of 26% was due to lower EBITDA per ton and higher sustaining capex per ton.
FINANCIAL
PERFORMANCE
NET
REVENUE
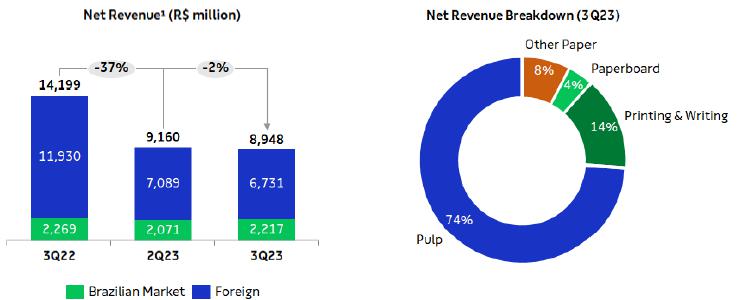
Suzano’s
net revenue in 3Q23 was R$8,948 million, 75% of which came from exports (vs. 77% in 2Q23 and 84% in 3Q22). In relation to 2Q23,
net revenue decreased 2%, due to lower net average pulp price in USD (-5%) and the decline in average USD against average BRL (-1%).
These effects were partially offset by higher paper sales volume in the period (+12%). The 37% decrease in consolidated net revenue compared
to 3Q22 is mainly explained by: i) lower average net pulp price in USD (-33%); ii) lower sales volume in the period (-10%); and iii)
the decline in average USD against average BRL (-7%). These effects were partially offset by better paper prices in the domestic market
(+17%).
1Does
not include Portocel service revenue.
CALENDAR
OF SCHEDULED MAINTENANCE DOWNTIMES
| Mill
– Pulp capacity |
2022 |
2023 |
2024 |
| 1Q22 |
2Q22 |
3Q22 |
4Q22 |
1Q23 |
2Q23 |
3Q23 |
4Q23 |
1Q24 |
2Q24 |
3Q24 |
4Q24 |
| Aracruz
- Mill A (ES) – 590 kt |
No
downtime |
|
|
|
|
|
|
|
|
|
|
| Aracruz
- Mill B (ES) – 830 kt |
|
|
|
|
|
|
No
downtime |
|
|
|
|
| Aracruz
- Mill C (ES) – 920 kt |
|
|
|
|
No
downtime |
|
|
|
|
| Imperatriz
(MA)1 – 1,650 kt |
|
|
|
|
|
|
|
|
|
|
|
|
| Jacareí
(SP) – 1,100 kt |
|
|
|
|
|
|
|
|
|
|
|
|
| Limeira
(SP)2 – 690 kt |
|
|
|
|
|
|
|
|
|
|
|
|
| Mucuri
- Mill 1 (BA)2 – 600 kt |
|
|
|
|
|
|
|
|
No
downtime |
| Mucuri
- Mill 2 (BA) – 1,130 kt |
No
downtime |
|
|
|
|
|
|
|
|
| Suzano
(SP)1 – 520 kt |
No
downtime |
|
|
|
|
|
|
|
|
| Três
Lagoas - Mill 1 (MS) – 1,300 kt |
|
|
|
|
|
|
|
|
No
downtime |
| Três
Lagoas - Mill 2 (MS) – 1,950 kt |
|
|
|
|
|
|
|
|
No
downtime |
| Veracel
(BA)2 – 560 kt |
No
downtime |
|
|
|
|
|
|
|
|
1Includes
integrated capacities and fluff.
2Veracel
is a joint operation between Suzano (50%) and Stora Enso (50%) with total annual capacity of 1,120 thousand tons.
COST
OF GOODS SOLD (COGS)
| COGS (R$
million) | |
3Q23 | | |
2Q23 | | |
Δ Q-o-Q | | |
3Q22 | | |
Δ Y-o-Y | | |
LTM 3Q23 | |
| COGS (Income statement) | |
| 6,104 | | |
| 6,228 | | |
| -2 | % | |
| 6,473 | | |
| -6 | % | |
| 25,094 | |
| (-) Depreciation, depletion and amortization | |
| 1,670 | | |
| 1,624 | | |
| 3 | % | |
| 1,640 | | |
| 2 | % | |
| 6,493 | |
| Cash COGS | |
| 4,434 | | |
| 4,604 | | |
| -4 | % | |
| 4,833 | | |
| -8 | % | |
| 18,601 | |
| Sales volume | |
| 2,817 | | |
| 2,807 | | |
| 0 | % | |
| 3,128 | | |
| -10 | % | |
| 11,457 | |
| Cash COGS/ton (R$/ton) | |
| 1,574 | | |
| 1,640 | | |
| -4 | % | |
| 1,545 | | |
| 2 | % | |
| 1,624 | |
Cash
COGS in 3Q23 totaled R$4,434 million, or R$1,574/ton. Compared to 2Q23, cash COGS decreased 4% mainly due to the lower cost of production
excluding downtimes, lower logistics costs (lower pulp sales, lower fuel costs and mix effect) and lower impact of scheduled maintenance
downtimes. On a per-ton basis, the 4% reduction is explained by the same factors mentioned earlier.
Compared
to 3Q22, cash COGS decreased 8%, chiefly due to lower sales volume and the decline in average USD against the BRL (7%), partially
offset by a greater impact of scheduled maintenance downtimes and inventory turnover effect. In relation to the same period last year,
cash COGS per ton increased 2% due to the same factors, except for the volume factor.
SELLING
EXPENSES
| Selling Expenses (R$
million) | |
3Q23 | | |
2Q23 | | |
Δ Q-o-Q | | |
3Q22 | | |
Δ Y-o-Y | | |
LTM 3Q23 | |
| Selling expenses (Income Statement) | |
| 654 | | |
| 627 | | |
| 4 | % | |
| 625 | | |
| 5 | % | |
| 2,545 | |
| (-) Depreciation, depletion and amortization1 | |
| 238 | | |
| 238 | | |
| 0 | % | |
| 238 | | |
| 0 | % | |
| 952 | |
| Cash selling expenses | |
| 416 | | |
| 389 | | |
| 7 | % | |
| 387 | | |
| 7 | % | |
| 1,593 | |
| Sales volume | |
| 2,817 | | |
| 2,807 | | |
| 0 | % | |
| 3,128 | | |
| -10 | % | |
| 11,457 | |
| Cash selling expenses/ton (R$/ton) | |
| 148 | | |
| 139 | | |
| 6 | % | |
| 124 | | |
| 19 | % | |
| 139 | |
Cash
selling expenses increased 7% from 2Q23, mainly due to higher spending with the acquisition of Kimberly Clark’s tissue business
in Brazil, which increased personnel, third-party services and other expenses. Cash selling expenses per ton increased 6% due to higher
costs, as mentioned earlier.
In
relation to 3Q22, the 7% increase in cash selling expenses is also explained by the acquisition of Kimberly Clark’s tissue business
in Brazil, higher allowance for loan losses and higher spending on labor and third-party services (IT, insurance, consulting and others).
These effects were partially offset by the drop in average USD versus BRL (7%) and higher sales volume. Cash selling expenses per ton
increased 19%, due to the factors mentioned above.
GENERAL
AND ADMINISTRATIVE EXPENSES
General and Administrative
Expenses (R$ million) | |
3Q23 | | |
2Q23 | | |
Δ Q-o-Q | | |
3Q22 | | |
Δ Y-o-Y | | |
LTM 3Q23 | |
| General and Administrative Expenses | |
| 491 | | |
| 427 | | |
| 15 | % | |
| 393 | | |
| 25 | % | |
| 1,924 | |
| (-) Depreciation, depletion and amortization1 | |
| 30 | | |
| 28 | | |
| 7 | % | |
| 25 | | |
| 22 | % | |
| 111 | |
| Cash general and administrative expenses | |
| 461 | | |
| 399 | | |
| 15 | % | |
| 368 | | |
| 25 | % | |
| 1,814 | |
| Sales volume | |
| 2,817 | | |
| 2,807 | | |
| 0 | % | |
| 3,128 | | |
| -10 | % | |
| 11,457 | |
| Cash general and administrative expenses/t (R$/ton) | |
| 164 | | |
| 142 | | |
| 15 | % | |
| 118 | | |
| 39 | % | |
| 158 | |
Compared
to 2Q23, the 15% increase in cash general and administrative expenses is mainly due to higher personnel expenses (variable compensation)
and incorporation of expenses with the acquisition of Kimberly Clark’s tissue business in Brazil. On a per-ton basis, these expenses
increased 15% due to the same factors.
Compared
to 3Q22, cash general and administrative expenses increased 25%, mainly due to higher personnel expenses (variable compensation and labor)
and incorporation of expenses with the acquisition of Kimberly Clark’s tissue business in Brazil. On a per-ton basis, the 39% increase
is explained by the same factors.
Other
operating income (expenses) was an expense of R$10 million in 3Q23, compared to an income of R$1,205 million in 2Q23 and an expense
of R$19 million in 3Q22. The variation in relation to 2Q23 is mainly due to the absence of the updated fair value of biological assets
(which happens in the second and fourth quarters of each year). Compared to 3Q22, the variation is mainly explained by several less significant
events.
ADJUSTED
EBITDA
| Consolidated | |
3Q23 | | |
2Q23 | | |
Δ Q-o-Q | | |
3Q22 | | |
Δ Y-o-Y | | |
LTM 3Q23 | |
| Adjusted EBITDA (R$ million)1 | |
| 3,695 | | |
| 3,919 | | |
| -6 | % | |
| 8,596 | | |
| -57 | % | |
| 21,944 | |
| Adjusted EBITDA1 Margin | |
| 41 | % | |
| 43 | % | |
| -2 p.p. | | |
| 61 | % | |
| -20 p.p. | | |
| 50 | % |
| Sales Volume (k ton) | |
| 2,817 | | |
| 2,807 | | |
| 0 | % | |
| 3,128 | | |
| -10 | % | |
| 11,457 | |
| Adjusted EBITDA1/ton (R$/ton) | |
| 1,312 | | |
| 1,396 | | |
| -6 | % | |
| 2,748 | | |
| -52 | % | |
| 1,915 | |
1Excludes
non-recurring items.
Adjusted
EBITDA in 3Q23 decreased 6% in relation to 2Q23, due to: i) the lower average net pulp price in USD (-5%); ii) higher SG&A expenses
(+9%), mainly explained by higher administrative expenses resulting from the increase in personnel expenses (variable compensation) and
the incorporation of expenses with the acquisition of Kimberly Clark’s tissue business in Brazil; and iii) the decline in average
USD against average BRL (-1%). These effects were marginally offset by lower cash COGS (-2%), as explained above and and slight increase
in volumes. Adjusted EBITDA per ton decreased 6% due to the same factors explained above, excluding volumes.
In
relation to 3Q22, Adjusted EBITDA decreased 57% due to: i) the lower average net pulp price in USD (-33%); ii) lower sales volume
(-10%); iii) the decline in average USD against average BRL (-7%); and iv) higher SG&A expenses (+12%), mainly explained by higher
administrative expenses resulting from the increase in personnel expenses (variable compensation) and incorporation of expenses with
the acquisition of Kimberly Clark’s tissue business in Brazil, as explained earlier. Adjusted EBITDA per ton decreased 52% due
to the same factors, excluding volume.
FINANCIAL
RESULT
Financial Result
(R$ million) | |
3Q23 | | |
2Q23 | | |
Δ Q-o-Q | | |
3Q22 | | |
Δ Y-o-Y | | |
LTM 3Q23 | |
| Financial Expenses | |
| (1,176 | ) | |
| (1,149 | ) | |
| 2 | % | |
| (1,216 | ) | |
| -3 | % | |
| (4,674 | ) |
Interest on loans and financing
(local currency) | |
| (371 | ) | |
| (359 | ) | |
| 3 | % | |
| (359 | ) | |
| 3 | % | |
| (1,426 | ) |
Interest on loans and financing
(foreign currency) | |
| (857 | ) | |
| (797 | ) | |
| 8 | % | |
| (692 | ) | |
| 24 | % | |
| (3,217 | ) |
| Capitalized interest1 | |
| 305 | | |
| 278 | | |
| 10 | % | |
| 97 | | |
| - | | |
| 970 | |
| Other financial expenses | |
| (253 | ) | |
| (270 | ) | |
| -7 | % | |
| (263 | ) | |
| -4 | % | |
| (1,001 | ) |
| Financial Income | |
| 426 | | |
| 404 | | |
| 5 | % | |
| 270 | | |
| 58 | % | |
| 1,561 | |
| Interest on financial investments | |
| 419 | | |
| 407 | | |
| 3 | % | |
| 229 | | |
| 84 | % | |
| 1,389 | |
| Other financial income | |
| 6 | | |
| (3 | ) | |
| - | | |
| 41 | | |
| -85 | % | |
| 171 | |
| Monetary and Exchange Variations | |
| (1,880 | ) | |
| 2,377 | | |
| - | | |
| (1,470 | ) | |
| 28 | % | |
| 3,339 | |
Foreign exchange variations
(Debt) | |
| (2,381 | ) | |
| 3,032 | | |
| - | | |
| (2,026 | ) | |
| 18 | % | |
| 4,324 | |
Other foreign exchange
variations | |
| 501 | | |
| (656 | ) | |
| - | | |
| 555 | | |
| -10 | % | |
| (984 | ) |
| Derivative income (loss), net2 | |
| (864 | ) | |
| 2,904 | | |
| - | | |
| 890 | | |
| - | | |
| 5,286 | |
| Operating Cash flow hedge | |
| (440 | ) | |
| 1,466 | | |
| - | | |
| 139 | | |
| - | | |
| 2,796 | |
Cash flow - Cerrado project hedge | |
| (249 | ) | |
| 298 | | |
| - | | |
| 44 | | |
| - | | |
| 662 | |
| Debt hedge | |
| (225 | ) | |
| 974 | | |
| - | | |
| 609 | | |
| - | | |
| 1,633 | |
| Others3 | |
| 49 | | |
| 166 | | |
| -70 | % | |
| 97 | | |
| -49 | % | |
| 195 | |
| Net Financial Result | |
| (3,494 | ) | |
| 4,536 | | |
| - | | |
| (1,527 | ) | |
| 129 | % | |
| 5,511 | |
1Capitalized
interest related to work in progress.
2Variation
in mark-to-market adjustment (3Q23: R$1,676 million | 2Q23: R$3,261 million), plus adjustments paid and received (3Q23: = R$720 million).
3Includes
commodity hedge and embedded derivatives.
Financial expenses were 2% higher than in 2Q23,
mainly due to the increase in interest expenses in foreign currency, mainly due to the decline in closing BRL against USD. In addition,
there was an increase in interest in local currency due to the issuance of debentures as per Notice to the Market released on 06/29 and
09/18. These effects were partially offset by the increase in capitalized interest (linked to the progress of the Cerrado Project) and
decline on other financial expenses (lower tax charges (IOF) arising from financial transactions). Compared to 3Q22, financial expenses
decreased 3%, mainly due to the increase in capitalized interest, partially offset mainly by the increase in interest expenses in foreign
currency resulting from the increase in the SOFR interest rate (3Q23: 5.24% p.a. | 3Q22: 2.15% p.a. - average reference).
Financial income grew 5% in relation to 2Q23,
partially due to the increase in interest on financial investments, mainly explained by the increase in the U.S. interest rate (3Q23:
5.24% p.a. | 2Q23: 4.97% p.a. – average reference). Compared to 3Q22, the 58% increase was mainly caused by higher U.S. interest
rate (3Q23: 5.24% p.a. | 3Q22: 2.15% p.a. – average reference).
Inflation adjustment and exchange variation had
a negative impact of R$1,880 million on the Company’s financial result due to the 4% drop in BRL against USD at the close of 3Q23,
which affected foreign currency debt by US$2,381 million (US$12,531 million at the end of 3Q23). This effect was partially offset by
the positive result of exchange variation on other balance sheet items in foreign currency (R$501 million), notably the impact on the
Company’s cash position (56% in USD at the end of 3Q23). Note that the accounting impact of exchange variation on foreign currency
debt has a cash impact only on the respective maturities.
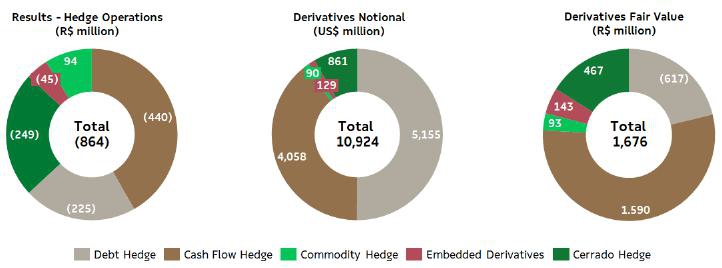
Derivative operations resulted in a loss of R$864
million in 3Q23, due to the negative impact of weaker BRL and the increase in IPCA coupon, despite the positive impact of the fixed,
coupon and SOFR rate curves on debt hedge and cash flow transactions. The mark-to-market adjustment of derivative instruments on September 30,
2023, generated an income of R$1,676 million, compared to an income of R$3,261 million on June 30, 2023, down R$1,585 million. Note
that the impact of BRL depreciation on the derivatives portfolio generates a cash impact only upon the respective maturities. The net
effect on cash, which refers to the maturity of derivative operations in the third quarter, was a positive R$720 million (R$58 million
expense from debt hedge, R$756 million gain from cash flow hedge and R$22 million gain from commodities).
As a result of the above factors, net financial
result in 3Q23, considering all financial expense and income lines, was an expense of R$3,494 million, compared to an income of R$4,536
million in 2Q23 and an expense of R$1,527 million in 3Q22.
DERIVATIVE OPERATIONS
Suzano carries out derivative operations exclusively
for hedging purposes. The following table reflects the position of derivative hedging instruments on September 30, 2023:
| |
Notional
(US$ million) | | |
Fair
Value (R$ million) | |
| Hedge1 | |
Sep/23 | | |
Jun/23 | | |
Sep/23 | | |
Jun/23 | |
| Debt | |
| 5,155 | | |
| 5,201 | | |
| (617 | ) | |
| (451 | ) |
| Cash Flow – Operating (ZCC + NDF) | |
| 4,058 | | |
| 4,256 | | |
| 1,590 | | |
| 2,583 | |
| Cash Flow – Cerrado² (ZCC + NDF) | |
| 861 | | |
| 1,207 | | |
| 467 | | |
| 919 | |
| Others3 | |
| 219 | | |
| 259 | | |
| 236 | | |
| 210 | |
| Total | |
| 10,294 | | |
| 10,923 | | |
| 1,676 | | |
| 3,261 | |
1See
note 4 of the 3Q23 Quarterly Financial Statements (ITR) for further details and the fair value sensitivity analysis.
2Hedge
program related to capex in BRL (ZCC) and EUR (NDF) of the Cerrado Project.
3Includes
commodity hedging and embedded derivatives.
The Company’s foreign exchange exposure
policy seeks to minimize the volatility of its cash generation and ensure greater flexibility in cash flow management. Currently, the
policy stipulates that surplus dollars may be partially hedged (at least 40% and up to 75% of exchange variation exposure over the next
24 months) using plain vanilla instruments, such as Zero Cost Collars (ZCC) and Non-Deliverable Forwards (NDF). At the end of 3Q23, 59%
of the exchange variation exposure was covered.
Considering the foreign exchange exposure related
to Capex in the Cerrado Project, since approximately 67% of Capex is pegged to local currency, the Board of Directors approved on October 28,
2021, a program for contracting additional specific hedge operations to protect from it such exposure. The program approved (established
in the Derivatives Management Policy available on the Investor Relations website) initially involved a maximum amount (notional) of up
to US$1 billion and a term of operations of up to 36 months. On July 27, 2022, the Board of Directors approved the expansion of
the program, increasing the maximum amount (notional) to US$1.5 billion while maintaining the previously established term. To ensure
transparency with regard to the Cerrado Project's hedge program, since 4Q21 the Company has been prominently disclosing the operations
contracted.
Since about 33% of the Capex of the Cerrado Project
is denominated in EUR, in 3Q22, the Company contracted hedge operations through NDFs to protect the exposure in EUR of the Capex of the
Cerrado Project, converting it into USD. This type of hedge is established in the Derivatives Management Policy available on the Investor
Relations website.
ZCC transactions establish minimum and maximum
limits for the exchange rate that minimize adverse effects in the event of significant appreciation of the BRL. As such, if the exchange
rate is within such limits, the Company neither pays nor receives any financial adjustments. This characteristic allows for capturing
greater benefits from export revenue in a potential scenario of BRL appreciation versus USD within the range contracted. In cases of
extreme BRL appreciation, the Company is protected by the minimum limits, which are considered appropriate for the operation. However,
this protection instrument also limits, temporarily and partially, potential gains in scenarios of extreme BRL depreciation when exchange
rates exceed the maximum limits contracted.
On September 30, 2023, the outstanding notional
value of operations involving forward USD sales through ZCCs related to Cash Flows (including those related to the Cerrado Project) was
US$4,517 million, with an average forward rate ranging from R$5.55 to R$6.41 and maturities distributed between October 2023 and
August 2025. On the same date, the outstanding notional value of operations involving forward USD sales through NDFs was US$44 million,
whose maturities are distributed between October 2023 and April 2025 and with an average rate of R$5.61. Regarding hedge for
foreign exchange exposure in EUR, the outstanding notional value of forward EUR purchases at the end of 3Q23 was €349 million (USD359
million), with an average contracted rate of 1.03 EUR/USD and maturities through July 2024. In 3Q23, operational, cash flow and
Cerrado Project hedge operations resulted in a loss of R$689 million. The mark-to-market (“MtM” or “fair value”)
value of these operations totaled R$2,057 million, with R$1,590 million related to cash flow operating hedge and R$467 million related
to operating hedge of the Cerrado Project.
The following table presents a sensitivity analysis
of the cash impact that the Company could have on its cash flow hedge portfolios (ZCC and NDF) if the exchange rate remains the same
as at the end of 3Q23 (BRL/USD = 5.01) in the coming quarters, as well as the projected cash impact for R$0.10 variations below / above
the strike of put/call options, respectively, defined in each quarter. Note that the figures presented in the table are the Company’s
projections based on the end-of-period curves and could vary depending on market conditions.
| | |
| | |
| | |
Cash Adjustment (R$ million) | |
Maturity
(up to) | |
Strike Range | | |
Notional
(US$ million) | | |
Actual | | |
Exchange Rate
3Q23
(R$ 5.01) | | |
Sensitivity at R$
0.10 / US$
variation (+/-) | |
| | |
| | |
| | |
| | |
| | |
| |
| Zero Cost Collars |
| 3Q23 | |
| - | | |
| - | | |
| 434 | | |
| - | | |
| - | |
| 4Q23 | |
| 5.56 - 6.35 | | |
| 981 | | |
| - | | |
| 538 | | |
| 98 | |
| 1Q24 | |
| 5.44 - 6.20 | | |
| 382 | | |
| - | | |
| 166 | | |
| 38 | |
| 2Q24 | |
| 5.56 - 6.40 | | |
| 560 | | |
| - | | |
| 308 | | |
| 56 | |
| 3Q24 | |
| 5.66 - 6.53 | | |
| 555 | | |
| - | | |
| 362 | | |
| 56 | |
| 4Q24 | |
| 5.71 - 6.63 | | |
| 505 | | |
| - | | |
| 353 | | |
| 51 | |
| 1Q25 | |
| 5.53 - 6.40 | | |
| 260 | | |
| - | | |
| 135 | | |
| 26 | |
| 2Q25 | |
| 5.34 - 6.15 | | |
| 247 | | |
| - | | |
| 81 | | |
| 25 | |
| 3Q25 | |
| 5.12 - 5.94 | | |
| 525 | | |
| - | | |
| 59 | | |
| 53 | |
| Total | |
| 5.51 - 6.34 | | |
| 4,015 | | |
| 434 | | |
| 2,001 | | |
| 401 | |
| NDF |
| 3Q23 | |
| - | | |
| - | | |
| 119 | | |
| - | | |
| - | |
| 4Q23 | |
| 5.64 | | |
| 34 | | |
| - | | |
| 21 | | |
| 3 | |
| 4Q24 | |
| 5.47 | | |
| 5 | | |
| - | | |
| 2 | | |
| 1 | |
| 2Q25 | |
| 5.54 | | |
| 5 | | |
| - | | |
| 3 | | |
| 1 | |
| Total | |
| 5.61 | | |
| 44 | | |
| 119 | | |
| 26 | | |
| 4 | |
| Zero Cost Collars – Projeto Cerrado |
| 3Q23 | |
| - | | |
| - | | |
| 186 | | |
| - | | |
| - | |
| 4Q23 | |
| 5.85 - 7.00 | | |
| 341 | | |
| - | | |
| 286 | | |
| 34 | |
| 1Q24 | |
| 5.87 - 6.98 | | |
| 95 | | |
| - | | |
| 82 | | |
| 9 | |
| 2Q24 | |
| 6.10 - 7.44 | | |
| 58 | | |
| - | | |
| 64 | | |
| 6 | |
| 3Q24 | |
| 6.35 - 8.34 | | |
| 9 | | |
| - | | |
| 12 | | |
| 1 | |
| Total | |
| 5.89 - 7.07 | | |
| 502 | | |
| 186 | | |
| 443 | | |
| 50 | |
| | |
| | |
| | |
Cash Adjustment (R$ million) | |
Maturity
(up to) | |
Strike Range | | |
Notional
(US$
million)1 | | |
Actual | | |
Exchange Rate
3Q23
(€ 1.06) | | |
Sensitivity at
€ 0.10 / US$
variation (+/-) | |
| NDF – Projeto Cerrado (EUR/USD) | |
| | | |
| | | |
| | | |
| | | |
| | |
| 3Q23 | |
| - | | |
| - | | |
| 17 | | |
| - | | |
| - | |
| 4Q23 | |
| 1.02 | | |
| 97 | | |
| - | | |
| 18 | | |
| 48 | |
| 1Q24 | |
| 1.03 | | |
| 98 | | |
| - | | |
| 14 | | |
| 48 | |
| 2Q24 | |
| 1.03 | | |
| 96 | | |
| - | | |
| 13 | | |
| 47 | |
| 3Q24 | |
| 1.04 | | |
| 69 | | |
| - | | |
| 7 | | |
| 33 | |
| Total | |
| 1.03 | | |
| 359 | | |
| 17 | | |
| 52 | | |
| 175 | |
1Translated at the average contracted
rate of 1.03 Euro/USD.
To mitigate the effects of exchange and interest
rate variations on its debt and its cash flows, the Company also uses currency and interest rate swaps. Swap contracts are entered into
considering different interest rates and inflation indices in order to mitigate the mismatch between financial assets and liabilities.
On September 30, 2023, the Company had an
outstanding amount (notional value) of US$5,155 million in swap contracts as shown in the table below. In 3Q23, the result of debt hedge
transactions was a loss of R$225 million, mainly due to negative impact of weaker BRL, despite the positive impact of the variation in
fixed-rate, coupon and SOFR curves. The mark-to-market adjustment (fair value) of these operations was a loss of R$617 million.
| | |
| | | |
| | | |
| Notional
(US$ million)
| | |
| Fair Value
(R$ million)
| |
| Debt Hedge | |
| Maturity
(up to) | | |
| Currency | | |
| Sep/23 | | |
| Jun/23 | | |
| Sep/23 | | |
| Jun/23 | |
| Swap (PRÉ x USD) | |
| 2024 | | |
| USD | | |
| 200 | | |
| 350 | | |
| (244 | ) | |
| (361 | ) |
| Swap (CDI x USD) | |
| 2026 | | |
| USD | | |
| 1,015 | | |
| 1,265 | | |
| (1,257 | ) | |
| (1,262 | ) |
| Swap (IPCA x USD) | |
| 2023 | | |
| USD | | |
| - | | |
| - | | |
| - | | |
| - | |
| Swap (SOFR x USD) | |
| 2027 | | |
| USD | | |
| 2,929 | | |
| 3,144 | | |
| 921 | | |
| 927 | |
| Swap SOFR | |
| 2029 | | |
| USD | | |
| 151 | | |
| - | | |
| 11 | | |
| - | |
| Swap (IPCA x CDI) | |
| 2038 | | |
| BRL | | |
| 860¹ | | |
| 442¹ | | |
| (48 | ) | |
| 245 | |
| Total | |
| | | |
| | | |
| 5,155 | | |
| 5,201 | | |
| (617 | ) | |
| (451 | ) |
1Translated at the closing exchange
rate (5.01).
The following table presents a sensitivity analysis1
of the cash impact that the Company could have on its debt hedge portfolio (swaps) if the exchange rate remains the same as at
the end of 3Q23 (BRL/USD = 5.01) in the coming quarters, as well as the projected variation in cash impact for each R$0.10 variation
on the same reference exchange rate (3Q23). Note that the figures presented in the table are the Company’s projections based on
the end-of-period curves and could vary depending on market conditions.
| | |
| | | |
| Cash Adjustment (R$ million) | |
Maturity
(up to) | |
| Notional (US$ million) | | |
| Actual | | |
| R$ / US$ = 5.01
(3Q23) | | |
| Sensitivity at
R$ 0.10 / US$
variation (+/-)1 | |
| 3Q23 | |
| - | | |
| (58 | ) | |
| - | | |
| - | |
| 4Q23 | |
| 405 | | |
| - | | |
| 206 | | |
| - | |
| 2024 | |
| 1,382 | | |
| - | | |
| 236 | | |
| 2 | |
| 2025 | |
| 1,474 | | |
| - | | |
| (475 | ) | |
| 58 | |
| 2026 | |
| 940 | | |
| - | | |
| (669 | ) | |
| 58 | |
| 2027 | |
| 108 | | |
| - | | |
| (46 | ) | |
| - | |
| >=2028 | |
| 845 | | |
| - | | |
| 10 | | |
| - | |
| Total | |
| 5,155 | | |
| (58 | ) | |
| (739 | ) | |
| 118 | |
1Sensitivity analysis considers variation
only in the exchange rate (R$/US$), while other variables are presumed constant.
Other transactions involving the Company’s
derivatives are related to the embedded derivative resulting from forestry partnerships and commodity hedges, as shown in the table.
| | |
| |
| |
Notional
(US$ million) | |
Fair Value
(R$ million) | |
Cash Adjustment
(R$ million) | |
| Other hedges | |
Maturity
(up to) | |
Index | |
Sep/23 |
|
Jun/23 | |
Sep/23 | |
Jun/23 | |
Sep/23 |
|
Jun/23 | |
| Embedded derivative | |
2038 | |
Fixed USD | USD US-CPI | |
129 | |
131 | |
143 | |
188 | |
- | |
- | |
| Commodities | |
2024 | |
Brent/VLSFO/
Others | |
90 | |
128 | |
93 | |
22 | |
22 | |
9 | |
| Total | |
| |
| |
219 | |
259 | |
236 | |
210 | |
22 | |
9 | |
A portion of the forestry partnership agreements
and standing timber supply agreements is denominated in USD per cubic meter of standing timber, adjusted by U.S. inflation measured by
the Consumer Price Index (CPI), which is not related to inflation in the economic environment where the forests are located and, hence,
constitutes an embedded derivative. This instrument, presented in the table above, consists of a sale swap contract of the variations
in the US-CPI during the period of the contracts. See note 4 of the 3Q23 Financial Statements for more details and for a sensitivity
analysis of the fair value in case of a sharp rise in the US-CPI and USD. On September 30, 2023, the outstanding (notional) value
of the operation was US$129 million. The result of this swap in 3Q23 was a loss of R$45 million. The mark-to-market (fair value) adjustment
of these operations generated a gain of R$143 million at the end of the quarter.
The Company is also exposed to the price of some
commodities and, therefore, constantly assesses the contracting of derivative financial instruments to mitigate such risks. On September 30,
2023, the outstanding (notional) value of the operation was US$90 million. The result from this swap in 3Q23 was a gain of R$94 million.
The mark-to-market (fair value) adjustment of these operations generated a gain of R$93 million at the end of the quarter.
NET INCOME (LOSS)
In 3Q23, the Company posted net loss of R$729
million, compared to net income of R$5,078 million in 2Q23 and net income of R$5,448 million in 3Q22. The variation in relation to 2Q23
was mainly due to the negative financial result, which was explained by the impact of weaker BRL on debt and derivative operations (compared
to the positive result registered in the previous quarter). Moreover, the lack of revaluation of biological assets led to a reduction
in other operating income/expenses line.
The variation in relation to 3Q22 is mainly explained
by the decrease in operating result (decline in net revenue) and the negative financial result, reflecting the effect of weaker BRL on
debt and derivative operations. These effects were partially offset by deferred IR/CSLL credits, mainly on negative results from exchange
variation and derivative operations.
DEBT
| Debt (R$ million) | |
| 3Q23 | |
| 2Q23 | |
| Δ Q-o-Q | | |
| 3Q22 | |
| Δ Y-o-Y | |
| Local Currency | |
| 15,770 | |
| 14,367 | |
| 10 | % | |
| 12,611 | |
| 25 | % |
| Short Term | |
| 1,921 | |
| 2,920 | |
| -34 | % | |
| 1,615 | |
| 19 | % |
| Long Term | |
| 13,849 | |
| 11,446 | |
| 21 | % | |
| 10,996 | |
| 26 | % |
| Foreign Currency | |
| 62,781 | |
| 60,166 | |
| 4 | % | |
| 63,449 | |
| -1 | % |
| Short Term | |
| 2,698 | |
| 2,612 | |
| 3 | % | |
| 1,236 | |
| 118 | % |
| Long Term | |
| 60,083 | |
| 57,554 | |
| 4 | % | |
| 62,213 | |
| -3 | % |
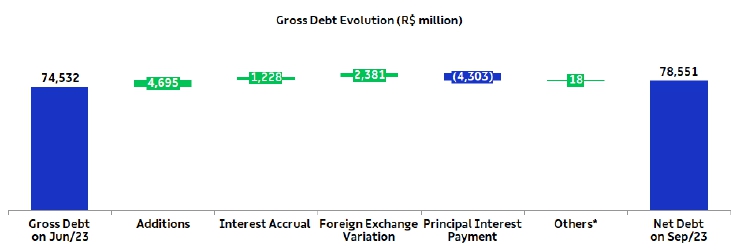
| Gross Debt | |
| 78,551 | |
| 74,532 | |
| 5 | % | |
| 76,060 | |
| 3 | % |
| (-) Cash | |
| 20,927 | |
| 20,215 | |
| 4 | % | |
| 18,272 | |
| 15 | % |
| Net debt | |
| 57,624 | |
| 54,317 | |
| 6 | % | |
| 57,788 | |
| 0 | % |
| Net debt/Adjusted EBITDA¹ (x) - R$ | |
| 2.6 | x |
| 2.0 | x |
| 0.6 | x | |
| 2.2 | x |
| 0.4 | x |
| Net debt/Adjusted EBITDA¹ (x) – US$ | |
| 2.7 | x |
| 2.2 | x |
| 0.5 | x | |
| 2.1 | x |
| 0.6 | x |
1Excluding non-recurring items.
On September 30, 2023, gross debt
totaled R$78.6 billion and was composed of 94% long-term maturities and 6% short-term maturities. Foreign currency debt corresponded
to 80% of the Company's total debt at the end of the quarter. The percentage of gross debt in foreign currency, considering the effect
of debt hedge, was 86%. Compared to 2Q23, gross debt increased 5%, mainly due to the effect of exchange variation of R$2,381 million
combined with net funding operations carried out during the period. Suzano ended 3Q23 with 40% of total debt linked to ESG instruments.
Suzano contracts debt in foreign currency as
a natural hedge, since net operating cash generation is mostly denominated in foreign currency (USD) due to its predominant status as
an exporter. This structural exposure allows the Company to match loans and financing payments in USD with receivable flows from sales.
*Corresponding mainly to transaction costs (issue,
funding, goodwill, discount and loss on business combinations, etc.).
On September 30, 2023, the total average
cost of debt in USD was 5.1% p.a. (considering the debt in BRL adjusted by the market swap curve), compared to 4.9% p.a. on June 30,
2023. The average term of consolidated debt at the end of the quarter was 77 months, compared to 75 months at the end of 2Q23.

1Considers the portion of debt with
swap for fixed rate in foreign currency. The exposure of the original debt was: Fixed (US$) – 54%, SOFR– 26%, CDI –
11%, Other (Fixed R$, IPCA, TJLP, others) – 9%.
2Considers the portion of debt with
currency swaps. The original debt was 80% denominated in USD and 20% in BRL.
Cash and cash
equivalents and financial investments on September 30, 2023 amounted to R$20.9 billion, 56% of which was in foreign currency,
allocated in remunerated accounts or in short-term fixed-income investments abroad. The remaining 44% was invested in local currency
fixed-income bonds (mainly CDBs, but also in government bonds and others), remunerated at the CDI rate.
On September 30,
2023, the company also had a stand-by credit facility totaling R$6.4 billion (US$1.3 billion) available through February 2027. This
facility strengthens the company's liquidity position and can be withdrawn during times of uncertainty. As a result, the cash and equivalents
of R$20.9 billion plus the credit facilities described above amounted to a readily available cash position of R$27.3 billion on September 30,
2023. Moreover, the Company has a financing agreement with Finnvera (US$800 million) related to the Cerrado Project, as per the
Notice to the Market of November 1, 2022, which has not yet been withdrawn, further strengthening its liquidity position.

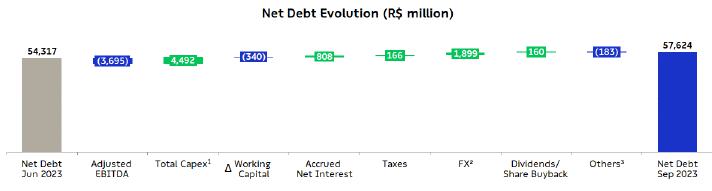
On September 30, 2023, net debt stood
at R$57.6 billion (US$11.5 billion), compared to R$54.3 billion (US$11.3 billion) on June 30, 2023. The main factors that explain
the increase in net debt were, in this order: capex (R$4.5 billion), exchange rate variations (R$1.9 billion) and appropriate interest
(R$0.8 billion). These effects were partially offset by adjusted EBITDA, positive adjustment of derivatives and release of working capital.
Financial leverage, measured as the ratio of
net debt to adjusted EBITDA in BRL, was 2.6 times on September 30, 2023, compared to 2.0 times in 2Q23. The same ratio in
USD (the measure established in Suzano’s financial policy) rose to 2.7 times on September 30, 2023 (from 2.2 times in 2Q23).

The breakdown of total gross debt between trade
and non-trade finance on September 30, 2023 is shown below:
| | |
| 3M23 | | |
| 2024 | | |
| 2025 | | |
| 2026 | | |
| 2027 | | |
| 2028
onwards | | |
| Total | |
| Trade Finance1 | |
| 13 | % | |
| 85 | % | |
| 55 | % | |
| 48 | % | |
| 50 | % | |
| 2 | % | |
| 24 | % |
| Non-Trade Finance2 | |
| 87 | % | |
| 15 | % | |
| 45 | % | |
| 52 | % | |
| 50 | % | |
| 98 | % | |
| 76 | % |
1 EEC, ECN, EPP
2Bonds, BNDES, CRA, Debentures, among
others.
CAPEX
In 3Q23, capital
expenditure (cash basis) totaled R$4,404 million. The 29% decrease in relation to 2Q23 was due to: i) lower investments in Land and Forests
due to the payment of the second installment for the acquisition of Parkia in the previous period; and ii) less spending on the Cerrado
Project due to advances made to suppliers in 2Q23.
Compared to 3Q22,
the 9% increase is mainly due to higher spending on maintenance, especially in the recovery of roads for forestry logistics and higher
expenses with services, in addition to the progress in execution of the Cerrado Project.
The Company also
announced three new investments:
| · | The
construction of a sanitary paper (tissue) factory and conversion into toilet paper and paper
towels in the municipality of Aracruz, in the state of Espírito Santo, with a capacity
of 60,000 tons per year, with total investments estimated at R$ 650 million and the beginning
of operations scheduled for the first quarter of 2026. Suzano plans to use the balance of
ICMS credits it has in the state in the investments, which should result in an estimated
net disbursement of R$129 million in the project; |
| · | The
construction of a new biomass boiler at the pulp mill in Aracruz to replace the current boiler,
at an estimated investment of R$520 million. The new biomass boiler should go operational
in 4Q25. |
| · | Investments
totaling R$490 million to produce fluff pulp from eucalyptus wood (Eucafluff), with nominal
production capacity of 340 thousand tons a year. The investment represents the conversion
of a pulp drying machine at the Limeira unit, which will give the company full flexibility
in producing pulp for paper or fluff after the investment is concluded in 4Q25. |
The above investments
do not affect the Capex guidance announced by the Company for 2023.
Investments1
(R$ million) | |
| 3Q23 | | |
| 2Q23 | | |
| Δ
Q-o-Q | | |
| 3Q22 | | |
| Δ
Y-o-Y | | |
| LTM
3Q23 | | |
| Guidance
2023 | |
| Maintenance | |
| 1,799 | | |
| 1,716 | | |
| 5 | % | |
| 1,441 | | |
| 25 | % | |
| 6,693 | | |
| 6,360 | |
| Industrial
maintenance | |
| 401 | | |
| 286 | | |
| 40 | % | |
| 219 | | |
| 83 | % | |
| 1,287 | | |
| 1,301 | |
| Forestry
maintenance | |
| 1,339 | | |
| 1,403 | | |
| -5 | % | |
| 1,183 | | |
| 13 | % | |
| 5,219 | | |
| 4,809 | |
| Others | |
| 59 | | |
| 27 | | |
| 117 | % | |
| 39 | | |
| 54 | % | |
| 186 | | |
| 250 | |
| Expansion and modernization | |
| 190 | | |
| 231 | | |
| -17 | % | |
| 127 | | |
| 50 | % | |
| 686 | | |
| 732 | |
| Land and forestry | |
| 253 | | |
| 1,828 | | |
| -86 | % | |
| 583 | | |
| -57 | % | |
| 2,651 | | |
| 2,420 | |
| Port terminals | |
| 1 | | |
| 2 | | |
| -29 | % | |
| 12 | | |
| -91 | % | |
| 10 | | |
| 12 | |
| Others | |
| 20 | | |
| 6 | | |
| - | | |
| 15 | | |
| 36 | % | |
| 137 | | |
| 34 | |
| Cerrado
Project | |
| 2,140 | | |
| 2,446 | | |
| -12 | % | |
| 1,866 | | |
| 15 | % | |
| 9,320 | | |
| 8,937 | |
| Total | |
| 4,404 | | |
| 6,228 | | |
| -29 | % | |
| 4,043 | | |
| 9 | % | |
| 19,496 | | |
| 18,495 | |
1Does
not include the acquisition of Kimberly Clark’s tissue business in Brazil, in the amount of R$1,073 million, as explained in Note
15 of the 2Q23 financial statements.
CERRADO PROJECT
The Cerrado Project
is progressing according to schedule on its physical and financial curves, closing the third quarter of 2023 with the “inside the
fence” execution (which corresponds to industrial and infrastructure investments) reaching physical progress of 78% and financial
progress of 68% (R$9,991 million). The Company expects the new pulp mill located in Ribas do Rio Pardo, Mato Grosso do Sul, with annual
capacity of 2,550 thousand tons, to go operational by June 2024.
OPERATING CASH
GENERATION
Operating
Cash Flow
(R$ million) | |
| 3Q23 | | |
| 2Q23 | | |
| Δ
Q-o-Q | | |
| 3Q22 | | |
| Δ
Y-o-Y | | |
| LTM
3Q23 | |
| Adjusted
EBITDA1 | |
| 3,695 | | |
| 3,919 | | |
| -6 | % | |
| 8,596 | | |
| -57 | % | |
| 21,944 | |
| Maintenance
Capex2 | |
| (1,799 | ) | |
| (1,716 | ) | |
| 5 | % | |
| (1,441 | ) | |
| 25 | % | |
| (6,693 | ) |
| Operating
Cash Flow | |
| 1,896 | | |
| 2,203 | | |
| -14 | % | |
| 7,155 | | |
| -74 | % | |
| 15,251 | |
| Operating
Cash Flow (R$/ton) | |
| 673 | | |
| 785 | | |
| -14 | % | |
| 2,288 | | |
| -71 | % | |
| 1,331 | |
1Excludes
non-recurring items.
2Cash
basis.
Operating cash
generation, measured by adjusted EBITDA less sustaining capex (cash basis), amounted to R$1,896 million in 3Q23. The decrease of 14%
and 71%, respectively, in operating cash generation per ton in relation to 2Q23 and 3Q22, is due to lower adjusted EBITDA per ton and
higher sustaining capex per ton.

FREE CASH FLOW
| Free
Cash Flow (R$ million) | |
| 3Q23 | | |
| 2Q23 | | |
| Δ
Q-o-Q | | |
| 3Q22 | | |
| Δ
Y-o-Y | | |
| LTM
3Q23 | |
| Adjusted EBITDA | |
| 3,695 | | |
| 3,919 | | |
| -6 | % | |
| 8,596 | | |
| -57 | % | |
| 29,333 | |
| (-) Total Capex1 | |
| (4,492 | ) | |
| (7,503 | ) | |
| -40 | % | |
| (5,527 | ) | |
| -19 | % | |
| (19,927 | ) |
| (-) Leases contracts –
IFRS 16 | |
| (293 | ) | |
| (284 | ) | |
| 3 | % | |
| (244 | ) | |
| 20 | % | |
| (1,170 | ) |
| (+/-)
Δ Working capital2 | |
| 340 | | |
| 2,789 | | |
| -88 | % | |
| (1,315 | ) | |
| - | | |
| 1,109 | |
| (-)
Net interest3 | |
| (1,460 | ) | |
| (532 | ) | |
| - | | |
| (1,381 | ) | |
| 6 | % | |
| (3,825 | ) |
| (-) Income taxes | |
| (166 | ) | |
| (47 | ) | |
| - | | |
| (122 | ) | |
| 36 | % | |
| (346 | ) |
| (-) Dividend payment/Share
Buyback Program | |
| (160 | ) | |
| (636 | ) | |
| -75 | % | |
| (1,402 | ) | |
| -89 | % | |
| (3,233 | ) |
| (+/-)
Derivative cash adjustment | |
| 720 | | |
| 1,299 | | |
| -45 | % | |
| (160 | ) | |
| - | | |
| 2,641 | |
| Free
cash flow | |
| (1,815 | ) | |
| (996 | ) | |
| 82 | % | |
| (1,556 | ) | |
| 17 | % | |
| 4,583 | |
| (+) Capex ex-maintenance | |
| 2,839 | | |
| 5,642 | | |
| -50 | % | |
| 2,885 | | |
| -2 | % | |
| 12,699 | |
| (+)
Dividend payment/Share Buyback Program | |
| 160 | | |
| 636 | | |
| -75 | % | |
| 1,402 | | |
| -89 | % | |
| 3,233 | |
| Free
cash flow – Adjusted4 | |
| 1,183 | | |
| 5,283 | | |
| -78 | % | |
| 2,732 | | |
| -57 | % | |
| 20,514 | |
1Accrual
basis, except for the Parkia deal (payment of R$1.6 billion in 2Q23) and the investment related to the Cerrado Project in 2Q23 and 3Q23,
as per note 15 (Property, Plant and Equipment) to the Financial Statements. Also considering the acquisition of Kimberly Clark Brazil's
tissue business in 2Q23 in the amount of R$ 1,073 million (operation is a business combination and not acquisition of assets).
2Considers
costs of capitalized loans paid in the amount of R$305 million in 3Q23.
3Considers
interest paid on debt and interest received on financial investments.
4Free
cash flow prior to dividend payments and capex ex-maintenance (accrual basis).
Adjusted Free Cash
Flow in 3Q23 was R$1,183 million, compared to R$5,283 million in 2Q23 and R$2,732 million in 3Q22. The decrease of 78% from the previous
quarter is mainly due to: i) working capital variation, due to lower reduction in pulp prices in relation to the delta observed in 2Q23
(2T23 vs. 1T23: -US$ 150/t | 3T23 vs. 2T23: -US$ 27/t); ii) higher concentration of interest payment in the period; iii) decrease in
positive adjustment of derivatives; and iv) lower adjusted EBITDA. These effects were partially offset mainly by lower sustaining capex
on accrual basis.
Compared to 3Q22,
the metric decreased 57% mainly due to lower adjusted EBITDA, partially offset by: i) release of working capital, mainly explained by
the reduction in accounts receivable (compared to the high consumption in this line in 3Q22, which registered an increase in pulp prices,
sales volume and average exchange rate); ii) lower sustaining capex (accrual basis); and iii) positive adjustment of derivatives.
EVOLUTION OF NET
DEBT
Following were
the changes in net debt in 3Q23:
1 Accrual
basis, except for the capex related to Cerrado Project (cash basis), as per the Cash Flow Statement. Considers the business combination
with Kimberly Clark’s tissue business in Brazil.
2Net
of exchange variations on cash and financial investments.
3Considers
amounts (cash basis) related to derivative adjustments, lease agreements and other items.
ESG
In 3Q23, the process
to approve Capex projects for Modernization started including the Internal Carbon Price, known as an instrument that quantifies the potential
of a project to reduce greenhouse gas emissions and support Suzano’s decarbonization curve. In practice, the Internal Carbon Price
is now incorporated into the Net Present Value (NPV) of projects, with a feasibility scenario. This mechanism will support the Company’s
decision-making on investment projects.
TOTAL OPERATIONAL
EXPENDITURE - PULP
As disclosed in
the Material Fact notice of February 28, 2023, total operational expenditure forecast for 2027 is approximately R$1,750 per ton
and the indicator has been evolving according to plan, considering the exchange rate and monetary premises used. Said estimate refers
to the currency in real terms of 2023.
CAPITAL MARKETS
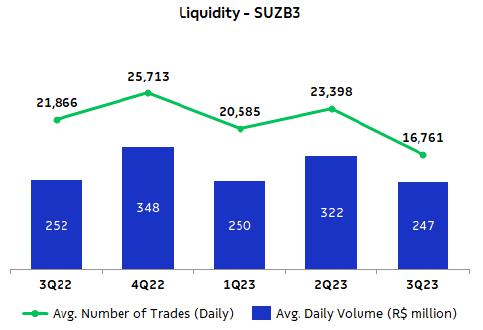
On September 30,
2023, Suzano’s stock was quoted at R$54.28/share (SUZB3) and US$10.75/share (SUZ). The Company’s stock is listed on the Novo
Mercado, the listing segment of the São Paulo Stock Exchange (B3 – Brasil, Bolsa e Balcão) with the highest corporate
governance standards, and on the New York Stock Exchange (NYSE) - Level II.

Source: Bloomberg.
Source: Bloomberg.
On September 30,
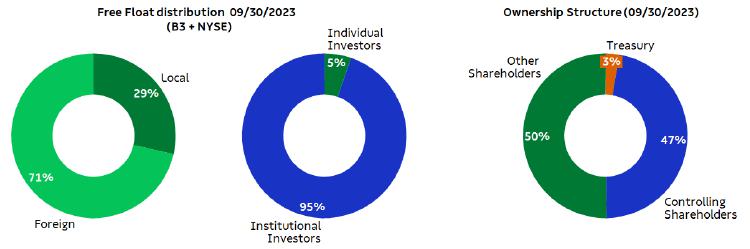
2023, the Company's capital stock was represented by 1,324,117,615 common shares, of which 34,765,600 were held in Treasury. Suzano’s
market capitalization on the same date (ex-treasury shares) stood at R$70.0 billion. Free float in 3Q23 corresponded to 50% of total
capital.
FIXED INCOME
| | |
Unit | |
Sep/23 | | |
Jun/23 | | |
Sep/22 | | |
Δ
Q-o-Q | | |
Δ
Y-o-Y | |
| Fibria 2025 – Price | |
USD/k | |
| 97.61 | | |
| 97.08 | | |
| 95.72 | | |
| 1 | % | |
| 2 | % |
| Fibria 2025 – Yield | |
% | |
| 5.96 | | |
| 6.03 | | |
| 6.04 | | |
| -1 | % | |
| -1 | % |
| Suzano 2026 – Price | |
USD/k | |
| 99.05 | | |
| 100.12 | | |
| 97.18 | | |
| -1 | % | |
| 2 | % |
| Suzano 2026 – Yield | |
% | |
| 6.12 | | |
| 5.71 | | |
| 6.60 | | |
| 7 | % | |
| -7 | % |
| Fibria 2027 – Price | |
USD/k | |
| 98.27 | | |
| 100.20 | | |
| 95.88 | | |
| -2 | % | |
| 2 | % |
| Fibria 2027 – Yield | |
% | |
| 6.08 | | |
| 5.44 | | |
| 6.62 | | |
| 12 | % | |
| -8 | % |
| Suzano 2028 – Price | |
USD/k | |
| 83.33 | | |
| 85.19 | | |
| 77.75 | | |
| -2 | % | |
| 7 | % |
| Suzano 2028 – Yield | |
% | |
| 6.49 | | |
| 5.85 | | |
| 7.16 | | |
| 11 | % | |
| -9 | % |
| Suzano 2029 – Price | |
USD/k | |
| 97.66 | | |
| 99.22 | | |
| 93.06 | | |
| -2 | % | |
| 5 | % |
| Suzano 2029 – Yield | |
% | |
| 6.53 | | |
| 6.17 | | |
| 7.40 | | |
| 6 | % | |
| -12 | % |
| Suzano 2030 – Price | |
USD/k | |
| 91.14 | | |
| 93.35 | | |
| 86.29 | | |
| -2 | % | |
| 6 | % |
| Suzano 2030 – Yield | |
% | |
| 6.75 | | |
| 6.26 | | |
| 7.47 | | |
| 8 | % | |
| -10 | % |
| Suzano 2031 – Price | |
USD/k | |
| 82.41 | | |
| 85.16 | | |
| 77.99 | | |
| -3 | % | |
| 6 | % |
| Suzano 2031 – Yield | |
% | |
| 6.86 | | |
| 6.25 | | |
| 7.34 | | |
| 10 | % | |
| -7 | % |
| Suzano 2032 – Price | |
USD/k | |
| 76.57 | | |
| 79.98 | | |
| 71.54 | | |
| -4 | % | |
| 7 | % |
| Suzano 2032 – Yield | |
% | |
| 6.88 | | |
| 6.18 | | |
| 7.42 | | |
| 11 | % | |
| -7 | % |
| Suzano 2047 – Price | |
USD/k | |
| 95.89 | | |
| 101.04 | | |
| 90.06 | | |
| -5 | % | |
| 6 | % |
| Suzano 2047 – Yield | |
% | |
| 7.37 | | |
| 6.91 | | |
| 7.93 | | |
| 7 | % | |
| -7 | % |
| Treasury 10 years | |
% | |
| 4.57 | | |
| 3.84 | | |
| 3.83 | | |
| 19 | % | |
| 19 | % |
Note: Senior Notes
issued with face value of 100 USD/k.
RATINGS
| Agency | |
National
Scale | |
Global
Scale | |
Outlook |
| Fitch Ratings | |
AAA | |
BBB- | |
Stable |
| Standard & Poor’s | |
br.AAA | |
BBB- | |
Stable |
| Moody’s | |
Aaa.br | |
Baa3 | |
Stable |
UPCOMING EVENTS
Suzano Investor
Day 2023
Date: October 27,
2023 (Friday)
| Portuguese (simultaneous translation) | |
English |
| 9 a.m. (BRT) 8 a.m. (EST) – Presentation and Q&A | |
8 a.m. (EST) 9 a.m. (BRT) – Presentation and Q&A |
| 10:30 a.m. (BRT) 9:30 a.m. (EST) – Closure | |
9:30 a.m. (EST) 10:30 a.m. (BRT) – Closure |
The highlights
of the quarter will be presented during the Suzano Investor Day 2023 event, which will be held in English with simultaneous translationin
Portuguese. Event’s agenda will consist in a presentention by Management, followed by Q&A session. The access links are available
on the Company’s Investor Relations website (www.suzano.com.br/ri).
If you are unable
to participate, the webcast link will be available for future consultation on the Investor Relations website of Suzano.
IR CONTACTS
Marcelo Bacci
Camila Nogueira
Roberto Costa
Mariana Dutra
Mariana Spinola
Luísa Puccini
Arthur Trovo
Tel.: +55 (11)
3503-9330
ri@suzano.com.br
www.suzano.com.br/ri
APPENDICES
APPENDIX 1 –
Operating Data
| Revenue
Breakdown (R$ '000) | |
| 3Q23 | | |
| 2Q23 | | |
| Δ
Q-o-Q | | |
| 3Q22 | | |
| Δ
Q-o-Q | | |
| 9M23 | | |
| 9M22 | | |
| Δ
Y-o-Y | |
| Exports | |
| 6,731,445 | | |
| 7,089,050 | | |
| -5 | % | |
| 11,930,133 | | |
| -44 | % | |
| 22,946,059 | | |
| 29,355,987 | | |
| -22 | % |
| Pulp | |
| 6,164,170 | | |
| 6,518,076 | | |
| -5 | % | |
| 11,222,662 | | |
| -45 | % | |
| 21,217,024 | | |
| 27,472,118 | | |
| -23 | % |
| Paper | |
| 567,275 | | |
| 570,974 | | |
| -1 | % | |
| 707,471 | | |
| -20 | % | |
| 1,729,035 | | |
| 1,883,869 | | |
| -8 | % |
| Domestic Market | |
| 2,216,568 | | |
| 2,070,584 | | |
| 7 | % | |
| 2,268,616 | | |
| -2 | % | |
| 6,437,971 | | |
| 6,105,252 | | |
| 5 | % |
| Pulp | |
| 440,860 | | |
| 583,192 | | |
| -24 | % | |
| 690,326 | | |
| -36 | % | |
| 1,690,353 | | |
| 1,937,291 | | |
| -13 | % |
| Paper | |
| 1,775,708 | | |
| 1,487,392 | | |
| 19 | % | |
| 1,578,290 | | |
| 13 | % | |
| 4,747,618 | | |
| 4,167,961 | | |
| 14 | % |
| Total Net Revenue | |
| 8,948,013 | | |
| 9,159,634 | | |
| -2 | % | |
| 14,198,749 | | |
| -37 | % | |
| 29,384,030 | | |
| 35,461,239 | | |
| -17 | % |
| Pulp | |
| 6,605,030 | | |
| 7,101,268 | | |
| -7 | % | |
| 11,912,988 | | |
| -45 | % | |
| 22,907,377 | | |
| 29,409,409 | | |
| -22 | % |
| Paper | |
| 2,342,983 | | |
| 2,058,366 | | |
| 14 | % | |
| 2,285,761 | | |
| 3 | % | |
| 6,476,653 | | |
| 6,051,830 | | |
| 7 | % |
| Sales
volume (‘000) | |
| 3Q23 | | |
| 2Q23 | | |
| Δ
Q-o-Q | | |
| 3Q22 | | |
| Δ
Q-o-Q | | |
| 9M23 | | |
| 9M22 | | |
| Δ
Y-o-Y | |
| Exports | |
| 2,404,086 | | |
| 2,426,241 | | |
| -1 | % | |
| 2,693,404 | | |
| -11 | % | |
| 7,183,949 | | |
| 7,547,269 | | |
| -5 | % |
| Pulp | |
| 2,308,084 | | |
| 2,341,852 | | |
| -1 | % | |
| 2,605,408 | | |
| -11 | % | |
| 6,933,668 | | |
| 7,272,663 | | |
| -5 | % |
| Paper | |
| 96,002 | | |
| 84,389 | | |
| 14 | % | |
| 87,996 | | |
| 9 | % | |
| 250,281 | | |
| 274,606 | | |
| -9 | % |
| Paperboard | |
| 5,529 | | |
| 5,185 | | |
| 7 | % | |
| 8,339 | | |
| -34 | % | |
| 15,959 | | |
| 25,594 | | |
| -38 | % |
| Printing & Writing | |
| 90,422 | | |
| 79,178 | | |
| 14 | % | |
| 79,246 | | |
| 14 | % | |
| 234,200 | | |
| 247,549 | | |
| -5 | % |
| Other paper1 | |
| 51 | | |
| 26 | | |
| 96 | % | |
| 411 | | |
| -88 | % | |
| 122 | | |
| 1,463 | | |
| -92 | % |
| Domestic Market | |
| 412,575 | | |
| 381,118 | | |
| 8 | % | |
| 434,256 | | |
| -5 | % | |
| 1,175,247 | | |
| 1,261,116 | | |
| -7 | % |
| Pulp | |
| 177,878 | | |
| 171,538 | | |
| 4 | % | |
| 191,210 | | |
| -7 | % | |
| 520,712 | | |
| 567,961 | | |
| -8 | % |
| Paper | |
| 234,697 | | |
| 209,580 | | |
| 12 | % | |
| 243,046 | | |
| -3 | % | |
| 654,535 | | |
| 693,155 | | |
| -6 | % |
| Paperboard | |
| 37,029 | | |
| 33,006 | | |
| 12 | % | |
| 41,303 | | |
| -10 | % | |
| 107,704 | | |
| 120,550 | | |
| -11 | % |
| Printing & Writing | |
| 136,054 | | |
| 143,193 | | |
| -5 | % | |
| 165,825 | | |
| -18 | % | |
| 418,747 | | |
| 468,900 | | |
| -11 | % |
| Other paper1 | |
| 61,614 | | |
| 33,381 | | |
| 85 | % | |
| 35,918 | | |
| 72 | % | |
| 128,084 | | |
| 103,705 | | |
| 24 | % |
| Total Sales Volume | |
| 2,816,661 | | |
| 2,807,359 | | |
| 0 | % | |
| 3,127,660 | | |
| -10 | % | |
| 8,359,196 | | |
| 8,808,385 | | |
| -5 | % |
| Pulp | |
| 2,485,962 | | |
| 2,513,390 | | |
| -1 | % | |
| 2,796,618 | | |
| -11 | % | |
| 7,454,380 | | |
| 7,840,624 | | |
| -5 | % |
| Paper | |
| 330,699 | | |
| 293,969 | | |
| 12 | % | |
| 331,042 | | |
| 0 | % | |
| 904,816 | | |
| 967,761 | | |
| -7 | % |
| Paperboard | |
| 42,558 | | |
| 38,191 | | |
| 11 | % | |
| 49,642 | | |
| -14 | % | |
| 123,663 | | |
| 146,144 | | |
| -15 | % |
| Printing & Writing | |
| 226,476 | | |
| 222,371 | | |
| 2 | % | |
| 245,071 | | |
| -8 | % | |
| 652,947 | | |
| 716,449 | | |
| -9 | % |
| Other paper1 | |
| 61,665 | | |
| 33,407 | | |
| 85 | % | |
| 36,329 | | |
| 70 | % | |
| 128,206 | | |
| 105,168 | | |
| 22 | % |
1Paper
of other manufacturers sold by Suzano and tissue paper.
| Average
net price (R$/ton) | |
| 3Q23 | | |
| 2Q23 | | |
| Δ
Q-o-Q | | |
| 3Q22 | | |
| Δ
Q-o-Q | | |
| 9M23 | | |
| 9M22 | | |
| Δ
Y-o-Y | |
| Exports | |
| 2,800 | | |
| 2,922 | | |
| -4 | % | |
| 4,429 | | |
| -37 | % | |
| 3,194 | | |
| 3,890 | | |
| -18 | % |
| Pulp | |
| 2,671 | | |
| 2,783 | | |
| -4 | % | |
| 4,307 | | |
| -38 | % | |
| 3,060 | | |
| 3,777 | | |
| -19 | % |
| Paper | |
| 5,909 | | |
| 6,766 | | |
| -13 | % | |
| 8,040 | | |
| -27 | % | |
| 6,908 | | |
| 6,860 | | |
| 1 | % |
| Domestic Market | |
| 5,373 | | |
| 5,433 | | |
| -1 | % | |
| 5,224 | | |
| 3 | % | |
| 5,478 | | |
| 4,841 | | |
| 13 | % |
| Pulp | |
| 2,478 | | |
| 3,400 | | |
| -27 | % | |
| 3,610 | | |
| -31 | % | |
| 3,246 | | |
| 3,411 | | |
| -5 | % |
| Paper | |
| 7,566 | | |
| 7,097 | | |
| 7 | % | |
| 6,494 | | |
| 17 | % | |
| 7,253 | | |
| 6,013 | | |
| 21 | % |
| Total | |
| 3,177 | | |
| 3,263 | | |
| -3 | % | |
| 4,540 | | |
| -30 | % | |
| 3,515 | | |
| 4,026 | | |
| -13 | % |
| Pulp | |
| 2,657 | | |
| 2,825 | | |
| -6 | % | |
| 4,260 | | |
| -38 | % | |
| 3,073 | | |
| 3,751 | | |
| -18 | % |
| Paper | |
| 7,085 | | |
| 7,002 | | |
| 1 | % | |
| 6,905 | | |
| 3 | % | |
| 7,158 | | |
| 6,253 | | |
| 14 | % |
| Average
net price (US$/ton) | |
| 3Q23 | | |
| 2Q23 | | |
| Δ
Q-o-Q | | |
| 3Q22 | | |
| Δ
Q-o-Q | | |
| 9M23 | | |
| 9M22 | | |
| Δ
Y-o-Y | |
| Exports | |
| 574 | | |
| 590 | | |
| -3 | % | |
| 844 | | |
| -32 | % | |
| 638 | | |
| 766 | | |
| -17 | % |
| Pulp | |
| 547 | | |
| 562 | | |
| -3 | % | |
| 821 | | |
| -33 | % | |
| 611 | | |
| 744 | | |
| -18 | % |
| Paper | |
| 1,211 | | |
| 1,367 | | |
| -11 | % | |
| 1,533 | | |
| -21 | % | |
| 1,379 | | |
| 1,351 | | |
| 2 | % |
| Domestic Market | |
| 1,101 | | |
| 1,098 | | |
| 0 | % | |
| 996 | | |
| 11 | % | |
| 1,094 | | |
| 953 | | |
| 15 | % |
| Pulp | |
| 508 | | |
| 687 | | |
| -26 | % | |
| 688 | | |
| -26 | % | |
| 648 | | |
| 672 | | |
| -4 | % |
| Paper | |
| 1,550 | | |
| 1,434 | | |
| 8 | % | |
| 1,238 | | |
| 25 | % | |
| 1,448 | | |
| 1,184 | | |
| 22 | % |
| Total | |
| 651 | | |
| 659 | | |
| -1 | % | |
| 865 | | |
| -25 | % | |
| 702 | | |
| 793 | | |
| -11 | % |
| Pulp | |
| 544 | | |
| 571 | | |
| -5 | % | |
| 812 | | |
| -33 | % | |
| 614 | | |
| 739 | | |
| -17 | % |
| Paper | |
| 1,452 | | |
| 1,415 | | |
| 3 | % | |
| 1,316 | | |
| 10 | % | |
| 1,429 | | |
| 1,231 | | |
| 16 | % |
| FX
Rate R$/US$ | |
| 3Q23 | | |
| 2Q23 | | |
| Δ
Q-o-Q | | |
| 3Q22 | | |
| Δ
Q-o-Q | | |
| 9M23 | | |
| 9M22 | | |
| Δ
Y-o-Y | |
| Closing | |
| 5.01 | | |
| 4.82 | | |
| 4 | % | |
| 5.41 | | |
| -7 | % | |
| 5.01 | | |
| 5.24 | | |
| -4 | % |
| Average | |
| 4.88 | | |
| 4.95 | | |
| -1 | % | |
| 5.25 | | |
| -7 | % | |
| 5.01 | | |
| 5.08 | | |
| -1 | % |
APPENDIX 2 –
Consolidated Statement of Income and Goodwill Amortization
Income
Statement
(R$ ‘000) | |
| 3Q23 | | |
| 2Q23 | | |
| Δ
Q-o-Q | | |
| 3Q22 | | |
| Δ
Y-o-Y | | |
| 9M23 | | |
| 9M22 | | |
| Δ
Y-o-Y | |
| Net Revenue | |
| 8,948,013 | | |
| 9,159,634 | | |
| -2 | % | |
| 14,198,749 | | |
| -37 | % | |
| 29,384,030 | | |
| 35,461,239 | | |
| -17 | % |
| Cost of Goods Sold | |
| (6,104,256 | ) | |
| (6,228,181 | ) | |
| -2 | % | |
| (6,472,670 | ) | |
| -6 | % | |
| (18,301,111 | ) | |
| (18,028,435 | ) | |
| 2 | % |
| Gross Debt | |
| 2,843,757 | | |
| 2,931,453 | | |
| -3 | % | |
| 7,726,079 | | |
| -63 | % | |
| 11,082,919 | | |
| 17,432,804 | | |
| -36 | % |
| Gross Margin | |
| 32 | % | |
| 32 | % | |
| 0 p.p. | | |
| 54 | % | |
| -23 p.p. | | |
| 38 | % | |
| 49 | % | |
| -11 p.p. | |
| |
| | | |
| | | |
| | | |
| | | |
| | | |
| | | |
| | | |
| | |
| Operating Expense/Income | |
| (1,160,262 | ) | |
| 137,224 | | |
| - | | |
| (778,701 | ) | |
| 49 | % | |
| (2,024,459 | ) | |
| (2,508,908 | ) | |
| -19 | % |
| Selling Expenses | |
| (653,574 | ) | |
| (626,809 | ) | |
| 4 | % | |
| (625,114 | ) | |
| 5 | % | |
| (1,884,736 | ) | |
| (1,822,822 | ) | |
| 3 | % |
| General and
Administrative Expenses | |
| (490,893 | ) | |
| (427,208 | ) | |
| 15 | % | |
| (392,663 | ) | |
| 25 | % | |
| (1,308,336 | ) | |
| (1,093,895 | ) | |
| 20 | % |
| Other Operating Income (Expenses) | |
| (9,546 | ) | |
| 1,205,293 | | |
| - | | |
| (18,562 | ) | |
| -49 | % | |
| 1,174,443 | | |
| 140,864 | | |
| - | |
| Equity Equivalence | |
| (6,249 | ) | |
| (14,052 | ) | |
| -56 | % | |
| 257,638 | | |
| -102 | % | |
| (5,830 | ) | |
| 266,945 | | |
| - | |
| EBIT | |
| 1,683,495 | | |
| 3,068,677 | | |
| -45 | % | |
| 6,947,378 | | |
| -76 | % | |
| 9,058,460 | | |
| 14,923,896 | | |
| -39 | % |
| | |
| | | |
| | | |
| | | |
| | | |
| | | |
| | | |
| | | |
| | |
| Depreciation, Amortization & Depletion | |
| 1,939,646 | | |
| 1,845,804 | | |
| 5 | % | |
| 1,902,668 | | |
| 2 | % | |
| 5,533,164 | | |
| 5,497,631 | | |
| 1 | % |
| | |
| | | |
| | | |
| | | |
| | | |
| | | |
| | | |
| | | |
| | |
| EBITDA | |
| 3,623,141 | | |
| 4,914,481 | | |
| -26 | % | |
| 8,850,046 | | |
| -59 | % | |
| 14,591,624 | | |
| 20,421,527 | | |
| -29 | % |
| EBITDA Margin (%) | |
| 40 | % | |
| 54 | % | |
| -13 p.p. | | |
| 62 | % | |
| -22 p.p. | | |
| 50 | % | |
| 58 | % | |
| -8 p.p. | |
| | |
| | | |
| | | |
| | | |
| | | |
| | | |
| | | |
| | | |
| | |
| Adjusted EBITDA1 | |
| 3,694,966 | | |
| 3,918,981 | | |
| -6 | % | |
| 8,595,987 | | |
| -57 | % | |
| 13,768,462 | | |
| 20,019,804 | | |
| -31 | % |
| Adjusted EBITDA Margin1 | |
| 41 | % | |
| 43 | % | |
| -1 p.p. | | |
| 61 | % | |
| -19 p.p. | | |
| 47 | % | |
| 56 | % | |
| -10 p.p. | |
| | |
| | | |
| | | |
| | | |
| | | |
| | | |
| | | |
| | | |
| | |
| Net Financial Result | |
| (3,494,316 | ) | |
| 4,535,679 | | |
| - | | |
| (1,527,776 | ) | |
| - | | |
| 3,511,470 | | |
| 4,432,843 | | |
| -21 | % |
| Financial Expenses | |
| 425,746 | | |
| 404,137 | | |
| 5 | % | |
| 269,505 | | |
| 58 | % | |
| 1,215,644 | | |
| 622,072 | | |
| 95 | % |
| Financial Revenues | |
| (1,175,608 | ) | |
| (1,149,041 | ) | |
| 2 | % | |
| (1,216,422 | ) | |
| -3 | % | |
| (3,483,674 | ) | |
| (3,399,945 | ) | |
| 2 | % |
| Exchange Rate Variation | |
| (864,399 | ) | |
| 2,903,766 | | |
| - | | |
| 889,628 | | |
| - | | |
| 4,034,620 | | |
| 5,510,514 | | |
| -27 | % |
| Net Proceeds Generated by Derivatives | |
| (1,880,055 | ) | |
| 2,376,817 | | |
| - | | |
| (1,470,487 | ) | |
| 28 | % | |
| 1,744,880 | | |
| 1,700,202 | | |
| 3 | % |
| Earnings Before Taxes | |
| (1,810,821 | ) | |
| 7,604,356 | | |
| - | | |
| 5,419,602 | | |
| - | | |
| 12,569,930 | | |
| 19,356,739 | | |
| -35 | % |
| | |
| | | |
| | | |
| | | |
| | | |
| | | |
| | | |
| | | |
| | |
| Income and Social Contribution Taxes | |
| 1,082,064 | | |
| (2,526,733 | ) | |
| -143 | % | |
| 28,496 | | |
| - | | |
| (2,978,271 | ) | |
| (3,420,742 | ) | |
| -13 | % |
| | |
| | | |
| | | |
| | | |
| | | |
| | | |
| | | |
| | | |
| | |
| Net Income (Loss) | |
| (728,757 | ) | |
| 5,077,623 | | |
| -114 | % | |
| 5,448,098 | | |
| -113 | % | |
| 9,591,659 | | |
| 15,935,997 | | |
| -40 | % |
| Net Margin | |
| -8 | % | |
| 55 | % | |
| -64 p.p. | | |
| 38 | % | |
| -47 p.p. | | |
| 33 | % | |
| 45 | % | |
| -12 p.p. | |
1Excluding
non-recurring items and PPA effects.

Goodwill amortization -
PPA (R$ ‘000) | |
3Q23 | | |
2Q23 | | |
Δ Q-o-Q | | |
3Q22 | | |
Δ Y-o-Y | |
| COGS | |
| (142,885 | ) | |
| (138,235 | ) | |
| 3 | % | |
| (140,861 | ) | |
| 1 | % |
| Selling Expenses | |
| (206,831 | ) | |
| (207,626 | ) | |
| 0 | % | |
| (207,740 | ) | |
| 0 | % |
| General and administrative expenses | |
| (2,456 | ) | |
| (2,457 | ) | |
| 0 | % | |
| (2,625 | ) | |
| -6 | % |
| Other operational revenues (expenses) | |
| (3,106 | ) | |
| 34,235 | | |
| - | | |
| (16,837 | ) | |
| -82 | % |
| Financial results | |
| - | | |
| - | | |
| 0 | % | |
| (4,722 | ) | |
| -100 | % |
APPENDIX 3 –
Consolidated Balance Sheet
| Assets (R$ ’000) | |
09/30/2023 | | |
06/30/2023 | | |
09/30/2022 | |
| Current Assets | |
| | | |
| | | |
| | |
| Cash and cash equivalents | |
| 5,526,463 | | |
| 11,860,415 | | |
| 6,958,161 | |
| Financial investments | |
| 14,947,272 | | |
| 7,913,730 | | |
| 10,907,907 | |
| Trade accounts receivable | |
| 6,650,210 | | |
| 6,488,192 | | |
| 8,664,852 | |
| Inventories | |
| 6,478,233 | | |
| 6,422,496 | | |
| 5,942,174 | |
| Recoverable taxes | |
| 933,616 | | |
| 747,847 | | |
| 502,163 | |
| Derivative financial instruments | |
| 2,849,012 | | |
| 3,747,881 | | |
| 2,308,110 | |
| Advance to suppliers | |
| 111,547 | | |
| 103,181 | | |
| 58,771 | |
| Dividend’s receivable | |
| - | | |
| - | | |
| - | |
| Other assets | |
| 730,267 | | |
| 778,557 | | |
| 876,603 | |
| Total Current Assets | |
| 38,226,620 | | |
| 38,062,299 | | |
| 36,218,741 | |
| | |
| | | |
| | | |
| | |
| Non-Current Assets | |
| | | |
| | | |
| | |
| Financial investments | |
| 453,301 | | |
| 441,140 | | |
| 405,956 | |
| Recoverable taxes | |
| 1,393,137 | | |
| 1,357,354 | | |
| 1,401,316 | |
| Deferred taxes | |
| 1,294,389 | | |
| 147,638 | | |
| 5,637,742 | |
| Derivative financial instruments | |
| 1,537,438 | | |
| 1,731,906 | | |
| 1,680,712 | |
| Advance to suppliers | |
| 2,113,874 | | |
| 1,981,199 | | |
| 1,487,207 | |
| Judicial deposits | |
| 354,142 | | |
| 342,017 | | |
| 364,093 | |
| Other assets | |
| 354,913 | | |
| 289,433 | | |
| 279,075 | |
| | |
| | | |
| | | |
| | |
| Biological assets | |
| 17,383,360 | | |
| 16,914,120 | | |
| 13,066,433 | |
| Investments | |
| 643,452 | | |
| 640,269 | | |
| 558,111 | |
| Property, plant and equipment | |
| 57,718,542 | | |
| 56,028,308 | | |
| 47,012,355 | |
| Right of use on lease agreements | |
| 5,267,493 | | |
| 5,230,789 | | |
| 5,105,422 | |
| Intangible | |
| 14,877,234 | | |
| 15,112,147 | | |
| 15,397,201 | |
| Total Non-Current Assets | |
| 103,391,275 | | |
| 100,216,320 | | |
| 92,395,623 | |
| Total Assets | |
| 141,617,895 | | |
| 138,278,619 | | |
| 128,614,364 | |
| Liabilities and Equity (R$ ’000) | |
| 09/30/2023 | | |
| 06/30/2023 | | |
| 09/30/2022 | |
| Current Liabilities | |
| | | |
| | | |
| | |
| Trade accounts payable | |
| 5,905,156 | | |
| 6,347,954 | | |
| 5,272,119 | |
| Loans, financing and debentures | |
| 4,619,083 | | |
| 5,532,543 | | |
| 2,850,556 | |
| Accounts payable for lease operations | |
| 755,867 | | |
| 710,906 | | |
| 654,133 | |
| Derivative financial instruments | |
| 600,355 | | |
| 483,512 | | |
| 750,396 | |
| Taxes payable | |
| 399,623 | | |
| 425,156 | | |
| 420,897 | |
| Payroll and charges | |
| 767,434 | | |
| 629,911 | | |
| 647,541 | |
| Liabilities for assets acquisitions and subsidiaries | |
| 93,167 | | |
| 101,207 | | |
| 1,919,150 | |
| Dividends payable | |
| 2,682 | | |
| 2,678 | | |
| 1,923 | |
| Advance from customers | |
| 132,668 | | |
| 74,538 | | |
| 112,915 | |
| Other liabilities | |
| 294,974 | | |
| 541,190 | | |
| 273,990 | |
| Total Current Liabilities | |
| 13,571,009 | | |
| 14,849,595 | | |
| 12,903,620 | |
| | |
| | | |
| | | |
| | |
| Non-Current Liabilities | |
| | | |
| | | |
| | |
| Loans, financing and debentures | |
| 73,931,955 | | |
| 68,999,788 | | |
| 73,209,230 | |
| Accounts payable for lease operations | |
| 5,633,226 | | |
| 5,485,078 | | |
| 5,595,755 | |
| Derivative financial instruments | |
| 2,109,636 | | |
| 1,735,204 | | |
| 4,206,646 | |
| Liabilities for assets acquisitions and subsidiaries | |
| 96,038 | | |
| 179,657 | | |
| 210,510 | |
| Provision for judicial liabilities | |
| 3,198,343 | | |
| 3,175,080 | | |
| 3,317,720 | |
| Actuarial liabilities | |
| 704,258 | | |
| 701,933 | | |
| 676,699 | |
| Deferred taxes | |
| 24,312 | | |
| 11,377 | | |
| 1,118 | |
| Share-based compensation plans | |
| 251,089 | | |
| 183,589 | | |
| 149,700 | |
| Provision for loss on investments in subsidiaries | |
| 1,134 | | |
| - | | |
| - | |
| Advance from customers | |
| 91,423 | | |
| 136,161 | | |
| 136,161 | |
| Other liabilities | |
| 127,719 | | |
| 121,144 | | |
| 149,004 | |
| Total Non-Current Liabilities | |
| 86,169,133 | | |
| 80,729,011 | | |
| 87,652,543 | |
| Total Liabilities | |
| 99,740,142 | | |
| 95,578,606 | | |
| 100,556,163 | |
| | |
| | | |
| | | |
| | |
| Shareholders’ Equity | |
| | | |
| | | |
| | |
| Share capital | |
| 9,235,546 | | |
| 9,235,546 | | |
| 9,235,546 | |
| Capital reserves | |
| 24,664 | | |
| 22,584 | | |
| 17,091 | |
| Treasury shares | |
| (1,484,014 | ) | |
| (1,381,600 | ) | |
| (2,120,324 | ) |
| Retained earnings reserves | |
| 22,690,645 | | |
| 22,690,645 | | |
| 3,040,935 | |
| Other reserves | |
| 1,637,970 | | |
| 1,650,150 | | |
| 1,766,711 | |
| Retained earnings | |
| 9,657,484 | | |
| 10,370,124 | | |
| 16,011,694 | |
| Controlling shareholders’ | |
| 41,762,295 | | |
| 42,587,449 | | |
| 27,951,653 | |
| Non-controlling interest | |
| 115,458 | | |
| 112,564 | | |
| 106,548 | |
| Total Equity | |
| 41,877,753 | | |
| 42,700,013 | | |
| 28,058,201 | |
| Total Liabilities and Equity | |
| 141,617,895 | | |
| 138,278,619 | | |
| 128,614,364 | |
APPENDIX 4 –
Consolidated Statement of Cash Flow
| Fluxo de Caixa (R$ mil) | |
3Q23 | | |
3Q22 | | |
9M23 | | |
9M22 | |
| OPERATING ACTIVITIES | |
| | | |
| | | |
| | | |
| | |
| Net income (loss) for the period | |
| (728,757 | ) | |
| 5,448,098 | | |
| 9,591,659 | | |
| 15,935,997 | |
| Depreciation, depletion and amortization | |
| 1,842,886 | | |
| 1,846,329 | | |
| 5,294,748 | | |
| 5,352,198 | |
| Depreciation of right of use | |
| 96,762 | | |
| 61,050 | | |
| 238,416 | | |
| 170,910 | |
| Sublease of ships | |
| - | | |
| - | | |
| - | | |
| (11,314 | ) |
| Interest expense on lease liabilities | |
| 110,562 | | |
| 110,769 | | |
| 333,799 | | |
| 321,366 | |
| Result from sale and disposal of property, plant and equipment and biological assets, net | |
| 62,813 | | |
| (18,586 | ) | |
| 174,008 | | |
| (26,627 | ) |
| Income (expense) from associates and joint ventures | |
| 6,249 | | |
| (257,638 | ) | |
| 5,830 | | |
| (266,945 | ) |
| Exchange rate and monetary variations, net | |
| 1,880,055 | | |
| 1,470,487 | | |
| (1,744,880 | ) | |
| (1,700,202 | ) |
| Interest expenses on financing, loans and debentures, net | |
| 1,227,912 | | |
| 1,050,589 | | |
| 3,537,499 | | |
| 2,902,537 | |
| Capitalized loan costs | |
| (305,113 | ) | |
| (97,472 | ) | |
| (816,763 | ) | |
| (206,444 | ) |
| Accrual of interest on marketable securities | |
| (312,044 | ) | |
| (208,798 | ) | |
| (841,931 | ) | |
| (487,890 | ) |
| Amortization of transaction costs | |
| 17,574 | | |
| 16,569 | | |
| 49,995 | | |
| 53,407 | |
| Derivative gains, net | |
| 864,399 | | |
| (889,628 | ) | |
| (4,034,620 | ) | |
| (5,510,514 | ) |
| Fair value adjustment of biological assets | |
| - | | |
| - | | |
| (1,256,315 | ) | |
| (171,618 | ) |
| Deferred income tax and social contribution | |
| (1,133,864 | ) | |
| (232,533 | ) | |
| 2,715,468 | | |
| 3,094,068 | |
| Interest on actuarial liabilities | |
| 17,374 | | |
| 14,827 | | |
| 51,989 | | |
| 44,443 | |
| Provision for judicial liabilities, net | |
| 18,857 | | |
| 38,716 | | |
| 81,011 | | |
| 101,717 | |
| Tax litigation reduction program | |
| - | | |
| - | | |
| 14,031 | | |
| - | |
| Provision for doubtful accounts, net | |
| 12,827 | | |
| 543 | | |
| 23,114 | | |
| 2,631 | |
| Provision for inventory losses, net | |
| 15,158 | | |
| 23,664 | | |
| 14,304 | | |
| 14,145 | |
| Provision for loss of ICMS credits, net | |
| 59,217 | | |
| 27,331 | | |
| 262,178 | | |
| 62,007 | |
| Tax credits | |
| - | | |
| 1,324 | | |
| - | | |
| 1,324 | |
| Other | |
| 18,834 | | |
| 367 | | |
| 29,328 | | |
| 7,868 | |
| Decrease (increase) in assets | |
| (272,899 | ) | |
| (3,032,293 | ) | |
| 1,828,091 | | |
| (3,411,267 | ) |
| Trade accounts receivable | |
| 13,794 | | |
| (2,538,887 | ) | |
| 2,587,427 | | |
| (2,074,641 | ) |
| Inventories | |
| 8,908 | | |
| (348,540 | ) | |
| (363,387 | ) | |
| (1,092,801 | ) |
| Recoverable taxes | |
| (283,513 | ) | |
| (173,900 | ) | |
| (619,320 | ) | |
| (342,011 | ) |
| Other assets | |
| (12,088 | ) | |
| 29,034 | | |
| 223,371 | | |
| 98,186 | |
| Increase (decrease) in liabilities | |
| 307,826 | | |
| 1,619,885 | | |
| 62,429 | | |
| 2,460,772 | |
| Trade accounts payable | |
| 169,506 | | |
| 1,352,846 | | |
| 64,470 | | |
| 2,350,136 | |
| Taxes payable | |
| 144,087 | | |
| 195,553 | | |
| 226,151 | | |
| 286,491 | |
| Payroll and charges | |
| 137,523 | | |
| 123,808 | | |
| 73,625 | | |
| 56,758 | |
| Other liabilities | |
| (143,290 | ) | |
| (52,322 | ) | |
| (301,817 | ) | |
| (232,613 | ) |
| Cash provided by operating activities | |
| 3,806,628 | | |
| 6,993,600 | | |
| 15,613,388 | | |
| 18,732,569 | |
| Payment of interest on financing, loans and debentures | |
| (1,584,454 | ) | |
| (1,499,635 | ) | |
| (3,936,938 | ) | |
| (3,419,037 | ) |
| Capitalized loan costs paid | |
| 305,113 | | |
| 97,472 | | |
| 816,763 | | |
| 206,444 | |
| Interest received on marketable securities | |
| 124,400 | | |
| 118,611 | | |
| 516,001 | | |
| 348,536 | |
| Payment of income taxes | |
| (165,961 | ) | |
| (121,671 | ) | |
| (255,443 | ) | |
| (216,064 | ) |
| Cash provided by operating activities | |
| 2,485,726 | | |
| 5,588,377 | | |
| 12,753,771 | | |
| 15,652,448 | |
| | |
| | | |
| | | |
| | | |
| | |
| INVESTING ACTIVITIES | |
| | | |
| | | |
| | | |
| | |
| Additions to property, plant and equipment | |
| (3,065,087 | ) | |
| (3,749,354 | ) | |
| (8,824,534 | ) | |
| (7,147,236 | ) |
| Additions to intangible | |
| (5,529 | ) | |
| (11,551 | ) | |
| (5,726 | ) | |
| (80,651 | ) |
| Additions to biological assets | |
| (1,433,061 | ) | |
| (1,386,878 | ) | |
| (4,332,093 | ) | |
| (3,522,875 | ) |
| Proceeds from sales of property, plant and equipment | |
| 47,804 | | |
| 67,729 | | |
| 145,216 | | |
| 166,057 | |
| Capital increase in subsidiaries and affiliates | |
| - | | |
| (5,281 | ) | |
| (35,075 | ) | |
| (32,144 | ) |
| Marketable securities, net | |
| (6,608,092 | ) | |
| 1,595,328 | | |
| (7,291,597 | ) | |
| (3,096,515 | ) |
| Advances for acquisition (receipt) of wood from operations with development and partnerships | |
| (143,834 | ) | |
| (57,146 | ) | |
| (553,858 | ) | |
| (231,636 | ) |
| Dividends received | |
| - | | |
| - | | |
| 4,869 | | |
| 6,604 | |
| Asset acquisition | |
| - | | |
| 1,699,869 | | |
| (1,615,140 | ) | |
| - | |
| Acquisition of subsidiaries | |
| 11,939 | | |
| (2,090,062 | ) | |
| (1,060,718 | ) | |
| (2,090,062 | ) |
| Net cash from acquisition of subsidiaries | |
| - | | |
| 10,590 | | |
| 5,002 | | |
| 10,590 | |
| Cash used in investing activities | |
| (11,195,860 | ) | |
| (3,926,756 | ) | |
| (23,563,654 | ) | |
| (16,017,868 | ) |
| | |
| | | |
| | | |
| | | |
| | |
| FINANCING ACTIVITIES | |
| | | |
| | | |
| | | |
| | |
| Proceeds from loans, financing and debentures | |
| 4,694,924 | | |
| 76,391 | | |
| 9,971,740 | | |
| 341,481 | |
| Receipt of derivative transactions | |
| 720,214 | | |
| (159,966 | ) | |
| 2,385,114 | | |
| 26,346 | |
| Payment of loans, financing and debentures | |
| (2,718,458 | ) | |
| (820,360 | ) | |
| (3,483,991 | ) | |
| (1,673,985 | ) |
| Payment of leases | |
| (292,841 | ) | |
| (244,247 | ) | |
| (869,973 | ) | |
| (743,619 | ) |
| Payment of dividends | |
| 3 | | |
| (17 | ) | |
| (2,412 | ) | |
| (1,801,579 | ) |
| Liabilities for assets acquisitions and subsidiaries | |
| (99,995 | ) | |
| (107,411 | ) | |
| (116,924 | ) | |
| (107,520 | ) |
| Shares repurchased | |
| (159,862 | ) | |
| (1,402,359 | ) | |
| (880,914 | ) | |
| (1,904,424 | ) |
| Cash provided (used) by financing activities | |
| 2,143,985 | | |
| (2,657,969 | ) | |
| 7,002,640 | | |
| (5,863,300 | ) |
| | |
| | | |
| | | |
| | | |
| | |
| EXCHANGE VARIATION ON CASH AND CASH EQUIVALENTS | |
| 232,197 | | |
| 242,428 | | |
| (172,245 | ) | |
| (403,895 | ) |
| | |
| | | |
| | | |
| | | |
| | |
| Increase (decrease) in cash and cash equivalents, net | |
| (6,333,952 | ) | |
| (753,920 | ) | |
| (3,979,488 | ) | |
| (6,632,615 | ) |
| At the beginning of the period | |
| 11,860,415 | | |
| 7,712,081 | | |
| 9,505,951 | | |
| 13,590,776 | |
| At the end of the period | |
| 5,526,463 | | |
| 6,958,161 | | |
| 5,526,463 | | |
| 6,958,161 | |
| Increase (decrease) in cash and cash equivalents, net | |
| (6,333,952 | ) | |
| (753,920 | ) | |
| (3,979,488 | ) | |
| (6,632,615 | ) |
APPENDIX 5 –
EBITDA
| (R$ '000, except where otherwise indicated) | |
3Q23 | | |
3Q22 | | |
9M23 | | |
9M22 | |
| Net income | |
| (728,757 | ) | |
| 5,448,098 | | |
| 9,591,659 | | |
| 15,935,997 | |
| Net Financial Result | |
| 3,494,316 | | |
| 1,527,776 | | |
| (3,511,470 | ) | |
| (4,432,843 | ) |
| Income and Social Contribution Taxes | |
| (1,082,064 | ) | |
| (28,496 | ) | |
| 2,978,271 | | |
| 3,420,742 | |
| EBIT | |
| 1,683,495 | | |
| 6,947,378 | | |
| 9,058,460 | | |
| 14,923,896 | |
| Depreciation, Amortization and Depletion | |
| 1,939,646 | | |
| 1,902,668 | | |
| 5,533,164 | | |
| 5,497,631 | |
| EBITDA1 | |
| 3,623,141 | | |
| 8,850,046 | | |
| 14,591,624 | | |
| 20,421,527 | |
| EBITDA Margin | |
| 40 | % | |
| 62 | % | |
| 50 | % | |
| 58 | % |
| | |
| | | |
| | | |
| | | |
| | |
| COVID-19 - Expenses related to social actions to combat the virus | |
| - | | |
| - | | |
| - | | |
| 178 | |
| Fair Value Update - Biological Asset | |
| - | | |
| - | | |
| (1,256,315 | ) | |
| (171,618 | ) |
| Effective loss of the development contract advance program | |
| 3,214 | | |
| - | | |
| 3,213 | | |
| - | |
| Tax credits - Exclusion of ICMS in the PIS and COFINS calculation base | |
| - | | |
| - | | |
| - | | |
| 1,324 | |
| Equity method | |
| 6,249 | | |
| (257,638 | ) | |
| 5,830 | | |
| (266,945 | ) |
| Extension of the PCHM grant | |
| - | | |
| - | | |
| - | | |
| - | |
| Provision of the Barge Contract with Norsul | |
| (11,114 | ) | |
| - | | |
| 49,737 | | |
| - | |
| Accruals for losses on ICMS credits | |
| 59,217 | | |
| 27,327 | | |
| 262,177 | | |
| 74,977 | |
| Tissue Operation Kimberley Clark Brazil | |
| 12,237 | | |
| - | | |
| 24,343 | | |
| - | |
| Income from disposal and write-off of property, plant and equipment and biological assets | |
| 2,022 | | |
| (23,748 | ) | |
| 87,853 | | |
| (39,639 | ) |
| Adjusted EBITDA | |
| 3,694,966 | | |
| 8,595,987 | | |
| 13,768,462 | | |
| 20,019,804 | |
| Adjusted EBITDA Margin | |
| 41 | % | |
| 61 | % | |
| 47 | % | |
| 56 | % |
1The
Company's EBITDA is calculated in accordance with CVM Instruction 527 of October 4, 2012.
APPENDIX 6 –
Segmented Income Statement
| |
3Q23 | | |
3Q22 | |
Segmented Financial Statement
(R$ '000) | |
Pulp | | |
Paper | | |
Non Segmented | | |
Total Consolidated | | |
Pulp | | |
Paper | | |
Non Segmented | | |
Total Consolidated | |
| Net Revenue | |
| 6,605,030 | | |
| 2,342,983 | | |
| - | | |
| 8,948,013 | | |
| 11,912,988 | | |
| 2,285,761 | | |
| - | | |
| 14,198,749 | |
| Cost of Goods Sold | |
| (4,712,452 | ) | |
| (1,391,804 | ) | |
| - | | |
| (6,104,256 | ) | |
| (5,218,062 | ) | |
| (1,254,608 | ) | |
| - | | |
| (6,472,670 | ) |
| Gross Profit | |
| 1,892,578 | | |
| 951,179 | | |
| - | | |
| 2,843,757 | | |
| 6,694,926 | | |
| 1,031,153 | | |
| - | | |
| 7,726,079 | |
| Gross Margin | |
| 29 | % | |
| 41 | % | |
| - | | |
| 32 | % | |
| 56 | % | |
| 45 | % | |
| - | | |
| 54 | % |
| | |
| | | |
| | | |
| | | |
| | | |
| | | |
| | | |
| | | |
| | |
| Operating Expense/Income | |
| (809,177 | ) | |
| (351,085 | ) | |
| - | | |
| (1,160,262 | ) | |
| (562,469 | ) | |
| (216,232 | ) | |
| - | | |
| (778,701 | ) |
| Selling Expenses | |
| (452,208 | ) | |
| (201,366 | ) | |
| - | | |
| (653,574 | ) | |
| (470,973 | ) | |
| (154,141 | ) | |
| - | | |
| (625,114 | ) |
| General and Administrative Expenses | |
| (334,279 | ) | |
| (156,614 | ) | |
| - | | |
| (490,893 | ) | |
| (280,608 | ) | |
| (112,055 | ) | |
| - | | |
| (392,663 | ) |
| Other Operating Income (Expenses) | |
| (12,367 | ) | |
| 2,821 | | |
| - | | |
| (9,546 | ) | |
| (27,404 | ) | |
| 8,842 | | |
| - | | |
| (18,562 | ) |
| Equity Equivalence | |
| (10,323 | ) | |
| 4,074 | | |
| - | | |
| (6,249 | ) | |
| 216,516 | | |
| 41,122 | | |
| - | | |
| 257,638 | |
| EBIT | |
| 1,083,401 | | |
| 600,094 | | |
| - | | |
| 1,683,495 | | |
| 6,132,457 | | |
| 814,921 | | |
| - | | |
| 6,947,378 | |
| | |
| | | |
| | | |
| | | |
| | | |
| | | |
| | | |
| | | |
| | |
| Depreciation, Amortization & Depletion | |
| 1,757,205 | | |
| 182,441 | | |
| - | | |
| 1,939,646 | | |
| 1,735,663 | | |
| 167,005 | | |
| - | | |
| 1,902,668 | |
| | |
| | | |
| | | |
| | | |
| | | |
| | | |
| | | |
| | | |
| | |
| EBITDA | |
| 2,840,606 | | |
| 782,535 | | |
| - | | |
| 3,623,141 | | |
| 7,868,120 | | |
| 981,926 | | |
| - | | |
| 8,850,046 | |
| EBITDA Margin | |
| 43 | % | |
| 33 | % | |
| - | | |
| 40 | % | |
| 66 | % | |
| 43 | % | |
| - | | |
| 62 | % |
| | |
| | | |
| | | |
| | | |
| | | |
| | | |
| | | |
| | | |
| | |
| Adjusted EBITDA1 | |
| 2,912,382 | | |
| 782,584 | | |
| - | | |
| 3,694,966 | | |
| 7,665,035 | | |
| 930,952 | | |
| - | | |
| 8,595,987 | |
| Adjusted EBITDA Margin¹ | |
| 44 | % | |
| 33 | % | |
| - | | |
| 41 | % | |
| 64 | % | |
| 41 | % | |
| - | | |
| 61 | % |
| | |
| | | |
| | | |
| | | |
| | | |
| | | |
| | | |
| | | |
| | |
| Net Financial Result | |
| - | | |
| - | | |
| (3,494,316 | ) | |
| (3,494,316 | ) | |
| - | | |
| - | | |
| (1,527,776 | ) | |
| (1,527,776 | ) |
| | |
| | | |
| | | |
| | | |
| | | |
| | | |
| | | |
| | | |
| | |
| Earnings Before Taxes | |
| 1,083,401 | | |
| 600,094 | | |
| (3,494,316 | ) | |
| (1,810,821 | ) | |
| 6,132,455 | | |
| 814,923 | | |
| (1,527,776 | ) | |
| 5,419,602 | |
| | |
| | | |
| | | |
| | | |
| | | |
| | | |
| | | |
| | | |
| | |
| Income and Social Contribution Taxes | |
| - | | |
| - | | |
| 1,082,064 | | |
| 1,082,064 | | |
| - | | |
| - | | |
| 28,496 | | |
| 28,496 | |
| | |
| | | |
| | | |
| | | |
| | | |
| | | |
| | | |
| | | |
| | |
| Net Income (Loss) | |
| 1,083,401 | | |
| 600,094 | | |
| (2,412,252 | ) | |
| (728,757 | ) | |
| 6,132,455 | | |
| 814,923 | | |
| (1,499,280 | ) | |
| 5,448,098 | |
| Net Margin | |
| 16 | % | |
| 26 | % | |
| - | | |
| -8 | % | |
| 51 | % | |
| 36 | % | |
| - | | |
| 38 | % |
1Excluding
non-recurring items and PPA effects.
| |
9M23 | | |
9M22 | |
Segmented Financial Statement
(R$ '000) | |
Pulp | | |
Paper | | |
Non Segmented | | |
Total Consolidated | | |
Pulp | | |
Paper | | |
Non Segmented | | |
Total Consolidated | |
| Net Revenue | |
| 22,907,377 | | |
| 6,476,653 | | |
| - | | |
| 29,384,030 | | |
| 29,409,409 | | |
| 6,051,830 | | |
| - | | |
| 35,461,239 | |
| Cost of Goods Sold | |
| (14,538,852 | ) | |
| (3,762,259 | ) | |
| - | | |
| (18,301,111 | ) | |
| (14,460,942 | ) | |
| (3,567,493 | ) | |
| - | | |
| (18,028,435 | ) |
| Gross Profit | |
| 8,368,525 | | |
| 2,714,394 | | |
| - | | |
| 11,082,919 | | |
| 14,948,467 | | |
| 2,484,337 | | |
| - | | |
| 17,432,804 | |
| Gross Margin | |
| 37 | % | |
| 42 | % | |
| - | | |
| 38 | % | |
| 51 | % | |
| 41 | % | |
| - | | |
| 49 | % |
| | |
| | | |
| | | |
| | | |
| | | |
| | | |
| | | |
| | | |
| | |
| Operating Expense/Income | |
| (1,408,673 | ) | |
| (615,786 | ) | |
| - | | |
| (2,024,459 | ) | |
| (1,904,736 | ) | |
| (604,172 | ) | |
| - | | |
| (2,508,908 | ) |
| Selling Expenses | |
| (1,389,718 | ) | |
| (495,018 | ) | |
| - | | |
| (1,884,736 | ) | |
| (1,375,048 | ) | |
| (447,774 | ) | |
| - | | |
| (1,822,822 | ) |
| General and Administrative Expenses | |
| (912,107 | ) | |
| (396,229 | ) | |
| - | | |
| (1,308,336 | ) | |
| (779,590 | ) | |
| (314,305 | ) | |
| - | | |
| (1,093,895 | ) |
| Other Operating Income (Expenses) | |
| 914,341 | | |
| 260,102 | | |
| - | | |
| 1,174,443 | | |
| 32,844 | | |
| 108,020 | | |
| - | | |
| 140,864 | |
| Equity Equivalence | |
| (21,189 | ) | |
| 15,359 | | |
| - | | |
| (5,830 | ) | |
| 217,058 | | |
| 49,887 | | |
| - | | |
| 266,945 | |
| EBIT | |
| 6,959,852 | | |
| 2,098,608 | | |
| - | | |
| 9,058,460 | | |
| 13,043,731 | | |
| 1,880,165 | | |
| - | | |
| 14,923,896 | |
| | |
| | | |
| | | |
| | | |
| | | |
| | | |
| | | |
| | | |
| | |
| Depreciation, Amortization & Depletion | |
| 5,036,451 | | |
| 496,713 | | |
| - | | |
| 5,533,164 | | |
| 4,992,972 | | |
| 504,659 | | |
| - | | |
| 5,497,631 | |
| | |
| | | |
| | | |
| | | |
| | | |
| | | |
| | | |
| | | |
| | |
| EBITDA | |
| 11,996,303 | | |
| 2,595,321 | | |
| - | | |
| 14,591,624 | | |
| 18,036,703 | | |
| 2,384,824 | | |
| - | | |
| 20,421,527 | |
| EBITDA Margin | |
| 52 | % | |
| 40 | % | |
| - | | |
| 50 | % | |
| 61 | % | |
| 39 | % | |
| - | | |
| 58 | % |
| | |
| | | |
| | | |
| | | |
| | | |
| | | |
| | | |
| | | |
| | |
| Adjusted EBITDA1 | |
| 11,438,362 | | |
| 2,330,100 | | |
| - | | |
| 13,768,462 | | |
| 17,849,083 | | |
| 2,170,721 | | |
| - | | |
| 20,019,804 | |
| Adjusted EBITDA Margin1 | |
| 50 | % | |
| 36 | % | |
| - | | |
| 47 | % | |
| 61 | % | |
| 36 | % | |
| - | | |
| 56 | % |
| | |
| | | |
| | | |
| | | |
| | | |
| | | |
| | | |
| | | |
| | |
| Net Financial Result | |
| - | | |
| - | | |
| 3,511,470 | | |
| 3,511,470 | | |
| - | | |
| - | | |
| 4,432,843 | | |
| 4,432,843 | |
| | |
| | | |
| | | |
| | | |
| | | |
| | | |
| | | |
| | | |
| | |
| Earnings Before Taxes | |
| 6,959,852 | | |
| 2,098,608 | | |
| 3,511,470 | | |
| 12,569,930 | | |
| 13,043,731 | | |
| 1,880,165 | | |
| 4,432,843 | | |
| 19,356,739 | |
| | |
| | | |
| | | |
| | | |
| | | |
| | | |
| | | |
| | | |
| | |
| Income and Social Contribution Taxes | |
| - | | |
| - | | |
| (2,978,271 | ) | |
| (2,978,271 | ) | |
| - | | |
| - | | |
| (3,420,742 | ) | |
| (3,420,742 | ) |
| | |
| | | |
| | | |
| | | |
| | | |
| | | |
| | | |
| | | |
| | |
| Net Income (Loss) | |
| 6,959,852 | | |
| 2,098,608 | | |
| 533,199 | | |
| 9,591,659 | | |
| 13,043,731 | | |
| 1,880,165 | | |
| 1,012,101 | | |
| 15,935,997 | |
| Net Margin | |
| 30 | % | |
| 32 | % | |
| - | | |
| 33 | % | |
| 44 | % | |
| 31 | % | |
| - | | |
| 45 | % |
1Excluding
non-recurring items and PPA effects.
Forward-Looking
Statements
This release may
contain forward-looking statements. Such statements are subject to known and unknown risks and uncertainties due to which such expectations
may not happen at all or may substantially differ from what was expected. These risks include, among others, changes in future demand
for the Company’s products, changes in factors affecting domestic and international product prices, changes in the cost structure,
changes in the seasonal patterns of markets, changes in prices charged by competitors, foreign exchange variations, changes in the political
or economic situation of Brazil, as well as emerging and international markets. The forward-looking statements were not reviewed by our
independent auditors.
Suzano (NYSE:SUZ)
過去 株価チャート
から 4 2024 まで 5 2024

Suzano (NYSE:SUZ)
過去 株価チャート
から 5 2023 まで 5 2024
