OEMs' first response to increasing inventories
is to pull the fleet lever
SANTA
MONICA, Calif., Nov. 30,
2022 /PRNewswire/ -- TrueCar, Inc. (NASDAQ:
TRUE), the easiest, most efficient and transparent online
destination for buying and selling new and used vehicles, expects
total new vehicle industry sales to reach 1,136,329 units
in November 2022, up 7% from a year ago and about on par with
October 2022, when adjusted for the
same number of selling days. This month's seasonally adjusted
annualized rate (SAAR) for total light vehicle industry sales is an
estimated 14 million, up 9% from November
2021. Excluding fleet sales, TrueCar expects U.S.
retail deliveries of new cars and light trucks to be 954,799 units,
about even from a year ago and down about 3% from October 2022.
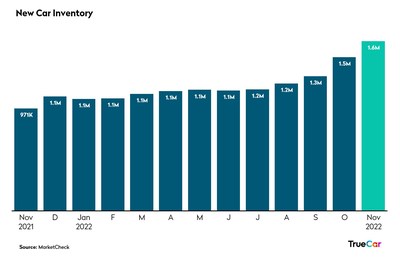
"Inventories are on pace for a fourth consecutive month of
double-digit increases. Consumers, however, continue to face
affordability challenges and high monthly payments, keeping many on
the sidelines," said Zack Krelle,
Industry Analyst at TrueCar. "To maintain sales momentum,
manufacturers appear to be shifting some of the new supply to
non-retail sales."
November fleet sales are up 68% year-over-year, and up 21% over
October.
"A TrueCar survey showed that 77% of shoppers are brand
agnostic, open to finding whichever make meets their needs. Because
incentives and price reductions have not yet materialized, there's
a larger potential for brand conquesting," said Justin Colon, Vice President of OEM Solutions at
TrueCar. "There is potential for a growth-minded OEM to lean into
this opportunity."
Additional November Industry Insights (from
TrueCar):
- Total sales for November 2022 are
expected to be up 7% from a year ago and about even with
October 2022 when adjusted for the
same number of selling days.
- Fleet sales for November 2022 are
expected to be up 68% from a year ago and up 21% from October 2022 when adjusted for the same number of
selling days.
- Average transaction price for new vehicles is projected to be
up 3% from a year ago and down 1% from October 2022.
- Total SAAR is expected to be up 9% from a year ago at 14
million units.
- Used vehicle sales for November
2022 are expected to reach almost 3 million, down 13% from a
year ago and even with October 2022.
- The average interest rate on new vehicles is 6.6% compared to
October 2022 at 6.3% and the average
interest rate on used vehicles is 9.8%.
- The average loan term on a new vehicle for November 2022 is about 70 months and the average
loan term on a used vehicle is about 71 months.
|
Total Unit Sales
|
|
|
|
Manufacturer
|
Nov 2022 Forecast
|
Nov 2021 Actual
|
Oct 2022 Actual
|
YoY % Change
|
YoY % Change
(Daily Selling Rate)
|
MoM % Change
|
MoM % Change
(Daily Selling Rate)
|
|
BMW
|
30,798
|
30,441
|
33,398
|
1.2 %
|
-2.9 %
|
-7.8 %
|
-4.1 %
|
|
Daimler
|
26,483
|
25,101
|
29,425
|
5.5 %
|
1.3 %
|
-10.0 %
|
-6.4 %
|
|
Ford
|
149,857
|
157,417
|
156,917
|
-4.8 %
|
-8.6 %
|
-4.5 %
|
-0.7 %
|
|
GM
|
199,521
|
139,618
|
201,296
|
42.9 %
|
37.2 %
|
-0.9 %
|
3.1 %
|
|
Honda
|
82,410
|
85,055
|
81,545
|
-3.1 %
|
-7.0 %
|
1.1 %
|
5.1 %
|
|
Hyundai
|
62,626
|
49,347
|
64,957
|
26.9 %
|
21.8 %
|
-3.6 %
|
0.3 %
|
|
Kia
|
56,595
|
45,318
|
58,276
|
24.9 %
|
19.9 %
|
-2.9 %
|
1.0 %
|
|
Nissan
|
64,595
|
57,625
|
66,678
|
12.1 %
|
7.6 %
|
-3.1 %
|
0.8 %
|
|
Stellantis
|
110,357
|
125,415
|
111,941
|
-12.0 %
|
-15.5 %
|
-1.4 %
|
2.5 %
|
|
Subaru
|
46,700
|
33,045
|
48,568
|
41.3 %
|
35.7 %
|
-3.8 %
|
0.0 %
|
|
Tesla
|
41,537
|
33,980
|
43,198
|
22.2 %
|
17.3 %
|
-3.8 %
|
0.0 %
|
|
Toyota
|
173,583
|
154,139
|
187,367
|
12.6 %
|
8.1 %
|
-7.4 %
|
-3.7 %
|
|
Volkswagen
Group
|
44,998
|
41,642
|
48,506
|
8.1 %
|
3.7 %
|
-7.2 %
|
-3.5 %
|
|
Industry
|
1,136,329
|
1,021,610
|
1,181,176
|
11.2 %
|
6.8 %
|
-3.8 %
|
0.1 %
|
|
Retail Unit Sales
|
|
|
|
Manufacturer
|
Nov 2022 Forecast
|
Nov 2021 Actual
|
Oct 2022 Actual
|
YoY % Change
|
YoY % Change
(Daily Selling Rate)
|
MoM % Change
|
MoM % Change
(Daily Selling Rate)
|
|
BMW
|
28,948
|
28,811
|
30,719
|
0.5 %
|
-3.5 %
|
-5.8 %
|
-2.0 %
|
|
Daimler
|
24,336
|
22,899
|
27,379
|
6.3 %
|
2.0 %
|
-11.1 %
|
-7.6 %
|
|
Ford
|
106,765
|
122,181
|
117,377
|
-12.6 %
|
-16.1 %
|
-9.0 %
|
-5.4 %
|
|
GM
|
148,007
|
125,465
|
166,418
|
18.0 %
|
13.2 %
|
-11.1 %
|
-7.5 %
|
|
Honda
|
80,327
|
84,618
|
79,266
|
-5.1 %
|
-8.9 %
|
1.3 %
|
5.4 %
|
|
Hyundai
|
61,057
|
48,706
|
64,207
|
25.4 %
|
20.3 %
|
-4.9 %
|
-1.1 %
|
|
Kia
|
54,632
|
42,539
|
56,318
|
28.4 %
|
23.3 %
|
-3.0 %
|
0.9 %
|
|
Nissan
|
56,932
|
51,233
|
54,410
|
11.1 %
|
6.7 %
|
4.6 %
|
8.8 %
|
|
Stellantis
|
76,486
|
100,611
|
89,438
|
-24.0 %
|
-27.0 %
|
-14.5 %
|
-11.1 %
|
|
Subaru
|
45,699
|
32,378
|
47,294
|
41.1 %
|
35.5 %
|
-3.4 %
|
0.5 %
|
|
Tesla
|
35,023
|
33,656
|
36,193
|
4.1 %
|
-0.1 %
|
-3.2 %
|
0.6 %
|
|
Toyota
|
155,752
|
144,204
|
167,783
|
8.0 %
|
3.7 %
|
-7.2 %
|
-3.5 %
|
|
Volkswagen
Group
|
40,363
|
40,941
|
44,314
|
-1.4 %
|
-5.4 %
|
-8.9 %
|
-5.3 %
|
|
Industry
|
954,799
|
919,212
|
1,025,020
|
3.9 %
|
-0.3 %
|
-6.9 %
|
-3.1 %
|
|
Fleet Unit Sales
|
|
|
|
Manufacturer
|
Nov 2022 Forecast
|
Nov 2021 Actual
|
Oct 2022 Actual
|
YoY % Change
|
YoY % Change
(Daily Selling Rate)
|
MoM % Change
|
MoM % Change
(Daily Selling Rate)
|
|
BMW
|
1,850
|
1,630
|
2,679
|
13.5 %
|
8.9 %
|
-31.0 %
|
-28.2 %
|
|
Daimler
|
2,147
|
2,202
|
2,046
|
-2.5 %
|
-6.4 %
|
4.9 %
|
9.1 %
|
|
Ford
|
43,092
|
35,236
|
39,540
|
22.3 %
|
17.4 %
|
9.0 %
|
13.3 %
|
|
GM
|
51,514
|
14,153
|
34,878
|
264.0 %
|
249.4 %
|
47.7 %
|
53.6 %
|
|
Honda
|
2,083
|
437
|
2,279
|
377.1 %
|
358.0 %
|
-8.6 %
|
-4.9 %
|
|
Hyundai
|
1,569
|
641
|
750
|
144.7 %
|
134.9 %
|
109.2 %
|
117.6 %
|
|
Kia
|
1,963
|
2,779
|
1,958
|
-29.4 %
|
-32.2 %
|
0.2 %
|
4.3 %
|
|
Nissan
|
7,663
|
6,392
|
12,268
|
19.9 %
|
15.1 %
|
-37.5 %
|
-35.0 %
|
|
Stellantis
|
33,871
|
24,804
|
22,503
|
36.6 %
|
31.1 %
|
50.5 %
|
56.5 %
|
|
Subaru
|
1,001
|
667
|
1,274
|
50.1 %
|
44.1 %
|
-21.4 %
|
-18.3 %
|
|
Tesla
|
6,514
|
324
|
7,005
|
1910.2 %
|
1829.8 %
|
-7.0 %
|
-3.3 %
|
|
Toyota
|
17,831
|
9,935
|
19,584
|
79.5 %
|
72.3 %
|
-9.0 %
|
-5.3 %
|
|
Volkswagen
Group
|
4,635
|
701
|
4,192
|
560.7 %
|
534.3 %
|
10.6 %
|
15.0 %
|
|
Industry
|
178,597
|
102,200
|
153,223
|
74.8 %
|
67.8 %
|
16.6 %
|
21.2 %
|
|
Fleet Penetration
|
|
Manufacturer
|
Nov 2022 Forecast
|
Nov 2021 Actual
|
Oct 2022 Actual
|
YoY % Change
|
MoM % Change
|
|
BMW
|
6.0 %
|
5.4 %
|
8.0 %
|
12.2 %
|
-25.1 %
|
|
Daimler
|
8.1 %
|
8.8 %
|
7.0 %
|
-7.6 %
|
16.6 %
|
|
Ford
|
28.8 %
|
22.4 %
|
25.2 %
|
28.5 %
|
14.1 %
|
|
GM
|
25.8 %
|
10.1 %
|
17.3 %
|
154.7 %
|
49.0 %
|
|
Honda
|
2.5 %
|
0.5 %
|
2.8 %
|
392.4 %
|
-9.6 %
|
|
Hyundai
|
2.5 %
|
1.3 %
|
1.2 %
|
92.8 %
|
117.0 %
|
|
Kia
|
3.5 %
|
6.1 %
|
3.4 %
|
-43.4 %
|
3.2 %
|
|
Nissan
|
11.9 %
|
11.1 %
|
18.4 %
|
7.0 %
|
-35.5 %
|
|
Stellantis
|
30.7 %
|
19.8 %
|
20.1 %
|
55.2 %
|
52.7 %
|
|
Subaru
|
2.1 %
|
2.0 %
|
2.6 %
|
6.2 %
|
-18.3 %
|
|
Tesla
|
15.7 %
|
1.0 %
|
16.2 %
|
1544.5 %
|
-3.3 %
|
|
Toyota
|
10.3 %
|
6.4 %
|
10.5 %
|
59.4 %
|
-1.7 %
|
|
Volkswagen
Group
|
10.3 %
|
1.7 %
|
8.6 %
|
511.4 %
|
19.2 %
|
|
Industry
|
15.7 %
|
10.0 %
|
13.0 %
|
57.1 %
|
21.2 %
|
|
Total Market Share
|
|
Manufacturer
|
Nov 2022 Forecast
|
Nov 2021 Actual
|
Oct 2022 Actual
|
|
BMW
|
2.7 %
|
3.0 %
|
2.8 %
|
|
Daimler
|
2.3 %
|
2.5 %
|
2.5 %
|
|
Ford
|
13.2 %
|
15.4 %
|
13.3 %
|
|
GM
|
17.6 %
|
13.7 %
|
17.0 %
|
|
Honda
|
7.3 %
|
8.3 %
|
6.9 %
|
|
Hyundai
|
5.5 %
|
4.8 %
|
5.5 %
|
|
Kia
|
5.0 %
|
4.4 %
|
4.9 %
|
|
Nissan
|
5.7 %
|
5.6 %
|
5.6 %
|
|
Stellantis
|
9.7 %
|
12.3 %
|
9.5 %
|
|
Subaru
|
4.1 %
|
3.2 %
|
4.1 %
|
|
Tesla
|
3.7 %
|
3.3 %
|
3.7 %
|
|
Toyota
|
15.3 %
|
15.1 %
|
15.9 %
|
|
Volkswagen
Group
|
4.0 %
|
4.1 %
|
4.1 %
|
|
95.9 %
|
95.7 %
|
95.8 %
|
|
Retail Market Share
|
|
Manufacturer
|
Nov 2022 Forecast
|
Nov 2021 Actual
|
Oct 2022 Actual
|
|
BMW
|
3.0 %
|
3.1 %
|
3.0 %
|
|
Daimler
|
2.5 %
|
2.5 %
|
2.7 %
|
|
Ford
|
11.2 %
|
13.3 %
|
11.5 %
|
|
GM
|
15.5 %
|
13.6 %
|
16.2 %
|
|
Honda
|
8.4 %
|
9.2 %
|
7.7 %
|
|
Hyundai
|
6.4 %
|
5.3 %
|
6.3 %
|
|
Kia
|
5.7 %
|
4.6 %
|
5.5 %
|
|
Nissan
|
6.0 %
|
5.6 %
|
5.3 %
|
|
Stellantis
|
8.0 %
|
10.9 %
|
8.7 %
|
|
Subaru
|
4.8 %
|
3.5 %
|
4.6 %
|
|
Tesla
|
3.7 %
|
3.7 %
|
3.5 %
|
|
Toyota
|
16.3 %
|
15.7 %
|
16.4 %
|
|
Volkswagen
Group
|
4.2 %
|
4.5 %
|
4.3 %
|
|
95.8 %
|
95.5 %
|
95.7 %
|
|
ATP
|
|
|
|
Manufacturer
|
Nov 2022 Forecast
|
Nov 2021 Actual
|
Oct 2022 Actual
|
YOY
|
MOM
|
|
BMW
|
$68,658
|
$61,769
|
$70,318
|
11.2 %
|
-2.4 %
|
|
Daimler
|
$73,959
|
$67,617
|
$71,784
|
9.4 %
|
3.0 %
|
|
Ford
|
$54,233
|
$48,709
|
$52,756
|
11.3 %
|
2.8 %
|
|
GM
|
$53,079
|
$54,388
|
$52,043
|
-2.4 %
|
2.0 %
|
|
Honda
|
$37,101
|
$35,176
|
$37,913
|
5.5 %
|
-2.1 %
|
|
Hyundai
|
$36,706
|
$35,814
|
$37,143
|
2.5 %
|
-1.2 %
|
|
Kia
|
$34,252
|
$33,620
|
$34,383
|
1.9 %
|
-0.4 %
|
|
Nissan
|
$36,964
|
$34,290
|
$37,094
|
7.8 %
|
-0.4 %
|
|
Stellantis
|
$55,408
|
$52,665
|
$54,693
|
5.2 %
|
1.3 %
|
|
Subaru
|
$35,392
|
$34,767
|
$34,855
|
1.8 %
|
1.5 %
|
|
Toyota
|
$41,297
|
$40,227
|
$39,908
|
2.7 %
|
3.5 %
|
|
Volkswagen
Group
|
$47,418
|
$44,754
|
$45,682
|
6.0 %
|
3.8 %
|
|
Industry
|
$45,290
|
$44,074
|
$44,769
|
2.8 %
|
1.2 %
|
|
$1,216
|
|
$521
|
|
|
|
Incentives
|
|
|
|
Manufacturer
|
Nov 2022 Forecast
|
Nov 2021 Actual
|
Oct 2022 Actual
|
YOY
|
MOM
|
|
BMW
|
$1,305
|
$2,786
|
$1,366
|
-53.2 %
|
-4.4 %
|
|
Daimler
|
$1,209
|
$2,427
|
$1,286
|
-50.2 %
|
-6.0 %
|
|
Ford
|
$965
|
$2,462
|
$1,020
|
-60.8 %
|
-5.4 %
|
|
GM
|
$1,334
|
$1,829
|
$1,377
|
-27.1 %
|
-3.2 %
|
|
Honda
|
$1,028
|
$1,599
|
$1,050
|
-35.7 %
|
-2.1 %
|
|
Hyundai
|
$1,056
|
$1,209
|
$855
|
-12.6 %
|
23.5 %
|
|
Kia
|
$552
|
$1,652
|
$423
|
-66.6 %
|
30.6 %
|
|
Nissan
|
$1,349
|
$1,995
|
$1,437
|
-32.4 %
|
-6.2 %
|
|
Stellantis
|
$1,604
|
$2,465
|
$1,333
|
-34.9 %
|
20.4 %
|
|
Subaru
|
$638
|
$1,058
|
$671
|
-39.7 %
|
-4.9 %
|
|
Toyota
|
$720
|
$1,257
|
$754
|
-42.7 %
|
-4.5 %
|
|
Volkswagen
Group
|
$1,650
|
$2,089
|
$1,506
|
-21.0 %
|
9.6 %
|
|
Industry
|
$1,072
|
$1,903
|
$1,060
|
-43.7 %
|
1.1 %
|
|
-$831
|
|
$12
|
|
|
|
Incentives as % of ATP
|
|
|
|
Manufacturer
|
Nov 2022 Forecast
|
Nov 2021 Actual
|
Oct 2022 Actual
|
YOY
|
MOM
|
|
BMW
|
1.9 %
|
4.5 %
|
1.9 %
|
-57.9 %
|
-2.1 %
|
|
Daimler
|
1.6 %
|
3.6 %
|
1.8 %
|
-54.5 %
|
-8.8 %
|
|
Ford
|
1.8 %
|
5.1 %
|
1.9 %
|
-64.8 %
|
-8.0 %
|
|
GM
|
2.5 %
|
3.4 %
|
2.6 %
|
-25.3 %
|
-5.1 %
|
|
Honda
|
2.8 %
|
4.5 %
|
2.8 %
|
-39.1 %
|
0.1 %
|
|
Hyundai
|
2.9 %
|
3.4 %
|
2.3 %
|
-14.8 %
|
25.0 %
|
|
Kia
|
1.6 %
|
4.9 %
|
1.2 %
|
-67.2 %
|
31.1 %
|
|
Nissan
|
3.6 %
|
5.8 %
|
3.9 %
|
-37.3 %
|
-5.8 %
|
|
Stellantis
|
2.9 %
|
4.7 %
|
2.4 %
|
-38.1 %
|
18.8 %
|
|
Subaru
|
1.8 %
|
3.0 %
|
1.9 %
|
-40.7 %
|
-6.3 %
|
|
Toyota
|
1.7 %
|
3.1 %
|
1.9 %
|
-44.2 %
|
-7.7 %
|
|
Volkswagen
Group
|
3.5 %
|
4.7 %
|
3.3 %
|
-25.4 %
|
5.6 %
|
|
Industry
|
2.4 %
|
4.3 %
|
2.4 %
|
-45.2 %
|
0.0 %
|
|
Revenue
|
|
|
|
Manufacturer
|
Nov 2022 Forecast
|
Nov 2021 Actual
|
Oct 2022 Actual
|
YOY
|
MOM
|
|
Industry
|
$51,464,397,411
|
$45,026,320,944
|
$52,880,515,204
|
14.3 %
|
-2.7 %
|
(Note: This industry insight is based solely on TrueCar,
Inc.'s analysis of domestic industry sales trends and conditions
and is not a projection of TrueCar, Inc.'s
operations.)
About TrueCar
TrueCar is a leading automotive digital
marketplace that lets auto buyers and sellers connect to our
nationwide network of Certified Dealers. With access to an
expansive inventory provided by our Certified Dealers, we are
building the industry's most personalized and efficient auto
shopping experience as we seek to bring more of the process online.
Consumers who visit our marketplace will find a suite of vehicle
discovery tools, price ratings and market context on new, used and
Certified Pre-Owned vehicles. When they are ready, shoppers in
TrueCar's marketplace can connect with a Certified Dealer in our
network, who shares our belief that truth, transparency and
fairness are the foundation of a great auto shopping experience. As
part of our marketplace, TrueCar powers auto-buying programs for
over 250 leading brands, including AARP, Sam's Club, Navy Federal
Credit Union and American Express.
For more information, please visit www.truecar.com, and
follow us on LinkedIn, Facebook or Twitter.
 View original content to download
multimedia:https://www.prnewswire.com/news-releases/truecar-releases-analysis-of-november-industry-sales-301689981.html
View original content to download
multimedia:https://www.prnewswire.com/news-releases/truecar-releases-analysis-of-november-industry-sales-301689981.html
SOURCE TrueCar.com