SANTA MONICA, Calif.,
July 29, 2021 /PRNewswire/ --
TrueCar, Inc. (NASDAQ: TRUE), the most efficient and transparent
online destination to find a car, forecasts total new vehicle
sales will reach 1,292,064 units in July 2021, up just 1%
from a year ago but down 8% vs. June
2021, when adjusted for the same number of selling days.
This month's seasonally adjusted annualized rate (SAAR) for total
light vehicle sales is an estimated 14.7 million, staying on par
with July 2020. Excluding fleet
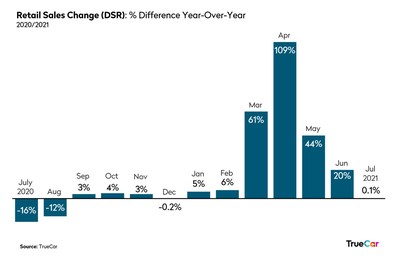
sales, TrueCar expects U.S. retail deliveries of new cars
and light trucks to be 1,171,277 units, about even with a year
ago and a decrease of 7% from June 2021.
"Increasing pressure on new car inventory continues to drive the
car buying landscape in July. Lower inventory is likely creating a
drag on sales and driving up transaction prices. It is also leading
to more would-be new car buyers opting for used cars, which in turn
is contributing to the surge in used car prices," said Nick Woolard, Lead Industry Analyst at TrueCar.
"However, there are still deals out there, and TrueCar is a great
way to navigate the current landscape and cast a wider net to find
those deals," added Woolard.
"In July we expect to see things continue to cool since the
recent new vehicle sales peak in April. Despite cooling from recent
months, many brands still show improvement compared to 2020.
Volkswagen in particular is looking strong in July, propelled in
part by the all-new Taos and ID.4
which are resonating well with buyers," said Valeri Tompkins, Senior Vice President of OEM
Solutions at TrueCar.
Additional Insights (forecast by TrueCar):
- Total sales for July 2021 are
expected to be up 1% from a year ago and down 8% from June 2021 when adjusted for the same number of
selling days.
- Fleet sales for July 2021 are
expected to be up 16% from a year ago and down 14% from
June 2021 when adjusted for the same
number of selling days.
- Incentive spend is down 36% from last year.
- Average transaction price is projected to be up 5% from a year
ago and up .2% from June 2021.
- Total SAAR is expected to remain about the same from a year ago
at 14.7 million units.
- Used vehicle sales for July 2021
are expected to reach 3.7 million, down 4% from a year ago and
about even with June 2021.
- The average interest rate on new vehicles is 4.5% and the
average interest rate on used vehicles is 7.5%.
- The average loan term on a new vehicle for July 2021 is 70 months and the average loan term
on a used vehicle is 69 months.
|
Total Unit
Sales
|
|
|
|
Manufacturer
|
Jul 2021
Forecast
|
Jul 2020
Actual
|
Jun 2021
Actual
|
YoY %
Change
|
YoY % Change
(Daily Selling Rate)
|
MoM %
Change
|
MoM %
Change
(Daily Selling Rate)
|
|
BMW
|
33,969
|
22,711
|
34,872
|
49.6%
|
44.0%
|
-2.6%
|
-9.8%
|
|
Daimler
|
24,576
|
26,850
|
24,347
|
-8.5%
|
-11.9%
|
0.9%
|
-6.5%
|
|
Ford
|
116,502
|
174,978
|
114,677
|
-33.4%
|
-35.9%
|
1.6%
|
-5.9%
|
|
GM
|
202,932
|
204,756
|
204,782
|
-0.9%
|
-4.6%
|
-0.9%
|
-8.2%
|
|
Honda
|
151,587
|
125,450
|
153,122
|
20.8%
|
16.4%
|
-1.0%
|
-8.3%
|
|
Hyundai
|
78,226
|
58,934
|
76,519
|
32.7%
|
27.8%
|
2.2%
|
-5.3%
|
|
Kia
|
68,358
|
52,479
|
68,486
|
30.3%
|
25.4%
|
-0.2%
|
-7.6%
|
|
Nissan
|
76,230
|
73,463
|
88,642
|
3.8%
|
-0.1%
|
-14.0%
|
-20.4%
|
|
Stellantis
|
140,068
|
157,025
|
136,334
|
-10.8%
|
-14.1%
|
2.7%
|
-4.9%
|
|
Subaru
|
45,685
|
51,458
|
42,877
|
-11.2%
|
-14.5%
|
6.5%
|
-1.3%
|
|
Tesla
|
23,734
|
15,800
|
22,869
|
50.2%
|
44.7%
|
3.8%
|
-3.9%
|
|
Toyota
|
206,520
|
168,791
|
209,721
|
22.4%
|
17.8%
|
-1.5%
|
-8.8%
|
|
Volkswagen
Group
|
60,973
|
47,724
|
61,251
|
27.8%
|
23.0%
|
-0.5%
|
-7.8%
|
|
Industry
|
1,292,064
|
1,227,420
|
1,300,873
|
5.3%
|
1.4%
|
-0.7%
|
-8.0%
|
|
Retail Unit
Sales
|
|
|
|
Manufacturer
|
Jul 2021
Forecast
|
Jul 2020
Actual
|
Jun 2021
Actual
|
YoY %
Change
|
YoY % Change
(Daily Selling Rate)
|
MoM %
Change
|
MoM % Change
(Daily Selling Rate)
|
|
BMW
|
33,404
|
22,341
|
34,276
|
49.5%
|
44.0%
|
-2.5%
|
-9.8%
|
|
Daimler
|
23,530
|
26,166
|
23,849
|
-10.1%
|
-13.4%
|
-1.3%
|
-8.6%
|
|
Ford
|
86,019
|
138,872
|
93,140
|
-38.1%
|
-40.4%
|
-7.6%
|
-14.5%
|
|
GM
|
173,961
|
183,945
|
178,935
|
-5.4%
|
-8.9%
|
-2.8%
|
-10.0%
|
|
Honda
|
149,962
|
124,387
|
152,480
|
20.6%
|
16.1%
|
-1.7%
|
-8.9%
|
|
Hyundai
|
72,518
|
57,530
|
70,650
|
26.1%
|
21.4%
|
2.6%
|
-5.0%
|
|
Kia
|
63,128
|
51,326
|
65,938
|
23.0%
|
18.4%
|
-4.3%
|
-11.4%
|
|
Nissan
|
67,581
|
66,400
|
73,163
|
1.8%
|
-2.0%
|
-7.6%
|
-14.5%
|
|
Stellantis
|
130,497
|
136,782
|
114,221
|
-4.6%
|
-8.1%
|
14.2%
|
5.8%
|
|
Subaru
|
44,840
|
50,436
|
41,278
|
-11.1%
|
-14.4%
|
8.6%
|
0.6%
|
|
Tesla
|
23,569
|
15,800
|
22,861
|
49.2%
|
43.6%
|
3.1%
|
-4.5%
|
|
Toyota
|
187,140
|
163,509
|
185,259
|
14.5%
|
10.2%
|
1.0%
|
-6.5%
|
|
Volkswagen
Group
|
60,184
|
47,208
|
60,350
|
27.5%
|
22.8%
|
-0.3%
|
-7.7%
|
|
Industry
|
1,171,277
|
1,127,219
|
1,170,134
|
3.9%
|
0.1%
|
0.1%
|
-7.3%
|
|
Fleet Unit
Sales
|
|
|
|
Manufacturer
|
Jul 2021
Forecast
|
Jul 2020
Actual
|
Jun 2021
Actual
|
YoY %
Change
|
YoY % Change
(Daily Selling Rate)
|
MoM %
Change
|
MoM % Change
(Daily Selling Rate)
|
|
BMW
|
565
|
370
|
596
|
52.9%
|
47.2%
|
-5.2%
|
-12.3%
|
|
Daimler
|
1,046
|
684
|
498
|
52.9%
|
47.2%
|
110.0%
|
94.5%
|
|
Ford
|
30,483
|
36,106
|
21,537
|
-15.6%
|
-18.7%
|
41.5%
|
31.1%
|
|
GM
|
28,971
|
20,811
|
25,847
|
39.2%
|
34.1%
|
12.1%
|
3.8%
|
|
Honda
|
1,625
|
1,063
|
642
|
52.9%
|
47.2%
|
153.0%
|
134.2%
|
|
Hyundai
|
5,708
|
1,404
|
5,869
|
306.6%
|
291.5%
|
-2.7%
|
-10.0%
|
|
Kia
|
5,230
|
1,153
|
2,548
|
353.6%
|
336.8%
|
105.3%
|
90.1%
|
|
Nissan
|
8,649
|
7,063
|
15,479
|
22.5%
|
17.9%
|
-44.1%
|
-48.3%
|
|
Stellantis
|
9,571
|
20,243
|
22,113
|
-52.7%
|
-54.5%
|
-56.7%
|
-59.9%
|
|
Subaru
|
845
|
1,022
|
1,599
|
-17.3%
|
-20.4%
|
-47.1%
|
-51.1%
|
|
Tesla
|
165
|
-
|
8
|
|
|
2016.2%
|
1859.5%
|
|
Toyota
|
19,380
|
5,282
|
24,462
|
266.9%
|
253.3%
|
-20.8%
|
-26.6%
|
|
Volkswagen
Group
|
789
|
516
|
901
|
52.9%
|
47.2%
|
-12.4%
|
-18.9%
|
|
Industry
|
120,787
|
100,201
|
130,739
|
20.5%
|
16.1%
|
-7.6%
|
-14.5%
|
|
Fleet
Penetration
|
|
Manufacturer
|
Jul 2021
Forecast
|
Jul 2020
Actual
|
Jun 2021
Actual
|
YoY %
Change
|
MoM %
Change
|
|
BMW
|
1.7%
|
1.6%
|
1.7%
|
2.2%
|
-2.7%
|
|
Daimler
|
4.3%
|
2.5%
|
2.0%
|
67.0%
|
108.1%
|
|
Ford
|
26.2%
|
20.6%
|
18.8%
|
26.8%
|
39.3%
|
|
GM
|
14.3%
|
10.2%
|
12.6%
|
40.5%
|
13.1%
|
|
Honda
|
1.1%
|
0.8%
|
0.4%
|
26.5%
|
155.5%
|
|
Hyundai
|
7.3%
|
2.4%
|
7.7%
|
206.3%
|
-4.9%
|
|
Kia
|
7.7%
|
2.2%
|
3.7%
|
248.3%
|
105.7%
|
|
Nissan
|
11.3%
|
9.6%
|
17.5%
|
18.0%
|
-35.0%
|
|
Stellantis
|
6.8%
|
12.9%
|
16.2%
|
-47.0%
|
-57.9%
|
|
Subaru
|
1.8%
|
2.0%
|
3.7%
|
-6.9%
|
-50.4%
|
|
Tesla
|
0.7%
|
0.0%
|
0.0%
|
|
1939.1%
|
|
Toyota
|
9.4%
|
3.1%
|
11.7%
|
199.9%
|
-19.5%
|
|
Volkswagen
Group
|
1.3%
|
1.1%
|
1.5%
|
19.6%
|
-12.1%
|
|
Industry
|
9.3%
|
8.2%
|
10.1%
|
14.5%
|
-7.0%
|
|
Total Market
Share
|
|
Manufacturer
|
Jul 2021
Forecast
|
Jul 2020
Actual
|
Jun 2021
Actual
|
|
BMW
|
2.6%
|
1.9%
|
2.7%
|
|
Daimler
|
1.9%
|
2.2%
|
1.9%
|
|
Ford
|
9.0%
|
14.3%
|
8.8%
|
|
GM
|
15.7%
|
16.7%
|
15.7%
|
|
Honda
|
11.7%
|
10.2%
|
11.8%
|
|
Hyundai
|
6.1%
|
4.8%
|
5.9%
|
|
Kia
|
5.3%
|
4.3%
|
5.3%
|
|
Nissan
|
5.9%
|
6.0%
|
6.8%
|
|
Stellantis
|
10.8%
|
12.8%
|
10.5%
|
|
Subaru
|
3.5%
|
4.2%
|
3.3%
|
|
Tesla
|
1.8%
|
1.3%
|
1.8%
|
|
Toyota
|
16.0%
|
13.8%
|
16.1%
|
|
Volkswagen
Group
|
4.7%
|
3.9%
|
4.7%
|
|
95.1%
|
96.2%
|
95.2%
|
|
Retail Market
Share
|
|
Manufacturer
|
Jul 2021
Forecast
|
Jul 2020
Actual
|
Jun 2021
Actual
|
|
BMW
|
2.9%
|
2.0%
|
2.9%
|
|
Daimler
|
2.0%
|
2.3%
|
2.0%
|
|
Ford
|
7.3%
|
12.3%
|
8.0%
|
|
GM
|
14.9%
|
16.3%
|
15.3%
|
|
Honda
|
12.8%
|
11.0%
|
13.0%
|
|
Hyundai
|
6.2%
|
5.1%
|
6.0%
|
|
Kia
|
5.4%
|
4.6%
|
5.6%
|
|
Nissan
|
5.8%
|
5.9%
|
6.3%
|
|
Stellantis
|
11.1%
|
12.1%
|
9.8%
|
|
Subaru
|
3.8%
|
4.5%
|
3.5%
|
|
Tesla
|
2.0%
|
1.4%
|
2.0%
|
|
Toyota
|
16.0%
|
14.5%
|
15.8%
|
|
Volkswagen
Group
|
5.1%
|
4.2%
|
5.2%
|
|
95.3%
|
96.2%
|
95.4%
|
|
ATP
|
|
|
|
Manufacturer
|
Jul 2021
Forecast
|
Jul 2020
Actual
|
Jun 2021
Actual
|
YOY
|
MOM
|
|
BMW
|
$57,024
|
$58,212
|
$58,570
|
-2.0%
|
-2.6%
|
|
Daimler
|
$56,048
|
$60,586
|
$56,585
|
-7.5%
|
-0.9%
|
|
Ford
|
$46,626
|
$43,304
|
$44,561
|
7.7%
|
4.6%
|
|
GM
|
$44,749
|
$41,068
|
$44,408
|
9.0%
|
0.8%
|
|
Honda
|
$31,149
|
$30,058
|
$31,075
|
3.6%
|
0.2%
|
|
Hyundai
|
$31,074
|
$28,808
|
$30,333
|
7.9%
|
2.4%
|
|
Kia
|
$28,085
|
$24,887
|
$27,783
|
12.9%
|
1.1%
|
|
Nissan
|
$31,258
|
$28,435
|
$30,945
|
9.9%
|
1.0%
|
|
Stellantis
|
$47,943
|
$42,206
|
$47,412
|
13.6%
|
1.1%
|
|
Subaru
|
$31,276
|
$30,292
|
$31,887
|
3.2%
|
-1.9%
|
|
Toyota
|
$35,264
|
$34,012
|
$35,398
|
3.7%
|
-0.4%
|
|
Volkswagen
Group
|
$41,614
|
$40,186
|
$42,050
|
3.6%
|
-1.0%
|
|
Industry
|
$38,188
|
$36,432
|
$38,097
|
4.8%
|
0.2%
|
|
Incentives
|
|
|
|
Manufacturer
|
Jul 2021
Forecast
|
Jul 2020
Actual
|
Jun 2021
Actual
|
YOY
|
MOM
|
|
BMW
|
$4,269
|
$5,479
|
$4,452
|
-22.1%
|
-4.1%
|
|
Daimler
|
$3,226
|
$5,560
|
$3,280
|
-42.0%
|
-1.6%
|
|
Ford
|
$2,251
|
$4,075
|
$2,479
|
-44.8%
|
-9.2%
|
|
GM
|
$3,336
|
$5,561
|
$4,023
|
-40.0%
|
-17.1%
|
|
Honda
|
$1,985
|
$2,661
|
$2,096
|
-25.4%
|
-5.3%
|
|
Hyundai
|
$1,720
|
$2,442
|
$1,884
|
-29.6%
|
-8.7%
|
|
Kia
|
$2,265
|
$3,711
|
$2,603
|
-39.0%
|
-13.0%
|
|
Nissan
|
$3,112
|
$4,556
|
$3,025
|
-31.7%
|
2.8%
|
|
Stellantis
|
$2,827
|
$4,763
|
$2,812
|
-40.6%
|
0.6%
|
|
Subaru
|
$1,345
|
$1,855
|
$1,395
|
-27.5%
|
-3.6%
|
|
Toyota
|
$1,882
|
$2,733
|
$1,916
|
-31.1%
|
-1.8%
|
|
Volkswagen
Group
|
$3,381
|
$4,508
|
$3,421
|
-25.0%
|
-1.2%
|
|
Industry
|
$2,529
|
$3,986
|
$2,732
|
-36.5%
|
-7.4%
|
|
Incentives as % of
ATP
|
|
|
|
Manufacturer
|
Jul 2021
Forecast
|
Jul 2020
Actual
|
Jun 2021
Actual
|
YOY
|
MOM
|
|
BMW
|
7.5%
|
9.4%
|
7.6%
|
-20.5%
|
-1.5%
|
|
Daimler
|
5.8%
|
9.2%
|
5.8%
|
-37.3%
|
-0.7%
|
|
Ford
|
4.8%
|
9.4%
|
5.6%
|
-48.7%
|
-13.2%
|
|
GM
|
7.5%
|
13.5%
|
9.1%
|
-44.9%
|
-17.7%
|
|
Honda
|
6.4%
|
8.9%
|
6.7%
|
-28.0%
|
-5.5%
|
|
Hyundai
|
5.5%
|
8.5%
|
6.2%
|
-34.7%
|
-10.9%
|
|
Kia
|
8.1%
|
14.9%
|
9.4%
|
-45.9%
|
-13.9%
|
|
Nissan
|
10.0%
|
16.0%
|
9.8%
|
-37.9%
|
1.8%
|
|
Stellantis
|
5.9%
|
11.3%
|
5.9%
|
-47.7%
|
-0.6%
|
|
Subaru
|
4.3%
|
6.1%
|
4.4%
|
-29.8%
|
-1.7%
|
|
Toyota
|
5.3%
|
8.0%
|
5.4%
|
-33.6%
|
-1.4%
|
|
Volkswagen
Group
|
8.1%
|
11.2%
|
8.1%
|
-27.6%
|
-0.1%
|
|
Industry
|
6.6%
|
10.9%
|
7.2%
|
-39.5%
|
-7.6%
|
|
Revenue
|
|
|
|
Manufacturer
|
Jul 2021
Forecast
|
Jul 2020
Actual
|
Jun 2021
Actual
|
YOY
|
MOM
|
|
Industry
|
$49,341,554,560
|
$44,717,708,837
|
$49,559,399,807
|
10.3%
|
-0.4%
|
(Note: This forecast is based solely on TrueCar, Inc.'s
analysis of industry sales trends and conditions and is not a
projection of TrueCar, Inc.'s operations.)
About TrueCar
TrueCar is a leading automotive digital marketplace that
enables car buyers to connect to our nationwide network of
Certified Dealers. We are building the industry's most personalized
and efficient car buying experience as we seek to bring more of the
purchasing process online. Consumers who visit our marketplace will
find a suite of vehicle discovery tools, price ratings, and market
context on new and used cars – all with a clear view of what's a
great deal. When they are ready, TrueCar will enable them
to connect with a local Certified Dealer who shares in our belief
that truth, transparency, and fairness are the foundation of a
great car buying experience. As part of our marketplace, TrueCar
powers car-buying programs for over 250 leading brands, including
AARP, Sam's Club, and American Express. Nearly half of all
new-car buyers engage with TrueCar powered sites, where
they buy smarter and drive happier. TrueCar is
headquartered in Santa Monica, California, with an office in Austin,
Texas.
For more information, please visit www.truecar.com, and
follow us on Facebook or Twitter.
 View original content to download
multimedia:https://www.prnewswire.com/news-releases/truecar-forecasts-third-consecutive-month-of-slowing-vehicle-sales-for-july-2021-301344103.html
View original content to download
multimedia:https://www.prnewswire.com/news-releases/truecar-forecasts-third-consecutive-month-of-slowing-vehicle-sales-for-july-2021-301344103.html
SOURCE TrueCar, Inc.