UNITED STATES
SECURITIES AND EXCHANGE COMMISSION
Washington, D.C.
20549
Form 6-K
REPORT OF FOREIGN
PRIVATE ISSUER PURSUANT TO RULE 13a-16 OR 15d-16
UNDER THE SECURITIES EXCHANGE ACT OF 1934
For the month
of July 2024
Commission File
No. 001-35193
Grifols, S.A.
(Translation of
registrant’s name into English)
Avinguda de la
Generalitat, 152-158
Parc de Negocis
Can Sant Joan
Sant Cugat del
Valles 08174
Barcelona, Spain
(Address of registrant’s
principal executive office)
Indicate by check mark whether the registrant
files or will file annual reports under cover Form 20-F or Form 40-F.
Form 20-F
x Form 40-F
¨
Grifols, S.A.
TABLE OF CONTENTS

Half
Year 2024 Results
Grifols
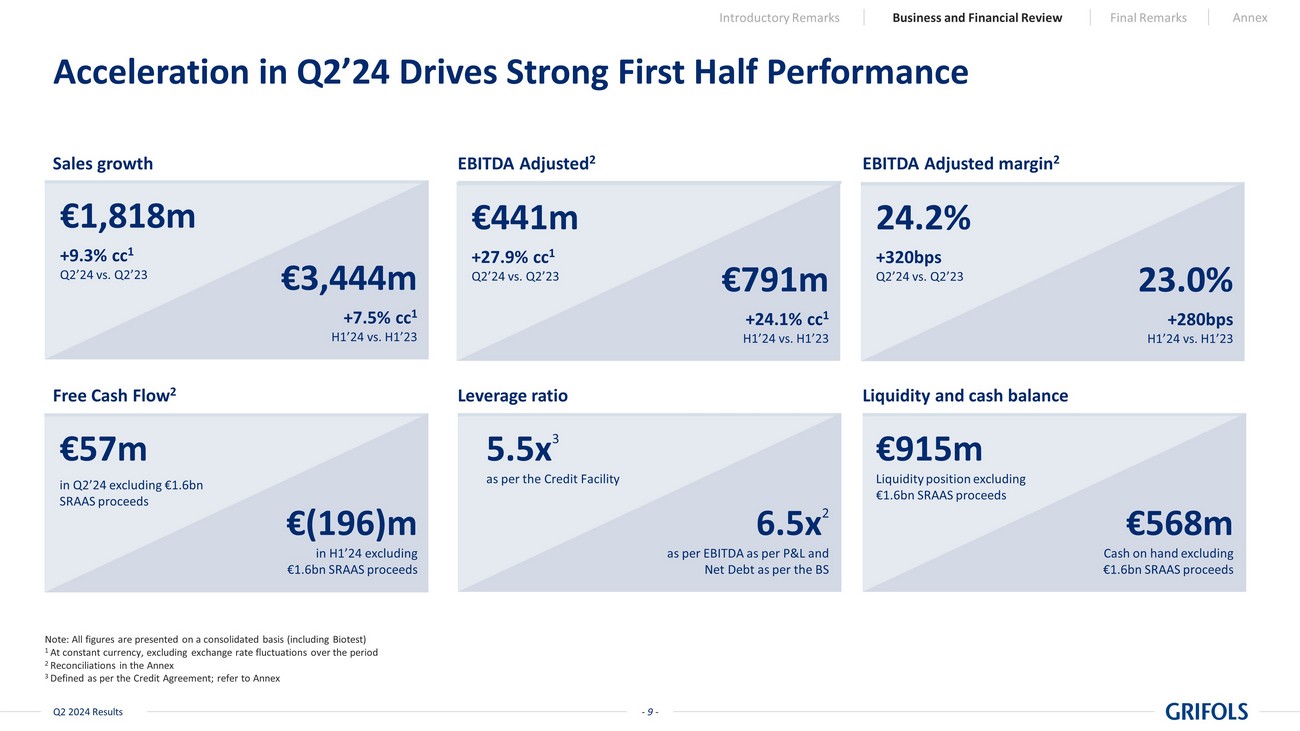
Accelerates Performance in Q2 and Reaffirms Full Year Guidance
| • | The
second quarter delivers revenue growth of 9.3% cc1 to EUR 1,818 million, driving
the total for H1’24 to EUR 3,444 million, a 7.5% cc increase as compared to H1'23, with all Business Units
fueling this growth |
| • | Adjusted
EBITDA grew 28% cc to reach EUR 441 million (a 24.2% margin) in Q2’24, contributing
to EUR 791 million and a 23.0% margin in H1’24 |
| • | Positive
free cash flow (EUR 57 million) in Q2’24 driven by working capital optimization |
| • | Reported
net profit turned positive to EUR 36 million in H1’24, increasing by EUR 106 million
compared to H1’23. Net income excl. one-offs amounted to EUR 152 million |
| • | Leverage ratio declined to 5.5x, driven by EBITDA
improvement and the €1.6 billion cash inflow from the SRAAS divestment completed in
June |
| • | Reaffirmed
guidance for 2024 |
Barcelona, Spain
– July 30, 2024 – Grifols (MCE:GRF, MCE:GRF.P, NASDAQ:GRFS), a global healthcare company and leading manufacturer
of plasma-derived medicines, today reported solid financial results for the first half of 2024 on the back of a strong second quarter.
Thomas Glanzmann,
Executive Chairman, remarked, “We are pleased to have delivered strong quarterly performance and to reaffirm our guidance for
the full year 2024. We remain focused on strengthening our governance and executing our strategy, including debt management. The successful
closing of the SRAAS deal, as part of the strategic alliance with Haier, serves as a testament to this, and we expect it will also drive
opportunities in China’s fast-growing plasma and diagnostics market.”
Nacho Abia,
Chief Executive Officer, added, “Thanks to the hard work of the Grifols team, I’m pleased to report that in the second
quarter we achieved positive free cash flow, significant sequential EBITDA expansion and near double-digit revenue growth. As we move
into the second half of the year, we remain laser-focused on implementing our disciplined approach to operational excellence and cost
management to further improve free cash flow generation and deliver sustainable profitability.”
Business Segment
Performance
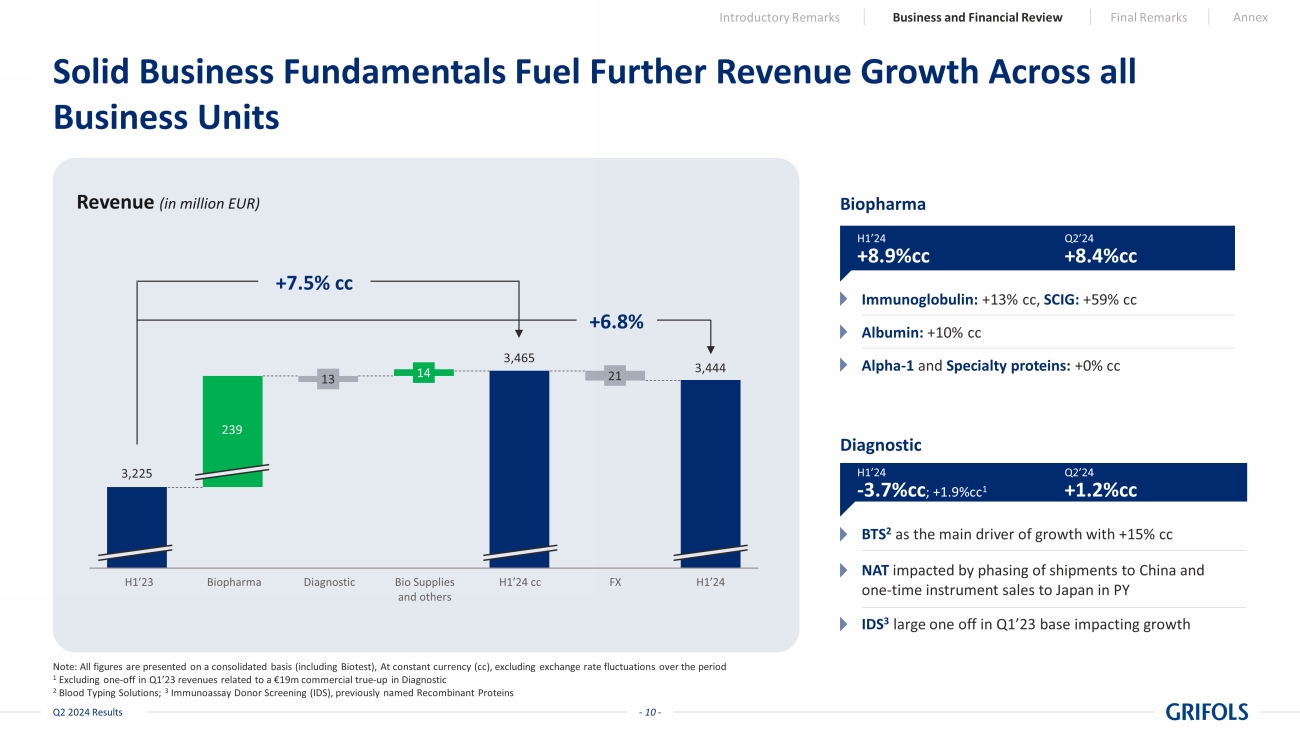
In the first half
of 2024, total revenue reached EUR 3,444 million, a year-over-year increase of 7.5% cc, on the back of an accelerated growth in the second
quarter of +9.3% cc spread across all Business Units.
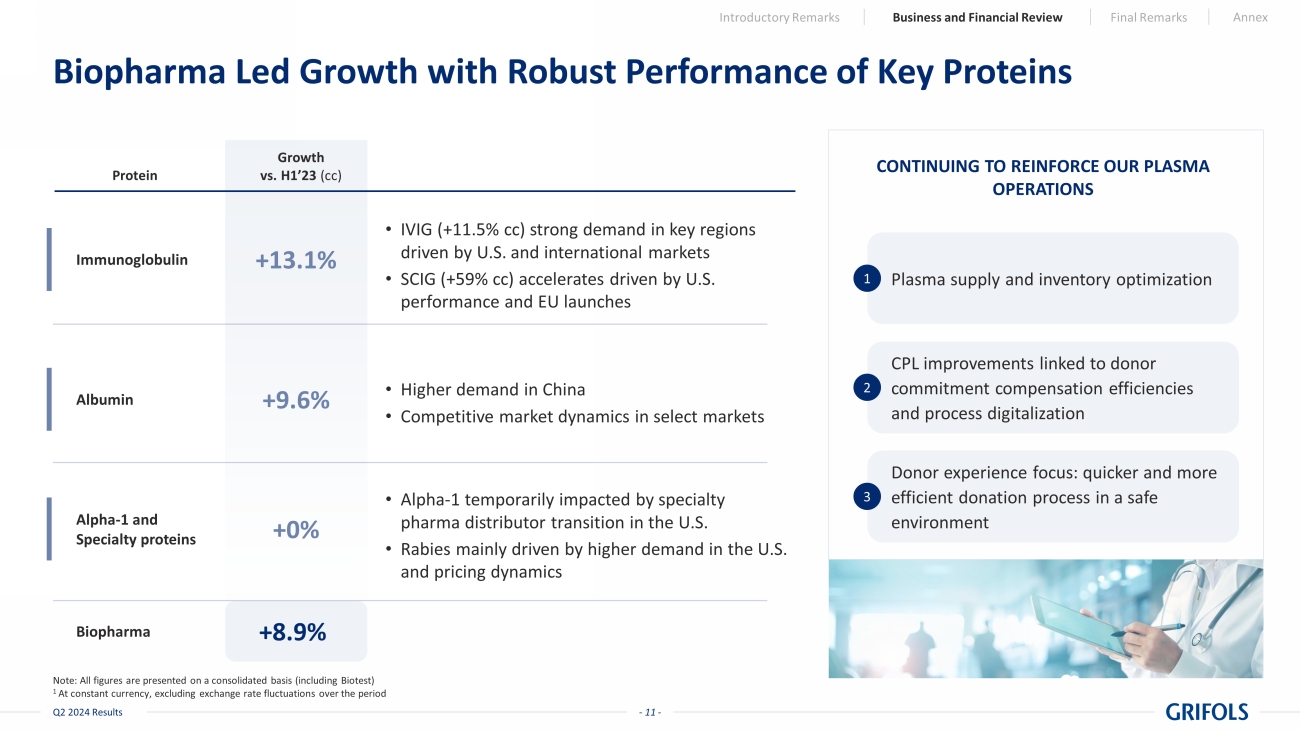
Biopharma
delivered 8.9% cc growth in the first half of 2024 with an 8.4% growth in the second quarter. The immunoglobulin franchise grew by 13.1%
cc in the first six months of the year (+13.7% cc in the quarter), supported by increasing demand in key regions and continued strong
adoption of our subcutaneous immunoglobulin, Xembify®, which surged almost 60% cc in the first half, driven by its performance
in the U.S. and its successful commercialization in European countries.
Note: For comparative
purposes with H1'24, the financial statements for H1'23 have been re-expressed according to the Inside Information released on July 30,
2024, and further disclosed in accordance with Note 2(d) of the Consolidated Interim Financial Statements for H1'24
1 Operating or constant
currency (cc) excludes changes rate variations reported in the period
Additionally, albumin
revenues grew by 9.6% cc (+11.9% in the quarter) driven by increased demand in China. Alpha-1 and Specialty proteins were flat including
the strategic switch of specialty pharma partner in the U.S. during Q2’24 to strengthen the value proposition for Alpha-1 patients
for the future.
Diagnostic
sales amounted to EUR 322 million in the first half of the year, increasing by 1.9% cc like-for-like2 (-3.7% cc reported)
and driven by a 1.2% cc uptick in the second quarter on the back of strong Blood Typing Solutions (+14.0% cc) and Immunoassay Donor Screening
(+7.6% cc).
Bio Supplies’
revenue increase by 32.6% cc resulting in EUR 110 million for the first half of 2024.
Plasma supply
continued to increase in the first half of 2024, while cost per liter (CPL) stabilized in the second quarter following a 2% decline in
March 2024 compared to December 2023, which added up to the 22% drop since the peak of July 2022. Overall, outlook for
plasma remains positive, with significant opportunities for further cost reductions triggered by current initiatives focused on increasing
efficiencies, streamlining operations and digitization.
Financial
Performance and Leverage
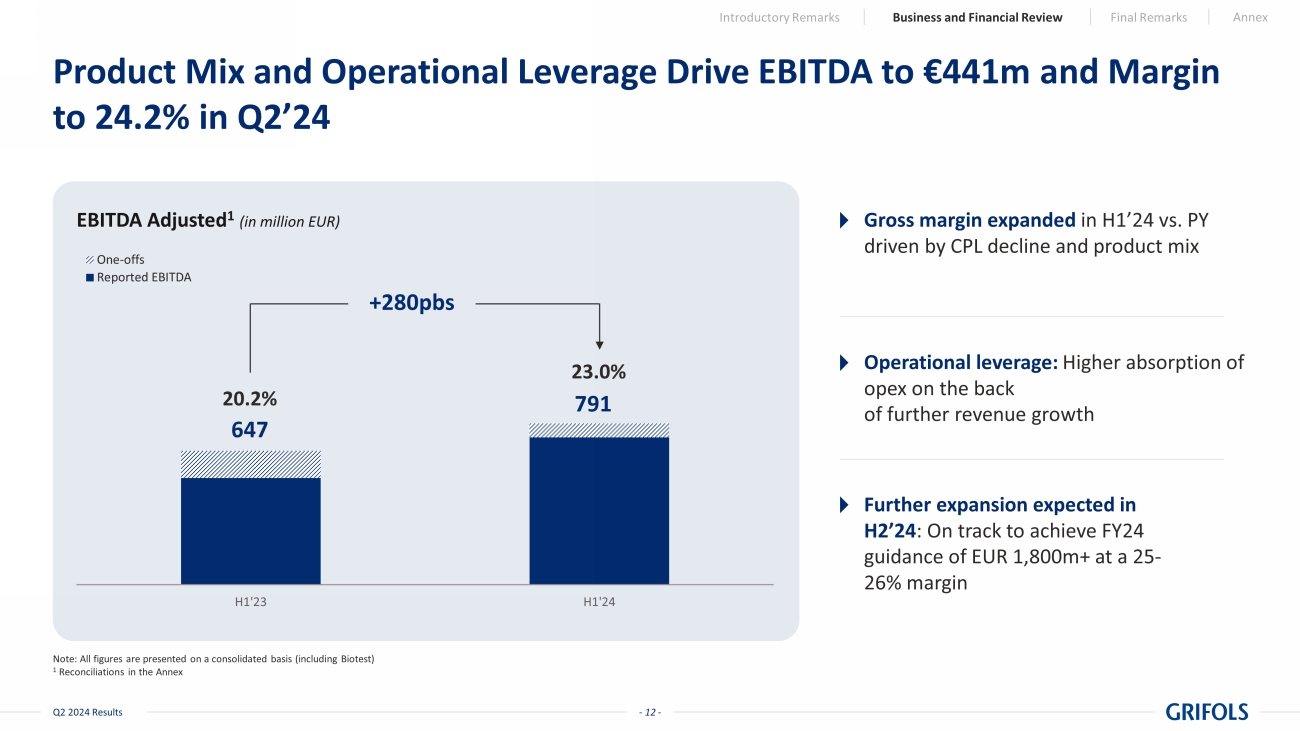
Adjusted EBITDA
for the second quarter of 2024 amounted to EUR 441 million, with a 24.2% margin and a 27.9% growth at constant currency. For the
first half of the year, it reached EUR 791 million, achieving a 23.0% margin and a 24.1% growth at constant currency. This performance
reflects strong operational execution, cost-per-liter reduction in the second half of 2023, and higher fixed-cost absorption in the first
half of 2024.
Reported EBITDA
for the second quarter reached EUR 414 million and EUR 724 million in the first half, with margins of 22.8% and 21.0%, respectively.
Reported EBITDA for the first half mainly included EUR 44 million of non-recurring transaction and restructuring costs and EUR 22 million
from the Biotest Next Level (BNL) project3.
Reported net
profit turned positive to EUR 36 million in the first half of 2024 from negative EUR (70) million in the same period last year. Net income excl. one-offs amounted to EUR 152 million.
Free cash flow
generation continues to be Grifols’ top priority. Positive free cash flow of EUR 57 million in the second quarter is indicative
of the significant sequential improvement expected throughout the year. Working capital improvements, driven by optimized inventory levels,
were the largest contributors to the strong free cash flows in the quarter.
Deleveraging
remains a key priority for Grifols, and the company made significant progress in the second quarter using the proceeds from the successfully
completed SRAAS transaction to lower the company’s leverage ratio to 5.5x.
2
Excluding the EUR 19 million commercial true-up in Immunoassay Donor Screening (formerly
Recombinant proteins) from the first quarter of 2023
3 Biotest Next Level (BNL)
is a one-off project aimed to increase production capacity in Dreieich, Germany
Net financial
debt as per the Credit Facility stood at EUR 8,262 million. This amount does not include the impact of the financial obligations
related to leasing, primarily of plasma centers (IFRS 16) – the related impact is EUR 1,134 million as of June 30, 2024. Therefore,
net financial debt as per Balance Sheet was EUR 9,396 million.
As of June 30, 2024, and
excluding the EUR 1.6 billion net proceeds from the SRAAS transaction, Grifols had a liquidity position of EUR 915 million, with
a cash position of EUR 568 million.
FY24
Guidance
| REVENUE (at cc) | |
|
| Total revenue growth | |
7%+ |
| Biopharma revenue growth | |
8-10% |
| | |
|
| EBITDA adjusted |
| EBITDA adjusted | |
EUR 1,800m+ |
| EBITDA adjusted margin | |
25-26% |
Financial
Metrics
| (in million EUR) | |
Q2’24 | | |
% vs. PY
reported | | |
% vs. PY
cc | | |
H1’24 | | |
% vs. PY
reported | | |
% vs. PY
cc | |
| Total revenue | |
| 1,818 | m | |
| +9.3 | % | |
| +9.3 | % | |
| 3,444 | m | |
| +6.8 | % | |
| +7.5 | % |
| EBITDA Adjusted | |
| 441 | m | |
| +26.3 | % | |
| +27.9 | % | |
| 791 | m | |
| +22.2 | % | |
| +24.1 | % |
| EBITDA margin Adjusted | |
| 24.2 | % | |
| +320bps | | |
| - | | |
| 23.0 | % | |
| +280bps | | |
| - | |
| Free Cash Flow | |
| 57 | m | |
| - | | |
| - | | |
| (196 | )m | |
| - | | |
| - | |
| Leverage Ratio | |
| 5.5 | x | |
| - | | |
| - | | |
| 5.5 | x | |
| - | | |
| - | |
| Liquidity | |
| 915 | m | |
| - | | |
| - | | |
| 915 | m | |
| - | | |
| - | |
| Net profit | |
| 15 | m | |
| -61.1 | % | |
| - | | |
| 36 | m | |
| n/a | | |
| - | |
| Net profit excl. one-offs | |
| 105 | m | |
| +127.1 | % | |
| - | | |
| 152 | m | |
| +328.7 | % | |
| - | |
Note: All figures are consolidated, including Biotest. Leverage ratio definitions as per Credit Facility
Alternative Performance
Measures (APMs)
This document contains
the following Alternative Performance Measures (APMs): Consolidated EBITDA Reported, Consolidated EBITDA Adjusted, Leverage Ratio as
per the Credit Facility, Net Debt as per the Credit Facility, Free Cash Flow, Working Capital, and non-recurring items. For further details
on the definition, explanation on the use, and reconciliation of APMs, please see the Appendix of the Presentation as well as the “Alternative
Performance Measures” document from our website www.grifols.com/en/investors.
CONFERENCE CALL
Grifols will host
a conference call today, Tuesday, July 30, 2024, at 6:30 pm CET / 12:30 pm EST to provide a Business Update and its Half Year 2024
Financial Results. To view and listen to the webcast and view the presentation, click on Grifols Q2’24 Results or visit
the website www.grifols.com/en/investors. Participants are advised to register in advance of the conference call.
The transcript
and webcast replay of the call will be available on the web site at www.grifols.com/en/investors within 24 hours after the end
of the live conference call.
INVESTORS:
Investors
Relations & Sustainability
inversores@grifols.com
- investors@grifols.com
sostenibilidad@grifols.com
- sustainability@grifols.com
Tel. +34 93 571
02 21
MEDIA CONTACTS:
Grifols
Press Office
media@grifols.com
/ Tel. +34 93 571 00 02 |
Spain
Duomo Comunicación
Tel.: +34 91
311 92 89 – +34 91 311 92 90
Raquel Lumbreras
(M. +34 659 572 185)
Raquel_lumbreras@duomocomunicacion.com
Borja Gómez
(M. +34 650 402 225)
Borja_gomez@duomocomunicacion.com |
About Grifols
Grifols is a global
healthcare company founded in Barcelona in 1909 committed to improving the health and well-being of people around the world. A leader
in essential plasma-derived medicines and transfusion medicine, the company develops, produces, and provides innovative healthcare services
and solutions in more than 110 countries.
Patient needs and
Grifols’ ever-growing knowledge of many chronic, rare and prevalent conditions, at times life-threatening, drive the company’s
innovation in both plasma and other biopharmaceuticals to enhance quality of life. Grifols is focused on treating conditions across a
broad range of therapeutic areas: immunology, hepatology and intensive care, pulmonology, hematology, neurology, and infectious diseases.
A pioneer in the
plasma industry, Grifols continues to grow its network of donation centers, the world’s largest with over 390 across North America,
Europe, Africa and the Middle East, and China.
As a recognized
leader in transfusion medicine, Grifols offers a comprehensive portfolio of solutions designed to enhance safety from donation to transfusion,
in addition to clinical diagnostic technologies. It provides high-quality biological supplies for life-science research, clinical trials,
and for manufacturing pharmaceutical and diagnostic products. The company also supplies tools, information and services that enable hospitals,
pharmacies and healthcare professionals to efficiently deliver expert medical care.
Grifols, with more
than 23,000 employees in more than 30 countries and regions, is committed to a sustainable business model that sets the standard for
continuous innovation, quality, safety, and ethical leadership.
In 2023, Grifols’
economic impact in its core countries of operation was EUR 9.6 billion. The company also generated 193,000 jobs, including indirect and
induced.
The company’s
class A shares are listed on the Spanish Stock Exchange, where they are part of the Ibex-35 (MCE:GRF). Grifols non-voting class B shares
are listed on the Mercado Continuo (MCE:GRF.P) and on the U.S. NASDAQ through ADRs (NASDAQ:GRFS). For more information about Grifols,
please visit www.grifols.com
Forward-Looking
Statements
This note contains
forward-looking information and statements about Grifols based on current assumptions and forecast made by Grifols management, including
pro forma figures, estimates and their underlying assumptions, statements regarding plans, objectives and expectations with respect to
capital expenditures, synergies, products and services, and statements regarding future performance. Forward-looking statements are statements
that are not historical facts and are generally identified by the words “expected”, “potential”, “estimates”
and similar expressions.
Although Grifols
believes that the expectations reflected in such forward-looking statements are reasonable, various known and unknown risks, uncertainties
and other factors could lead to material differences between the actual future results, financial situation, development or performance
of the Company and the estimates given here. These factors include those discussed in our public reports filed with the Comisión
Nacional del Mercado de Valores and the Securities and Exchange Commission, which are accessible to the public. The Company assumes no
liability whatsoever to update these forward-looking statements or conform them to future events or developments. Forward-looking statements
are not guarantees of future performance. They have not been reviewed by the auditors of Grifols.


- 1 - Q2 2024 Results Q2 2024 Results July 30, 2024
- 2 - Q2 2024 Results Legal Disclaimer Important Information This presentation does not constitute an offer or invitation to purchase or subscribe shares, in accordance with the provisio ns of the Regulation (EU) 2017/1129 of the European Parliament and of the Council of 14 June 2017 on the prospectus to be published when securities are offered to the public or admitted to trading on a regulated m ark et, and repealing Directive 2003/71/EC, the Spanish Securities Market and Investment Services Law (Law 6/2023, of 17 March, as amended and restated from time to time), Royal Decree 814/2023, of Novem ber 8, and its implementing regulations. In addition, this document does not constitute an offer of purchase, sale or exchange, nor a request for an offer of purchase, sale or exchange of securities, no r a request for any vote or approval in any other jurisdiction. This information has not been audited. Forward - Looking Statements This presentation contains forward - looking information and statements about Grifols based on current assumptions and forecast ma de by Grifols management, including pro forma figures, estimates and their underlying assumptions, statements regarding plans, objectives and expectations with respect to capital expenditures, synergi es, products and services, and statements regarding future performance. Forward - looking statements are statements that are not historical facts and are generally identified by the words “expected”, “potent ial ”, “estimates” and similar expressions. Although Grifols believes that the expectations reflected in such forward - looking statements are reasonable, various known and u nknown risks, uncertainties and other factors could lead to material differences between the actual future results, financial situation, development or performance of the Company and the estimates given her e. These factors include those discussed in our public reports filed with the Comisión Nacional del Mercado de Valores and the Securities and Exchange Commission, which are accessible to the public. The Company a ssu mes no liability whatsoever to update these forward - looking statements or conform them to future events or developments. Forward - looking statements are not guarantees of future performance. They have no t been reviewed by the auditors of Grifols. Alternative Performance Measures (APMs) This document and any related conference call or webcast (including a Q&A session) contain, in addition to the financial info rma tion prepared in accordance with IFRS, alternative performance measures (‘APMs’) as defined in the guidelines issued by the European Securities and Markets Authority (‘ESMA’) on October 5, 2015. APMs are used by Grifols’ management to evaluate the group’s financial performance, cash flows or financial position in making operational and strategic decisions for the group and therefore are useful information for inves tor s and other stakeholders. Certain key APMs form part of executive directors, management and employees’ remuneration targets. APMs are prepared on a consistent basis for the periods presented in this document. They should be considered in addition to IFR S measurements, may differ to definitions given by regulatory bodies relevant to the group and to similarly titled measures presented by other companies. They have not been audited, reviewed or verified by the ext ernal auditor of Grifols. For further details on the definition, explanation on the use, and reconciliation of APMs, please see the appendix as well as the “Alternative performance measures” document from our websi te www.grifols.com/en/investors . Basis of Presentation For comparative purposes with H1'24, the financial statements for H1'23 have been re - expressed according to the Inside Informati on released on July 30, 2024, and further disclosed in accordance with Note 2(d) of the Consolidated Interim Financial Statements for H1’24.

- 3 - Q2 2024 Results Introductory Remarks 01 Business and Financial Review 02 Annex 03 Thomas Glanzmann Executive Chairman Nacho Abia Chief Executive Officer (CEO) Agenda

- 4 - Q2 2024 Results Thomas Glanzmann Executive Chairman Introductory Remarks Consistently Delivering on Our Commitments
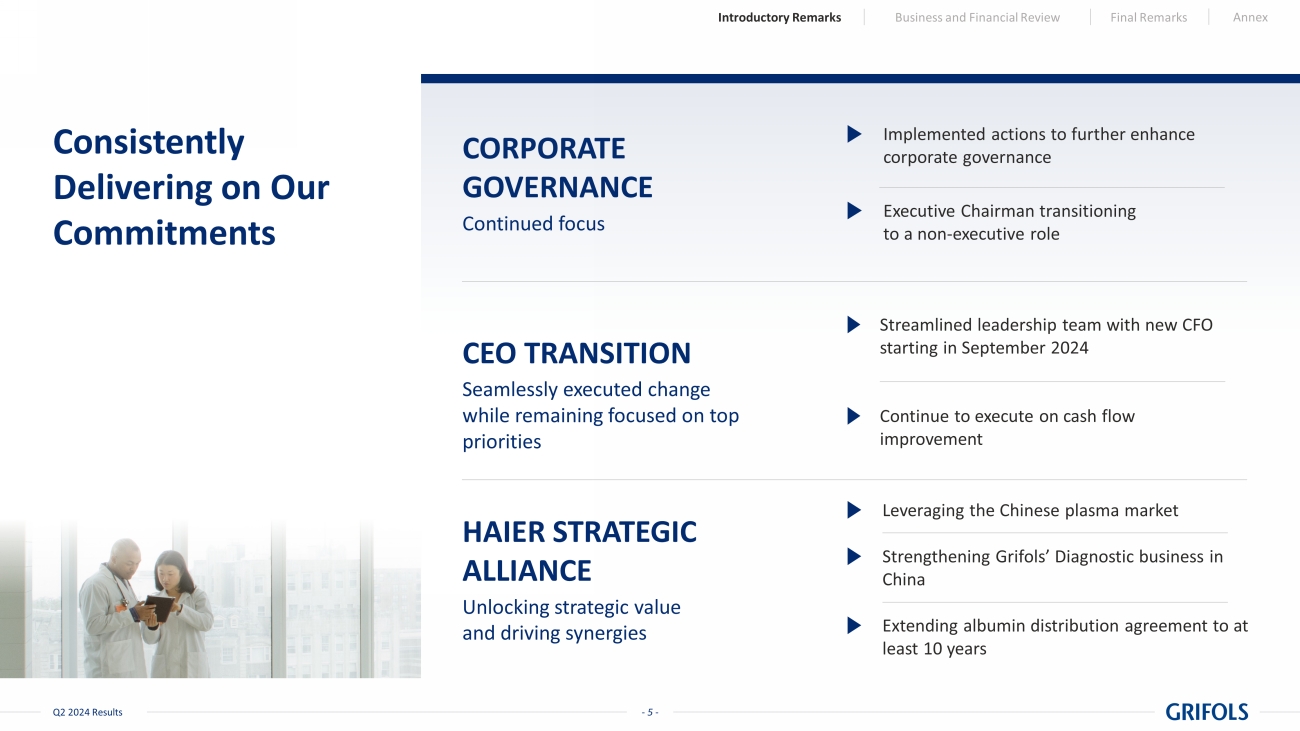
- 5 - Q2 2024 Results Consistently Delivering on Our Commitments CORPORATE GOVERNANCE Continued focus CEO TRANSITION Seamlessly executed change while remaining focused on top priorities HAIER STRATEGIC ALLIANCE Unlocking strategic value and driving synergies Implemented actions to further enhance corporate governance Executive Chairman transitioning to a non - executive role Leveraging the Chinese plasma market Strengthening Grifols’ Diagnostic business in China Extending albumin distribution agreement to at least 10 years Streamlined leadership team with new CFO starting in September 2024 Continue to execute on cash flow improvement Introductory Remarks Business and Financial Review Final Remarks Annex
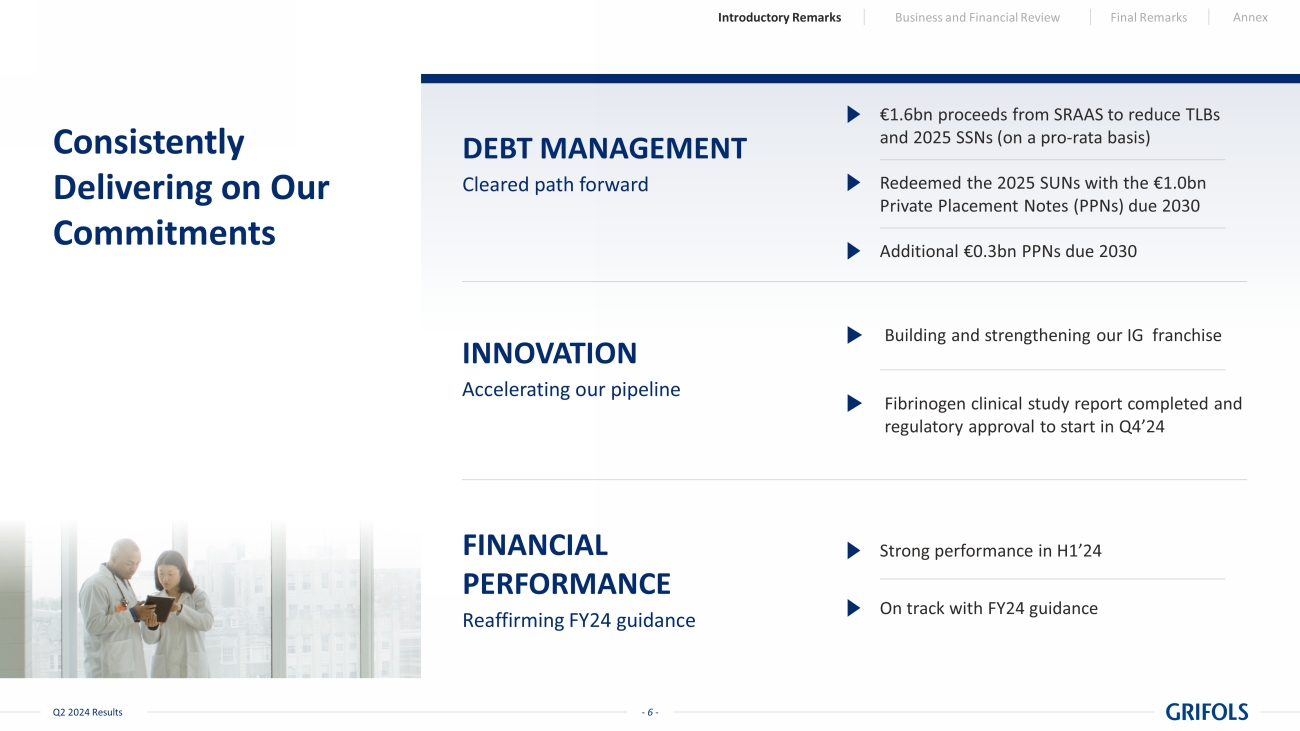
- 6 - Q2 2024 Results Consistently Delivering on Our Commitments DEBT MANAGEMENT Cleared path forward INNOVATION Accelerating our pipeline FINANCIAL PERFORMANCE Reaffirming FY24 guidance Building and strengthening our IG franchise Fibrinogen clinical study report completed and regulatory approval to start in Q4’24 Strong performance in H1’24 On track with FY24 guidance €1.6bn proceeds from SRAAS to reduce TLBs and 2025 SSNs (on a pro - rata basis) Redeemed the 2025 SUNs with the €1.0bn Private Placement Notes (PPNs) due 2030 Additional €0.3bn PPNs due 2030 Introductory Remarks Business and Financial Review Final Remarks Annex

- 7 - Q2 2024 Results Nacho Abia Chief Executive Officer (CEO) Business and Financial Review Accelerating Performance in Q2’24 and Reaffirming FY24 Guidance
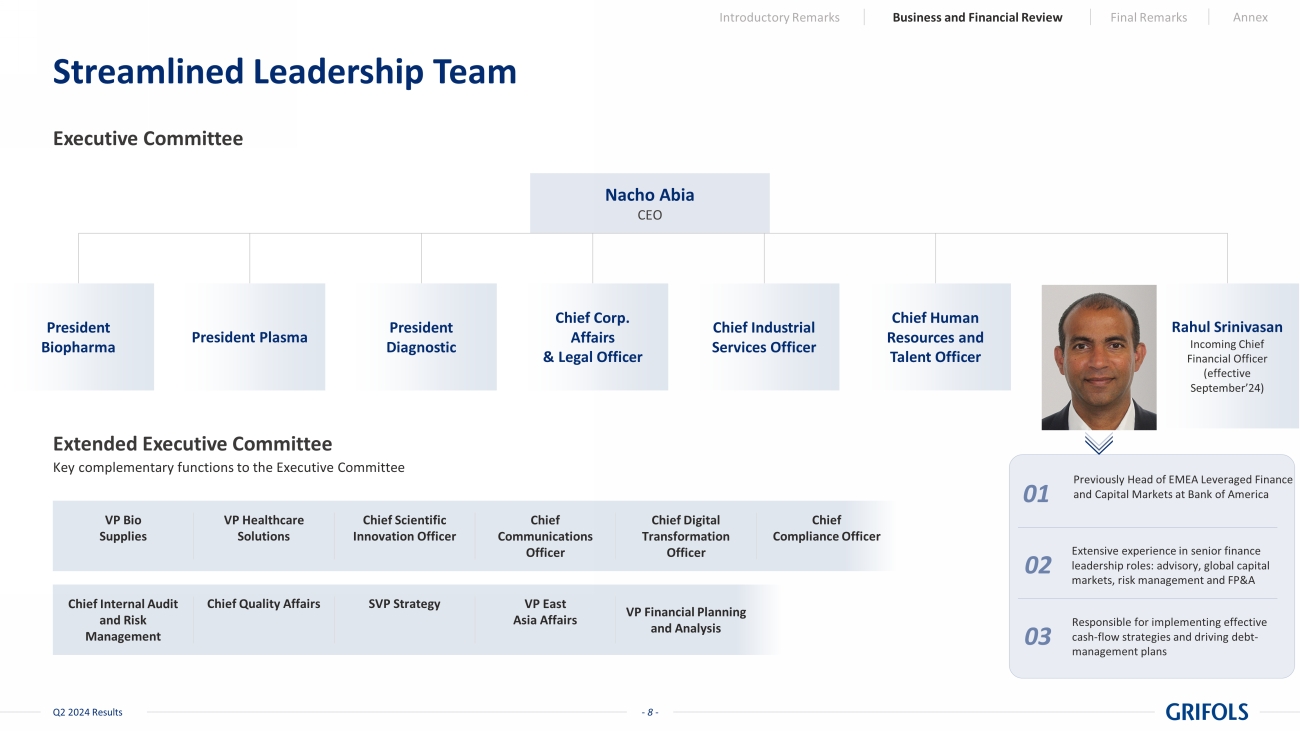
- 8 - Q2 2024 Results Streamlined Leadership Team Executive Committee Extended Executive Committee Key complementary functions to the Executive Committee VP Healthcare Solutions Chief Communications Officer Chief Compliance Officer VP Bio Supplies Chief Scientific Innovation Officer Chief Digital Transformation Officer Chief Quality Affairs VP East Asia Affairs Chief Internal Audit and Risk Management SVP Strategy VP Financial Planning and Analysis Previously Head of EMEA Leveraged Finance and Capital Markets at Bank of America Extensive experience in senior finance leadership roles: advisory, global capital markets, risk management and FP&A Responsible for implementing effective cash - flow strategies and driving debt - management plans Introductory Remarks Business and Financial Review Final Remarks Annex Nacho Abia CEO President Plasma Chief Industrial Services Officer President Diagnostic Rahul Srinivasan Incoming Chief Financial Officer (effective September’24) Chief Corp. Affairs & Legal Officer President Biopharma Chief Human Resources and Talent Officer 01 02 03
- 9 - Q2 2024 Results Acceleration in Q2’24 Drives Strong First Half Performance Sales growth EBITDA Adjusted 2 EBITDA Adjusted margin 2 Free Cash Flow 2 Liquidity and cash balance Leverage ratio 5.5x 3 as per the Credit Facility 6.5x 2 as per EBITDA as per P&L and Net Debt as per the BS Note: All figures are presented on a consolidated basis (including Biotest) 1 At constant currency, excluding exchange rate fluctuations over the period 2 Reconciliations in the Annex 3 Defined as per the Credit Agreement; refer to Annex €915m Liquidity position excluding €1.6bn SRAAS proceeds €568m Cash on hand excluding €1.6bn SRAAS proceeds €1,818m +9.3% cc 1 Q2’24 vs. Q2’23 €3,444m +7.5% cc 1 H1’24 vs. H1’23 €441m +27.9% cc 1 Q2’24 vs. Q2’23 €791m +24.1% cc 1 H1’24 vs. H1’23 24.2% +320bps Q2’24 vs. Q2’23 23.0% +280bps H1’24 vs. H1’23 €57m in Q2’24 excluding €1.6bn SRAAS proceeds Introductory Remarks Business and Financial Review Final Remarks Annex €(196)m in H1’24 excluding €1.6bn SRAAS proceeds
- 10 - Q2 2024 Results Solid Business Fundamentals Fuel Further Revenue Growth Across all Business Units Note: All figures are presented on a consolidated basis (including Biotest), At constant currency (cc), excluding exchange ra te fluctuations over the period 1 Excluding one - off in Q1’23 revenues related to a €19m commercial true - up in Diagnostic 2 Blood Typing Solutions; 3 Immunoassay Donor Screening (IDS), previously named Recombinant Proteins Biopharma Immunoglobulin: +13% cc, SCIG: +59% cc Albumin: +10% cc Alpha - 1 and Specialty proteins : +0% cc Diagnostic BTS 2 as the main driver of growth with +15% cc NAT impacted by phasing of shipments to China and one - time instrument sales to Japan in PY IDS 3 large one off in Q1’23 base impacting growth Revenue (in million EUR) 3,225 3,465 13 14 21 1 2 3 4 5 6 7 239 3,444 +7.5% cc +6.8% H1’23 Biopharma Diagnostic Bio Supplies and others H1’24 cc FX H1’24 H1’24 +8.9%cc Q2’24 +8.4%cc H1’24 - 3.7%cc ; +1.9%cc 1 Q2’24 +1.2%cc Introductory Remarks Business and Financial Review Final Remarks Annex
- 11 - Q2 2024 Results Biopharma Led Growth with Robust Performance of Key Proteins Growth vs. H1’23 (cc) +8.9% Biopharma CONTINUING TO REINFORCE OUR PLASMA OPERATIONS Plasma supply and inventory optimization 1 CPL improvements linked to donor commitment compensation efficiencies and process digitalization 2 Donor experience focus: quicker and more efficient donation process in a safe environment 3 Protein Note: All figures are presented on a consolidated basis (including Biotest) 1 At constant currency, excluding exchange rate fluctuations over the period Introductory Remarks Business and Financial Review Final Remarks Annex Immunoglobulin • IVIG (+11.5% cc) strong demand in key regions driven by U.S. and international markets • SCIG (+59% cc) accelerates driven by U.S. performance and EU launches +13.1% Alpha - 1 and Specialty proteins • Alpha - 1 temporarily impacted by specialty pharma distributor transition in the U.S. • Rabies mainly driven by higher demand in the U.S. and pricing dynamics +0% Albumin • Higher demand in China • Competitive market dynamics in select markets +9.6%
- 12 - Q2 2024 Results Product Mix and Operational Leverage Drive EBITDA to €441m and Margin to 24.2% in Q2’24 Note: All figures are presented on a consolidated basis (including Biotest) 1 Reconciliations in the Annex EBITDA Adjusted 1 (in million EUR) H1'23 H1'24 One-offs Reported EBITDA 647 791 23.0% 20.2% +280pbs Gross margin expanded in H1’24 vs. PY driven by CPL decline and product mix Operational leverage: Higher absorption of opex on the back of further revenue growth Further expansion expected in H2’24 : On track to achieve FY24 guidance of EUR 1,800m+ at a 25 - 26% margin Introductory Remarks Business and Financial Review Final Remarks Annex
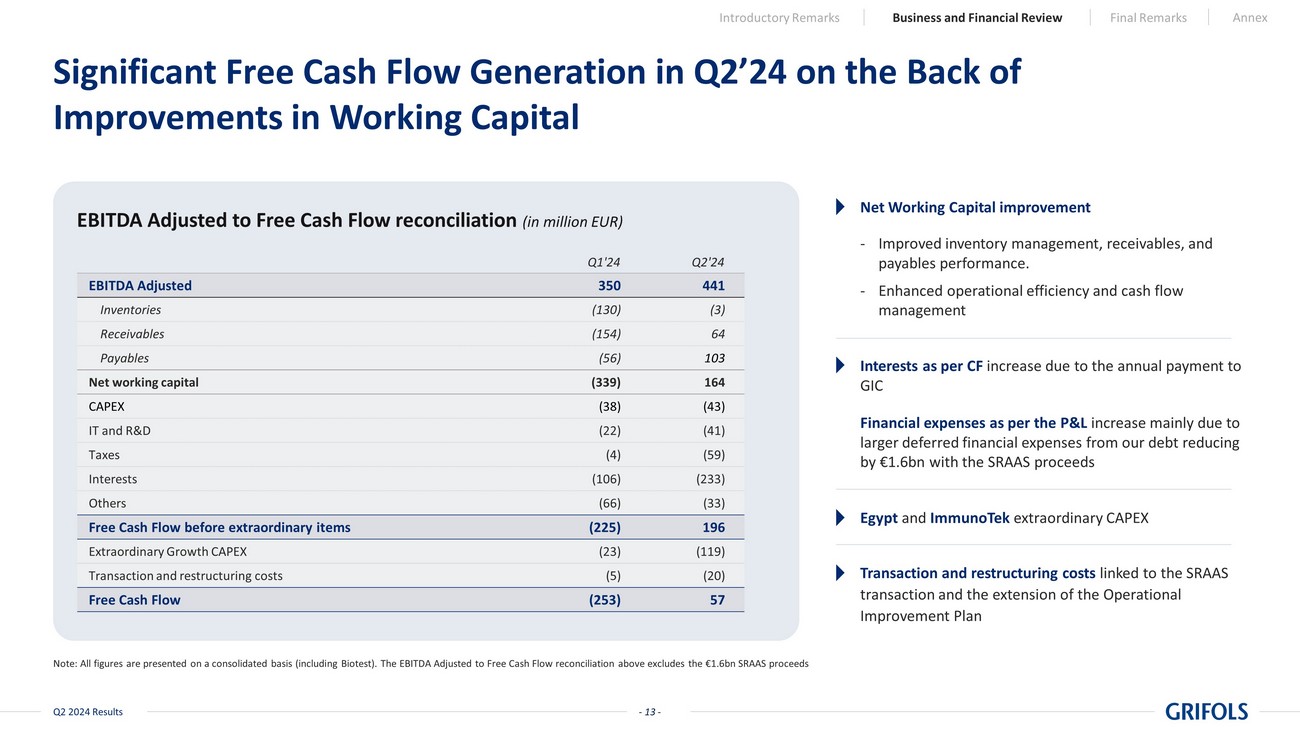
- 13 - Q2 2024 Results EBITDA Adjusted 350 441 Inventories (130) (3) Receivables (154) 64 Payables (56) 103 Net working capital (339) 164 CAPEX (38) (43) IT and R&D (22) (41) Taxes (4) (59) Interests (106) (233) Others (66) (33) Free Cash Flow before extraordinary items (225) 196 Extraordinary Growth CAPEX (23) (119) Transaction and restructuring costs (5) (20) Free Cash Flow (253) 57 Significant Free Cash Flow Generation in Q2’24 on the Back of Improvements in Working Capital Note: All figures are presented on a consolidated basis (including Biotest). The EBITDA Adjusted to Free Cash Flow reconcilia tio n above excludes the €1.6bn SRAAS proceeds EBITDA Adjusted to Free Cash Flow reconciliation (in million EUR) Egypt and ImmunoTek extraordinary CAPEX Interests as per CF increase due to the annual payment to GIC Net Working Capital improvement - Improved inventory management, receivables, and payables performance. - Enhanced operational efficiency and cash flow management Transaction and restructuring costs linked to the SRAAS transaction and the extension of the Operational Improvement Plan Q1'24 Q2'24 Introductory Remarks Business and Financial Review Final Remarks Annex Financial expenses as per the P&L increase mainly due to larger deferred financial expenses from our debt reducing by €1.6bn with the SRAAS proceeds - 13 -
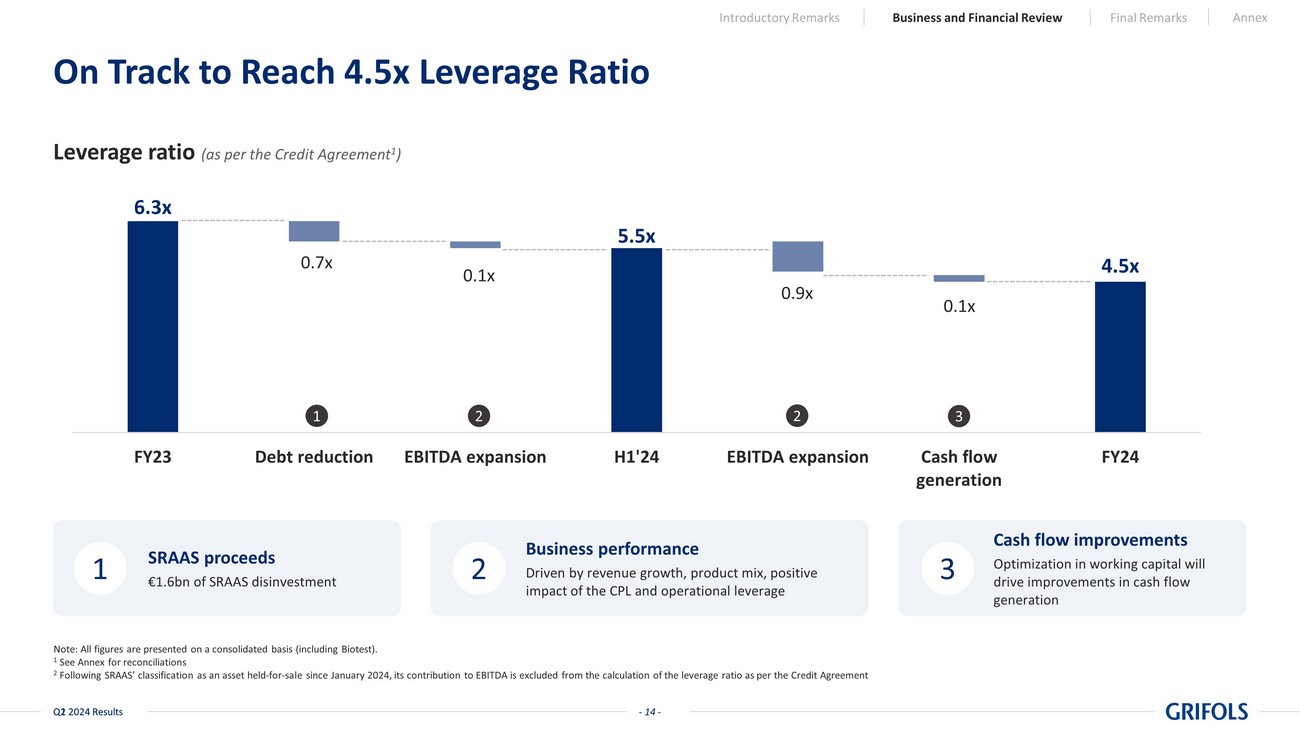
- 14 - Q2 2024 Results Note: All figures are presented on a consolidated basis (including Biotest). 1 See Annex for reconciliations 2 Following SRAAS’ classification as an asset held - for - sale since January 2024, its contribution to EBITDA is excluded from the calculation of the leverage ratio as per the Credit Agreement On Track to Reach 4.5x Leverage Ratio - 11 - Q1 2024 Results Cash flow improvements Optimization in working capital will drive improvements in cash flow generation Business performance Driven by revenue growth, product mix, positive impact of the CPL and operational leverage SRAAS proceeds €1.6bn of SRAAS disinvestment 1 2 3 6.3 x 5.5 x 4.5 x FY23 Debt reduction EBITDA expansion H1'24 EBITDA expansion Cash flow generation FY24 Leverage ratio (as per the Credit Agreement 1 ) 0.7x 0.1x 0.9x 0.1x 1 2 2 3 Introductory Remarks Business and Financial Review Final Remarks Annex - 14 -
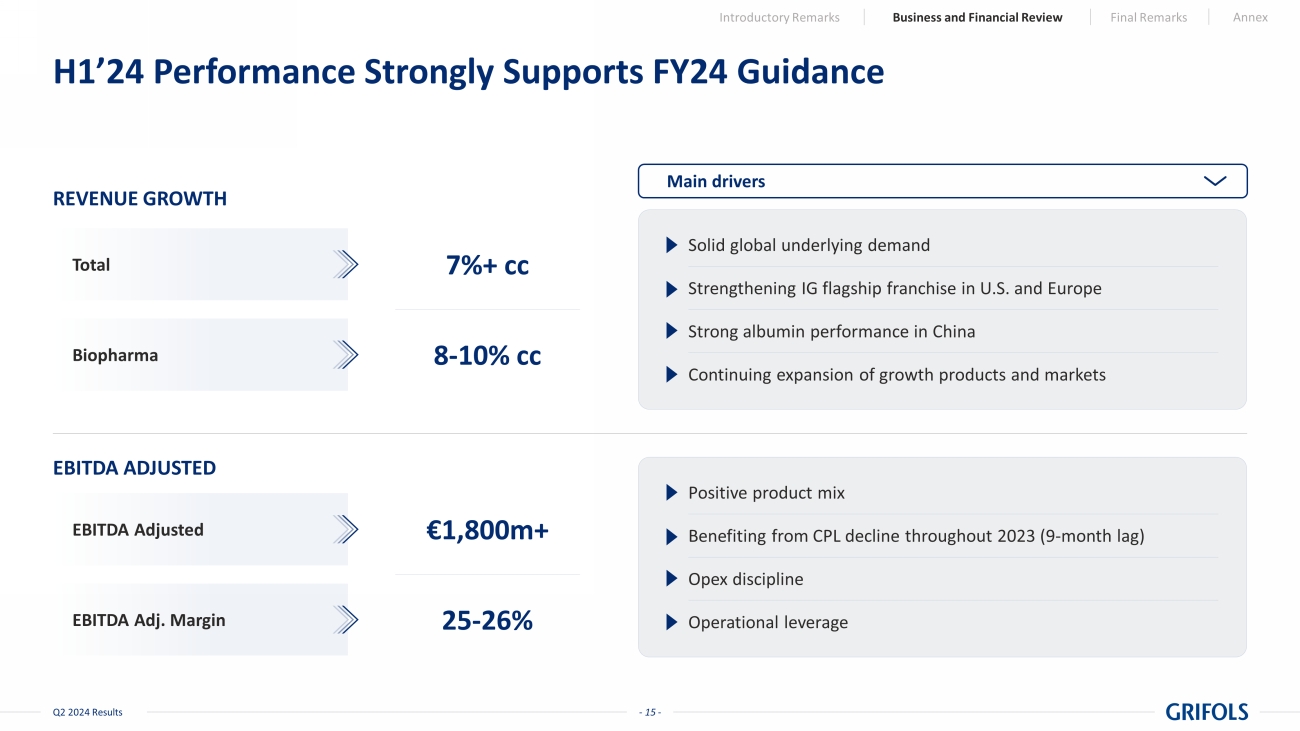
- 15 - Q2 2024 Results H1’24 Performance Strongly Supports FY24 Guidance REVENUE GROWTH EBITDA ADJUSTED EBITDA Adjusted EBITDA Adj. Margin €1,800m+ 25 - 26% Total Biopharma 7%+ cc 8 - 10% cc Main drivers Solid global underlying demand Strengthening IG flagship franchise in U.S. and Europe Strong albumin performance in China Continuing expansion of growth products and markets Positive product mix Benefiting from CPL decline throughout 2023 (9 - month lag) Opex discipline Operational leverage Introductory Remarks Business and Financial Review Final Remarks Annex
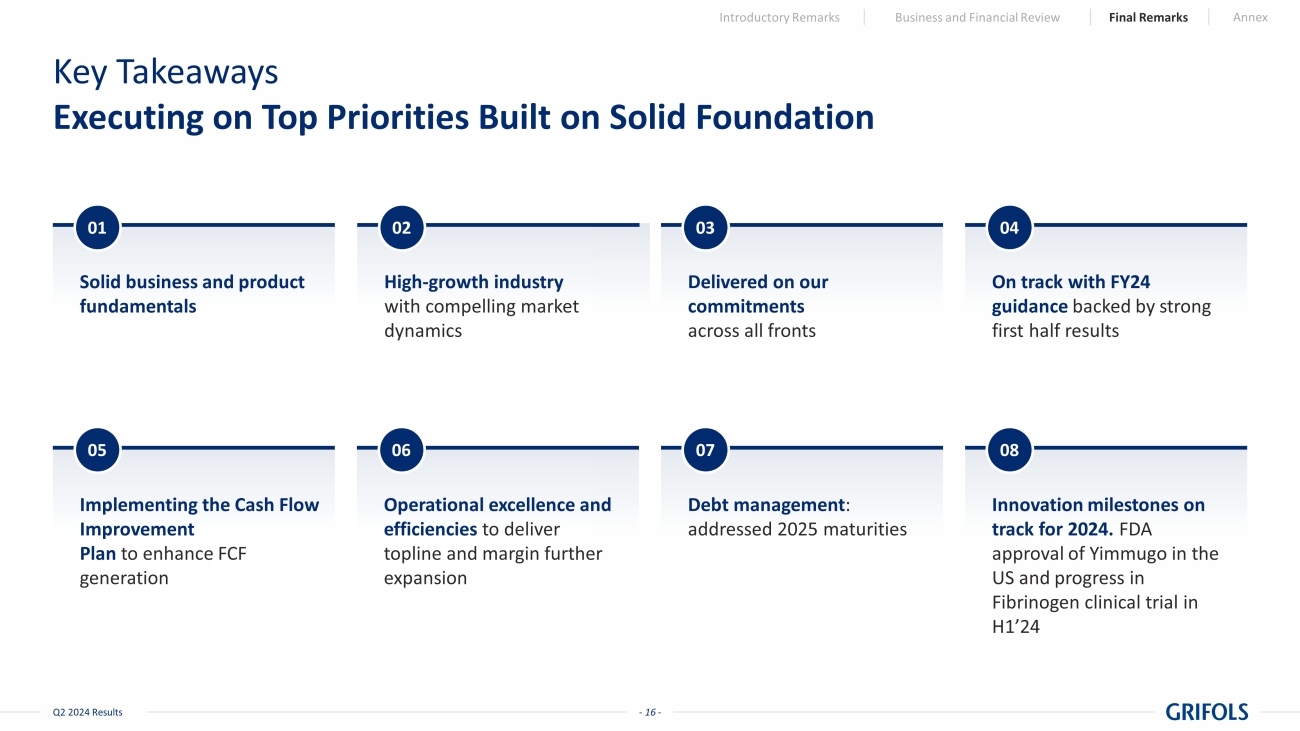
- 16 - Q2 2024 Results Key Takeaways Executing on Top Priorities Built on Solid Foundation Implementing the Cash Flow Improvement Plan to enhance FCF generation Operational excellence and efficiencies to deliver topline and margin further expansion Debt management : addressed 2025 maturities Innovation milestones on track for 2024. FDA approval of Yimmugo in the US and progress in Fibrinogen clinical trial in H1’24 Solid business and product fundamentals High - growth industry with compelling market dynamics On track with FY24 guidance backed by strong first half results 05 06 08 01 02 04 Introductory Remarks Business and Financial Review Final Remarks Annex Delivered on our commitments across all fronts 03 07

- 17 - Q2 2024 Results ANNEX
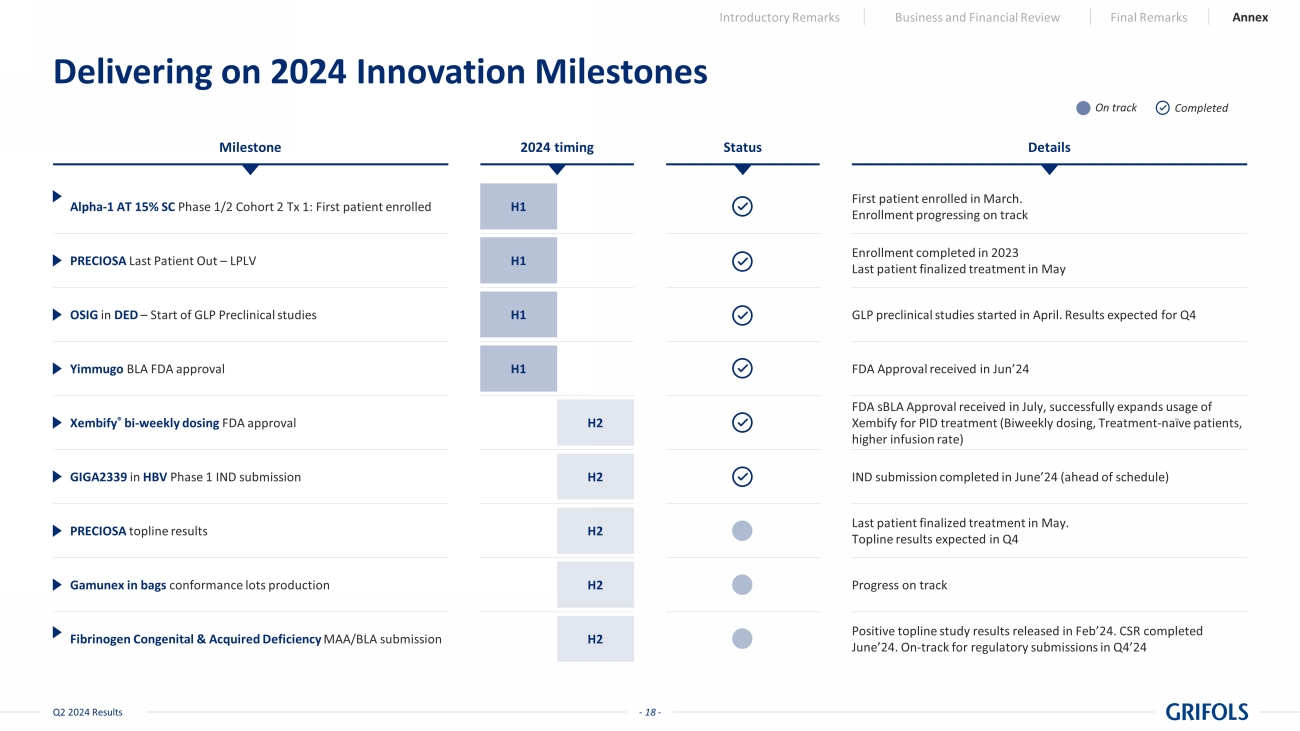
- 18 - Q2 2024 Results Delivering on 2024 Innovation Milestones Completed On track Milestone Details 2024 timing Status Alpha - 1 AT 15% SC Phase 1/2 Cohort 2 Tx 1: First patient enrolled PRECIOSA Last Patient Out – LPLV OSIG in DED – Start of GLP Preclinical studies Yimmugo BLA FDA approval Xembify ® bi - weekly dosing FDA approval GIGA2339 in HBV Phase 1 IND submission PRECIOSA topline results Gamunex in bags conformance lots production Fibrinogen Congenital & Acquired Deficiency MAA/BLA submission First patient enrolled in March. Enrollment progressing on track Enrollment completed in 2023 Last patient finalized treatment in May GLP preclinical studies started in April. Results expected for Q4 FDA Approval received in Jun’24 FDA sBLA Approval received in July, successfully expands usage of Xembify for PID treatment (Biweekly dosing, Treatment - naïve patients, higher infusion rate) IND submission completed in June’24 (ahead of schedule) Last patient finalized treatment in May. Topline results expected in Q4 Progress on track Positive topline study results released in Feb’24. CSR completed June’24. On - track for regulatory submissions in Q4’24 H1 H1 H1 H1 H2 H2 H2 H2 H2 Introductory Remarks Business and Financial Review Final Remarks Annex
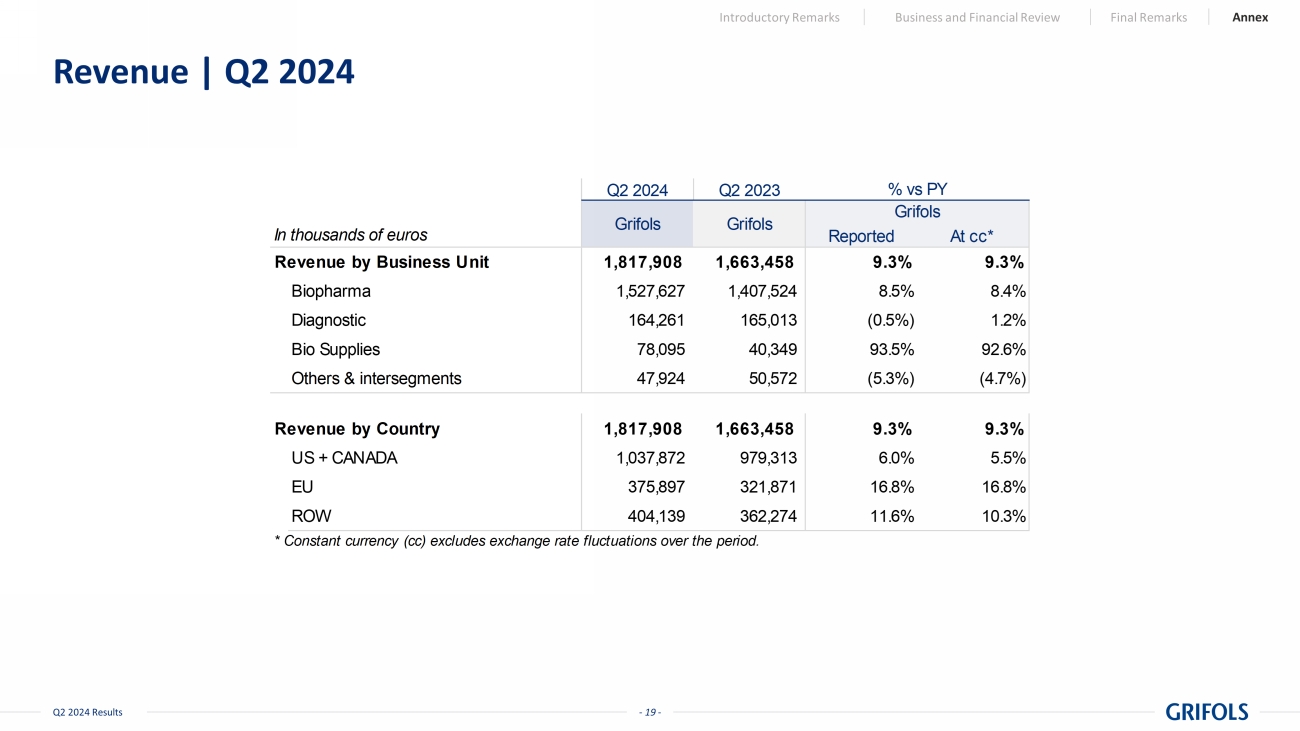
- 19 - Q2 2024 Results Revenue | Q2 2024 Introductory Remarks Business and Financial Review Final Remarks Annex Q2 2024 Q2 2023 In thousands of euros Reported At cc* Revenue by Business Unit 1,817,908 1,663,458 9.3% 9.3% Biopharma 1,527,627 1,407,524 8.5% 8.4% Diagnostic 164,261 165,013 (0.5%) 1.2% Bio Supplies 78,095 40,349 93.5% 92.6% Others & intersegments 47,924 50,572 (5.3%) (4.7%) Revenue by Country 1,817,908 1,663,458 9.3% 9.3% US + CANADA 1,037,872 979,313 6.0% 5.5% EU 375,897 321,871 16.8% 16.8% ROW 404,139 362,274 11.6% 10.3% * Constant currency (cc) excludes exchange rate fluctuations over the period. Grifols Grifols Grifols % vs PY
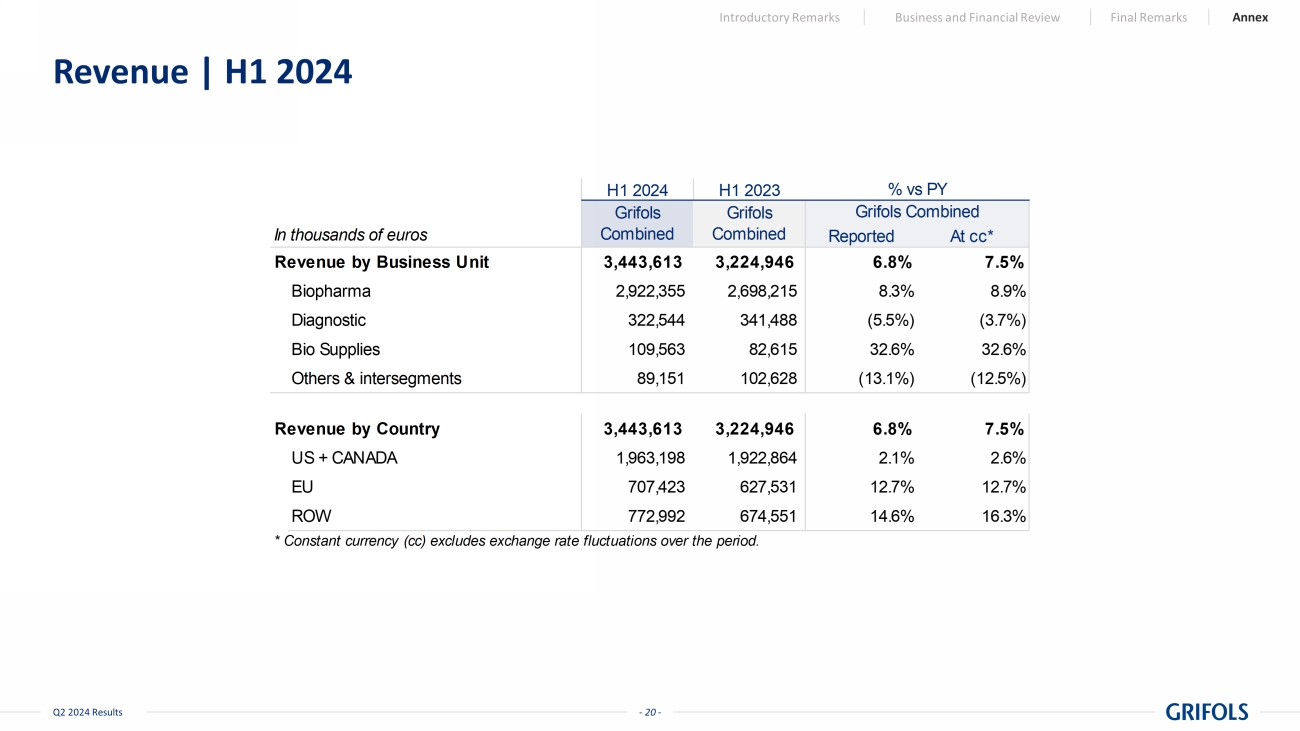
- 20 - Q2 2024 Results Revenue | H1 2024 Introductory Remarks Business and Financial Review Final Remarks Annex H1 2024 H1 2023 In thousands of euros Reported At cc* Revenue by Business Unit 3,443,613 3,224,946 6.8% 7.5% Biopharma 2,922,355 2,698,215 8.3% 8.9% Diagnostic 322,544 341,488 (5.5%) (3.7%) Bio Supplies 109,563 82,615 32.6% 32.6% Others & intersegments 89,151 102,628 (13.1%) (12.5%) Revenue by Country 3,443,613 3,224,946 6.8% 7.5% US + CANADA 1,963,198 1,922,864 2.1% 2.6% EU 707,423 627,531 12.7% 12.7% ROW 772,992 674,551 14.6% 16.3% * Constant currency (cc) excludes exchange rate fluctuations over the period. Grifols Combined Grifols Combined Grifols Combined % vs PY
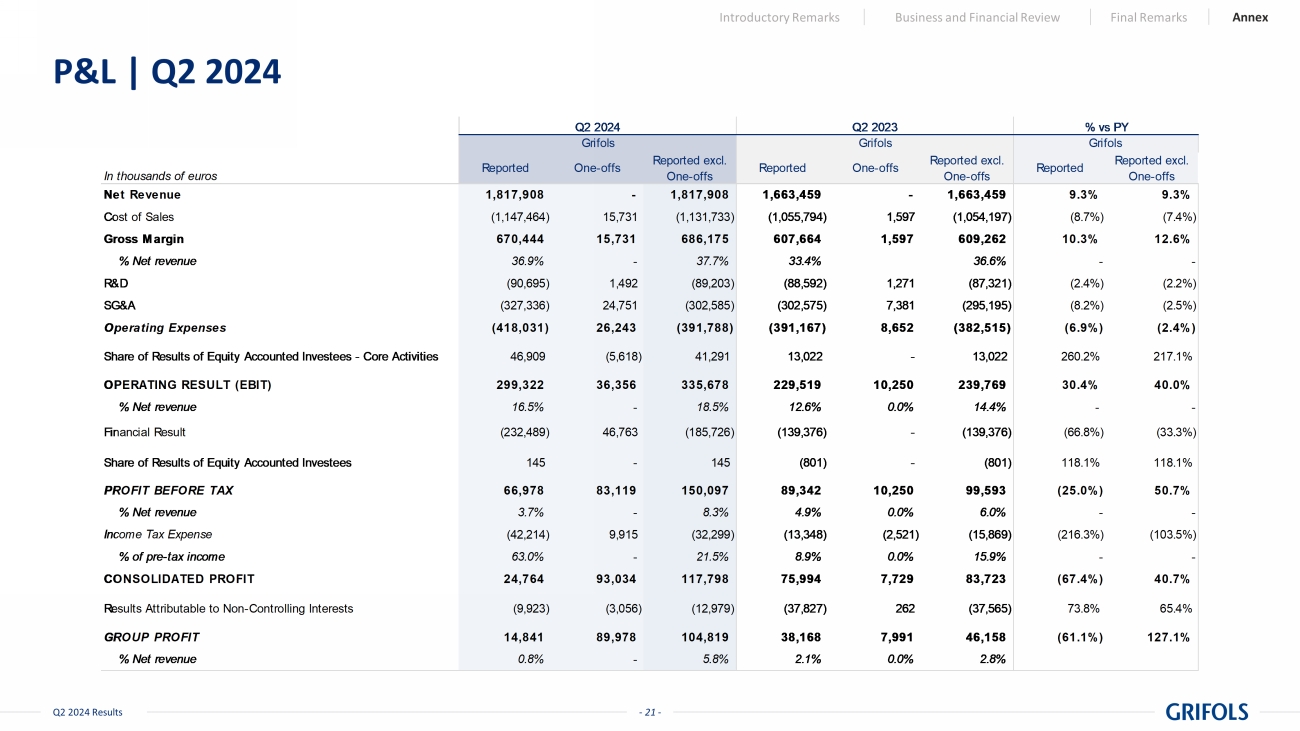
- 21 - Q2 2024 Results P&L | Q2 2024 Introductory Remarks Business and Financial Review Final Remarks Annex In thousands of euros Reported One-offs Reported excl. One-offs Reported One-offs Reported excl. One-offs Reported Reported excl. One-offs Net Revenue 1,817,908 - 1,817,908 1,663,459 - 1,663,459 9.3% 9.3% Cost of Sales (1,147,464) 15,731 (1,131,733) (1,055,794) 1,597 (1,054,197) (8.7%) (7.4%) Gross Margin 670,444 15,731 686,175 607,664 1,597 609,262 10.3% 12.6% % Net revenue 36.9% - 37.7% 33.4% 36.6% - - R&D (90,695) 1,492 (89,203) (88,592) 1,271 (87,321) (2.4%) (2.2%) SG&A (327,336) 24,751 (302,585) (302,575) 7,381 (295,195) (8.2%) (2.5%) Operating Expenses (418,031) 26,243 (391,788) (391,167) 8,652 (382,515) (6.9%) (2.4%) 46,909 (5,618) 41,291 13,022 - 13,022 260.2% 217.1% OPERATING RESULT (EBIT) 299,322 36,356 335,678 229,519 10,250 239,769 30.4% 40.0% % Net revenue 16.5% - 18.5% 12.6% 0.0% 14.4% - - Financial Result (232,489) 46,763 (185,726) (139,376) - (139,376) (66.8%) (33.3%) 145 - 145 (801) - (801) 118.1% 118.1% PROFIT BEFORE TAX 66,978 83,119 150,097 89,342 10,250 99,593 (25.0%) 50.7% % Net revenue 3.7% - 8.3% 4.9% 0.0% 6.0% - - Income Tax Expense (42,214) 9,915 (32,299) (13,348) (2,521) (15,869) (216.3%) (103.5%) % of pre-tax income 63.0% - 21.5% 8.9% 0.0% 15.9% - - CONSOLIDATED PROFIT 24,764 93,034 117,798 75,994 7,729 83,723 (67.4%) 40.7% Results Attributable to Non-Controlling Interests (9,923) (3,056) (12,979) (37,827) 262 (37,565) 73.8% 65.4% GROUP PROFIT 14,841 89,978 104,819 38,168 7,991 46,158 (61.1%) 127.1% % Net revenue 0.8% - 5.8% 2.1% 0.0% 2.8% Q2 2024 % vs PY Share of Results of Equity Accounted Investees Share of Results of Equity Accounted Investees - Core Activities Grifols GrifolsGrifols Q2 2023
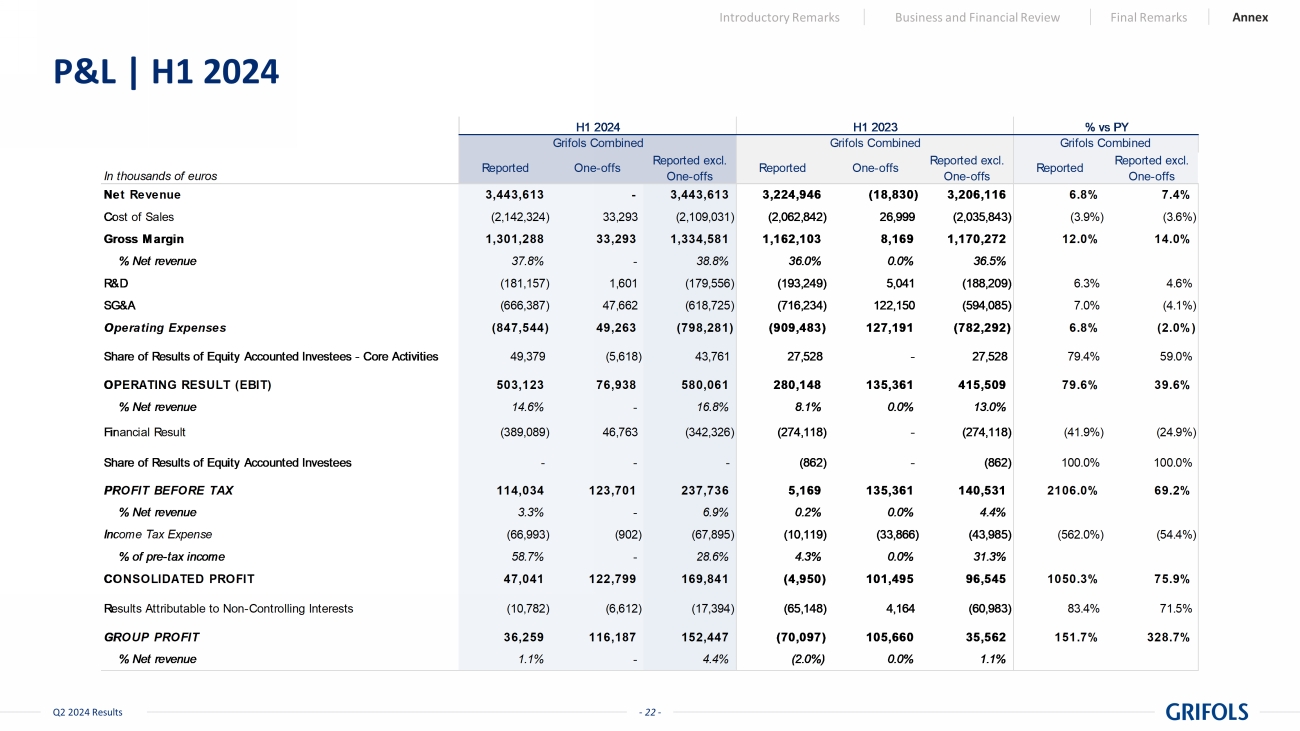
- 22 - Q2 2024 Results P&L | H1 2024 Introductory Remarks Business and Financial Review Final Remarks Annex In thousands of euros Reported One-offs Reported excl. One-offs Reported One-offs Reported excl. One-offs Reported Reported excl. One-offs Net Revenue 3,443,613 - 3,443,613 3,224,946 (18,830) 3,206,116 6.8% 7.4% Cost of Sales (2,142,324) 33,293 (2,109,031) (2,062,842) 26,999 (2,035,843) (3.9%) (3.6%) Gross Margin 1,301,288 33,293 1,334,581 1,162,103 8,169 1,170,272 12.0% 14.0% % Net revenue 37.8% - 38.8% 36.0% 0.0% 36.5% R&D (181,157) 1,601 (179,556) (193,249) 5,041 (188,209) 6.3% 4.6% SG&A (666,387) 47,662 (618,725) (716,234) 122,150 (594,085) 7.0% (4.1%) Operating Expenses (847,544) 49,263 (798,281) (909,483) 127,191 (782,292) 6.8% (2.0%) 49,379 (5,618) 43,761 27,528 - 27,528 79.4% 59.0% OPERATING RESULT (EBIT) 503,123 76,938 580,061 280,148 135,361 415,509 79.6% 39.6% % Net revenue 14.6% - 16.8% 8.1% 0.0% 13.0% Financial Result (389,089) 46,763 (342,326) (274,118) - (274,118) (41.9%) (24.9%) - - - (862) - (862) 100.0% 100.0% PROFIT BEFORE TAX 114,034 123,701 237,736 5,169 135,361 140,531 2106.0% 69.2% % Net revenue 3.3% - 6.9% 0.2% 0.0% 4.4% Income Tax Expense (66,993) (902) (67,895) (10,119) (33,866) (43,985) (562.0%) (54.4%) % of pre-tax income 58.7% - 28.6% 4.3% 0.0% 31.3% CONSOLIDATED PROFIT 47,041 122,799 169,841 (4,950) 101,495 96,545 1050.3% 75.9% Results Attributable to Non-Controlling Interests (10,782) (6,612) (17,394) (65,148) 4,164 (60,983) 83.4% 71.5% GROUP PROFIT 36,259 116,187 152,447 (70,097) 105,660 35,562 151.7% 328.7% % Net revenue 1.1% - 4.4% (2.0%) 0.0% 1.1% Share of Results of Equity Accounted Investees - Core Activities Share of Results of Equity Accounted Investees Grifols Combined % vs PY Grifols Combined Grifols Combined H1 2024 H1 2023
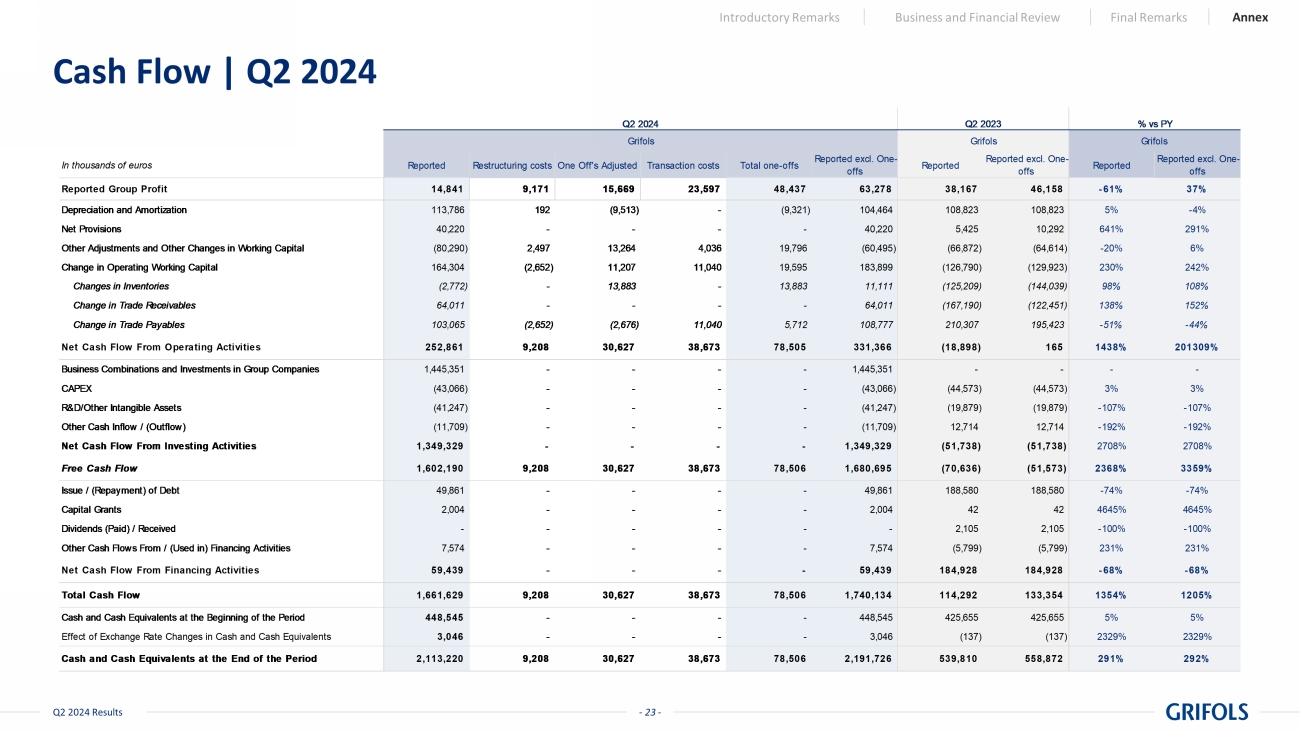
- 23 - Q2 2024 Results Cash Flow | Q2 2024 Introductory Remarks Business and Financial Review Final Remarks Annex In thousands of euros Reported Restructuring costsOne Off's Adjusted Transaction costs Total one-offs Reported excl. One- offs Reported Reported excl. One- offs Reported Reported excl. One- offs Reported Group Profit 14,841 9,171 15,669 23,597 48,437 63,278 38,167 46,158 -61% 37% Depreciation and Amortization 113,786 192 (9,513) - (9,321) 104,464 108,823 108,823 5% -4% Net Provisions 40,220 - - - - 40,220 5,425 10,292 641% 291% Other Adjustments and Other Changes in Working Capital (80,290) 2,497 13,264 4,036 19,796 (60,495) (66,872) (64,614) -20% 6% Change in Operating Working Capital 164,304 (2,652) 11,207 11,040 19,595 183,899 (126,790) (129,923) 230% 242% Changes in Inventories (2,772) - 13,883 - 13,883 11,111 (125,209) (144,039) 98% 108% Change in Trade Receivables 64,011 - - - - 64,011 (167,190) (122,451) 138% 152% Change in Trade Payables 103,065 (2,652) (2,676) 11,040 5,712 108,777 210,307 195,423 -51% -44% Net Cash Flow From Operating Activities 252,861 9,208 30,627 38,673 78,505 331,366 (18,898) 165 1438% 201309% Business Combinations and Investments in Group Companies 1,445,351 - - - - 1,445,351 - - - - CAPEX (43,066) - - - - (43,066) (44,573) (44,573) 3% 3% R&D/Other Intangible Assets (41,247) - - - - (41,247) (19,879) (19,879) -107% -107% Other Cash Inflow / (Outflow) (11,709) - - - - (11,709) 12,714 12,714 -192% -192% Net Cash Flow From Investing Activities 1,349,329 - - - - 1,349,329 (51,738) (51,738) 2708% 2708% Free Cash Flow 1,602,190 9,208 30,627 38,673 78,506 1,680,695 (70,636) (51,573) 2368% 3359% Issue / (Repayment) of Debt 49,861 - - - - 49,861 188,580 188,580 -74% -74% Capital Grants 2,004 - - - - 2,004 42 42 4645% 4645% Dividends (Paid) / Received - - - - - - 2,105 2,105 -100% -100% Other Cash Flows From / (Used in) Financing Activities 7,574 - - - - 7,574 (5,799) (5,799) 231% 231% Net Cash Flow From Financing Activities 59,439 - - - - 59,439 184,928 184,928 -68% -68% Total Cash Flow 1,661,629 9,208 30,627 38,673 78,506 1,740,134 114,292 133,354 1354% 1205% Cash and Cash Equivalents at the Beginning of the Period 448,545 - - - - 448,545 425,655 425,655 5% 5% Effect of Exchange Rate Changes in Cash and Cash Equivalents 3,046 - - - - 3,046 (137) (137) 2329% 2329% Cash and Cash Equivalents at the End of the Period 2,113,220 9,208 30,627 38,673 78,506 2,191,726 539,810 558,872 291% 292% Q2 2024 Q2 2023 % vs PY Grifols Grifols Grifols
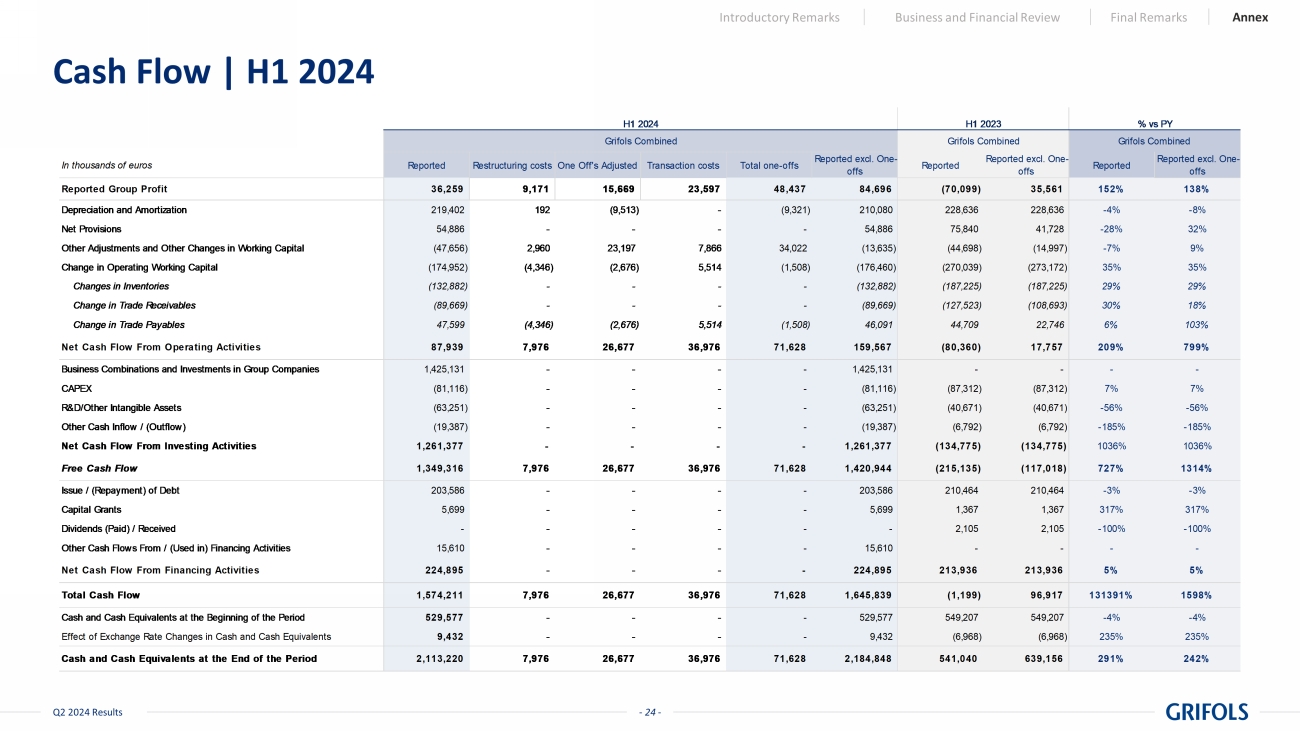
- 24 - Q2 2024 Results Cash Flow | H1 2024 Introductory Remarks Business and Financial Review Final Remarks Annex In thousands of euros Reported Restructuring costsOne Off's Adjusted Transaction costs Total one-offs Reported excl. One- offs Reported Reported excl. One- offs Reported Reported excl. One- offs Reported Group Profit 36,259 9,171 15,669 23,597 48,437 84,696 (70,099) 35,561 152% 138% Depreciation and Amortization 219,402 192 (9,513) - (9,321) 210,080 228,636 228,636 -4% -8% Net Provisions 54,886 - - - - 54,886 75,840 41,728 -28% 32% Other Adjustments and Other Changes in Working Capital (47,656) 2,960 23,197 7,866 34,022 (13,635) (44,698) (14,997) -7% 9% Change in Operating Working Capital (174,952) (4,346) (2,676) 5,514 (1,508) (176,460) (270,039) (273,172) 35% 35% Changes in Inventories (132,882) - - - - (132,882) (187,225) (187,225) 29% 29% Change in Trade Receivables (89,669) - - - - (89,669) (127,523) (108,693) 30% 18% Change in Trade Payables 47,599 (4,346) (2,676) 5,514 (1,508) 46,091 44,709 22,746 6% 103% Net Cash Flow From Operating Activities 87,939 7,976 26,677 36,976 71,628 159,567 (80,360) 17,757 209% 799% Business Combinations and Investments in Group Companies 1,425,131 - - - - 1,425,131 - - - - CAPEX (81,116) - - - - (81,116) (87,312) (87,312) 7% 7% R&D/Other Intangible Assets (63,251) - - - - (63,251) (40,671) (40,671) -56% -56% Other Cash Inflow / (Outflow) (19,387) - - - - (19,387) (6,792) (6,792) -185% -185% Net Cash Flow From Investing Activities 1,261,377 - - - - 1,261,377 (134,775) (134,775) 1036% 1036% Free Cash Flow 1,349,316 7,976 26,677 36,976 71,628 1,420,944 (215,135) (117,018) 727% 1314% Issue / (Repayment) of Debt 203,586 - - - - 203,586 210,464 210,464 -3% -3% Capital Grants 5,699 - - - - 5,699 1,367 1,367 317% 317% Dividends (Paid) / Received - - - - - - 2,105 2,105 -100% -100% Other Cash Flows From / (Used in) Financing Activities 15,610 - - - - 15,610 - - - - Net Cash Flow From Financing Activities 224,895 - - - - 224,895 213,936 213,936 5% 5% Total Cash Flow 1,574,211 7,976 26,677 36,976 71,628 1,645,839 (1,199) 96,917 131391% 1598% Cash and Cash Equivalents at the Beginning of the Period 529,577 - - - - 529,577 549,207 549,207 -4% -4% Effect of Exchange Rate Changes in Cash and Cash Equivalents 9,432 - - - - 9,432 (6,968) (6,968) 235% 235% Cash and Cash Equivalents at the End of the Period 2,113,220 7,976 26,677 36,976 71,628 2,184,848 541,040 639,156 291% 242% Grifols Combined % vs PY Grifols Combined H1 2024 Grifols Combined H1 2023
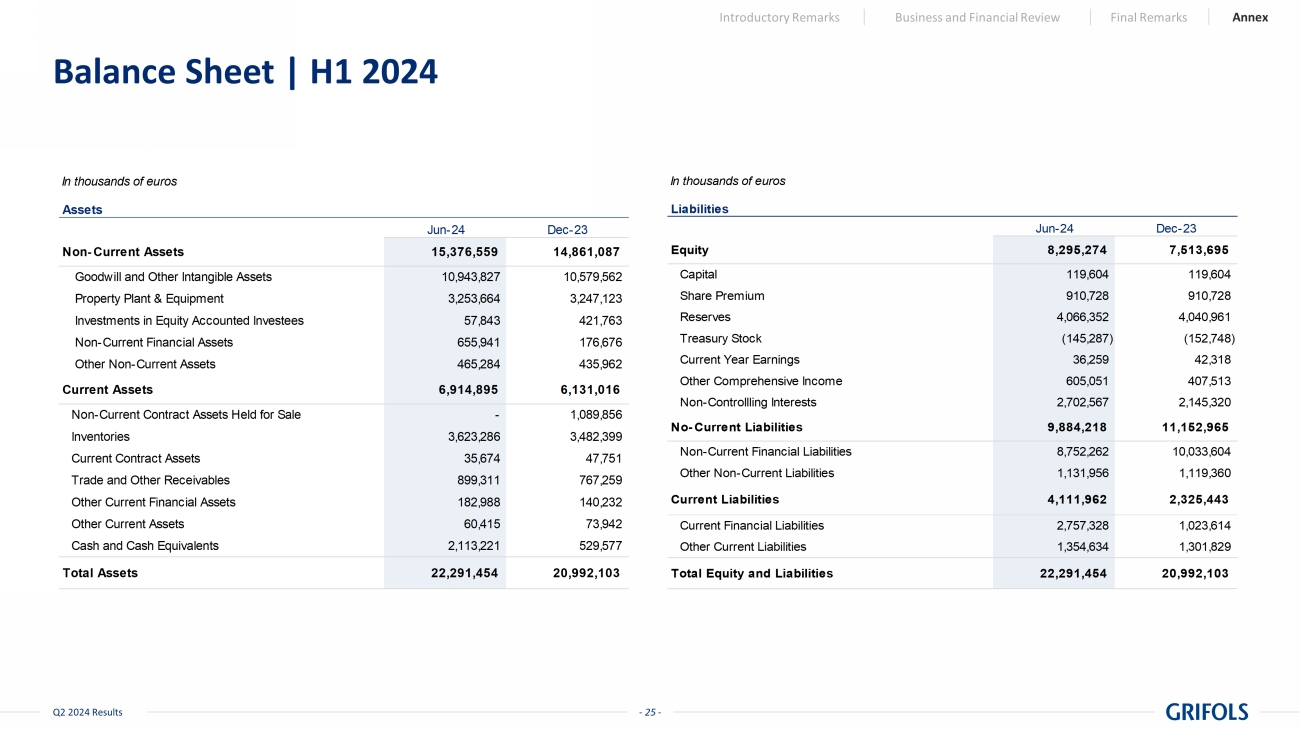
- 25 - Q2 2024 Results Balance Sheet | H1 2024 Introductory Remarks Business and Financial Review Final Remarks Annex In thousands of euros Jun-24 Dec-23 15,376,559 14,861,087 10,943,827 10,579,562 3,253,664 3,247,123 57,843 421,763 655,941 176,676 465,284 435,962 6,914,895 6,131,016 - 1,089,856 3,623,286 3,482,399 35,674 47,751 899,311 767,259 182,988 140,232 60,415 73,942 2,113,221 529,577 22,291,454 20,992,103 Assets Non-Current Assets Total Assets Current Assets Inventories Current Contract Assets Other Current Financial Assets Non-Current Contract Assets Held for Sale Trade and Other Receivables Investments in Equity Accounted Investees Non-Current Financial Assets Other Non-Current Assets Other Current Assets Cash and Cash Equivalents Goodwill and Other Intangible Assets Property Plant & Equipment In thousands of euros Jun-24 Dec-23 8,295,274 7,513,695 119,604 119,604 910,728 910,728 4,066,352 4,040,961 Treasury Stock (145,287) (152,748) 36,259 42,318 605,051 407,513 2,702,567 2,145,320 9,884,218 11,152,965 8,752,262 10,033,604 1,131,956 1,119,360 4,111,962 2,325,443 2,757,328 1,023,614 1,354,634 1,301,829 22,291,454 20,992,103 Equity Liabilities Other Current Liabilities Total Equity and Liabilities Other Comprehensive Income Non-Controllling Interests No-Current Liabilities Non-Current Financial Liabilities Other Non-Current Liabilities Share Premium Reserves Current Year Earnings Current Liabilities Current Financial Liabilities Capital
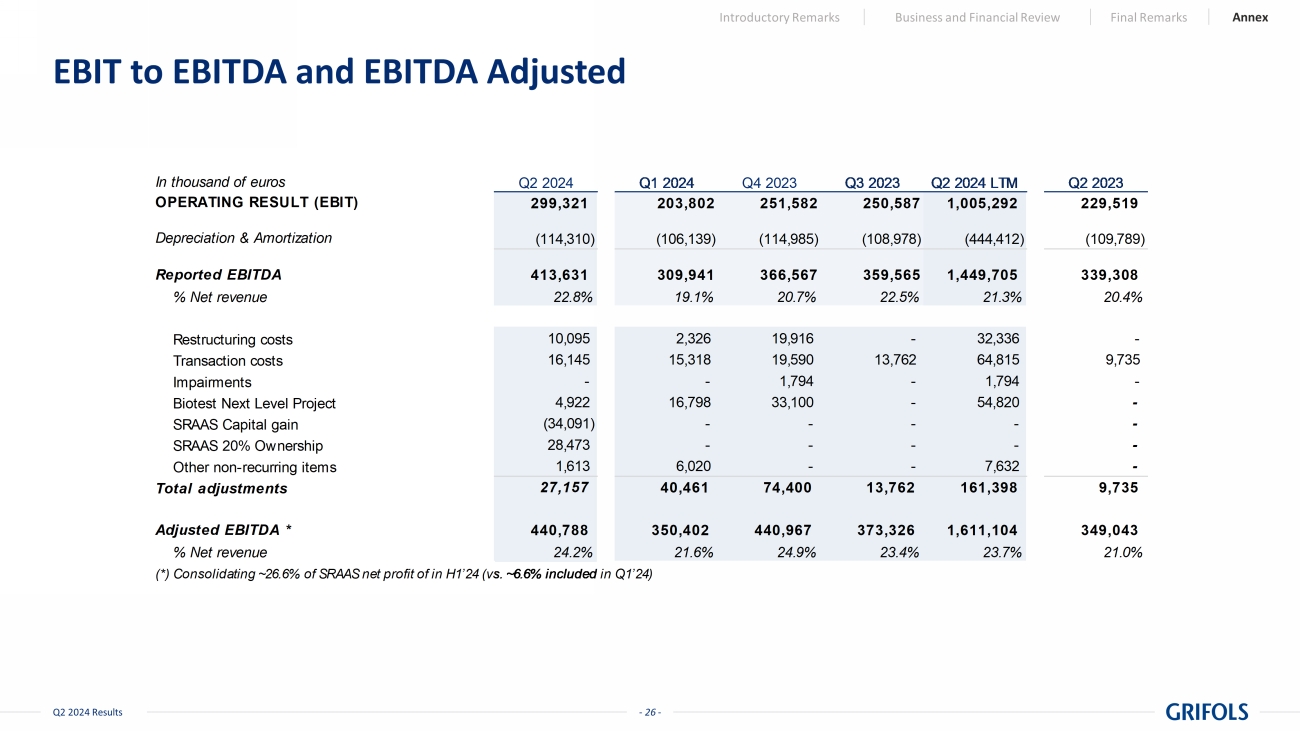
- 26 - Q2 2024 Results EBIT to EBITDA and EBITDA Adjusted Introductory Remarks Business and Financial Review Final Remarks Annex In thousand of euros 299,321 203,802 251,582 250,587 1,005,292 229,519 (114,310) (106,139) (114,985) (108,978) (444,412) (109,789) Reported EBITDA 413,631 309,941 366,567 359,565 1,449,705 339,308 % Net revenue 22.8% 19.1% 20.7% 22.5% 21.3% 20.4% Restructuring costs 10,095 2,326 19,916 - 32,336 - Transaction costs 16,145 15,318 19,590 13,762 64,815 9,735 Impairments - - 1,794 - 1,794 - Biotest Next Level Project 4,922 16,798 33,100 - 54,820 - SRAAS Capital gain (34,091) - - - - - SRAAS 20% Ownership 28,473 - - - - - Other non-recurring items 1,613 6,020 - - 7,632 - Total adjustments 27,157 40,461 74,400 13,762 161,398 9,735 Adjusted EBITDA * 440,788 350,402 440,967 373,326 1,611,104 349,043 % Net revenue 24.2% 21.6% 24.9% 23.4% 23.7% 21.0% (*) Consolidating ~26.6% of SRAAS net profit of in H1’24 (vs. ~6.6% included in Q1’24) Q2 2024 Q4 2023 Q3 2023 Q2 2023Q1 2024 Q2 2024 LTM Depreciation & Amortization OPERATING RESULT (EBIT)
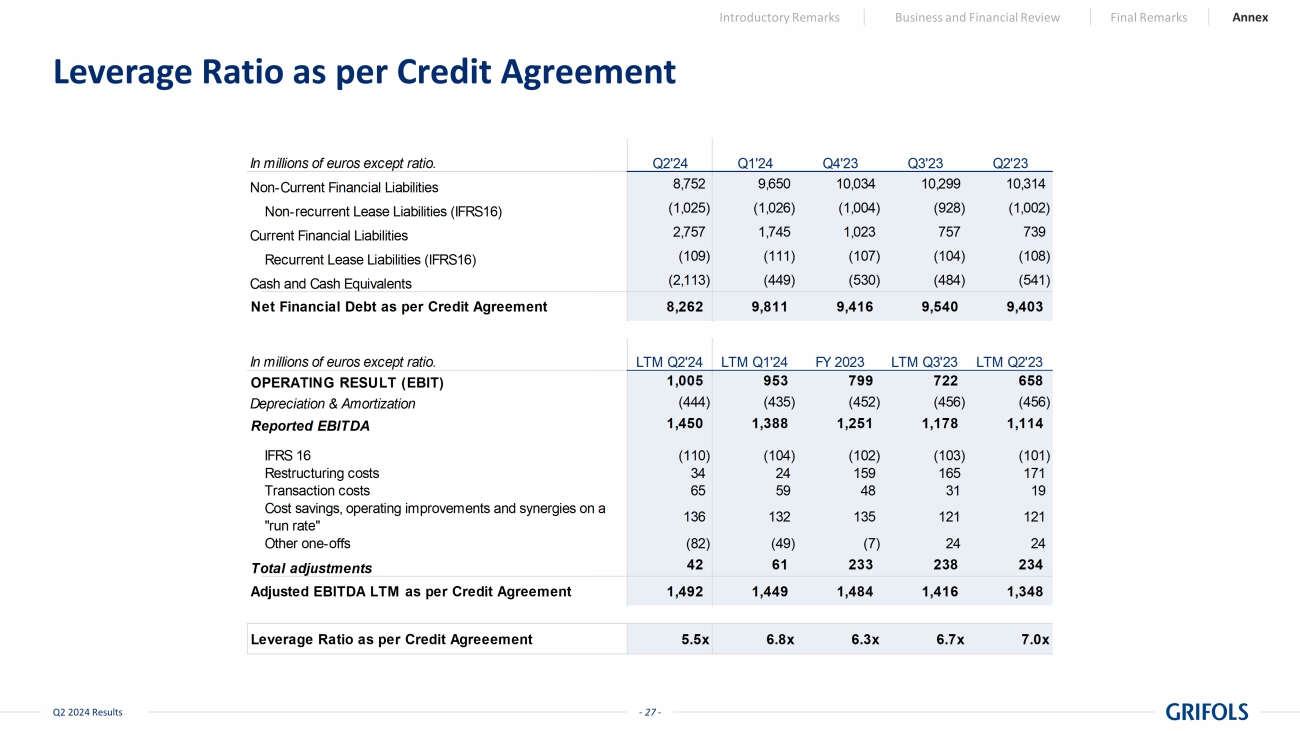
- 27 - Q2 2024 Results Leverage Ratio as per Credit Agreement Introductory Remarks Business and Financial Review Final Remarks Annex In millions of euros except ratio. Q2'24 Q1'24 Q4'23 Q3'23 Q2'23 Non-Current Financial Liabilities 8,752 9,650 10,034 10,299 10,314 Non-recurrent Lease Liabilities (IFRS16) (1,025) (1,026) (1,004) (928) (1,002) Current Financial Liabilities 2,757 1,745 1,023 757 739 Recurrent Lease Liabilities (IFRS16) (109) (111) (107) (104) (108) Cash and Cash Equivalents (2,113) (449) (530) (484) (541) Net Financial Debt as per Credit Agreement 8,262 9,811 9,416 9,540 9,403 In millions of euros except ratio. LTM Q2'24 LTM Q1'24 FY 2023 LTM Q3'23 LTM Q2'23 OPERATING RESULT (EBIT) 1,005 953 799 722 658 Depreciation & Amortization (444) (435) (452) (456) (456) Reported EBITDA 1,450 1,388 1,251 1,178 1,114 IFRS 16 (110) (104) (102) (103) (101) Restructuring costs 34 24 159 165 171 Transaction costs 65 59 48 31 19 Cost savings, operating improvements and synergies on a "run rate" 136 132 135 121 121 Other one-offs (82) (49) (7) 24 24 Total adjustments 42 61 233 238 234 Adjusted EBITDA LTM as per Credit Agreement 1,492 1,449 1,484 1,416 1,348 Leverage Ratio as per Credit Agreeement 5.5x 6.8x 6.3x 6.7x 7.0x
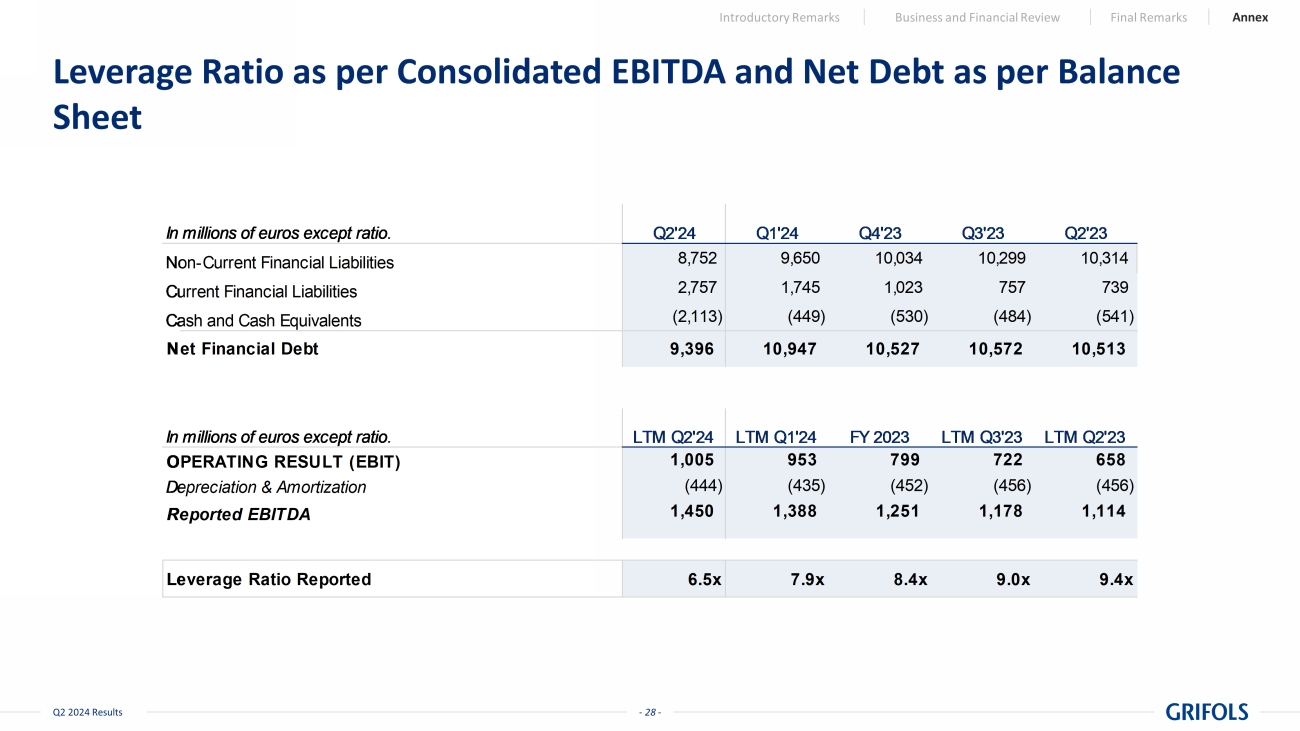
- 28 - Q2 2024 Results Leverage Ratio as per Consolidated EBITDA and Net Debt as per Balance Sheet Introductory Remarks Business and Financial Review Final Remarks Annex In millions of euros except ratio. Q2'24 Q1'24 Q4'23 Q3'23 Q2'23 Non-Current Financial Liabilities 8,752 9,650 10,034 10,299 10,314 Current Financial Liabilities 2,757 1,745 1,023 757 739 Cash and Cash Equivalents (2,113) (449) (530) (484) (541) Net Financial Debt 9,396 10,947 10,527 10,572 10,513 In millions of euros except ratio. LTM Q2'24 LTM Q1'24 FY 2023 LTM Q3'23 LTM Q2'23 OPERATING RESULT (EBIT) 1,005 953 799 722 658 Depreciation & Amortization (444) (435) (452) (456) (456) Reported EBITDA 1,450 1,388 1,251 1,178 1,114 Leverage Ratio Reported 6.5x 7.9x 8.4x 9.0x 9.4x
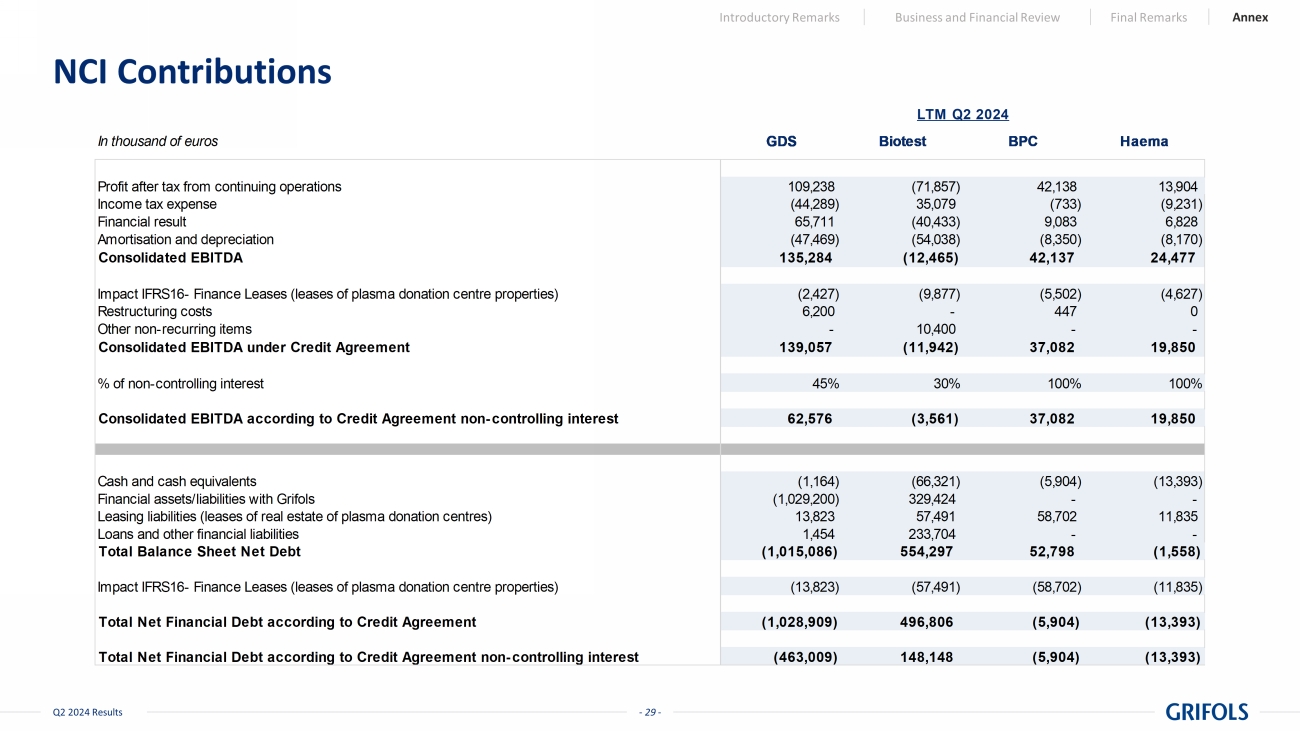
- 29 - Q2 2024 Results NCI Contributions Introductory Remarks Business and Financial Review Final Remarks Annex In thousand of euros GDS Biotest BPC Haema Profit after tax from continuing operations 109,238 (71,857) 42,138 13,904 Income tax expense (44,289) 35,079 (733) (9,231) Financial result 65,711 (40,433) 9,083 6,828 Amortisation and depreciation (47,469) (54,038) (8,350) (8,170) Consolidated EBITDA 135,284 (12,465) 42,137 24,477 Impact IFRS16- Finance Leases (leases of plasma donation centre properties) (2,427) (9,877) (5,502) (4,627) Restructuring costs 6,200 - 447 0 Other non-recurring items - 10,400 - - Consolidated EBITDA under Credit Agreement 139,057 (11,942) 37,082 19,850 % of non-controlling interest 45% 30% 100% 100% Consolidated EBITDA according to Credit Agreement non-controlling interest 62,576 (3,561) 37,082 19,850 Cash and cash equivalents (1,164) (66,321) (5,904) (13,393) Financial assets/liabilities with Grifols (1,029,200) 329,424 - - Leasing liabilities (leases of real estate of plasma donation centres) 13,823 57,491 58,702 11,835 Loans and other financial liabilities 1,454 233,704 - - Total Balance Sheet Net Debt (1,015,086) 554,297 52,798 (1,558) Impact IFRS16- Finance Leases (leases of plasma donation centre properties) (13,823) (57,491) (58,702) (11,835) Total Net Financial Debt according to Credit Agreement (1,028,909) 496,806 (5,904) (13,393) Total Net Financial Debt according to Credit Agreement non-controlling interest (463,009) 148,148 (5,904) (13,393) LTM Q2 2024
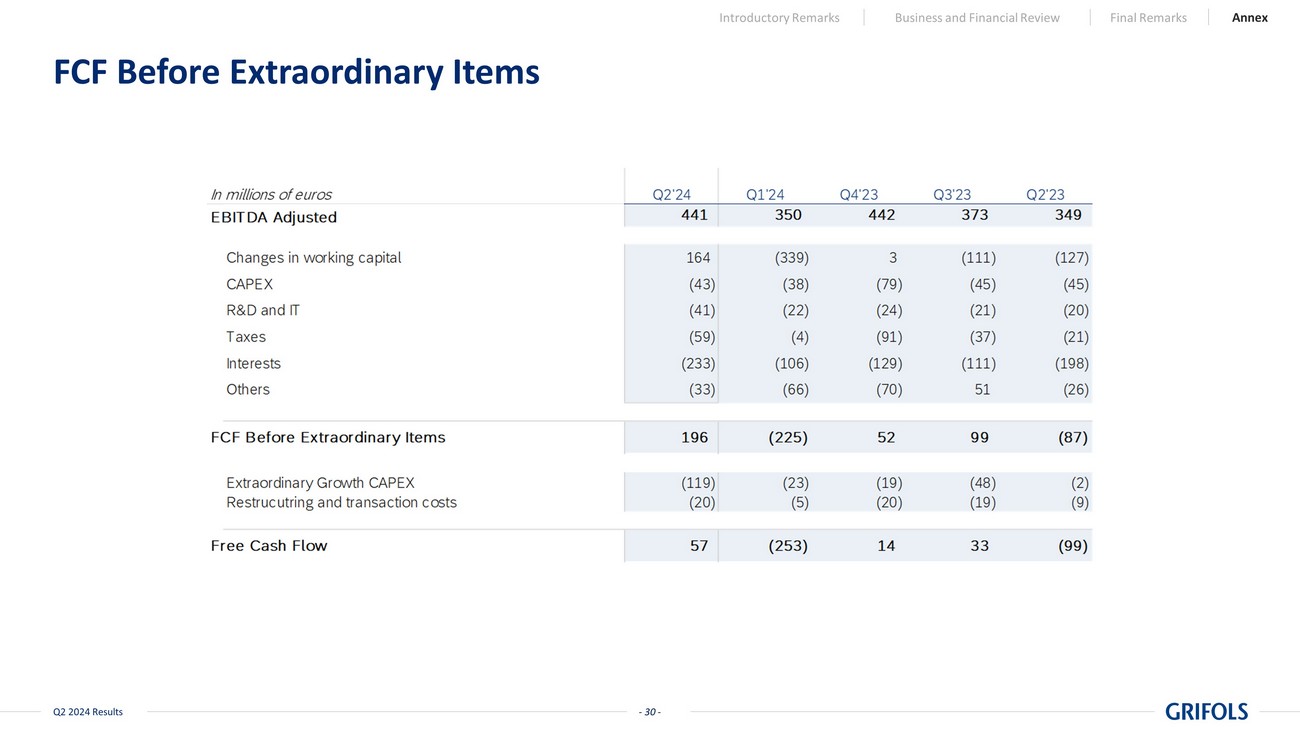
- 30 - Q2 2024 Results FCF Before Extraordinary Items Introductory Remarks Business and Financial Review Final Remarks Annex - 30 -
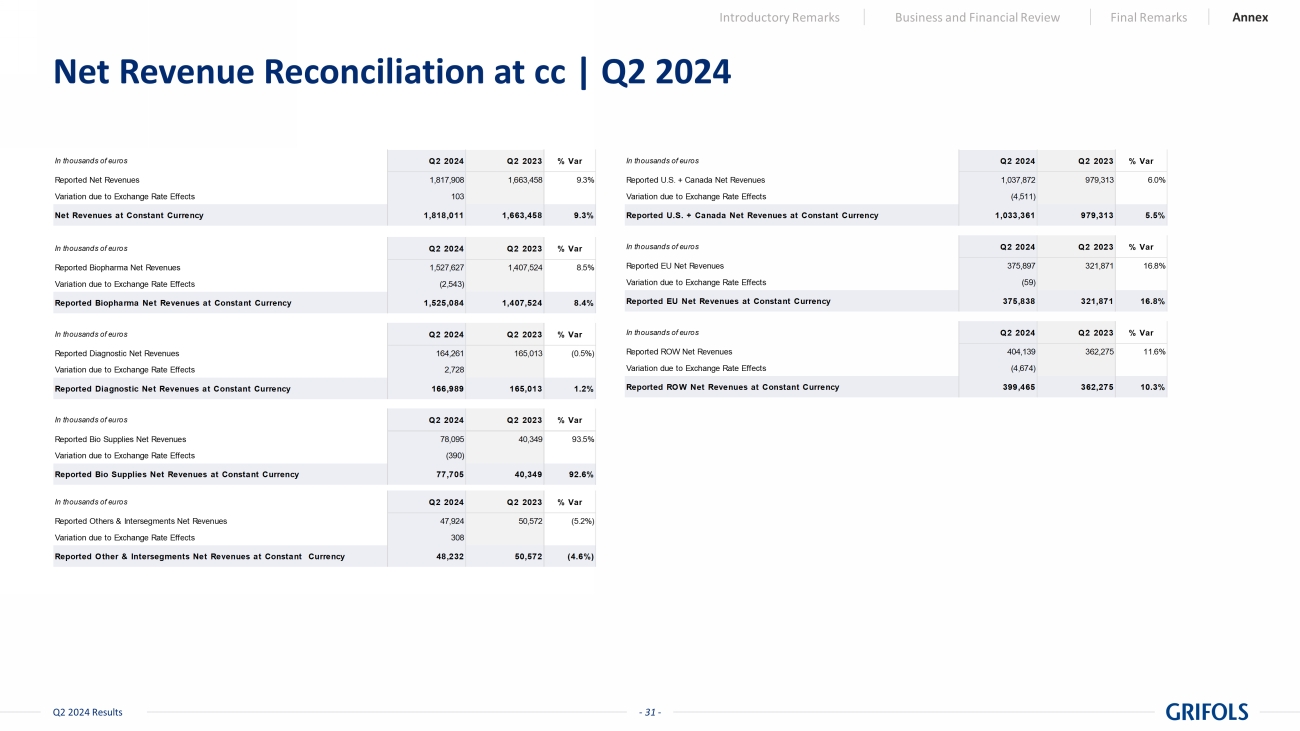
- 31 - Q2 2024 Results Net Revenue Reconciliation at cc | Q2 2024 Introductory Remarks Business and Financial Review Final Remarks Annex In thousands of euros Q2 2024 Q2 2023 % Var Reported Net Revenues 1,817,908 1,663,458 9.3% Variation due to Exchange Rate Effects 103 Net Revenues at Constant Currency 1,818,011 1,663,458 9.3% In thousands of euros Q2 2024 Q2 2023 % Var Reported Biopharma Net Revenues 1,527,627 1,407,524 8.5% Variation due to Exchange Rate Effects (2,543) Reported Biopharma Net Revenues at Constant Currency 1,525,084 1,407,524 8.4% In thousands of euros Q2 2024 Q2 2023 % Var Reported Diagnostic Net Revenues 164,261 165,013 (0.5%) Variation due to Exchange Rate Effects 2,728 Reported Diagnostic Net Revenues at Constant Currency 166,989 165,013 1.2% In thousands of euros Q2 2024 Q2 2023 % Var Reported Bio Supplies Net Revenues 78,095 40,349 93.5% Variation due to Exchange Rate Effects (390) Reported Bio Supplies Net Revenues at Constant Currency 77,705 40,349 92.6% In thousands of euros Q2 2024 Q2 2023 % Var Reported Others & Intersegments Net Revenues 47,924 50,572 (5.2%) Variation due to Exchange Rate Effects 308 Reported Other & Intersegments Net Revenues at Constant Currency 48,232 50,572 (4.6%) In thousands of euros Q2 2024 Q2 2023 % Var Reported U.S. + Canada Net Revenues 1,037,872 979,313 6.0% Variation due to Exchange Rate Effects (4,511) Reported U.S. + Canada Net Revenues at Constant Currency 1,033,361 979,313 5.5% In thousands of euros Q2 2024 Q2 2023 % Var Reported EU Net Revenues 375,897 321,871 16.8% Variation due to Exchange Rate Effects (59) Reported EU Net Revenues at Constant Currency 375,838 321,871 16.8% In thousands of euros Q2 2024 Q2 2023 % Var Reported ROW Net Revenues 404,139 362,275 11.6% Variation due to Exchange Rate Effects (4,674) Reported ROW Net Revenues at Constant Currency 399,465 362,275 10.3%

- 32 - Q2 2024 Results Net Revenue Reconciliation at cc | H1 2024 Introductory Remarks Business and Financial Review Final Remarks Annex In thousands of euros H1 2024 H1 2023 % Var Reported Net Revenues 3,443,613 3,224,946 6.8% Variation due to Exchange Rate Effects 21,687 Net Revenues at Constant Currency 3,465,300 3,224,946 7.5% In thousands of euros H1 2024 H1 2023 % Var Reported Biopharma Net Revenues 2,922,355 2,698,215 8.3% Variation due to Exchange Rate Effects 14,733 Reported Biopharma Net Revenues at Constant Currency 2,937,088 2,698,215 8.9% In thousands of euros H1 2024 H1 2023 % Var Reported Diagnostic Net Revenues 322,544 341,488 (5.5%) Variation due to Exchange Rate Effects 6,351 Reported Diagnostic Net Revenues at Constant Currency 328,895 341,488 (3.7%) In thousands of euros H1 2024 H1 2023 % Var Reported Bio Supplies Net Revenues 109,563 82,616 32.6% Variation due to Exchange Rate Effects (22) Reported Bio Supplies Net Revenues at Constant Currency 109,541 82,616 32.6% In thousands of euros H1 2024 H1 2023 % Var Reported Others & Intersegments Net Revenues 89,151 102,628 (13.1%) Variation due to Exchange Rate Effects 624 Reported Other & Intersegments Net Revenues at Constant Currency 89,775 102,628 (12.5%) In thousands of euros H1 2024 H1 2023 % Var Reported U.S. + Canada Net Revenues 1,963,198 1,922,864 2.1% Variation due to Exchange Rate Effects 10,406 Reported U.S. + Canada Net Revenues at Constant Currency 1,973,604 1,922,864 2.6% In thousands of euros H1 2024 H1 2023 % Var Reported EU Net Revenues 707,423 627,531 12.7% Variation due to Exchange Rate Effects (225) Reported EU Net Revenues at Constant Currency 707,198 627,531 12.7% In thousands of euros H1 2024 H1 2023 % Var Reported ROW Net Revenues 772,992 674,551 14.6% Variation due to Exchange Rate Effects 11,506 Reported ROW Net Revenues at Constant Currency 784,498 674,551 16.3%

- 33 - Q2 2024 Results Investor Relations & Sustainability + 34 93 571 02 21 investors@grifols.com sustainability@grifols.com inversores@grifols.com sostenibilidad@grifols.com
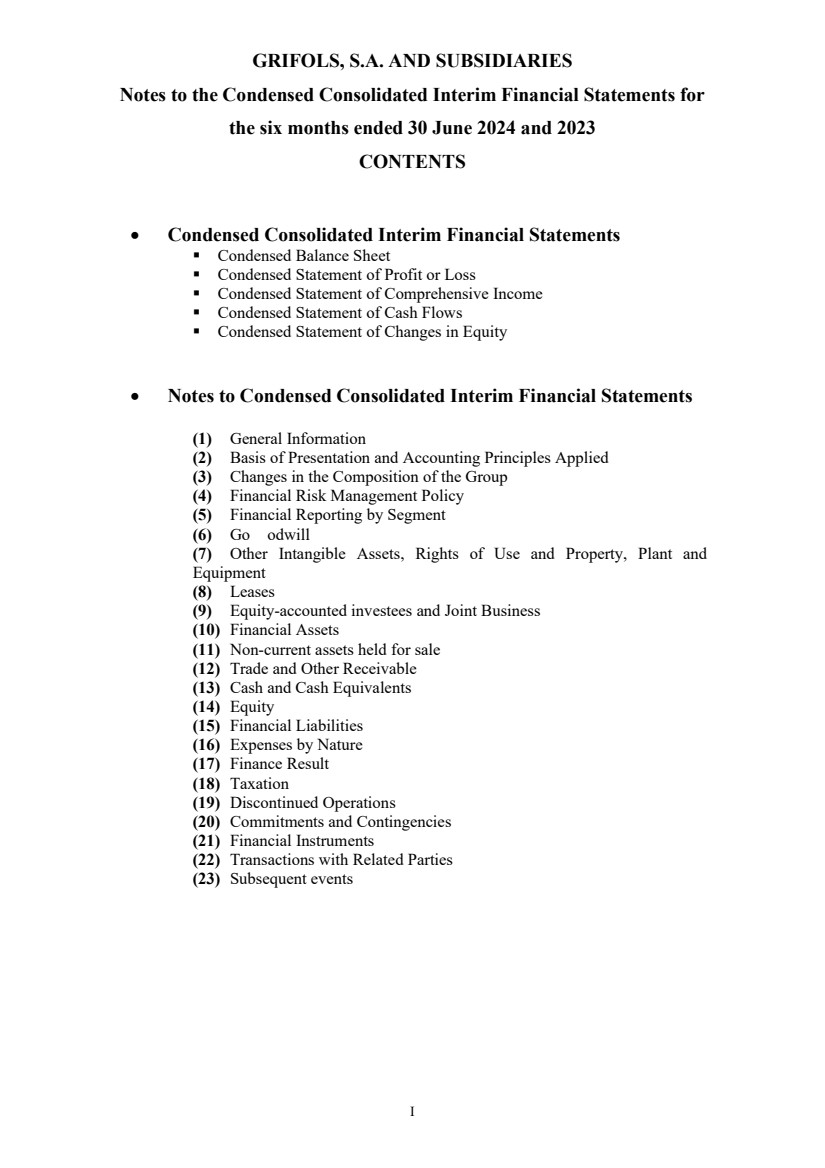
| GRIFOLS, S.A. AND SUBSIDIARIES
Notes to the Condensed Consolidated Interim Financial Statements for
the six months ended 30 June 2024 and 2023
CONTENTS
I
• Condensed Consolidated Interim Financial Statements
▪ Condensed Balance Sheet
▪ Condensed Statement of Profit or Loss
▪ Condensed Statement of Comprehensive Income
▪ Condensed Statement of Cash Flows
▪ Condensed Statement of Changes in Equity
• Notes to Condensed Consolidated Interim Financial Statements
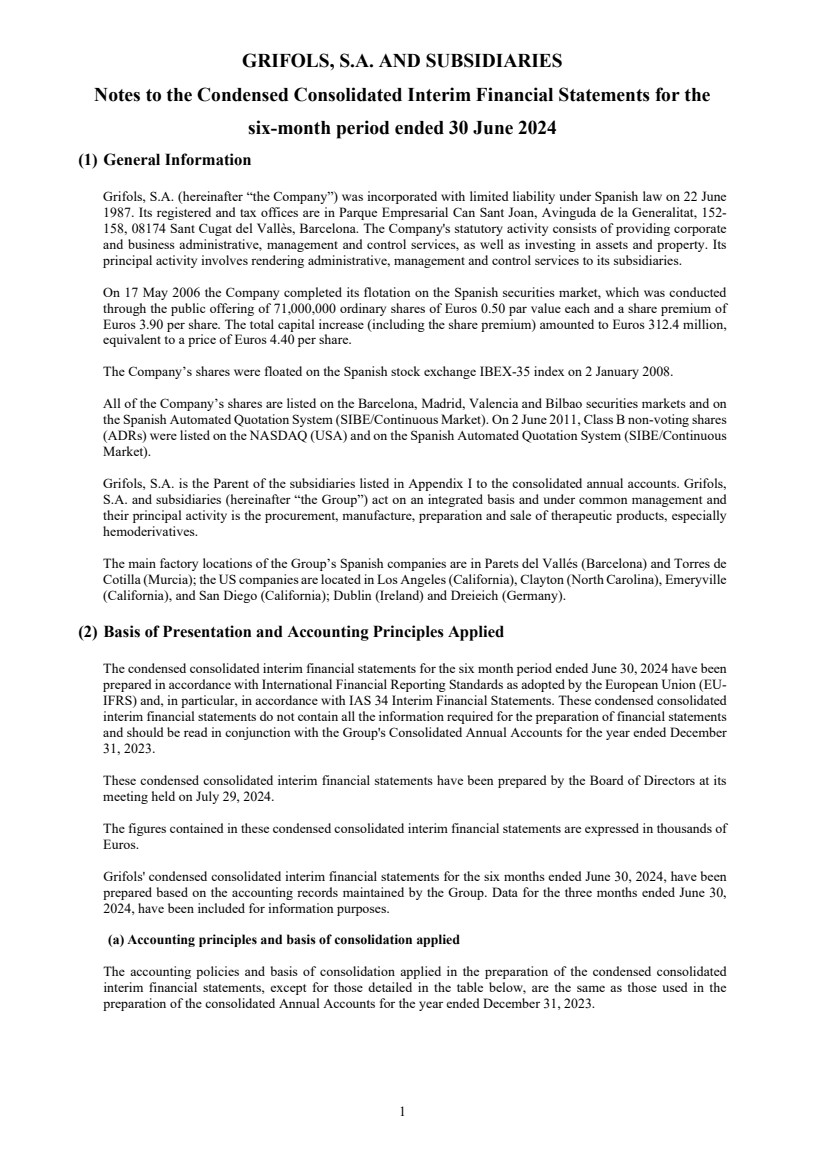
(1) General Information
(2) Basis of Presentation and Accounting Principles Applied
(3) Changes in the Composition of the Group
(4) Financial Risk Management Policy
(5) Financial Reporting by Segment
(6) Go odwill
(7) Other Intangible Assets, Rights of Use and Property, Plant and
Equipment
(8) Leases
(9) Equity-accounted investees and Joint Business
(10) Financial Assets
(11) Non-current assets held for sale
(12) Trade and Other Receivable
(13) Cash and Cash Equivalents
(14) Equity
(15) Financial Liabilities
(16) Expenses by Nature
(17) Finance Result
(18) Taxation
(19) Discontinued Operations
(20) Commitments and Contingencies
(21) Financial Instruments
(22) Transactions with Related Parties
(23) Subsequent events |
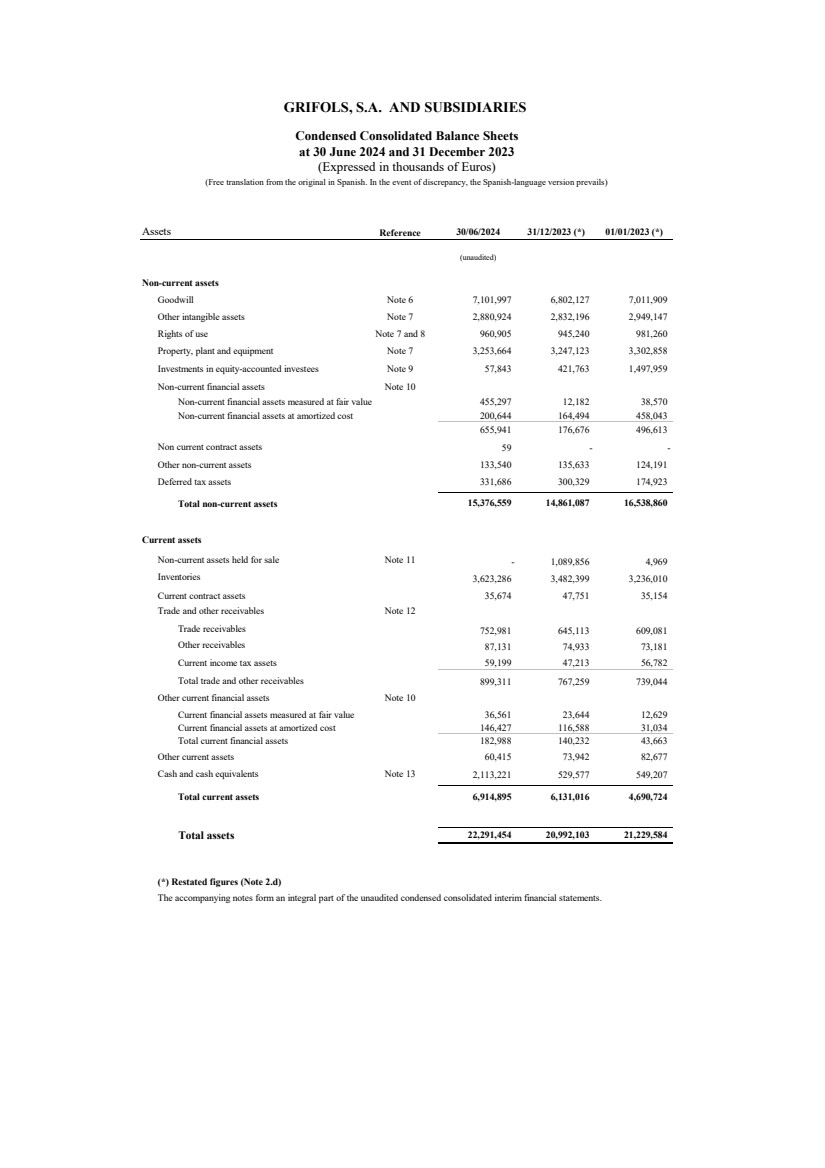
| Assets Reference 30/06/2024 31/12/2023 (*) 01/01/2023 (*)
(unaudited)
Non-current assets
Goodwill Note 6 7,101,997 6,802,127 7,011,909
Other intangible assets Note 7 2,880,924 2,832,196 2,949,147
Rights of use Note 7 and 8 960,905 945,240 981,260
Property, plant and equipment Note 7 3,253,664 3,247,123 3,302,858
Investments in equity-accounted investees Note 9 57,843 421,763 1,497,959
Non-current financial assets Note 10
Non-current financial assets measured at fair value 455,297 12,182 38,570
Non-current financial assets at amortized cost 200,644 164,494 458,043
655,941 176,676 496,613
Non current contract assets 59 - -
Other non-current assets 133,540 135,633 124,191
Deferred tax assets 331,686 300,329 174,923
Total non-current assets 15,376,559 14,861,087 16,538,860
Current assets
Non-current assets held for sale Note 11 - 1,089,856 4,969
Inventories 3,623,286 3,482,399 3,236,010
Current contract assets 35,674 47,751 35,154
Trade and other receivables Note 12
Trade receivables 752,981 645,113 609,081
Other receivables 87,131 74,933 73,181
Current income tax assets 59,199 47,213 56,782
Total trade and other receivables 899,311 767,259 739,044
Other current financial assets Note 10
Current financial assets measured at fair value 36,561 23,644 12,629
Current financial assets at amortized cost 146,427 116,588 31,034
Total current financial assets 182,988 140,232 43,663
Other current assets 60,415 73,942 82,677
Cash and cash equivalents Note 13 2,113,221 529,577 549,207
Total current assets 6,914,895 6,131,016 4,690,724
Total assets 22,291,454 20,992,103 21,229,584
(*) Restated figures (Note 2.d)
The accompanying notes form an integral part of the unaudited condensed consolidated interim financial statements.
GRIFOLS, S.A. AND SUBSIDIARIES
Condensed Consolidated Balance Sheets
at 30 June 2024 and 31 December 2023
(Expressed in thousands of Euros)
(Free translation from the original in Spanish. In the event of discrepancy, the Spanish-language version prevails) |
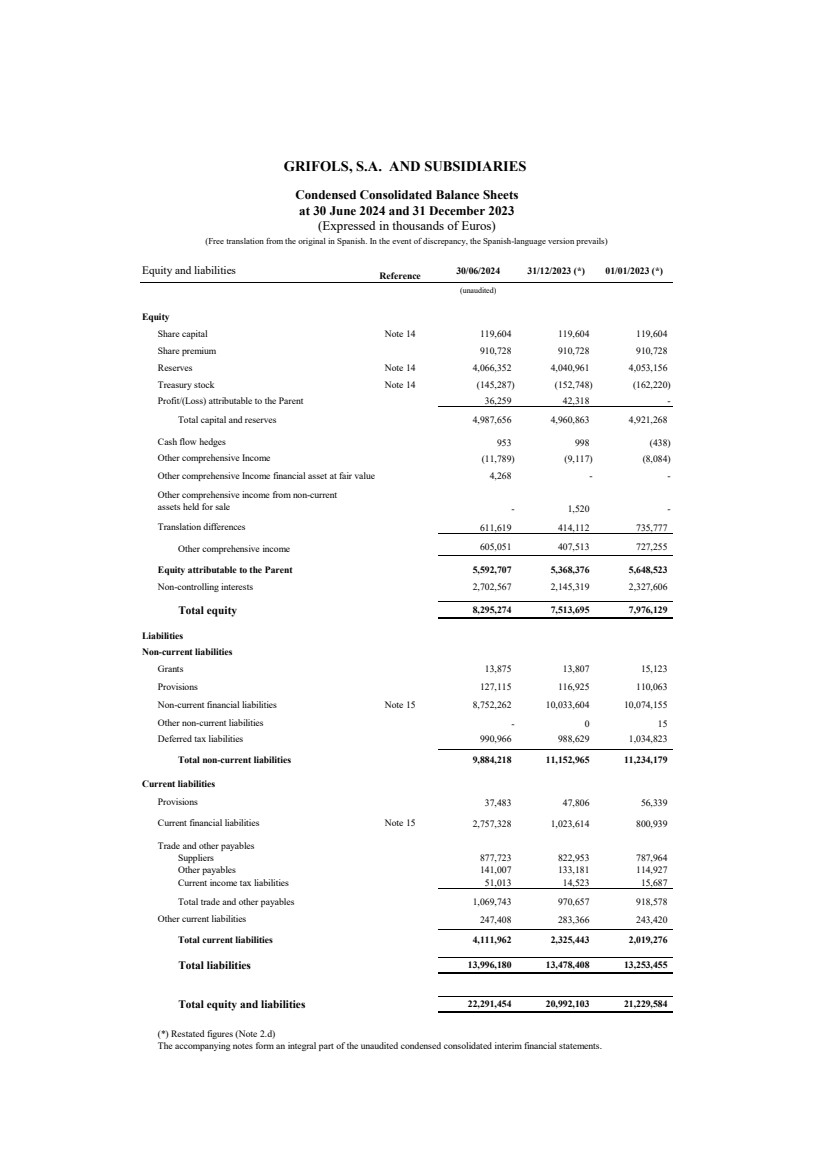
| Equity and liabilities Reference 30/06/2024 31/12/2023 (*) 01/01/2023 (*)
(unaudited)
Equity
Share capital Note 14 119,604 119,604 119,604
Share premium 0 910,728 910,728 910,728
Reserves Note 14 4,066,352 4,040,961 4,053,156
Treasury stock Note 14 (145,287) (152,748) (162,220)
Profit/(Loss) attributable to the Parent 0 36,259 42,318 -
Total capital and reserves 4,987,656 4,960,863 4,921,268
Cash flow hedges 953 998 (438)
Other comprehensive Income (11,789) (9,117) (8,084)
Other comprehensive Income financial asset at fair value 4,268 - -
- 1,520 -
Translation differences 611,619 414,112 735,777
Other comprehensive income 0 605,051 407,513 727,255
Equity attributable to the Parent 5,592,707 5,368,376 5,648,523
Non-controlling interests 0 2,702,567 2,145,319 2,327,606
Total equity 8,295,274 7,513,695 7,976,129
Liabilities
Non-current liabilities
Grants 13,875 13,807 15,123
Provisions 127,115 116,925 110,063
Non-current financial liabilities Note 15 8,752,262 10,033,604 10,074,155
Other non-current liabilities - 0 15
Deferred tax liabilities 0 990,966 988,629 1,034,823
Total non-current liabilities 0 9,884,218 11,152,965 11,234,179
Current liabilities
Provisions 37,483 47,806 56,339
Current financial liabilities Note 15 2,757,328 1,023,614 800,939
Trade and other payables 0
Suppliers 877,723 822,953 787,964
Other payables 141,007 133,181 114,927
Current income tax liabilities 51,013 14,523 15,687
Total trade and other payables 1,069,743 970,657 918,578
Other current liabilities 0 247,408 283,366 243,420
Total current liabilities 0 4,111,962 2,325,443 2,019,276
Total liabilities 13,996,180 13,478,408 13,253,455
Total equity and liabilities 0 22,291,454 20,992,103 21,229,584
(*) Restated figures (Note 2.d)
The accompanying notes form an integral part of the unaudited condensed consolidated interim financial statements.
Other comprehensive income from non-current
assets held for sale
GRIFOLS, S.A. AND SUBSIDIARIES
Condensed Consolidated Balance Sheets
at 30 June 2024 and 31 December 2023
(Expressed in thousands of Euros)
(Free translation from the original in Spanish. In the event of discrepancy, the Spanish-language version prevails) |
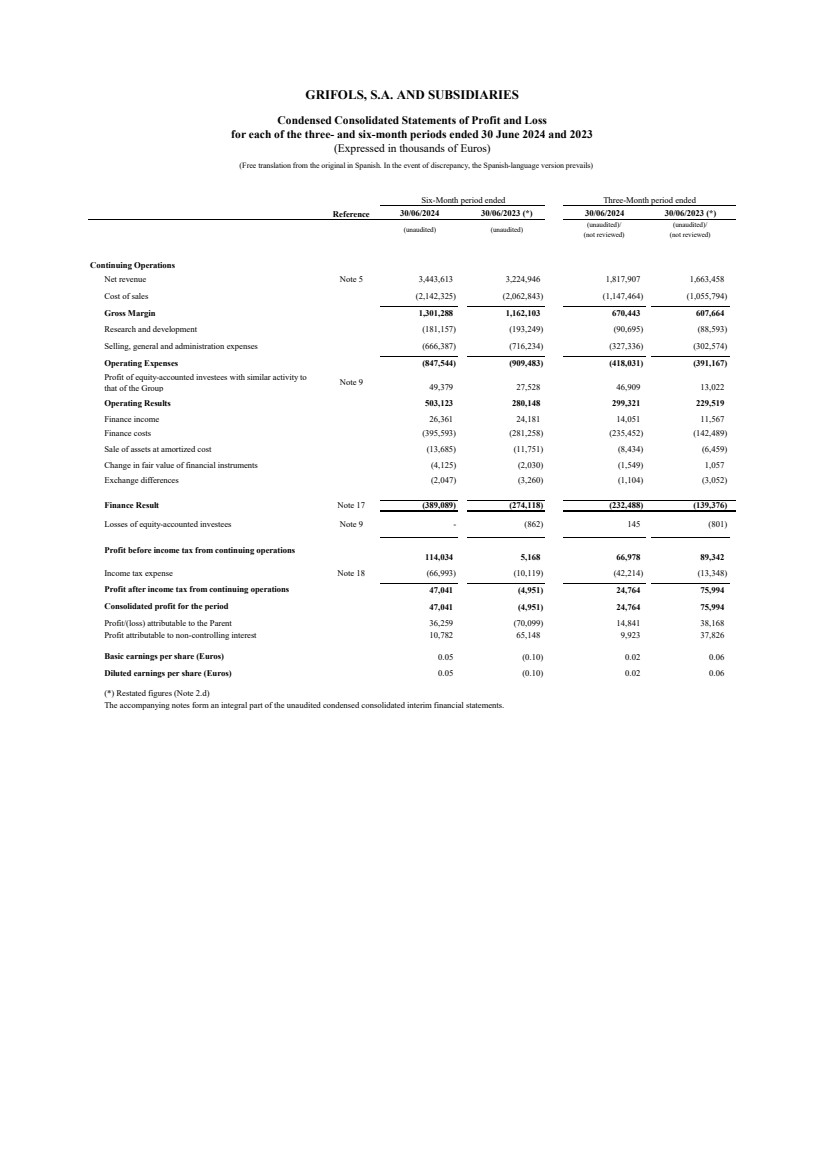
| Reference 30/06/2024 30/06/2023 (*) 30/06/2024 30/06/2023 (*)
(unaudited) (unaudited) (unaudited)/
(not reviewed)
(unaudited)/
(not reviewed)
Continuing Operations
Net revenue Note 5 3,443,613 3,224,946 1,817,907 1,663,458
Cost of sales (2,142,325) (2,062,843) (1,147,464) (1,055,794)
Gross Margin 1,301,288 1,162,103 670,443 607,664
Research and development (181,157) (193,249) (90,695) (88,593)
Selling, general and administration expenses (666,387) (716,234) (327,336) (302,574)
Operating Expenses (847,544) (909,483) (418,031) (391,167)
Profit of equity-accounted investees with similar activity to
that of the Group Note 9 49,379 27,528 46,909 13,022
Operating Results 503,123 280,148 299,321 229,519
Finance income 26,361 24,181 14,051 11,567
Finance costs (395,593) (281,258) (235,452) (142,489)
Sale of assets at amortized cost (13,685) (11,751) (8,434) (6,459)
Change in fair value of financial instruments (4,125) (2,030) (1,549) 1,057
Exchange differences (2,047) (3,260) (1,104) (3,052)
Finance Result Note 17 (389,089) (274,118) (232,488) (139,376)
Losses of equity-accounted investees Note 9 - (862) 145 (801)
Profit before income tax from continuing operations
114,034 5,168 66,978 89,342
Income tax expense Note 18 (66,993) (10,119) (42,214) (13,348)
Profit after income tax from continuing operations 47,041 (4,951) 24,764 75,994
Consolidated profit for the period 47,041 (4,951) 24,764 75,994
Profit/(loss) attributable to the Parent 36,259 (70,099) 14,841 38,168
Profit attributable to non-controlling interest 10,782 65,148 9,923 37,826
Basic earnings per share (Euros) 0.05 (0.10) 0.02 0.06
Diluted earnings per share (Euros) 0.05 (0.10) 0.02 0.06
(*) Restated figures (Note 2.d)
The accompanying notes form an integral part of the unaudited condensed consolidated interim financial statements.
GRIFOLS, S.A. AND SUBSIDIARIES
Condensed Consolidated Statements of Profit and Loss
for each of the three- and six-month periods ended 30 June 2024 and 2023
(Expressed in thousands of Euros)
Six-Month period ended Three-Month period ended
(Free translation from the original in Spanish. In the event of discrepancy, the Spanish-language version prevails) |
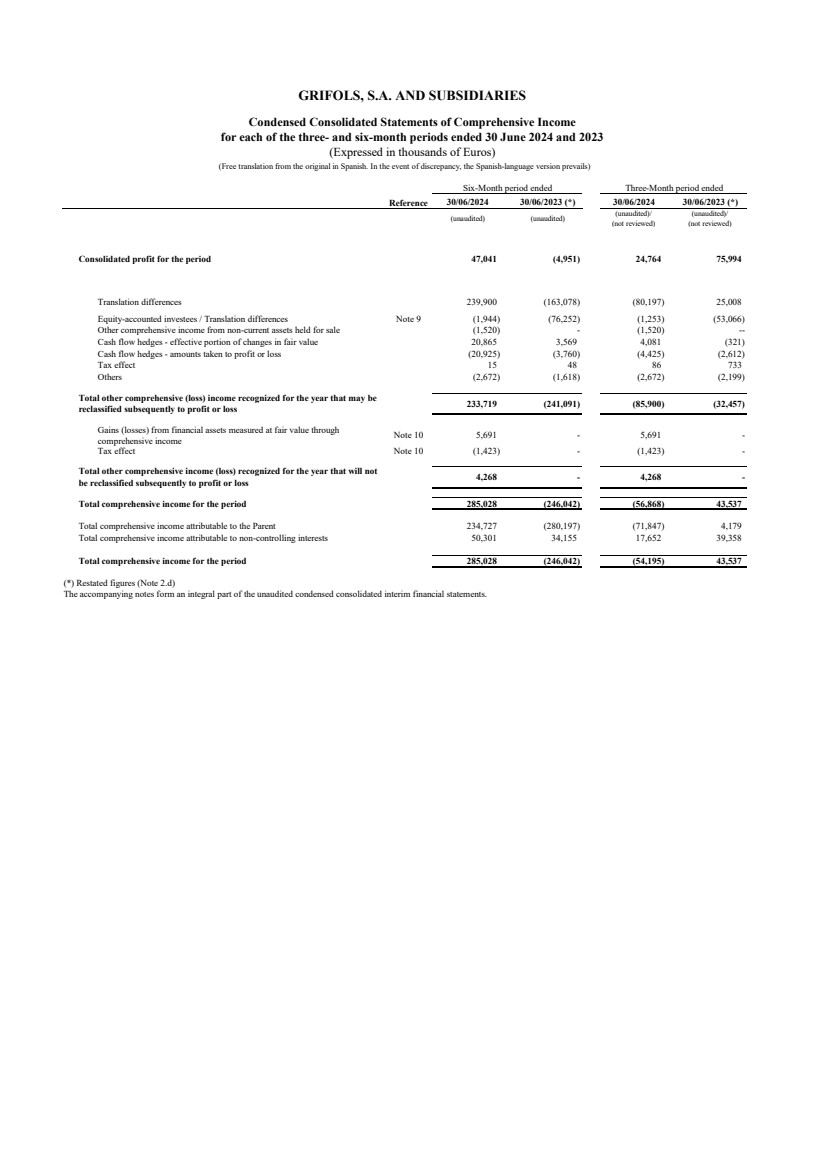
| Reference 30/06/2024 30/06/2023 (*) 30/06/2024 30/06/2023 (*)
(unaudited) (unaudited) (unaudited)/
(not reviewed)
(unaudited)/
(not reviewed)
Consolidated profit for the period 47,041 (4,951) 24,764 75,994
Translation differences 239,900 (163,078) (80,197) 25,008
Equity-accounted investees / Translation differences Note 9 (1,944) (76,252) (1,253) (53,066)
Other comprehensive income from non-current assets held for sale (1,520) - (1,520) --
Cash flow hedges - effective portion of changes in fair value 20,865 3,569 4,081 (321)
Cash flow hedges - amounts taken to profit or loss (20,925) (3,760) (4,425) (2,612)
Tax effect 15 48 86 733
Others (2,672) (1,618) (2,672) (2,199)
233,719 (241,091) (85,900) (32,457)
Gains (losses) from financial assets measured at fair value through
comprehensive income Note 10 5,691 - 5,691 -
Tax effect Note 10 (1,423) - (1,423) -
4,268 - 4,268 -
Total comprehensive income for the period 285,028 (246,042) (56,868) 43,537
Total comprehensive income attributable to the Parent 234,727 (280,197) (71,847) 4,179
50,301 34,155 17,652 39,358
Total comprehensive income for the period 285,028 (246,042) (54,195) 43,537
(*) Restated figures (Note 2.d)
The accompanying notes form an integral part of the unaudited condensed consolidated interim financial statements.
Condensed Consolidated Statements of Comprehensive Income
GRIFOLS, S.A. AND SUBSIDIARIES
Total comprehensive income attributable to non-controlling interests
Three-Month period ended
for each of the three- and six-month periods ended 30 June 2024 and 2023
(Expressed in thousands of Euros)
Six-Month period ended
(Free translation from the original in Spanish. In the event of discrepancy, the Spanish-language version prevails)
Total other comprehensive income (loss) recognized for the year that will not
be reclassified subsequently to profit or loss
Total other comprehensive (loss) income recognized for the year that may be
reclassified subsequently to profit or loss |
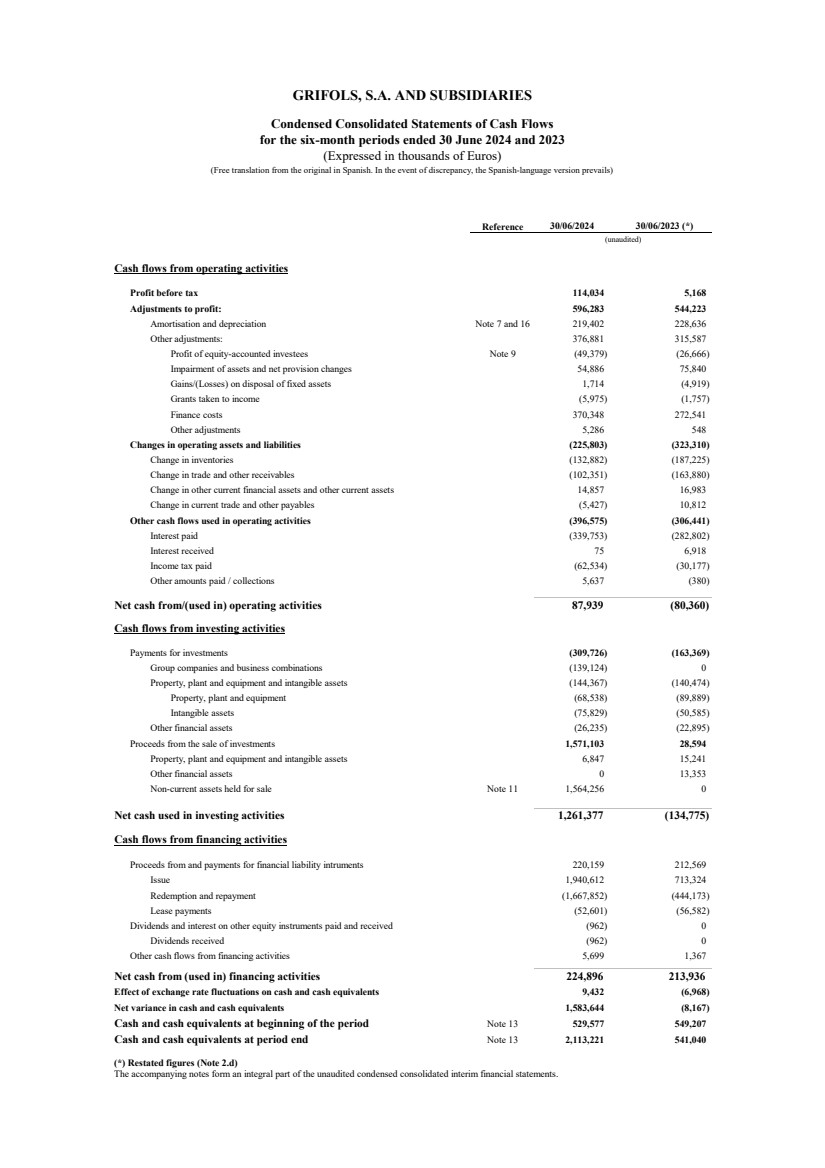
| Reference 30/06/2024 30/06/2023 (*)
Cash flows from operating activities
Profit before tax 114,034 5,168
Adjustments to profit: 596,283 544,223
Amortisation and depreciation Note 7 and 16 219,402 228,636
Other adjustments: 376,881 315,587
Profit of equity-accounted investees Note 9 (49,379) (26,666)
Impairment of assets and net provision changes 54,886 75,840
Gains/(Losses) on disposal of fixed assets 1,714 (4,919)
Grants taken to income (5,975) (1,757)
Finance costs 370,348 272,541
Other adjustments 5,286 548
Changes in operating assets and liabilities (225,803) (323,310)
Change in inventories (132,882) (187,225)
Change in trade and other receivables (102,351) (163,880)
Change in other current financial assets and other current assets 14,857 16,983
Change in current trade and other payables (5,427) 10,812
Other cash flows used in operating activities (396,575) (306,441)
Interest paid (339,753) (282,802)
Interest received 75 6,918
Income tax paid (62,534) (30,177)
Other amounts paid / collections 5,637 (380)
Net cash from/(used in) operating activities 87,939 (80,360)
Cash flows from investing activities
Payments for investments (309,726) (163,369)
Group companies and business combinations (139,124) 0
Property, plant and equipment and intangible assets (144,367) (140,474)
Property, plant and equipment (68,538) (89,889)
Intangible assets (75,829) (50,585)
Other financial assets (26,235) (22,895)
Proceeds from the sale of investments 1,571,103 28,594
Property, plant and equipment and intangible assets 6,847 15,241
Other financial assets 0 13,353
Non-current assets held for sale Note 11 1,564,256 0
Net cash used in investing activities 1,261,377 (134,775)
Cash flows from financing activities
Proceeds from and payments for financial liability intruments 220,159 212,569
Issue 1,940,612 713,324
Redemption and repayment (1,667,852) (444,173)
Lease payments (52,601) (56,582)
Dividends and interest on other equity instruments paid and received (962) 0
Dividends received (962) 0
Other cash flows from financing activities 5,699 1,367
Net cash from (used in) financing activities 224,896 213,936
Effect of exchange rate fluctuations on cash and cash equivalents 9,432 (6,968)
Net variance in cash and cash equivalents 1,583,644 (8,167)
Cash and cash equivalents at beginning of the period Note 13 529,577 549,207
Cash and cash equivalents at period end Note 13 2,113,221 541,040
(*) Restated figures (Note 2.d)
The accompanying notes form an integral part of the unaudited condensed consolidated interim financial statements.
for the six-month periods ended 30 June 2024 and 2023
GRIFOLS, S.A. AND SUBSIDIARIES
(unaudited)
Condensed Consolidated Statements of Cash Flows
(Expressed in thousands of Euros)
(Free translation from the original in Spanish. In the event of discrepancy, the Spanish-language version prevails) |
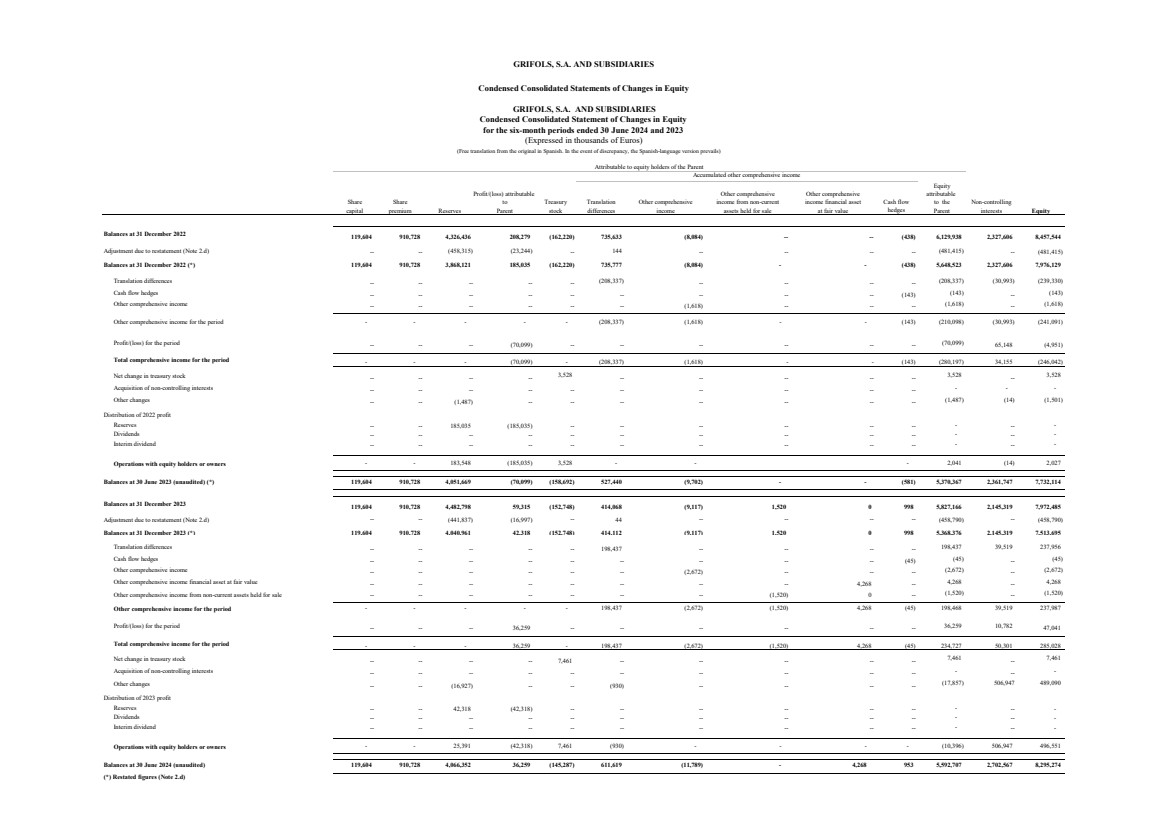
| Equity
Profit/(loss) attributable Other comprehensive Other comprehensive attributable
Share Share to Treasury Translation Other comprehensive income from non-current income financial asset to the Non-controlling
capital premium Reserves Parent stock differences income assets held for sale at fair value Parent interests Equity
Balances at 31 December 2022 119,604 910,728 4,326,436 208,279 (162,220) 735,633 (8,084) -- -- (438) 6,129,938 2,327,606 8,457,544
Adjustment due to restatement (Note 2.d) -- -- (458,315) (23,244) -- 144 -- -- -- -- (481,415) -- (481,415)
Balances at 31 December 2022 (*) 119,604 910,728 3,868,121 185,035 (162,220) 735,777 (8,084) - - (438) 5,648,523 2,327,606 7,976,129
Translation differences
-- -- -- -- --
(208,337)
-- -- -- --
(208,337) (30,993) (239,330)
Cash flow hedges
-- -- -- -- -- -- -- -- -- (143) (143)
--
(143)
Other comprehensive income -- -- -- -- -- -- (1,618) -- -- --
(1,618)
--
(1,618)
Other comprehensive income for the period - - - - - (208,337) (1,618) - - (143) (210,098) (30,993) (241,091)
Profit/(loss) for the period -- -- -- (70,099) -- -- -- -- -- --
(70,099) 65,148 (4,951)
Total comprehensive income for the period - - - (70,099) - (208,337) (1,618) - - (143) (280,197) 34,155 (246,042)
Net change in treasury stock
-- -- -- --
3,528
-- -- -- -- --
3,528
--
3,528
Acquisition of non-controlling interests
-- -- -- -- -- -- -- -- -- --
- - -
Other changes
-- -- (1,487) -- -- -- -- -- -- --
(1,487) (14) (1,501)
Distribution of 2022 profit
Reserves -- -- 185,035 (185,035) -- -- -- -- -- -- - -- -
Dividends -- -- -- -- -- -- -- -- -- -- - -- -
Interim dividend -- -- -- -- -- -- -- -- -- -- - -- -
Operations with equity holders or owners - - 183,548 (185,035) 3,528 - - - 2,041 (14) 2,027
Balances at 30 June 2023 (unaudited) (*) 119,604 910,728 4,051,669 (70,099) (158,692) 527,440 (9,702) - - (581) 5,370,367 2,361,747 7,732,114
Balances at 31 December 2023 119,604 910,728 4,482,798 59,315 (152,748) 414,068 (9,117) 1,520 0 998 5,827,166 2,145,319 7,972,485
Adjustment due to restatement (Note 2.d) -- -- (441,837) (16,997) -- 44 -- -- -- -- (458,790) -- (458,790)
Balances at 31 December 2023 (*) 119,604 910,728 4,040,961 42,318 (152,748) 414,112 (9,117) 1,520 0 998 5,368,376 2,145,319 7,513,695
Translation differences
-- -- -- -- -- 198,437 -- -- -- --
198,437 39,519 237,956
Cash flow hedges
-- -- -- -- -- -- -- -- -- (45) (45)
--
(45)
Other comprehensive income -- -- -- -- -- -- (2,672) -- -- --
(2,672)
--
(2,672)
Other comprehensive income financial asset at fair value -- -- -- -- -- -- -- -- 4,268 --
4,268 --
4,268
Other comprehensive income from non-current assets held for sale -- -- -- -- -- -- -- (1,520) 0 --
(1,520)
--
(1,520)
Other comprehensive income for the period - - - - - 198,437 (2,672) (1,520) 4,268 (45) 198,468 39,519 237,987
Profit/(loss) for the period -- -- -- 36,259 -- -- -- -- -- --
36,259 10,782 47,041
Total comprehensive income for the period - - - 36,259 - 198,437 (2,672) (1,520) 4,268 (45) 234,727 50,301 285,028
Net change in treasury stock
-- -- -- -- 7,461 -- -- -- -- --
7,461
--
7,461
Acquisition of non-controlling interests
-- -- -- -- -- -- -- -- -- --
-
--
-
Other changes
-- -- (16,927) -- -- (930) -- -- -- --
(17,857) 506,947 489,090
Distribution of 2023 profit
Reserves -- -- 42,318 (42,318) -- -- -- -- -- -- - -- -
Dividends -- -- -- -- -- -- -- -- -- -- - -- -
Interim dividend -- -- -- -- -- -- -- -- -- -- - -- -
Operations with equity holders or owners - - 25,391 (42,318) 7,461 (930) - - - - (10,396) 506,947 496,551
Balances at 30 June 2024 (unaudited) 119,604 910,728 4,066,352 36,259 (145,287) 611,619 (11,789) - 4,268 953 5,592,707 2,702,567 8,295,274
(*) Restated figures (Note 2.d)
Cash flow
hedges
GRIFOLS, S.A. AND SUBSIDIARIES
Condensed Consolidated Statements of Changes in Equity
GRIFOLS, S.A. AND SUBSIDIARIES
Condensed Consolidated Statement of Changes in Equity
for the six-month periods ended 30 June 2024 and 2023
(Expressed in thousands of Euros)
Attributable to equity holders of the Parent
(Free translation from the original in Spanish. In the event of discrepancy, the Spanish-language version prevails)
Accumulated other comprehensive income |
| GRIFOLS, S.A. AND SUBSIDIARIES
Notes to the Condensed Consolidated Interim Financial Statements for the
six-month period ended 30 June 2024
1
(1) General Information
Grifols, S.A. (hereinafter “the Company”) was incorporated with limited liability under Spanish law on 22 June
1987. Its registered and tax offices are in Parque Empresarial Can Sant Joan, Avinguda de la Generalitat, 152-
158, 08174 Sant Cugat del Vallès, Barcelona. The Company's statutory activity consists of providing corporate
and business administrative, management and control services, as well as investing in assets and property. Its
principal activity involves rendering administrative, management and control services to its subsidiaries.
On 17 May 2006 the Company completed its flotation on the Spanish securities market, which was conducted
through the public offering of 71,000,000 ordinary shares of Euros 0.50 par value each and a share premium of
Euros 3.90 per share. The total capital increase (including the share premium) amounted to Euros 312.4 million,
equivalent to a price of Euros 4.40 per share.
The Company’s shares were floated on the Spanish stock exchange IBEX-35 index on 2 January 2008.
All of the Company’s shares are listed on the Barcelona, Madrid, Valencia and Bilbao securities markets and on
the Spanish Automated Quotation System (SIBE/Continuous Market). On 2 June 2011, Class B non-voting shares
(ADRs) were listed on the NASDAQ (USA) and on the Spanish Automated Quotation System (SIBE/Continuous
Market).
Grifols, S.A. is the Parent of the subsidiaries listed in Appendix I to the consolidated annual accounts. Grifols,
S.A. and subsidiaries (hereinafter “the Group”) act on an integrated basis and under common management and
their principal activity is the procurement, manufacture, preparation and sale of therapeutic products, especially
hemoderivatives.
The main factory locations of the Group’s Spanish companies are in Parets del Vallés (Barcelona) and Torres de
Cotilla (Murcia); the US companies are located in Los Angeles (California), Clayton (North Carolina), Emeryville
(California), and San Diego (California); Dublin (Ireland) and Dreieich (Germany).
(2) Basis of Presentation and Accounting Principles Applied
The condensed consolidated interim financial statements for the six month period ended June 30, 2024 have been
prepared in accordance with International Financial Reporting Standards as adopted by the European Union (EU-IFRS) and, in particular, in accordance with IAS 34 Interim Financial Statements. These condensed consolidated
interim financial statements do not contain all the information required for the preparation of financial statements
and should be read in conjunction with the Group's Consolidated Annual Accounts for the year ended December
31, 2023.
These condensed consolidated interim financial statements have been prepared by the Board of Directors at its
meeting held on July 29, 2024.
The figures contained in these condensed consolidated interim financial statements are expressed in thousands of
Euros.
Grifols' condensed consolidated interim financial statements for the six months ended June 30, 2024, have been
prepared based on the accounting records maintained by the Group. Data for the three months ended June 30,
2024, have been included for information purposes.
(a) Accounting principles and basis of consolidation applied
The accounting policies and basis of consolidation applied in the preparation of the condensed consolidated
interim financial statements, except for those detailed in the table below, are the same as those used in the
preparation of the consolidated Annual Accounts for the year ended December 31, 2023. |
| GRIFOLS, S.A. AND SUBSIDIARIES
Notes to the Condensed Consolidated Interim Financial Statements for the
six-month period ended 30 June 2024
2
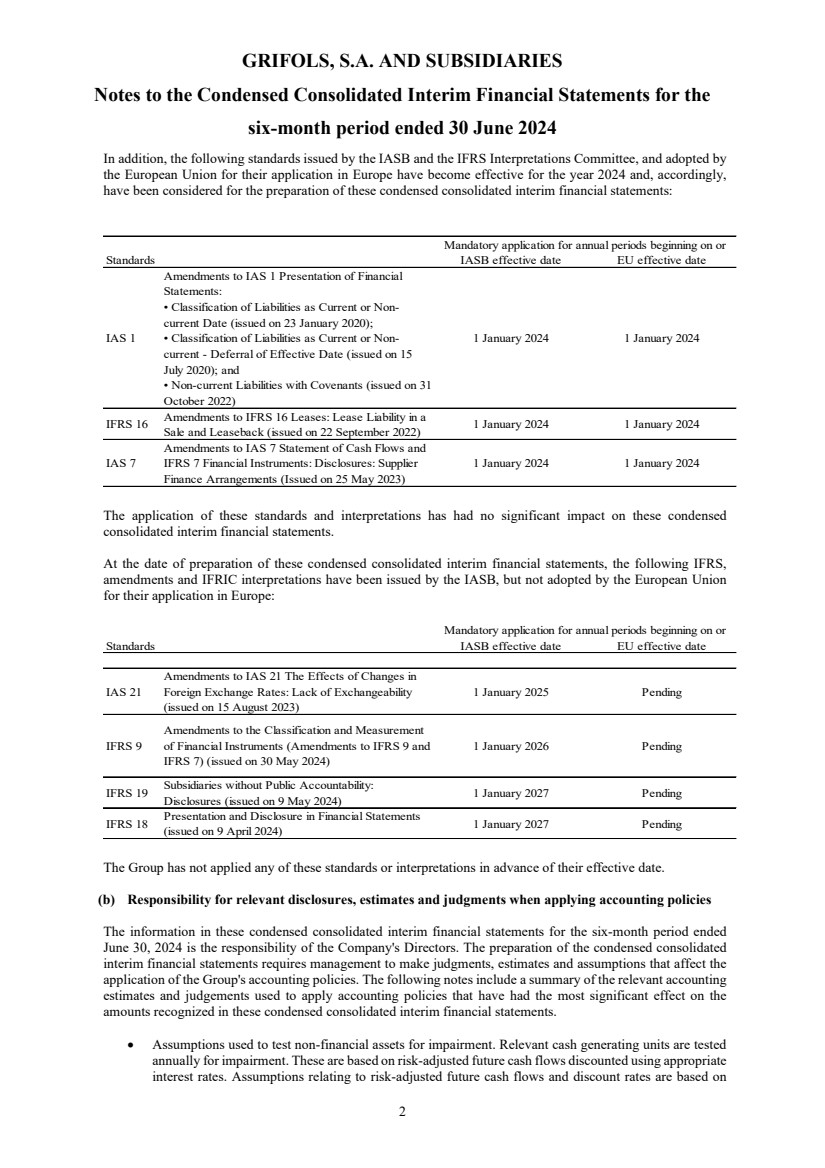
In addition, the following standards issued by the IASB and the IFRS Interpretations Committee, and adopted by
the European Union for their application in Europe have become effective for the year 2024 and, accordingly,
have been considered for the preparation of these condensed consolidated interim financial statements:
Standards IASB effective date EU effective date
IAS 1
Amendments to IAS 1 Presentation of Financial
Statements:
• Classification of Liabilities as Current or Non-current Date (issued on 23 January 2020);
• Classification of Liabilities as Current or Non-current - Deferral of Effective Date (issued on 15
July 2020); and
• Non-current Liabilities with Covenants (issued on 31
October 2022)
1 January 2024 1 January 2024
IFRS 16 Amendments to IFRS 16 Leases: Lease Liability in a
Sale and Leaseback (issued on 22 September 2022) 1 January 2024 1 January 2024
IAS 7
Amendments to IAS 7 Statement of Cash Flows and
IFRS 7 Financial Instruments: Disclosures: Supplier
Finance Arrangements (Issued on 25 May 2023)
1 January 2024 1 January 2024
Mandatory application for annual periods beginning on or
The application of these standards and interpretations has had no significant impact on these condensed
consolidated interim financial statements.
At the date of preparation of these condensed consolidated interim financial statements, the following IFRS,
amendments and IFRIC interpretations have been issued by the IASB, but not adopted by the European Union
for their application in Europe:
Standards IASB effective date EU effective date
IAS 21
Amendments to IAS 21 The Effects of Changes in
Foreign Exchange Rates: Lack of Exchangeability
(issued on 15 August 2023)
1 January 2025 Pending
IFRS 9
Amendments to the Classification and Measurement
of Financial Instruments (Amendments to IFRS 9 and
IFRS 7) (issued on 30 May 2024)
1 January 2026 Pending
IFRS 19 Subsidiaries without Public Accountability:
Disclosures (issued on 9 May 2024) 1 January 2027 Pending
IFRS 18 Presentation and Disclosure in Financial Statements
(issued on 9 April 2024) 1 January 2027 Pending
Mandatory application for annual periods beginning on or
The Group has not applied any of these standards or interpretations in advance of their effective date.
(b) Responsibility for relevant disclosures, estimates and judgments when applying accounting policies
The information in these condensed consolidated interim financial statements for the six-month period ended
June 30, 2024 is the responsibility of the Company's Directors. The preparation of the condensed consolidated
interim financial statements requires management to make judgments, estimates and assumptions that affect the
application of the Group's accounting policies. The following notes include a summary of the relevant accounting
estimates and judgements used to apply accounting policies that have had the most significant effect on the
amounts recognized in these condensed consolidated interim financial statements.
• Assumptions used to test non-financial assets for impairment. Relevant cash generating units are tested
annually for impairment. These are based on risk-adjusted future cash flows discounted using appropriate
interest rates. Assumptions relating to risk-adjusted future cash flows and discount rates are based on |
| GRIFOLS, S.A. AND SUBSIDIARIES
Notes to the Condensed Consolidated Interim Financial Statements for the
six-month period ended 30 June 2024
3
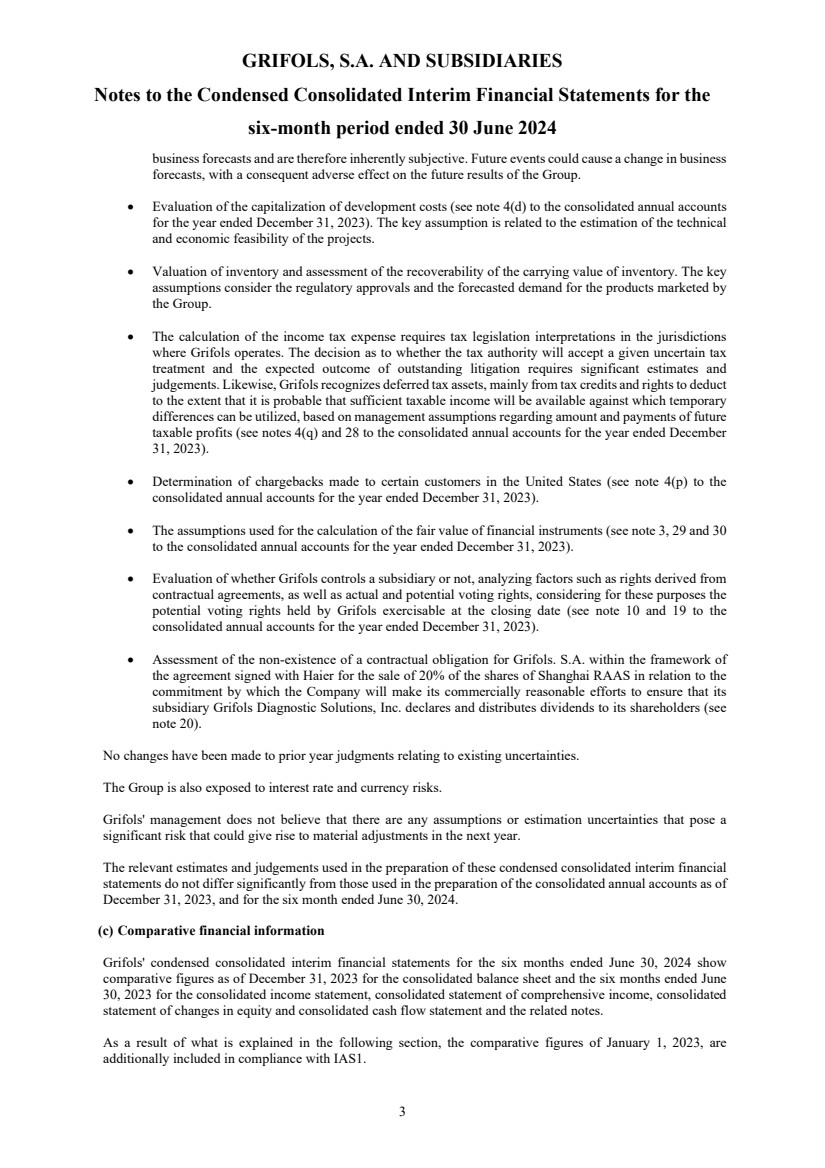
business forecasts and are therefore inherently subjective. Future events could cause a change in business
forecasts, with a consequent adverse effect on the future results of the Group.
• Evaluation of the capitalization of development costs (see note 4(d) to the consolidated annual accounts
for the year ended December 31, 2023). The key assumption is related to the estimation of the technical
and economic feasibility of the projects.
• Valuation of inventory and assessment of the recoverability of the carrying value of inventory. The key
assumptions consider the regulatory approvals and the forecasted demand for the products marketed by
the Group.
• The calculation of the income tax expense requires tax legislation interpretations in the jurisdictions
where Grifols operates. The decision as to whether the tax authority will accept a given uncertain tax
treatment and the expected outcome of outstanding litigation requires significant estimates and
judgements. Likewise, Grifols recognizes deferred tax assets, mainly from tax credits and rights to deduct
to the extent that it is probable that sufficient taxable income will be available against which temporary
differences can be utilized, based on management assumptions regarding amount and payments of future
taxable profits (see notes 4(q) and 28 to the consolidated annual accounts for the year ended December
31, 2023).
• Determination of chargebacks made to certain customers in the United States (see note 4(p) to the
consolidated annual accounts for the year ended December 31, 2023).
• The assumptions used for the calculation of the fair value of financial instruments (see note 3, 29 and 30
to the consolidated annual accounts for the year ended December 31, 2023).
• Evaluation of whether Grifols controls a subsidiary or not, analyzing factors such as rights derived from
contractual agreements, as well as actual and potential voting rights, considering for these purposes the
potential voting rights held by Grifols exercisable at the closing date (see note 10 and 19 to the
consolidated annual accounts for the year ended December 31, 2023).
• Assessment of the non-existence of a contractual obligation for Grifols. S.A. within the framework of
the agreement signed with Haier for the sale of 20% of the shares of Shanghai RAAS in relation to the
commitment by which the Company will make its commercially reasonable efforts to ensure that its
subsidiary Grifols Diagnostic Solutions, Inc. declares and distributes dividends to its shareholders (see
note 20).
No changes have been made to prior year judgments relating to existing uncertainties.
The Group is also exposed to interest rate and currency risks.
Grifols' management does not believe that there are any assumptions or estimation uncertainties that pose a
significant risk that could give rise to material adjustments in the next year.
The relevant estimates and judgements used in the preparation of these condensed consolidated interim financial
statements do not differ significantly from those used in the preparation of the consolidated annual accounts as of
December 31, 2023, and for the six month ended June 30, 2024.
(c) Comparative financial information
Grifols' condensed consolidated interim financial statements for the six months ended June 30, 2024 show
comparative figures as of December 31, 2023 for the consolidated balance sheet and the six months ended June
30, 2023 for the consolidated income statement, consolidated statement of comprehensive income, consolidated
statement of changes in equity and consolidated cash flow statement and the related notes.
As a result of what is explained in the following section, the comparative figures of January 1, 2023, are
additionally included in compliance with IAS1. |
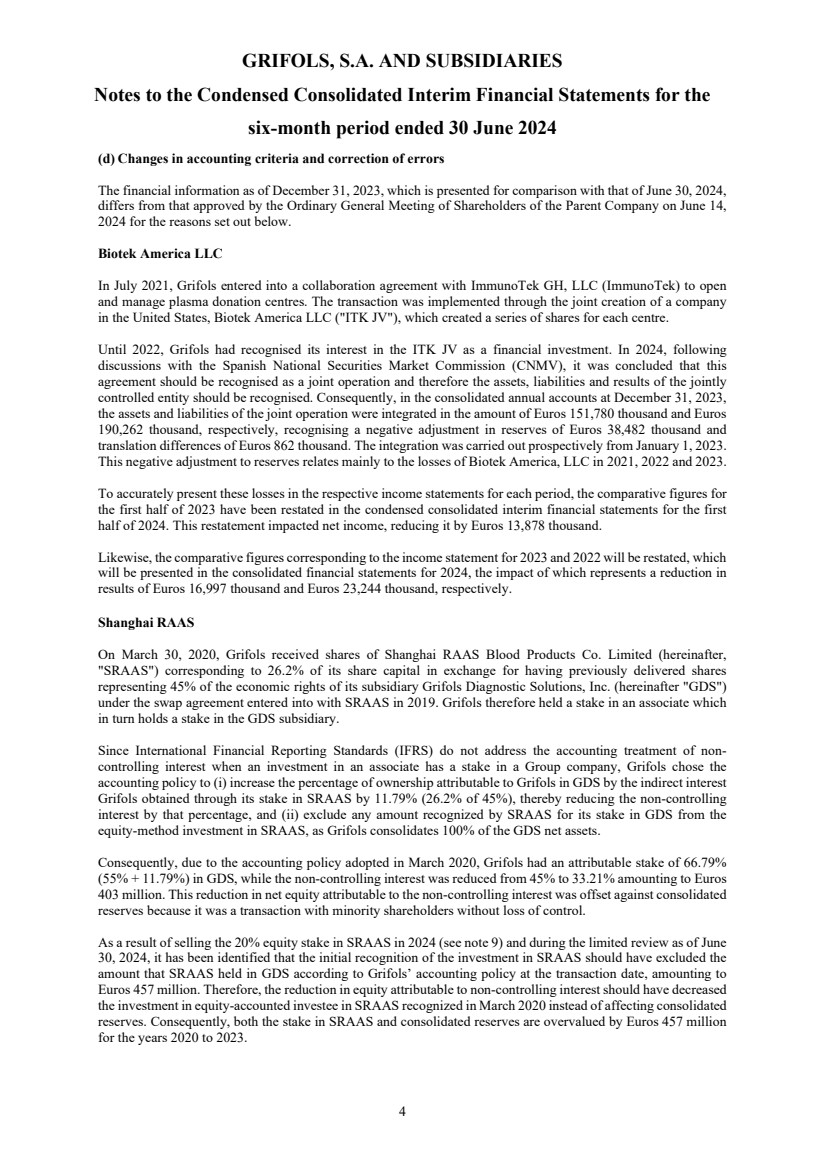
| GRIFOLS, S.A. AND SUBSIDIARIES
Notes to the Condensed Consolidated Interim Financial Statements for the
six-month period ended 30 June 2024
4
(d) Changes in accounting criteria and correction of errors
The financial information as of December 31, 2023, which is presented for comparison with that of June 30, 2024,
differs from that approved by the Ordinary General Meeting of Shareholders of the Parent Company on June 14,
2024 for the reasons set out below.
Biotek America LLC
In July 2021, Grifols entered into a collaboration agreement with ImmunoTek GH, LLC (ImmunoTek) to open
and manage plasma donation centres. The transaction was implemented through the joint creation of a company
in the United States, Biotek America LLC ("ITK JV"), which created a series of shares for each centre.
Until 2022, Grifols had recognised its interest in the ITK JV as a financial investment. In 2024, following
discussions with the Spanish National Securities Market Commission (CNMV), it was concluded that this
agreement should be recognised as a joint operation and therefore the assets, liabilities and results of the jointly
controlled entity should be recognised. Consequently, in the consolidated annual accounts at December 31, 2023,
the assets and liabilities of the joint operation were integrated in the amount of Euros 151,780 thousand and Euros
190,262 thousand, respectively, recognising a negative adjustment in reserves of Euros 38,482 thousand and
translation differences of Euros 862 thousand. The integration was carried out prospectively from January 1, 2023.
This negative adjustment to reserves relates mainly to the losses of Biotek America, LLC in 2021, 2022 and 2023.
To accurately present these losses in the respective income statements for each period, the comparative figures for
the first half of 2023 have been restated in the condensed consolidated interim financial statements for the first
half of 2024. This restatement impacted net income, reducing it by Euros 13,878 thousand.
Likewise, the comparative figures corresponding to the income statement for 2023 and 2022 will be restated, which
will be presented in the consolidated financial statements for 2024, the impact of which represents a reduction in
results of Euros 16,997 thousand and Euros 23,244 thousand, respectively.
Shanghai RAAS
On March 30, 2020, Grifols received shares of Shanghai RAAS Blood Products Co. Limited (hereinafter,
"SRAAS") corresponding to 26.2% of its share capital in exchange for having previously delivered shares
representing 45% of the economic rights of its subsidiary Grifols Diagnostic Solutions, Inc. (hereinafter "GDS")
under the swap agreement entered into with SRAAS in 2019. Grifols therefore held a stake in an associate which
in turn holds a stake in the GDS subsidiary.
Since International Financial Reporting Standards (IFRS) do not address the accounting treatment of non-controlling interest when an investment in an associate has a stake in a Group company, Grifols chose the
accounting policy to (i) increase the percentage of ownership attributable to Grifols in GDS by the indirect interest
Grifols obtained through its stake in SRAAS by 11.79% (26.2% of 45%), thereby reducing the non-controlling
interest by that percentage, and (ii) exclude any amount recognized by SRAAS for its stake in GDS from the
equity-method investment in SRAAS, as Grifols consolidates 100% of the GDS net assets.
Consequently, due to the accounting policy adopted in March 2020, Grifols had an attributable stake of 66.79%
(55% + 11.79%) in GDS, while the non-controlling interest was reduced from 45% to 33.21% amounting to Euros
403 million. This reduction in net equity attributable to the non-controlling interest was offset against consolidated
reserves because it was a transaction with minority shareholders without loss of control.
As a result of selling the 20% equity stake in SRAAS in 2024 (see note 9) and during the limited review as of June
30, 2024, it has been identified that the initial recognition of the investment in SRAAS should have excluded the
amount that SRAAS held in GDS according to Grifols’ accounting policy at the transaction date, amounting to
Euros 457 million. Therefore, the reduction in equity attributable to non-controlling interest should have decreased
the investment in equity-accounted investee in SRAAS recognized in March 2020 instead of affecting consolidated
reserves. Consequently, both the stake in SRAAS and consolidated reserves are overvalued by Euros 457 million
for the years 2020 to 2023. |
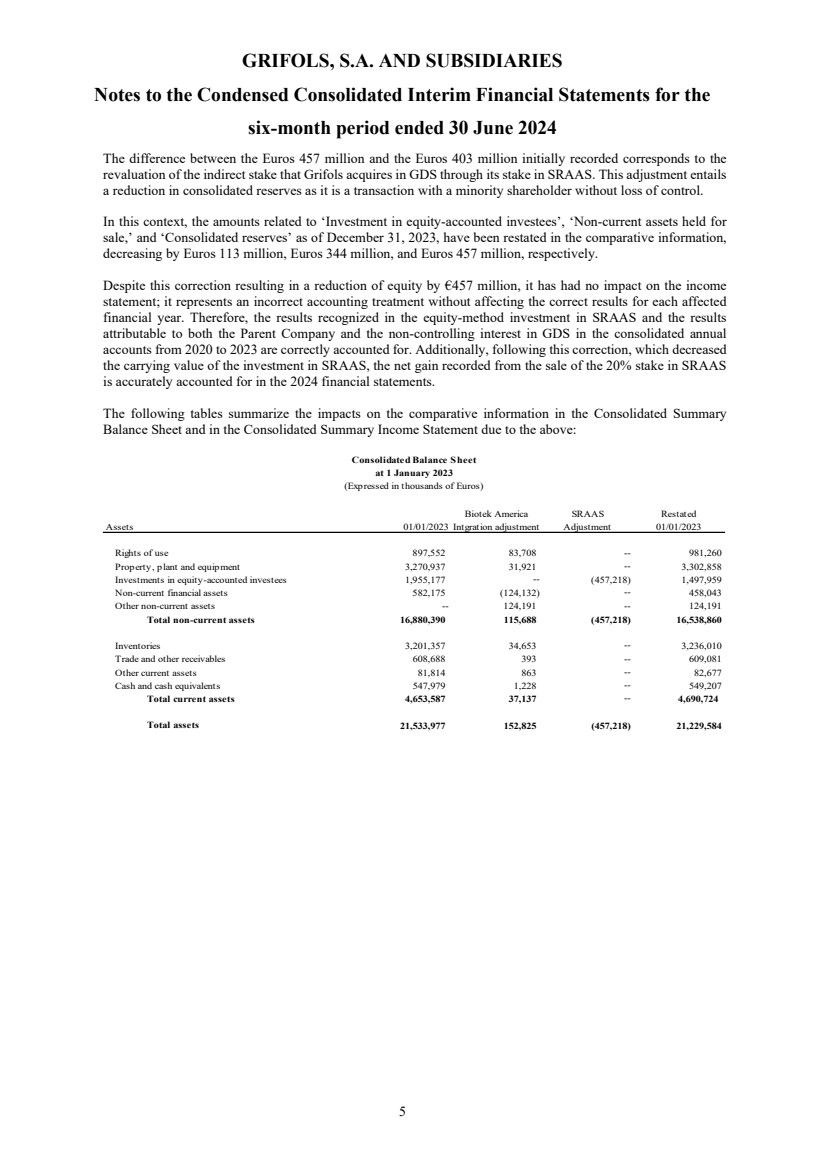
| GRIFOLS, S.A. AND SUBSIDIARIES
Notes to the Condensed Consolidated Interim Financial Statements for the
six-month period ended 30 June 2024
5
The difference between the Euros 457 million and the Euros 403 million initially recorded corresponds to the
revaluation of the indirect stake that Grifols acquires in GDS through its stake in SRAAS. This adjustment entails
a reduction in consolidated reserves as it is a transaction with a minority shareholder without loss of control.
In this context, the amounts related to ‘Investment in equity-accounted investees’, ‘Non-current assets held for
sale,’ and ‘Consolidated reserves’ as of December 31, 2023, have been restated in the comparative information,
decreasing by Euros 113 million, Euros 344 million, and Euros 457 million, respectively.
Despite this correction resulting in a reduction of equity by €457 million, it has had no impact on the income
statement; it represents an incorrect accounting treatment without affecting the correct results for each affected
financial year. Therefore, the results recognized in the equity-method investment in SRAAS and the results
attributable to both the Parent Company and the non-controlling interest in GDS in the consolidated annual
accounts from 2020 to 2023 are correctly accounted for. Additionally, following this correction, which decreased
the carrying value of the investment in SRAAS, the net gain recorded from the sale of the 20% stake in SRAAS
is accurately accounted for in the 2024 financial statements.
The following tables summarize the impacts on the comparative information in the Consolidated Summary
Balance Sheet and in the Consolidated Summary Income Statement due to the above:
Biotek America SRAAS Restated
Assets 01/01/2023 Intgration adjustment Adjustment 01/01/2023
Rights of use 897,552 83,708 -- 981,260
Property, plant and equipment 3,270,937 31,921 -- 3,302,858
Investments in equity-accounted investees 1,955,177 -- (457,218) 1,497,959
Non-current financial assets 582,175 (124,132) -- 458,043
Other non-current assets -- 124,191 -- 124,191
Total non-current assets 16,880,390 115,688 (457,218) 16,538,860
Inventories 3,201,357 34,653 -- 3,236,010
Trade and other receivables 608,688 393 -- 609,081
Other current assets 81,814 863 -- 82,677
Cash and cash equivalents 547,979 1,228 -- 549,207
Total current assets 4,653,587 37,137 -- 4,690,724
Total assets 21,533,977 152,825 (457,218) 21,229,584
Consolidated Balance Sheet
at 1 January 2023
(Expressed in thousands of Euros) |
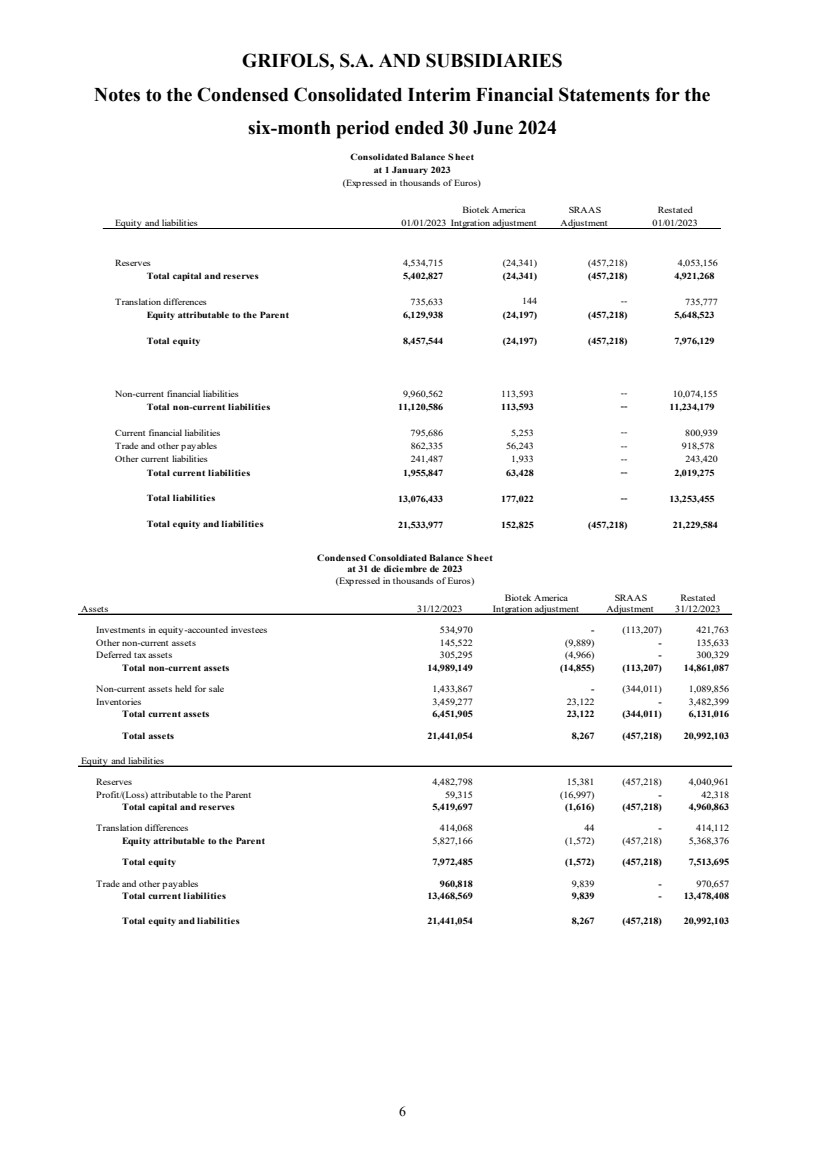
| GRIFOLS, S.A. AND SUBSIDIARIES
Notes to the Condensed Consolidated Interim Financial Statements for the
six-month period ended 30 June 2024
6
Biotek America SRAAS Restated
Equity and liabilities 01/01/2023 Intgration adjustment Adjustment 01/01/2023
Reserves 4,534,715 (24,341) (457,218) 4,053,156
Total capital and reserves 5,402,827 (24,341) (457,218) 4,921,268
Translation differences 735,633 144 -- 735,777
Equity attributable to the Parent 6,129,938 (24,197) (457,218) 5,648,523
Total equity 8,457,544 (24,197) (457,218) 7,976,129
Non-current financial liabilities 9,960,562 113,593 -- 10,074,155
Total non-current liabilities 11,120,586 113,593 -- 11,234,179
Current financial liabilities 795,686 5,253 -- 800,939
Trade and other payables 862,335 56,243 -- 918,578
Other current liabilities 241,487 1,933 -- 243,420
Total current liabilities 1,955,847 63,428 -- 2,019,275
Total liabilities 13,076,433 177,022 -- 13,253,455
Total equity and liabilities 21,533,977 152,825 (457,218) 21,229,584
Consolidated Balance Sheet
at 1 January 2023
(Expressed in thousands of Euros)
Biotek America SRAAS Restated
Assets 31/12/2023 Intgration adjustment Adjustment 31/12/2023
Investments in equity-accounted investees 534,970 - (113,207) 421,763
Other non-current assets 145,522 (9,889) - 135,633
Deferred tax assets 305,295 (4,966) - 300,329
Total non-current assets 14,989,149 (14,855) (113,207) 14,861,087
Non-current assets held for sale 1,433,867 - (344,011) 1,089,856
Inventories 3,459,277 23,122 - 3,482,399
Total current assets 6,451,905 23,122 (344,011) 6,131,016
Total assets 21,441,054 8,267 (457,218) 20,992,103
Equity and liabilities
Reserves 4,482,798 15,381 (457,218) 4,040,961
Profit/(Loss) attributable to the Parent 59,315 (16,997) - 42,318
Total capital and reserves 5,419,697 (1,616) (457,218) 4,960,863
Translation differences 414,068 44 - 414,112
Equity attributable to the Parent 5,827,166 (1,572) (457,218) 5,368,376
Total equity 7,972,485 (1,572) (457,218) 7,513,695
Trade and other payables 960,818 9,839 - 970,657
Total current liabilities 13,468,569 9,839 - 13,478,408
Total equity and liabilities 21,441,054 8,267 (457,218) 20,992,103
Condensed Consoldiated Balance Sheet
at 31 de diciembre de 2023
(Expressed in thousands of Euros) |
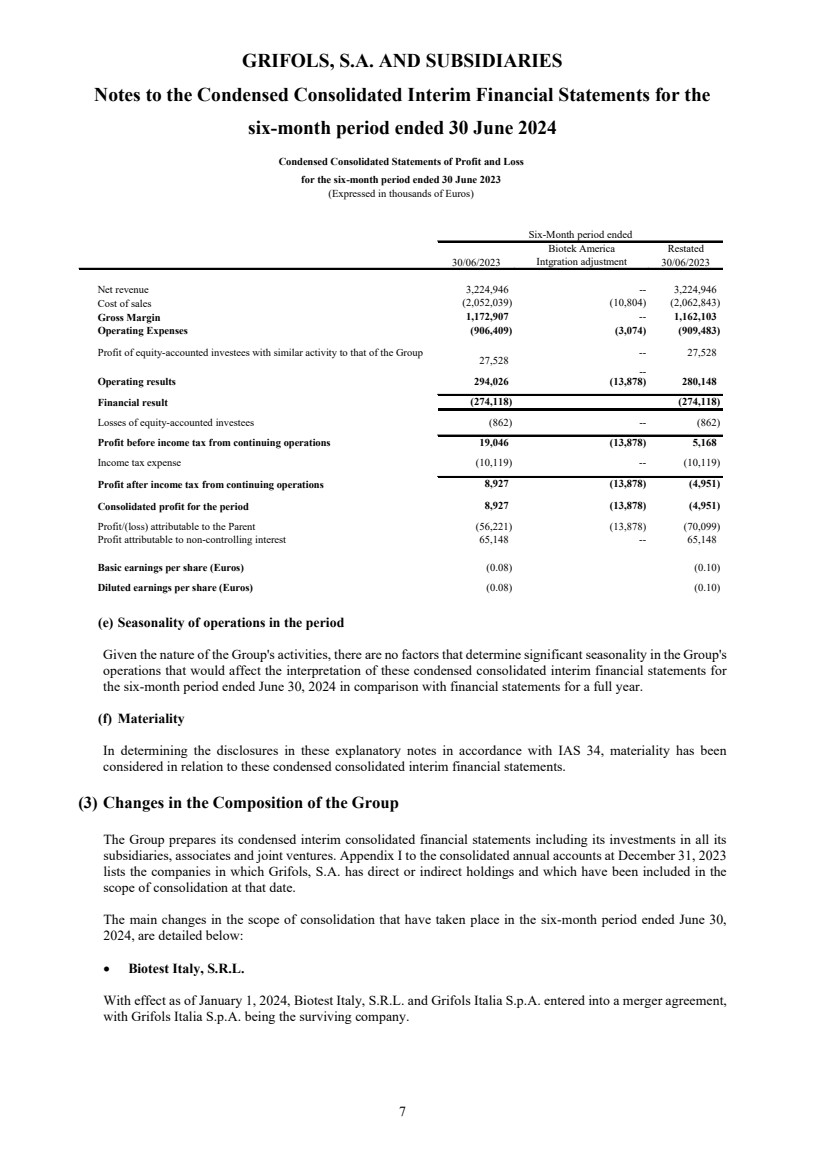
| GRIFOLS, S.A. AND SUBSIDIARIES
Notes to the Condensed Consolidated Interim Financial Statements for the
six-month period ended 30 June 2024
7
Biotek America Restated
30/06/2023 Intgration adjustment 30/06/2023
Net revenue 3,224,946 -- 3,224,946
Cost of sales (2,052,039) (10,804) (2,062,843)
Gross Margin 1,172,907 -- 1,162,103
Operating Expenses (906,409) (3,074) (909,483)
27,528 -- 27,528
-- Operating results 294,026 (13,878) 280,148
Financial result (274,118) (274,118)
Losses of equity-accounted investees (862) -- (862)
Profit before income tax from continuing operations 19,046 (13,878) 5,168
Income tax expense (10,119) -- (10,119)
Profit after income tax from continuing operations 8,927 (13,878) (4,951)
Consolidated profit for the period 8,927 (13,878) (4,951)
Profit/(loss) attributable to the Parent (56,221) (13,878) (70,099)
Profit attributable to non-controlling interest 65,148 -- 65,148
Basic earnings per share (Euros) (0.08) (0.10)
Diluted earnings per share (Euros) (0.08) (0.10)
Profit of equity-accounted investees with similar activity to that of the Group
Six-Month period ended
Condensed Consolidated Statements of Profit and Loss
for the six-month period ended 30 June 2023
(Expressed in thousands of Euros)
(e) Seasonality of operations in the period
Given the nature of the Group's activities, there are no factors that determine significant seasonality in the Group's
operations that would affect the interpretation of these condensed consolidated interim financial statements for
the six-month period ended June 30, 2024 in comparison with financial statements for a full year.
(f) Materiality
In determining the disclosures in these explanatory notes in accordance with IAS 34, materiality has been
considered in relation to these condensed consolidated interim financial statements.
(3) Changes in the Composition of the Group
The Group prepares its condensed interim consolidated financial statements including its investments in all its
subsidiaries, associates and joint ventures. Appendix I to the consolidated annual accounts at December 31, 2023
lists the companies in which Grifols, S.A. has direct or indirect holdings and which have been included in the
scope of consolidation at that date.
The main changes in the scope of consolidation that have taken place in the six-month period ended June 30,
2024, are detailed below:
• Biotest Italy, S.R.L.
With effect as of January 1, 2024, Biotest Italy, S.R.L. and Grifols Italia S.p.A. entered into a merger agreement,
with Grifols Italia S.p.A. being the surviving company. |
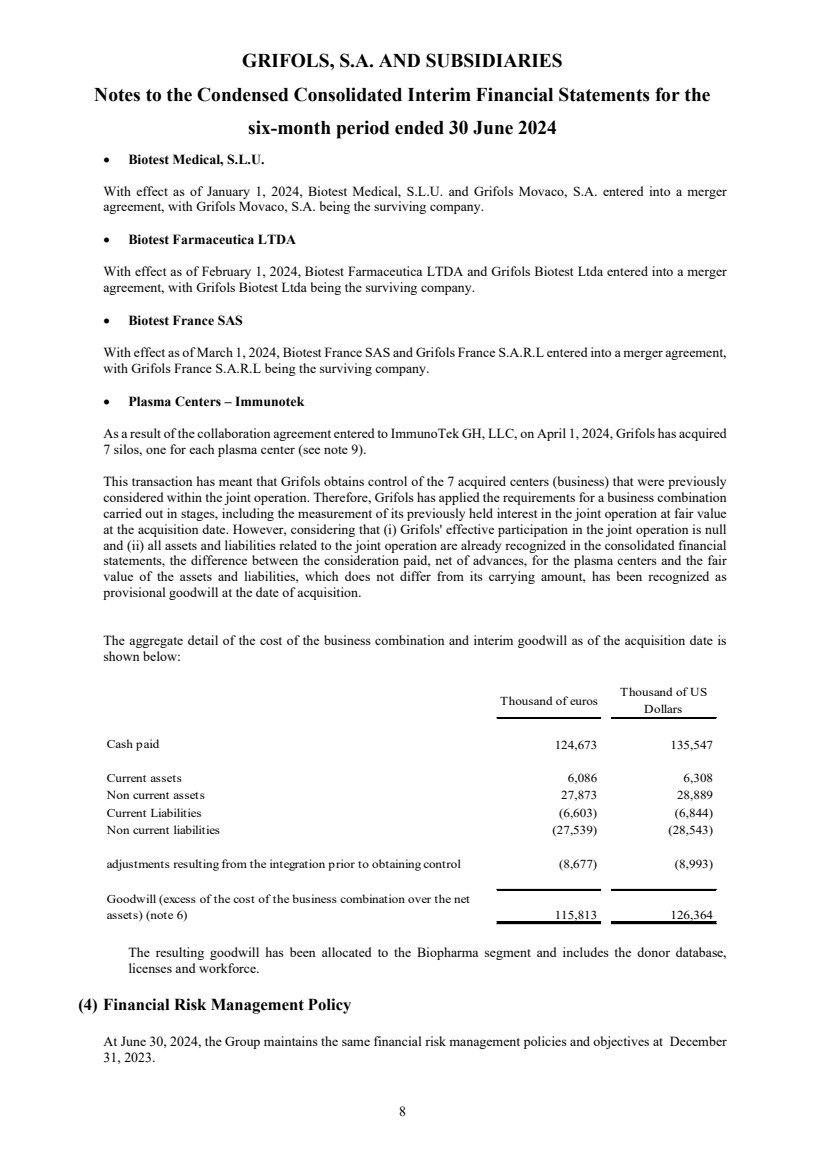
| GRIFOLS, S.A. AND SUBSIDIARIES
Notes to the Condensed Consolidated Interim Financial Statements for the
six-month period ended 30 June 2024
8
• Biotest Medical, S.L.U.
With effect as of January 1, 2024, Biotest Medical, S.L.U. and Grifols Movaco, S.A. entered into a merger
agreement, with Grifols Movaco, S.A. being the surviving company.
• Biotest Farmaceutica LTDA
With effect as of February 1, 2024, Biotest Farmaceutica LTDA and Grifols Biotest Ltda entered into a merger
agreement, with Grifols Biotest Ltda being the surviving company.
• Biotest France SAS
With effect as of March 1, 2024, Biotest France SAS and Grifols France S.A.R.L entered into a merger agreement,
with Grifols France S.A.R.L being the surviving company.
• Plasma Centers – Immunotek
As a result of the collaboration agreement entered to ImmunoTek GH, LLC, on April 1, 2024, Grifols has acquired
7 silos, one for each plasma center (see note 9).
This transaction has meant that Grifols obtains control of the 7 acquired centers (business) that were previously
considered within the joint operation. Therefore, Grifols has applied the requirements for a business combination
carried out in stages, including the measurement of its previously held interest in the joint operation at fair value
at the acquisition date. However, considering that (i) Grifols' effective participation in the joint operation is null
and (ii) all assets and liabilities related to the joint operation are already recognized in the consolidated financial
statements, the difference between the consideration paid, net of advances, for the plasma centers and the fair
value of the assets and liabilities, which does not differ from its carrying amount, has been recognized as
provisional goodwill at the date of acquisition.
The aggregate detail of the cost of the business combination and interim goodwill as of the acquisition date is
shown below:
Thousand of euros Thousand of US
Dollars
Cash paid 124,673 135,547
Current assets 6,086 6,308
Non current assets 27,873 28,889
Current Liabilities (6,603) (6,844)
Non current liabilities (27,539) (28,543)
adjustments resulting from the integration prior to obtaining control (8,677) (8,993)
Goodwill (excess of the cost of the business combination over the net
assets) (note 6) 115,813 126,364
The resulting goodwill has been allocated to the Biopharma segment and includes the donor database,
licenses and workforce.
(4) Financial Risk Management Policy
At June 30, 2024, the Group maintains the same financial risk management policies and objectives at December
31, 2023. |
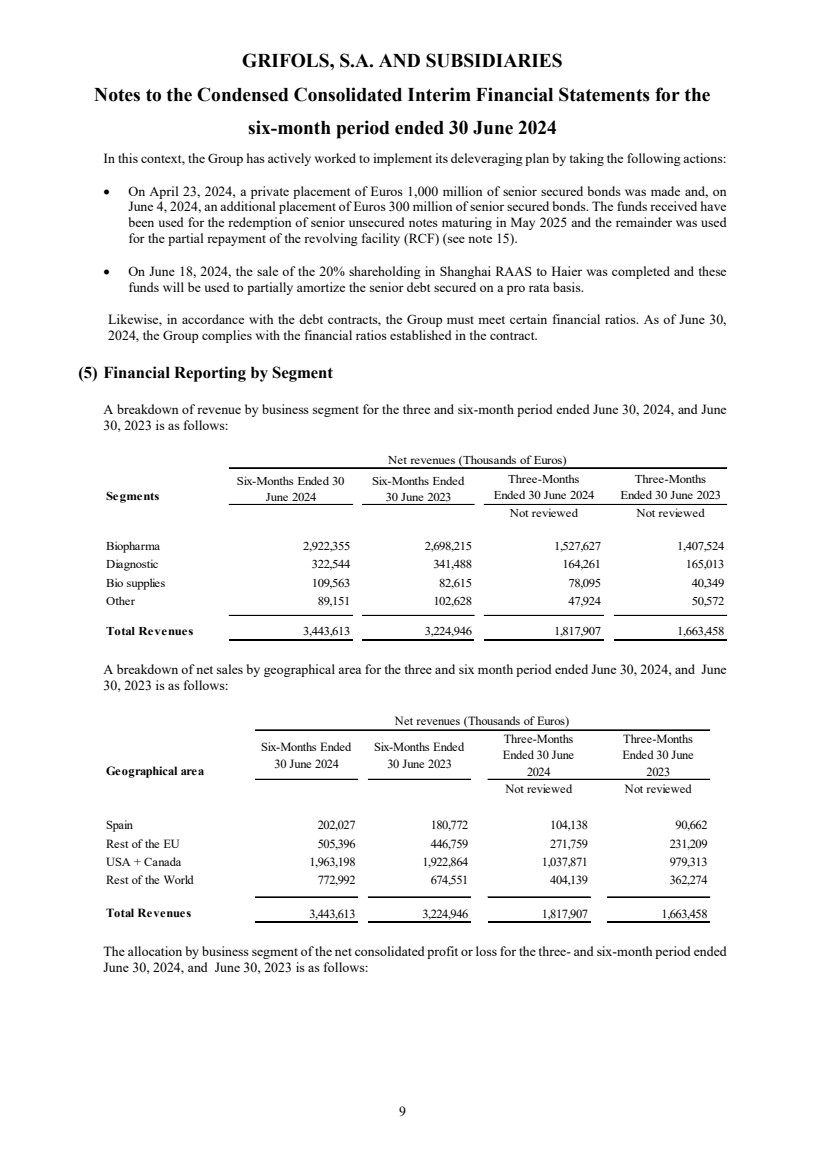
| GRIFOLS, S.A. AND SUBSIDIARIES
Notes to the Condensed Consolidated Interim Financial Statements for the
six-month period ended 30 June 2024
9
In this context, the Group has actively worked to implement its deleveraging plan by taking the following actions:
• On April 23, 2024, a private placement of Euros 1,000 million of senior secured bonds was made and, on
June 4, 2024, an additional placement of Euros 300 million of senior secured bonds. The funds received have
been used for the redemption of senior unsecured notes maturing in May 2025 and the remainder was used
for the partial repayment of the revolving facility (RCF) (see note 15).
• On June 18, 2024, the sale of the 20% shareholding in Shanghai RAAS to Haier was completed and these
funds will be used to partially amortize the senior debt secured on a pro rata basis.
Likewise, in accordance with the debt contracts, the Group must meet certain financial ratios. As of June 30,
2024, the Group complies with the financial ratios established in the contract.
(5) Financial Reporting by Segment
A breakdown of revenue by business segment for the three and six-month period ended June 30, 2024, and June
30, 2023 is as follows:
Segments
Six-Months Ended 30
June 2024
Six-Months Ended
30 June 2023
Three-Months
Ended 30 June 2024
Three-Months
Ended 30 June 2023
Not reviewed Not reviewed
Biopharma 2,922,355 2,698,215 1,527,627 1,407,524
Diagnostic 322,544 341,488 164,261 165,013
Bio supplies 109,563 82,615 78,095 40,349
Other 89,151 102,628 47,924 50,572
Total Revenues 3,443,613 3,224,946 1,817,907 1,663,458
Net revenues (Thousands of Euros)
A breakdown of net sales by geographical area for the three and six month period ended June 30, 2024, and June
30, 2023 is as follows:
Geographical area
Six-Months Ended
30 June 2024
Six-Months Ended
30 June 2023
Three-Months
Ended 30 June
2024
Three-Months
Ended 30 June
2023
Not reviewed Not reviewed
Spain 202,027 180,772 104,138 90,662
Rest of the EU 505,396 446,759 271,759 231,209
USA + Canada 1,963,198 1,922,864 1,037,871 979,313
Rest of the World 772,992 674,551 404,139 362,274
Total Revenues 3,443,613 3,224,946 1,817,907 1,663,458
Net revenues (Thousands of Euros)
The allocation by business segment of the net consolidated profit or loss for the three- and six-month period ended
June 30, 2024, and June 30, 2023 is as follows: |
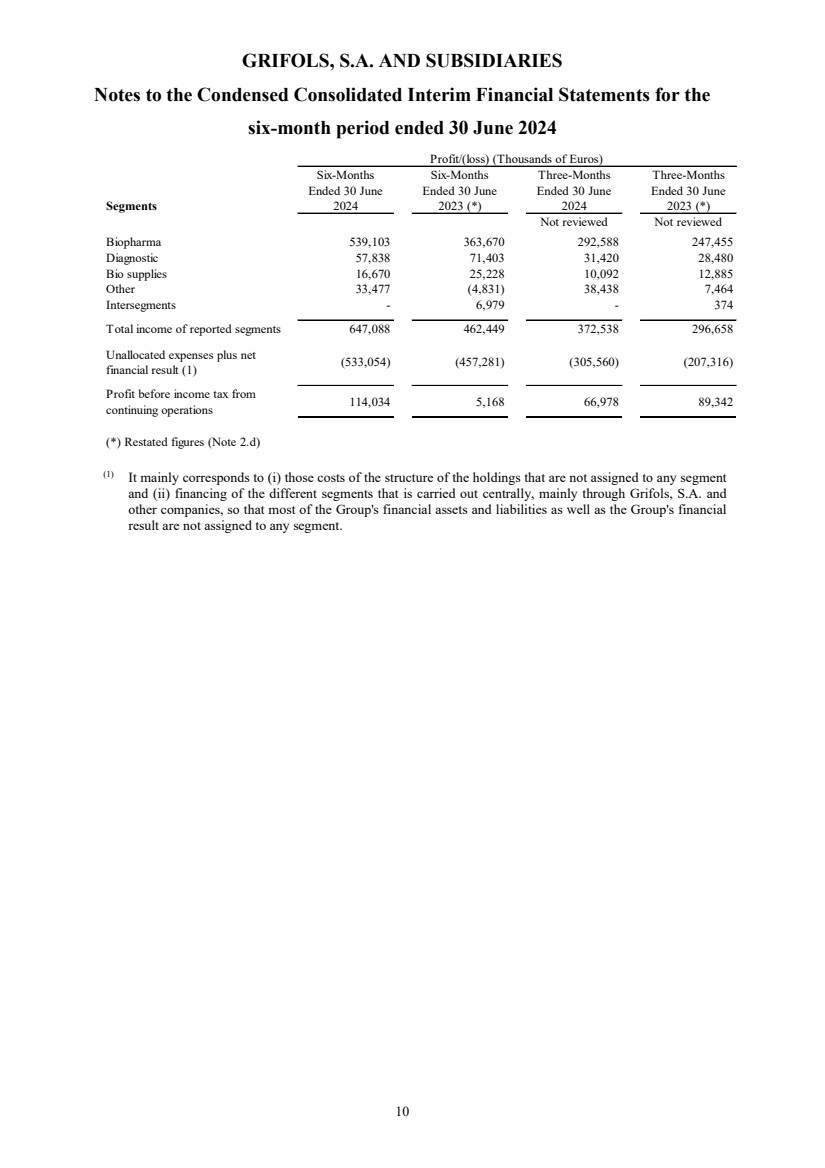
| GRIFOLS, S.A. AND SUBSIDIARIES
Notes to the Condensed Consolidated Interim Financial Statements for the
six-month period ended 30 June 2024
10
Segments
Six-Months
Ended 30 June
2024
Six-Months
Ended 30 June
2023 (*)
Three-Months
Ended 30 June
2024
Three-Months
Ended 30 June
2023 (*)
Not reviewed Not reviewed
Biopharma 539,103 363,670 292,588 247,455
Diagnostic 57,838 71,403 31,420 28,480
Bio supplies 16,670 25,228 10,092 12,885
Other 33,477 (4,831) 38,438 7,464
Intersegments - 6,979 - 374
Total income of reported segments 647,088 462,449 372,538 296,658
Unallocated expenses plus net
financial result (1) (533,054) (457,281) (305,560) (207,316)
Profit before income tax from
continuing operations 114,034 5,168 66,978 89,342
(*) Restated figures (Note 2.d)
Profit/(loss) (Thousands of Euros)
(1) It mainly corresponds to (i) those costs of the structure of the holdings that are not assigned to any segment
and (ii) financing of the different segments that is carried out centrally, mainly through Grifols, S.A. and
other companies, so that most of the Group's financial assets and liabilities as well as the Group's financial
result are not assigned to any segment. |
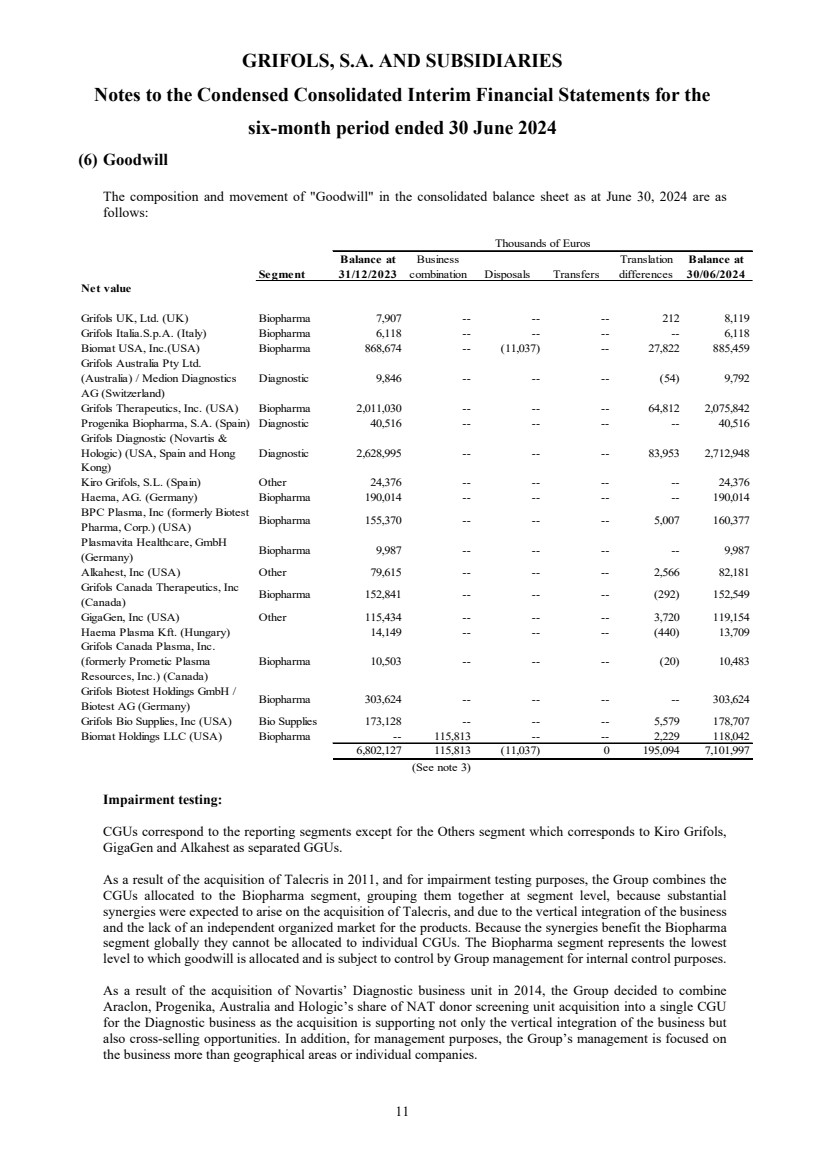
| GRIFOLS, S.A. AND SUBSIDIARIES
Notes to the Condensed Consolidated Interim Financial Statements for the
six-month period ended 30 June 2024
11
(6) Goodwill
The composition and movement of "Goodwill" in the consolidated balance sheet as at June 30, 2024 are as
follows:
Balance at Business Translation Balance at
Segment 31/12/2023 combination Disposals Transfers differences 30/06/2024
Net value
Grifols UK, Ltd. (UK) Biopharma 7,907 -- -- -- 212 8,119
Grifols Italia.S.p.A. (Italy) Biopharma 6,118 -- -- -- -- 6,118
Biomat USA, Inc.(USA) Biopharma 868,674 -- (11,037) -- 27,822 885,459
Grifols Australia Pty Ltd.
(Australia) / Medion Diagnostics
AG (Switzerland)
Diagnostic 9,846 -- -- -- (54) 9,792
Grifols Therapeutics, Inc. (USA) Biopharma 2,011,030 -- -- -- 64,812 2,075,842
Progenika Biopharma, S.A. (Spain) Diagnostic 40,516 -- -- -- -- 40,516
Grifols Diagnostic (Novartis &
Hologic) (USA, Spain and Hong
Kong)
Diagnostic 2,628,995 -- -- -- 83,953 2,712,948
Kiro Grifols, S.L. (Spain) Other 24,376 -- -- -- -- 24,376
Haema, AG. (Germany) Biopharma 190,014 -- -- -- -- 190,014
BPC Plasma, Inc (formerly Biotest
Pharma, Corp.) (USA) Biopharma 155,370 -- -- -- 5,007 160,377
Plasmavita Healthcare, GmbH
(Germany) Biopharma 9,987 -- -- -- -- 9,987
Alkahest, Inc (USA) Other 79,615 -- -- -- 2,566 82,181
Grifols Canada Therapeutics, Inc
(Canada) Biopharma 152,841 -- -- -- (292) 152,549
GigaGen, Inc (USA) Other 115,434 -- -- -- 3,720 119,154
Haema Plasma Kft. (Hungary) 14,149 -- -- -- (440) 13,709
Grifols Canada Plasma, Inc.
(formerly Prometic Plasma
Resources, Inc.) (Canada)
Biopharma 10,503 -- -- -- (20) 10,483
Grifols Biotest Holdings GmbH /
Biotest AG (Germany) Biopharma 303,624 -- -- -- -- 303,624
Grifols Bio Supplies, Inc (USA) Bio Supplies 173,128 -- -- -- 5,579 178,707
Biomat Holdings LLC (USA) Biopharma -- 115,813 -- -- 2,229 118,042
6,802,127 115,813 (11,037) 0 195,094 7,101,997
(See note 3)
Thousands of Euros
Impairment testing:
CGUs correspond to the reporting segments except for the Others segment which corresponds to Kiro Grifols,
GigaGen and Alkahest as separated GGUs.
As a result of the acquisition of Talecris in 2011, and for impairment testing purposes, the Group combines the
CGUs allocated to the Biopharma segment, grouping them together at segment level, because substantial
synergies were expected to arise on the acquisition of Talecris, and due to the vertical integration of the business
and the lack of an independent organized market for the products. Because the synergies benefit the Biopharma
segment globally they cannot be allocated to individual CGUs. The Biopharma segment represents the lowest
level to which goodwill is allocated and is subject to control by Group management for internal control purposes.
As a result of the acquisition of Novartis’ Diagnostic business unit in 2014, the Group decided to combine
Araclon, Progenika, Australia and Hologic’s share of NAT donor screening unit acquisition into a single CGU
for the Diagnostic business as the acquisition is supporting not only the vertical integration of the business but
also cross-selling opportunities. In addition, for management purposes, the Group’s management is focused on
the business more than geographical areas or individual companies. |
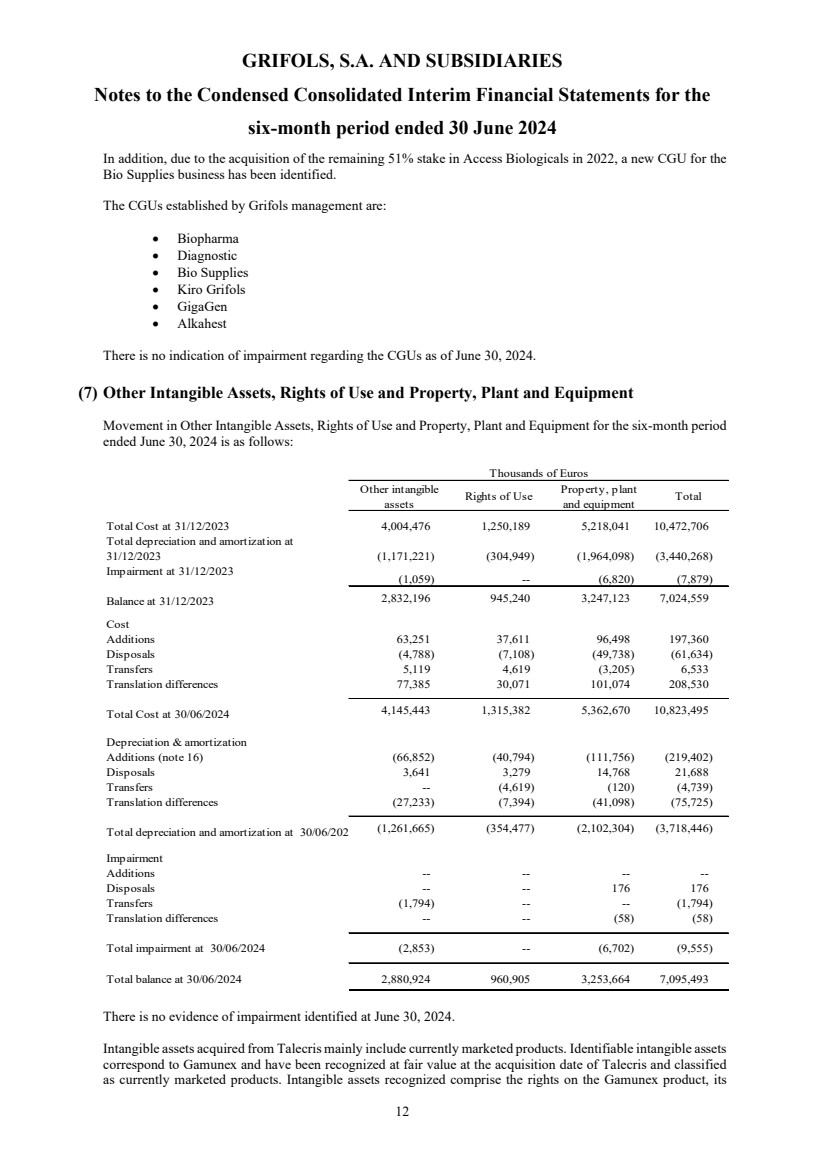
| GRIFOLS, S.A. AND SUBSIDIARIES
Notes to the Condensed Consolidated Interim Financial Statements for the
six-month period ended 30 June 2024
12
In addition, due to the acquisition of the remaining 51% stake in Access Biologicals in 2022, a new CGU for the
Bio Supplies business has been identified.
The CGUs established by Grifols management are:
• Biopharma
• Diagnostic
• Bio Supplies
• Kiro Grifols
• GigaGen
• Alkahest
There is no indication of impairment regarding the CGUs as of June 30, 2024.
(7) Other Intangible Assets, Rights of Use and Property, Plant and Equipment
Movement in Other Intangible Assets, Rights of Use and Property, Plant and Equipment for the six-month period
ended June 30, 2024 is as follows:
Other intangible
assets Rights of Use Property, plant
and equipment Total
Total Cost at 31/12/2023 4,004,476 1,250,189 5,218,041 10,472,706
Total depreciation and amortization at
31/12/2023 (1,171,221) (304,949) (1,964,098) (3,440,268)
Impairment at 31/12/2023 (1,059) -- (6,820) (7,879)
Balance at 31/12/2023 2,832,196 945,240 3,247,123 7,024,559
Cost
Additions 63,251 37,611 96,498 197,360
Disposals (4,788) (7,108) (49,738) (61,634)
Transfers 5,119 4,619 (3,205) 6,533
Translation differences 77,385 30,071 101,074 208,530
Total Cost at 30/06/2024 4,145,443 1,315,382 5,362,670 10,823,495
Depreciation & amortization
Additions (note 16) (66,852) (40,794) (111,756) (219,402)
Disposals 3,641 3,279 14,768 21,688
Transfers -- (4,619) (120) (4,739)
Translation differences (27,233) (7,394) (41,098) (75,725)
Total depreciation and amortization at 30/06/202 (1,261,665) (354,477) (2,102,304) (3,718,446)
Impairment
Additions -- -- -- --
Disposals -- -- 176 176
Transfers (1,794) -- -- (1,794)
Translation differences -- -- (58) (58)
Total impairment at 30/06/2024 (2,853) -- (6,702) (9,555)
Total balance at 30/06/2024 2,880,924 960,905 3,253,664 7,095,493
Thousands of Euros
There is no evidence of impairment identified at June 30, 2024.
Intangible assets acquired from Talecris mainly include currently marketed products. Identifiable intangible assets
correspond to Gamunex and have been recognized at fair value at the acquisition date of Talecris and classified
as currently marketed products. Intangible assets recognized comprise the rights on the Gamunex product, its |
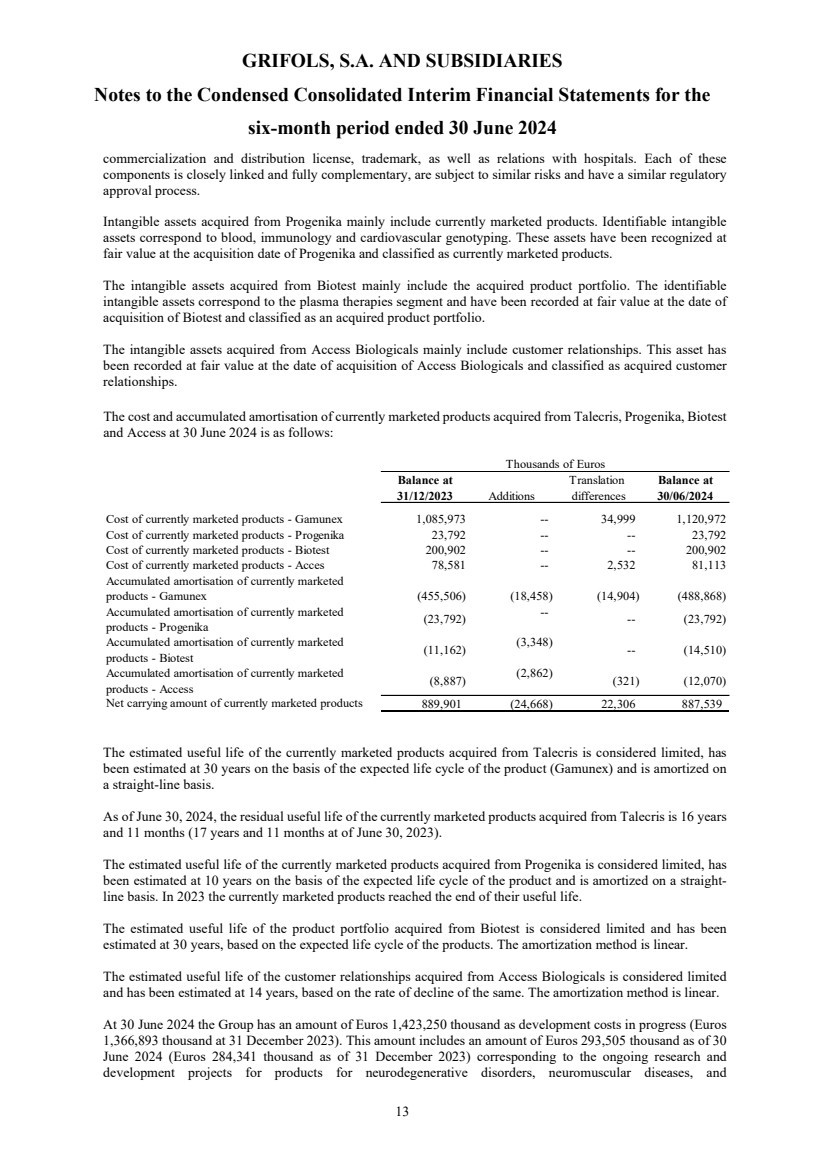
| GRIFOLS, S.A. AND SUBSIDIARIES
Notes to the Condensed Consolidated Interim Financial Statements for the
six-month period ended 30 June 2024
13
commercialization and distribution license, trademark, as well as relations with hospitals. Each of these
components is closely linked and fully complementary, are subject to similar risks and have a similar regulatory
approval process.
Intangible assets acquired from Progenika mainly include currently marketed products. Identifiable intangible
assets correspond to blood, immunology and cardiovascular genotyping. These assets have been recognized at
fair value at the acquisition date of Progenika and classified as currently marketed products.
The intangible assets acquired from Biotest mainly include the acquired product portfolio. The identifiable
intangible assets correspond to the plasma therapies segment and have been recorded at fair value at the date of
acquisition of Biotest and classified as an acquired product portfolio.
The intangible assets acquired from Access Biologicals mainly include customer relationships. This asset has
been recorded at fair value at the date of acquisition of Access Biologicals and classified as acquired customer
relationships.
The cost and accumulated amortisation of currently marketed products acquired from Talecris, Progenika, Biotest
and Access at 30 June 2024 is as follows:
Balance at Translation Balance at
31/12/2023 Additions differences 30/06/2024
Cost of currently marketed products - Gamunex 1,085,973 -- 34,999 1,120,972
Cost of currently marketed products - Progenika 23,792 -- -- 23,792
Cost of currently marketed products - Biotest 200,902 -- -- 200,902
Cost of currently marketed products - Acces 78,581 -- 2,532 81,113
Accumulated amortisation of currently marketed
products - Gamunex (455,506) (18,458) (14,904) (488,868)
Accumulated amortisation of currently marketed
products - Progenika (23,792) -- -- (23,792)
Accumulated amortisation of currently marketed
products - Biotest (11,162) (3,348) -- (14,510)
Accumulated amortisation of currently marketed
products - Access (8,887) (2,862) (321) (12,070)
Net carrying amount of currently marketed products 889,901 (24,668) 22,306 887,539
Thousands of Euros
The estimated useful life of the currently marketed products acquired from Talecris is considered limited, has
been estimated at 30 years on the basis of the expected life cycle of the product (Gamunex) and is amortized on
a straight-line basis.
As of June 30, 2024, the residual useful life of the currently marketed products acquired from Talecris is 16 years
and 11 months (17 years and 11 months at of June 30, 2023).
The estimated useful life of the currently marketed products acquired from Progenika is considered limited, has
been estimated at 10 years on the basis of the expected life cycle of the product and is amortized on a straight-line basis. In 2023 the currently marketed products reached the end of their useful life.
The estimated useful life of the product portfolio acquired from Biotest is considered limited and has been
estimated at 30 years, based on the expected life cycle of the products. The amortization method is linear.
The estimated useful life of the customer relationships acquired from Access Biologicals is considered limited
and has been estimated at 14 years, based on the rate of decline of the same. The amortization method is linear.
At 30 June 2024 the Group has an amount of Euros 1,423,250 thousand as development costs in progress (Euros
1,366,893 thousand at 31 December 2023). This amount includes an amount of Euros 293,505 thousand as of 30
June 2024 (Euros 284,341 thousand as of 31 December 2023) corresponding to the ongoing research and
development projects for products for neurodegenerative disorders, neuromuscular diseases, and |
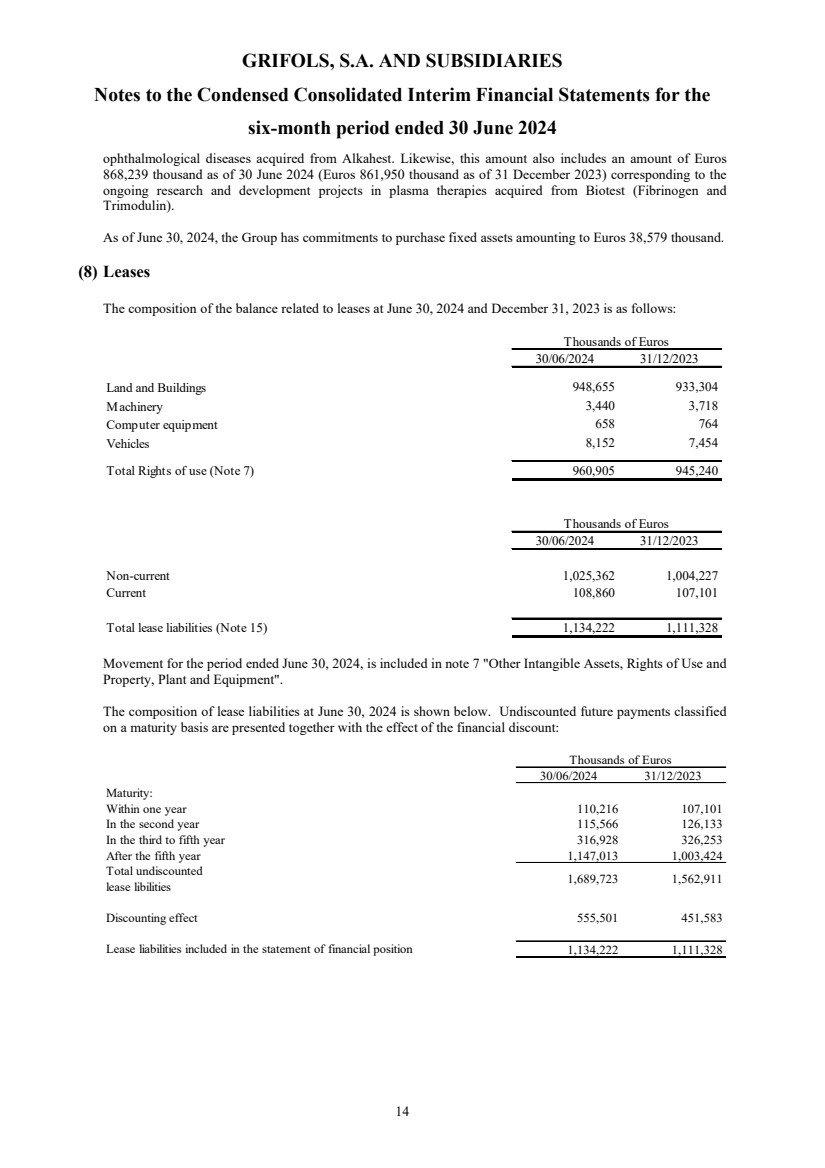
| GRIFOLS, S.A. AND SUBSIDIARIES
Notes to the Condensed Consolidated Interim Financial Statements for the
six-month period ended 30 June 2024
14
ophthalmological diseases acquired from Alkahest. Likewise, this amount also includes an amount of Euros
868,239 thousand as of 30 June 2024 (Euros 861,950 thousand as of 31 December 2023) corresponding to the
ongoing research and development projects in plasma therapies acquired from Biotest (Fibrinogen and
Trimodulin).
As of June 30, 2024, the Group has commitments to purchase fixed assets amounting to Euros 38,579 thousand.
(8) Leases
The composition of the balance related to leases at June 30, 2024 and December 31, 2023 is as follows:
Movement for the period ended June 30, 2024, is included in note 7 "Other Intangible Assets, Rights of Use and
Property, Plant and Equipment".
The composition of lease liabilities at June 30, 2024 is shown below. Undiscounted future payments classified
on a maturity basis are presented together with the effect of the financial discount:
30/06/2024 31/12/2023
Maturity:
Within one year 110,216 107,101
In the second year 115,566 126,133
In the third to fifth year 316,928 326,253
After the fifth year 1,147,013 1,003,424
Total undiscounted
lease libilities 1,689,723 1,562,911
Discounting effect 555,501 451,583
Lease liabilities included in the statement of financial position 1,134,222 1,111,328
Thousands of Euros
30/06/2024 31/12/2023
Land and Buildings 948,655 933,304
Machinery 3,440 3,718
Computer equipment 658 764
Vehicles 8,152 7,454
Total Rights of use (Note 7) 960,905 945,240
30/06/2024 31/12/2023
Non-current 1,025,362 1,004,227
Current 108,860 107,101
Total lease liabilities (Note 15) 1,134,222 1,111,328
Thousands of Euros
Thousands of Euros |
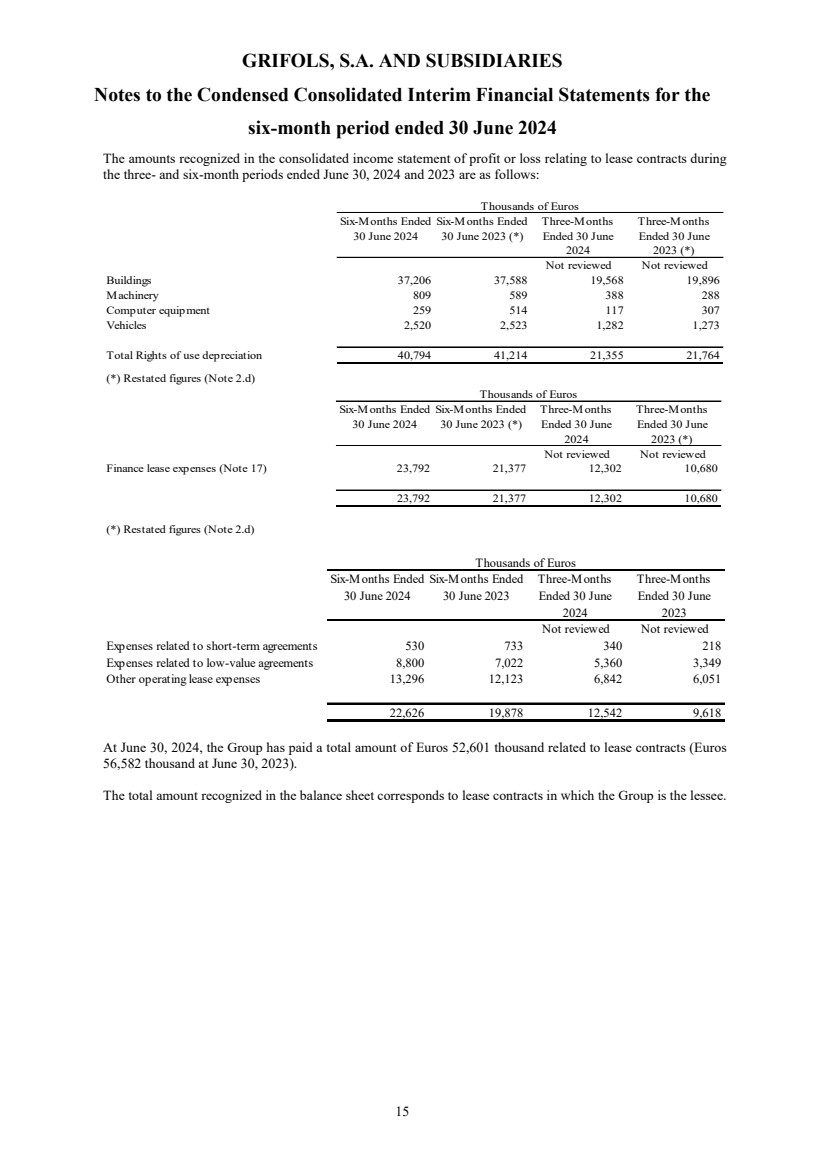
| GRIFOLS, S.A. AND SUBSIDIARIES
Notes to the Condensed Consolidated Interim Financial Statements for the
six-month period ended 30 June 2024
15
The amounts recognized in the consolidated income statement of profit or loss relating to lease contracts during
the three- and six-month periods ended June 30, 2024 and 2023 are as follows:
Six-Months Ended
30 June 2024
Six-Months Ended
30 June 2023 (*)
Three-Months
Ended 30 June
2024
Three-Months
Ended 30 June
2023 (*)
Not reviewed Not reviewed
Buildings 37,206 37,588 19,568 19,896
Machinery 809 589 388 288
Computer equipment 259 514 117 307
Vehicles 2,520 2,523 1,282 1,273
Total Rights of use depreciation 40,794 41,214 21,355 21,764
(*) Restated figures (Note 2.d)
Thousands of Euros
Six-Months Ended
30 June 2024
Six-Months Ended
30 June 2023 (*)
Three-Months
Ended 30 June
2024
Three-Months
Ended 30 June
2023 (*)
Not reviewed Not reviewed
Finance lease expenses (Note 17) 23,792 21,377 12,302 10,680
23,792 21,377 12,302 10,680
(*) Restated figures (Note 2.d)
Thousands of Euros
At June 30, 2024, the Group has paid a total amount of Euros 52,601 thousand related to lease contracts (Euros
56,582 thousand at June 30, 2023).
The total amount recognized in the balance sheet corresponds to lease contracts in which the Group is the lessee.
Six-Months Ended
30 June 2024
Six-Months Ended
30 June 2023
Three-Months
Ended 30 June
2024
Three-Months
Ended 30 June
2023
Not reviewed Not reviewed
Expenses related to short-term agreements 530 733 340 218
Expenses related to low-value agreements 8,800 7,022 5,360 3,349
Other operating lease expenses 13,296 12,123 6,842 6,051
22,626 19,878 12,542 9,618
Thousands of Euros |
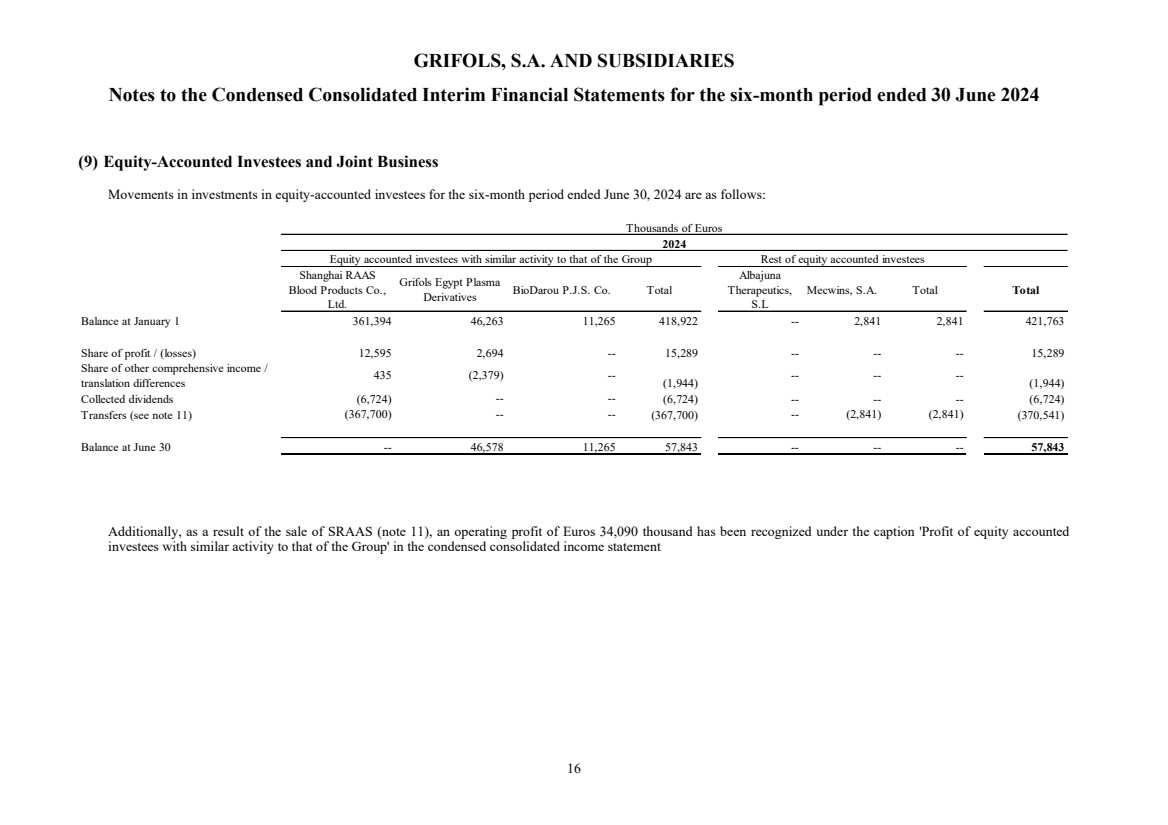
| GRIFOLS, S.A. AND SUBSIDIARIES
Notes to the Condensed Consolidated Interim Financial Statements for the six-month period ended 30 June 2024
16
(9) Equity-Accounted Investees and Joint Business
Movements in investments in equity-accounted investees for the six-month period ended June 30, 2024 are as follows:
Shanghai RAAS
Blood Products Co.,
Ltd.
Grifols Egypt Plasma
Derivatives BioDarou P.J.S. Co. Total
Albajuna
Therapeutics,
S.L
Mecwins, S.A. Total Total
Balance at January 1 361,394 46,263 11,265 418,922 -- 2,841 2,841 421,763
Share of profit / (losses) 12,595 2,694 -- 15,289 -- -- -- 15,289
Share of other comprehensive income /
translation differences 435 (2,379) -- (1,944) -- -- -- (1,944)
Collected dividends (6,724) -- -- (6,724) -- -- -- (6,724)
Transfers (see note 11) (367,700) -- -- (367,700) -- (2,841) (2,841) (370,541)
Balance at June 30 -- 46,578 11,265 57,843 -- -- -- 57,843
Equity accounted investees with similar activity to that of the Group Rest of equity accounted investees
Thousands of Euros
2024
Additionally, as a result of the sale of SRAAS (note 11), an operating profit of Euros 34,090 thousand has been recognized under the caption 'Profit of equity accounted
investees with similar activity to that of the Group' in the condensed consolidated income statement |
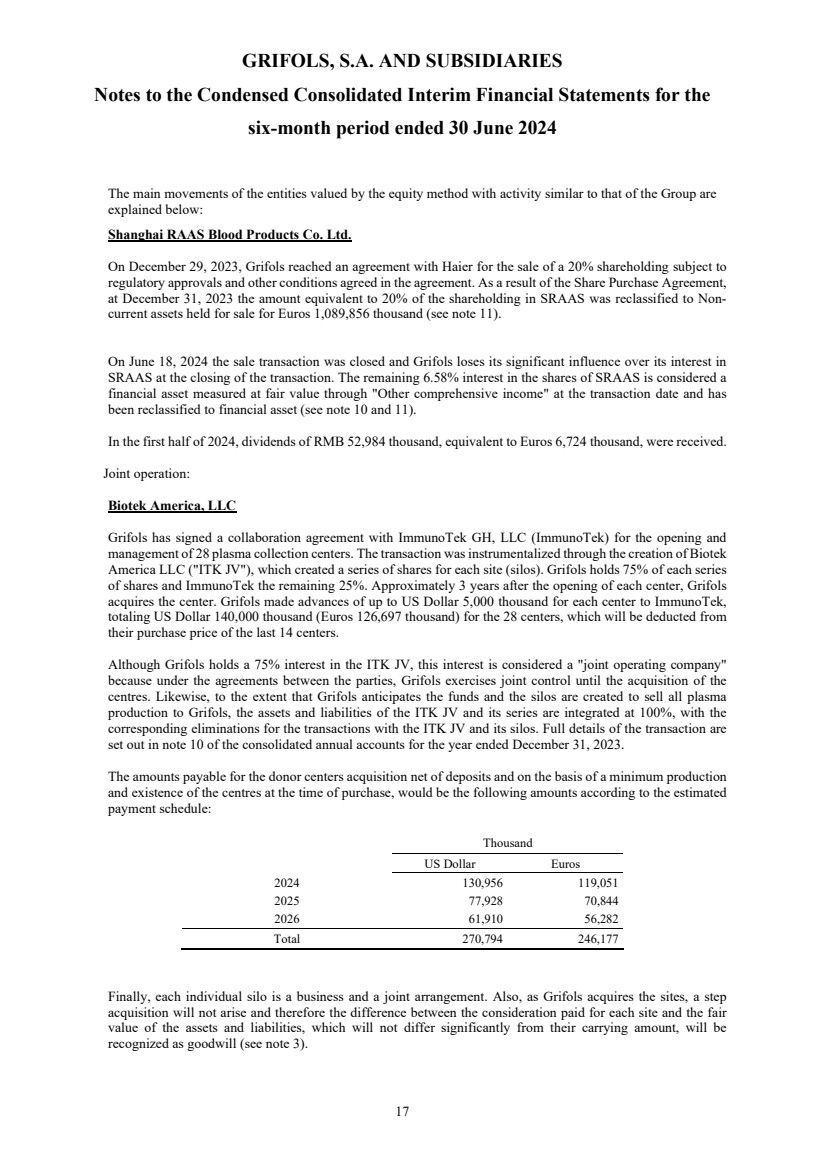
| GRIFOLS, S.A. AND SUBSIDIARIES
Notes to the Condensed Consolidated Interim Financial Statements for the
six-month period ended 30 June 2024
17
The main movements of the entities valued by the equity method with activity similar to that of the Group are
explained below:
Shanghai RAAS Blood Products Co. Ltd.
On December 29, 2023, Grifols reached an agreement with Haier for the sale of a 20% shareholding subject to
regulatory approvals and other conditions agreed in the agreement. As a result of the Share Purchase Agreement,
at December 31, 2023 the amount equivalent to 20% of the shareholding in SRAAS was reclassified to Non-current assets held for sale for Euros 1,089,856 thousand (see note 11).
On June 18, 2024 the sale transaction was closed and Grifols loses its significant influence over its interest in
SRAAS at the closing of the transaction. The remaining 6.58% interest in the shares of SRAAS is considered a
financial asset measured at fair value through "Other comprehensive income" at the transaction date and has
been reclassified to financial asset (see note 10 and 11).
In the first half of 2024, dividends of RMB 52,984 thousand, equivalent to Euros 6,724 thousand, were received.
Joint operation:
Biotek America, LLC
Grifols has signed a collaboration agreement with ImmunoTek GH, LLC (ImmunoTek) for the opening and
management of 28 plasma collection centers. The transaction was instrumentalized through the creation of Biotek
America LLC ("ITK JV"), which created a series of shares for each site (silos). Grifols holds 75% of each series
of shares and ImmunoTek the remaining 25%. Approximately 3 years after the opening of each center, Grifols
acquires the center. Grifols made advances of up to US Dollar 5,000 thousand for each center to ImmunoTek,
totaling US Dollar 140,000 thousand (Euros 126,697 thousand) for the 28 centers, which will be deducted from
their purchase price of the last 14 centers.
Although Grifols holds a 75% interest in the ITK JV, this interest is considered a "joint operating company"
because under the agreements between the parties, Grifols exercises joint control until the acquisition of the
centres. Likewise, to the extent that Grifols anticipates the funds and the silos are created to sell all plasma
production to Grifols, the assets and liabilities of the ITK JV and its series are integrated at 100%, with the
corresponding eliminations for the transactions with the ITK JV and its silos. Full details of the transaction are
set out in note 10 of the consolidated annual accounts for the year ended December 31, 2023.
The amounts payable for the donor centers acquisition net of deposits and on the basis of a minimum production
and existence of the centres at the time of purchase, would be the following amounts according to the estimated
payment schedule:
Thousand
US Dollar Euros
2024 130,956 119,051
2025 77,928 70,844
2026 61,910 56,282
Total 270,794 246,177
Finally, each individual silo is a business and a joint arrangement. Also, as Grifols acquires the sites, a step
acquisition will not arise and therefore the difference between the consideration paid for each site and the fair
value of the assets and liabilities, which will not differ significantly from their carrying amount, will be
recognized as goodwill (see note 3). |
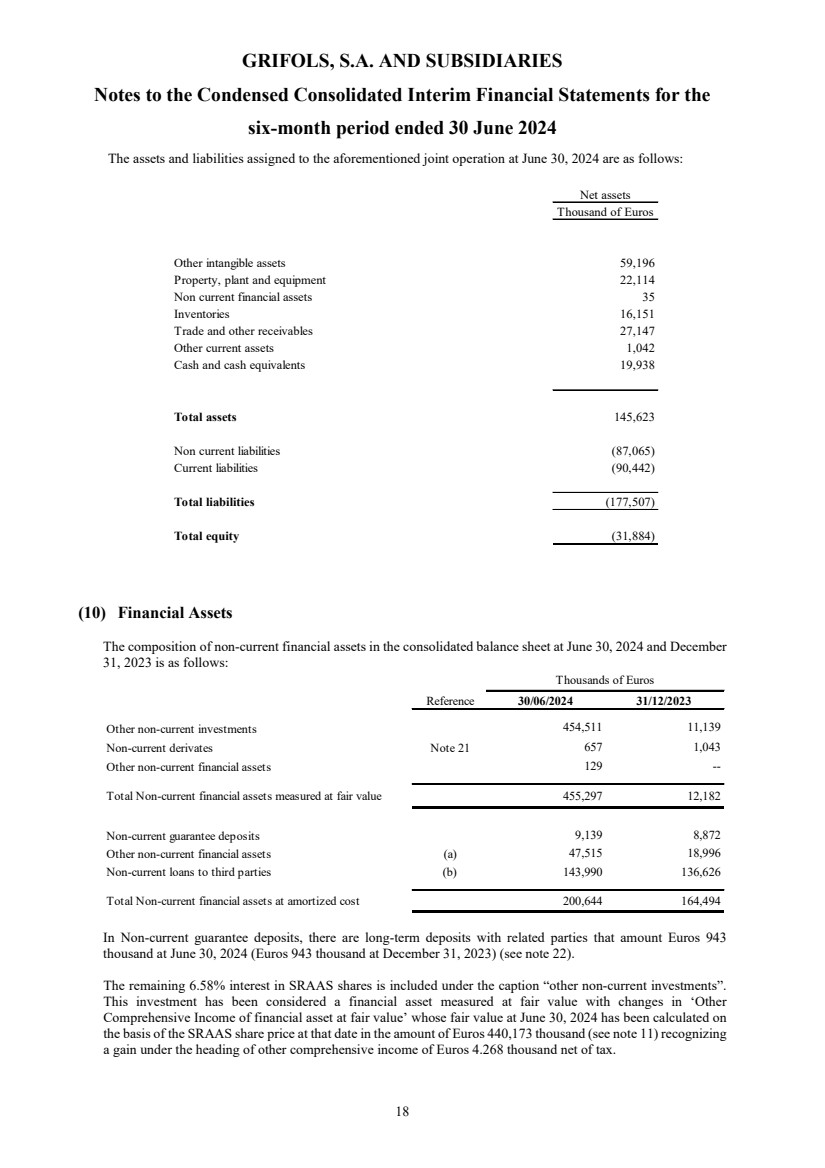
| GRIFOLS, S.A. AND SUBSIDIARIES
Notes to the Condensed Consolidated Interim Financial Statements for the
six-month period ended 30 June 2024
18
The assets and liabilities assigned to the aforementioned joint operation at June 30, 2024 are as follows:
Net assets
Thousand of Euros
Other intangible assets 59,196
Property, plant and equipment 22,114
Non current financial assets 35
Inventories 16,151
Trade and other receivables 27,147
Other current assets 1,042
Cash and cash equivalents 19,938
Total assets 145,623
Non current liabilities (87,065)
Current liabilities (90,442)
Total liabilities (177,507)
Total equity (31,884)
(10) Financial Assets
The composition of non-current financial assets in the consolidated balance sheet at June 30, 2024 and December
31, 2023 is as follows:
In Non-current guarantee deposits, there are long-term deposits with related parties that amount Euros 943
thousand at June 30, 2024 (Euros 943 thousand at December 31, 2023) (see note 22).
The remaining 6.58% interest in SRAAS shares is included under the caption “other non-current investments”.
This investment has been considered a financial asset measured at fair value with changes in ‘Other
Comprehensive Income of financial asset at fair value’ whose fair value at June 30, 2024 has been calculated on
the basis of the SRAAS share price at that date in the amount of Euros 440,173 thousand (see note 11) recognizing
a gain under the heading of other comprehensive income of Euros 4.268 thousand net of tax.
Reference 30/06/2024 31/12/2023
Other non-current investments 454,511 11,139
Non-current derivates Note 21 657 1,043
Other non-current financial assets 129 --
Total Non-current financial assets measured at fair value 455,297 12,182
Non-current guarantee deposits 9,139 8,872
Other non-current financial assets (a) 47,515 18,996
Non-current loans to third parties (b) 143,990 136,626
Total Non-current financial assets at amortized cost 200,644 164,494
Thousands of Euros |
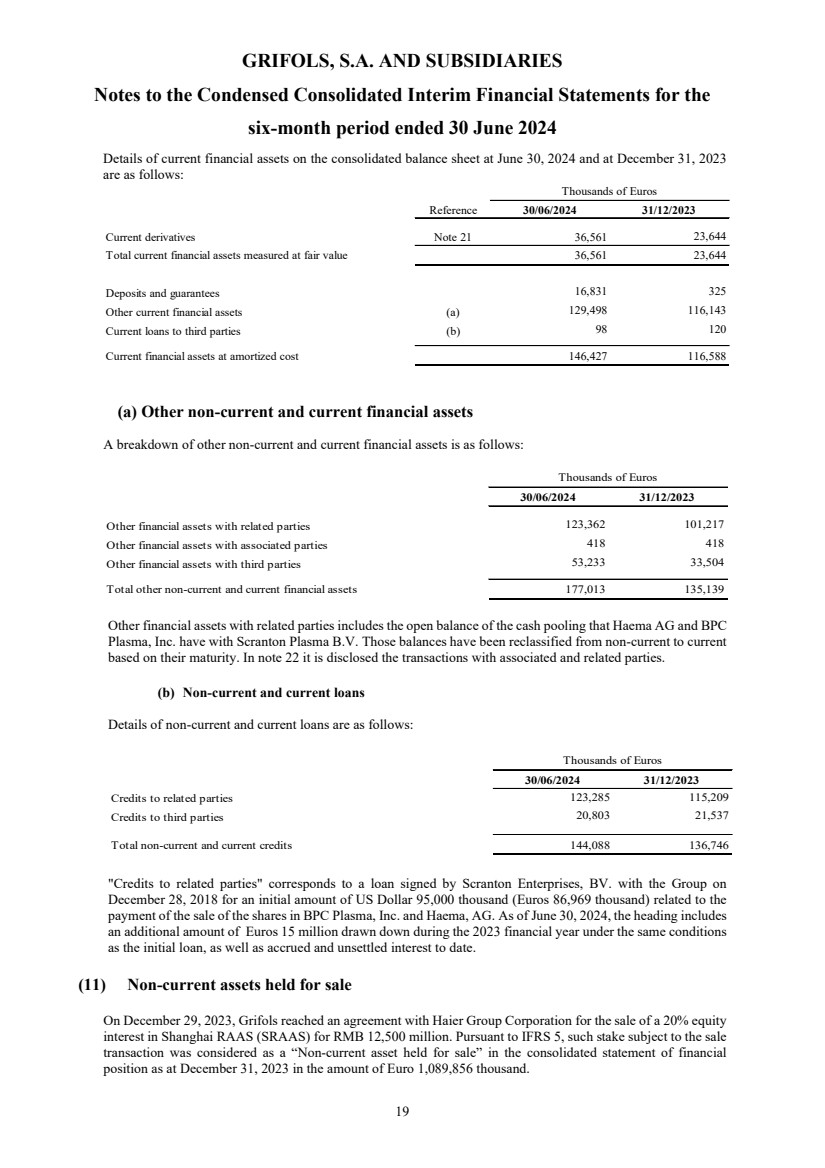
| GRIFOLS, S.A. AND SUBSIDIARIES
Notes to the Condensed Consolidated Interim Financial Statements for the
six-month period ended 30 June 2024
19
Details of current financial assets on the consolidated balance sheet at June 30, 2024 and at December 31, 2023
are as follows:
Reference 30/06/2024 31/12/2023
Current derivatives Note 21 36,561 23,644
Total current financial assets measured at fair value 36,561 23,644
Deposits and guarantees 16,831 325
Other current financial assets (a) 129,498 116,143
Current loans to third parties (b) 98 120
Current financial assets at amortized cost 146,427 116,588
Thousands of Euros
(a) Other non-current and current financial assets
A breakdown of other non-current and current financial assets is as follows:
30/06/2024 31/12/2023
Other financial assets with related parties 123,362 101,217
Other financial assets with associated parties 418 418
Other financial assets with third parties 53,233 33,504
Total other non-current and current financial assets 177,013 135,139
Thousands of Euros
Other financial assets with related parties includes the open balance of the cash pooling that Haema AG and BPC
Plasma, Inc. have with Scranton Plasma B.V. Those balances have been reclassified from non-current to current
based on their maturity. In note 22 it is disclosed the transactions with associated and related parties.
(b) Non-current and current loans
Details of non-current and current loans are as follows:
30/06/2024 31/12/2023
Credits to related parties 123,285 115,209
Credits to third parties 20,803 21,537
Total non-current and current credits 144,088 136,746
Thousands of Euros
"Credits to related parties" corresponds to a loan signed by Scranton Enterprises, BV. with the Group on
December 28, 2018 for an initial amount of US Dollar 95,000 thousand (Euros 86,969 thousand) related to the
payment of the sale of the shares in BPC Plasma, Inc. and Haema, AG. As of June 30, 2024, the heading includes
an additional amount of Euros 15 million drawn down during the 2023 financial year under the same conditions
as the initial loan, as well as accrued and unsettled interest to date.
(11) Non-current assets held for sale
On December 29, 2023, Grifols reached an agreement with Haier Group Corporation for the sale of a 20% equity
interest in Shanghai RAAS (SRAAS) for RMB 12,500 million. Pursuant to IFRS 5, such stake subject to the sale
transaction was considered as a “Non-current asset held for sale” in the consolidated statement of financial
position as at December 31, 2023 in the amount of Euro 1,089,856 thousand. |
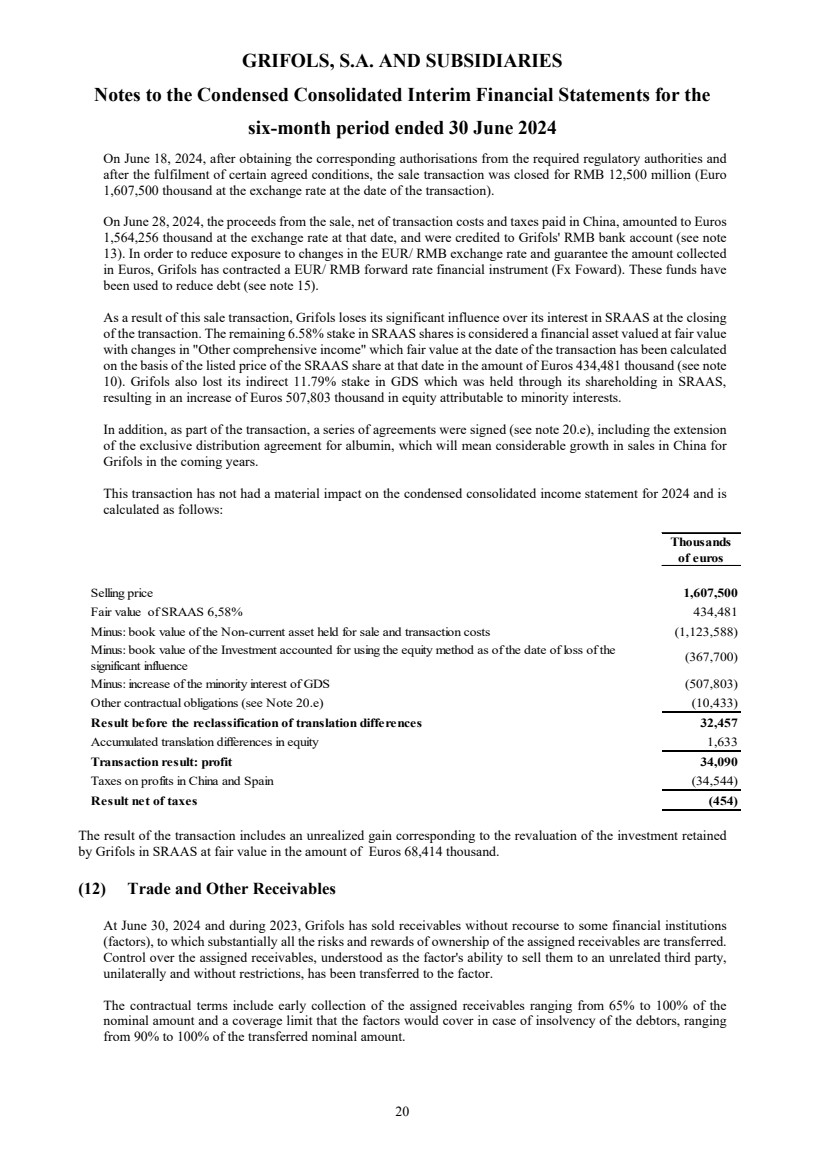
| GRIFOLS, S.A. AND SUBSIDIARIES
Notes to the Condensed Consolidated Interim Financial Statements for the
six-month period ended 30 June 2024
20
On June 18, 2024, after obtaining the corresponding authorisations from the required regulatory authorities and
after the fulfilment of certain agreed conditions, the sale transaction was closed for RMB 12,500 million (Euro
1,607,500 thousand at the exchange rate at the date of the transaction).
On June 28, 2024, the proceeds from the sale, net of transaction costs and taxes paid in China, amounted to Euros
1,564,256 thousand at the exchange rate at that date, and were credited to Grifols' RMB bank account (see note
13). In order to reduce exposure to changes in the EUR/ RMB exchange rate and guarantee the amount collected
in Euros, Grifols has contracted a EUR/ RMB forward rate financial instrument (Fx Foward). These funds have
been used to reduce debt (see note 15).
As a result of this sale transaction, Grifols loses its significant influence over its interest in SRAAS at the closing
of the transaction. The remaining 6.58% stake in SRAAS shares is considered a financial asset valued at fair value
with changes in "Other comprehensive income" which fair value at the date of the transaction has been calculated
on the basis of the listed price of the SRAAS share at that date in the amount of Euros 434,481 thousand (see note
10). Grifols also lost its indirect 11.79% stake in GDS which was held through its shareholding in SRAAS,
resulting in an increase of Euros 507,803 thousand in equity attributable to minority interests.
In addition, as part of the transaction, a series of agreements were signed (see note 20.e), including the extension
of the exclusive distribution agreement for albumin, which will mean considerable growth in sales in China for
Grifols in the coming years.
This transaction has not had a material impact on the condensed consolidated income statement for 2024 and is
calculated as follows:
Selling price 1,607,500
Fair value of SRAAS 6,58% 434,481
Minus: book value of the Non-current asset held for sale and transaction costs (1,123,588)
Minus: book value of the Investment accounted for using the equity method as of the date of loss of the
significant influence (367,700)
Minus: increase of the minority interest of GDS (507,803)
Other contractual obligations (see Note 20.e) (10,433)
Result before the reclassification of translation differences 32,457
Accumulated translation differences in equity 1,633
Transaction result: profit 34,090
Taxes on profits in China and Spain (34,544)
Result net of taxes (454)
Thousands
of euros
The result of the transaction includes an unrealized gain corresponding to the revaluation of the investment retained
by Grifols in SRAAS at fair value in the amount of Euros 68,414 thousand.
(12) Trade and Other Receivables
At June 30, 2024 and during 2023, Grifols has sold receivables without recourse to some financial institutions
(factors), to which substantially all the risks and rewards of ownership of the assigned receivables are transferred.
Control over the assigned receivables, understood as the factor's ability to sell them to an unrelated third party,
unilaterally and without restrictions, has been transferred to the factor.
The contractual terms include early collection of the assigned receivables ranging from 65% to 100% of the
nominal amount and a coverage limit that the factors would cover in case of insolvency of the debtors, ranging
from 90% to 100% of the transferred nominal amount. |
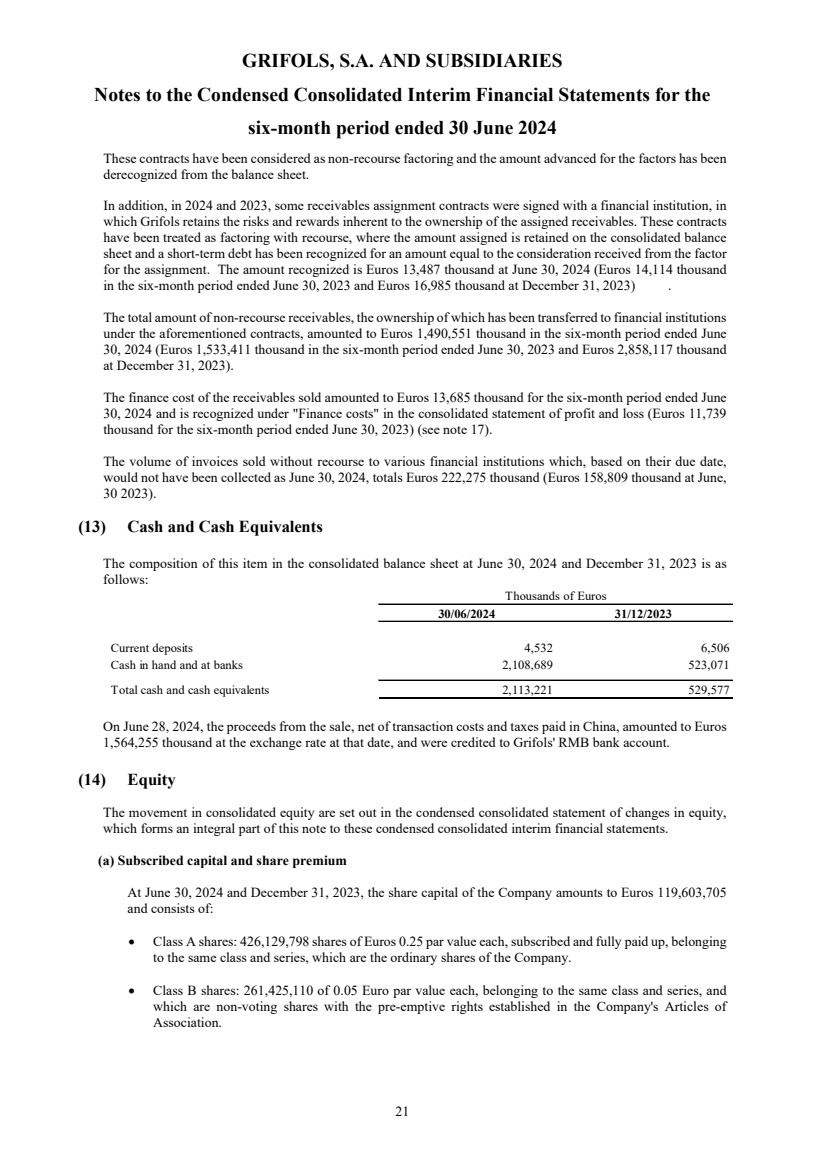
| GRIFOLS, S.A. AND SUBSIDIARIES
Notes to the Condensed Consolidated Interim Financial Statements for the
six-month period ended 30 June 2024
21
These contracts have been considered as non-recourse factoring and the amount advanced for the factors has been
derecognized from the balance sheet.
In addition, in 2024 and 2023, some receivables assignment contracts were signed with a financial institution, in
which Grifols retains the risks and rewards inherent to the ownership of the assigned receivables. These contracts
have been treated as factoring with recourse, where the amount assigned is retained on the consolidated balance
sheet and a short-term debt has been recognized for an amount equal to the consideration received from the factor
for the assignment. The amount recognized is Euros 13,487 thousand at June 30, 2024 (Euros 14,114 thousand
in the six-month period ended June 30, 2023 and Euros 16,985 thousand at December 31, 2023) .
The total amount of non-recourse receivables, the ownership of which has been transferred to financial institutions
under the aforementioned contracts, amounted to Euros 1,490,551 thousand in the six-month period ended June
30, 2024 (Euros 1,533,411 thousand in the six-month period ended June 30, 2023 and Euros 2,858,117 thousand
at December 31, 2023).
The finance cost of the receivables sold amounted to Euros 13,685 thousand for the six-month period ended June
30, 2024 and is recognized under "Finance costs" in the consolidated statement of profit and loss (Euros 11,739
thousand for the six-month period ended June 30, 2023) (see note 17).
The volume of invoices sold without recourse to various financial institutions which, based on their due date,
would not have been collected as June 30, 2024, totals Euros 222,275 thousand (Euros 158,809 thousand at June,
30 2023).
(13) Cash and Cash Equivalents
The composition of this item in the consolidated balance sheet at June 30, 2024 and December 31, 2023 is as
follows:
30/06/2024 31/12/2023
Current deposits 4,532 6,506
Cash in hand and at banks 2,108,689 523,071
Total cash and cash equivalents 2,113,221 529,577
Thousands of Euros
On June 28, 2024, the proceeds from the sale, net of transaction costs and taxes paid in China, amounted to Euros
1,564,255 thousand at the exchange rate at that date, and were credited to Grifols' RMB bank account.
(14) Equity
The movement in consolidated equity are set out in the condensed consolidated statement of changes in equity,
which forms an integral part of this note to these condensed consolidated interim financial statements.
(a) Subscribed capital and share premium
At June 30, 2024 and December 31, 2023, the share capital of the Company amounts to Euros 119,603,705
and consists of:
• Class A shares: 426,129,798 shares of Euros 0.25 par value each, subscribed and fully paid up, belonging
to the same class and series, which are the ordinary shares of the Company.
• Class B shares: 261,425,110 of 0.05 Euro par value each, belonging to the same class and series, and
which are non-voting shares with the pre-emptive rights established in the Company's Articles of
Association. |
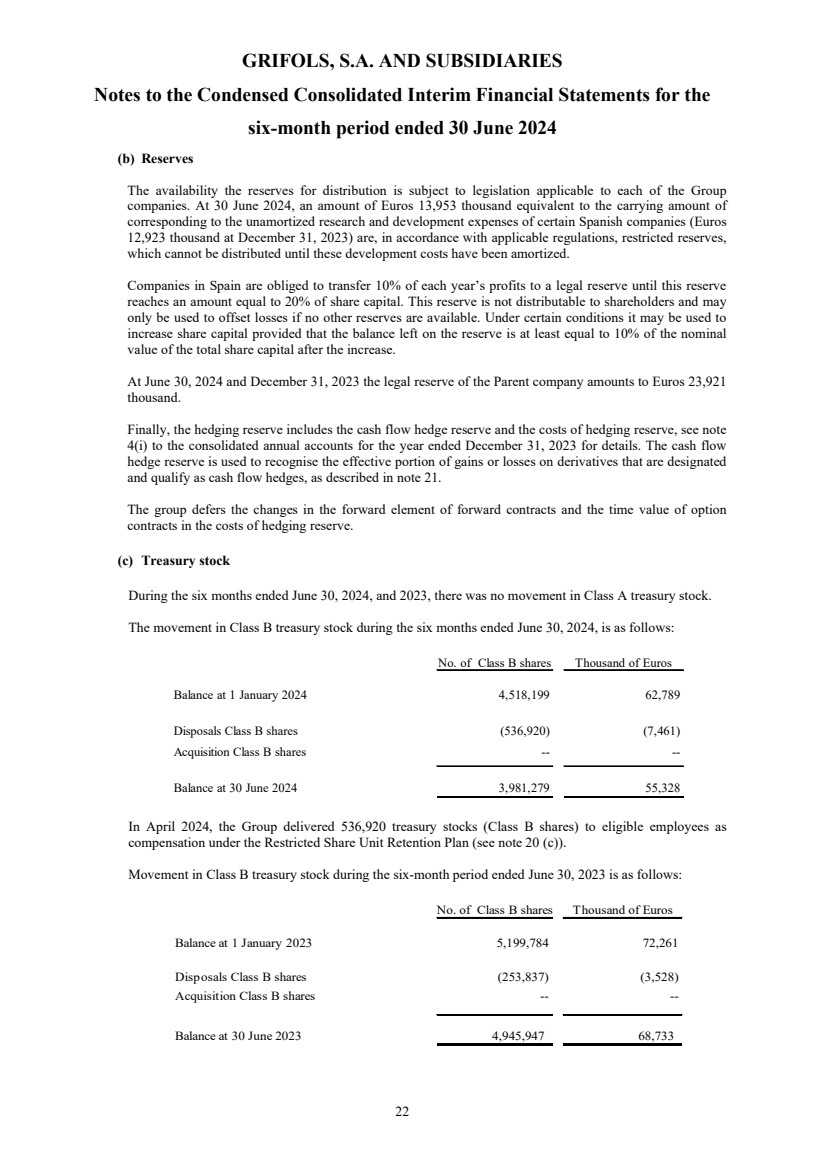
| GRIFOLS, S.A. AND SUBSIDIARIES
Notes to the Condensed Consolidated Interim Financial Statements for the
six-month period ended 30 June 2024
22
(b) Reserves
The availability the reserves for distribution is subject to legislation applicable to each of the Group
companies. At 30 June 2024, an amount of Euros 13,953 thousand equivalent to the carrying amount of
corresponding to the unamortized research and development expenses of certain Spanish companies (Euros
12,923 thousand at December 31, 2023) are, in accordance with applicable regulations, restricted reserves,
which cannot be distributed until these development costs have been amortized.
Companies in Spain are obliged to transfer 10% of each year’s profits to a legal reserve until this reserve
reaches an amount equal to 20% of share capital. This reserve is not distributable to shareholders and may
only be used to offset losses if no other reserves are available. Under certain conditions it may be used to
increase share capital provided that the balance left on the reserve is at least equal to 10% of the nominal
value of the total share capital after the increase.
At June 30, 2024 and December 31, 2023 the legal reserve of the Parent company amounts to Euros 23,921
thousand.
Finally, the hedging reserve includes the cash flow hedge reserve and the costs of hedging reserve, see note
4(i) to the consolidated annual accounts for the year ended December 31, 2023 for details. The cash flow
hedge reserve is used to recognise the effective portion of gains or losses on derivatives that are designated
and qualify as cash flow hedges, as described in note 21.
The group defers the changes in the forward element of forward contracts and the time value of option
contracts in the costs of hedging reserve.
(c) Treasury stock
During the six months ended June 30, 2024, and 2023, there was no movement in Class A treasury stock.
The movement in Class B treasury stock during the six months ended June 30, 2024, is as follows:
No. of Class B shares Thousand of Euros
Balance at 1 January 2024 4,518,199 62,789
Disposals Class B shares (536,920) (7,461)
Acquisition Class B shares -- --
Balance at 30 June 2024 3,981,279 55,328
In April 2024, the Group delivered 536,920 treasury stocks (Class B shares) to eligible employees as
compensation under the Restricted Share Unit Retention Plan (see note 20 (c)).
Movement in Class B treasury stock during the six-month period ended June 30, 2023 is as follows:
No. of Class B shares Thousand of Euros
Balance at 1 January 2023 5,199,784 72,261
Disposals Class B shares (253,837) (3,528)
Acquisition Class B shares -- --
Balance at 30 June 2023 4,945,947 68,733 |
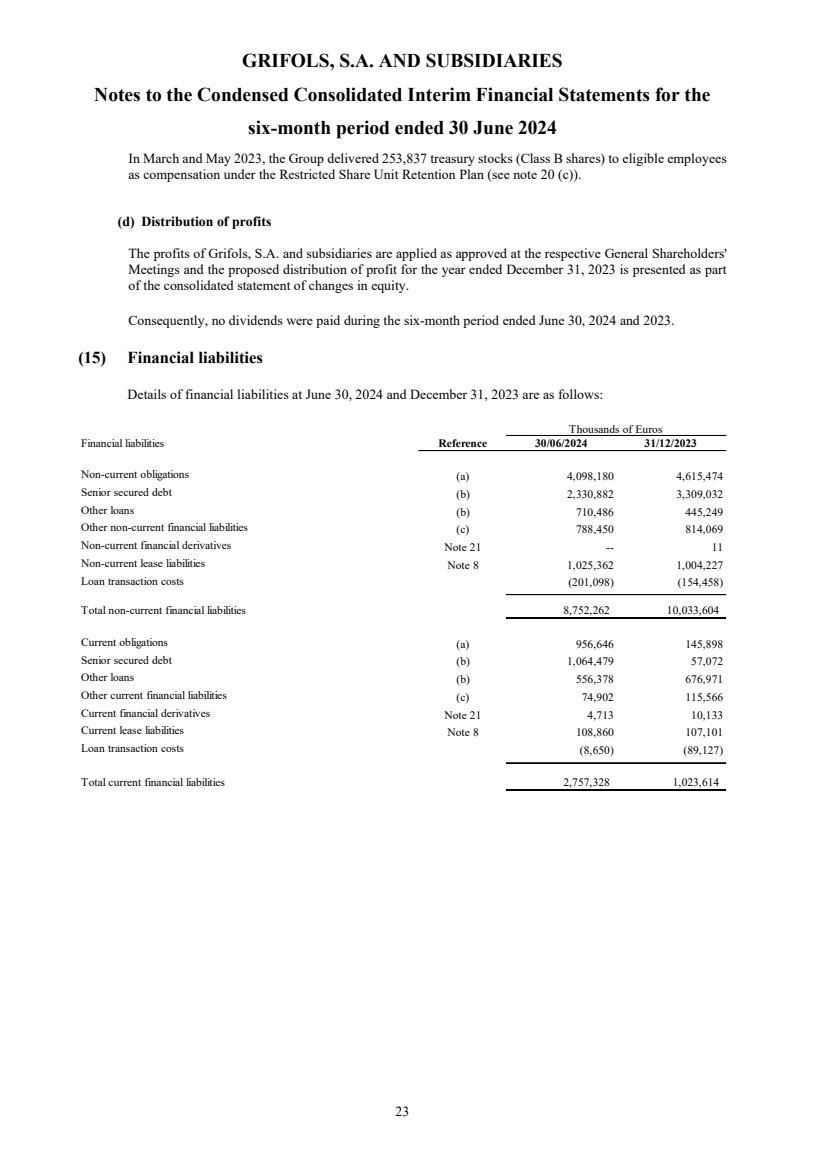
| GRIFOLS, S.A. AND SUBSIDIARIES
Notes to the Condensed Consolidated Interim Financial Statements for the
six-month period ended 30 June 2024
23
In March and May 2023, the Group delivered 253,837 treasury stocks (Class B shares) to eligible employees
as compensation under the Restricted Share Unit Retention Plan (see note 20 (c)).
(d) Distribution of profits
The profits of Grifols, S.A. and subsidiaries are applied as approved at the respective General Shareholders'
Meetings and the proposed distribution of profit for the year ended December 31, 2023 is presented as part
of the consolidated statement of changes in equity.
Consequently, no dividends were paid during the six-month period ended June 30, 2024 and 2023.
(15) Financial liabilities
Details of financial liabilities at June 30, 2024 and December 31, 2023 are as follows:
Financial liabilities Reference 30/06/2024 31/12/2023
Non-current obligations (a) 4,098,180 4,615,474
Senior secured debt (b) 2,330,882 3,309,032
Other loans (b) 710,486 445,249
Other non-current financial liabilities (c) 788,450 814,069
Non-current financial derivatives Note 21 -- 11
Non-current lease liabilities Note 8 1,025,362 1,004,227
Loan transaction costs (201,098) (154,458)
Total non-current financial liabilities 8,752,262 10,033,604
Current obligations (a) 956,646 145,898
Senior secured debt (b) 1,064,479 57,072
Other loans (b) 556,378 676,971
Other current financial liabilities (c) 74,902 115,566
Current financial derivatives Note 21 4,713 10,133
Current lease liabilities Note 8 108,860 107,101
Loan transaction costs (8,650) (89,127)
Total current financial liabilities 2,757,328 1,023,614
Thousands of Euros |
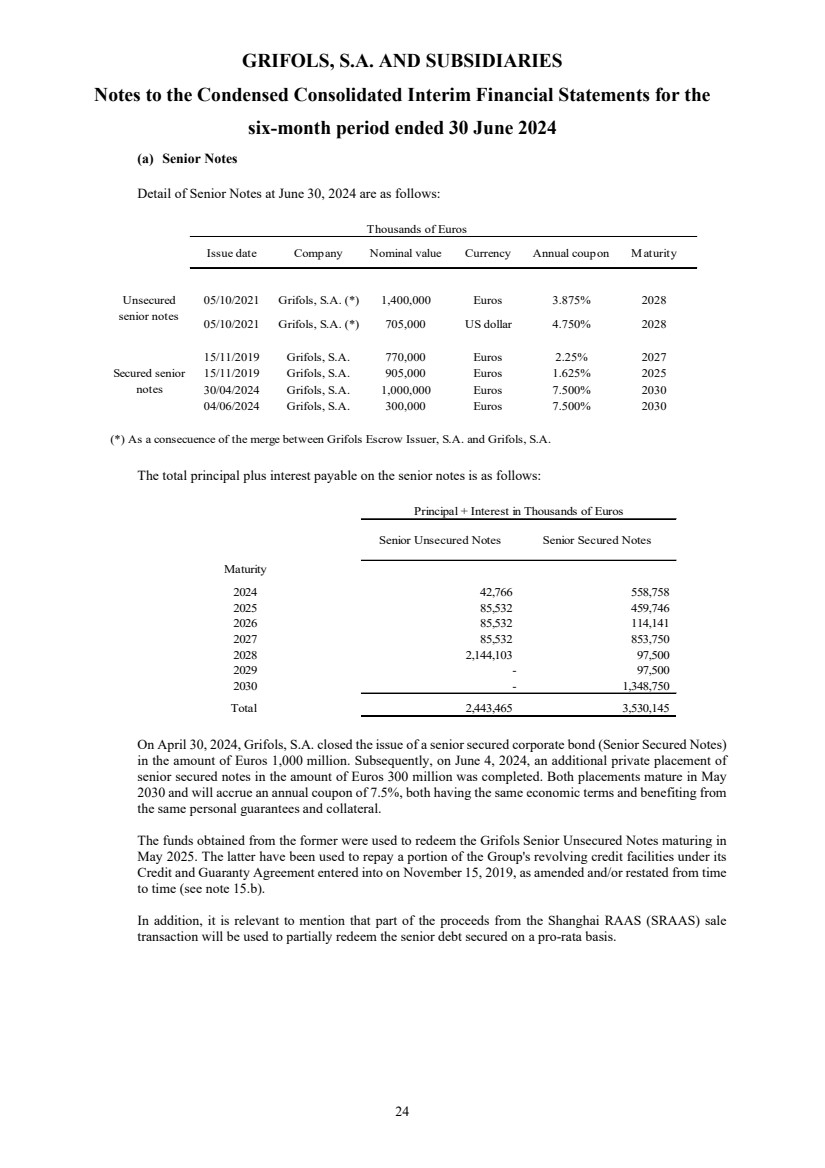
| GRIFOLS, S.A. AND SUBSIDIARIES
Notes to the Condensed Consolidated Interim Financial Statements for the
six-month period ended 30 June 2024
24
(a) Senior Notes
Detail of Senior Notes at June 30, 2024 are as follows:
Thousands of Euros
Issue date Company Nominal value Currency Annual coupon Maturity
05/10/2021 Grifols, S.A. (*) 1,400,000 Euros 3.875% 2028
05/10/2021 Grifols, S.A. (*) 705,000 US dollar 4.750% 2028
15/11/2019 Grifols, S.A. 770,000 Euros 2.25% 2027
15/11/2019 Grifols, S.A. 905,000 Euros 1.625% 2025
30/04/2024 Grifols, S.A. 1,000,000 Euros 7.500% 2030
04/06/2024 Grifols, S.A. 300,000 Euros 7.500% 2030
(*) As a consecuence of the merge between Grifols Escrow Issuer, S.A. and Grifols, S.A.
Unsecured
senior notes
Secured senior
notes
The total principal plus interest payable on the senior notes is as follows:
Senior Unsecured Notes Senior Secured Notes
Maturity
2024 42,766 558,758
2025 85,532 459,746
2026 85,532 114,141
2027 85,532 853,750
2028 2,144,103 97,500
2029 - 97,500
2030 - 1,348,750
Total 2,443,465 3,530,145
Principal + Interest in Thousands of Euros
On April 30, 2024, Grifols, S.A. closed the issue of a senior secured corporate bond (Senior Secured Notes)
in the amount of Euros 1,000 million. Subsequently, on June 4, 2024, an additional private placement of
senior secured notes in the amount of Euros 300 million was completed. Both placements mature in May
2030 and will accrue an annual coupon of 7.5%, both having the same economic terms and benefiting from
the same personal guarantees and collateral.
The funds obtained from the former were used to redeem the Grifols Senior Unsecured Notes maturing in
May 2025. The latter have been used to repay a portion of the Group's revolving credit facilities under its
Credit and Guaranty Agreement entered into on November 15, 2019, as amended and/or restated from time
to time (see note 15.b).
In addition, it is relevant to mention that part of the proceeds from the Shanghai RAAS (SRAAS) sale
transaction will be used to partially redeem the senior debt secured on a pro-rata basis. |
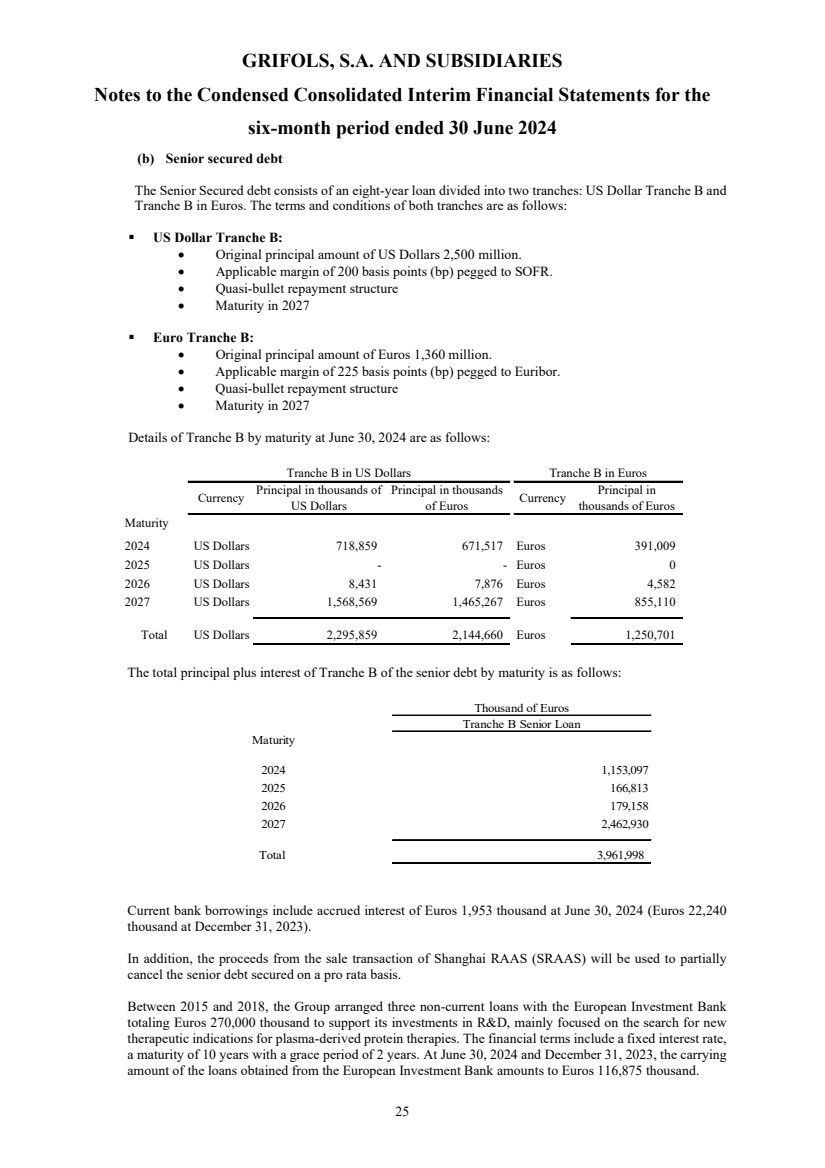
| GRIFOLS, S.A. AND SUBSIDIARIES
Notes to the Condensed Consolidated Interim Financial Statements for the
six-month period ended 30 June 2024
25
(b) Senior secured debt
The Senior Secured debt consists of an eight-year loan divided into two tranches: US Dollar Tranche B and
Tranche B in Euros. The terms and conditions of both tranches are as follows:
US Dollar Tranche B:
• Original principal amount of US Dollars 2,500 million.
• Applicable margin of 200 basis points (bp) pegged to SOFR.
• Quasi-bullet repayment structure
• Maturity in 2027
Euro Tranche B:
• Original principal amount of Euros 1,360 million.
• Applicable margin of 225 basis points (bp) pegged to Euribor.
• Quasi-bullet repayment structure
• Maturity in 2027
Details of Tranche B by maturity at June 30, 2024 are as follows:
Currency Principal in thousands of
US Dollars
Principal in thousands
of Euros Currency Principal in
thousands of Euros
Maturity
2024 US Dollars 718,859 671,517 Euros 391,009
2025 US Dollars - - Euros 0
2026 US Dollars 8,431 7,876 Euros 4,582
2027 US Dollars 1,568,569 1,465,267 Euros 855,110
Total US Dollars 2,295,859 2,144,660 Euros 1,250,701
Tranche B in US Dollars Tranche B in Euros
The total principal plus interest of Tranche B of the senior debt by maturity is as follows:
Thousand of Euros
Tranche B Senior Loan
Maturity
2024 1,153,097
2025 166,813
2026 179,158
2027 2,462,930
Total 3,961,998
Current bank borrowings include accrued interest of Euros 1,953 thousand at June 30, 2024 (Euros 22,240
thousand at December 31, 2023).
In addition, the proceeds from the sale transaction of Shanghai RAAS (SRAAS) will be used to partially
cancel the senior debt secured on a pro rata basis.
Between 2015 and 2018, the Group arranged three non-current loans with the European Investment Bank
totaling Euros 270,000 thousand to support its investments in R&D, mainly focused on the search for new
therapeutic indications for plasma-derived protein therapies. The financial terms include a fixed interest rate,
a maturity of 10 years with a grace period of 2 years. At June 30, 2024 and December 31, 2023, the carrying
amount of the loans obtained from the European Investment Bank amounts to Euros 116,875 thousand. |
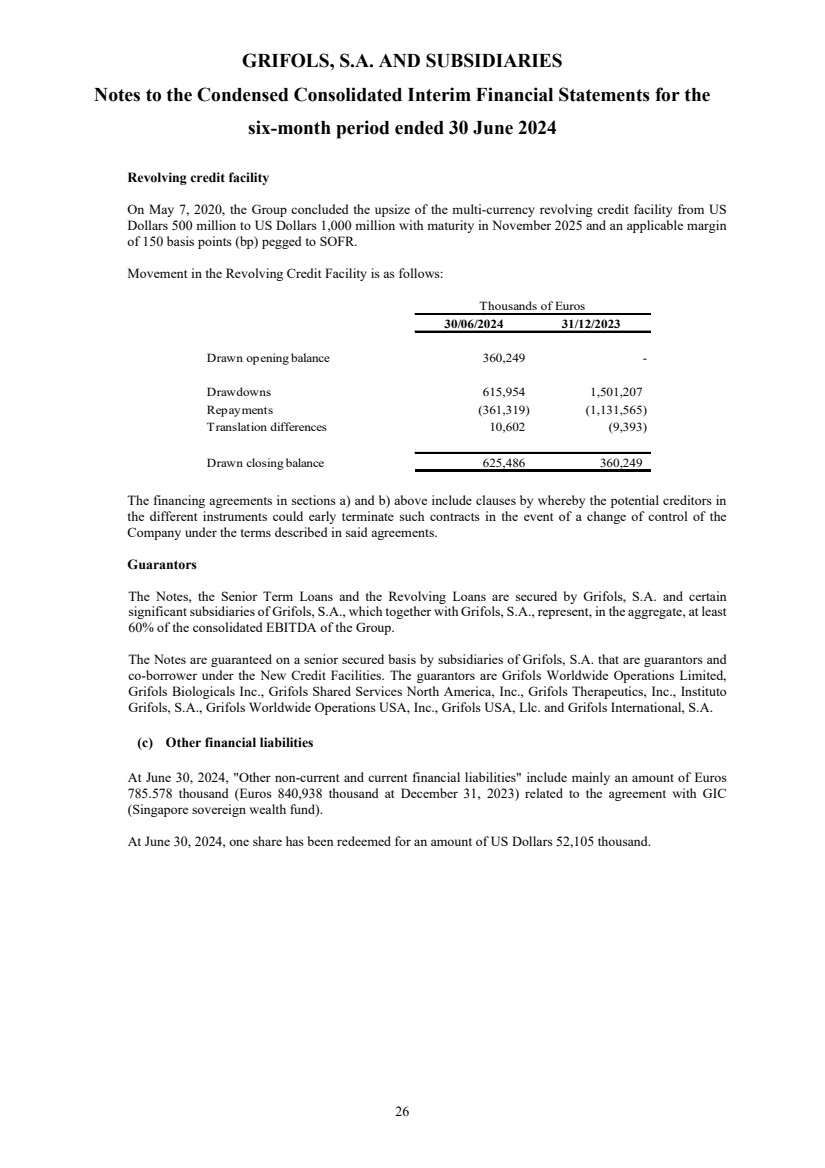
| GRIFOLS, S.A. AND SUBSIDIARIES
Notes to the Condensed Consolidated Interim Financial Statements for the
six-month period ended 30 June 2024
26
Revolving credit facility
On May 7, 2020, the Group concluded the upsize of the multi-currency revolving credit facility from US
Dollars 500 million to US Dollars 1,000 million with maturity in November 2025 and an applicable margin
of 150 basis points (bp) pegged to SOFR.
Movement in the Revolving Credit Facility is as follows:
30/06/2024 31/12/2023
Drawn opening balance 360,249 -
Drawdowns 615,954 1,501,207
Repayments (361,319) (1,131,565)
Translation differences 10,602 (9,393)
Drawn closing balance 625,486 360,249
Thousands of Euros
The financing agreements in sections a) and b) above include clauses by whereby the potential creditors in
the different instruments could early terminate such contracts in the event of a change of control of the
Company under the terms described in said agreements.
Guarantors
The Notes, the Senior Term Loans and the Revolving Loans are secured by Grifols, S.A. and certain
significant subsidiaries of Grifols, S.A., which together with Grifols, S.A., represent, in the aggregate, at least
60% of the consolidated EBITDA of the Group.
The Notes are guaranteed on a senior secured basis by subsidiaries of Grifols, S.A. that are guarantors and
co-borrower under the New Credit Facilities. The guarantors are Grifols Worldwide Operations Limited,
Grifols Biologicals Inc., Grifols Shared Services North America, Inc., Grifols Therapeutics, Inc., Instituto
Grifols, S.A., Grifols Worldwide Operations USA, Inc., Grifols USA, Llc. and Grifols International, S.A.
(c) Other financial liabilities
At June 30, 2024, "Other non-current and current financial liabilities" include mainly an amount of Euros
785.578 thousand (Euros 840,938 thousand at December 31, 2023) related to the agreement with GIC
(Singapore sovereign wealth fund).
At June 30, 2024, one share has been redeemed for an amount of US Dollars 52,105 thousand. |
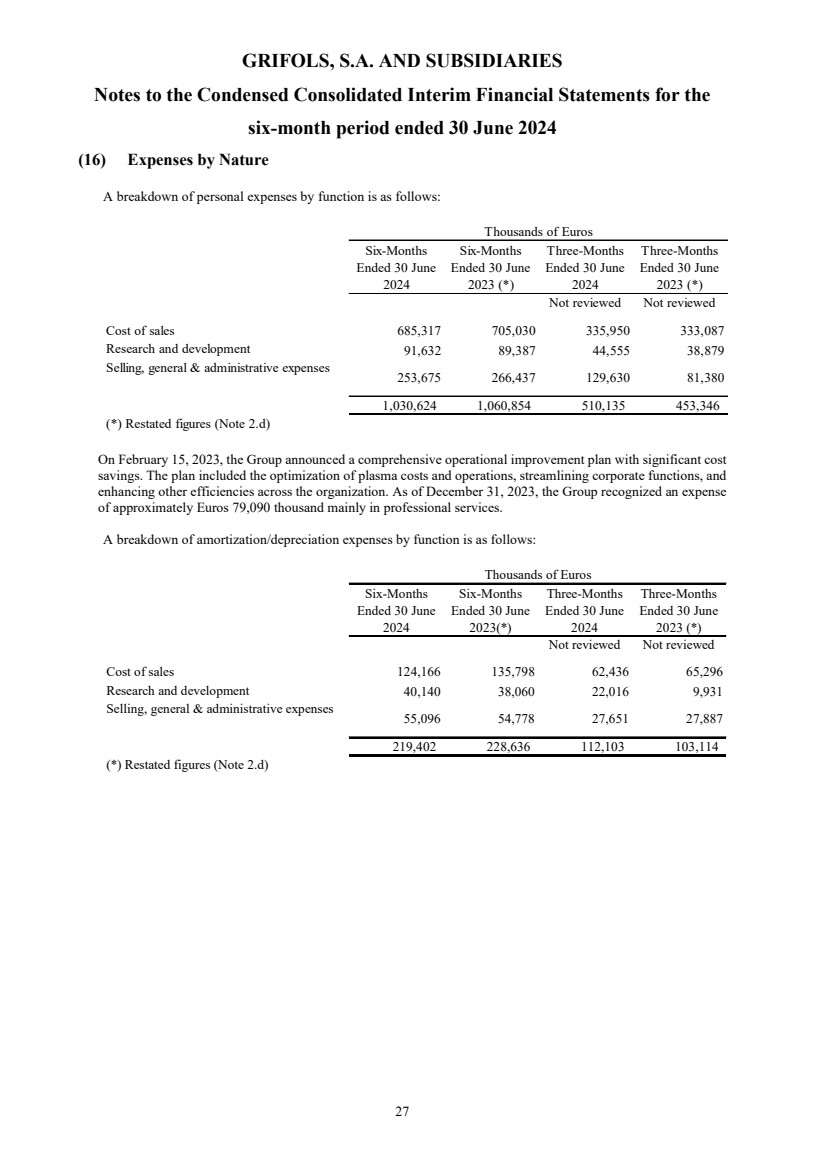
| GRIFOLS, S.A. AND SUBSIDIARIES
Notes to the Condensed Consolidated Interim Financial Statements for the
six-month period ended 30 June 2024
27
(16) Expenses by Nature
A breakdown of personal expenses by function is as follows:
Six-Months
Ended 30 June
2024
Six-Months
Ended 30 June
2023 (*)
Three-Months
Ended 30 June
2024
Three-Months
Ended 30 June
2023 (*)
Not reviewed Not reviewed
Cost of sales 685,317 705,030 335,950 333,087
Research and development 91,632 89,387 44,555 38,879
Selling, general & administrative expenses 253,675 266,437 129,630 81,380
1,030,624 1,060,854 510,135 453,346
(*) Restated figures (Note 2.d)
Thousands of Euros
On February 15, 2023, the Group announced a comprehensive operational improvement plan with significant cost
savings. The plan included the optimization of plasma costs and operations, streamlining corporate functions, and
enhancing other efficiencies across the organization. As of December 31, 2023, the Group recognized an expense
of approximately Euros 79,090 thousand mainly in professional services.
A breakdown of amortization/depreciation expenses by function is as follows:
Six-Months
Ended 30 June
2024
Six-Months
Ended 30 June
2023(*)
Three-Months
Ended 30 June
2024
Three-Months
Ended 30 June
2023 (*)
Not reviewed Not reviewed
Cost of sales 124,166 135,798 62,436 65,296
Research and development 40,140 38,060 22,016 9,931
Selling, general & administrative expenses 55,096 54,778 27,651 27,887
219,402 228,636 112,103 103,114
(*) Restated figures (Note 2.d)
Thousands of Euros |
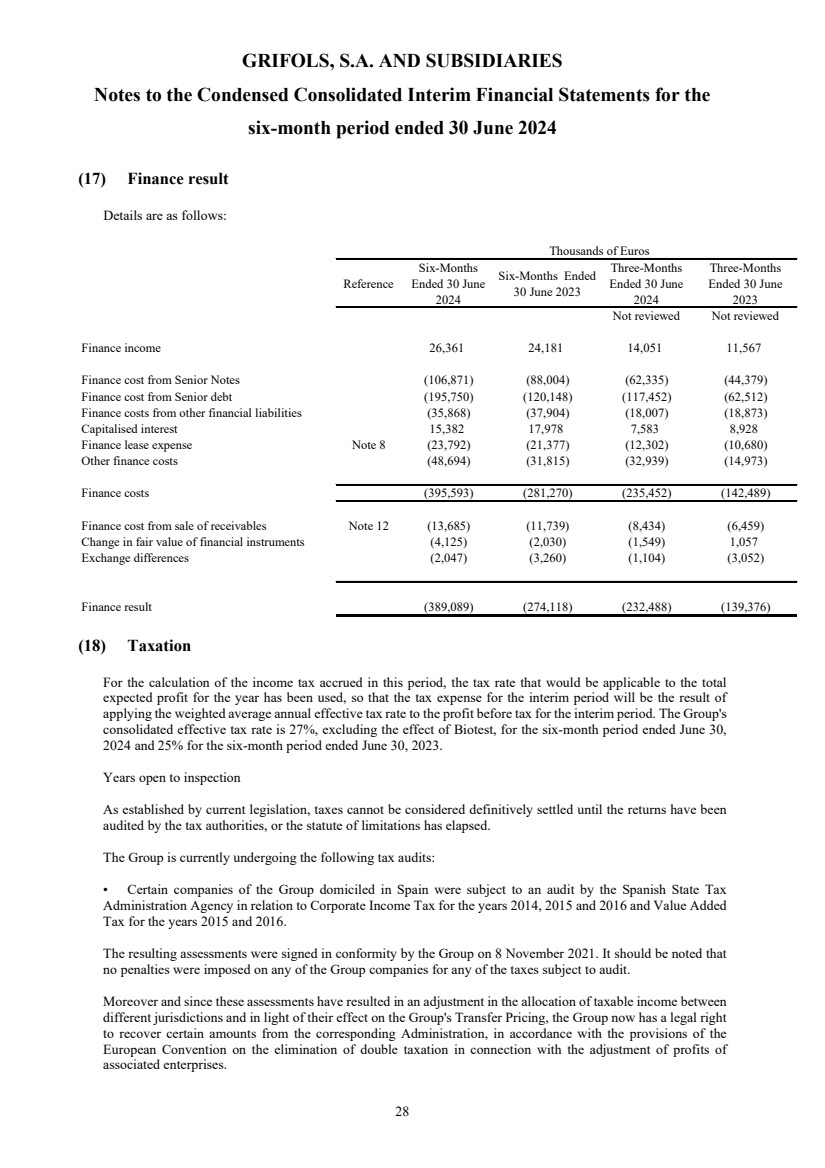
| GRIFOLS, S.A. AND SUBSIDIARIES
Notes to the Condensed Consolidated Interim Financial Statements for the
six-month period ended 30 June 2024
28
(17) Finance result
Details are as follows:
Reference
Six-Months
Ended 30 June
2024
Six-Months Ended
30 June 2023
Three-Months
Ended 30 June
2024
Three-Months
Ended 30 June
2023
Not reviewed Not reviewed
Finance income 26,361 24,181 14,051 11,567
Finance cost from Senior Notes (106,871) (88,004) (62,335) (44,379)
Finance cost from Senior debt (195,750) (120,148) (117,452) (62,512)
Finance costs from other financial liabilities (35,868) (37,904) (18,007) (18,873)
Capitalised interest 15,382 17,978 7,583 8,928
Finance lease expense Note 8 (23,792) (21,377) (12,302) (10,680)
Other finance costs (48,694) (31,815) (32,939) (14,973)
Finance costs (395,593) (281,270) (235,452) (142,489)
Finance cost from sale of receivables Note 12 (13,685) (11,739) (8,434) (6,459)
Change in fair value of financial instruments (4,125) (2,030) (1,549) 1,057
Exchange differences (2,047) (3,260) (1,104) (3,052)
Finance result (389,089) (274,118) (232,488) (139,376)
Thousands of Euros
(18) Taxation
For the calculation of the income tax accrued in this period, the tax rate that would be applicable to the total
expected profit for the year has been used, so that the tax expense for the interim period will be the result of
applying the weighted average annual effective tax rate to the profit before tax for the interim period. The Group's
consolidated effective tax rate is 27%, excluding the effect of Biotest, for the six-month period ended June 30,
2024 and 25% for the six-month period ended June 30, 2023.
Years open to inspection
As established by current legislation, taxes cannot be considered definitively settled until the returns have been
audited by the tax authorities, or the statute of limitations has elapsed.
The Group is currently undergoing the following tax audits:
• Certain companies of the Group domiciled in Spain were subject to an audit by the Spanish State Tax
Administration Agency in relation to Corporate Income Tax for the years 2014, 2015 and 2016 and Value Added
Tax for the years 2015 and 2016.
The resulting assessments were signed in conformity by the Group on 8 November 2021. It should be noted that
no penalties were imposed on any of the Group companies for any of the taxes subject to audit.
Moreover and since these assessments have resulted in an adjustment in the allocation of taxable income between
different jurisdictions and in light of their effect on the Group's Transfer Pricing, the Group now has a legal right
to recover certain amounts from the corresponding Administration, in accordance with the provisions of the
European Convention on the elimination of double taxation in connection with the adjustment of profits of
associated enterprises. |
| GRIFOLS, S.A. AND SUBSIDIARIES
Notes to the Condensed Consolidated Interim Financial Statements for the
six-month period ended 30 June 2024
29
• Grifols Shared Services North America, Inc. and subsidiaries received in 2020 notification of a tax audit
relating to the State Income Tax for the fiscal years 2017 and 2018. There have been no relevant developments
with respect to this audit during the six-month period ending June 30, 2024.
• Certain Group companies domiciled in Spain are currently under audit by the Spanish State Tax
Administration Agency in relation to Corporate Income Tax for the years 2017 to 2019 and Value Added Tax,
personal income tax, non-resident income and capital income tax for June 2018 to December 2019. The audit
procedure is not over, although the group has signed in disagreement the corresponding provisional assessment
proposals.
As regards to Corporate Tax, the proposal is based on a difference in criteria in the valuation of certain transaction
between Group companies. In relation to VAT, the proposal relies on a different interpretation of the financial
activity carried out by the parent company of the Spanish tax Group and how such difference affects the
deductibility of certain concepts. It should be noted that the Inspection has stated that it considers there have been
no infringements in any of the taxes subject to verification.
The Group acts with the tax authorities in a cooperative and transparent manner to resolve disputes and considers
that its position in the years and matters described above have been in accordance with the law and are based on
a reasonable interpretation of the applicable regulations. Therefore, the Group intends to submit pleadings to the
Tax Authorities in this regard. Should the Tax Authorities not reconsider the position, the Group also intends to
file the appropriate appeals and petitions to best defend its interests against the settlements finally issued.
As of June 30, 2024, the Group has recorded an amount of Euros 92,517 thousand as a provision for previous
disputes and pending tax litigation (such provision amounted to Euros 76,604 thousand as of December 31, 2023).
According to the information currently available, the Group and the tax advisors consider that the provisions that
have been recorded are adequate based on the existing risk best estimate and reasonably cover the possible
obligations derived from current audits and litigations with regard to taxes.
Minimum taxation (Pillar2 OECD)
As at June 30, 2024, the Group continues to assess the implications of the OECD Pillar 2 reforms, which provide
for the establishment of global minimum taxation rules; rules adopted in the EU through the relevant Directive to
be transposed by Member States for application for financial years beginning on or after January 1, 2024.
Beyond a significant increase in formal compliance burdens, the Group does not expect significant economic
impacts from the application of this new regulation, as it is already subject to effective tax rates above 15% in
most of the territories in which it operates and expects to benefit from the "transitional safe harbour" which allows
avoiding the additional tax and alleviating formal compliance burdens.
An exception to the above is Ireland, which has a nominal corporate income tax rate of 12.5% and has already
passed its own Pillar 2 legislation which will allow it to levy corporate income tax directly. However, the Group
does not expect a significant impact from Pillar 2 legislation arising from its operations in Ireland or in any of the
other jurisdictions, although the complexity of the legislation could, in specific cases, give rise to additional
taxation, which is not expected to be material.
(19) Discontinued Operations
During the six-month period ended June 30, 2024, and June 30, 2023, the Group has not discontinued any
operations.
(20) Commitments and Contingencies
(a) Guarantees
The Group has no significant guarantees extended to third parties. |
| GRIFOLS, S.A. AND SUBSIDIARIES
Notes to the Condensed Consolidated Interim Financial Statements for the
six-month period ended 30 June 2024
30
(b) Guarantees committed with third parties
Since June 30, 2023, Grifols, through Grifols Shared Services North America, Inc, acts as a guarantor for
five lease contracts for certain ImmunoTek plasma centers not affected by the collaboration under Biotek
America LLC. In addition, Grifols, S.A. acts as guarantor of the commitments made for the purchase of the
plasma centers (note 3 and 9).
Additionally, the Group has significant guarantees committed to third parties as described in note 15.
(c) Obligations with personnel
The Group’s annual contribution to defined contribution pension plans of Spanish Group companies for the
six-month ended in June 30, 2024 has amounted to Euros 564 thousand (Euros 534 thousand for 2023).
In the event that control is taken of the Company, the Group has agreements with 34 employees/directors
whereby they can unilaterally rescind their employment contracts with the Company and are entitled to
termination benefits ranging from two to five years’ salary.
In addition, the share-based remuneration plans maintained by the Company for certain employees include
clauses according to which, in the event of a change of control, the amounts pending exchange would be
early settled under the terms described in said agreements.
The Group has contracts with 22 executives entitling them to termination benefits ranging from eleven
months to four years of their salary in different circumstances.
Restricted Share Unit Retention Plan
In March 2022, the Group established a Restricted Stock Share Plan (hereinafter RSU) for certain employees.
Under this plan, an employee may elect to receive up to 50% of his or her annual bonus in Class B non-voting ordinary shares (Grifols Class B Shares) or Grifols American Depositary Shares (Grifols ADSs), and
the Group will match this with an additional 50% contribution in RSUs.
Class B Grifols shares and Grifols ADSs are valued at the date of grant of the bonus.
These RSUs will have a vesting period of 2 years and 1 day and will subsequently be exchanged for Grifols
Class B Shares or Grifols ADSs (American Depositary Shares representing 1 Class B Share).
If an eligible employee leaves the company or is terminated prior to the vesting period, he/she will not be
entitled to the additional RSUs.
At June 30, 2024 the Group has settled the 2022 RSU plan for an amount of Euros 5,900 thousand (Euros
3,296 thousand at December 31, 2023 corresponding to the 2020 RSU plan).
This commitment is treated as equity-settled and the accumulated amount recognized at June 30, 2024 as
share-based payments cost of employees is Euros 4,155 thousand (Euros 8,282 thousand at December 31,
2023).
Equity-settled share-based payment plan
In May 2023, the Board of Directors approved a proposal to the Ordinary General Meeting on June 16, 2023,
which approved it, a long term incentive plan based on the granting of stock options for certain executive
directors, members of the senior management of Grifols and its subsidiaries. The plan has a term of four
years for each beneficiary, from the effective date where 40% of the options granted will vest (provided that
the conditions for their vesting are met) at the end of the second year of the plan and the remaining 60% will
vest (provided that the conditions for their vesting are met) at the end of the fourth year of the plan. A
maximum of 4,000,000 stock options will be granted, representing the right to acquire 4,000,000 Class A
shares of the Company with an exercise price of Euros 8.96 per Class A share. As a condition for the vesting
of the options granted, each beneficiary must have remained continuously employed by Grifols on each |
| GRIFOLS, S.A. AND SUBSIDIARIES
Notes to the Condensed Consolidated Interim Financial Statements for the
six-month period ended 30 June 2024
31
vesting date, must pass an individual performance evaluation and, in addition, settlement is subject to the
achievement of specific, predetermined and quantifiable objectives, related to financial and non-financial
metrics, in order to reward value creation through the achievement of the objectives set in the plan. The
Company will allocate the shares it currently holds in treasury or may come to hold to cover the needs of the
plan.
Settlement date Number of RSUs assigned Unit fair value (Euros)
2025 1,072,000 3.05
2027 1,608,000 2.85
Additionally, there is a special remuneration plan referenced to the value of the share settled in equity
instruments for certain executives with an exercise price of Euros 8.964 and Euros 12.84 per Class A share
and maturity 2025, 2026.
Settlement date Number of RSUs assigned Unit fair value (Euros)
22/02/2025 700,000 1.08
28/02/2025 270,000 2.19
31/12/2026 180,000 2.39
The recognized amount in Equity as of 30 June 2024 amounts to Euros 4,176 thousand.
Cash-settled share-based payment plan
In May 2023, the Board of Directors of Grifols, S.A. approved a new long-term incentive plan based on
restricted stock units (RSUs) aimed at certain members of the management team of the Company and its
subsidiaries. The plan has a total duration of four years, where 50% of the RSUs granted will be settled at
the end of the second year of the plan and the remainder at the end of the fourth year of the plan. As a
condition for the vesting of the RSUs granted, each beneficiary must have remained continuously employed
by Grifols on the settlement date of the plan and, in addition, such settlement is subject to the achievement
of performance objectives. The RSUs will be settled in cash for an amount equivalent to the average price of
the Class A shares during the five (5) business days prior to the settlement. At 30 June 2024, the total
accumulated amount is Euros 1,906 thousand and is included in the heading "Trade and other payable". The
amount recognized in the Consolidated Statement of Profit and Loss as of 30 June 2024 amounts to Euros
182 thousand.
Settlement date Number of RSUs assigned Unit fair value (Euros)
2025 274,500 8.52
2027 274,500 6.92
Savings plan and profit-sharing plan
The Group has a defined contribution plan (savings plan), which qualifies as a deferred salary arrangement
under Section 401 (k) of the Internal Revenue Code (IRC). Once eligible, employees may elect to contribute
a portion of their salaries to the savings plan, subject to certain limitations. The Group matches 100% of the
first 4% of employee contributions and 50% of the next 2%. Group and employee contributions are fully
vested when contributed. The total cost of matching contributions to the savings plan was US Dollars 18,6
million in the six-months period ended 30 June 2024 (US Dollars 18,3 million in the six-months ended 30
June 2023).
Other plans
The Group has a defined benefit pension plan for certain former Talecris Biotherapeutics, GmbH employees
in Germany as required by statutory law. The pension cost relating to this plan is not material for the periods
presented. |
| GRIFOLS, S.A. AND SUBSIDIARIES
Notes to the Condensed Consolidated Interim Financial Statements for the
six-month period ended 30 June 2024
32
The Biotest Group has established retirement benefits and employment commitments for certain employees,
primarily from its German companies. These benefits are based on employees' length of service and salary.
The pension plans are voluntary and are not subject to statutory or legal obligations. The amount of pension
liabilities largely depends on fluctuations in interest rates and the life expectancy of the beneficiaries.
(d) Purchase commitments
Purchase option on BPC Plasma Inc. and Haema AG
On December 28, 2018, the Group sold BPC Plasma Inc. and Haema AG to Scranton Enterprises B.V. The
sales contract included a purchase option for Grifols that grants it the irrevocable and exclusive right (not an
obligation) to acquire the shares sold to Scranton Enterprises B.V. (both at the same time) at any time from
the effective date of sale.
In relation to the purchase option and given that it is based on a variable number of shares and a variable
acquisition price, said instrument is a derivative financial instrument that must be valued at fair value with
changes in the profit and loss account.
The exercise price of the option will be equal to the greater of: (i) the same price at which the shares were
sold to Scranton, adding the expenses related to the transaction and the increase in net working capital from
the time of exercise of the option and the time at which the sale occurred, and (ii) the amount necessary to
cancel the debt contracted by Scranton with the financing entity of the transaction for an amount of US
Dollars 360 million, plus accrued interest, as well as any other amount necessary to cancel said debt.
Based on the contractual conditions, Grifols has estimated the price of the option as (i) the price for which
the shares have been sold to Scranton (US Dollars 538,000,000) plus (ii) the variation in working capital,
which, given the business model of both companies, will be mainly represented by undistributed profits.
Insofar as the exercise price has been established for a value similar to the fair value of BPC and Haema, the
option does not have a significant value. On the other hand, since the valuation of the option is based on non-observable market variables, it corresponds to Level 3 of the fair value hierarchy. Considering the
uncertainties underlying the valuation of the option as it deals with non-observable variables, and the value
of the same not being significant, said value has not been recognized as of 30 June 2024 and 31 December
2023.
Likewise, both the shares of Haema AG and the shares of BPC Plasma Inc. are currently pledged as collateral
for the loan from Scranton Plasma BV with Bank of America. If a default occurs under the loan agreement,
as long as the financing banks have not executed the corresponding pledge, Grifols may exercise the purchase
option. Grifols will pay the bank in preference to Scranton Plasma BV until the amount of the debt at the
time of acquisition is settled. There is no time limitation in the loan agreement for Grifols to exercise the
repurchase option. As of June 30, 2024, there have been no default events.
Purchase option on Haema PlasmaKft.
On 1 February 2021 the Group signed a call option on the shares of Haema Plasma kft, exercisable by the
Group only 12 months after signing and with an expiry of 48 months from the date on which the option
becomes exercisable. The option price was set at thirteen times EBITDA minus net debt. Grifols did not
make any monetary consideration for the purchase option agreement when signing the agreement.
Purchase option from Plasmavita Healthcare GmbH
On November 22, 2017, the company Plasmavita Healthcare GmbH was incorporated in Germany. Currently,
the Group is a shareholder of 50% of the shares and two individual partners, shareholders of the remaining
50% of the Company's shares. Through a management services agreement, one of them (the "Managing
Partner") provides certain management services to the Company. The Company's incorporation agreement
establishes a purchase option in favor of the Group that grants the irrevocable right (not the obligation) to the
Group to acquire the remaining 50% stake in the Company from the two individual partners within a period |
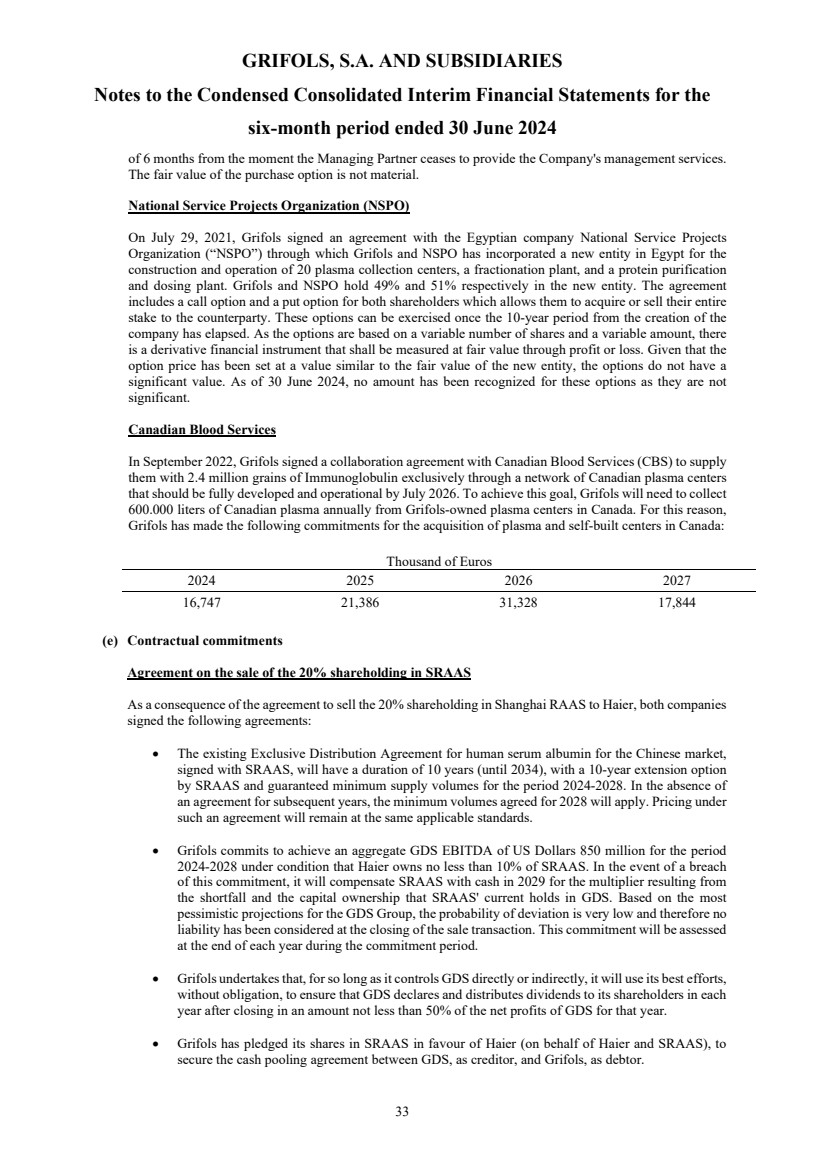
| GRIFOLS, S.A. AND SUBSIDIARIES
Notes to the Condensed Consolidated Interim Financial Statements for the
six-month period ended 30 June 2024
33
of 6 months from the moment the Managing Partner ceases to provide the Company's management services.
The fair value of the purchase option is not material.
National Service Projects Organization (NSPO)
On July 29, 2021, Grifols signed an agreement with the Egyptian company National Service Projects
Organization (“NSPO”) through which Grifols and NSPO has incorporated a new entity in Egypt for the
construction and operation of 20 plasma collection centers, a fractionation plant, and a protein purification
and dosing plant. Grifols and NSPO hold 49% and 51% respectively in the new entity. The agreement
includes a call option and a put option for both shareholders which allows them to acquire or sell their entire
stake to the counterparty. These options can be exercised once the 10-year period from the creation of the
company has elapsed. As the options are based on a variable number of shares and a variable amount, there
is a derivative financial instrument that shall be measured at fair value through profit or loss. Given that the
option price has been set at a value similar to the fair value of the new entity, the options do not have a
significant value. As of 30 June 2024, no amount has been recognized for these options as they are not
significant.
Canadian Blood Services
In September 2022, Grifols signed a collaboration agreement with Canadian Blood Services (CBS) to supply
them with 2.4 million grains of Immunoglobulin exclusively through a network of Canadian plasma centers
that should be fully developed and operational by July 2026. To achieve this goal, Grifols will need to collect
600.000 liters of Canadian plasma annually from Grifols-owned plasma centers in Canada. For this reason,
Grifols has made the following commitments for the acquisition of plasma and self-built centers in Canada:
Thousand of Euros
2024 2025 2026 2027
16,747 21,386 31,328 17,844
(e) Contractual commitments
Agreement on the sale of the 20% shareholding in SRAAS
As a consequence of the agreement to sell the 20% shareholding in Shanghai RAAS to Haier, both companies
signed the following agreements:
• The existing Exclusive Distribution Agreement for human serum albumin for the Chinese market,
signed with SRAAS, will have a duration of 10 years (until 2034), with a 10-year extension option
by SRAAS and guaranteed minimum supply volumes for the period 2024-2028. In the absence of
an agreement for subsequent years, the minimum volumes agreed for 2028 will apply. Pricing under
such an agreement will remain at the same applicable standards.
• Grifols commits to achieve an aggregate GDS EBITDA of US Dollars 850 million for the period
2024-2028 under condition that Haier owns no less than 10% of SRAAS. In the event of a breach
of this commitment, it will compensate SRAAS with cash in 2029 for the multiplier resulting from
the shortfall and the capital ownership that SRAAS' current holds in GDS. Based on the most
pessimistic projections for the GDS Group, the probability of deviation is very low and therefore no
liability has been considered at the closing of the sale transaction. This commitment will be assessed
at the end of each year during the commitment period.
• Grifols undertakes that, for so long as it controls GDS directly or indirectly, it will use its best efforts,
without obligation, to ensure that GDS declares and distributes dividends to its shareholders in each
year after closing in an amount not less than 50% of the net profits of GDS for that year.
• Grifols has pledged its shares in SRAAS in favour of Haier (on behalf of Haier and SRAAS), to
secure the cash pooling agreement between GDS, as creditor, and Grifols, as debtor. |
| GRIFOLS, S.A. AND SUBSIDIARIES
Notes to the Condensed Consolidated Interim Financial Statements for the
six-month period ended 30 June 2024
34
• Grifols retains the right to appoint one director to the board of directors of SRAAS. However, Grifols
has granted Haier (a) a voting proxy for 10 years and (b) a right of first refusal in the event that
Grifols wishes to sell these shares. The voting proxy agreement has been valued at Euros 10 million.
(f) Judicial procedures and arbitration
• ABBOTT LABORATORIES v. GRIFOLS DIAGNOSTIC SOLUTIONS INC., GRIFOLS
WORLDWIDE OPERATIONS LIMITED AND NOVARTIS VACCINES AND DIAGNOSTICS, INC.
Served: October 8, 2019
US District Court, Northern District of Illinois
Patent Infringement, Civil Action No. 1:19-cv-6587
Abbott Laboratories (“Abbott”), GDS, GWWO and Novartis Vaccines and Diagnostics, Inc. are in dispute
over unpaid royalties payable by Abbott to GDS and Ortho-Clinical Diagnostics (“Ortho”) under an HIV
License and Option agreement dated August 16, 2019 (the “HIV License”).
On September 12, 2019, GDS and Ortho filed Notice of Arbitration. On October 3, 2019, Abbott terminated
the HIV License and filed for Declaratory Relief seeking to invalidate the licensed patent. On March 16, 2020,
Grifols and Ortho filed an answer and counterclaim to the litigation, while simultaneously pursuing arbitration
for the pre-termination amount owed by Abbott. The arbitration hearing was June 15-16 , 2020. Grifols/Ortho
were awarded $4 Million.
NEXT ACTION: Expert Discovery was concluded on October 14th 2022 and the parties filed dispositive
motions, including a motion for summary judgement by Abbott, which was unsuccessful to dispose of the
litigation. GDS and Ortho contend that the patent is valid and they believe that Abbott will be unsuccessful in
its Declaratory Relief action. A mediation took place on 31 January 2024 without success. Further pre-trial
hearings will be held between now and trial setting. Trial is expected to be in late 2024 or early 2025.
• RAMIREZ-VIVAR, ALFONSO v. GRIFOLS DIAGNOSTIC SOLUTIONS, INC.
Served: March 11, 2021
Superior Court, CA County of Alameda
Case No.: RG21089519
Wage & Hour Class Action
Plaintiff claiming violation of CA wage & hour statutes, including a claim under the Private Attorney's General
Act.
NEXT STEP: The Hearing on the class certification motion was heard on October 28, 2022. Court granted
class certification encompassing all persons employed in California by GDS as hourly non-exempt employees
during period of February 22, 2017 through November 4, 2022, relating to only two of the ten claims alleged
in the class action lawsuit. After exchanging preliminary discovery, this matter settled at mediation for
$400,000 in exchange for a full release of all claims. The settlement amount includes a release for any wage
and hour claims, claims under the Private Attorneys' General Act, and attorneys' fees. The Court approved the
settlement in a hearing that occurred on July 18, 2024. The settlement proceeds will be due sometime in the
next sixty (60) days, and the checks would be distributed to class members within month thereafter. The Court
scheduled a final compliance hearing for March 27, 2025, to ensure that all class requirements have been met.
Plaintiff’s counsel will file a final report and declaration prior to the hearing, in which case no appearance will
be necessary.
CLASS POTENTIAL: Approx. 300 CA GDS employees for payroll/wage & hour violations per pay period
for 5 years. |
| GRIFOLS, S.A. AND SUBSIDIARIES
Notes to the Condensed Consolidated Interim Financial Statements for the
six-month period ended 30 June 2024
35
• CERUS CORPORATION v. LABORATORIOS GRIFOLS, S.A.
Cerus Corporation ("Cerus") and Laboratorios Grifols, S.A. ("Grifols") entered into a Manufacturing and
Supply Agreement executed in 2016, pursuant to which Grifols was to manufacture and supply to Cerus
processing and filters sets to be used by Cerus in its own product (the "Agreement"). As a result of Grifols'
decision to discontinue the manufacturing, sale and support of its blood bag product business worldwide,
Grifols was unable to comply with the Agreement.
In December 2021, Cerus filed a notice of arbitration in the UK pursuant to the terms of the Agreement alleging
wrongful termination of the Agreement by Grifols. Furthermore, in January 2022, Cerus filed injunctive
measures with the Courts of Rubí (Barcelona) requiring the suspension of the closure of Grifols' blood bags
production facility until the arbitration proceedings is finalized.
NEXT ACTION: In March 2024, the Parties agreed to further suspend the proceedings, which was granted by
the Tribunal until June 7, 2024. However, the Tribunal had called the parties to a short remote hearing on May
30, 2024 in order to avoid that this matter drifted indefinitely. Further, at the end of March, 2024, the Spanish
court made an order withdrawing the claim, and thereby discontinuing the Spanish proceedings, which is now
closed and each party is to cover its own costs. In respect of the arbitration and before May 30, 2024, the parties
engaged in negotiations to find an agreement on, either settling the claim pending in arbitration or defining the
terms on how the arbitration should proceed forward. To this extent, the parties requested to the Tribunal to
suspend the May hearing, which the Tribunal agreed to do until the next available date as of July 2024. In the
meantime, while the companies' respective counsels are negotiating a settlement of the arbitration, the
commercial and technical teams are working on the manufacturing and supply activities within the terms of
the Agreement.
(21) Financial Instruments
Classification
A breakdown of financial instruments by nature, category and fair value is as follows: |
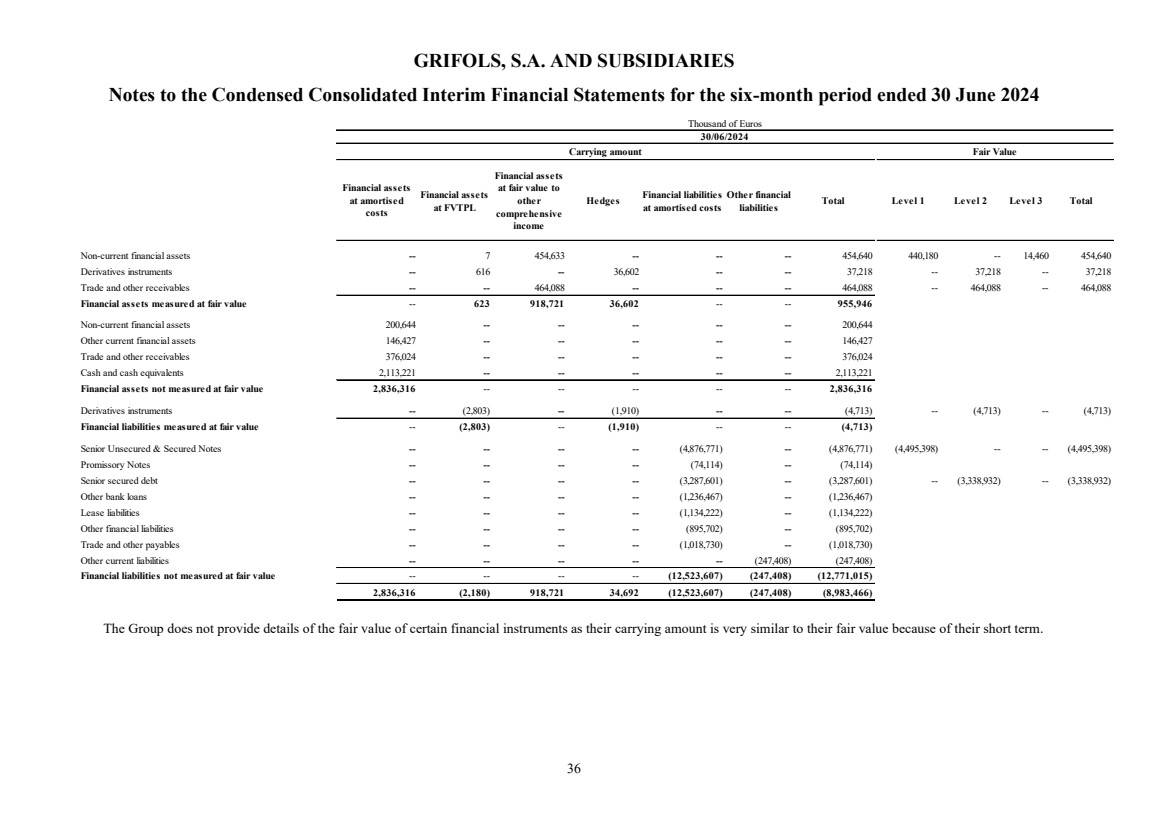
| GRIFOLS, S.A. AND SUBSIDIARIES
Notes to the Condensed Consolidated Interim Financial Statements for the six-month period ended 30 June 2024
36
Financial assets
at amortised
costs
Financial assets
at FVTPL
Financial assets
at fair value to
other
comprehensive
income
Hedges Financial liabilities
at amortised costs
Other financial
liabilities Total Level 1 Level 2 Level 3 Total
Non-current financial assets -- 7 454,633 -- -- -- 454,640 440,180 -- 14,460 454,640
Derivatives instruments -- 616 -- 36,602 -- -- 37,218 -- 37,218 -- 37,218
Trade and other receivables -- -- 464,088 -- -- -- 464,088 -- 464,088 -- 464,088
Financial assets measured at fair value -- 623 918,721 36,602 -- -- 955,946
Non-current financial assets 200,644 -- -- -- -- -- 200,644
Other current financial assets 146,427 -- -- -- -- -- 146,427
Trade and other receivables 376,024 -- -- -- -- -- 376,024
Cash and cash equivalents 2,113,221 -- -- -- -- -- 2,113,221
Financial assets not measured at fair value 2,836,316 -- -- -- -- -- 2,836,316
Derivatives instruments -- (2,803) -- (1,910) -- -- (4,713) -- (4,713) -- (4,713)
Financial liabilities measured at fair value -- (2,803) -- (1,910) -- -- (4,713)
Senior Unsecured & Secured Notes -- -- -- -- (4,876,771) -- (4,876,771) (4,495,398) -- -- (4,495,398)
Promissory Notes -- -- -- -- (74,114) -- (74,114)
Senior secured debt -- -- -- -- (3,287,601) -- (3,287,601) -- (3,338,932) -- (3,338,932)
Other bank loans -- -- -- -- (1,236,467) -- (1,236,467)
Lease liabilities -- -- -- -- (1,134,222) -- (1,134,222)
Other financial liabilities -- -- -- -- (895,702) -- (895,702)
Trade and other payables -- -- -- -- (1,018,730) -- (1,018,730)
Other current liabilities -- -- -- -- -- (247,408) (247,408)
Financial liabilities not measured at fair value -- -- -- -- (12,523,607) (247,408) (12,771,015)
2,836,316 (2,180) 918,721 34,692 (12,523,607) (247,408) (8,983,466)
Thousand of Euros
30/06/2024
Carrying amount Fair Value
The Group does not provide details of the fair value of certain financial instruments as their carrying amount is very similar to their fair value because of their short term. |
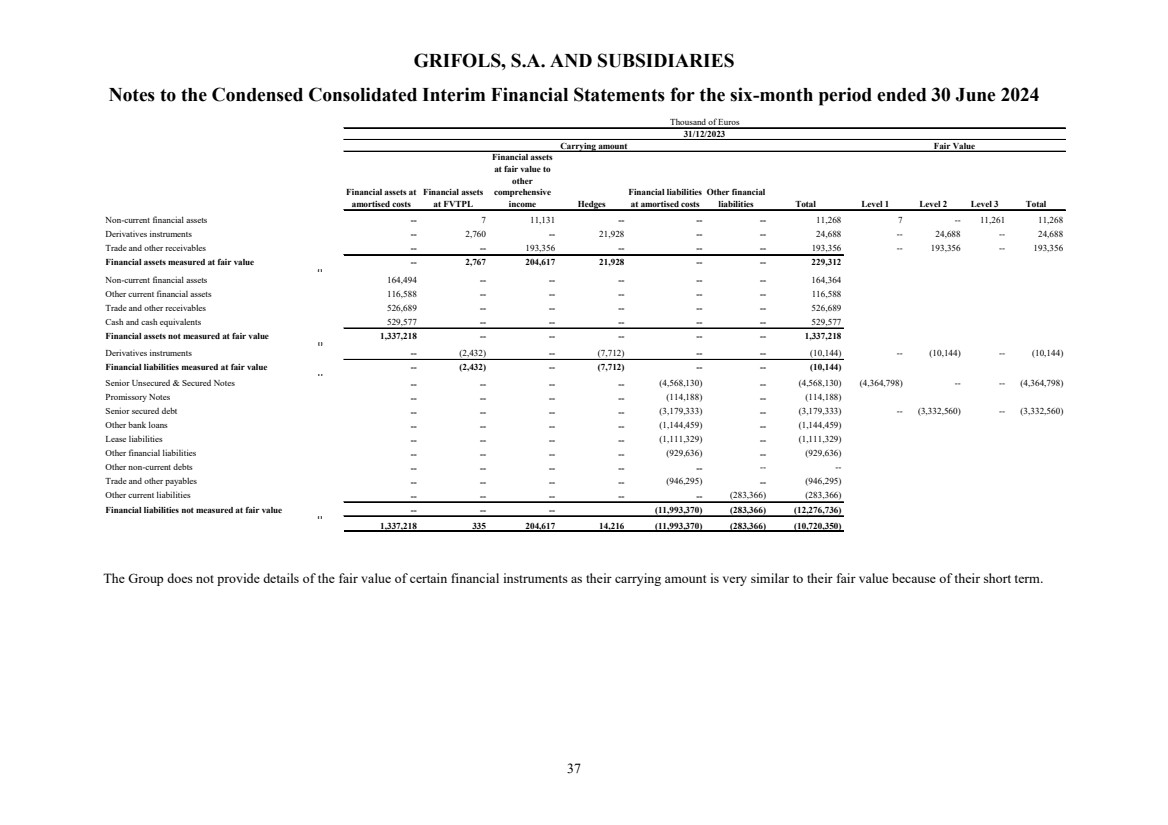
| GRIFOLS, S.A. AND SUBSIDIARIES
Notes to the Condensed Consolidated Interim Financial Statements for the six-month period ended 30 June 2024
37
Financial assets at
amortised costs
Financial assets
at FVTPL
Financial assets
at fair value to
other
comprehensive
income Hedges
Financial liabilities
at amortised costs
Other financial
liabilities Total Level 1 Level 2 Level 3 Total
Non-current financial assets -- 7 11,131 -- -- -- 11,268 7 -- 11,261 11,268
Derivatives instruments -- 2,760 -- 21,928 -- -- 24,688 -- 24,688 -- 24,688
Trade and other receivables -- -- 193,356 -- -- -- 193,356 -- 193,356 -- 193,356
Financial assets measured at fair value -- 2,767 204,617 21,928 -- -- 229,312 0 Non-current financial assets 164,494 -- -- -- -- -- 164,364
Other current financial assets 116,588 -- -- -- -- -- 116,588
Trade and other receivables 526,689 -- -- -- -- -- 526,689
Cash and cash equivalents 529,577 -- -- -- -- -- 529,577
Financial assets not measured at fair value 1,337,218 -- -- -- -- -- 1,337,218 0 Derivatives instruments -- (2,432) -- (7,712) -- -- (10,144) -- (10,144) -- (10,144)
Financial liabilities measured at fair value -- (2,432) -- (7,712) -- -- (10,144) 0 Senior Unsecured & Secured Notes -- -- -- -- (4,568,130) -- (4,568,130) (4,364,798) -- -- (4,364,798)
Promissory Notes -- -- -- -- (114,188) -- (114,188)
Senior secured debt -- -- -- -- (3,179,333) -- (3,179,333) -- (3,332,560) -- (3,332,560)
Other bank loans -- -- -- -- (1,144,459) -- (1,144,459)
Lease liabilities -- -- -- -- (1,111,329) -- (1,111,329)
Other financial liabilities -- -- -- -- (929,636) -- (929,636)
Other non-current debts -- -- -- -- -- -- --
Trade and other payables -- -- -- -- (946,295) -- (946,295)
Other current liabilities -- -- -- -- -- (283,366) (283,366)
Financial liabilities not measured at fair value -- -- -- (11,993,370) (283,366) (12,276,736) 0 1,337,218 335 204,617 14,216 (11,993,370) (283,366) (10,720,350)
Carrying amount Fair Value
Thousand of Euros
31/12/2023
The Group does not provide details of the fair value of certain financial instruments as their carrying amount is very similar to their fair value because of their short term. |
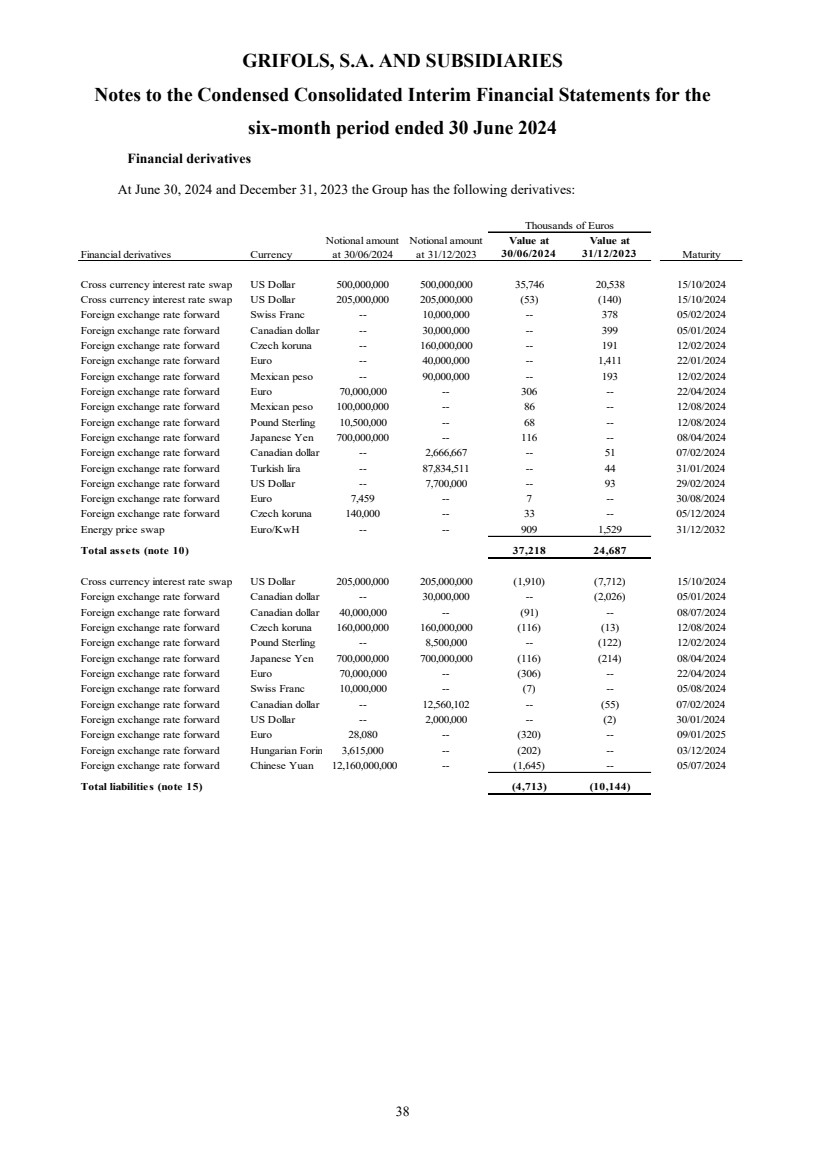
| GRIFOLS, S.A. AND SUBSIDIARIES
Notes to the Condensed Consolidated Interim Financial Statements for the
six-month period ended 30 June 2024
38
Financial derivatives
At June 30, 2024 and December 31, 2023 the Group has the following derivatives:
Financial derivatives Currency
Notional amount
at 30/06/2024
Notional amount
at 31/12/2023
Value at
30/06/2024
Value at
31/12/2023 Maturity
Cross currency interest rate swap US Dollar 500,000,000 500,000,000 35,746 20,538 15/10/2024
Cross currency interest rate swap US Dollar 205,000,000 205,000,000 (53) (140) 15/10/2024
Foreign exchange rate forward Swiss Franc -- 10,000,000 -- 378 05/02/2024
Foreign exchange rate forward Canadian dollar -- 30,000,000 -- 399 05/01/2024
Foreign exchange rate forward Czech koruna -- 160,000,000 -- 191 12/02/2024
Foreign exchange rate forward Euro -- 40,000,000 -- 1,411 22/01/2024
Foreign exchange rate forward Mexican peso -- 90,000,000 -- 193 12/02/2024
Foreign exchange rate forward Euro 70,000,000 -- 306 -- 22/04/2024
Foreign exchange rate forward Mexican peso 100,000,000 -- 86 -- 12/08/2024
Foreign exchange rate forward Pound Sterling 10,500,000 -- 68 -- 12/08/2024
Foreign exchange rate forward Japanese Yen 700,000,000 -- 116 -- 08/04/2024
Foreign exchange rate forward Canadian dollar -- 2,666,667 -- 51 07/02/2024
Foreign exchange rate forward Turkish lira -- 87,834,511 -- 44 31/01/2024
Foreign exchange rate forward US Dollar -- 7,700,000 -- 93 29/02/2024
Foreign exchange rate forward Euro 7,459 -- 7 -- 30/08/2024
Foreign exchange rate forward Czech koruna 140,000 -- 33 -- 05/12/2024
Energy price swap Euro/KwH -- -- 909 1,529 31/12/2032
Total assets (note 10) 37,218 24,687
Cross currency interest rate swap US Dollar 205,000,000 205,000,000 (1,910) (7,712) 15/10/2024
Foreign exchange rate forward Canadian dollar -- 30,000,000 -- (2,026) 05/01/2024
Foreign exchange rate forward Canadian dollar 40,000,000 -- (91) -- 08/07/2024
Foreign exchange rate forward Czech koruna 160,000,000 160,000,000 (116) (13) 12/08/2024
Foreign exchange rate forward Pound Sterling -- 8,500,000 -- (122) 12/02/2024
Foreign exchange rate forward Japanese Yen 700,000,000 700,000,000 (116) (214) 08/04/2024
Foreign exchange rate forward Euro 70,000,000 -- (306) -- 22/04/2024
Foreign exchange rate forward Swiss Franc 10,000,000 -- (7) -- 05/08/2024
Foreign exchange rate forward Canadian dollar -- 12,560,102 -- (55) 07/02/2024
Foreign exchange rate forward US Dollar -- 2,000,000 -- (2) 30/01/2024
Foreign exchange rate forward Euro 28,080 -- (320) -- 09/01/2025
Foreign exchange rate forward Hungarian Forin 3,615,000 -- (202) -- 03/12/2024
Foreign exchange rate forward Chinese Yuan 12,160,000,000 -- (1,645) -- 05/07/2024
Total liabilities (note 15) (4,713) (10,144)
Thousands of Euros |
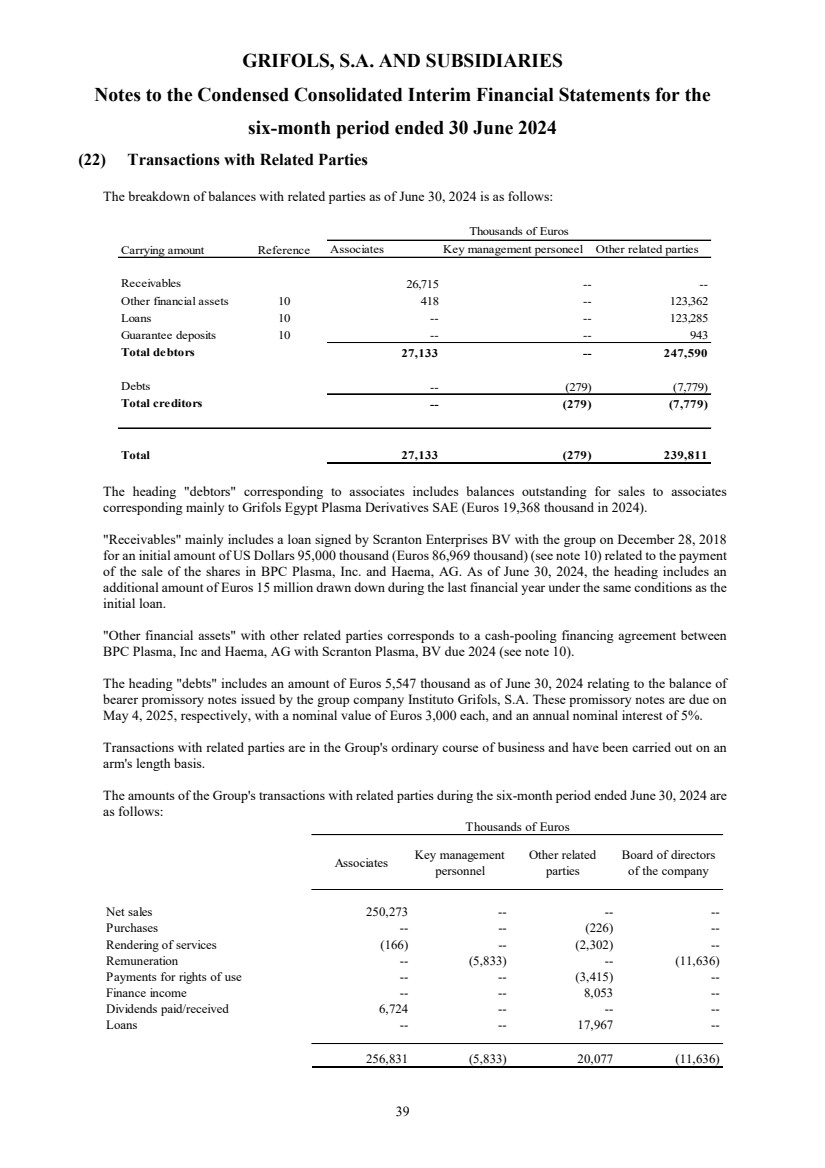
| GRIFOLS, S.A. AND SUBSIDIARIES
Notes to the Condensed Consolidated Interim Financial Statements for the
six-month period ended 30 June 2024
39
(22) Transactions with Related Parties
The breakdown of balances with related parties as of June 30, 2024 is as follows:
Carrying amount Reference Associates Key management personeel Other related parties
Receivables 26,715 -- --
Other financial assets 10 418 -- 123,362
Loans 10 -- -- 123,285
Guarantee deposits 10 -- -- 943
Total debtors 27,133 -- 247,590
Debts -- (279) (7,779)
Total creditors -- (279) (7,779)
Total 27,133 (279) 239,811
Thousands of Euros
The heading "debtors" corresponding to associates includes balances outstanding for sales to associates
corresponding mainly to Grifols Egypt Plasma Derivatives SAE (Euros 19,368 thousand in 2024).
"Receivables" mainly includes a loan signed by Scranton Enterprises BV with the group on December 28, 2018
for an initial amount of US Dollars 95,000 thousand (Euros 86,969 thousand) (see note 10) related to the payment
of the sale of the shares in BPC Plasma, Inc. and Haema, AG. As of June 30, 2024, the heading includes an
additional amount of Euros 15 million drawn down during the last financial year under the same conditions as the
initial loan.
"Other financial assets" with other related parties corresponds to a cash-pooling financing agreement between
BPC Plasma, Inc and Haema, AG with Scranton Plasma, BV due 2024 (see note 10).
The heading "debts" includes an amount of Euros 5,547 thousand as of June 30, 2024 relating to the balance of
bearer promissory notes issued by the group company Instituto Grifols, S.A. These promissory notes are due on
May 4, 2025, respectively, with a nominal value of Euros 3,000 each, and an annual nominal interest of 5%.
Transactions with related parties are in the Group's ordinary course of business and have been carried out on an
arm's length basis.
The amounts of the Group's transactions with related parties during the six-month period ended June 30, 2024 are
as follows:
Associates Key management
personnel
Other related
parties
Board of directors
of the company
Net sales 250,273 -- -- --
Purchases -- -- (226) --
Rendering of services (166) -- (2,302) --
Remuneration -- (5,833) -- (11,636)
Payments for rights of use -- -- (3,415) --
Finance income -- -- 8,053 --
Dividends paid/received 6,724 -- -- --
Loans -- -- 17,967 --
256,831 (5,833) 20,077 (11,636)
Thousands of Euros |
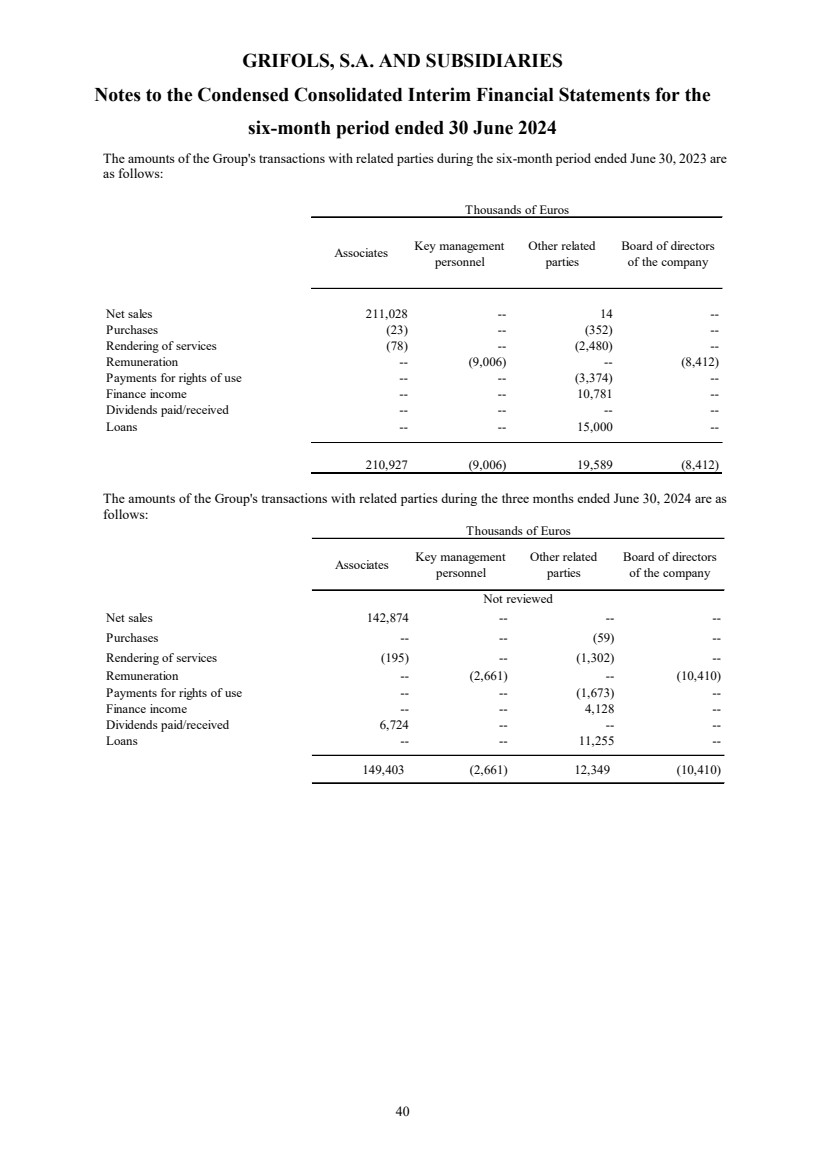
| GRIFOLS, S.A. AND SUBSIDIARIES
Notes to the Condensed Consolidated Interim Financial Statements for the
six-month period ended 30 June 2024
40
The amounts of the Group's transactions with related parties during the six-month period ended June 30, 2023 are
as follows:
Associates Key management
personnel
Other related
parties
Board of directors
of the company
Net sales 211,028 -- 14 --
Purchases (23) -- (352) --
Rendering of services (78) -- (2,480) --
Remuneration -- (9,006) -- (8,412)
Payments for rights of use -- -- (3,374) --
Finance income -- -- 10,781 --
Dividends paid/received -- -- -- --
Loans -- -- 15,000 --
210,927 (9,006) 19,589 (8,412)
Thousands of Euros
The amounts of the Group's transactions with related parties during the three months ended June 30, 2024 are as
follows:
Associates Key management
personnel
Other related
parties
Board of directors
of the company
Net sales 142,874 -- -- --
Purchases -- -- (59) --
Rendering of services (195) -- (1,302) --
Remuneration -- (2,661) -- (10,410)
Payments for rights of use -- -- (1,673) --
Finance income -- -- 4,128 --
Dividends paid/received 6,724 -- -- --
Loans -- -- 11,255 --
149,403 (2,661) 12,349 (10,410)
Thousands of Euros
Not reviewed |
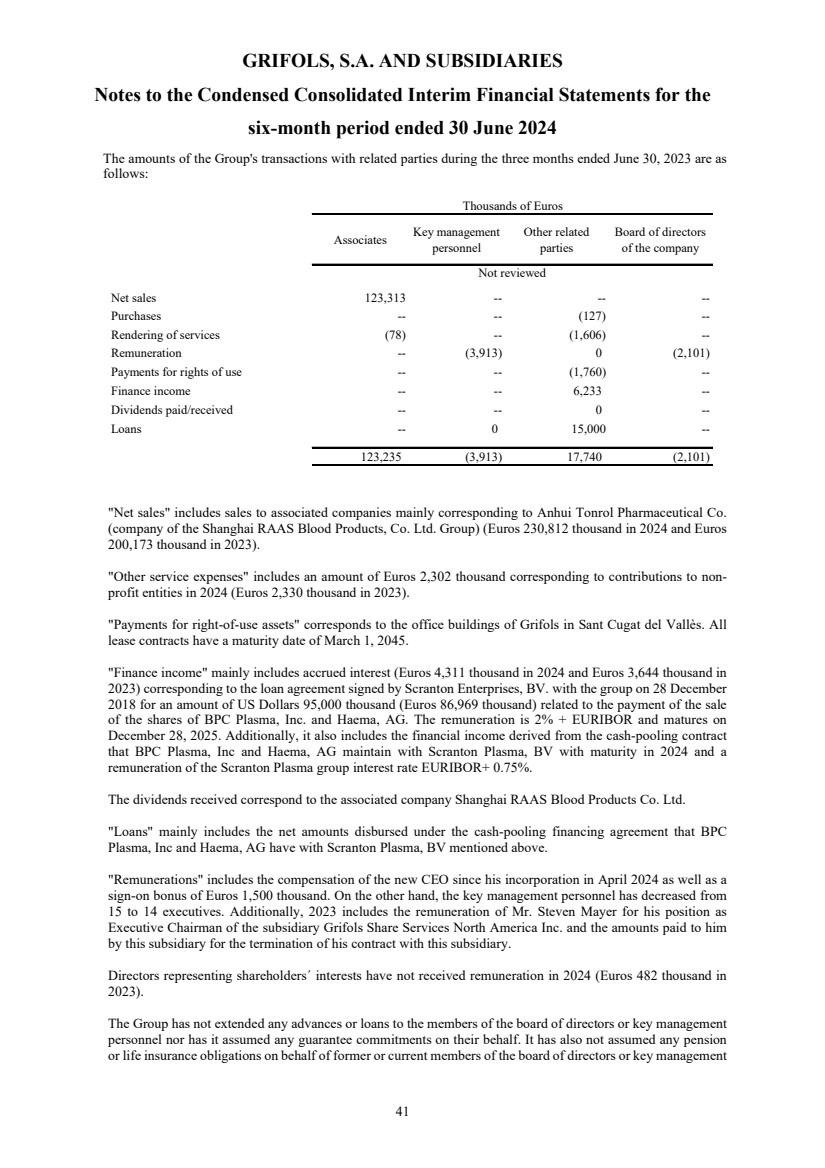
| GRIFOLS, S.A. AND SUBSIDIARIES
Notes to the Condensed Consolidated Interim Financial Statements for the
six-month period ended 30 June 2024
41
The amounts of the Group's transactions with related parties during the three months ended June 30, 2023 are as
follows:
Associates Key management
personnel
Other related
parties
Board of directors
of the company
Net sales 123,313 -- -- --
Purchases -- -- (127) --
Rendering of services (78) -- (1,606) --
Remuneration -- (3,913) 0 (2,101)
Payments for rights of use -- -- (1,760) --
Finance income -- -- 6,233 --
Dividends paid/received -- -- 0 --
Loans -- 0 15,000 --
123,235 (3,913) 17,740 (2,101)
Thousands of Euros
Not reviewed
"Net sales" includes sales to associated companies mainly corresponding to Anhui Tonrol Pharmaceutical Co.
(company of the Shanghai RAAS Blood Products, Co. Ltd. Group) (Euros 230,812 thousand in 2024 and Euros
200,173 thousand in 2023).
"Other service expenses" includes an amount of Euros 2,302 thousand corresponding to contributions to non-profit entities in 2024 (Euros 2,330 thousand in 2023).
"Payments for right-of-use assets" corresponds to the office buildings of Grifols in Sant Cugat del Vallès. All
lease contracts have a maturity date of March 1, 2045.
"Finance income" mainly includes accrued interest (Euros 4,311 thousand in 2024 and Euros 3,644 thousand in
2023) corresponding to the loan agreement signed by Scranton Enterprises, BV. with the group on 28 December
2018 for an amount of US Dollars 95,000 thousand (Euros 86,969 thousand) related to the payment of the sale
of the shares of BPC Plasma, Inc. and Haema, AG. The remuneration is 2% + EURIBOR and matures on
December 28, 2025. Additionally, it also includes the financial income derived from the cash-pooling contract
that BPC Plasma, Inc and Haema, AG maintain with Scranton Plasma, BV with maturity in 2024 and a
remuneration of the Scranton Plasma group interest rate EURIBOR+ 0.75%.
The dividends received correspond to the associated company Shanghai RAAS Blood Products Co. Ltd.
"Loans" mainly includes the net amounts disbursed under the cash-pooling financing agreement that BPC
Plasma, Inc and Haema, AG have with Scranton Plasma, BV mentioned above.
"Remunerations" includes the compensation of the new CEO since his incorporation in April 2024 as well as a
sign-on bonus of Euros 1,500 thousand. On the other hand, the key management personnel has decreased from
15 to 14 executives. Additionally, 2023 includes the remuneration of Mr. Steven Mayer for his position as
Executive Chairman of the subsidiary Grifols Share Services North America Inc. and the amounts paid to him
by this subsidiary for the termination of his contract with this subsidiary.
Directors representing shareholders´ interests have not received remuneration in 2024 (Euros 482 thousand in
2023).
The Group has not extended any advances or loans to the members of the board of directors or key management
personnel nor has it assumed any guarantee commitments on their behalf. It has also not assumed any pension
or life insurance obligations on behalf of former or current members of the board of directors or key management |
| GRIFOLS, S.A. AND SUBSIDIARIES
Notes to the Condensed Consolidated Interim Financial Statements for the
six-month period ended 30 June 2024
42
personnel. In addition, as detailed in note 29(c) to the consolidated annual accounts for the year ended December
31, 2023, certain Company directors and key management personnel have termination benefit commitments.
(23) Subsequent events
Description of Certain Inside Information: Potential Transaction
On 8 July 2024, the Parent Company (by means of a communication to the market of Inside Information)
informed that on 7 July 2024 an extraordinary meeting of the Board of Directors had been held to analyse the
request of certain family shareholders of Grifols and Brookfield Capital Partners (UK) Limited ("Brookfield")
for access to certain Group information, in order to carry out a due diligence process in relation to a possible
acquisition of shares of Grifols, S.A.. Specifically, in accordance with the Inside Information note communicated
by Brookfield to the market on 8 July 2024, various companies that hold the shares of the aforementioned family
shareholders (Deria S.A., Ponder Trade S.L. and Ralledor Holding Spain, S.L. together with Scranton Enterprises
BV) (the "Family Shareholders") and Brookfield entered into an exclusivity arrangement to evaluate the potential
joint tender offer transaction for the entire share capital of Grifols (class A shares and class B shares), and the
delisting of the Group from the Spanish Stock Exchanges and NASDAQ (the "Potential Transaction").
As of today, there is no agreement regarding the potential terms or conditions of the Potential Transaction. At
this stage, there is no guarantee that Brookfield and/or the Family Shareholders will make a tender offer for the
shares of the Parent Company and/or that a delisting of the shares of the Parent Company will be proposed or
agreed.
(A) Certain Contractual Implications in a take of control (toma de control)
The financing contracts entered into by the Parent Company, as well as the Corporate Bonds issued described in
Note 15, include clauses whereby the potential creditors in the different instruments could early terminate such
contracts in the event of a take of control of the Parent Company, provided that, in accordance with the terms
and conditions under which the Potential Transaction finally materialises, the terms defined as a take of control
in such contracts apply.
In addition, as described in Note 20 c), the Group has entered into agreements with executives and directors
whereby they may unilaterally terminate their employment contracts with the Parent Company and are entitled
to certain indemnification in the event of a take of control of the Parent Company, provided that, in accordance
with the terms and conditions under which the Potential Transaction finally materialises, the terms in such
contracts apply. Similarly, the share-based remuneration plans maintained by the Parent Company for certain
employees include clauses according to which, in the event of a take of control - provided that, in accordance
with the terms and conditions under which the Potential Transaction finally materialises, the terms defined as a
take of control in such contracts apply -, the amounts pending exchange would be early settled.
In addition, certain operating contracts entered into by the Group with third parties also include clauses providing
for a potential early termination in favour of the counterparty in the event of a take of control of the Parent
Company provided that, in accordance with the terms and conditions under which the Potential Transaction
finally materialises, the terms defined as a take of control in such contracts apply.
At the date of preparation of the condensed interim consolidated financial statements at 30 June 2024, insofar as
no public tender offer for the shares of Grifols, S.A. has yet been made and the terms and conditions under which
the Potential Transaction would be reflected are not known, no situation exists whereby any of the early
termination clauses mentioned in the preceding paragraphs would apply, and the terms and conditions under
which the Potential Transaction would be reflected are not known, so there is no situation in which any of the
early termination clauses mentioned in the preceding paragraphs would apply, and therefore the Group would
not incur in any obligation to early repay its financing, nor would any counterparty have the right to early
terminate any of these operating contracts, nor would there be any indemnification payments or settlement of
obligations with its executives and employees.
In any event, the Directors of the Parent Company understand that, in the event that the Potential Transaction
constitutes or results in a take of control that could trigger the early termination of the aforementioned contracts |
| GRIFOLS, S.A. AND SUBSIDIARIES
Notes to the Condensed Consolidated Interim Financial Statements for the
six-month period ended 30 June 2024
43
or, as the case may be, payment obligations or settlements to its officers and employees, the submission of any
potential takeover bid by the potential bidder shall be subject to the condition that, as a result thereof, the financial
and economic viability of the Group would not be compromised.
(B) Certain Statutory Implications
As described in Note 14, the Parent Company's share capital consists of Class A Shares and Class B Shares,
Class B Shares being non-voting shares with preferential economic rights according to its Articles of Association.
Treatment of Class A and Class B shares in the event of a public offer for the acquisition of shares
Section 4.1. of article 6.Bis of the Articles of Association of the Parent Company provides that in the event that
a public offer is made and settled for the acquisition of all or part of the shares of the Parent Company, the holders
of Class B Shares shall be entitled to participate in such offer and to have their shares acquired in the same
manner and on the same terms as the Class A Shares (including, without limitation, for the same consideration).
Otherwise, the holders of the Class B Shares are entitled to require the Parent to redeem their shares (in
accordance with the terms and process set out in Articles 4.2 and 4.3 of the Articles of Association). The wording
of section 4.1 of article 6 bis of the Articles of Association of the Parent Company is transcribed literally below:
[...]
4. Right of redemption
4.1 Redemption event. Each Class B Share entitles its holder to obtain its redemption as set forth in this section
4 in the event that (each offer that meets the following requirements, a “Redemption Event”) a tender acquisition
offer over all or part of the shares in the Company is made and settled (in whole or in part), except if holders of
Class B Shares have been entitled to participate in such offer and to their shares acquired in such offer equally
and on the same terms as holders of Class A Shares (including, without limitation, for the same consideration).
Approval of Exclusion Resolution
In addition, certain extraordinary matters defined pursuant to article 6.2 of the Articles of Association, including
any resolution approving the delisting of any shares of the Parent Company from trading on any stock exchange
or secondary market, must be approved by a simple majority of the Class B Shares then outstanding.
The Board of Directors of the Parent Company will at all times ensure compliance with the Articles of
Association and act in the best interests of the Company and in the best interests of its shareholders, employees
and other stakeholders.
Acquisition of plasma centers
As a result of the collaboration agreement entered to ImmunoTek GH, LLC in 2021, the Group acquired 7 plasma
centers, through its 100% subsidiary Grifols Bio North America, LLC, for an amount of US Dollar 131 million.
Settlement derived from hedging
On July 5, 2024, Grifols settled the EUR/RMB exchange rate hedging derivative (see note 11) receiving an
amount of Euros 1,559,942 thousand. This transaction has not had a significant impact on the consolidated
income statement. |
| GRIFOLS, S.A. AND SUBSIDIARIES
Consolidated Management Report
for the six-month period ended June 30, 2024
(Free translation from the original in Spanish. In the event of discrepancy, the Spanish language version will prevail)
1
Management Report for the six-month period ended June 30, 2024, should be read in conjunction with the
corresponding consolidated interim financial statements and related notes. The comments and analysis
included in the report may contain projections and forward-looking considerations that involve risks and
uncertainties. Please refer to the legal notice included at the end of the document.
In a half-year marked by an acceleration in operational and financial performance, Grifols reported solid results
for the first six months of 2024 that reaffirmed its guidance for the year. Led by a strengthened leadership team,
the company continues to make progress in achieving its strategic objectives, with a focus on cash generation,
debt reduction, deleveraging, operational excellence and value creation for all its stakeholders.
In this regard, the strategic alliance with the Haier Group in China involving the sale of a 20% stake in Shanghai
RAAS (SRAAS), completed on June 18, 2024, as well as the execution of the cash generation plan, support
both the debt reduction path and the efforts to improve cash flow, respectively.
EVOLUTION OF REVENUES
In this context, Grifols' revenue reached €3,444 million in the first half of 2024, representing an increase of
+7.5% cc1
(+6.8% reported2
). It is worth highlighting the solid revenue growth of +9.3% cc (+7.8% reported)
in the second quarter of the year to 1,818 million euros, driven by the growth of the main business units:
Biopharma, Diagnostic and Bio Supplies.
Biopharma
Biopharma's revenues increased by +8.9% cc (+8.3% reported) to €2,922 million in the first half of the year
and by +8.4% cc (+8.5%) to €1,528 million in the second quarter.
Framed on solid business fundamentals, the main growth drivers have been strong underlying demand for key
plasma proteins, a solid plasma supply and a favorable pricing and product mix combination. Of particular note
was the performance of immunoglobulin sales, the company's main franchise, up +13.1% cc in the half year
due to higher growth in subcutaneous immunoglobulin (SCIG) Xembify® (+58.9% cc).
Grifols continues to strengthen the immunoglobulin franchise with a strategy focused on primary
immunodeficiencies (PI) and secondary immunodeficiencies (SID), the indications with the greatest growth
potential in the coming years, while maintaining leadership in neurology and intensive care. The company's
focus is on continuing to drive growth in the U.S. and prioritizing certain countries, while accelerating the
expansion and penetration of Xembify®, its subcutaneous formulation.
Sales of albumin grew by +9.6% cc in the first half of 2024, driven mainly by demand in China and the United
States. In addition, Grifols' commercial innovation within the framework of the strategic alliance with Haier
1
Operating or constant exchange rate (cc) excludes exchange rate variations for the period
2
Reported includes the impact of foreign exchange rates |
| GRIFOLS, S.A. AND SUBSIDIARIES
Consolidated Management Report
for the six-month period ended June 30, 2024
(Free translation from the original in Spanish. In the event of discrepancy, the Spanish language version will prevail)
2
allows us to continue to expand supply in the country. In addition, the addition of Alfa-1 and other specialized
proteins has remained stable.
Diagnostic
Diagnostic posted revenues of €323 million, up -3.7% cc year-on-year (-5.5% reported), driven by €164 million
in the second quarter, representing growth of +1.2% cc (-0.5%). Excluding the €19 million commercial one-off
that took place in Q1 2023, the division posted a +1.9% cc increase in the half-year.
The positive performance of the main growth driver, blood typing solutions (+14.9% cc in the first half of the
year) in the main regions was particularly noteworthy.
Bio Supplies
Bio Supplies grew +32.6% cc (+32.6% reported) to €110 million in the first half, up +92.6% cc (+93.5%) and
€78 million in revenues in the second quarter thanks to sales phasing that impacted the first quarter and was
offset during this quarter, as planned. The division continues to benefit from the integration of Access
Biologicals.
PLASMA SUPPLY AND COST PER LITER
Grifols continues to increase plasma supply and effectively manage its cost per liter (CPL), driving further
margin expansion. Plasma supply continues to grow sustainably, and CPL has stabilized in the second quarter
compared to the first quarter of 2024, having been reduced by nearly 25% from the peak reached in July 2022.
The outlook for plasma is positive, highlighting the opportunity for cost reductions related to increased
efficiencies, streamlined operations and progress in technology and digitization.
FINANCIAL RESULTS AND DELEVERAGING
In the first six months of 2024, reported gross margin rose to 37.8% of revenue, improving from 36.0% in the
same period last year, driven primarily by lower CPL and product mix. Taking into account the approximately
nine-month inventory accounting lag that applies in the plasma industry, this improvement in CPL will continue
to lead to incremental margin expansion in the second half of 2024.
Reported EBITDA amounted to €723.6 million in the first half and €413.6 million in the second quarter,
representing margins on revenues of 21.0% and 22.8%, respectively. At the same time, adjusted EBITDA
amounted to €791.2 million in the first half, representing a margin of 23.0% on revenues, and €440.8 million
in the second quarter, with a 24.2% margin – mainly including €44 million of non-recurring transaction and
restructuring costs and €22 million from the Biotest Next Level (BNL) project. |
| GRIFOLS, S.A. AND SUBSIDIARIES
Consolidated Management Report
for the six-month period ended June 30, 2024
(Free translation from the original in Spanish. In the event of discrepancy, the Spanish language version will prevail)
3
The sequential improvement was supported by Biopharma's performance-led growth, cost savings from the
operational improvement plan and higher absorption of fixed costs.
The financial result (loss) amounted to €389.1 million in the first half of the year (€274.1 million in 2023),
mainly impacted by larger deferred financial expenses from our debt reducing by €1.6bn with the SRAAS
proceeds.
Reported net income of the Group amounted to EUR 36.3 million in the first half of 2024.
Grifols reiterates its commitment to debt reduction. Its leverage ratio stood at 5.5x in the first half of 2024,
driven by the 1.6 billion euros proceeds from the sale of 20% of SRAAS and the organic improvement in
EBITDA. The target is to bring the ratio to 4.5x by the end of 2024, with the main lever being EBITDA
improvement and, to a lesser extent, cash generation.
The proceeds from the SRAAS transaction will be allocated in full, and on a pro rata basis, to reduce the 2025
Senior Secured Notes (SSNs) and the 2027 Term Loan B (TLB), according to the Credit Agreement. In addition,
the €1 billion Private Placement Note (PPN) has already been used to repay the 2025 Senior Unsecured Notes
(SUNs). The Company does not have additional maturities until 2027.
Excluding the impact of IFRS 163
3, Grifols' net financial debt amounted to 8,262.1 million euros.
At June 30, 2024 and excluding the net proceeds from the divestment of SRAAS, Grifols had a liquidity position
of 915 million euros, which includes a cash position of 568 million euros.
CORPORATE GOVERNANCE
Changes in governance separating property management within the framework of a planned strategy
In February, Raimon Grifols and Víctor Grifols Deu decided to put an end to their executive role, remaining on
the Board of Directors of Grifols as proprietary directors. As of May 31, 2024, they cease to have the category
of "executive directors" as they cease to perform management functions at Grifols, and as of June 1, 2024, they
become "proprietary directors".
These changes are part of a long-planned and carefully designed strategy for the evolution of Grifols' corporate
governance, which Raimon Grifols and Víctor Grifols Deu initiated in 2022, together with the Board, to
progressively separate ownership from management of the company, setting a new standard for family-owned
companies listed on the Spanish stock exchange.
Nacho Abia takes over as Chief Executive Officer
On April 1, Nacho Abia officially assumed the position of Chief Executive Officer of Grifols, reporting directly
to Thomas Glanzmann, who will retain the position of Executive Chairman. Previously, on February 26, 2024,
3
3
As of June 2024, the impact of IRFS 16 on total debt is €1,134.2 million |
| GRIFOLS, S.A. AND SUBSIDIARIES
Consolidated Management Report
for the six-month period ended June 30, 2024
(Free translation from the original in Spanish. In the event of discrepancy, the Spanish language version will prevail)
4
Nacho Abia was appointed to the Board of Directors of Grifols. Consequently, Raimon Grifols and Víctor
Grifols Deu transfer their responsibilities to Nacho Abia and will remain with the company as advisors in a
transition period that ended on May 31, 2024.
The addition of Nacho Abia concludes a planned corporate governance evolution that began in 2022 to separate
ownership from management of the company. Nacho Abia will focus on continuing to accelerate the company's
growth, drive operational excellence and execute the deleveraging plan. He will also continue to reduce
operational complexity and improve clarity.
AGREEMENTS
Grifols Egypt moves towards self-sufficiency thanks to solid plasma volumes obtained
In February, Grifols announced that its integrated plasma collection and blood product production platform in
Africa is making great strides towards its goal of achieving local self-sufficiency in these essential treatments.
Grifols Egypt, which expects to double plasma collections by 2024, is already receiving enough donations to
cover Egypt's current domestic need for immunoglobulins.
Meanwhile, the project to build a new 105,000 square meter, state-of-the-art production center in the Medical
City of the New Administrative Capital, which will include fractionation and purification plants, logistics
facilities and what will be Grifols' first fully automated plasma testing laboratory in the world, is still underway.
When fully operational, Grifols Egypt will analyze more than one million plasma samples per year.
Grifols completes the sale of 20% of its stake in Shanghai RAAS and forges a strategic alliance with
Haier Group in China
On June 18, 2024, Grifols reported the sale of its 20% stake in SRAAS for approximately 1.6 billion euros and
the establishment of a strategic alliance with Haier Group Corporation (Haier Group), following confirmatory
due diligence by Haier and after obtaining all required government approvals.
Grifols and Haier Group will collaborate through SRAAS to create synergies that will help boost the
development of the Chinese healthcare system. The two companies extend their exclusive albumin distribution
agreement for the next 10 years, with guaranteed minimum supply volumes for the next five years (2024-2028).
SRAAS will be able to extend this agreement until 2044. The demand for albumin in China is significant and
is expected to grow considerably in the coming years.
With this transaction, announced in December 2023, Grifols maintains its presence in China and its commercial
agreements with SRAAS, while meeting its deleveraging commitment. The company will use all proceeds to
meet its deleveraging commitment. |
| GRIFOLS, S.A. AND SUBSIDIARIES
Consolidated Management Report
for the six-month period ended June 30, 2024
(Free translation from the original in Spanish. In the event of discrepancy, the Spanish language version will prevail)
5
INNOVATION
Grifols continues to make progress and meet the milestones planned
Grifols' innovation pipeline continues to make solid progress. Out of a total of nine milestones set for the year,
the company has met the four milestones planned for the first half of 2024 and 2 expected to be met during the
second half of the year related to Xembify® SCIG bi-weekly dosing and a GigaGen asset to treat the Hepatitis
B virus (HBV). Highlights include the recruitment of the first patient in the Phase 1/2 trial of the subcutaneous
formulation of Alpha-1-15%, the last patient recruited for the PRECIOSA albumin trial, and the Investigational
New Drug Application (IND) for the Phase 1 GIGA2339 trial to treat Hepatitis B virus (HBV).
Positive preliminary results of phase 3 clinical trial with fibrinogen
In February 2024, Biotest's fibrinogen concentrate (FC), BT524, achieved the primary endpoint in the AdFIrst
clinical trial, demonstrating its efficacy in the treatment of acquired fibrinogen deficiency as equivalent to
standard therapy, while maintaining an excellent safety profile.
The regulatory approvals process in Europe and the United States is scheduled to begin in the fourth quarter of
2024. This CF could be the first to be approved for a DAF indication in the U.S.
Launch in China of Erytra Eflexis, a powerful blood typing system
In April 2024, Grifols announced the launch in China of its leading blood typing technology - the fully
automated Erytra Eflexis system - after receiving regulatory approval.
The system enables complex blood typing analyses to be performed rapidly and represents a new generation of
fully automated blood typing analyzers designed to improve pre-transfusion compatibility testing.
GigaGen announces dosing of first patient in Phase 1 trial of anti-CTLA-4 oncology candidate in
advanced solid tumors
In May 2024, GigaGen, a subsidiary of Grifols, announced the dosing of the first patient in the Phase 1 clinical
trial evaluating the safety and tolerability of its anti-CTLA-4 oncology drug, GIGA-564, for the treatment of
metastatic or locally advanced solid tumors.
The trial is being conducted by researchers at the U.S. National Cancer Institute (NCI), part of the U.S. National
Institutes of Health, in close collaboration with GigaGen.
Grifols-Biotest receives FDA approval for Yimmugo immunoglobulin® in the treatment of primary
immunodeficiency diseases
In June 2024, Biotest received U.S. FDA approval for Yimmugo®, an innovative intravenous immunoglobulin
(IG) for the treatment of primary immunodeficiencies, which adds to Grifols' strong franchise of intravenous
and subcutaneous IG treatments. |
| GRIFOLS, S.A. AND SUBSIDIARIES
Consolidated Management Report
for the six-month period ended June 30, 2024
(Free translation from the original in Spanish. In the event of discrepancy, the Spanish language version will prevail)
6
The launch of Yimmugo in the U.S. in the second half of 2024 follows the successful launch in Europe in late
2022 and will contribute to Grifols' future revenue growth and profitability. Yimmugo is the first of three plasma
proteins in Biotest's portfolio to be marketed in different countries, including the United States. |
| GRIFOLS, S.A. AND SUBSIDIARIES
Consolidated Management Report
for the six-month period ended June 30, 2024
(Free translation from the original in Spanish. In the event of discrepancy, the Spanish language version will prevail)
7
NON-FINANCIAL INFORMATION
COMMITMENT TO THE HUMAN TEAM
Workforce, equal opportunities, and diversity
In the first half of 2024, Grifols' workforce was 23,505 people, a reduction of -1% compared to the end of 2023.
Specifically, the workforce in the USA it has decreased by -3.5% to 13.579 people; in Spain it has increased by
4,3% to 4.355 people; and in ROW (rest of the world) has remained stable at 5.571 people.
Grifols works to guarantee equal opportunities, values diversity, actively promotes inclusion and encourages
the professional development of its employees.
In the first six months of the year, Grifols has continued to make progress on its Strategic Diversity and
Inclusion (D&I) Plan, a three-year plan that began in January 2023, focused on creating specific training
pathways on key diversity topics, constant review of HHRR policies and programs to ensure the company
reflects the diversity of the communities in which it operates, as well as strengthening Employee Resource
Groups (ERGs) and local D&I ambassador groups at various Grifols sites.
In the first half of 2024, significant progress has been made in line with the commitments set out in the Grifols
2030 Agenda. Among them, the number of women in management positions has increased by +2% in the period
and now represents 41% of the total. In addition, the Grifols team includes people of more than 90 nationalities
and close to 800 people with disabilities. As of June 30, 2024, 57% of the workforce is made up of women and
43% of men.
Physical and mental health and well-being
In the area of health and wellbeing, significant progress has also been made during the first half of 2024 within
the framework of Grifols' three-year Strategic Wellbeing Plan "Care for your heart" which, in force since 2022,
focuses on the prevention and awareness of cardiovascular risk. To this end, we have continued with our
nutrition activities in Spain, and have launched the sleep campaign, with various activities in the countries
where we operate, such as masterclasses by experts in sleep hygiene. In the second half of the year, we will
work on tobacco consumption as the last cardiovascular risk factor.
From 2023, Grifols also has a new corporate mental health policy to support and safeguard the well-being of
its human team in a comprehensive manner. In this context, in 2023 Grifols implemented a specific mental
health action plan, where one of the actions launched was to monitor various indicators of mental health and
well-being of the workforce, provide them with tools to prevent and manage anxiety and stress, and foster a
culture that prevents any type of discrimination related to mental health. During 2024, work has been carried
out on an emotional health survey. In this regard, the information from the company's global engagement
questionnaire is used to extract an emotional management indicator that considers three factors: leadership,
organization and personnel. |
| GRIFOLS, S.A. AND SUBSIDIARIES
Consolidated Management Report
for the six-month period ended June 30, 2024
(Free translation from the original in Spanish. In the event of discrepancy, the Spanish language version will prevail)
8
Training, promotion and talent retention
The training and development of Grifols' human resources is fundamental to the company. In the first half of
2024, more than 2.5 million hours were devoted to staff training, an average of 125 hours per employee.
Noteworthy is the commitment to team development. During the first half of 2024, the second edition of the
Talent Program was conducted, in which 100 high-potential people from the organization undergo a
personalized development plan that includes, among other things, job rotations and specific training, including
those related to change management and the improvement of performance evaluation processes, among others.
Additionally, this year Grifols has launched two new development programs: the Grow Program, which, over
an 8-month training pathway, will prepare high-potential individuals within the company to become future
managers, and the LEAP (Leading Excellence for Advancing Performance) Program, which will support future
leaders of the Plasma organization through an extensive 9-month training program.
ENVIRONMENT
Advancing commitments
In the first half of the year, Grifols published the environmental balance sheet for the year 2023 in its Annual
Integrated and Sustainability Report. This report fully complies with the requirements and recommendations of
the Global Reporting Initiative (GRI), has been approved by Grifols' Board of Directors and verified by an
independent external audit.
In addition, an external audit was conducted to monitor the Environmental Management System in ISO 14001-
certified companies in Spain and the United States, with satisfactory results.
In 2023, the evolution of the 2030 Agenda has been positive: although CO2 equivalent emissions have increased
by +1.3%4
4 in absolute value, they have decreased by -4.3% relative to sales and CO2 equivalent emissions
intensity for scopes 1, 2 and 35
5 has been reduced by -33%. In addition, energy consumption relative to sales
decreased by -2%, renewable electricity consumption was -34.3% compared to -26.4% in 2022, and water
consumption increased in absolute value by +22% compared to 2023, but by +13% relative to sales.
Details of progress in achieving Grifols' 2030 commitments and the 2023-2026 corporate Environmental
Program are included in the aforementioned report, which also includes an update on climate risks and
opportunities following the recommendations of the Task Force for Climated-related Financial Disclosure
(TCFD).
Corporate Environmental Program 2023-2026
Grifols continues to make progress on its Corporate Environmental Program 2023-2026, which includes some
60 specific actions aimed at making further progress in three key areas: energy efficiency, circular economy
4
4
Data corresponding to 2023 vs. 2022 for scopes 1 and 2 (market-based)
5
5
Data corresponding to 2023 vs. 2022 for scopes 1 and 2 (market-based) and 3 |
| GRIFOLS, S.A. AND SUBSIDIARIES
Consolidated Management Report
for the six-month period ended June 30, 2024
(Free translation from the original in Spanish. In the event of discrepancy, the Spanish language version will prevail)
9
and biodiversity. The development of this program will reduce energy consumption by more than 8,000 million
kWh and a reduction of more than 60,000 tons of CO2 e per year (scopes 1 and 2) with a total investment of
more than 26 million euros. The targets set constitute the roadmap for achieving the corporate objectives set for
the year 2030. These include:
- Signing of renewable electricity purchase agreements through PPA (Power Purchasing Agreement)
contracts in Spain and the USA for 169 million kWh/year.
- Implementation of energy efficiency measures at the Biopharma and Diagnostic facilities in Barcelona
(Spain).
- Application of artificial intelligence measures in the control systems of the Biopharma plants in
Barcelona (Spain) and Clayton (USA).
- Implementation of actions to reduce heat energy consumption at the GWWO (Ireland) and Biotest
(Germany) facilities.
- 39,000 m3
reduction in water consumption at Biopharma's Barcelona facilities.
- Reduction of +75 tons of plastic waste per year at Biopharma's plants in Barcelona.
- Reduction of ethanol residues at Biopharma's facilities in Germany.
- Maintain and establish new biodiversity conservation programs in natural areas owned by Grifols or
in its areas of influence, both in Spain and in the USA.
Key initiatives implemented in the first half of 2024
- Publication of a new Biodiversity Policy that integrates ecological considerations into Grifols' strategic
decisions, ensuring that the company minimizes its environmental footprint and contributes positively
to the ecosystems in which it operates.
- Update of Grifols' Energy Policy to ensure that its application increases competitiveness and reduces
its environmental impact.
- Progress in adapting environmental information reporting to the new European regulations starting
with dual materiality analysis and analysis of required information
- Application to the Science Based Targets Initiative (SBTi) for the validation of the carbon reduction
targets proposed by Grifols
SUSTAINABILITY
Recognitions in the first half of 2024
Grifols' performance in recent years has enabled it to be recognized as one of the most sustainable companies
in the world. This is demonstrated by its inclusion and presence in the Dow Jones Sustainability Index (DJSI)
Euro, Euronext Vigeo Europe 120, Euronext Vigeo Eurozone 120, FTSE4Good Global and Bloomberg Gender-Equality Index (GEI), among others.
In addition, various agencies such as Standard & Poor's Global Rating, Moody's, Sustainalytics, EcoVadis and
ISS evaluate Grifols' performance in terms of sustainability. |
| GRIFOLS, S.A. AND SUBSIDIARIES
Consolidated Management Report
for the six-month period ended June 30, 2024
(Free translation from the original in Spanish. In the event of discrepancy, the Spanish language version will prevail)
10
Transparency
As part of its commitment to transparency, Grifols has detailed for the ninth consecutive year all payments and
other transfers of value related to medicines and healthcare technology made to professionals and organizations
in the sector in various European countries defined in the EFPIA scope, including Spain.
In 2023, Grifols made transfers of value in Europe for a total amount of 14.5 million euros, which represents a
decrease of 25% compared to 2022. Of these, 68.9% were transfers of value related to R&D, amounting to 10.0
million euros. Transfers of value to healthcare organizations and professionals amounted to €4.5 million.
In addition to Europe, Grifols applies this transparency policy in the United States as stipulated by the Centers
for Medicare & Medicaid Services (CMS).
Social action
Grifols extended its commitment to the World Federation of Hemophilia's (WFH) humanitarian aid program
until 2030 and will donate a minimum of 240 million international units (IU) of clotting factors (factor VIII and
factor IX) to the WFH Humanitarian Aid Program in the period 2022 - 2030. Grifols has been collaborating
with the World Federation of Hemophilia since 2014 and, in addition to support of humanitarian initiatives, we
have also supported and encouraged patient-centric initiatives through the Grifols Hemophilia Awareness
Global Awards (GHAGA) which has provided winners awards of up to €30,000 for programs that have
contributed to improving the care of hemophilia patients and their quality of life.
Grifols also collaborates with Habitat for Humanity since 2014 to provide safe, decent and healthy housing in
communities in across the United States. Employees in California have helped the organization meet the need
for affordable housing and supported local non-profit organizations by rehabilitating homes for families and
building playhouses in their nearby communities, respectively. Nearly 50 Grifols volunteers from our sites in
San Diego, Los Angeles and Emeryville participated in six Habitat build events during the first half of the year.
RISKS
At June 30, 2024, the Group maintains the same financial risk management policies and objectives than it had
at December 31, 2023. In this context, the Group has actively worked to implement its deleveraging plan by
taking the following actions:
On April 23, 2024, a private placement of Euros 1,000 million of senior secured bonds was made and, on
June 4, 2024, an additional placement of Euros 300 million of senior secured bonds. The funds received
have been used for the redemption of senior unsecured notes maturing in May 2025 and the remainder was
used for the repayment of the revolving facility (RCF).
On June 18, 2024, the sale of the 20% shareholding in Shanghai RAAS to Haier was completed and these
funds will be used to partially amortize the senior secured debt on a pro rata basis. |
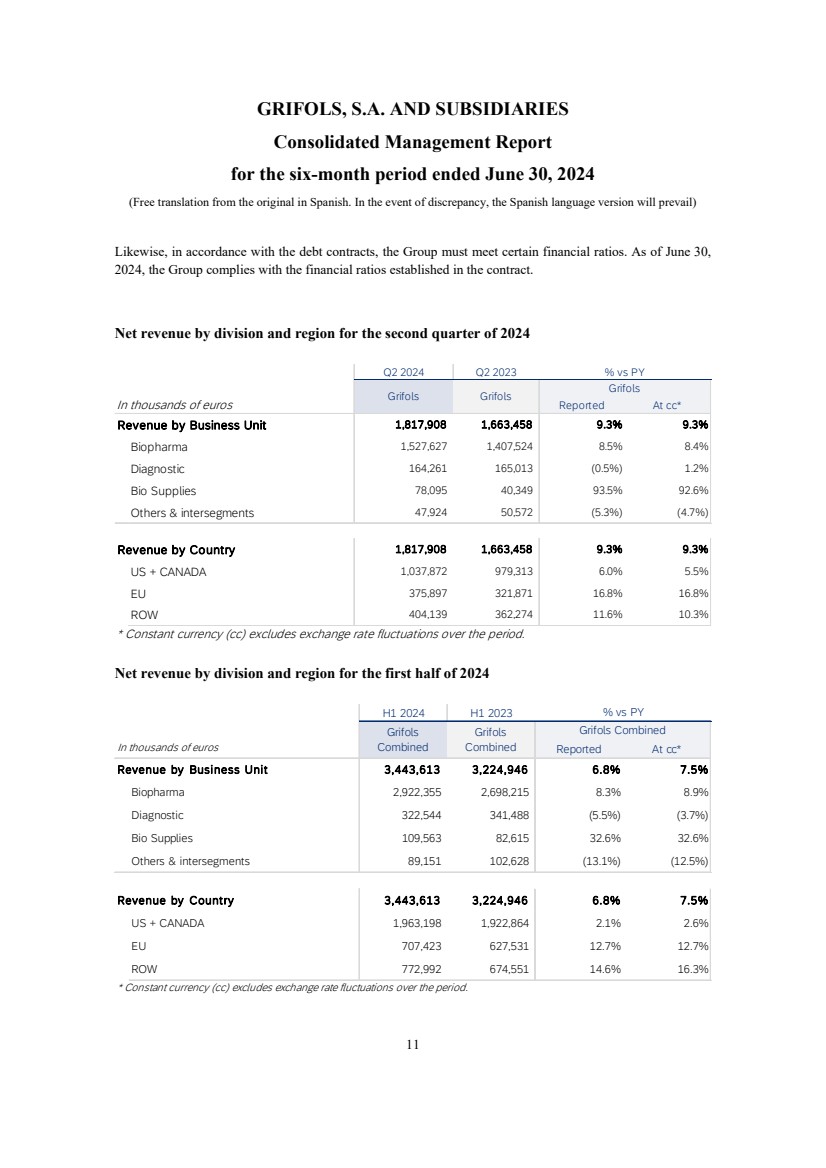
| GRIFOLS, S.A. AND SUBSIDIARIES
Consolidated Management Report
for the six-month period ended June 30, 2024
(Free translation from the original in Spanish. In the event of discrepancy, the Spanish language version will prevail)
11
Likewise, in accordance with the debt contracts, the Group must meet certain financial ratios. As of June 30,
2024, the Group complies with the financial ratios established in the contract.
Net revenue by division and region for the second quarter of 2024
Net revenue by division and region for the first half of 2024
Q2 2024 Q2 2023
In thousands of euros Reported At cc*
Revenue by Business Unit 1,663,458 1,817,908 9.3% 9.3%
Biopharma 1,407,524 1,527,627 8.5% 8.4%
Diagnostic 165,013 164,261 (0.5%) 1.2%
Bio Supplies 40,349 78,095 93.5% 92.6%
Others & intersegments 50,572 47,924 (5.3%) (4.7%)
Revenue by Country 1,663,458 1,817,908 9.3% 9.3%
US + CANADA 979,313 1,037,872 6.0% 5.5%
EU 321,871 375,897 16.8% 16.8%
ROW 362,274 404,139 11.6% 10.3%
* Constant currency (cc) excludes exchange rate fluctuations over the period.
Grifols Grifols
Grifols
% vs PY
H1 2024 H1 2023
In thousands of euros Reported At cc*
Revenue by Business Unit 3,443,613 3,224,946 6.8% 7.5%
Biopharma 2,922,355 2,698,215 8.3% 8.9%
Diagnostic 322,544 341,488 (5.5%) (3.7%)
Bio Supplies 109,563 82,615 32.6% 32.6%
Others & intersegments 89,151 102,628 (13.1%) (12.5%)
Revenue by Country 3,443,613 3,224,946 6.8% 7.5%
US + CANADA 1,963,198 1,922,864 2.1% 2.6%
EU 707,423 627,531 12.7% 12.7%
ROW 772,992 674,551 14.6% 16.3%
* Constant currency (cc) excludes exchange rate fluctuations over the period.
Grifols
Combined
Grifols Grifols Combined
Combined
% vs PY |
| GRIFOLS, S.A. AND SUBSIDIARIES
Consolidated Management Report
for the six-month period ended June 30, 2024
(Free translation from the original in Spanish. In the event of discrepancy, the Spanish language version will prevail)
12
ANNEX - NON-GAAP (IFRS-EU) MEASURES RECONCILIATION OR ALTERNATIVE
PERFORMANCE MEASURES (APM)
To complement the consolidated financial statements presented in accordance with International
Financial Reporting Standards (IFRS), Grifols provides the following tables and reconciliations.
These tables contain APM measures, which are used in conjunction with financial metrics in
accordance with IFRS. Their purpose covers budget setting, business management, operational and
financial performance evaluation, as well as comparison with prior periods and competitors. The
inclusion of these measures is useful as it allows for analysis and comparison of profitability and
solvency across companies and industries, eliminating accounting and financial effects that are not
directly related to cash flows.
In addition, Grifols presents non-financial measures because they are commonly used by investors,
securities analysts, and other market players. These measures comple(ment the analysis of financial
performance and should be considered in conjunction with IFRS metrics, not as a replacement for
them.
The following tables set out the measures and ratios commonly used by Grifols, including their name,
purpose and, in the case of ratios, how they are calculated.
Alternative Performance Measures Definition Aim / Purpose
Revenue at constant currency Reported revenue + variation due to
exchange rate impact
Excludes fluctuations in the exchange
rates of the different currencies in
which Grifols reports revenues in
order to facilitate to facilitate the
comparison between different
financial periods and the
understanding of their evolution.
Earnings Before Interest, Tax,
Depreciation and Amortization
(EBITDA) or Gross Operating Profit
Operating profit + depreciation,
amortization and provisions
El EBITDA (“Earnings Before
Interest, Tax, Depreciation and
Amortization”) evaluates operating
results without taking into account
large expense items that have no
impact on cash flows. This metric
provides a more accurate and
comparable understanding of the
company's performance.
|
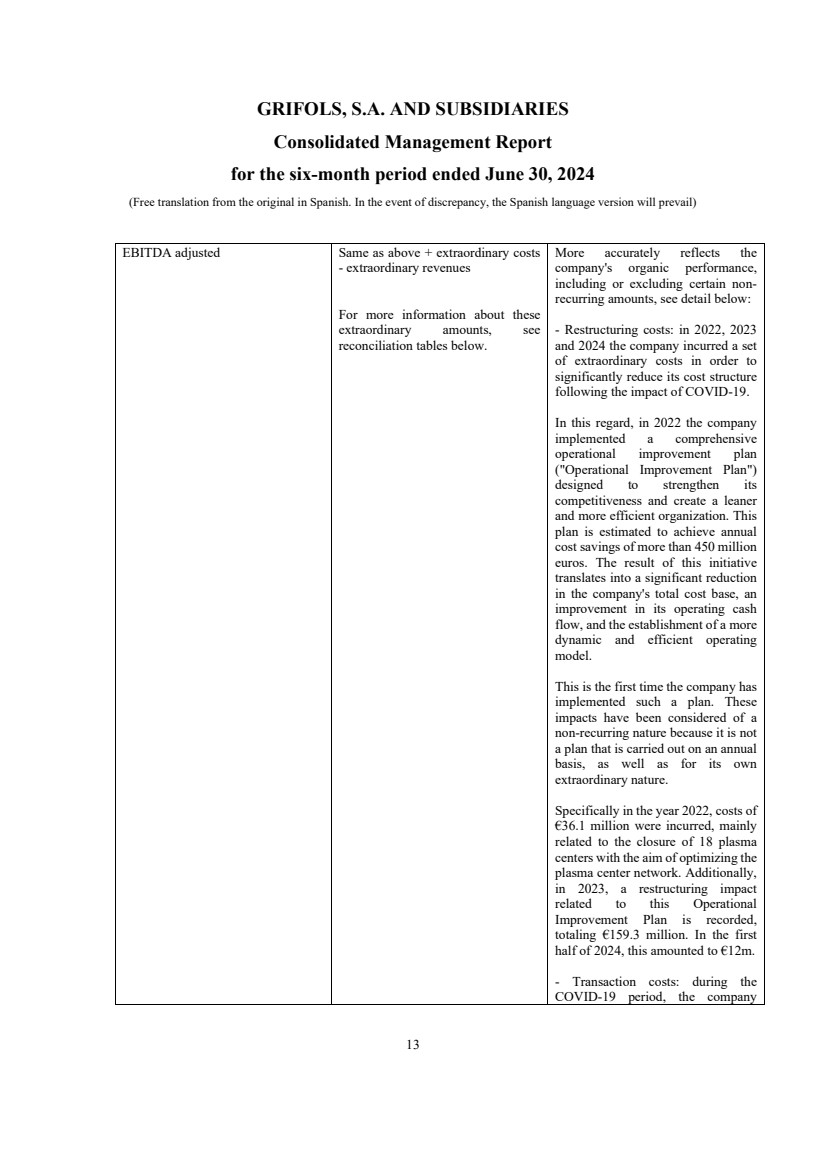
| GRIFOLS, S.A. AND SUBSIDIARIES
Consolidated Management Report
for the six-month period ended June 30, 2024
(Free translation from the original in Spanish. In the event of discrepancy, the Spanish language version will prevail)
13
EBITDA adjusted Same as above + extraordinary costs
- extraordinary revenues
For more information about these
extraordinary amounts, see
reconciliation tables below.
More accurately reflects the
company's organic performance,
including or excluding certain non-recurring amounts, see detail below:
- Restructuring costs: in 2022, 2023
and 2024 the company incurred a set
of extraordinary costs in order to
significantly reduce its cost structure
following the impact of COVID-19.
In this regard, in 2022 the company
implemented a comprehensive
operational improvement plan
("Operational Improvement Plan")
designed to strengthen its
competitiveness and create a leaner
and more efficient organization. This
plan is estimated to achieve annual
cost savings of more than 450 million
euros. The result of this initiative
translates into a significant reduction
in the company's total cost base, an
improvement in its operating cash
flow, and the establishment of a more
dynamic and efficient operating
model.
This is the first time the company has
implemented such a plan. These
impacts have been considered of a
non-recurring nature because it is not
a plan that is carried out on an annual
basis, as well as for its own
extraordinary nature.
Specifically in the year 2022, costs of
€36.1 million were incurred, mainly
related to the closure of 18 plasma
centers with the aim of optimizing the
plasma center network. Additionally,
in 2023, a restructuring impact
related to this Operational
Improvement Plan is recorded,
totaling €159.3 million. In the first
half of 2024, this amounted to €12m.
- Transaction costs: during the
COVID-19 period, the company |
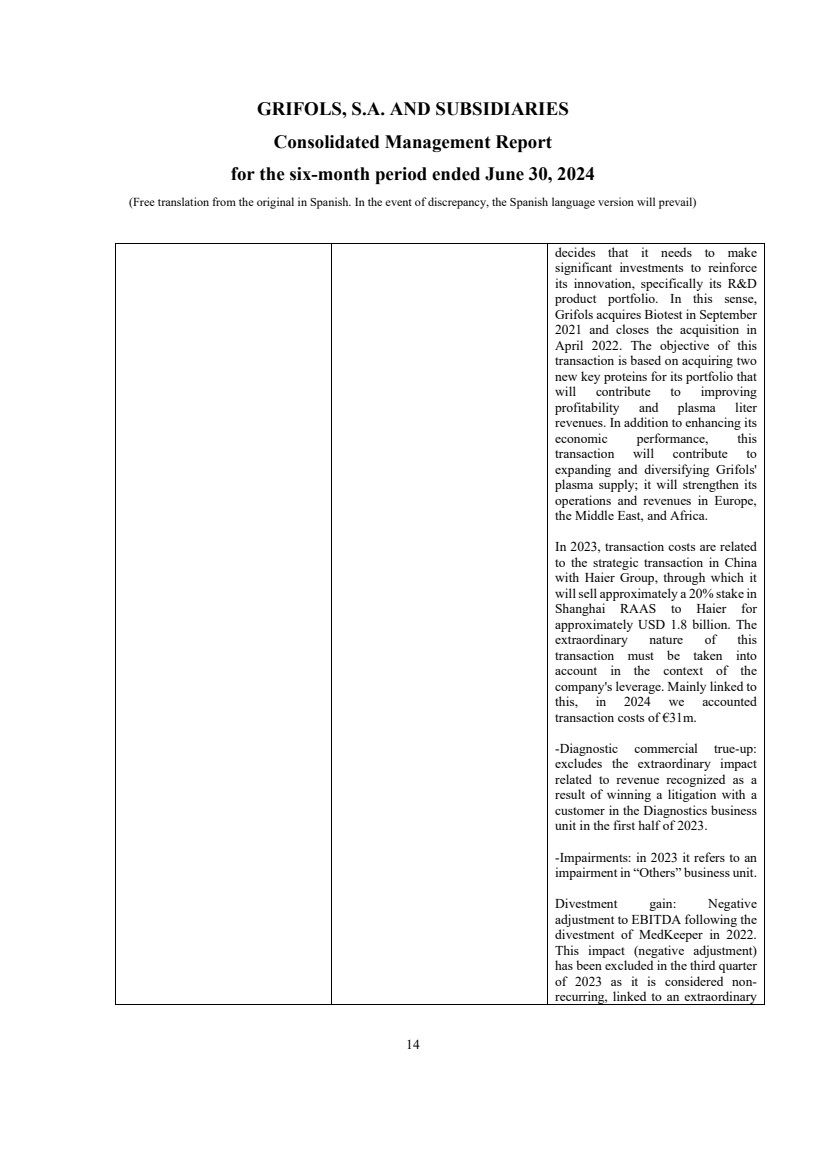
| GRIFOLS, S.A. AND SUBSIDIARIES
Consolidated Management Report
for the six-month period ended June 30, 2024
(Free translation from the original in Spanish. In the event of discrepancy, the Spanish language version will prevail)
14
decides that it needs to make
significant investments to reinforce
its innovation, specifically its R&D
product portfolio. In this sense,
Grifols acquires Biotest in September
2021 and closes the acquisition in
April 2022. The objective of this
transaction is based on acquiring two
new key proteins for its portfolio that
will contribute to improving
profitability and plasma liter
revenues. In addition to enhancing its
economic performance, this
transaction will contribute to
expanding and diversifying Grifols'
plasma supply; it will strengthen its
operations and revenues in Europe,
the Middle East, and Africa.
In 2023, transaction costs are related
to the strategic transaction in China
with Haier Group, through which it
will sell approximately a 20% stake in
Shanghai RAAS to Haier for
approximately USD 1.8 billion. The
extraordinary nature of this
transaction must be taken into
account in the context of the
company's leverage. Mainly linked to
this, in 2024 we accounted
transaction costs of €31m.
-Diagnostic commercial true-up:
excludes the extraordinary impact
related to revenue recognized as a
result of winning a litigation with a
customer in the Diagnostics business
unit in the first half of 2023.
-Impairments: in 2023 it refers to an
impairment in “Others” business unit.
Divestment gain: Negative
adjustment to EBITDA following the
divestment of MedKeeper in 2022.
This impact (negative adjustment)
has been excluded in the third quarter
of 2023 as it is considered non-recurring, linked to an extraordinary |
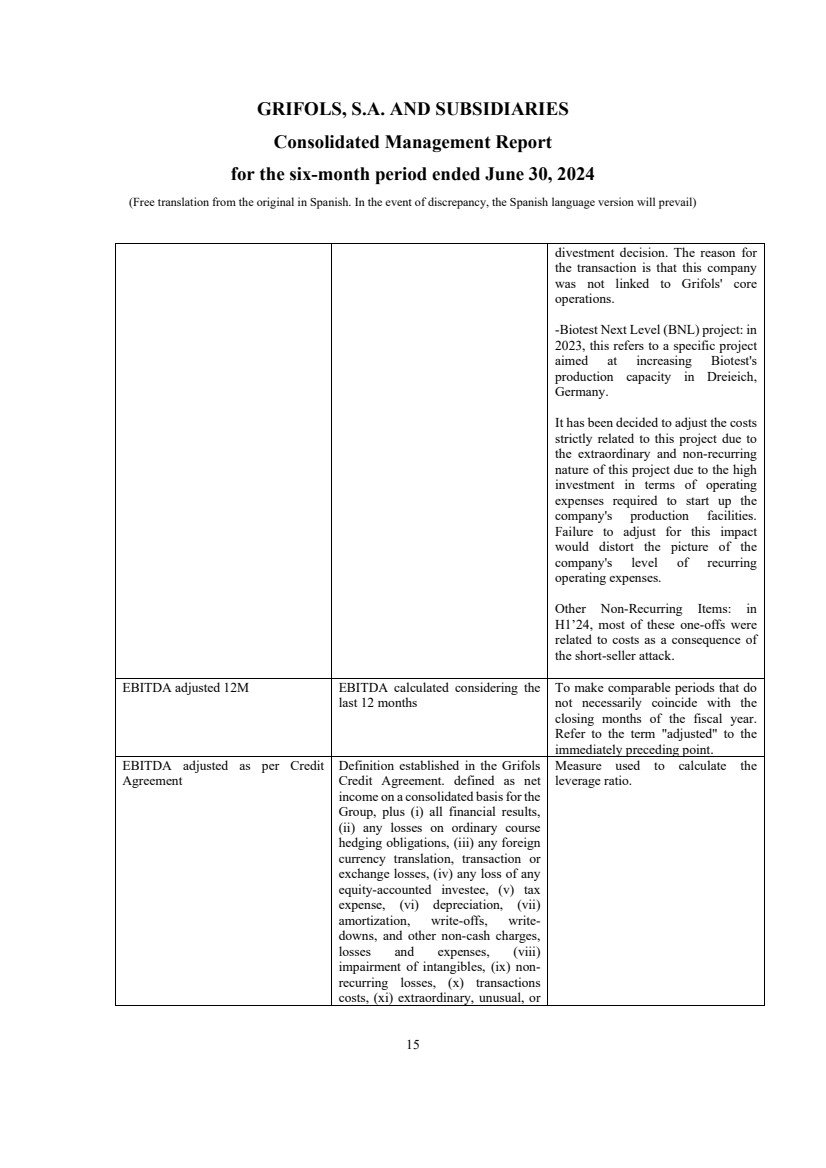
| GRIFOLS, S.A. AND SUBSIDIARIES
Consolidated Management Report
for the six-month period ended June 30, 2024
(Free translation from the original in Spanish. In the event of discrepancy, the Spanish language version will prevail)
15
divestment decision. The reason for
the transaction is that this company
was not linked to Grifols' core
operations.
-Biotest Next Level (BNL) project: in
2023, this refers to a specific project
aimed at increasing Biotest's
production capacity in Dreieich,
Germany.
It has been decided to adjust the costs
strictly related to this project due to
the extraordinary and non-recurring
nature of this project due to the high
investment in terms of operating
expenses required to start up the
company's production facilities.
Failure to adjust for this impact
would distort the picture of the
company's level of recurring
operating expenses.
Other Non-Recurring Items: in
H1’24, most of these one-offs were
related to costs as a consequence of
the short-seller attack.
EBITDA adjusted 12M EBITDA calculated considering the
last 12 months
To make comparable periods that do
not necessarily coincide with the
closing months of the fiscal year.
Refer to the term "adjusted" to the
immediately preceding point.
EBITDA adjusted as per Credit
Agreement
Definition established in the Grifols
Credit Agreement. defined as net
income on a consolidated basis for the
Group, plus (i) all financial results,
(ii) any losses on ordinary course
hedging obligations, (iii) any foreign
currency translation, transaction or
exchange losses, (iv) any loss of any
equity-accounted investee, (v) tax
expense, (vi) depreciation, (vii)
amortization, write-offs, write-downs, and other non-cash charges,
losses and expenses, (viii)
impairment of intangibles, (ix) non-recurring losses, (x) transactions
costs, (xi) extraordinary, unusual, or
Measure used to calculate the
leverage ratio. |
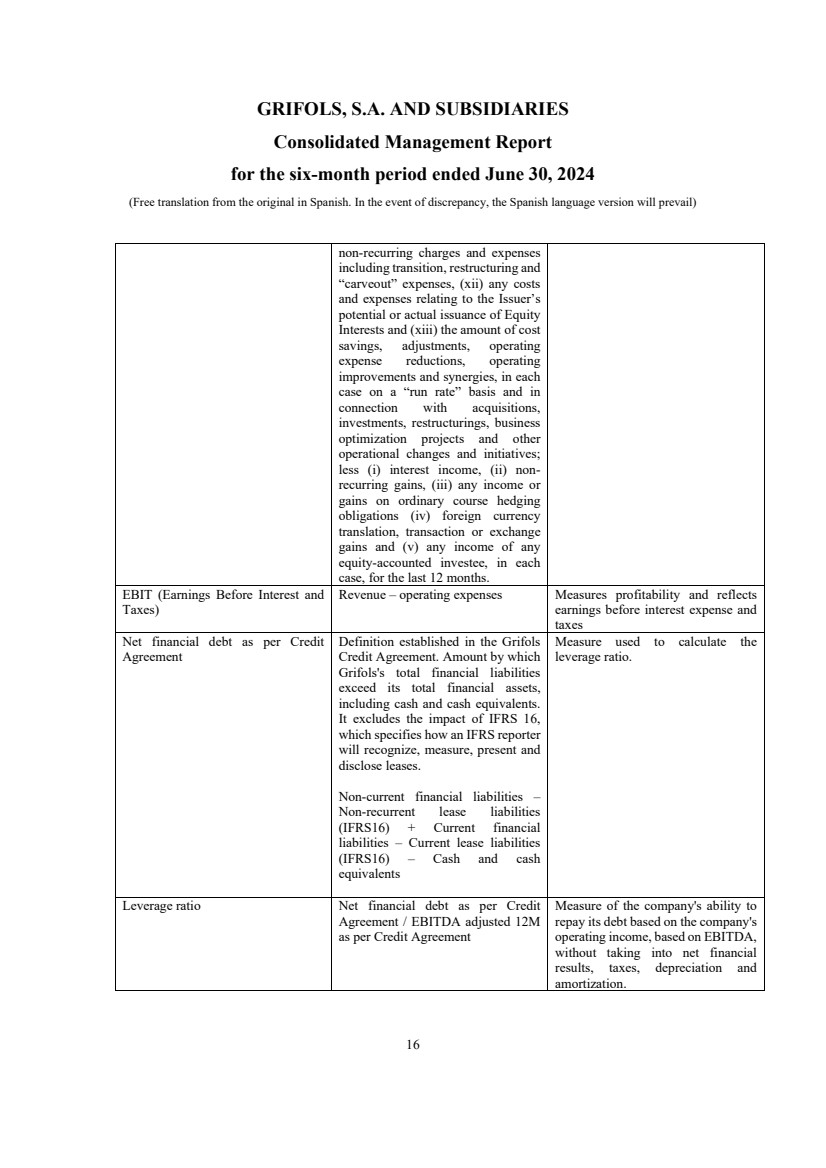
| GRIFOLS, S.A. AND SUBSIDIARIES
Consolidated Management Report
for the six-month period ended June 30, 2024
(Free translation from the original in Spanish. In the event of discrepancy, the Spanish language version will prevail)
16
non-recurring charges and expenses
including transition, restructuring and
“carveout” expenses, (xii) any costs
and expenses relating to the Issuer’s
potential or actual issuance of Equity
Interests and (xiii) the amount of cost
savings, adjustments, operating
expense reductions, operating
improvements and synergies, in each
case on a “run rate” basis and in
connection with acquisitions,
investments, restructurings, business
optimization projects and other
operational changes and initiatives;
less (i) interest income, (ii) non-recurring gains, (iii) any income or
gains on ordinary course hedging
obligations (iv) foreign currency
translation, transaction or exchange
gains and (v) any income of any
equity-accounted investee, in each
case, for the last 12 months.
EBIT (Earnings Before Interest and
Taxes)
Revenue – operating expenses Measures profitability and reflects
earnings before interest expense and
taxes
Net financial debt as per Credit
Agreement
Definition established in the Grifols
Credit Agreement. Amount by which
Grifols's total financial liabilities
exceed its total financial assets,
including cash and cash equivalents.
It excludes the impact of IFRS 16,
which specifies how an IFRS reporter
will recognize, measure, present and
disclose leases.
Non-current financial liabilities –
Non-recurrent lease liabilities
(IFRS16) + Current financial
liabilities – Current lease liabilities
(IFRS16) – Cash and cash
equivalents
Measure used to calculate the
leverage ratio.
Leverage ratio Net financial debt as per Credit
Agreement / EBITDA adjusted 12M
as per Credit Agreement
Measure of the company's ability to
repay its debt based on the company's
operating income, based on EBITDA,
without taking into net financial
results, taxes, depreciation and
amortization. |
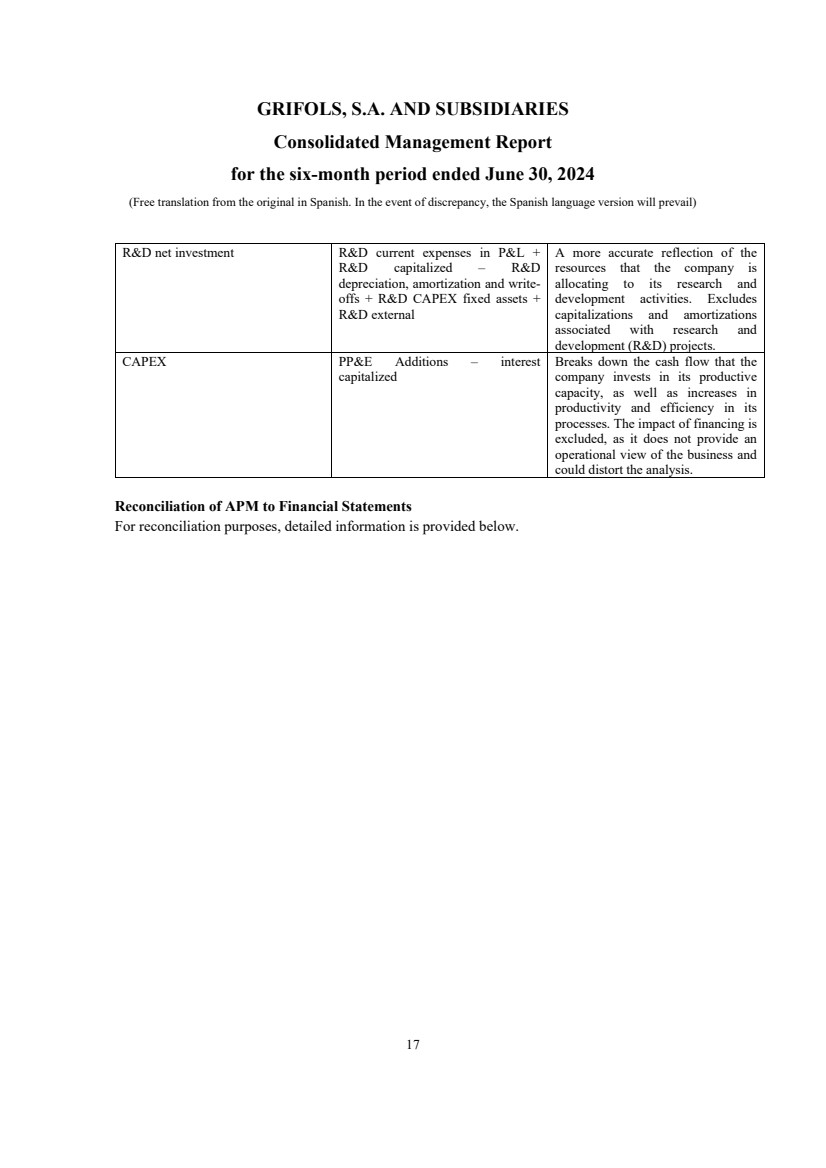
| GRIFOLS, S.A. AND SUBSIDIARIES
Consolidated Management Report
for the six-month period ended June 30, 2024
(Free translation from the original in Spanish. In the event of discrepancy, the Spanish language version will prevail)
17
R&D net investment R&D current expenses in P&L +
R&D capitalized – R&D
depreciation, amortization and write-offs + R&D CAPEX fixed assets +
R&D external
A more accurate reflection of the
resources that the company is
allocating to its research and
development activities. Excludes
capitalizations and amortizations
associated with research and
development (R&D) projects.
CAPEX PP&E Additions – interest
capitalized
Breaks down the cash flow that the
company invests in its productive
capacity, as well as increases in
productivity and efficiency in its
processes. The impact of financing is
excluded, as it does not provide an
operational view of the business and
could distort the analysis.
Reconciliation of APM to Financial Statements
For reconciliation purposes, detailed information is provided below. |
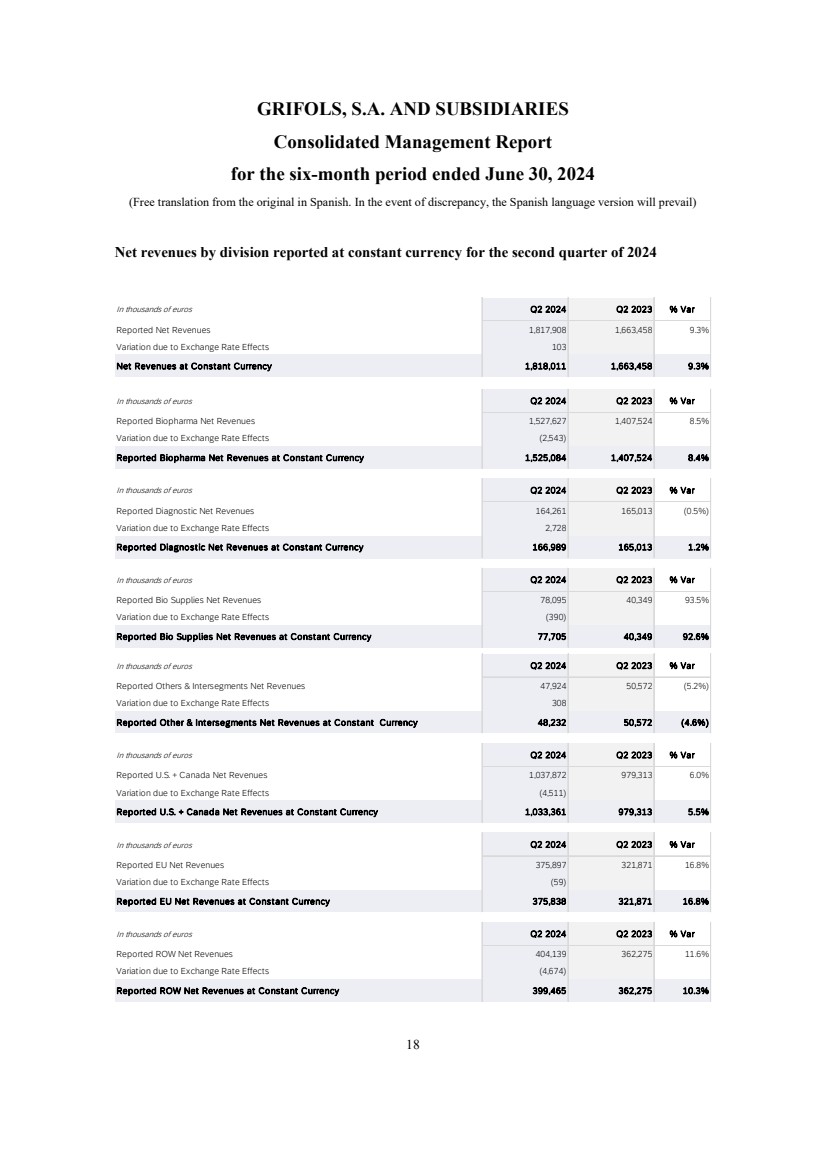
| GRIFOLS, S.A. AND SUBSIDIARIES
Consolidated Management Report
for the six-month period ended June 30, 2024
(Free translation from the original in Spanish. In the event of discrepancy, the Spanish language version will prevail)
18
Net revenues by division reported at constant currency for the second quarter of 2024
In thousands of euros Q2 2024 Q2 2023 % Var
Reported Net Revenues 1,817,908 1,663,458 9.3%
Variation due to Exchange Rate Effects 103
Net Revenues at Constant Currency 1,818,011 1,663,458 9.3%
In thousands of euros Q2 2024 Q2 2023 % Var
Reported Biopharma Net Revenues 1,527,627 1,407,524 8.5%
Variation due to Exchange Rate Effects (2,543)
Reported Biopharma Net Revenues at Constant Currency 1,525,084 1,407,524 8.4%
In thousands of euros Q2 2024 Q2 2023 % Var
Reported Diagnostic Net Revenues 164,261 165,013 (0.5%)
Variation due to Exchange Rate Effects 2,728
Reported Diagnostic Net Revenues at Constant Currency 166,989 165,013 1.2%
In thousands of euros Q2 2024 Q2 2023 % Var
Reported Bio Supplies Net Revenues 78,095 40,349 93.5%
Variation due to Exchange Rate Effects (390)
Reported Bio Supplies Net Revenues at Constant Currency 77,705 40,349 92.6%
In thousands of euros Q2 2024 Q2 2023 % Var
Reported Others & Intersegments Net Revenues 47,924 50,572 (5.2%)
Variation due to Exchange Rate Effects 308
Reported Other & Intersegments Net Revenues at Constant Currency 48,232 50,572 (4.6%)
In thousands of euros Q2 2024 Q2 2023 % Var
Reported U.S. + Canada Net Revenues 1,037,872 979,313 6.0%
Variation due to Exchange Rate Effects (4,511)
Reported U.S. + Canada Net Revenues at Constant Currency 1,033,361 979,313 5.5%
In thousands of euros Q2 2024 Q2 2023 % Var
Reported EU Net Revenues 375,897 321,871 16.8%
Variation due to Exchange Rate Effects (59)
Reported EU Net Revenues at Constant Currency 375,838 321,871 16.8%
In thousands of euros Q2 2024 Q2 2023 % Var
Reported ROW Net Revenues 404,139 362,275 11.6%
Variation due to Exchange Rate Effects (4,674)
Reported ROW Net Revenues at Constant Currency 399,465 362,275 10.3% |
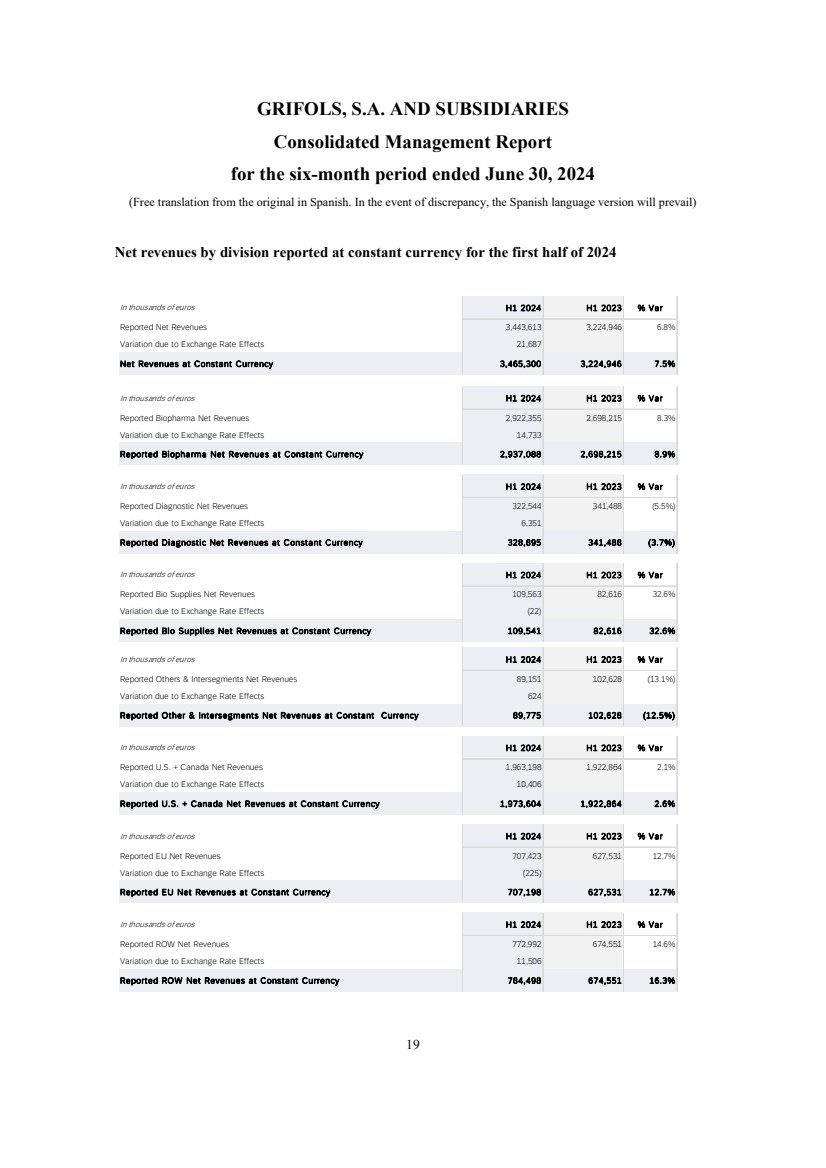
| GRIFOLS, S.A. AND SUBSIDIARIES
Consolidated Management Report
for the six-month period ended June 30, 2024
(Free translation from the original in Spanish. In the event of discrepancy, the Spanish language version will prevail)
19
Net revenues by division reported at constant currency for the first half of 2024
In thousands of euros H1 2024 H1 2023 % Var
Reported Net Revenues 3,443,613 3,224,946 6.8%
Variation due to Exchange Rate Effects 21,687
Net Revenues at Constant Currency 3,465,300 3,224,946 7.5%
In thousands of euros H1 2024 H1 2023 % Var
Reported Biopharma Net Revenues 2,922,355 2,698,215 8.3%
Variation due to Exchange Rate Effects 14,733
Reported Biopharma Net Revenues at Constant Currency 2,937,088 2,698,215 8.9%
In thousands of euros H1 2024 H1 2023 % Var
Reported Diagnostic Net Revenues 322,544 341,488 (5.5%)
Variation due to Exchange Rate Effects 6,351
Reported Diagnostic Net Revenues at Constant Currency 328,895 341,488 (3.7%)
In thousands of euros H1 2024 H1 2023 % Var
Reported Bio Supplies Net Revenues 109,563 82,616 32.6%
Variation due to Exchange Rate Effects (22)
Reported Bio Supplies Net Revenues at Constant Currency 109,541 82,616 32.6%
In thousands of euros H1 2024 H1 2023 % Var
Reported Others & Intersegments Net Revenues 89,151 102,628 (13.1%)
Variation due to Exchange Rate Effects 624
Reported Other & Intersegments Net Revenues at Constant Currency 89,775 102,628 (12.5%)
In thousands of euros H1 2024 H1 2023 % Var
Reported U.S. + Canada Net Revenues 1,963,198 1,922,864 2.1%
Variation due to Exchange Rate Effects 10,406
Reported U.S. + Canada Net Revenues at Constant Currency 1,973,604 1,922,864 2.6%
In thousands of euros H1 2024 H1 2023 % Var
Reported EU Net Revenues 707,423 627,531 12.7%
Variation due to Exchange Rate Effects (225)
Reported EU Net Revenues at Constant Currency 707,198 627,531 12.7%
In thousands of euros H1 2024 H1 2023 % Var
Reported ROW Net Revenues 772,992 674,551 14.6%
Variation due to Exchange Rate Effects 11,506
Reported ROW Net Revenues at Constant Currency 784,498 674,551 16.3% |
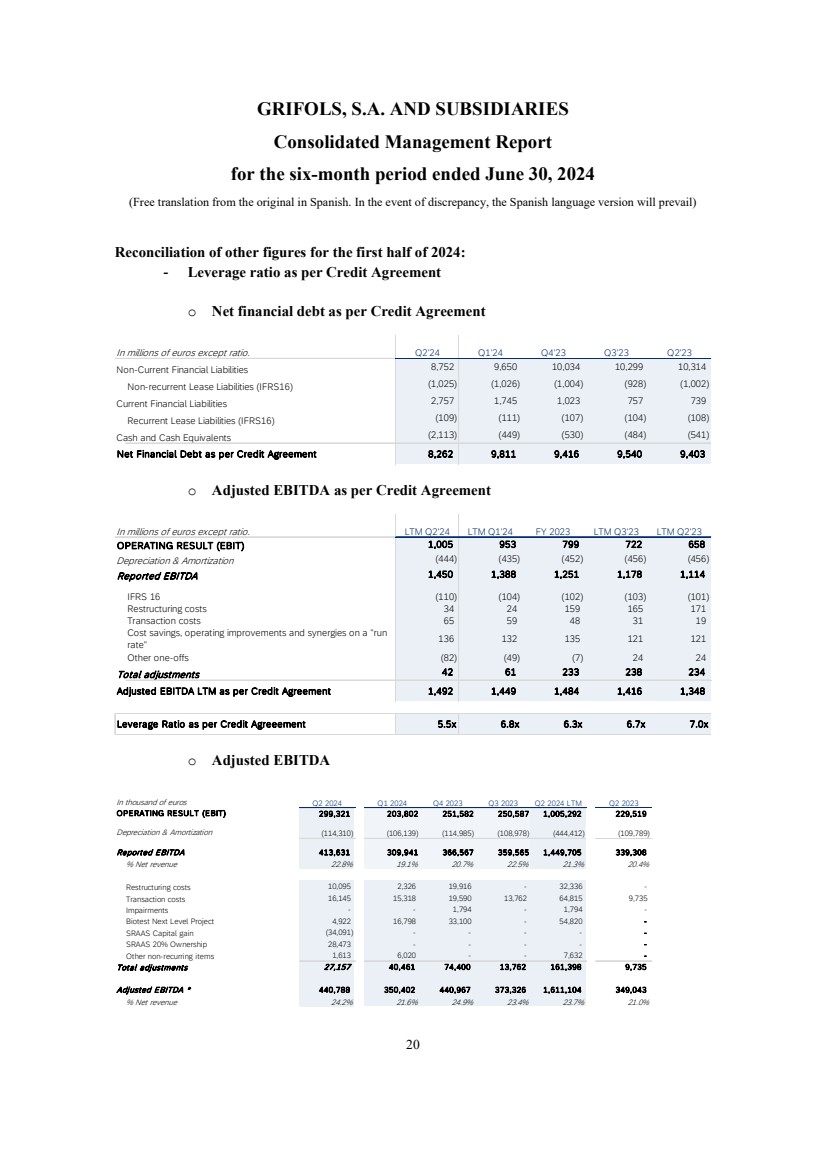
| GRIFOLS, S.A. AND SUBSIDIARIES
Consolidated Management Report
for the six-month period ended June 30, 2024
(Free translation from the original in Spanish. In the event of discrepancy, the Spanish language version will prevail)
20
Reconciliation of other figures for the first half of 2024:
- Leverage ratio as per Credit Agreement
o Net financial debt as per Credit Agreement
o Adjusted EBITDA as per Credit Agreement
o Adjusted EBITDA
In millions of euros except ratio. Q2'24 Q1'24 Q4'23 Q3'23 Q2'23
Non-Current Financial Liabilities 9,650 8,752 10,034 10,299 10,314
Non-recurrent Lease Liabilities (IFRS16) (1,026) (1,025) (1,004) (928) (1,002)
Current Financial Liabilities 1,745 2,757 1,023 757 739
Recurrent Lease Liabilities (IFRS16) (111) (109) (107) (104) (108)
Cash and Cash Equivalents (449) (2,113) (530) (484) (541)
Net Financial Debt as per Credit Agreement 8,262 9,811 9,416 9,540 9,403
In millions of euros except ratio. LTM Q2'24 LTM Q1'24 FY 2023 LTM Q3'23 LTM Q2'23
OPERATING RESULT (EBIT) 953 1,005 799 722 658
Depreciation & Amortization (435) (444) (452) (456) (456)
Reported EBITDA 1,388 1,450 1,251 1,178 1,114
IFRS 16 (110) (104) (102) (103) (101)
Restructuring costs 34 24 159 165 171
Transaction costs 65 59 48 31 19
Cost savings, operating improvements and synergies on a "run
rate" 132 136 135 121 121
Other one-offs (82) (49) (7) 24 24
Total adjustments 61 42 233 238 234
Adjusted EBITDA LTM as per Credit Agreement 1,492 1,449 1,484 1,416 1,348
Leverage Ratio as per Credit Agreeement 5.5x 6.8x 6.3x 6.7x 7.0x
In thousand of euros
203,802 251,582 250,587 1,005,292 299,321 229,519
(106,139) (114,985) (108,978) (444,412) (114,310) (109,789)
Reported EBITDA 309,941 366,567 359,565 1,449,705 413,631 339,308
% Net revenue 22.8% 19.1% 20.7% 22.5% 21.3% 20.4%
Restructuring costs 2,326 10,095 19,916 - 32,336 -
Transaction costs 15,318 16,145 19,590 13,762 64,815 9,735
Impairments - - 1,794 - 1,794 -
Biotest Next Level Project 16,798 4,922 33,100 - 54,820 -
SRAAS Capital gain - (34,091) - - - -
SRAAS 20% Ownership - 28,473 - - - -
Other non-recurring items 6,020 1,613 - - 7,632 -
Total adjustments 27,157 74,400 40,461 13,762 161,398 9,735
Adjusted EBITDA * 350,402 440,788 440,967 373,326 1,611,104 349,043
% Net revenue 24.2% 21.6% 24.9% 23.4% 23.7% 21.0%
Depreciation & Amortization
OPERATING RESULT (EBIT)
Q2 2024 Q4 2023 Q3 2023 Q2 2023 Q1 2024 Q2 2024 LTM |
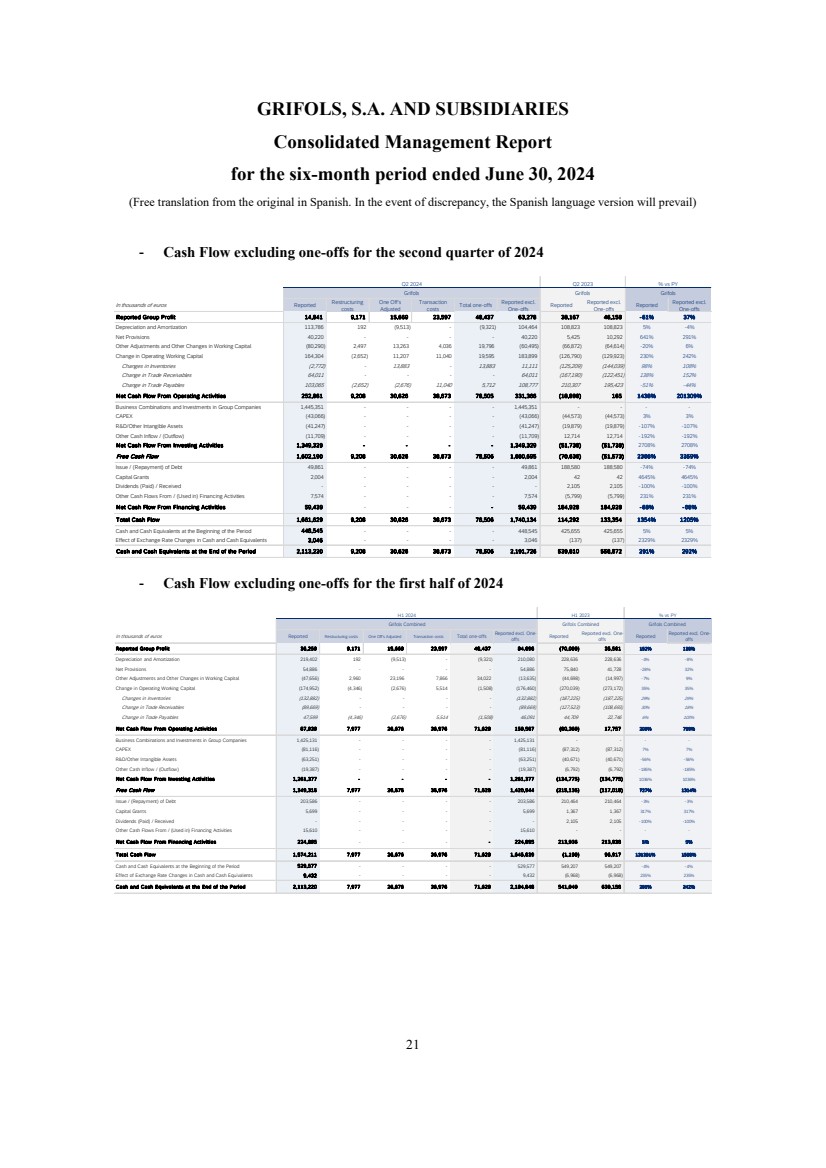
| GRIFOLS, S.A. AND SUBSIDIARIES
Consolidated Management Report
for the six-month period ended June 30, 2024
(Free translation from the original in Spanish. In the event of discrepancy, the Spanish language version will prevail)
21
- Cash Flow excluding one-offs for the second quarter of 2024
- Cash Flow excluding one-offs for the first half of 2024
In thousands of euros Reported Restructuring
costs
One Off's
Adjusted
Transaction
costs Total one-offs Reported excl.
One-offs Reported Reported excl.
One-offs Reported Reported excl.
One-offs
Reported Group Profit 14,841 9,171 15,669 23,597 48,437 63,278 38,167 46,158 -61% 37%
Depreciation and Amortization 113,786 192 (9,513) - (9,321) 104,464 108,823 108,823 5% -4%
Net Provisions 40,220 - - - - 40,220 5,425 10,292 641% 291%
Other Adjustments and Other Changes in Working Capital (80,290) 2,497 13,263 4,036 19,796 (60,495) (66,872) (64,614) -20% 6%
Change in Operating Working Capital 164,304 (2,652) 11,207 11,040 19,595 183,899 (126,790) (129,923) 230% 242%
Changes in Inventories (2,772) - 13,883 - 13,883 11,111 (125,209) (144,039) 98% 108%
Change in Trade Receivables 64,011 - - - - 64,011 (167,190) (122,451) 138% 152%
Change in Trade Payables 103,065 (2,652) (2,676) 11,040 5,712 108,777 210,307 195,423 -51% -44%
Net Cash Flow From Operating Activities 252,861 9,208 30,626 38,673 78,505 331,366 (18,898) 165 1438% 201309%
Business Combinations and Investments in Group Companies 1,445,351 - - - - 1,445,351 - - - -
CAPEX (43,066) - - - - (43,066) (44,573) (44,573) 3% 3%
R&D/Other Intangible Assets (41,247) - - - - (41,247) (19,879) (19,879) -107% -107%
Other Cash Inflow / (Outflow) (11,709) - - - - (11,709) 12,714 12,714 -192% -192%
Net Cash Flow From Investing Activities 1,349,329 - - - - 1,349,329 (51,738) (51,738) 2708% 2708%
Free Cash Flow 9,208 1,602,190 30,626 38,673 78,506 1,680,695 (70,636) (51,573) 2368% 3359%
Issue / (Repayment) of Debt 49,861 - - - - 49,861 188,580 188,580 -74% -74%
Capital Grants 2,004 - - - - 2,004 42 42 4645% 4645%
Dividends (Paid) / Received - - - - - - 2,105 2,105 -100% -100%
Other Cash Flows From / (Used in) Financing Activities 7,574 - - - - 7,574 (5,799) (5,799) 231% 231%
Net Cash Flow From Financing Activities 59,439 - - - 59,439 - 184,928 184,928 -68% -68%
Total Cash Flow 1,661,629 9,208 30,626 38,673 78,506 1,740,134 114,292 133,354 1354% 1205%
Cash and Cash Equivalents at the Beginning of the Period 448,545 - - - - 448,545 425,655 425,655 5% 5%
Effect of Exchange Rate Changes in Cash and Cash Equivalents 3,046 - - - - 3,046 (137) (137) 2329% 2329%
Cash and Cash Equivalents at the End of the Period 2,113,220 9,208 30,626 38,673 78,506 2,191,726 539,810 558,872 291% 292%
Q2 2024 Q2 2023 % vs PY
Grifols Grifols Grifols
In thousands of euros Reported Restructuring costs One Off's Adjusted Transaction costs Total one-offs Reported excl. One-offs Reported Reported excl. One-offs Reported Reported excl. One-offs
Reported Group Profit 36,259 9,171 15,669 23,597 48,437 84,696 (70,099) 35,561 152% 138%
Depreciation and Amortization 219,402 192 (9,513) - (9,321) 210,080 228,636 228,636 -4% -8%
Net Provisions - 54,886 - - - 54,886 75,840 41,728 -28% 32%
Other Adjustments and Other Changes in Working Capital (47,656) 2,960 23,196 7,866 34,022 (13,635) (44,698) (14,997) -7% 9%
Change in Operating Working Capital (174,952) (4,346) (2,676) 5,514 (1,508) (176,460) (270,039) (273,172) 35% 35%
Changes in Inventories (132,882) - - - - (132,882) (187,225) (187,225) 29% 29%
Change in Trade Receivables (89,669) - - - - (89,669) (127,523) (108,693) 30% 18%
Change in Trade Payables 47,599 (4,346) (2,676) 5,514 (1,508) 46,091 44,709 22,746 6% 103%
Net Cash Flow From Operating Activities 87,939 7,977 26,676 36,976 71,628 159,567 (80,360) 17,757 209% 799%
Business Combinations and Investments in Group Companies 1,425,131 - - - - 1,425,131 - - - -
CAPEX - (81,116) - - - (81,116) (87,312) (87,312) 7% 7%
R&D/Other Intangible Assets (63,251) - - - - (63,251) (40,671) (40,671) -56% -56%
Other Cash Inflow / (Outflow) (19,387) - - - - (19,387) (6,792) (6,792) -185% -185%
Net Cash Flow From Investing Activities 1,261,377 - - - - 1,261,377 (134,775) (134,775) 1036% 1036%
Free Cash Flow 7,977 1,349,316 26,676 36,976 71,628 1,420,944 (215,135) (117,018) 727% 1314%
Issue / (Repayment) of Debt 203,586 - - - - 203,586 210,464 210,464 -3% -3%
Capital Grants - 5,699 - - - 5,699 1,367 1,367 317% 317%
Dividends (Paid) / Received - - - - - - 2,105 2,105 -100% -100%
Other Cash Flows From / (Used in) Financing Activities 15,610 - - - - 15,610 - - - -
Net Cash Flow From Financing Activities 224,895 - - - 224,895 - 213,936 213,936 5% 5%
Total Cash Flow 1,574,211 7,977 26,676 36,976 71,628 1,645,839 (1,199) 96,917 131391% 1598%
Cash and Cash Equivalents at the Beginning of the Period 529,577 - - - - 529,577 549,207 549,207 -4% -4%
Effect of Exchange Rate Changes in Cash and Cash Equivalents 9,432 - - - - 9,432 (6,968) (6,968) 235% 235%
Cash and Cash Equivalents at the End of the Period 2,113,220 7,977 26,676 36,976 71,628 2,184,848 541,040 639,156 291% 242%
Grifols Combined
% vs PY
Grifols Combined
H1 2024
Grifols Combined
H1 2023 |
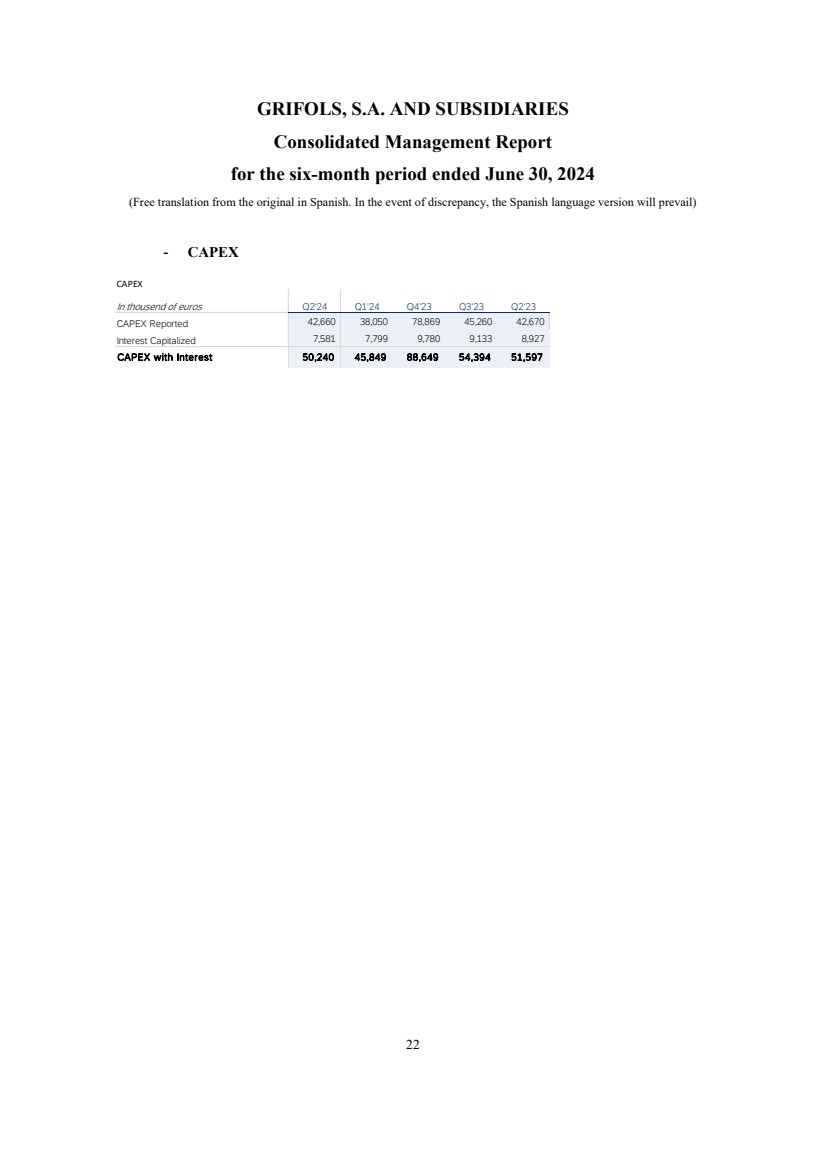
| GRIFOLS, S.A. AND SUBSIDIARIES
Consolidated Management Report
for the six-month period ended June 30, 2024
(Free translation from the original in Spanish. In the event of discrepancy, the Spanish language version will prevail)
22
- CAPEX
CAPEX
In thousend of euros Q2'24 Q1'24 Q4'23 Q3'23 Q2'23
CAPEX Reported 38,050 42,660 78,869 45,260 42,670
Interest Capitalized 7,799 7,581 9,780 9,133 8,927
CAPEX with Interest 50,240 45,849 88,649 54,394 51,597 |
| GRIFOLS, S.A. AND SUBSIDIARIES
At their meeting held on 29 July 2024, pursuant to legal requirements, the Directors of
Grifols, S.A. authorized for issue the condensed consolidated interim financial statements
and consolidated directors’ report for the period from 1 January 2024 to 30 June 2024.
Thomas Glanzmann
Executive Chairman
Jose Ignacio Abia
CEO
Raimon Grifols Roura
Board member
Victor Grifols Deu Albert Grifols Coma-Cros
Montserrat Muñoz Abellana
Board member Board member Board member
Tomás Dagà Gelabert Iñigo Sánchez-Asiaín
Mardones
Enriqueta Felip Font
Board member Board member Board member
Susana González
Rodríguez
Anne-Catherine Berner
Board member Board member
Nuria Martín Barnés
Secretary of the Board |
SIGNATURES
Pursuant to the
requirements of the Securities Exchange Act of 1934, the registrant has duly caused this report to be signed on its behalf by the undersigned,
thereto duly authorized.
| |
Grifols, S.A. |
| |
|
|
| |
By: |
/s/
David I. Bell |
| |
|
Name: |
David I. Bell |
| |
|
Title: |
Authorized Signatory |
Date: July 30, 2024
Grifols (NASDAQ:GRFS)
過去 株価チャート
から 7 2024 まで 7 2024

Grifols (NASDAQ:GRFS)
過去 株価チャート
から 7 2023 まで 7 2024
