Valvoline’s Board of Directors
Composition
Our business and affairs are managed under the direction of our Board. Our Corporate Governance Guidelines require that two-thirds of our directors be independent, as defined in our Director Independence Standards (published on our investor relations website at http://investors.valvoline.com/governance) (“Independence Standards”), which incorporate the requirements of SEC rules and NYSE listing standards. Within this framework, the Governance & Nominating Committee (the “G&N Committee”) is charged with determining and refreshing, as appropriate, the composition of our Board. The G&N Committee seeks to fill our Board with exceptionally talented and diverse directors, with expertise and leadership experience in the markets in which we operate.
Our Board currently consists of the following nine members: Gerald W. Evans, Jr., Lori A. Flees, Richard J. Freeland, Carol H. Kruse, Vada O. Manager, Patrick S. Pacious, Jennifer L. Slater, Charles M. Sonsteby, and Mary J. Twinem. All of the directors were elected at the 2023 Annual Meeting of Shareholders, other than Mr. Pacious and Ms. Flees, who were appointed to the Board, effective July 11, 2023 and October 1, 2023, respectively. Ms. Flees succeeds Samuel J. Mitchell, Jr. who retired as Chief Executive Officer and as a director, effective September 30, 2023. Each of the current directors has been nominated for election at the 2024 Annual Meeting.
See the “Proposal One—Election of Directors” section of this Proxy Statement.
During fiscal 2023, nine meetings of the Board were held. On average, our directors attended 96% of the total meetings of the Board and the Committees on which they serve. No director attended less than 75% of such meetings.
Leadership Structure
Our Amended and Restated By-Laws (“By-Laws”) provide the Board flexibility in determining the appropriate leadership structure for the Company. Currently, Ms. Flees serves as our Chief Executive Officer and Mr. Freeland serves as Chair of the Board, a role he has held since the 2022 Annual Meeting. The Board currently believes that separating the roles of Chair and Chief Executive Officer is in the best interest of the Company because it allows our Chief Executive Officer to focus on operating and managing the day-to-day activities of our business, while the Chair can focus on Board leadership independent of management.
Independence
Our Corporate Governance Guidelines require that two-thirds of our directors be independent, as defined in the Independence Standards. The Independence Standards incorporate the requirements of SEC rules and NYSE listing standards and were adopted by our Board to assist in its determination of director independence. Pursuant to these rules, our Board must make an affirmative determination that those members of the Board who serve as independent directors have no material relationship with the Company (either directly or as a partner, shareholder or officer of an organization that has a relationship with the Company). Members of the Audit and Compensation Committees are also subject to heightened standards for independence under SEC rules and NYSE listing standards.
Our Board annually reviews director independence in accordance with these requirements. In making its independence determinations, the Board considered relationships and transactions between each director, on the one hand, and Valvoline, its subsidiaries and its affiliates, on the other hand, including the director’s commercial, economic, charitable and familial relationships. As a result of this review, the Board affirmatively determined that Mses. Kruse, Slater, and Twinem and Messrs. Evans, Freeland, Manager, Pacious and Sonsteby are each independent of Valvoline and its affiliates. Ms. Flees was determined not to be independent because she currently serves as Chief Executive Officer of the Company.
|
|
|
|
|
|
|
|
|
|
|
16 PROXY STATEMENT |
|

|
|
|
|
|
compensation policies and procedures. To provide for effective oversight of the Company’s strategy, initiatives and policies regarding environmental, social and governance (“ESG”) matters, the G&N Committee is responsible for the review and oversight of ESG matters. As part of this responsibility, the G&N Committee assists the Board in fulfilling its oversight responsibility with respect to environmental, health and safety (“EH&S”) risks and programs and diversity, equity and inclusion efforts, each of which are reviewed by the G&N Committee at least twice per year. The G&N Committee is also charged with reviewing and recommending governance policies and procedures, including Board and Committee structure, leadership and membership, that ensure independence of the Board as it exercises its corporate governance and risk oversight roles. In addition, the G&N Committee reviews transactions pursuant to our Related Person Transaction Policy (which is further described in “—Other Governance Policies and Practices—Related Person Transaction Policy”).
The Board’s Role in ESG Oversight
Valvoline recognizes the importance of being a good corporate citizen and we strive to run our business in a responsible manner, reduce our environmental impact and create a diverse and vibrant workforce. We believe that ESG matters are intimately intertwined with our business and believe that a strategy that recognizes the importance of each ESG pillar is in the best interests of Valvoline and our stakeholders.
As part of the G&N Committee’s oversight responsibilities related to ESG matters, the G&N Committee reviewed and discussed a number of ESG matters with senior management in fiscal 2023. These topics included EH&S matters, including Valvoline’s sustainability initiatives and safety performance; ethics and compliance, including Valvoline’s focus on anti-bribery/corruption, data protection and privacy compliance, and key legal compliance risks and initiatives to mitigate such risks; diversity, equity and inclusion, including supplier diversity and charitable giving to diverse organizations; and governance matters, including corporate governance responsibilities of the Board, overseeing the CEO and senior management succession planning process, and reviewing trends in corporate governance.
In December 2022, the Company established an internal ESG and Equality Council (the “Council”) to guide and support the Company’s continued progress on ESG initiatives in connection with the Company’s transition to a pure-play retail services business. The Council reports to the G&N Committee and is led by Julie O’Daniel, Senior Vice President, Chief Legal Officer and Corporate Secretary of the Company. Valvoline Director, Ms. Kruse, and senior management with relevant subject matter expertise are also members of the Council. The Council will focus on strengthening the Company’s commitment to diversity, equity and inclusion and will work to further Valvoline’s efforts to integrate sustainability into the Company’s business operations.
Other Governance Policies and Practices
Overview of Governance Principles
We are committed to adhering to sound corporate governance practices. We have adopted Corporate Governance Guidelines, which include our Related Person Transaction Policy. These Guidelines provide the framework for our Board’s governance of the Company and include a general description of our Board’s purpose, responsibilities and member qualification standards. As further discussed in “—Valvoline’s Board of Directors—Independence,” our Corporate Governance Guidelines require that at least two-thirds of our directors be independent. Our Related Person Transaction Policy requires our directors and executive officers to identify annually and on an as needed basis potential transactions with related persons or their firms that meet certain criteria set forth in our Related Person Transaction Policy.
We also require compliance with our code of business conduct, entitled “Global Standards of Business Conduct,” which applies to all of our directors and employees, including our principal executive officer, principal financial officer, principal accounting officer and persons performing similar functions. Our Global Standards of Business Conduct promote honest and ethical conduct, compliance with applicable laws, rules and regulations, prompt reporting of violations of the standards set forth therein and full, fair, accurate, timely and understandable disclosure in reports filed with the SEC.
|
|
|
|
|
|
|
|
|
|
|
|
|
|
|
PROXY STATEMENT 21 |
|
|
The Pension Plan operated in conjunction with the Ashland Inc. Leveraged Employee Stock Ownership Plan (the “LESOP”) for eligible participants. The LESOP transferred to Valvoline upon separation from Ashland. Effective May 1, 2017, Valvoline merged the LESOP into the Valvoline Inc. 401(k) Plan. Provisions for coordination with the Pension Plan remained unchanged.
Traditional Benefit/Annuity Formula
Under this formula, for certain highly compensated employees, compensation only includes base compensation, up to the maximum amount allowed under Code Section 401(a)(17). For all other participants, compensation includes base compensation and bonus amounts. This applies to both the annuity formula and the cash balance formula.
The final average compensation formula is the average for a 48-consecutive month period producing the highest average for the last 120 months of credited service.
The annual annuity benefit formula is:
(1.08% x final average compensation up to $10,700) + (1.5% x final average compensation exceeding $10,700)
×
(years of credited service, which means years as a participant in the plan up to a maximum of 35 years)
The normal form of benefit payment under the annuity benefit is a single life annuity. However, as required by federal law, the normal form of benefit for a married participant is a joint and survivor annuity, unless the spouse consents to a different benefit distribution. A participant may also elect a non-spousal joint and survivor annuity or a 10-year term certain annuity. All payment forms are actuarially equivalent.
The normal retirement age is 65, but an unreduced benefit is paid for retirement at age 62. A participant may retire early once the participant is either at least age 55 or when the sum of the participant’s age and service equals at least 80.
Retirement Growth Account Benefit/Cash Balance Formula
Under this formula, contribution credits are accumulated in a notional account. Interest credits are allocated to each participant’s account monthly. The interest rate is from a minimum of 4.0% to a maximum of 7.0% and is set at the beginning of each plan year. The interest rate for fiscal 2023 was 4.9%.
The accrued benefit under this formula is the balance in the retirement growth account. The benefit is payable in the same forms that apply to the annuity benefit formula or may be paid as a single lump sum.
The normal retirement age under the retirement growth account formula is also age 65. The earliest that a participant can receive an unreduced benefit is at age 55 with at least five years of service.
Non-Qualified Excess Defined Benefit Pension Plan (“Excess Plan”)
The Excess Plan is an unfunded, non-qualified pension plan providing a benefit payable, based on the applicable Named Executive Officer’s pension plan eligibility, equal to the difference between the benefit under the Pension Plan in the absence of the Code limits (the gross benefit) and the actual benefit that would be payable under the Pension Plan.
The Excess Plan covers employees (i) who are eligible for the Pension Plan and whose benefit under the Pension Plan were limited because of either Code Section 401(a)(17) or Section 415(b) and (ii) who are not terminated for cause as defined in the Excess Plan. For purposes of computing the Excess Plan benefits, a participant’s compensation is defined the same as it is for the Pension Plan. However, the limits on the compensation under the Pension Plan that are imposed by the Code do not apply under the Excess Plan.
|
|
|
|
|
|
|
|
|
|
|
|
|
|
|
PROXY STATEMENT 55 |
|
|
Pay vs Performance Disclosure
|
12 Months Ended |
|
Sep. 30, 2023
USD ($)
|
Sep. 30, 2022
USD ($)
|
Sep. 30, 2021
USD ($)
|
| Pay vs Performance Disclosure |
|
|
|
| Pay vs Performance Disclosure, Table |
As required by Section 953(a) of the Dodd-Frank Wall Street Reform and Consumer Protection Act, and Item 402(v) of Regulation S-K, we are providing the following information about the relationship between executive “Compensation Actually Paid” and certain financial performance of the Company. For further information concerning the Company’s pay for performance philosophy and how the Company aligns executive compensation with the Company’s performance, see “Executive Compensation—Compensation Discussion and Analysis.”
|
|
|
|
|
|
|
|
|
|
|
|
|
|
|
|
|
|
|
|
|
|
|
|
|
|
|
|
|
|
|
|
|
| |
|
Summary
Compensation
Table Total for
PEO
($)
(1) |
|
|
Compensation
Actually Paid
to PEO
($)
(2) |
|
|
Average Summary Compensation Table Total for Non-PEO NEOs ($) (3) |
|
|
Average Compensation Actually Paid to Non-PEO NEOs ($) (4) |
|
|
Value of Initial Fixed $100
Investment on
October 1, 2020
Based On: |
|
|
|
|
|
|
|
| |
Total
Shareholder
Return
($)
(5) |
|
|
Peer Group
Total
Shareholder
Return
($)
(6) |
|
| |
|
|
|
|
|
|
|
|
| |
|
|
5,316,809 |
|
|
|
7,367,248 |
|
|
|
1,624,911 |
|
|
|
1,918,832 |
|
|
|
176 |
|
|
|
133 |
|
|
|
1,411 |
|
|
|
1.18 |
|
| |
|
|
|
|
|
|
|
|
| |
|
|
5,294,758 |
|
|
|
3,249,815 |
|
|
|
1,615,493 |
|
|
|
1,334,444 |
|
|
|
138 |
|
|
|
117 |
|
|
|
424 |
|
|
|
2.06 |
|
| |
|
|
|
|
|
|
|
|
| |
|
|
5,747,615 |
|
|
|
12,776,238 |
|
|
|
1,297,534 |
|
|
|
2,210,204 |
|
|
|
167 |
|
|
|
140 |
|
|
|
420 |
|
|
|
1.73 |
|
| (1) |
Represents the amount reported for each of the corresponding years in the “Total” column of the Summary Compensation Table for Mr. Mitchell, the Company’s CEO. |
| (2) |
Represents the amount of “Compensation Actually Paid” to Mr. Mitchell, as computed in accordance with Item 402(v) of Regulation S-K. This amount does not reflect the total compensation actually realized or received by Mr. Mitchell. In accordance with Item 402(v) of Regulation S-K, these amounts reflect “Total” compensation as set forth in the Summary Compensation Table for each year, adjusted as shown below. Equity values are calculated in accordance with FASB ASC Topic 718, and the valuation assumptions used to calculate fair values did not materially differ from those disclosed at the time of grant. |
|
|
|
|
|
|
|
|
|
|
|
|
|
| |
|
|
|
Compensation Actually Paid to PEO |
|
|
|
|
|
|
|
|
|
| |
|
|
|
| Summary Compensation Table Total |
|
|
5,316,809 |
|
|
|
5,294,758 |
|
|
|
5,747,615 |
|
| |
|
|
|
| Less, value of “Stock Awards” and “Option Awards” reported in Summary Compensation Table |
|
|
(2,941,867 |
) |
|
|
(2,963,993 |
) |
|
|
(2,992,063 |
) |
| |
|
|
|
Less, change in pension value and Non-Qualified Deferred Compensation earnings |
|
|
0 |
|
|
|
0 |
|
|
|
0 |
|
| |
|
|
|
Plus, year-end fair value of outstanding and unvested equity awards granted in the year |
|
|
2,746,714 |
|
|
|
2,284,525 |
|
|
|
5,891,221 |
|
| |
|
|
|
| Plus (less), year over year change in fair value of outstanding and unvested equity awards granted in prior years |
|
|
717,627 |
|
|
|
(948,953 |
) |
|
|
2,462,219 |
|
| |
|
|
|
| Plus (less), year over year change in fair value of equity awards granted in prior years that vested in the year |
|
|
1,521,859 |
|
|
|
(444,178 |
) |
|
|
1,632,946 |
|
| |
|
|
|
| Plus, change in dividends accrued |
|
|
6,107 |
|
|
|
27,656 |
|
|
|
34,301 |
|
| |
|
|
|
Compensation Actually Paid to Mr. Mitchell |
|
|
7,367,248 |
|
|
|
3,249,815 |
|
|
|
12,776,238 |
|
| (3) |
Represents the average of the amounts reported for the Company’s named executive officers (NEOs) as a group (excluding Mr. Mitchell) for each of the corresponding years in the “Total” column of the Summary Compensation Table. The names of each of the NEOs included for these purposes in each applicable year are as follows: |
|
|
|
|
|
|
|
|
| Year |
|
PEO |
|
NEOs included in Average |
| 2023 |
|
Samuel J. Mitchell, Jr. |
|
Mary E. Meixelsperger, Lori A Flees, Julie M. O’Daniel, Heidi J. Matheys, |
| 2022 |
|
Samuel J. Mitchell, Jr. |
|
Mary E. Meixelsperger, Lori A Flees, Julie M. O’Daniel, Jamal K. Muashsher |
| 2021 |
|
Samuel J. Mitchell, Jr. |
|
Mary E. Meixelsperger, Julie M. O’Daniel, Crag A. Moughler, Thomas A. Gerrald II, Anthony Puckett |
| (4) |
Represents the average amount of “Compensation Actually Paid” to the NEOs as a group (excluding Mr. Mitchell), as computed in accordance with Item 402(v) of Regulation S-K. In accordance with Item 402(v) of Regulation S-K, these amounts reflect “Total” compensation as set forth in the Summary Compensation Table for each year, adjusted as shown below. Equity values are calculated in accordance with FASB ASC Topic 718, and the valuation assumptions used to calculate fair values did not materially differ from those disclosed at the time of the grant. |
|
|
|
|
|
|
|
|
|
|
|
|
|
| |
|
|
|
Average Compensation Actually Paid to Non-PEO NEOs |
|
|
|
|
|
|
|
|
|
| |
|
|
|
| Average Summary Compensation Table Total |
|
|
1,624,911 |
|
|
|
1,615,493 |
|
|
|
1,297,534 |
|
| |
|
|
|
| Less, average value of “Stock Awards” and “Option Awards” reported in Summary Compensation Table |
|
|
(628,597 |
) |
|
|
(639,430 |
) |
|
|
(385,342 |
) |
| |
|
|
|
Less, change in pension value and Non-Qualified Deferred Compensation earnings |
|
|
(354 |
) |
|
|
(278 |
) |
|
|
(7,487 |
) |
| |
|
|
|
Plus, average year-end fair value of outstanding and unvested equity awards granted in the year |
|
|
586,898 |
|
|
|
519,947 |
|
|
|
717,368 |
|
| |
|
|
|
| Plus (less), average year over year change in fair value of outstanding and unvested equity awards granted in prior years |
|
|
145,078 |
|
|
|
(111,663 |
) |
|
|
375,239 |
|
| |
|
|
|
| Plus (less), average year over year change in fair value of equity awards granted in prior years that vested in the year |
|
|
189,379 |
|
|
|
(54,158 |
) |
|
|
206,265 |
|
| |
|
|
|
| Plus, change in dividends accrued |
|
|
1,517 |
|
|
|
4,534 |
|
|
|
6,628 |
|
| |
|
|
|
Average Compensation Actually Paid to Non-PEO NEOs |
|
|
1,918,832 |
|
|
|
1,334,444 |
|
|
|
2,210,204 |
|
| (5) |
Total Shareholder Return (TSR) is calculated by dividing (a) the sum of (i) the cumulative amount of dividends for the measurement period, assuming dividend reinvestment, and (ii) the difference between the Company’s share price at the end of each fiscal year shown and the beginning of the measurement period, and the beginning of the measurement period by (b) the Company’s share price at the beginning of the measurement period. The beginning of the measurement period for each year in the table is October 1, 2020. |
| (6) |
The peer group used for this purpose is the following published industry index: S&P Midcap 400 Index. |
| (7) |
Represents the amount of Net Income reflected in the Company’s audited financial statements for the applicable year. In fiscal 2023, the Company sold the Valvoline Global Products business, which created a significant increase to Net Income from the gain on the sale. |
| (8) |
Adjusted EPS is a non-GAAP measure. In fiscal 2023, Adjusted EPS reflects adjustments made following the sale of the Valvoline Global Products business. Adjusted EPS is defined as diluted earnings per share calculated using adjusted income from continuing operations. |
|
|
|
| Company Selected Measure Name |
Adjusted EPS
|
|
|
| Named Executive Officers, Footnote |
| (3) |
Represents the average of the amounts reported for the Company’s named executive officers (NEOs) as a group (excluding Mr. Mitchell) for each of the corresponding years in the “Total” column of the Summary Compensation Table. The names of each of the NEOs included for these purposes in each applicable year are as follows: |
|
|
|
|
|
|
|
|
| Year |
|
PEO |
|
NEOs included in Average |
| 2023 |
|
Samuel J. Mitchell, Jr. |
|
Mary E. Meixelsperger, Lori A Flees, Julie M. O’Daniel, Heidi J. Matheys, |
| 2022 |
|
Samuel J. Mitchell, Jr. |
|
Mary E. Meixelsperger, Lori A Flees, Julie M. O’Daniel, Jamal K. Muashsher |
| 2021 |
|
Samuel J. Mitchell, Jr. |
|
Mary E. Meixelsperger, Julie M. O’Daniel, Crag A. Moughler, Thomas A. Gerrald II, Anthony Puckett |
|
|
|
| Peer Group Issuers, Footnote |
The peer group used for this purpose is the following published industry index: S&P Midcap 400 Index.
|
|
|
| PEO Total Compensation Amount |
$ 5,316,809
|
$ 5,294,758
|
$ 5,747,615
|
| PEO Actually Paid Compensation Amount |
$ 7,367,248
|
3,249,815
|
12,776,238
|
| Adjustment To PEO Compensation, Footnote |
Represents the amount of “Compensation Actually Paid” to Mr. Mitchell, as computed in accordance with Item 402(v) of Regulation S-K. This amount does not reflect the total compensation actually realized or received by Mr. Mitchell. In accordance with Item 402(v) of Regulation S-K, these amounts reflect “Total” compensation as set forth in the Summary Compensation Table for each year, adjusted as shown below. Equity values are calculated in accordance with FASB ASC Topic 718, and the valuation assumptions used to calculate fair values did not materially differ from those disclosed at the time of grant.
|
|
|
|
|
|
|
|
|
|
|
|
|
| |
|
|
|
Compensation Actually Paid to PEO |
|
|
|
|
|
|
|
|
|
| |
|
|
|
| Summary Compensation Table Total |
|
|
5,316,809 |
|
|
|
5,294,758 |
|
|
|
5,747,615 |
|
| |
|
|
|
| Less, value of “Stock Awards” and “Option Awards” reported in Summary Compensation Table |
|
|
(2,941,867 |
) |
|
|
(2,963,993 |
) |
|
|
(2,992,063 |
) |
| |
|
|
|
Less, change in pension value and Non-Qualified Deferred Compensation earnings |
|
|
0 |
|
|
|
0 |
|
|
|
0 |
|
| |
|
|
|
Plus, year-end fair value of outstanding and unvested equity awards granted in the year |
|
|
2,746,714 |
|
|
|
2,284,525 |
|
|
|
5,891,221 |
|
| |
|
|
|
| Plus (less), year over year change in fair value of outstanding and unvested equity awards granted in prior years |
|
|
717,627 |
|
|
|
(948,953 |
) |
|
|
2,462,219 |
|
| |
|
|
|
| Plus (less), year over year change in fair value of equity awards granted in prior years that vested in the year |
|
|
1,521,859 |
|
|
|
(444,178 |
) |
|
|
1,632,946 |
|
| |
|
|
|
| Plus, change in dividends accrued |
|
|
6,107 |
|
|
|
27,656 |
|
|
|
34,301 |
|
| |
|
|
|
Compensation Actually Paid to Mr. Mitchell |
|
|
7,367,248 |
|
|
|
3,249,815 |
|
|
|
12,776,238 |
|
|
|
|
| Non-PEO NEO Average Total Compensation Amount |
$ 1,624,911
|
1,615,493
|
1,297,534
|
| Non-PEO NEO Average Compensation Actually Paid Amount |
$ 1,918,832
|
1,334,444
|
2,210,204
|
| Adjustment to Non-PEO NEO Compensation Footnote |
Represents the average amount of “Compensation Actually Paid” to the NEOs as a group (excluding Mr. Mitchell), as computed in accordance with Item 402(v) of Regulation S-K. In accordance with Item 402(v) of Regulation S-K, these amounts reflect “Total” compensation as set forth in the Summary Compensation Table for each year, adjusted as shown below. Equity values are calculated in accordance with FASB ASC Topic 718, and the valuation assumptions used to calculate fair values did not materially differ from those disclosed at the time of the grant.
|
|
|
|
|
|
|
|
|
|
|
|
|
| |
|
|
|
Average Compensation Actually Paid to Non-PEO NEOs |
|
|
|
|
|
|
|
|
|
| |
|
|
|
| Average Summary Compensation Table Total |
|
|
1,624,911 |
|
|
|
1,615,493 |
|
|
|
1,297,534 |
|
| |
|
|
|
| Less, average value of “Stock Awards” and “Option Awards” reported in Summary Compensation Table |
|
|
(628,597 |
) |
|
|
(639,430 |
) |
|
|
(385,342 |
) |
| |
|
|
|
Less, change in pension value and Non-Qualified Deferred Compensation earnings |
|
|
(354 |
) |
|
|
(278 |
) |
|
|
(7,487 |
) |
| |
|
|
|
Plus, average year-end fair value of outstanding and unvested equity awards granted in the year |
|
|
586,898 |
|
|
|
519,947 |
|
|
|
717,368 |
|
| |
|
|
|
| Plus (less), average year over year change in fair value of outstanding and unvested equity awards granted in prior years |
|
|
145,078 |
|
|
|
(111,663 |
) |
|
|
375,239 |
|
| |
|
|
|
| Plus (less), average year over year change in fair value of equity awards granted in prior years that vested in the year |
|
|
189,379 |
|
|
|
(54,158 |
) |
|
|
206,265 |
|
| |
|
|
|
| Plus, change in dividends accrued |
|
|
1,517 |
|
|
|
4,534 |
|
|
|
6,628 |
|
| |
|
|
|
Average Compensation Actually Paid to Non-PEO NEOs |
|
|
1,918,832 |
|
|
|
1,334,444 |
|
|
|
2,210,204 |
|
|
|
|
| Compensation Actually Paid vs. Total Shareholder Return |
Compensation Actually Paid vs. Company TSR and Peer Group TSR The following graph provides an illustration of the relationship between Compensation Actually Paid for the PEO and average non-PEO NEO and the Total Shareholder Return of Valvoline and the S&P MidCap 400 Index for the fiscal years ended September 30, 2023, 2022, and 2021.

|
|
|
| Compensation Actually Paid vs. Net Income |
Compensation Actually Paid and Net Income The following graph provides an illustration of the relationship between Compensation Actually Paid for the PEO and average non-PEO NEO and the Company’s Net Income for the fiscal years ended September 30, 2023, 2022, and 2021.

|
|
|
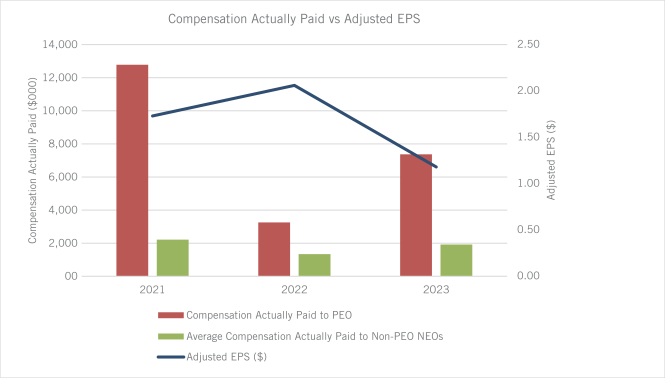
| Compensation Actually Paid vs. Company Selected Measure |
Compensation Actually Paid and Adjusted EPS The following graph provides an illustration of the relationship between Compensation Actually Paid for the PEO and average non-PEO NEO and the Company’s Adjusted EPS for the fiscal years ended September 30, 2023, 2022, and 2021.
|
|
|
| Total Shareholder Return Vs Peer Group |
Compensation Actually Paid vs. Company TSR and Peer Group TSR The following graph provides an illustration of the relationship between Compensation Actually Paid for the PEO and average non-PEO NEO and the Total Shareholder Return of Valvoline and the S&P MidCap 400 Index for the fiscal years ended September 30, 2023, 2022, and 2021.
|
|
|
| Tabular List, Table |
Financial Performance Measures As described in greater detail under “Executive Compensation—Compensation Discussion and Analysis,” the Company’s executive compensation program reflects a variable philosophy. The metrics that the Company uses for both our long-term and short-term incentive awards are selected based on an objective of incentivizing our NEOs to increase the value of our enterprise for our shareholders. The most important financial performance measures used by the Company to link executive compensation actually paid to the Company’s NEOs, for the most recently completed fiscal year, to the Company’s performance are as follows:
|
|
|
| Total Shareholder Return Amount |
$ 176
|
138
|
167
|
| Peer Group Total Shareholder Return Amount |
133
|
117
|
140
|
| Net Income (Loss) |
$ 1,411,000,000
|
$ 424,000,000
|
$ 420,000,000
|
| Company Selected Measure Amount |
1.18
|
2.06
|
1.73
|
| PEO Name |
Samuel J. Mitchell, Jr.
|
Samuel J. Mitchell, Jr.
|
Samuel J. Mitchell, Jr.
|
| Measure:: 1 |
|
|
|
| Pay vs Performance Disclosure |
|
|
|
| Name |
Adjusted EPS
|
|
|
| Non-GAAP Measure Description |
Adjusted EPS is a non-GAAP measure. In fiscal 2023, Adjusted EPS reflects adjustments made following the sale of the Valvoline Global Products business. Adjusted EPS is defined as diluted earnings per share calculated using adjusted income from continuing operations.
|
|
|
| Measure:: 2 |
|
|
|
| Pay vs Performance Disclosure |
|
|
|
| Name |
Adjusted Net Income
|
|
|
| Measure:: 3 |
|
|
|
| Pay vs Performance Disclosure |
|
|
|
| Name |
Net Sales
|
|
|
| Measure:: 4 |
|
|
|
| Pay vs Performance Disclosure |
|
|
|
| Name |
Adjusted EBIT
|
|
|
| Measure:: 5 |
|
|
|
| Pay vs Performance Disclosure |
|
|
|
| Name |
TSR
|
|
|
| PEO | Value of Stock Awards and Option Awards Reported in Summary Compensation Table [Member] |
|
|
|
| Pay vs Performance Disclosure |
|
|
|
| Adjustment to Compensation, Amount |
$ (2,941,867)
|
$ (2,963,993)
|
$ (2,992,063)
|
| PEO | Change in Pension Value and Non Qualified Deferred Compensation Earnings [Member] |
|
|
|
| Pay vs Performance Disclosure |
|
|
|
| Adjustment to Compensation, Amount |
0
|
0
|
0
|
| PEO | Year End Fair Value of Outstanding and Unvested Equity Awards Granted in the Year [Member] |
|
|
|
| Pay vs Performance Disclosure |
|
|
|
| Adjustment to Compensation, Amount |
2,746,714
|
2,284,525
|
5,891,221
|
| PEO | Year Over Year Change In Fair Value Of Outstanding And Unvested Equity Awards Granted In Prior Years [Member] |
|
|
|
| Pay vs Performance Disclosure |
|
|
|
| Adjustment to Compensation, Amount |
717,627
|
(948,953)
|
2,462,219
|
| PEO | Year Over Year Change in Fair Value of Equity Awards Granted in Prior Years that Vested in the Year [Member] |
|
|
|
| Pay vs Performance Disclosure |
|
|
|
| Adjustment to Compensation, Amount |
1,521,859
|
(444,178)
|
1,632,946
|
| PEO | Change in Dividends Accrued [Member] |
|
|
|
| Pay vs Performance Disclosure |
|
|
|
| Adjustment to Compensation, Amount |
6,107
|
27,656
|
34,301
|
| Non-PEO NEO | Value of Stock Awards and Option Awards Reported in Summary Compensation Table [Member] |
|
|
|
| Pay vs Performance Disclosure |
|
|
|
| Adjustment to Compensation, Amount |
(628,597)
|
(639,430)
|
(385,342)
|
| Non-PEO NEO | Change in Pension Value and Non Qualified Deferred Compensation Earnings [Member] |
|
|
|
| Pay vs Performance Disclosure |
|
|
|
| Adjustment to Compensation, Amount |
(354)
|
(278)
|
(7,487)
|
| Non-PEO NEO | Year End Fair Value of Outstanding and Unvested Equity Awards Granted in the Year [Member] |
|
|
|
| Pay vs Performance Disclosure |
|
|
|
| Adjustment to Compensation, Amount |
586,898
|
519,947
|
717,368
|
| Non-PEO NEO | Year Over Year Change In Fair Value Of Outstanding And Unvested Equity Awards Granted In Prior Years [Member] |
|
|
|
| Pay vs Performance Disclosure |
|
|
|
| Adjustment to Compensation, Amount |
145,078
|
(111,663)
|
375,239
|
| Non-PEO NEO | Year Over Year Change in Fair Value of Equity Awards Granted in Prior Years that Vested in the Year [Member] |
|
|
|
| Pay vs Performance Disclosure |
|
|
|
| Adjustment to Compensation, Amount |
189,379
|
(54,158)
|
206,265
|
| Non-PEO NEO | Change in Dividends Accrued [Member] |
|
|
|
| Pay vs Performance Disclosure |
|
|
|
| Adjustment to Compensation, Amount |
$ 1,517
|
$ 4,534
|
$ 6,628
|