 US Market News
3週前
US Market News
3週前
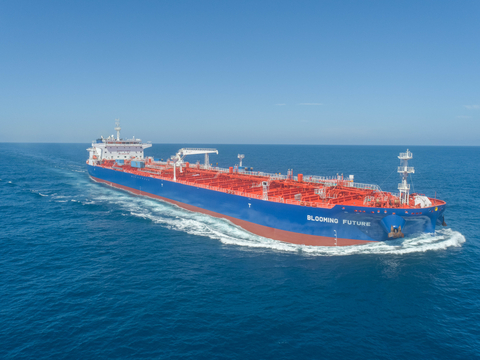
Blooming Future Launches Operations as Part of Braskem’s Expanding Sustainable FleetJune 18, 2026 4:00 AM
Business Wire Designed for long-range transport of essential raw materials, Blooming Future strengthens Braskem’s commitment to safer, more efficient, and lower-emission shipping. Braskem (B3: BRKM3, BRKM5, and BRKM6; NYSE: BAK; LATIBEX: XBRK), the largest polyolefins producer in the Americas and global leader in the production of biopolymers on an industrial scale announces today that Braskem Trading & Shipping (BT&S) has launched the maiden voyage of Blooming Future, a next-generation LR1 chemical and product oil tanker designed to transport essential raw materials with greater efficiency and a lower carbon footprint. The vessel was formally named at a ceremony in China on May 8. This press release features multimedia. View the full release here: https://www.businesswire.com/news/home/20260618915078/en/Braskem's Blooming Future “Blooming Future will carry naphtha to support our industrial production, while operating at optimized speed to reduce fuel consumption and emissions. The vessel is as wide as a six-lane highway and can hold cargo equivalent to roughly 35 Olympic size swimming pools. She has been designed to meet the highest standards of safety, reliability, and sustainability, demonstrating how operational efficiency and lower carbon maritime transport can scale together,” said Hardi Schuck, Director of Braskem Trading & Shipping. Built as a specialized chemical and product oil tanker (IMO Type 3), Blooming Future incorporates advanced technologies, including biofuel-ready engines and energy-efficient systems, supporting lower emissions and improved performance. The new vessel is expected to emit approximately 30% less CO2 than the average vessels currently in operation at Braskem, resulting in an estimated reduction of around 6,500 tonnes of CO2 emissions per year. The vessel is part of a broader fleet expansion program, under which Braskem Trading & Shipping is expected to operate a total of four LR1 tankers by early 2027, reinforcing its commitment to reliability, safety, and sustainable maritime operations. ABOUT BRASKEM With a global vision of the future oriented towards people and sustainability, Braskem is committed to contributing to the value chain for strengthening the Circular Economy. The petrochemical company’s almost 8,000 team members dedicate themselves every day to improving people’s lives through sustainable chemicals and plastics solutions. Braskem has an innovative DNA and a comprehensive portfolio of plastic resins and chemical products for diverse segments, such as food packaging, construction, manufacturing, automotive, agribusiness, healthcare, and hygiene, among others. With 40 industrial units in Brazil, the United States, Mexico, and Germany, Braskem exports its products to clients in more than 70 countries. To learn more visit, www.braskem.com. ABOUT BRASKEM TRADING & SHIPPING Braskem Trading & Shipping (BT&S) is Braskem’s global trading, shipping, and supply chain organization, responsible for the sourcing, transportation, and commercialization of feedstocks, chemicals, fuels, and specialty products. BT&S supports operations in Brazil, Mexico, and Germany through international trading, maritime logistics, and strategic supplier partnerships, while serving customers across Europe, North America, Asia, and the Caribbean. The organization also leads sustainable maritime transportation initiatives, including investments in lower-emission vessel operations and the “Seas of the Future” program, focused on improving logistics efficiency, reducing freight costs, and lowering CO2 emissions across global shipping activities. Braskem social media: www.facebook.com/BraskemGlobal
www.linkedin.com/company/braskem View source version on businesswire.com: https://www.businesswire.com/news/home/20260618915078/en/ For press information, please contact: Braskem North America, Europe, and Asia
Stacy Torpey - stacy.torpey@braskem.com
Jessica Frank – jessica.frank@braskem.com Original: Blooming Future Launches Operations as Part of Braskem’s Expanding Sustainable Fleet
US Market News
2月前
Braskem feiert die Taufe der „Beautiful Future“ und der „Blooming Future“, Tanker der nächsten Generation für einen saubereren globalen HandelMay 11, 2026 7:20 AM
Business Wire Die „Beautiful Future“ und die „Blooming Future“ vereinen modernste Effizienz- und Emissionsminderungstechnologien, um einen verantwortungsvolleren globalen Handel zu fördern. Braskem (B3: BRKM3, BRKM5 und BRKM6; NYSE: BAK; LATIBEX: XBRK), der größte Polyolefinhersteller in Amerika und weltweit führend in der Produktion von Biopolymeren im industriellen Maßstab, gibt heute bekannt, dass Braskem Trading & Shipping (BT&S) mit der Taufe von Beautiful Future und Blooming Future einen wichtigen Meilenstein bei der Modernisierung seiner Flotte und auf dem Weg zur Nachhaltigkeit erreicht hat. Dabei handelt es sich um Chemikalien- und Produktöltanker der nächsten Generation, die dafür ausgelegt sind, wichtige Rohstoffe effizienter und mit deutlich geringerem ökologischen Fußabdruck zu transportieren. Beide Schiffe wurden am 8. Mai im Rahmen einer Zeremonie in China offiziell getauft. Diese Pressemitteilung enthält multimediale Inhalte. Die vollständige Mitteilung hier ansehen: https://www.businesswire.com/news/home/20260511693210/de/Beautiful Future Beautiful Future und Blooming Future sind LR1-Schiffe (Long Range 1), die Naphtha – einen wesentlichen Baustein für die Herstellung von Alltagsgütern wie medizinischen Verbrauchsmaterialien, Verpackungen und Haushaltswaren – auf Langstreckenrouten zwischen der US-Golfküste und Brasilien transportieren werden. Die Schiffe wurden von Ocean Yield finanziert; die Beautiful Future wird von ISHIMA betrieben, die Blooming Future von TB Marine unter der Aufsicht von BT&S. Durch die Kombination aus fortschrittlicher Motorentechnologie, energiesparendem Rumpfdesign und Emissionskontrollsystemen, die die aktuellen gesetzlichen Anforderungen übertreffen, stehen die Schiffe für einen intelligenteren, saubereren Ansatz im globalen Handel und geben einen Einblick in die Zukunft eines verantwortungsvollen Seeverkehrs. „Wir freuen uns sehr, unsere Flotte mit der Beautiful Future und der Blooming Future zu erweitern. Schiffe wie die Beautiful Future und die Blooming Future transportieren die Rohstoffe für die Herstellung von Alltagsprodukten wie Kunststoffe für medizinische Geräte, Verpackungen und Haushaltswaren, jedoch mit deutlich geringeren Umweltauswirkungen als herkömmliche Tanker“, erklärte Hardi Schuck, Director bei Braskem Trading & Shipping. Auf einer typischen Reise werden die Beautiful Future und die Blooming Future über 5.500 Seemeilen von der US-Golfküste nach Brasilien zurücklegen und dabei genug Naphtha transportieren, um die industrielle Produktion für Wochen zu versorgen, während sie mit optimierter Geschwindigkeit fahren, um den Kraftstoffverbrauch und die Emissionen zu senken. Die neuen Schiffe werden voraussichtlich jeweils etwa 30 % weniger CO2 ausstoßen als die durchschnittlichen Schiffe, die derzeit bei Braskem im Einsatz sind, was zu einer geschätzten Reduzierung der CO2-Emissionen um rund 6.500 Tonnen pro Jahr führt. Diese Emissionsreduktion entspricht der Vermeidung von fast 50.000 Flüge zwischen Amsterdam und Paris und stellt einen bedeutenden Fortschritt bei der Verringerung des ökologischen Fußabdrucks des Seeverkehrs dar. Beautiful Future und Blooming Future sind die ersten LR1-Schiffe, die 2026 an Braskem Trading & Shipping ausgeliefert wurden. Zwei weitere Schiffe befinden sich bereits im Bau und werden die Schiffsflotte des Unternehmens ergänzen; ihre Auslieferung ist für später in diesem Jahr bzw. Anfang 2027 geplant. ÜBER BRASKEM
Mit einer globalen Zukunftsvision, die auf Menschen und Nachhaltigkeit ausgerichtet ist, engagiert sich Braskem dafür, einen Beitrag zur Wertschöpfungskette zur Stärkung der Kreislaufwirtschaft zu leisten. Die fast 8.000 Mitarbeiter des Petrochemieunternehmens setzen sich täglich dafür ein, das Leben der Menschen durch nachhaltige Chemie- und Kunststofflösungen zu verbessern. Braskem verfügt über eine innovative DNA und ein umfassendes Portfolio an Kunststoffgranulaten und chemischen Produkten für verschiedene Branchen, darunter Lebensmittelverpackungen, Bauwesen, Fertigung, Automobilindustrie, Agrarwirtschaft, Gesundheitswesen und Hygiene. Mit 40 Industrieanlagen in Brasilien, den Vereinigten Staaten, Mexiko und Deutschland exportiert Braskem seine Produkte an Kunden in mehr als 70 Ländern. Braskem in den sozialen Medien: www.facebook.com/BraskemGlobal
www.linkedin.com/company/braskem Die Ausgangssprache, in der der Originaltext veröffentlicht wird, ist die offizielle und autorisierte Version. Übersetzungen werden zur besseren Verständigung mitgeliefert. Nur die Sprachversion, die im Original veröffentlicht wurde, ist rechtsgültig. Gleichen Sie deshalb Übersetzungen mit der originalen Sprachversion der Veröffentlichung ab. Originalversion auf businesswire.com ansehen: https://www.businesswire.com/news/home/20260511693210/de/ Wenden Sie sich für Presseinformationen an: Braskem North America, Europe, and Asia
Stacy Torpey - stacy.torpey@braskem.com
Jessica Frank – jessica.frank@braskem.com Original: Braskem feiert die Taufe der „Beautiful Future“ und der „Blooming Future“, Tanker der nächsten Generation für einen saubereren globalen Handel
US Market News
2月前
Braskem Celebrates Naming of Beautiful Future and Blooming Future, Next-Generation Tankers for Cleaner Global TradeMay 11, 2026 4:00 AM
Business Wire Beautiful Future and Blooming Future combine cutting-edge efficiency and emissions-reduction technologies to support more responsible global trade. Braskem (B3: BRKM3, BRKM5, and BRKM6; NYSE: BAK; LATIBEX: XBRK), the largest polyolefins producer in the Americas and global leader in the production of biopolymers on an industrial scale announces today that Braskem Trading & Shipping (BT&S) has reached a major milestone in its fleet modernization and sustainability journey with the naming of Beautiful Future and Blooming Future, next-generation chemical and product oil tankers designed to move essential raw materials more efficiently and with a significantly lower environmental footprint. Both vessels were formally named at a ceremony in China on May 8. This press release features multimedia. View the full release here: https://www.businesswire.com/news/home/20260511191334/en/Beautiful Future Beautiful Future and Blooming Future are LR1 (Long Range 1) vessels that will transport naphtha, which is an essential building block used to produce everyday items such as medical supplies, packaging, and household goods, on long-distance routes between the U.S. Gulf Coast and Brazil. The vessels were financed by Ocean Yield and Beautiful Future will be operated by ISHIMA and Blooming Future will be operated by TB Marine under BT&S supervision. By combining advanced engine technology, energy-saving hull design, and emissions-control systems that exceed current regulatory requirements, the vessel represents a smarter, cleaner approach to global trade and a glimpse into the future of responsible maritime transportation. “We are excited to expand our fleet of ships with Beautiful Future and Blooming Future. Ships like Beautiful Future and Blooming Future transport the raw materials used to make everyday products such as plastics for medical equipment, packaging, and household goods, but with significantly lower environmental impact than traditional tankers,” shared Hardi Schuck, Director, Braskem Trading & Shipping. On a typical voyage, Beautiful Future and Blooming Future will travel over 5,500 nautical miles from the U.S. Gulf Coast to Brazil, carrying enough naphtha to supply industrial production for weeks while operating at optimized speed to reduce fuel consumption and emissions. The new vessels are expected to each emit approximately 30% less CO2 than the average vessels currently in operation at Braskem, resulting in an estimated reduction of around 6,500 tonnes of CO2 emissions per year. This emissions reduction is equivalent to eliminating nearly 50,000 one-way flights between Amsterdam and Paris, representing a significant step forward in lowering the environmental footprint of maritime operations. Beautiful Future and Blooming Future are the first LR1 vessels delivered to Braskem Trading & Shipping in 2026. Two additional ships are already under construction and will join the company’s maritime fleet and are scheduled for delivery later this year and early 2027, respectively. ABOUT BRASKEM With a global vision of the future oriented towards people and sustainability, Braskem is committed to contributing to the value chain for strengthening the Circular Economy. The petrochemical company’s almost 8,000 team members dedicate themselves every day to improving people’s lives through sustainable chemicals and plastics solutions. Braskem has an innovative DNA and a comprehensive portfolio of plastic resins and chemical products for diverse segments, such as food packaging, construction, manufacturing, automotive, agribusiness, healthcare, and hygiene, among others. With 40 industrial units in Brazil, the United States, Mexico, and Germany, Braskem exports its products to clients in more than 70 countries. Braskem social media: www.facebook.com/BraskemGlobal
www.linkedin.com/company/braskem View source version on businesswire.com: https://www.businesswire.com/news/home/20260511191334/en/ For press information, please contact: Braskem North America, Europe, and Asia
Stacy Torpey - stacy.torpey@braskem.com
Jessica Frank – jessica.frank@braskem.com Original: Braskem Celebrates Naming of Beautiful Future and Blooming Future, Next-Generation Tankers for Cleaner Global Trade
US Market News
2月前
Braskem présentera des solutions d’emballage durables au salon interpack 2026April 28, 2026 4:29 PM
Business Wire
Braskem propose des solutions circulaires évolutives qui renforcent la chaîne de valeur de l’emballage et favorisent un avenir à faible empreinte carbone.
Braskem (B3 : BRKM3, BRKM5 et BRKM6, NYSE : BAK, LATIBEX : XBRK), premier producteur de polyoléfines des Amériques, leader mondial et pionnier de la production de biopolymères à l’échelle industrielle, sera présent à interpack 2026 dans le hall 9, stand A32, pour présenter des solutions d’emballage fabriquées à partir de polyoléfines biosourcées, recyclées et traditionnelles, permettant une circularité des plastiques de bout en bout. À interpack, Braskem mettra en avant les grades de polyéthylène biosourcé I’m green™, spécialement conçus pour les applications en contact avec les aliments, ainsi que le Medcol V7040, un nouveau grade destiné aux secteurs de la santé et de l’hygiène. Ces innovations marquent la première fois que Braskem propose des plastiques issus de la canne à sucre et d’origine durable pour ces segments.
Dans un contexte où les décisions en matière d’emballage sont de plus en plus évaluées à la fois en fonction des ambitions de durabilité et de l’impact commercial, Braskem se positionne comme un partenaire en matériaux proposant de multiples voies complémentaires vers la circularité et la réduction des émissions. Plutôt que d’offrir une solution unique, le portefeuille de l’entreprise est conçu pour aider les marques et les transformateurs à progresser à leur propre rythme, en utilisant des matériaux de remplacement direct qui s’intègrent parfaitement aux opérations existantes.
« Les défis actuels en matière d’emballage exigent des solutions pragmatiques », déclare Walmir Soller, vice-président pour l’Amérique du Nord, l’Europe et l’Asie (NAMEA). « Les objectifs de durabilité doivent s’appuyer sur des matériaux qui offrent performance, évolutivité et fiabilité d’approvisionnement. Notre portefeuille, allant des résines renouvelables aux résines recyclées en passant par les résines conventionnelles, permet aux clients de choisir les solutions qui correspondent le mieux à leurs réalités techniques, réglementaires et de résilience commerciale, tout en progressant vers la transition vers une économie circulaire à faible émission de carbone. »
Braskem mettra en avant son portefeuille de produits en pleine expansion, destiné à soutenir une économie circulaire du plastique qui maintient le carbone dans le circuit, à travers des présentations interactives, des exemples concrets et des sessions d’experts. Les participants pourront découvrir :
Des produits phares
I’m green™ bio-sourcée
Emballages souples destinés au contact alimentaire
Braskem présentera sa dernière innovation en matière de grades souples bio-sourcés, conçue pour les applications en contact alimentaire. Ce nouveau grade combine des performances élevées et prévisibles avec les avantages de la capture du carbone et de la compatibilité directe de la gamme bio-sourcée I’m green™.
Medcol V7040 (LDPE) pour les soins de santé et l’hygiène
Le Medcol V7040 de Braskem, un polyéthylène basse densité spécialement développé pour les procédés de soufflage-remplissage-scellage, répond aux réglementations pharmaceutiques strictes du secteur des soins de santé.
Excellente fluidité, rigidité et résistance à la température
Compatibilité avec les systèmes de transformation existants en tant que véritable solution de remplacement direct
Une matière première renouvelable, évolutive et entièrement recyclable
Une empreinte carbone négative du berceau à la porte de –2,27 kg CO2e/kg
Films orientés dans le sens machine (MDO) fabriqués à partir de matières premières renouvelables, alliant hautes performances mécaniques et faible impact environnemental. Durables et esthétiques, ils conviennent aux applications dans les secteurs de l’alimentation, de la beauté, des produits d’entretien et des soins personnels qui recherchent une structure monomatérielle pour faciliter le recyclage ; ils peuvent également être utilisés dans une large gamme d’applications d’emballages souples.
Polypropylène
Applications d’emballage alimentaire
Braskem présente plusieurs options différentes pour l’emballage alimentaire, allant des gobelets durables aux barquettes alimentaires thermoformées, utilisant différentes qualités de polymères Inspire™. Toutes ces options offrent une recyclabilité et d’excellentes performances optiques pour garantir une présentation esthétique du produit.
Santé
La résine Medcol V4020 est utilisée pour les flacons de perfusion et convient à une large gamme d’applications médicales et de santé, notamment les flacons, les ampoules injectables et les poches de perfusion. Ce matériau offre une excellente transparence et une bonne résistance à la température tout en conservant sa souplesse et une bonne aptitude au traitement. Il peut être stérilisé à la vapeur et à l’oxyde d’éthylène (EtO).
Présentations
Braskem au forum SPOTLIGHT (Entrée nord B/B)
Samedi 9 mai | 12 h 00 – 12 h 20 (suivi d’une séance de questions-réponses)
Forum sur les emballages intelligents
Les emballages intelligents commencent par les matériaux : l’impact des biopolymères dans une économie circulaire à faible émission de carbone
Intervenants : Brendan Hill et Richard Lambert
Mardi 12 mai | 15h40 – 16h00
Session sur les matériaux innovants
Innover dans les plastiques renouvelables : L’avantage bio-sourcé I’m green™
Intervenante : Camila Pilatti
interpack est un précurseur mondial des thèmes d’avenir du secteur et se concentre sur les matériaux d’emballage, les machines d’emballage et les technologies de processus associées pour les secteurs de l’alimentation, des boissons, de la confiserie, de la boulangerie, des produits pharmaceutiques, des cosmétiques, des produits non alimentaires et des biens industriels. Braskem sera présent à interpack du 7 au 13 mai, hall 9, stand 32.
À PROPOS DE BRASKEM
Avec une vision mondiale de l’avenir axée sur les personnes et la durabilité, Braskem s’engage à contribuer à la chaîne de valeur pour renforcer l’économie circulaire. Les quelque 8 000 collaborateurs de cette entreprise pétrochimique se consacrent chaque jour à améliorer la vie des gens grâce à des solutions chimiques et plastiques durables. Braskem possède un ADN innovant et un portefeuille complet de résines plastiques et de produits chimiques destinés à divers segments, tels que l’emballage alimentaire, la construction, la fabrication, l’automobile, l’agroalimentaire, la santé et l’hygiène, entre autres. Avec 40 sites industriels au Brésil, aux États-Unis, au Mexique et en Allemagne, Braskem exporte ses produits vers des clients dans plus de 70 pays.
Braskem sur les réseaux sociaux :
www.facebook.com/BraskemGlobal
www.linkedin.com/company/braskem
Le texte du communiqué issu d’une traduction ne doit d’aucune manière être considéré comme officiel. La seule version du communiqué qui fasse foi est celle du communiqué dans sa langue d’origine. La traduction devra toujours être confrontée au texte source, qui fera jurisprudence.
Consultez la version source sur businesswire.com : https://www.businesswire.com/news/home/20260428640317/fr/
Pour toute information de presse, veuillez contacter :
Braskem Amérique du Nord, Europe et Asie
Stacy Torpey– stacy.torpey@braskem.com
Jessica Frank– jessica.frank@braskem.com
Original: Braskem présentera des solutions d’emballage durables au salon interpack 2026
US Market News
2月前
Braskem to Showcase Sustainable Packaging Solutions at interpack 2026April 28, 2026 4:00 AM
Business Wire
Braskem delivers scalable circular solutions that strengthen the packaging value chain and advance a lower-carbon future.
Braskem (B3: BRKM3, BRKM5, and BRKM6, NYSE: BAK, LATIBEX: XBRK) the largest polyolefins producer in the Americas, as well as a global market leader and pioneer producer of biopolymers on an industrial scale, will be at interpack 2026 in hall 9, booth A32, presenting packaging solutions made from bio-based, recycled and traditional polyolefins, enabling circular plastics, end-to-end. At interpack, Braskem will highlight I’m green™ bio-based polyethylene grades specifically engineered for food-contact applications, as well as Medcol V7040, a new grade for Healthcare and Hygiene. These innovations mark the first time Braskem has offered sustainably sourced sugarcane-derived plastics for these segments.
In an environment where packaging decisions are increasingly evaluated on both sustainability ambitions and business impact, Braskem positions itself as a materials partner offering multiple, complementary pathways toward circularity and lower emissions. Rather than a one-size-fits-all solution, the company’s portfolio is designed to help brands and converters advance at their own pace—using drop-in materials that integrate seamlessly into existing operations.
“Today’s packaging challenges require pragmatic solutions,” said Walmir Soller, Vice President for North America, Europe and Asia (NAMEA). “Sustainability goals must be supported by materials that deliver performance, scalability and supply reliability. Our portfolio—from renewable to recycled together with conventional resins—allows customers to choose the solutions that best fit their technical, regulatory and business resilience realities while moving forward on transitioning into a low carbon circular economy.”
Braskem will spotlight its expanding product portfolio to support a circular plastic economy that keeps carbon in the loop through interactive displays, real-life examples and expert sessions. Attendees can expect to explore:
Product Highlights
I’m green™ bio-based
Flexible packaging for Food Contact
Braskem will introduce its latest bio-based flexible grade innovation designed for food-contact applications. The new grade combines high and predictable performance with the carbon capturing, drop-in benefits of the I’m green™ bio-based portfolio.
Medcol V7040 (LDPE) for Healthcare and Hygiene
Braskem’s Medcol V7040, a low-density polyethylene specifically developed for blow-fill-seal processes, meets stringent pharmaceutical regulations for the healthcare sector.
Excellent flowability, stiffness, and temperature resistance
Compatibility with existing processing systems as a true drop-in solution
A scalable and fully recyclable renewable feedstock
A negative cradle-to-gate carbon footprint of –2.27 kg CO2e/kg
Machine Direction Oriented (MDO) films made with renewable feedstock that combines high mechanical performance with lower environmental impact. Sustainable and visually appealing, it is suitable for food, beauty, home and personal care applications that seek mono-material structure to facilitate recyclability and can also be used across a wide range of flexible packaging applications.
Polypropylene
Food Packaging Applications
Braskem showcases several different options for food packaging ranging from durable cups to thermoformed food trays using different grades of Inspire™ polymers. All options provide recyclability and excellent optical performance to ensure aesthetic product presentation.
Healthcare
Medcol V4020 resin is used for IV bottles and is suitable for a wide range of medical and healthcare applications, including bottles, injectable ampoules, and IV pouches. The material offers excellent clarity and temperature resistance while maintaining flexibility and good processability. It can be sterilized using steam and ethylene oxide (EtO).
Presentations
Braskem at the SPOTLIGHT Forum (North Entrance B/B)
Saturday, May 9 | 12:00–12:20 PM (followed by Q&A)
Smart Packaging Forum
Smart Packaging Starts with Materials: The Impact of Biopolymers in a Low-Carbon Circular Economy
Speakers: Brendan Hill and Richard Lambert
Tuesday, May 12 | 3:40–4:00 PM
Innovative Materials Session
Innovating Renewable Plastics: The I’m green™ bio-based Advantage
Speaker: Camila Pilatti
interpack is a global trendsetter for the future themes of the industry and focuses on packaging materials, packaging machines and related process technology for the food, beverage, confectionary, bakery, pharmaceutical, cosmetics, non-food and industrial goods sector. Braskem will be at interpack from May 7 until May 13 in Hall 9 Booth 32.
ABOUT BRASKEM
With a global vision of the future oriented toward people and sustainability, Braskem is committed to contributing to the value chain for strengthening the Circular Economy. The petrochemical company’s almost 8,000 team members dedicate themselves every day to improving people’s lives through sustainable chemicals and plastics solutions. Braskem has an innovative DNA and a comprehensive portfolio of plastic resins and chemical products for diverse segments, such as food packaging, construction, manufacturing, automotive, agribusiness, healthcare, and hygiene, among others. With 40 industrial units in Brazil, the United States, Mexico, and Germany, Braskem exports its products to clients in more than 70 countries.
Braskem on social media:
www.facebook.com/BraskemGlobal
www.linkedin.com/company/braskem
View source version on businesswire.com: https://www.businesswire.com/news/home/20260428736579/en/
For press information, please contact:
Braskem North America, Europe, and Asia
Stacy Torpey– stacy.torpey@braskem.com
Jessica Frank– jessica.frank@braskem.com
Original: Braskem to Showcase Sustainable Packaging Solutions at interpack 2026
 Hot Features


 TrendTrade2016
4月前
TrendTrade2016
4月前
 81vette
9月前
81vette
9月前
 Renee
7年前
Renee
7年前
 stocktrademan
10年前
stocktrademan
10年前
 Timothy Smith
11年前
Timothy Smith
11年前

 メールアドレスで登録


