Pay vs Performance Disclosure - USD ($)
|
12 Months Ended |
Jun. 30, 2023 |
Jun. 30, 2022 |
Jun. 30, 2021 |
| Pay vs Performance Disclosure |
|
|
|
| Pay vs Performance Disclosure, Table |
As required by Section 953(a) of the Dodd-Frank Wall Street Reform and Consumer Protection Act (“Dodd-Frank”) and Item 402(v) of Regulation S-K, the table below sets forth information about the relationship between compensation actually paid (“CAP”) to our principal executive officer (“PEO”) and non-PEO NEOs and certain financial performance measures of the Company and how the Company aligns executive compensation with the Company’s performance. CAP represents an amount calculated in accordance with the SEC’s prescribed formula pursuant to Dodd-Frank and does not represent compensation actually paid to or earned by our NEOs in any year. Neither the Compensation Committee nor the Company directly used this information when making compensation-related decisions for the 2 02 3 fiscal year. For further information concerning the Company’s variable philosophy and how the Company aligns executive compensation with Company performance, refer to the “Compensation Discussion and Analysis” section of this proxy statement.
|
|
|
|
|
|
|
|
|
|
|
|
|
|
|
|
|
|
|
|
|
|
|
|
|
|
|
|
|
|
|
|
|
|
|
Summary Compensation Table Total for PEO ($) (1) |
|
|
Compensation Actually Paid for PEO ($) (2) |
|
|
Average Summary Compensation Table Total for Non-PEO NEOs ($) (3) |
|
|
Average Compensation Actually Paid for Non-PEO NEOs ($) (4) |
|
|
Value of Initial Fixed $100
Investment Based on: |
|
|
(GAAP) Net Income ($000s) (7) |
|
|
Company
Selected
Performance
Measure |
|
| |
Total Shareholder Return ($) (5) |
|
|
Peer Group Total Shareholder Return ($) (5)(6) |
|
|
Adjusted Operating Income ($000s) (8) |
|
2023 |
|
|
16,310,205 |
|
|
|
12,079,152 |
|
|
|
3,038,025 |
|
|
|
2,642,673 |
|
|
|
79.10 |
|
|
|
144.03 |
|
|
|
505,680 |
|
|
|
(122,520 |
) |
2022 |
|
|
19,243,679 |
|
|
|
9,274,510 |
|
|
|
3,756,214 |
|
|
|
2,727,399 |
|
|
|
70.16 |
|
|
|
121.64 |
|
|
|
(190,147 |
) |
|
|
133,555 |
|
2021 |
|
|
8,323,840 |
|
|
|
(741,453 |
) |
|
|
3,228,102 |
|
|
|
3,411,600 |
|
|
|
89.32 |
|
|
|
43.45 |
|
|
|
(395,560 |
) |
|
|
(271,012 |
) |
| (1) |
The dollar amounts reported for the PEO, Mr. Dolan, under “Summary Compensation Table Total” are the amounts of total compensation reported for Mr. Dolan for each corresponding year in the “Total” column of the Summary Compensation Table. |
| (2) |
The dollar amounts reported for Mr. Dolan under “Compensation Actually Paid” represent the amount of CAP to Mr. Dolan, as computed in accordance with Item 402(v) of Regulation S-K. In accordance with the requirements of Item 402(v) of Regulation S-K, the adjustments in the table below were made to Mr. Dolan’s total compensation for each year to determine CAP: |
|
|
|
|
|
|
|
|
|
|
|
|
|
| |
|
|
|
| |
|
|
|
|
|
|
|
|
|
Total Compensation as reported in Summary Compensation Table |
|
|
16,310,205 |
|
|
|
19,243,679 |
|
|
|
8,323,840 |
|
Subtract change in pension value as reported in Summary Compensation Table |
|
|
— |
|
|
|
— |
|
|
|
— |
|
Add pension value attributable to covered fiscal year’s service and any change in such value attributable to plan amendments made in covered fiscal year |
|
|
— |
|
|
|
— |
|
|
|
— |
|
Subtract value of equity awards as reported in Summary Compensation Table |
|
|
10,973,100 |
|
|
|
11,148,811 |
|
|
|
5,848,014 |
|
Add year-end fair value of equity awards granted in covered fiscal year that were unvested at end of covered fiscal year |
|
|
5,409,525 |
|
|
|
8,917,617 |
|
|
|
12,266,002 |
|
Add change in fair value from end of prior fiscal year to vesting date for awards made in prior fiscal years that vested during covered fiscal year (a) |
|
|
593,819 |
|
|
|
(448,675 |
) |
|
|
(40,174 |
) |
Add vesting date fair value of equity awards granted in covered fiscal year that vested during covered fiscal year (a) |
|
|
— |
|
|
|
— |
|
|
|
— |
|
Add change in fair value from end of prior fiscal year to end of covered fiscal year for awards granted in prior fiscal years that were unvested at end of covered fiscal year (b)(c) |
|
|
738,702 |
|
|
|
(7,289,299 |
) |
|
|
(1,963,852 |
) |
Subtract fair value of awards forfeited in covered fiscal year determined at end of prior fiscal year (d) |
|
|
— |
|
|
|
— |
|
|
|
13,479,255 |
|
Add dividends or other earnings paid on stock or option awards in covered fiscal year that are not otherwise included in total compensation for covered fiscal year (a) |
|
|
— |
|
|
|
— |
|
|
|
— |
|
Compensation Actually Paid to PEO (c)(e) |
|
|
|
|
|
|
|
|
|
|
|
|
| |
(a) |
Includes change in fair value of MSGN awards which were assumed by the Company in connection with the Networks Merger and converted into awards denominated in shares of Class A Common Stock based on an exchange ratio of 0.172 (stock options and restricted stock units subject to performance vesting conditions were converted to stock options and restricted stock units, as applicable, with time-vesting conditions for the remainder of the performance period assuming the performance conditions were achieved at 100% of target). For 2021, calculations for such awards assume fair value at end of prior fiscal year end as of July 9, 2021, the date of the Networks Merger. In addition, calculation for 2021 is net of awards both vested and forfeited in 2021 (see footnote (d) for further detail). |
| |
(b) |
Includes change in fair value of MSGN awards which were assumed by the Company in connection with the Networks Merger and converted into awards denominated in shares of Class A Common Stock based on an exchange ratio of 0.172 (stock options and restricted stock units subject to performance vesting conditions were converted to stock options and restricted stock units, as applicable, with time-vesting conditions for the remainder of the performance p erio d assuming the performance conditions were achieved at 100% of target). For 2021, calculations for such awards assume fair value at end of prior fiscal year end as of July 9, 2021, the date of the Networks Merger. |
| |
(c) |
Includes change in fair value of Company awards granted prior to the MSGE Distribution. For 2023, calculations assume the historical adjustment of Company stock price as of the prior fiscal year end (i.e., 2022) in order to account for the MSGE Distribution. Absent this adjustment, the PEO’s CAP in 2023 would be $5,320,269. |
| |
(d) |
For 2021, includes value of Performance Alignment PSU Grants and Performance Alignment Option Grants, which were voluntarily relinquished in October 2021 in connection with the settlement of litigation. |
| |
(e) |
Does not include MSGE awards granted in April 2023 in res pect of existing Company awards that were granted by the Company prior to the MSGE Distribution. For more information on such awards, see MSGE’s 2023 Definitive Proxy Statement. |
| (3) |
The dollar amounts reported under “Average Summary Compensation Total for non-PEO NEOs” represent the average of the amounts reported for the Company’s NEOs as a group (excluding Mr. Dolan) in the “Total” column of the Summary Compensation Table in each applicable year. The NEOs included for purposes of calculating the average amounts in each applicable year are as follows: (i) for 2023, Andrea Greenberg, David Granville-Smith, Gautam Ranji, Gregory Brunner, David F. Byrnes, Jamal H. Haughton, and Philip G. D’Ambrosio; (ii) for 2022, Andrea Greenberg, David F. Byrnes, Jamal H. Haughton, Philip G. D’Ambrosio, Andrew Lustgarten, Mark H. FitzPatrick, and Scott S. Packman; and (iii) for 2021, Andrew Lustgarten, Mark H. FitzPatrick, Scott S. Packman, and Philip G. D’Ambrosio. |
| (4) |
The dollar amounts reported under “Average Compensation Actually Paid for non-PEO NEOs” represent the average amount of CAP to the NEOs as a group (excluding Mr. Dolan), as computed in accordance with Item 402(v) of Regulation S-K. In accordance with the requirements of Item 402(v) of Regulation S-K, the adjustments in the table below were made to the non-PEO NEOs’ total compensation for each year to determine the CAP: |
|
|
|
|
|
|
|
|
|
|
|
|
|
| |
|
|
|
| |
|
|
|
|
|
|
|
|
|
Total Compensation as reported in Summary Compensation Table |
|
|
3,038,025 |
|
|
|
3,756,214 |
|
|
|
3,228,102 |
|
Subtract change in pension value as reported in Summary Compensation Table |
|
|
1,822 |
|
|
|
1,966 |
|
|
|
15 |
|
Add pension value attributable to covered fiscal year’s service and any change in such value attributable to plan amendments made in covered fiscal year |
|
|
— |
|
|
|
— |
|
|
|
— |
|
Subtract value of equity awards as reported in Summary Compensation Table |
|
|
1,483,542 |
|
|
|
1,323,798 |
|
|
|
1,350,659 |
|
Add year-end fair value of equity awards granted in covered fiscal year that were unvested at end of covered fiscal year |
|
|
1,006,528 |
|
|
|
831,644 |
|
|
|
1,506,926 |
|
Add change in fair value from end of prior fiscal year to vesting date for awards made in prior fiscal years that vested during covered fiscal year (a) |
|
|
25,422 |
|
|
|
(50,542 |
) |
|
|
(19,205 |
) |
Add vesting date fair value of equity awards granted in covered fiscal year that vested during covered fiscal year (a) |
|
|
7,929 |
|
|
|
331,433 |
|
|
|
— |
|
Add change in fair value from end of prior fiscal year to end of covered fiscal year for awards granted in prior fiscal years that were unvested at end of covered fiscal year (a)(b) |
|
|
50,134 |
|
|
|
(815,587 |
) |
|
|
46,453 |
|
Subtract fair value of awards forfeited in covered fiscal year determined at end of prior fiscal year |
|
|
— |
|
|
|
— |
|
|
|
— |
|
Add dividends or other earnings paid on stock or option awards in covered fiscal year that are not otherwise included in total compensation for covered fiscal year |
|
|
— |
|
|
|
— |
|
|
|
— |
|
Compensation Actually Paid to Non-PEO NEOs (b)(c) |
|
|
|
|
|
|
|
|
|
|
|
|
| |
(a) |
Includes change in fair value of MSGN awards which were assumed by the Company in connection with the Networks Merger and converted into awards denominated in shares of Class A Common Stock based on an exchange ratio of 0.172 (stock options and restricted stock units subject to performance vesting conditions were converted to stock options and restricted stock units, as applicable, with time-vesting conditions for the remainder of the performance period assuming the performance conditions were achieved at 100% of target). For 2021, calculations for such awards assume fair value at end of prior fiscal year end as of July 9, 2021, the date of the Networks Merger. |
| |
(b) |
Includes change in fair value of Company awards granted prior to the MSGE Distribution. For 2023, calculations assume the historical adjustment of Company stock price as of the prior fiscal year end (i.e., 2022) in order to account for the MSGE Distribution. Absent this adjustment, non-PEO NEOs’ CAP in 2023 would be $2,183,961. |
| |
(c) |
Does not include MSGE awards granted in April 2023 in respect of existing Company awards that were granted by the Company prior to the MSGE Distribution. For more information on such awards, see MSGE’s 2023 Definitive Proxy Statement. |
| (5) |
Cumulative Total Shareholder Return is calculated by dividing the sum of the cumulative amount of dividends for the measurement period, assuming dividend reinvestment, and the difference between the company’s share price at the end and the beginning of the measurement period by the company’s share price at the beginning of the measurement period. |
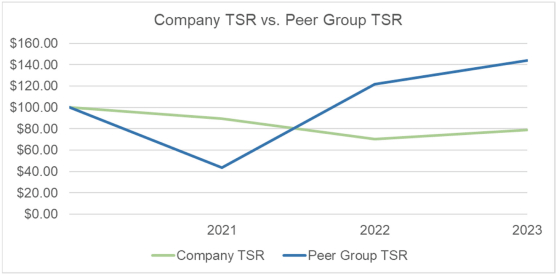
| (6) |
As permitted by SEC rules, the peer group referenced for purposes of “Peer Group Total Shareholder Return” is that of the Bloomberg Americas Entertainment Index, which is the industry index reported in our 2023 Form 10-K in accordance with Regulation S-K Item 201(e). |
| (7) |
Reflects Net Income as reported in our Annual Report on Form 10-K for the relevant fiscal year. Net Income Attributable to Sphere Stockholders was $502,772 in 2023, $(194,395) in 2022, and $(377,192) in 2021. |
| (8) |
Reflects adjusted operating income as defined in our Annual Report on Form 10-K for the relevant fiscal year. The adjusted operating income figures used to set performance targets and determine payouts within our MPIP and LTIP (as described in the “Compensation Discussion & Analysis” section of this proxy statement) may contemplate certain potential future adjustments or exclusions. |
|
|
|
| Company Selected Measure Name |
AdjustedOperatingIncome
|
|
|
| Named Executive Officers, Footnote |
| (3) |
The dollar amounts reported under “Average Summary Compensation Total for non-PEO NEOs” represent the average of the amounts reported for the Company’s NEOs as a group (excluding Mr. Dolan) in the “Total” column of the Summary Compensation Table in each applicable year. The NEOs included for purposes of calculating the average amounts in each applicable year are as follows: (i) for 2023, Andrea Greenberg, David Granville-Smith, Gautam Ranji, Gregory Brunner, David F. Byrnes, Jamal H. Haughton, and Philip G. D’Ambrosio; (ii) for 2022, Andrea Greenberg, David F. Byrnes, Jamal H. Haughton, Philip G. D’Ambrosio, Andrew Lustgarten, Mark H. FitzPatrick, and Scott S. Packman; and (iii) for 2021, Andrew Lustgarten, Mark H. FitzPatrick, Scott S. Packman, and Philip G. D’Ambrosio. |
|
|
|
| Peer Group Issuers, Footnote |
| (6) |
As permitted by SEC rules, the peer group referenced for purposes of “Peer Group Total Shareholder Return” is that of the Bloomberg Americas Entertainment Index, which is the industry index reported in our 2023 Form 10-K in accordance with Regulation S-K Item 201(e). |
|
|
|
| PEO Total Compensation Amount |
$ 16,310,205
|
$ 19,243,679
|
$ 8,323,840
|
| PEO Actually Paid Compensation Amount |
$ 12,079,152
|
9,274,510
|
(741,453)
|
| Adjustment To PEO Compensation, Footnote |
|
|
|
|
|
|
|
|
|
|
|
|
|
| |
|
|
|
| |
|
|
|
|
|
|
|
|
|
Total Compensation as reported in Summary Compensation Table |
|
|
16,310,205 |
|
|
|
19,243,679 |
|
|
|
8,323,840 |
|
Subtract change in pension value as reported in Summary Compensation Table |
|
|
— |
|
|
|
— |
|
|
|
— |
|
Add pension value attributable to covered fiscal year’s service and any change in such value attributable to plan amendments made in covered fiscal year |
|
|
— |
|
|
|
— |
|
|
|
— |
|
Subtract value of equity awards as reported in Summary Compensation Table |
|
|
10,973,100 |
|
|
|
11,148,811 |
|
|
|
5,848,014 |
|
Add year-end fair value of equity awards granted in covered fiscal year that were unvested at end of covered fiscal year |
|
|
5,409,525 |
|
|
|
8,917,617 |
|
|
|
12,266,002 |
|
Add change in fair value from end of prior fiscal year to vesting date for awards made in prior fiscal years that vested during covered fiscal year (a) |
|
|
593,819 |
|
|
|
(448,675 |
) |
|
|
(40,174 |
) |
Add vesting date fair value of equity awards granted in covered fiscal year that vested during covered fiscal year (a) |
|
|
— |
|
|
|
— |
|
|
|
— |
|
Add change in fair value from end of prior fiscal year to end of covered fiscal year for awards granted in prior fiscal years that were unvested at end of covered fiscal year (b)(c) |
|
|
738,702 |
|
|
|
(7,289,299 |
) |
|
|
(1,963,852 |
) |
Subtract fair value of awards forfeited in covered fiscal year determined at end of prior fiscal year (d) |
|
|
— |
|
|
|
— |
|
|
|
13,479,255 |
|
Add dividends or other earnings paid on stock or option awards in covered fiscal year that are not otherwise included in total compensation for covered fiscal year (a) |
|
|
— |
|
|
|
— |
|
|
|
— |
|
Compensation Actually Paid to PEO (c)(e) |
|
|
|
|
|
|
|
|
|
|
|
|
| |
(a) |
Includes change in fair value of MSGN awards which were assumed by the Company in connection with the Networks Merger and converted into awards denominated in shares of Class A Common Stock based on an exchange ratio of 0.172 (stock options and restricted stock units subject to performance vesting conditions were converted to stock options and restricted stock units, as applicable, with time-vesting conditions for the remainder of the performance period assuming the performance conditions were achieved at 100% of target). For 2021, calculations for such awards assume fair value at end of prior fiscal year end as of July 9, 2021, the date of the Networks Merger. In addition, calculation for 2021 is net of awards both vested and forfeited in 2021 (see footnote (d) for further detail). |
| |
(b) |
Includes change in fair value of MSGN awards which were assumed by the Company in connection with the Networks Merger and converted into awards denominated in shares of Class A Common Stock based on an exchange ratio of 0.172 (stock options and restricted stock units subject to performance vesting conditions were converted to stock options and restricted stock units, as applicable, with time-vesting conditions for the remainder of the performance p erio d assuming the performance conditions were achieved at 100% of target). For 2021, calculations for such awards assume fair value at end of prior fiscal year end as of July 9, 2021, the date of the Networks Merger. |
| |
(c) |
Includes change in fair value of Company awards granted prior to the MSGE Distribution. For 2023, calculations assume the historical adjustment of Company stock price as of the prior fiscal year end (i.e., 2022) in order to account for the MSGE Distribution. Absent this adjustment, the PEO’s CAP in 2023 would be $5,320,269. |
| |
(d) |
For 2021, includes value of Performance Alignment PSU Grants and Performance Alignment Option Grants, which were voluntarily relinquished in October 2021 in connection with the settlement of litigation. |
| |
(e) |
Does not include MSGE awards granted in April 2023 in res pect of existing Company awards that were granted by the Company prior to the MSGE Distribution. For more information on such awards, see MSGE’s 2023 Definitive Proxy Statement. |
|
|
|
| Non-PEO NEO Average Total Compensation Amount |
$ 3,038,025
|
3,756,214
|
3,228,102
|
| Non-PEO NEO Average Compensation Actually Paid Amount |
$ 2,642,673
|
2,727,399
|
3,411,600
|
| Adjustment to Non-PEO NEO Compensation Footnote |
|
|
|
|
|
|
|
|
|
|
|
|
|
| |
|
|
|
| |
|
|
|
|
|
|
|
|
|
Total Compensation as reported in Summary Compensation Table |
|
|
3,038,025 |
|
|
|
3,756,214 |
|
|
|
3,228,102 |
|
Subtract change in pension value as reported in Summary Compensation Table |
|
|
1,822 |
|
|
|
1,966 |
|
|
|
15 |
|
Add pension value attributable to covered fiscal year’s service and any change in such value attributable to plan amendments made in covered fiscal year |
|
|
— |
|
|
|
— |
|
|
|
— |
|
Subtract value of equity awards as reported in Summary Compensation Table |
|
|
1,483,542 |
|
|
|
1,323,798 |
|
|
|
1,350,659 |
|
Add year-end fair value of equity awards granted in covered fiscal year that were unvested at end of covered fiscal year |
|
|
1,006,528 |
|
|
|
831,644 |
|
|
|
1,506,926 |
|
Add change in fair value from end of prior fiscal year to vesting date for awards made in prior fiscal years that vested during covered fiscal year (a) |
|
|
25,422 |
|
|
|
(50,542 |
) |
|
|
(19,205 |
) |
Add vesting date fair value of equity awards granted in covered fiscal year that vested during covered fiscal year (a) |
|
|
7,929 |
|
|
|
331,433 |
|
|
|
— |
|
Add change in fair value from end of prior fiscal year to end of covered fiscal year for awards granted in prior fiscal years that were unvested at end of covered fiscal year (a)(b) |
|
|
50,134 |
|
|
|
(815,587 |
) |
|
|
46,453 |
|
Subtract fair value of awards forfeited in covered fiscal year determined at end of prior fiscal year |
|
|
— |
|
|
|
— |
|
|
|
— |
|
Add dividends or other earnings paid on stock or option awards in covered fiscal year that are not otherwise included in total compensation for covered fiscal year |
|
|
— |
|
|
|
— |
|
|
|
— |
|
Compensation Actually Paid to Non-PEO NEOs (b)(c) |
|
|
|
|
|
|
|
|
|
|
|
|
| |
(a) |
Includes change in fair value of MSGN awards which were assumed by the Company in connection with the Networks Merger and converted into awards denominated in shares of Class A Common Stock based on an exchange ratio of 0.172 (stock options and restricted stock units subject to performance vesting conditions were converted to stock options and restricted stock units, as applicable, with time-vesting conditions for the remainder of the performance period assuming the performance conditions were achieved at 100% of target). For 2021, calculations for such awards assume fair value at end of prior fiscal year end as of July 9, 2021, the date of the Networks Merger. |
| |
(b) |
Includes change in fair value of Company awards granted prior to the MSGE Distribution. For 2023, calculations assume the historical adjustment of Company stock price as of the prior fiscal year end (i.e., 2022) in order to account for the MSGE Distribution. Absent this adjustment, non-PEO NEOs’ CAP in 2023 would be $2,183,961. |
| |
(c) |
Does not include MSGE awards granted in April 2023 in respect of existing Company awards that were granted by the Company prior to the MSGE Distribution. For more information on such awards, see MSGE’s 2023 Definitive Proxy Statement. |
|
|
|
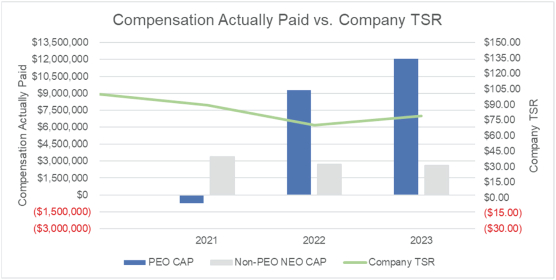
| Compensation Actually Paid vs. Total Shareholder Return |
|
|
|
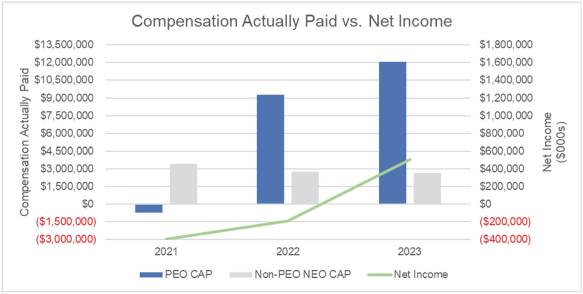
| Compensation Actually Paid vs. Net Income |
|
|
|
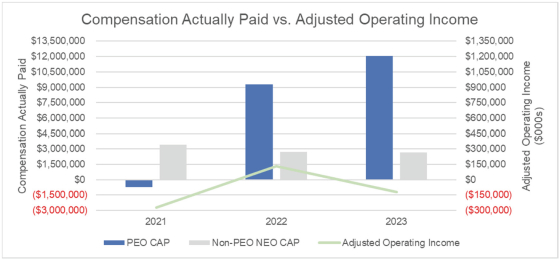
| Compensation Actually Paid vs. Company Selected Measure |
|
|
|
| Total Shareholder Return Vs Peer Group |
|
|
|
| Tabular List, Table |
Financial Performance Measures As described in greater detail in the “Compensation Discussion & Analysis” section of this proxy statement, our approach to executive compensation is designed to directly link pay to performance, recognize both corpo rat e and individual performance, p ro mote long-term stock ownership, attract, retain and motivate talented executi ves , and balance risk and reward while taking into consideration stakeholder feedback as well as market trends and practices. The most important performance measures used by the Company to link CAP to the Company’s NEOs for the most recently completed fiscal year to the Company’s performance are:
| |
• |
|
Adjusted operating income; |
| |
• |
|
Company strategic objectives. |
|
|
|
| Total Shareholder Return Amount |
$ 79.1
|
70.16
|
89.32
|
| Peer Group Total Shareholder Return Amount |
144.03
|
121.64
|
43.45
|
| Net Income (Loss) |
$ 505,680,000
|
$ (190,147,000)
|
$ (395,560,000)
|
| Company Selected Measure Amount |
(122,520,000)
|
133,555,000
|
(271,012,000)
|
| PEO Name |
Mr. Dolan
|
|
|
| Measure:: 1 |
|
|
|
| Pay vs Performance Disclosure |
|
|
|
| Name |
Adjusted operating income
|
|
|
| Measure:: 2 |
|
|
|
| Pay vs Performance Disclosure |
|
|
|
| Name |
Net revenue
|
|
|
| Measure:: 3 |
|
|
|
| Pay vs Performance Disclosure |
|
|
|
| Name |
Company strategic objectives
|
|
|
| PEO | Value Of Equity Awards As Reported [Member] |
|
|
|
| Pay vs Performance Disclosure |
|
|
|
| Adjustment to Compensation, Amount |
$ 10,973,100
|
$ 11,148,811
|
$ 5,848,014
|
| PEO | Year End Fair Value Of Equity Awards Granted In Covered Fiscal Year That Were Unvested At End Of Covered Fiscal Year [Member] |
|
|
|
| Pay vs Performance Disclosure |
|
|
|
| Adjustment to Compensation, Amount |
5,409,525
|
8,917,617
|
12,266,002
|
| PEO | Change In Fair Value From End Of Prior Fiscal Year To Vesting Date For Awards Made In Prior Fiscal Years That Vested During Covered Fiscal Year [Member] |
|
|
|
| Pay vs Performance Disclosure |
|
|
|
| Adjustment to Compensation, Amount |
593,819
|
(448,675)
|
(40,174)
|
| PEO | Change In Fair Value From End Of Prior Fiscal Year To End Of Covered Fiscal Year For Awards Granted In Prior Fiscal Years That Were Unvested At End Of Covered Fiscal Year [Member] |
|
|
|
| Pay vs Performance Disclosure |
|
|
|
| Adjustment to Compensation, Amount |
738,702
|
(7,289,299)
|
(1,963,852)
|
| PEO | Fair Value Of Awards Forfeited In Covered Fiscal Year Determined At End Of Prior Fiscal Year [Member] |
|
|
|
| Pay vs Performance Disclosure |
|
|
|
| Adjustment to Compensation, Amount |
|
|
13,479,255
|
| Non-PEO NEO | Change In Pension Value As Reported [Member] |
|
|
|
| Pay vs Performance Disclosure |
|
|
|
| Adjustment to Compensation, Amount |
1,822
|
1,966
|
15
|
| Non-PEO NEO | Value Of Equity Awards As Reported [Member] |
|
|
|
| Pay vs Performance Disclosure |
|
|
|
| Adjustment to Compensation, Amount |
1,483,542
|
1,323,798
|
1,350,659
|
| Non-PEO NEO | Year End Fair Value Of Equity Awards Granted In Covered Fiscal Year That Were Unvested At End Of Covered Fiscal Year [Member] |
|
|
|
| Pay vs Performance Disclosure |
|
|
|
| Adjustment to Compensation, Amount |
1,006,528
|
831,644
|
1,506,926
|
| Non-PEO NEO | Change In Fair Value From End Of Prior Fiscal Year To Vesting Date For Awards Made In Prior Fiscal Years That Vested During Covered Fiscal Year [Member] |
|
|
|
| Pay vs Performance Disclosure |
|
|
|
| Adjustment to Compensation, Amount |
25,422
|
(50,542)
|
(19,205)
|
| Non-PEO NEO | Vesting Date Fair Value Of Equity Awards Granted In Covered Fiscal Year That Vested During Covered Fiscal Year [Member] |
|
|
|
| Pay vs Performance Disclosure |
|
|
|
| Adjustment to Compensation, Amount |
7,929
|
331,433
|
|
| Non-PEO NEO | Change In Fair Value From End Of Prior Fiscal Year To End Of Covered Fiscal Year For Awards Granted In Prior Fiscal Years That Were Unvested At End Of Covered Fiscal Year [Member] |
|
|
|
| Pay vs Performance Disclosure |
|
|
|
| Adjustment to Compensation, Amount |
$ 50,134
|
$ (815,587)
|
$ 46,453
|