false
0001214816
0001214816
2024-05-30
2024-05-30
0001214816
us-gaap:CommonStockMember
2024-05-30
2024-05-30
0001214816
us-gaap:SeriesEPreferredStockMember
2024-05-30
2024-05-30
iso4217:USD
xbrli:shares
iso4217:USD
xbrli:shares
UNITED
STATES
SECURITIES AND EXCHANGE COMMISSION
Washington, D.C. 20549
FORM 8-K
Current Report
Pursuant to Section 13 or 15(d) of the
Securities Exchange Act of 1934
Date of
Report (Date of earliest event reported): May 30, 2024
AXIS CAPITAL HOLDINGS LIMITED
(Exact Name Of Registrant As Specified In Charter)
| Bermuda |
|
001-31721 |
|
98-0395986 |
| (State of Incorporation) |
|
(Commission File No.) |
|
(I.R.S. Employer
Identification No.) |
92 Pitts Bay Road
Pembroke, Bermuda HM 08
(Address of principal executive offices, including zip code)
(441) 496-2600
(Registrant's telephone number, including area code)
Not applicable
(Former name or address, if changed since last report)
Check the appropriate
box below if the Form 8-K filing is intended to simultaneously satisfy the filing obligation of the registrant under any of the
following provisions (see General Instruction A.2 below):
| ¨ | Written
communications pursuant to Rule 425 under the Securities Act (17 CFR 230.425) |
| ¨ | Soliciting
material pursuant to Rule 14a-12 under the Exchange Act (17 CFR 240.14a-12) |
| ¨ | Pre-commencement
communications pursuant to Rule 14d-2(b) under the Exchange Act (17 CFR 240.14d-2(b)) |
| ¨ | Pre-commencement
communications pursuant to Rule 13e-4(c) under the Exchange Act (17 CFR 240.13e(4)(c)) |
Securities registered pursuant
to Section 12(b) of the Exchange Act:
| Title of each class |
Trading Symbol(s) |
Name of each exchange on which registered |
| Common shares, par value $0.0125 per share |
AXS |
New York Stock Exchange |
| Depositary
shares, each representing a 1/100th interest in a 5.50% Series E preferred share |
AXS PRE |
New York Stock Exchange |
Indicate by check mark whether
the registrant is an emerging growth company as defined in Rule 405 of the Securities Act of 1933 (17 CFR §230.405) or Rule 12b-2
of the Securities Exchange Act of 1934 (17 CFR §240.12b-2).
Emerging
growth company ¨
If
an emerging growth company, indicate by check mark if the registrant has elected not to use the extended transition period for
complying with any new or revised financial accounting standards provided pursuant to Section 13(a) of the Exchange Act. ¨
| Item 7.01 |
Regulation FD Disclosure. |
On May 30, 2024, beginning at 9:00 a.m. (ET),
AXIS Capital Holdings Limited (the "Company") is holding an Investor Day. Vincent Tizzio, President and Chief Executive Officer,
Peter Vogt, Chief Financial Officer, and other members of the Company’s leadership team will discuss the Company's strategic priorities
and outlook.
The presentation is attached as Exhibit 99.1 to
this Report on Form 8-K and incorporated herein by reference. The presentation is also available on our investor website at investor.axiscapital.com,
along with a live webcast. A replay of the webcast will be available after the event on the same website.
The preceding information, as well as Exhibit
99.1 referenced herein, shall not be deemed “filed” for purposes of Section 18 of the Securities Exchange Act of 1934, nor
shall it be deemed incorporated by reference in any filing under the Securities Act of 1933 or the Securities Exchange Act of 1934 unless
the Company expressly so incorporates such information by reference.
Cautionary Note on Forward-Looking Statements
For more information regarding the forward-looking
statements included in this Report on Form 8-K (including Exhibit 99.1 attached hereto), see the Cautionary Note on Forward-Looking Statements
included in Exhibit 99.1.
| Item 9.01 |
Financial Statements and Exhibits |
(d) Exhibits
SIGNATURES
Pursuant to the requirements of the Securities
Exchange Act of 1934, the registrant has duly caused this report to be signed on its behalf by the undersigned hereunto duly authorized.
Dated: May 30, 2024
| |
AXIS CAPITAL HOLDINGS LIMITED |
| |
|
|
| |
|
| |
By: |
/s/ G. Christina Gray-Trefry |
| |
|
G. Christina Gray-Trefry |
| |
|
General Counsel and Secretary |
Exhibit 99.1

Investor Day May 30, 2024
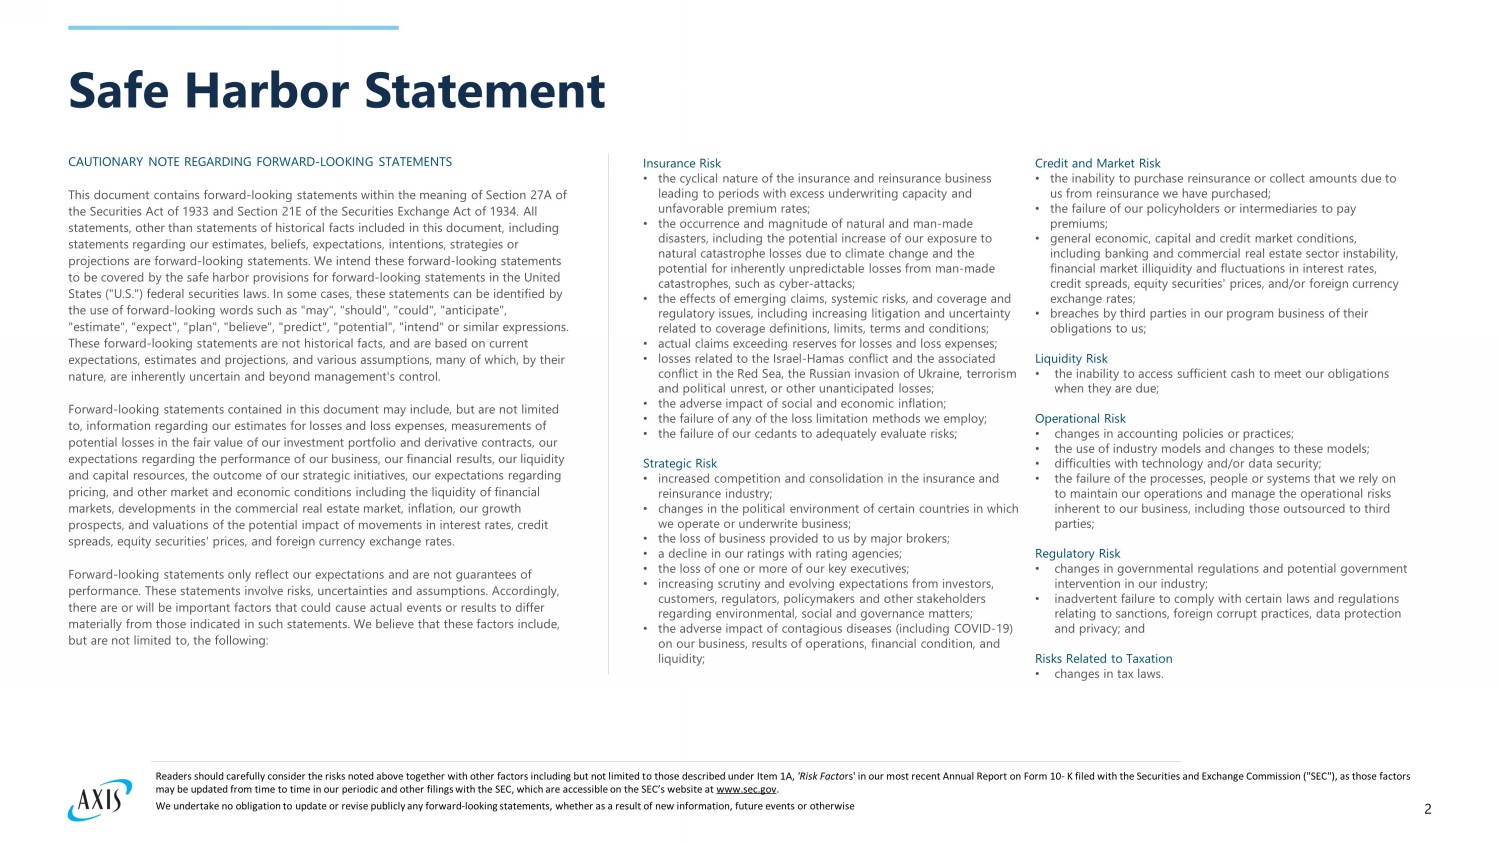
2 Safe Harbor Statement CAUTIONARY NOTE REGARDING FORWARD - LOOKING STATEMENTS This document contains forward - looking statements within the meaning of Section 27A of the Securities Act of 1933 and Section 21E of the Securities Exchange Act of 1934. All statements, other than statements of historical facts included in this document, including statements regarding our estimates, beliefs, expectations, intentions, strategies or projections are forward - looking statements. We intend these forward - looking statements to be covered by the safe harbor provisions for forward - looking statements in the United States ("U.S.") federal securities laws. In some cases, these statements can be identified by the use of forward - looking words such as "may", "should", "could", "anticipate", "estimate", "expect", "plan", "believe", "predict", "potential", "intend" or similar expressions. These forward - looking statements are not historical facts, and are based on current expectations, estimates and projections, and various assumptions, many of which, by their nature, are inherently uncertain and beyond management's control. Forward - looking statements contained in this document may include, but are not limited to, information regarding our estimates for losses and loss expenses, measurements of potential losses in the fair value of our investment portfolio and derivative contracts, our expectations regarding the performance of our business, our financial results, our liquidity and capital resources, the outcome of our strategic initiatives, our expectations regarding pricing, and other market and economic conditions including the liquidity of financial markets, developments in the commercial real estate market, inflation, our growth prospects, and valuations of the potential impact of movements in interest rates, credit spreads, equity securities' prices, and foreign currency exchange rates. Forward - looking statements only reflect our expectations and are not guarantees of performance. These statements involve risks, uncertainties and assumptions. Accordingly, there are or will be important factors that could cause actual events or results to differ materially from those indicated in such statements. We believe that these factors include, but are not limited to, the following: Insurance Risk • the cyclical nature of the insurance and reinsurance business leading to periods with excess underwriting capacity and unfavorable premium rates; • the occurrence and magnitude of natural and man - made disasters, including the potential increase of our exposure to natural catastrophe losses due to climate change and the potential for inherently unpredictable losses from man - made catastrophes, such as cyber - attacks; • the effects of emerging claims, systemic risks, and coverage and regulatory issues, including increasing litigation and uncertainty related to coverage definitions, limits, terms and conditions; • actual claims exceeding reserves for losses and loss expenses; • losses related to the Israel - Hamas conflict and the associated conflict in the Red Sea, the Russian invasion of Ukraine, terrorism and political unrest, or other unanticipated losses; • the adverse impact of social and economic inflation; • the failure of any of the loss limitation methods we employ; • the failure of our cedants to adequately evaluate risks; Strategic Risk • increased competition and consolidation in the insurance and reinsurance industry; • changes in the political environment of certain countries in which we operate or underwrite business; • the loss of business provided to us by major brokers; • a decline in our ratings with rating agencies; • the loss of one or more of our key executives; • increasing scrutiny and evolving expectations from investors, customers, regulators, policymakers and other stakeholders regarding environmental, social and governance matters; • the adverse impact of contagious diseases (including COVID - 19) on our business, results of operations, financial condition, and liquidity; Credit and Market Risk • the inability to purchase reinsurance or collect amounts due to us from reinsurance we have purchased; • the failure of our policyholders or intermediaries to pay premiums; • general economic, capital and credit market conditions, including banking and commercial real estate sector instability, financial market illiquidity and fluctuations in interest rates, credit spreads, equity securities' prices, and/or foreign currency exchange rates; • breaches by third parties in our program business of their obligations to us; Liquidity Risk • the inability to access sufficient cash to meet our obligations when they are due; Operational Risk • changes in accounting policies or practices; • the use of industry models and changes to these models; • difficulties with technology and/or data security; • the failure of the processes, people or systems that we rely on to maintain our operations and manage the operational risks inherent to our business, including those outsourced to third parties; Regulatory Risk • changes in governmental regulations and potential government intervention in our industry; • inadvertent failure to comply with certain laws and regulations relating to sanctions, foreign corrupt practices, data protection and privacy; and Risks Related to Taxation • changes in tax laws. Readers should carefully consider the risks noted above together with other factors including but not limited to those described under Item 1 A, 'Risk Facto rs' in our most recent Annual Report on Form 10 - K filed with the Securities and Exchange Commission ("SEC"), as those factors may be updated from time to time in our periodic and other filings with the SEC, which are accessible on the SEC’s website at www . sec . gov . We undertake no obligation to update or revise publicly any forward - looking statements, whether as a result of new information, future events or otherwise
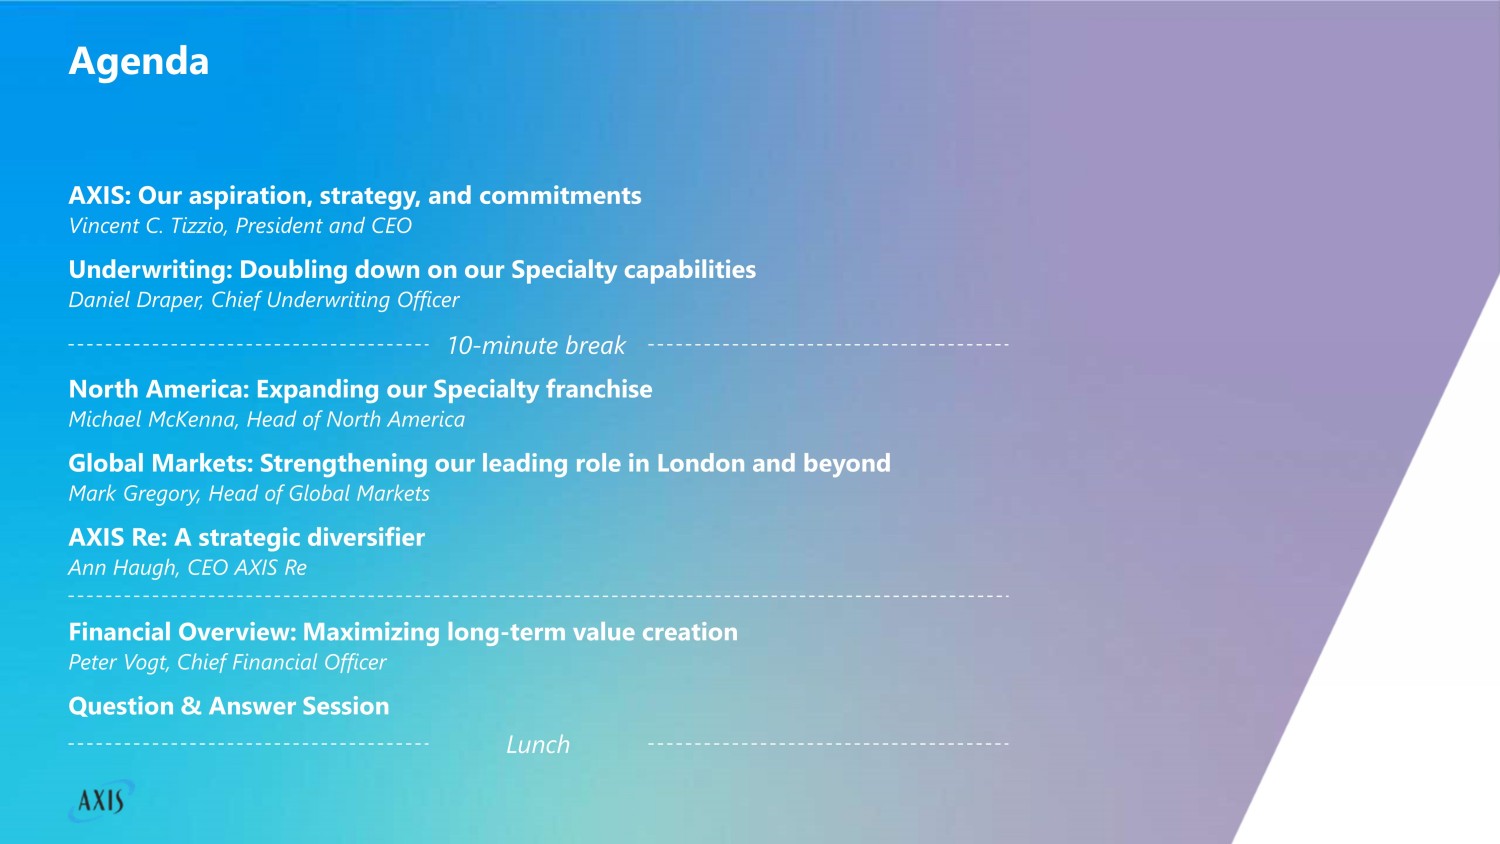
AXIS: Our aspiration, strategy, and commitments Vincent C. Tizzio, President and CEO Underwriting: Doubling down on our Specialty capabilities Daniel Draper, Chief Underwriting Officer Global Markets: Strengthening our leading role in London and beyond Mark Gregory, Head of Global Markets North America: Expanding our Specialty franchise Michael McKenna, Head of North America AXIS Re: A strategic diversifier Ann Haugh, CEO AXIS Re Financial Overview: Maximizing long - term value creation Peter Vogt, Chief Financial Officer Question & Answer Session 10 - minute break Lunch Agenda

AXIS: Our aspiration, strategy and commitments Vincent C. Tizzio President and CEO
5 AXIS aspiration Be the leading Specialty underwriter , generating consistent top - quartile diluted book value per common share (“DBVPS”) growth for shareholders
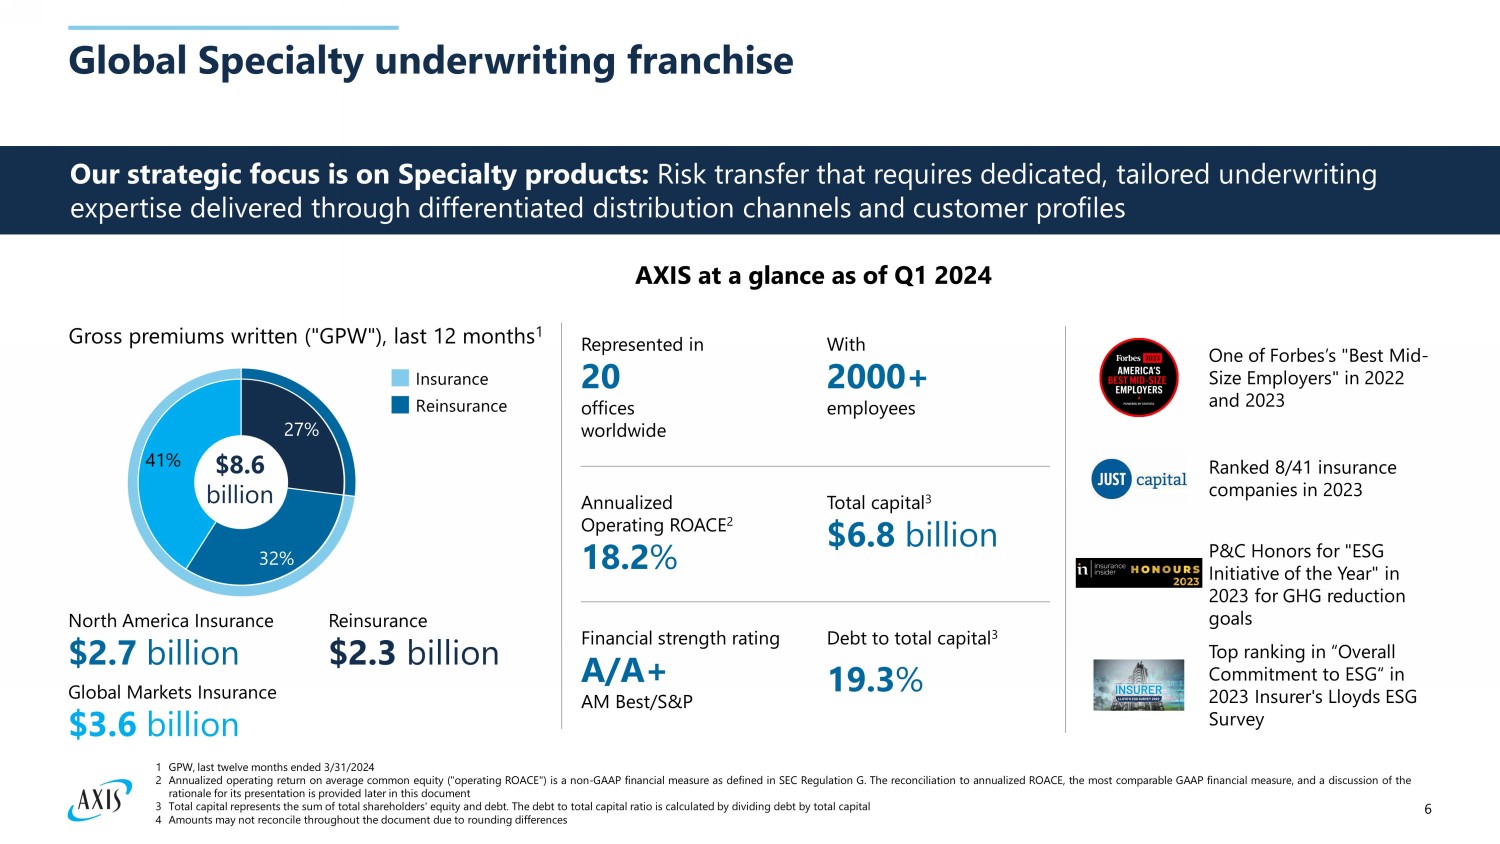
6 Global Specialty underwriting franchise 27% 32% 41% Insurance Reinsurance AXIS at a glance as of Q1 2024 Annualized Operating ROACE 2 18.2 % Total capital 3 $6.8 billion Financial strength rating A/A+ AM Best/S&P Debt to total capital 3 19.3 % Represented in 20 offices worldwide With 2000+ employees North America Insurance $2.7 billion Global Markets Insurance $3 .6 billion Reinsurance $2.3 billion Our strategic focus is on Specialty products: Risk transfer that requires dedicated, tailored underwriting expertise delivered through differentiated distribution channels and customer profiles $8.6 billion Ranked 8/41 insurance companies in 2023 One of Forbes’s "Best Mid - Size Employers" in 2022 and 2023 P&C Honors for "ESG Initiative of the Year" in 2023 for GHG reduction goals Top ranking in “Overall Commitment to ESG“ in 2023 Insurer's Lloyds ESG Survey 1 GPW, last twelve months ended 3 / 31 / 2024 2 Annualized operating return on average common equity ("operating ROACE") is a non - GAAP financial measure as defined in SEC Regulation G . The reconciliation to annualized ROACE, the most comparable GAAP financial measure, and a discussion of the rationale for its presentation is provided later in this document 3 Total capital represents the sum of total shareholders' equity and debt . The debt to total capital ratio is calculated by dividing debt by total capital 4 Amounts may not reconcile throughout the document due to rounding differences Gross premiums written ("GPW"), last 12 months 1
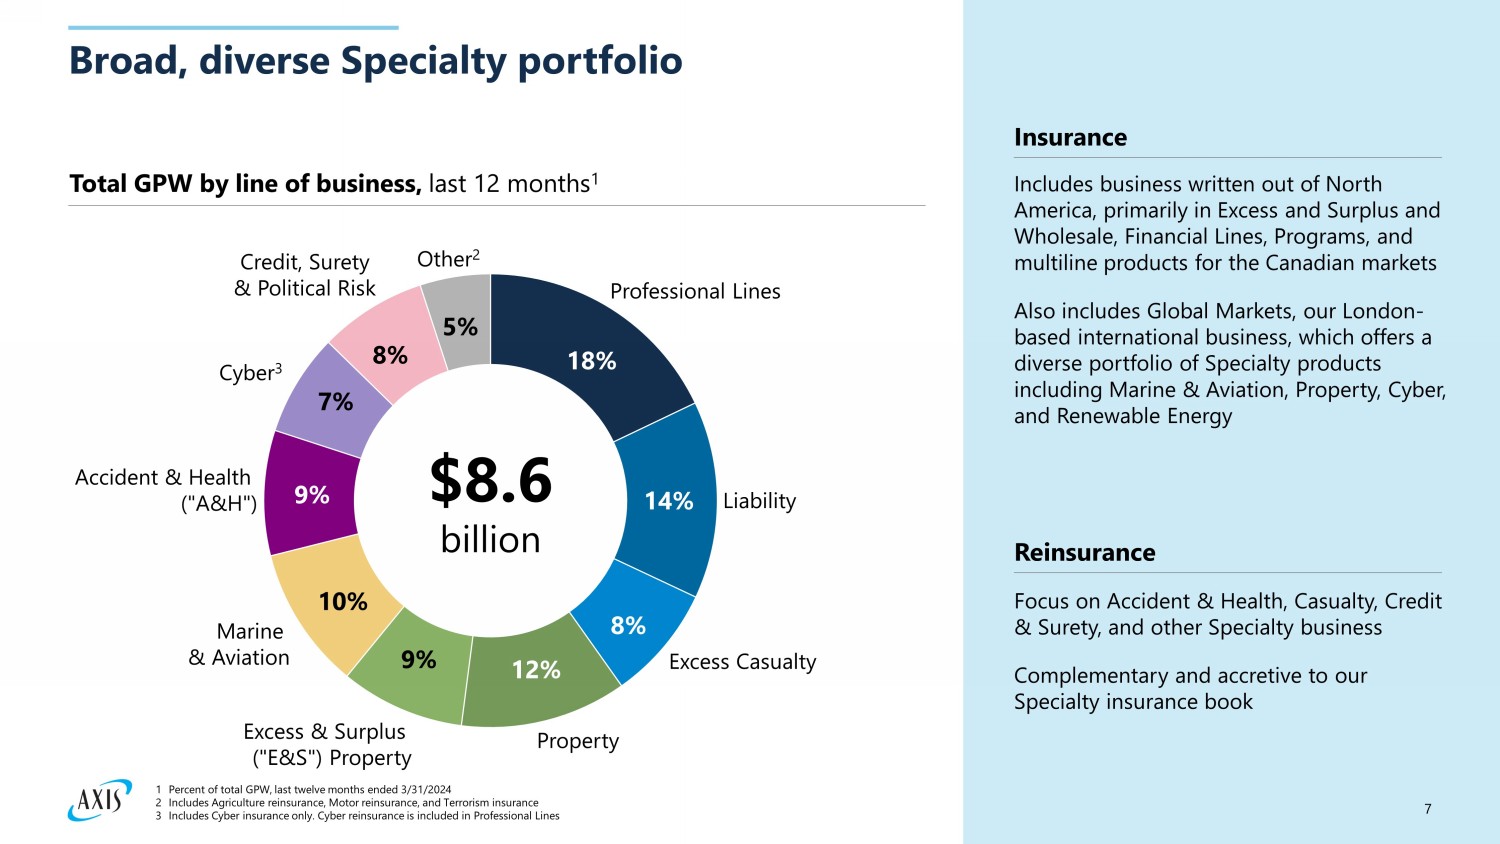
7 Broad, diverse Specialty portfolio 9% 18% 8% Professional Lines 14% Property Cyber 3 12% Excess Casualty Liability Excess & Surplus ("E&S") Property 10% Marine & Aviation 9% Accident & Health (" A&H ") 7% Other 2 8% Credit, Surety & Political Risk 5% $8.6 billion Total GPW by line of business, last 12 months 1 Insurance Reinsurance Includes business written out of North America, primarily in Excess and Surplus and Wholesale, Financial Lines, Programs, and multiline products for the Canadian markets Also includes Global Markets, our London - based international business, which offers a diverse portfolio of Specialty products including Marine & Aviation, Property, Cyber, and Renewable Energy Focus on Accident & Health, Casualty, Credit & Surety, and other Specialty business Complementary and accretive to our Specialty insurance book 1 Percent of total GPW, last twelve months ended 3/31/2024 2 Includes Agriculture reinsurance, Motor reinsurance, and Terrorism insurance 3 Includes Cyber insurance only. Cyber reinsurance is included in Professional Lines
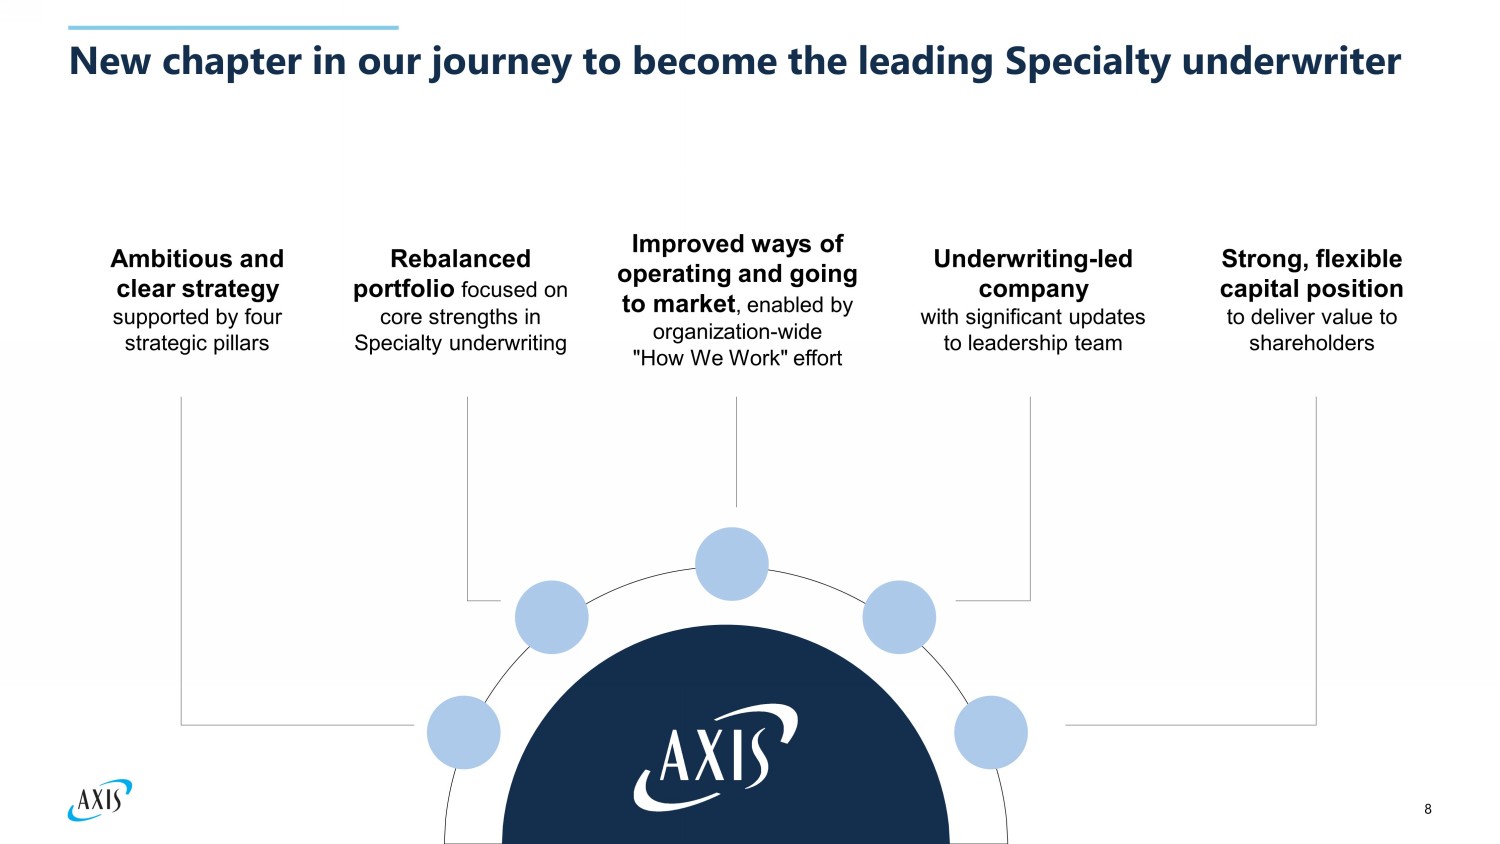
8 New chapter in our journey to become the leading Specialty underwriter Ambitious and clear strategy supported by four strategic pillars Rebalanced portfolio focused on core strengths in Specialty underwriting Improved ways of operating and going to market , enabled by organization - wide "How We Work" effort Underwriting - led company with significant updates to leadership team Strong, flexible capital position to deliver value to shareholders
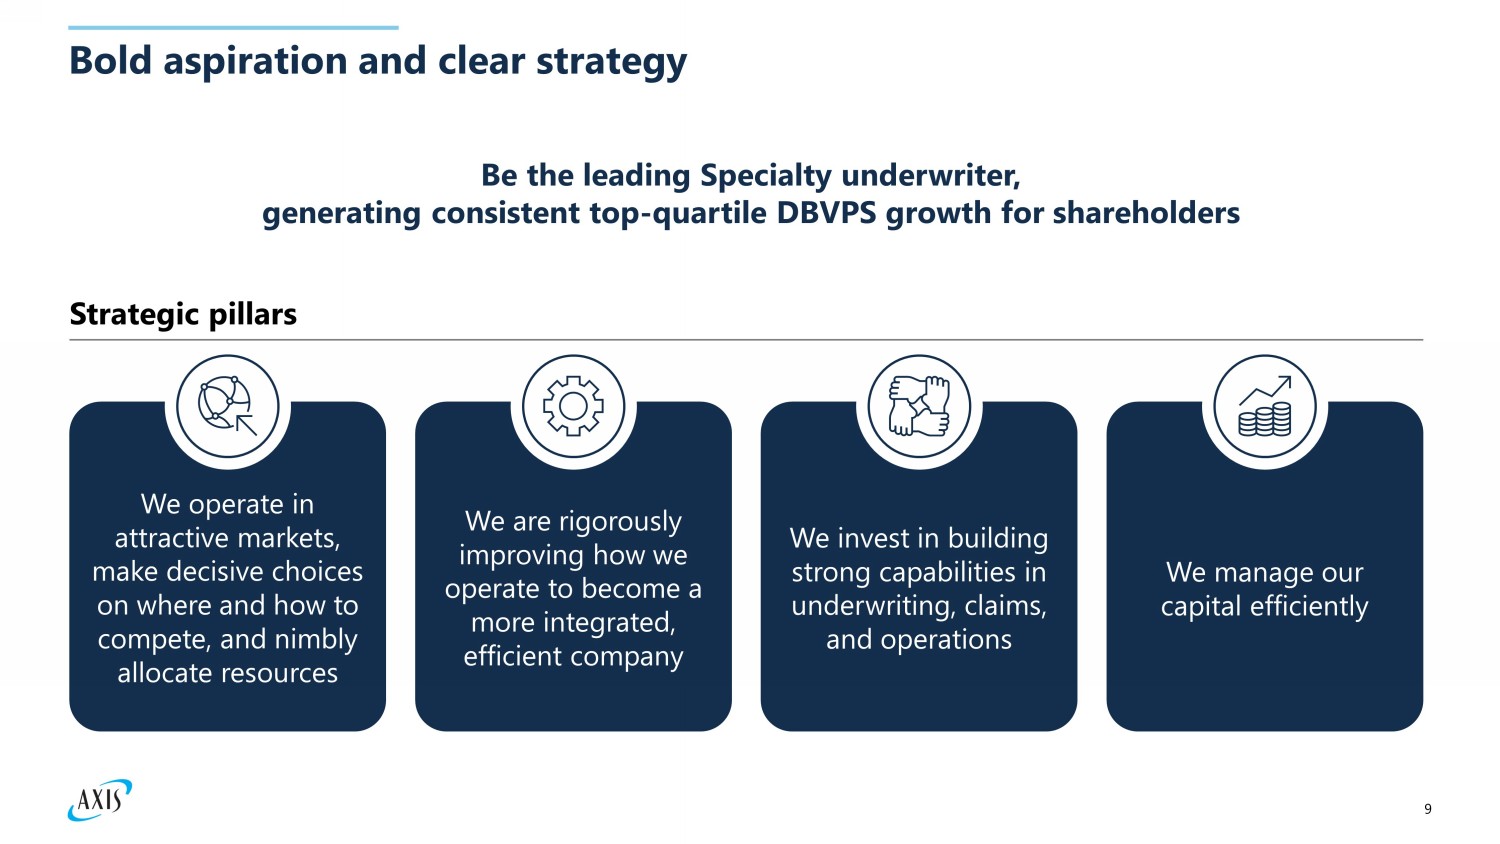
9 Bold aspiration and clear strategy We operate in attractive markets, make decisive choices on where and how to compete, and nimbly allocate resources We manage our capital efficiently We invest in building strong capabilities in underwriting, claims, and operations We are rigorously improving how we operate to become a more integrated, efficient company Be the leading Specialty underwriter, generating consistent top - quartile DBVPS growth for shareholders Strategic pillars
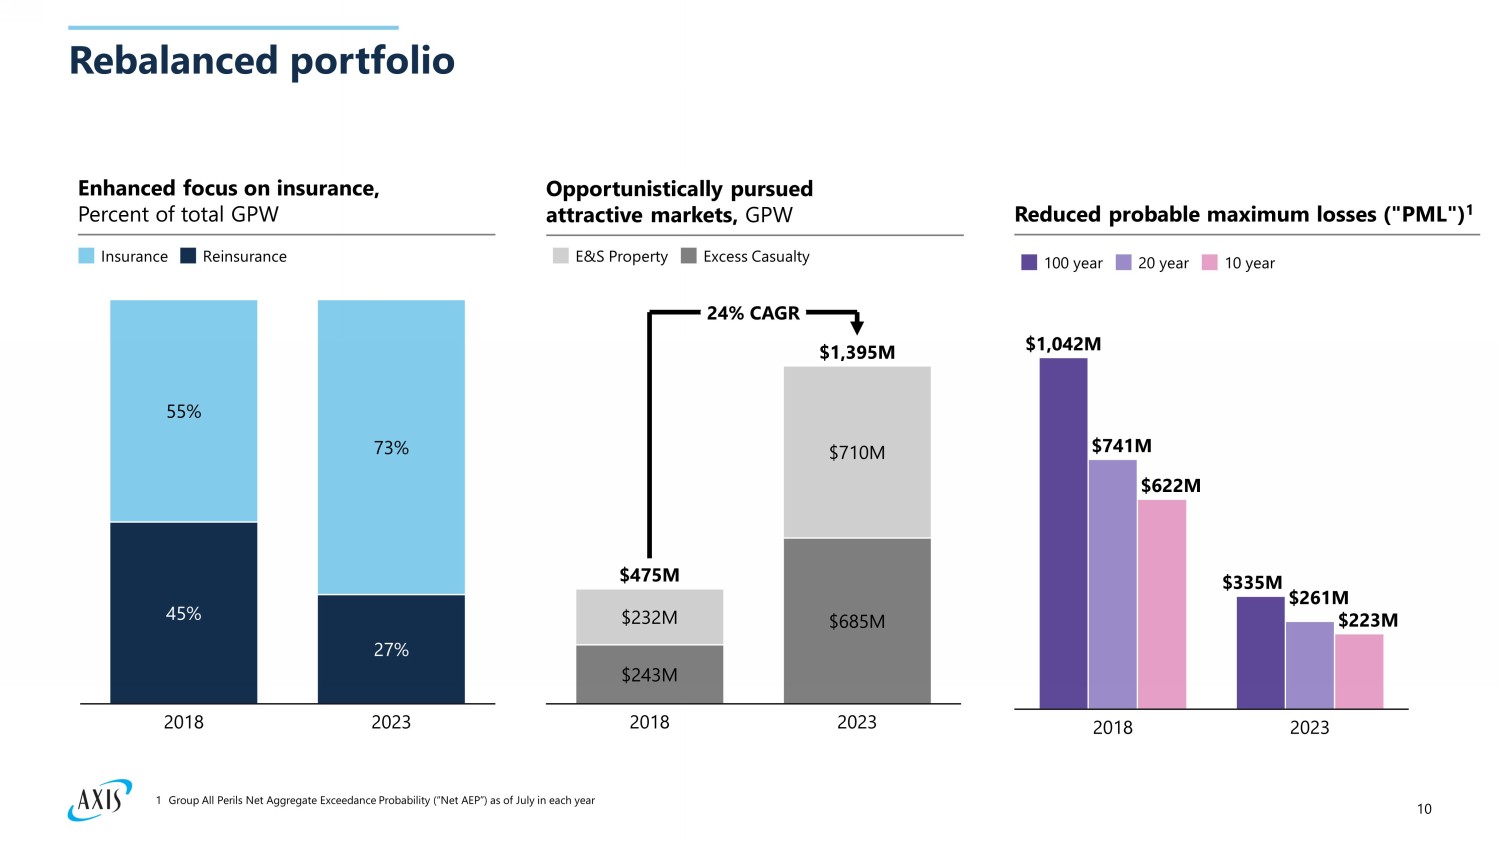
10 Rebalanced portfolio 45% 27% 55% 73% 2018 2023 Insurance Reinsurance Enhanced focus on insurance, Percent of total GPW Reduced probable maximum losses ("PML") 1 Opportunistically pursued attractive markets, GPW $243M $685M $232M $710M 2018 2023 $475M $1,395M 24% CAGR E&S Property Excess Casualty 2018 2023 $1,042M $741M $622M $335M $261M $223M 100 year 20 year 10 year 1 Group All Perils Net Aggregate Exceedance Probability (“Net AEP”) as of July in each year
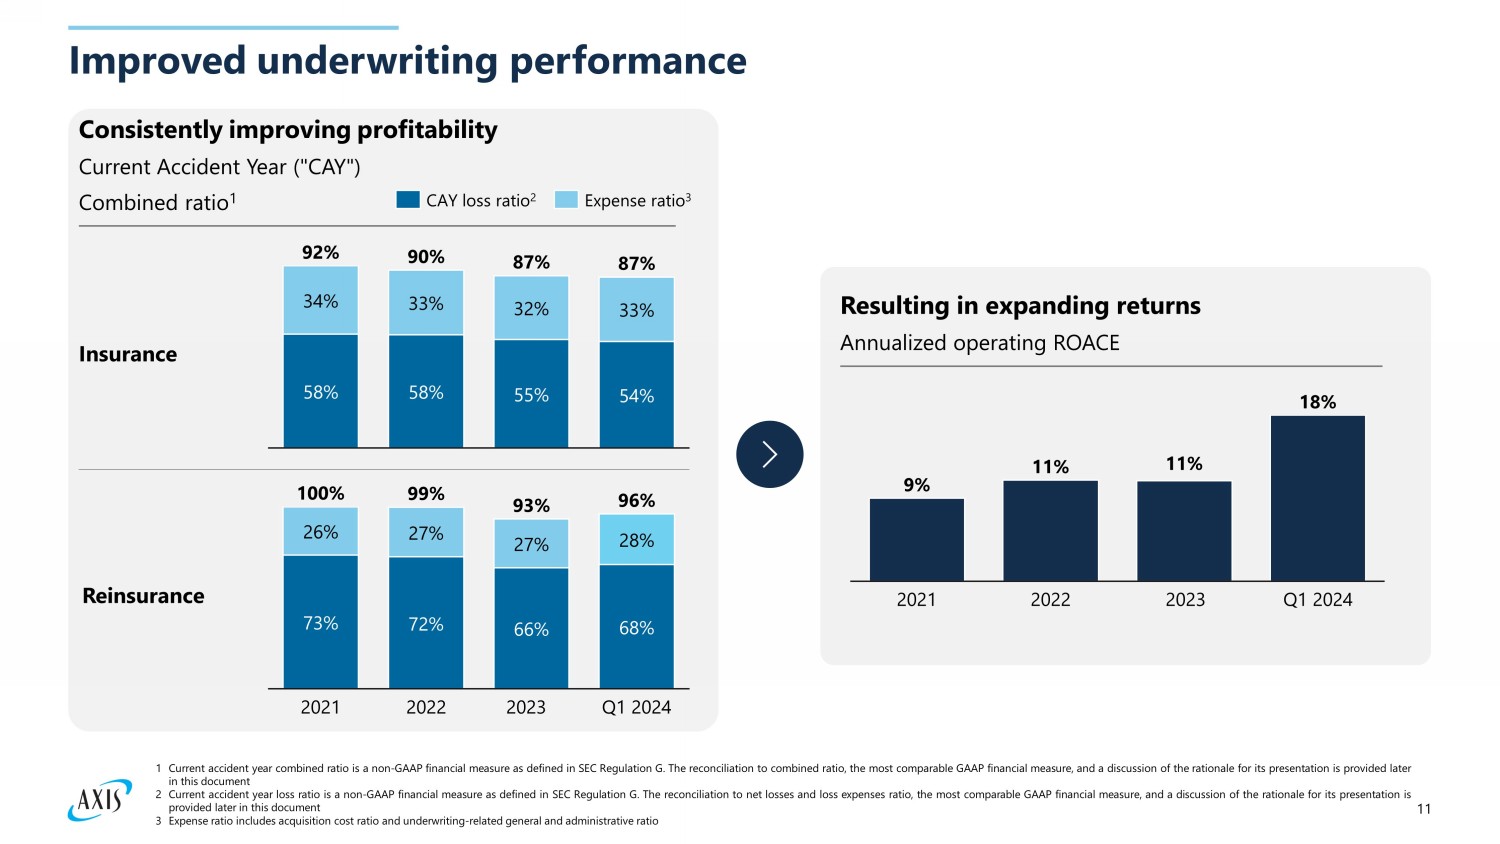
11 Consistently improving profitability Current Accident Year ("CAY") Combined ratio 1 Improved underwriting performance 58% 58% 55% 54% 34% 33% 32% 33% 92% 90% 87% 87% CAY loss ratio 2 Expense ratio 3 Insurance Reinsurance 73% 72% 66% 68% 26% 27% 27% 28% 2021 20 22 20 23 Q1 2024 100% 99% 93% 96% 9% 11% 11% 18% 2021 20 22 20 23 Q1 2024 Resulting in expanding returns Annualized operating ROACE 1 Current accident year combined ratio is a non - GAAP financial measure as defined in SEC Regulation G . The reconciliation to combined ratio, the most comparable GAAP financial measure, and a discussion of the rationale for its presentation is provided later in this document 2 Current accident year loss ratio is a non - GAAP financial measure as defined in SEC Regulation G . The reconciliation to net losses and loss expenses ratio, the most comparable GAAP financial measure, and a discussion of the rationale for its presentation is provided later in this document 3 Expense ratio includes acquisition cost ratio and underwriting - related general and administrative ratio
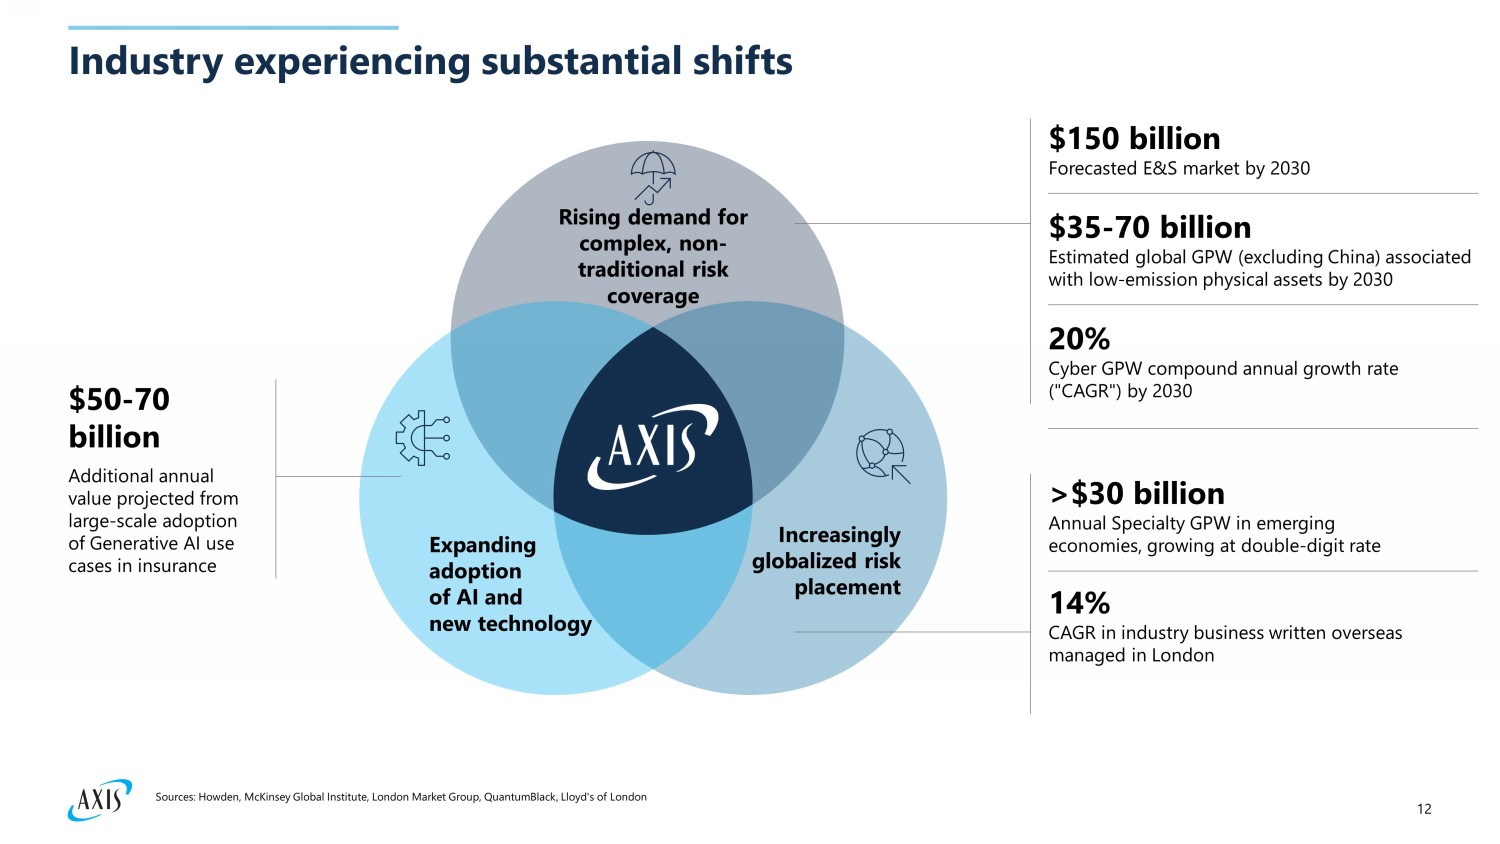
12 Industry experiencing substantial shifts Rising demand for complex, non - traditional risk coverage Increasingly globalized risk placement Expanding adoption of AI and new technology $50 - 70 billion Additional annual value projected from large - scale adoption of Generative AI use cases in insurance $35 - 70 billion E stimated global GPW (excluding China) associated with low - emission physical assets by 2030 $150 billion Forecasted E&S market by 2030 20% Cyber GPW compound a nnual gr owth r ate ("CAGR") by 2030 >$30 billion Annual Specialty GPW in emerging economies, growing at double - digit rate 14% CAGR in industry business written overseas managed in London Sources: Howden, McKinsey Global Institute, London Market Group, QuantumBlack , Lloyd's of London
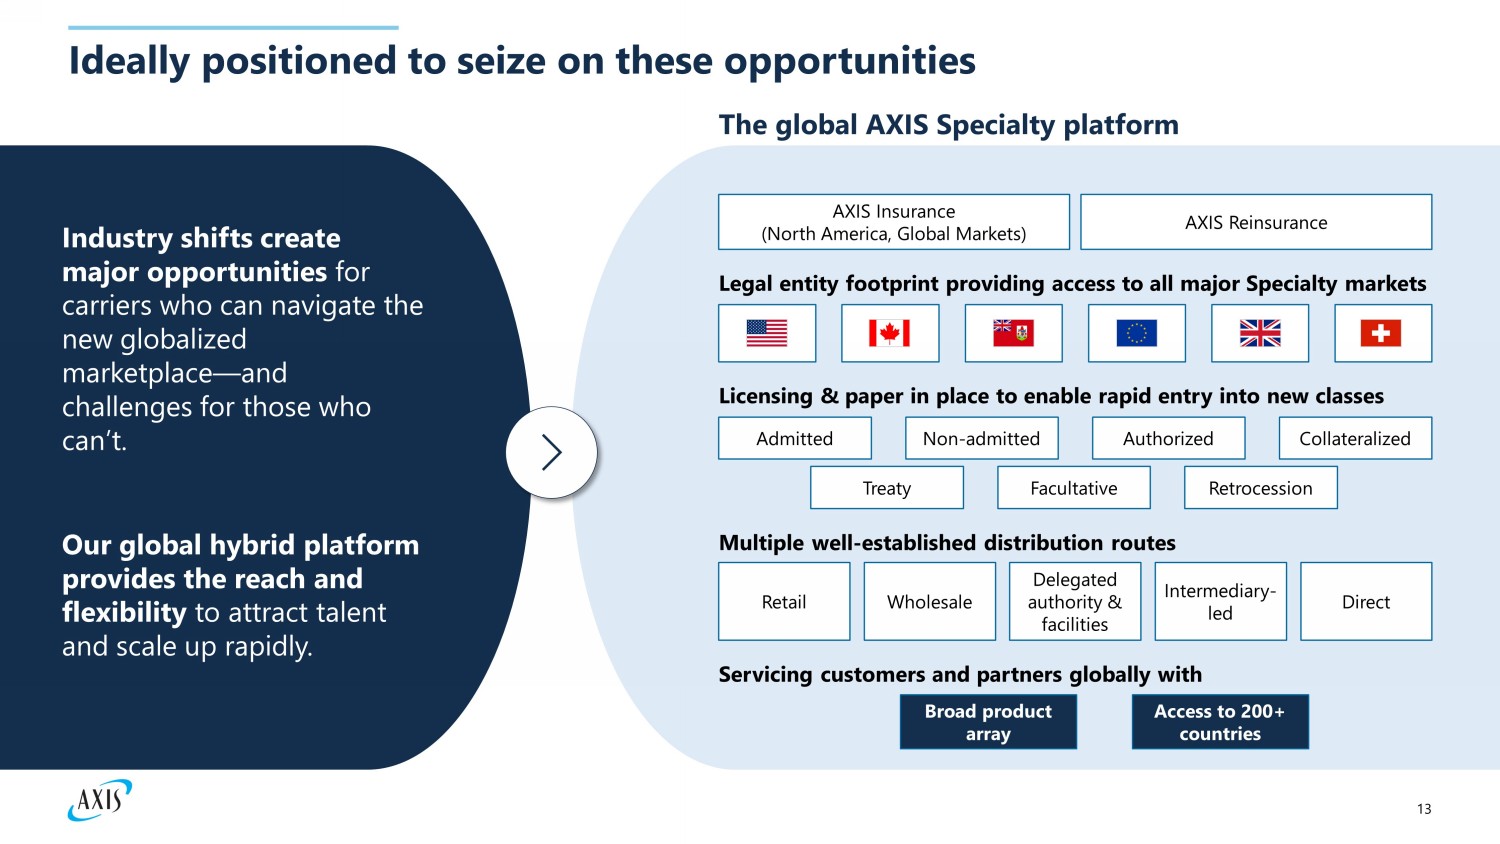
13 Ideally positioned to seize on these opportunities Industry shifts create major opportunities for carriers who can navigate the new globalized marketplace — and challenges for those who can’t. Our global hybrid platform provides the reach and flexibility to attract talent and scale up rapidly. The global AXIS Specialty platform AXIS Insurance (North America, Global Markets) AXIS Reinsurance Legal entity footprint providing access to all major Specialty markets Ba US Licensing & paper in place to enable rapid entry into new classes Admitted Non - admitted Authorized Collateralized Treaty Facultative Retrocession Multiple well - established distribution routes Retail Delegated authority & facilities Direct Wholesale Intermediary - led Servicing customers and partners globally with Access to 200+ countries Broad product array
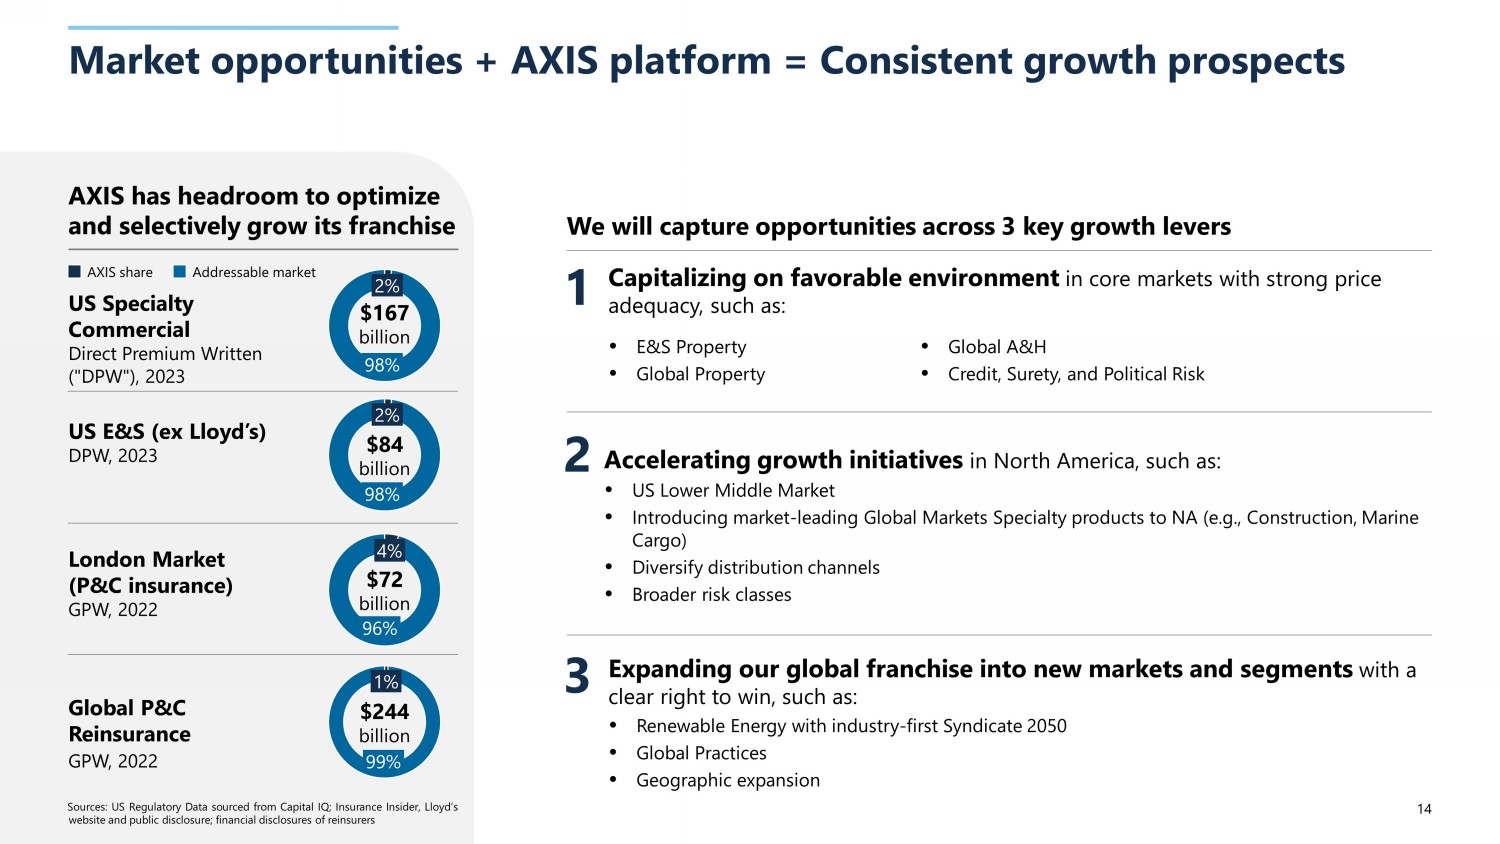
14 Market opportunities + AXIS platform = Consistent growth prospects AXIS has headroom to optimize and selectively grow its franchise US Specialty Commercial Direct Premium Written ("DPW"), 2023 US E&S (ex Lloyd’s) DPW, 2023 London Market (P&C insurance) GPW, 2022 Global P&C Reinsurance GPW, 2022 2% 98% AXIS share Addressable market We will capture opportunities across 3 key growth levers Capitalizing on favorable environment in core markets with strong price adequacy, such as: E&S Property Global Property Global A&H Credit, Surety, and Political Risk 1 Accelerating growth initiatives in North America, such as: US Lower Middle Market Introducing market - leading Global Markets Specialty products to NA (e.g., Construction, Marine Cargo) Diversify distribution channels Broader risk classes 2 Expanding our global franchise into new markets and segments with a clear right to win, such as: Renewable Energy with industry - first Syndicate 2050 Global Practices Geographic expansion 3 $167 billion 2% 98% $84 billion 4% 96% $72 billion 1% 99% $244 billion Sources : US Regulatory Data sourced from Capital IQ ; Insurance Insider, Lloyd’s website and public disclosure ; financial disclosures of reinsurers
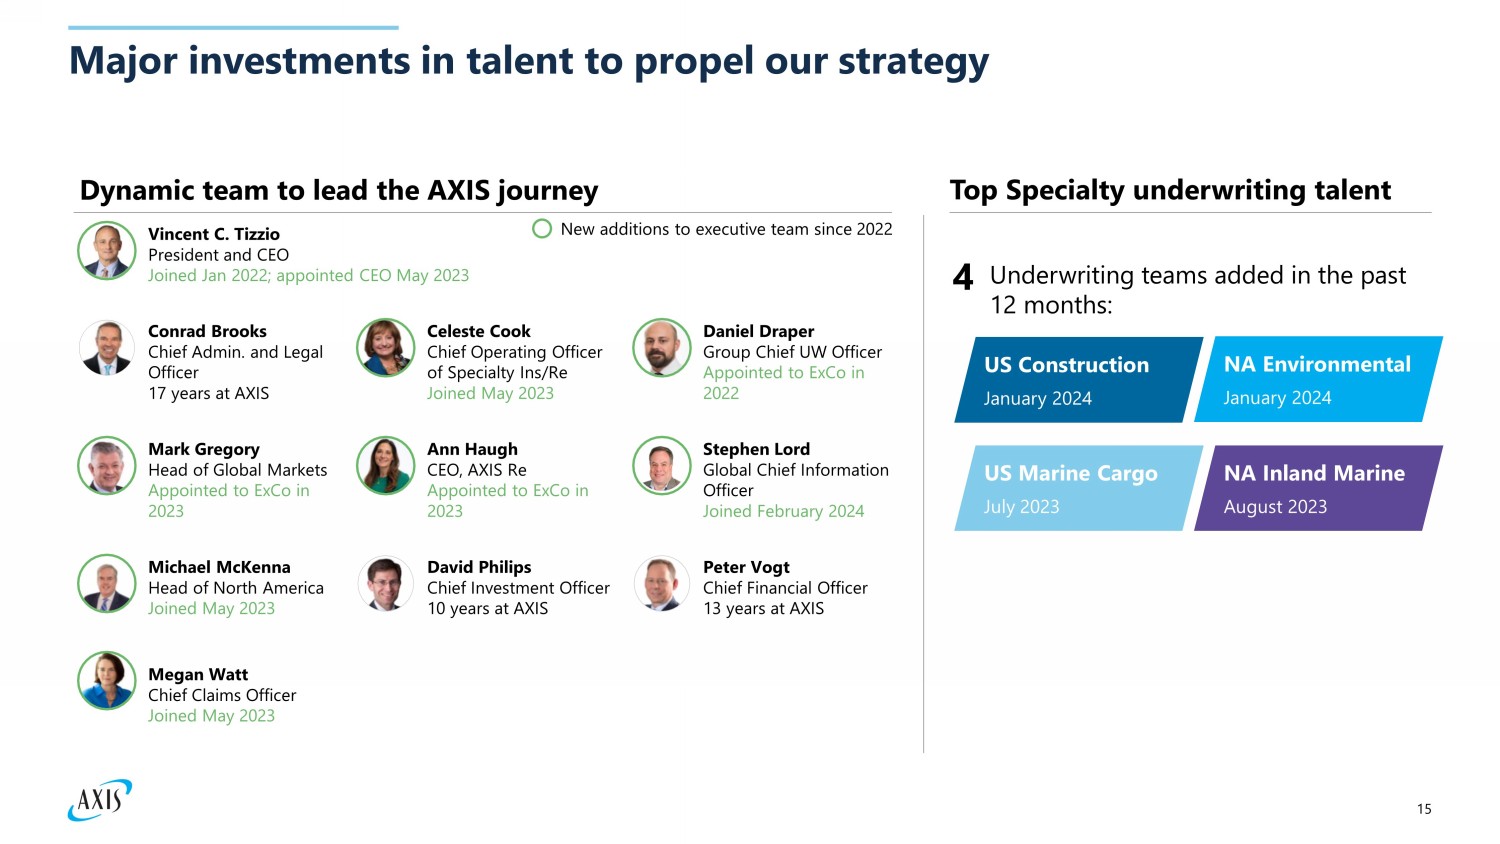
15 Major investments in talent to propel our strategy Top Specialty underwriting talent New additions to executive team since 2022 Dynamic team to lead the AXIS journey Vincent C. Tizzio President and CEO Joined Jan 2022; appointed CEO May 2023 Ann Haugh CEO, AXIS Re Appointed to ExCo in 2023 Michael McKenna Head of North America Joined May 2023 Mark Gregory Head of Global Markets Appointed to ExCo in 2023 Peter Vogt Chief Financial Officer 13 years at AXIS Daniel Draper Group Chief UW Officer Appointed to ExCo in 2022 Conrad Brooks Chief Admin. and Legal Officer 17 years at AXIS Megan Watt Chief Claims Officer Joined May 2023 Celeste Cook Chief Operating Officer of Specialty Ins/Re Joined May 2023 David Philips Chief Investment Officer 10 years at AXIS Stephen Lord Global Chief Information Officer Joined February 2024 Underwriting teams added in the past 12 months: 4 US Construction January 2024 NA Environmental January 2024 US Marine Cargo July 2023 NA Inland Marine August 2023
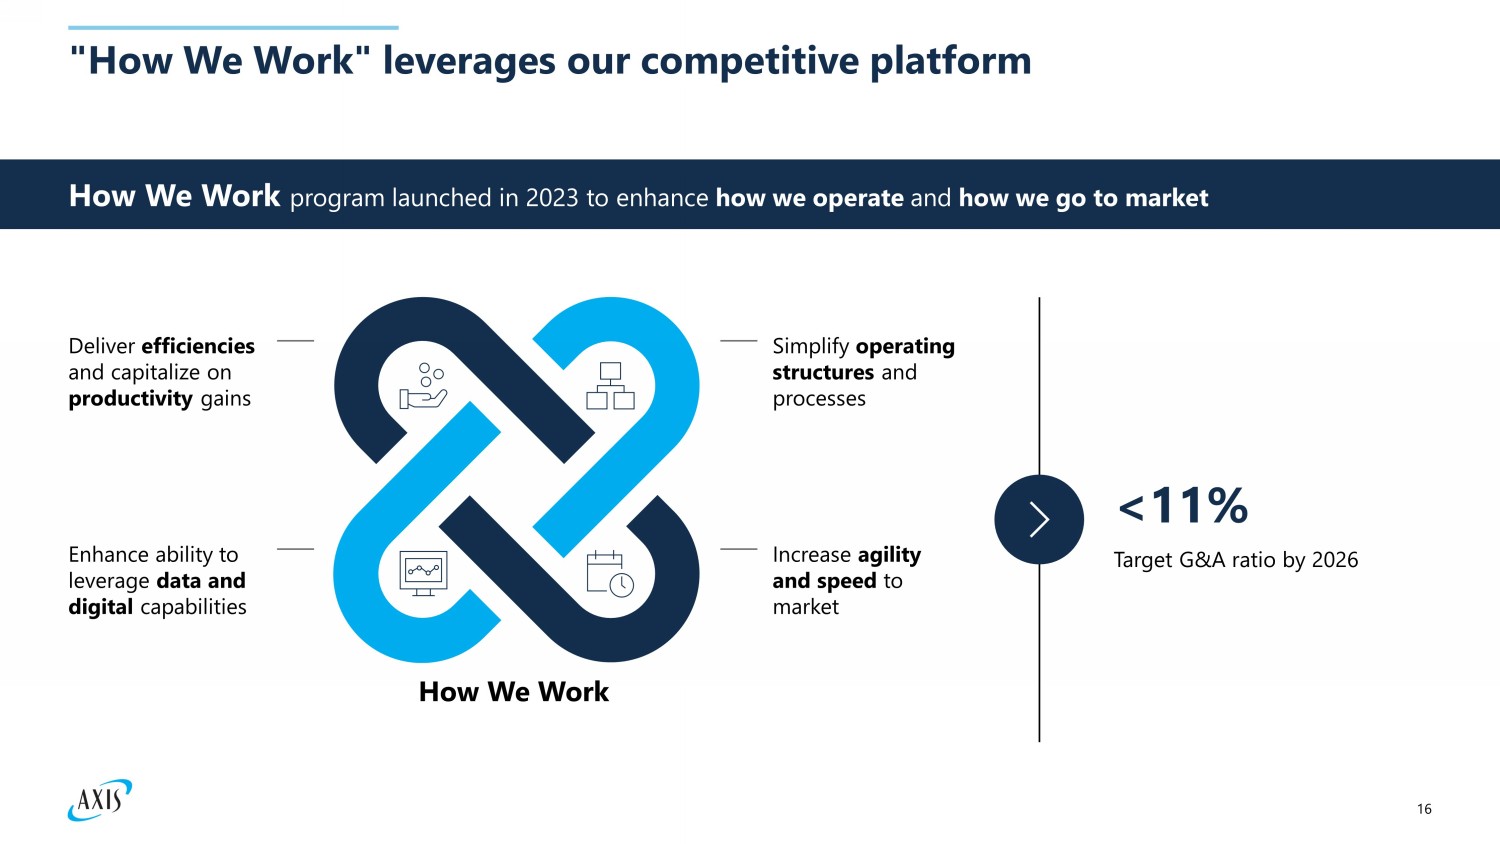
16 "How We Work" leverages our competitive platform How We Work program launched in 2023 to enhance how we operate and how we go to market < 11% Target G&A ratio by 2026 Simplify operating structures and processes Increase agility and speed to market Deliver efficiencies and capitalize on productivity gains Enhance ability to leverage data and digital capabilities How We Work
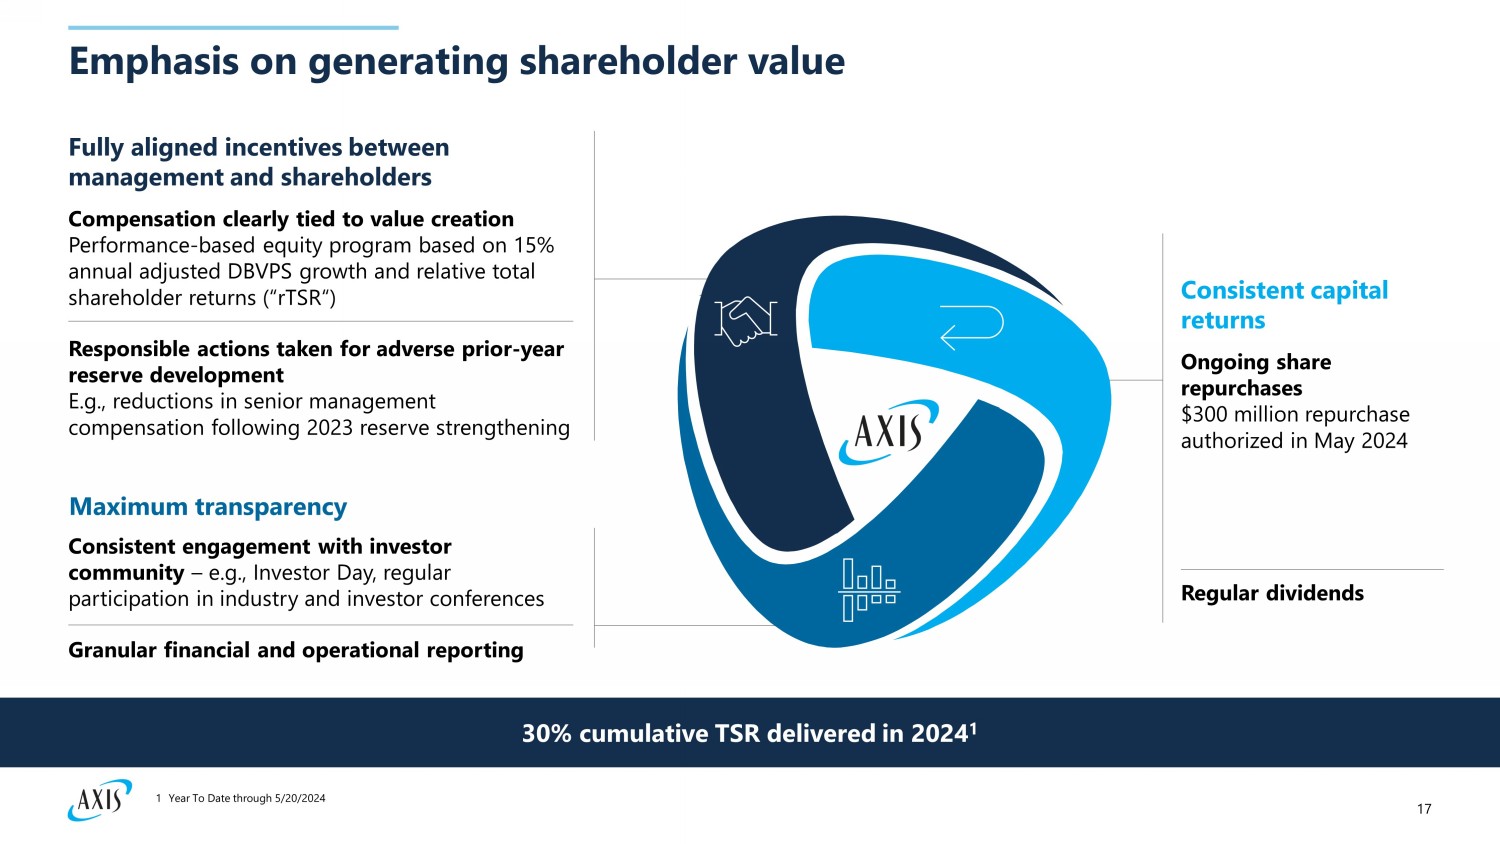
17 Emphasis on generating shareholder value Compensation clearly tied to value creation Performance - based equity program based on 15% annual adjusted DBVPS growth and relative total shareholder returns (“ rTSR “) Responsible actions taken for adverse prior - year reserve development E.g., reductions in senior management compensation following 2023 reserve strengthening Fully aligned incentives between management and shareholders Consistent engagement with investor community – e.g., Investor Day, regular participation in industry and investor conferences Maximum transparency Granular financial and operational reporting Ongoing share repurchases $300 million repurchase authorized in May 2024 Consistent capital returns Regular dividends 30% cumulative TSR delivered in 2024 1 1 Year To Date through 5/20/2024
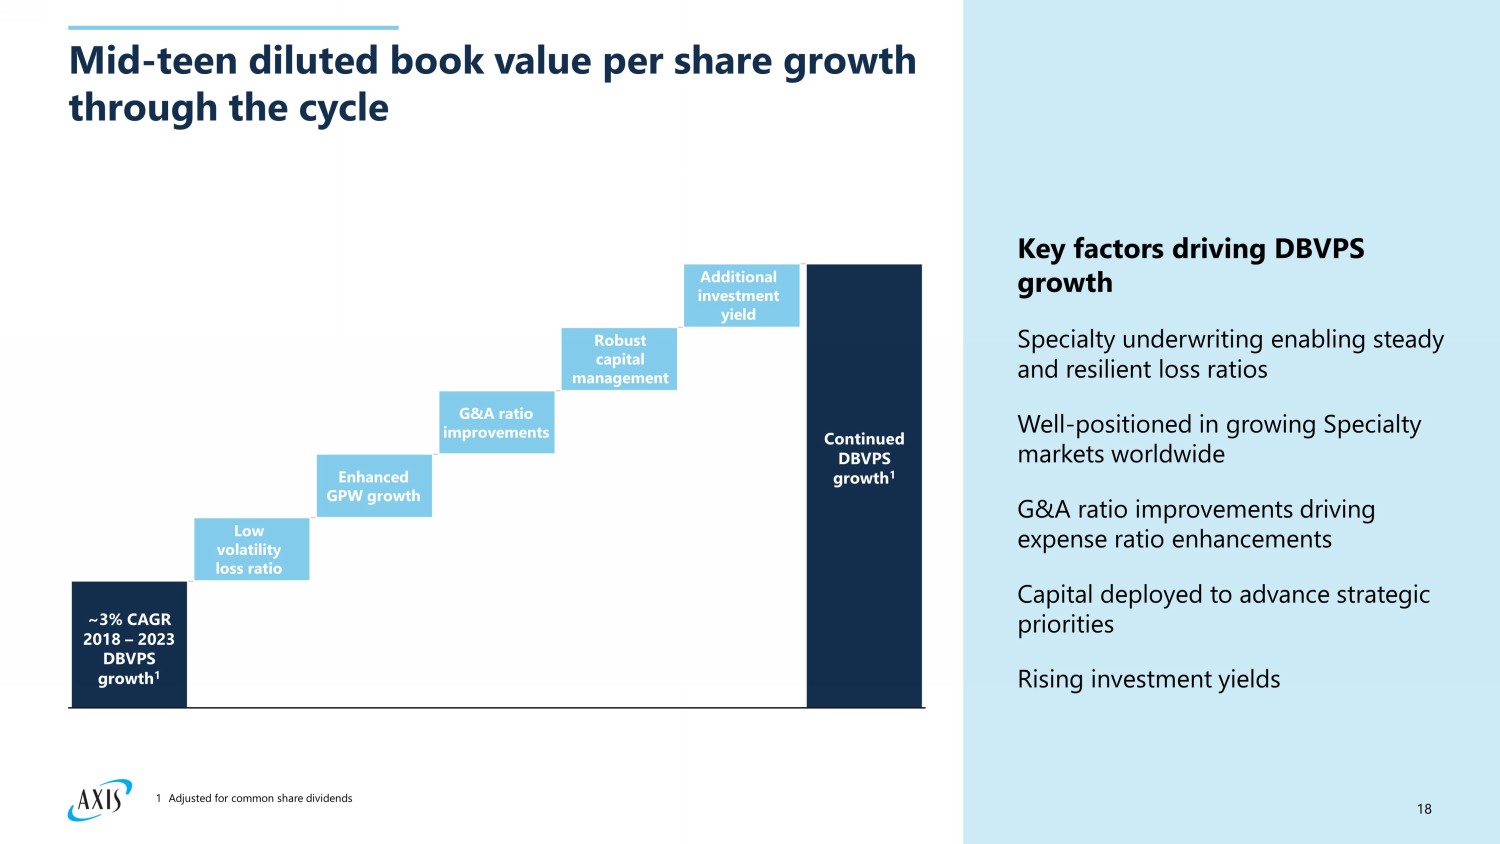
18 Mid - teen diluted book value per share growth through the cycle Enhanced GPW growth G&A ratio improvements Additional investment yield ~3% CAGR 2018 – 2023 DBVPS growth 1 Continued DBVPS growth 1 Low volatility loss ratio Key factors driving DBVPS growth Specialty underwriting enabling steady and resilient loss ratios Well - positioned in growing Specialty markets worldwide G&A ratio improvements driving expense ratio enhancements Capital deployed to advance strategic priorities Rising investment yields Robust capital management 1 Adjusted for common share dividends
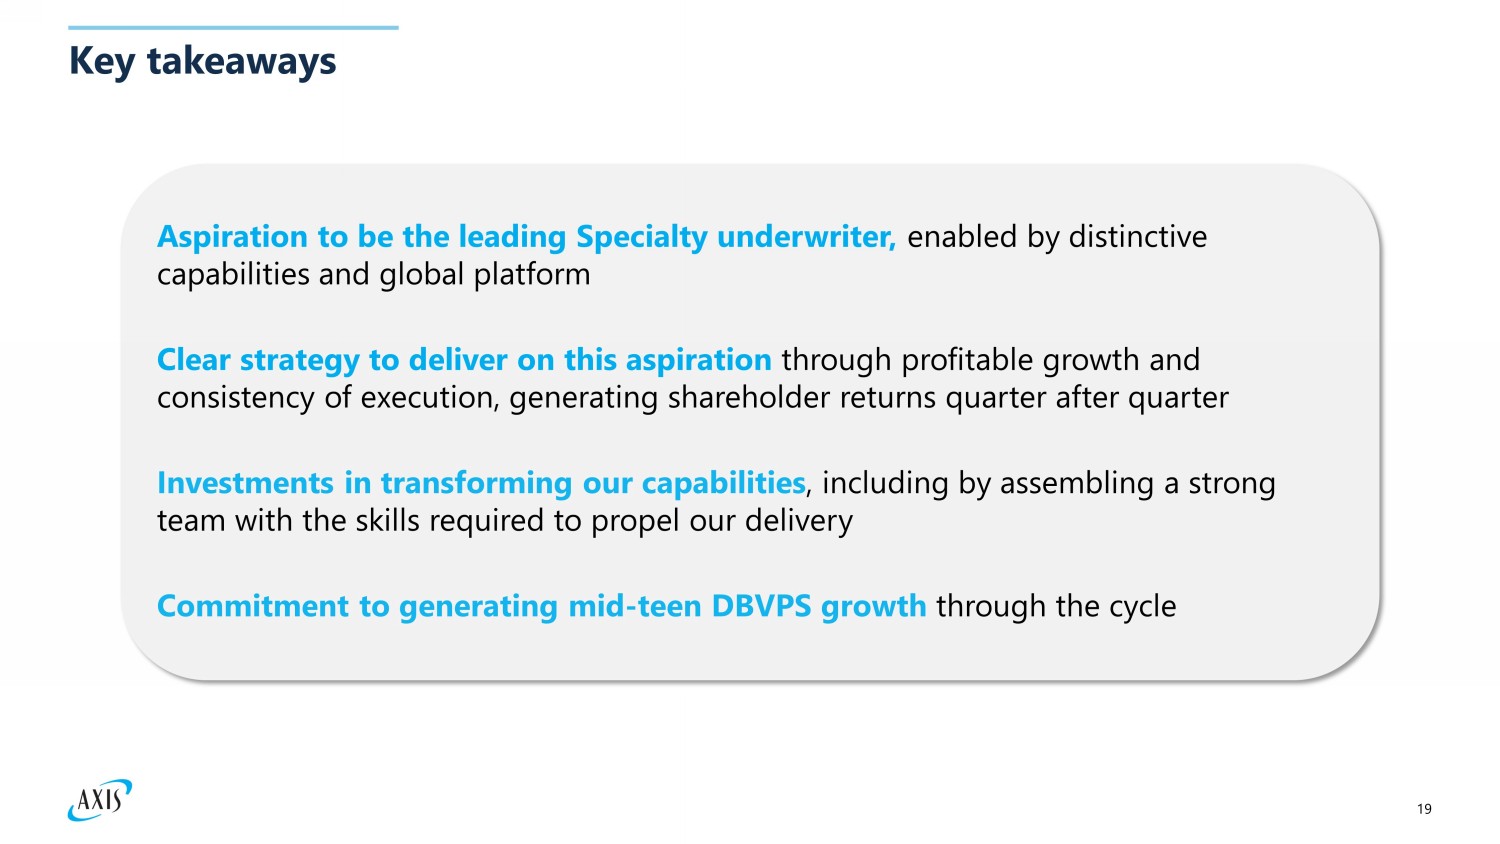
19 Key takeaways Aspiration to be the leading Specialty underwriter, enabled by distinctive capabilities and global platform Clear strategy to deliver on this aspiration through profitable growth and consistency of execution, generating shareholder returns quarter after quarter Investments in transforming our capabilities , including by assembling a strong team with the skills required to propel our delivery Commitment to generating mid - teen DBVPS growth through the cycle
Underwriting: Doubling down on our Specialty capabilities Daniel Draper Group Chief Underwriting Officer
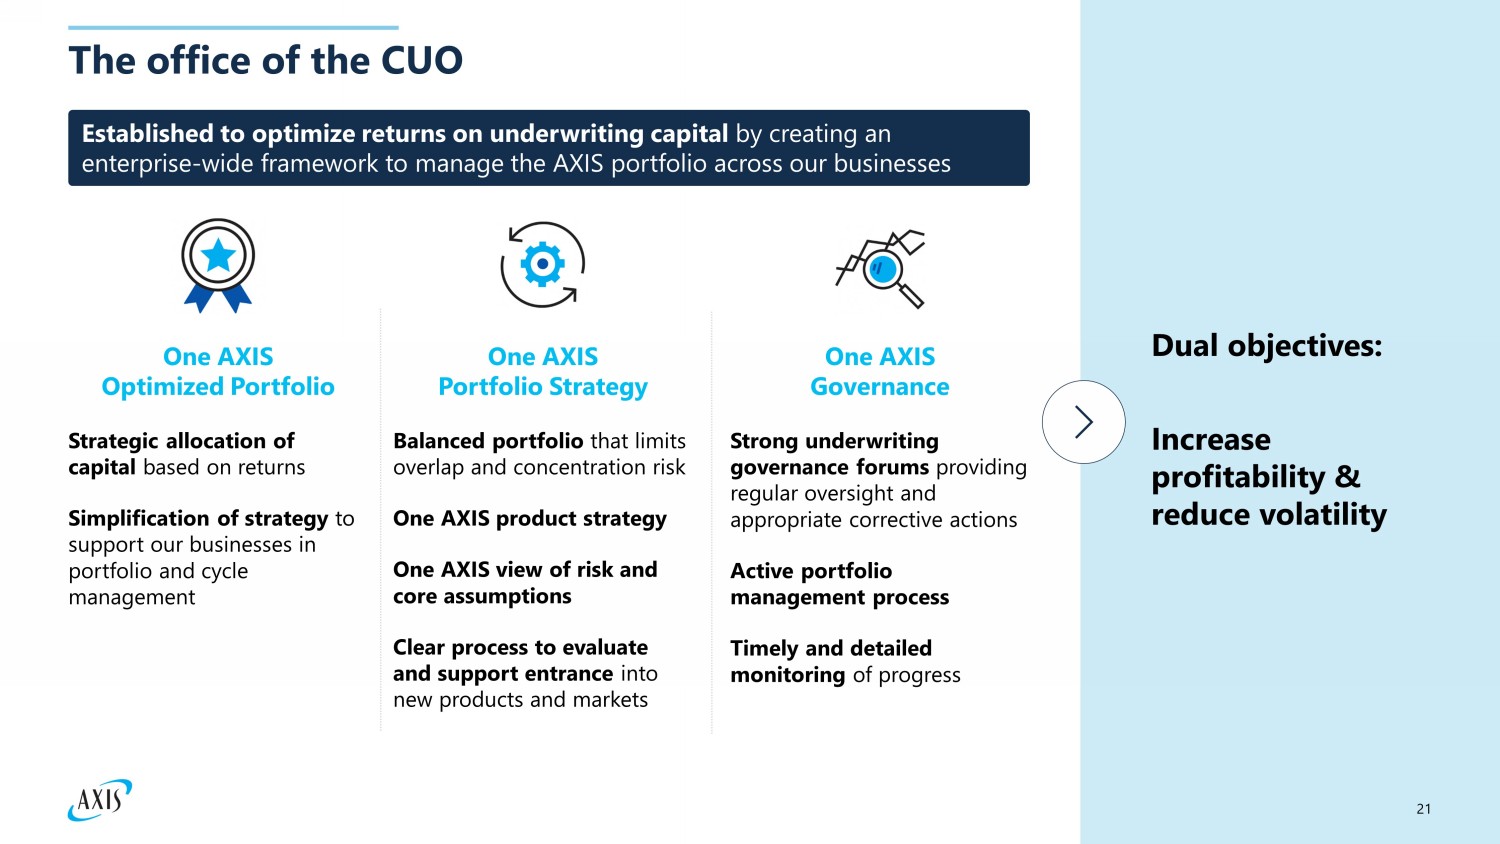
21 The office of the CUO One AXIS Optimized Portfolio One AXIS Portfolio Strategy One AXIS Governance Strategic allocation of capital based on returns Simplification of strategy to support our businesses in portfolio and cycle management Balanced portfolio that limits overlap and concentration risk One AXIS product s trategy One AXIS view of risk and core assumptions Clear process to evaluate and support entrance into new products and markets Strong underwriting governance forums providing regular oversight and appropriate corrective actions Active portfolio management process Timely and detailed monitoring of progress Established to optimize returns on underwriting capital by creating an enterprise - wide framework to manage the AXIS portfolio across our businesses Dual objectives: Increase profitability & reduce volatility
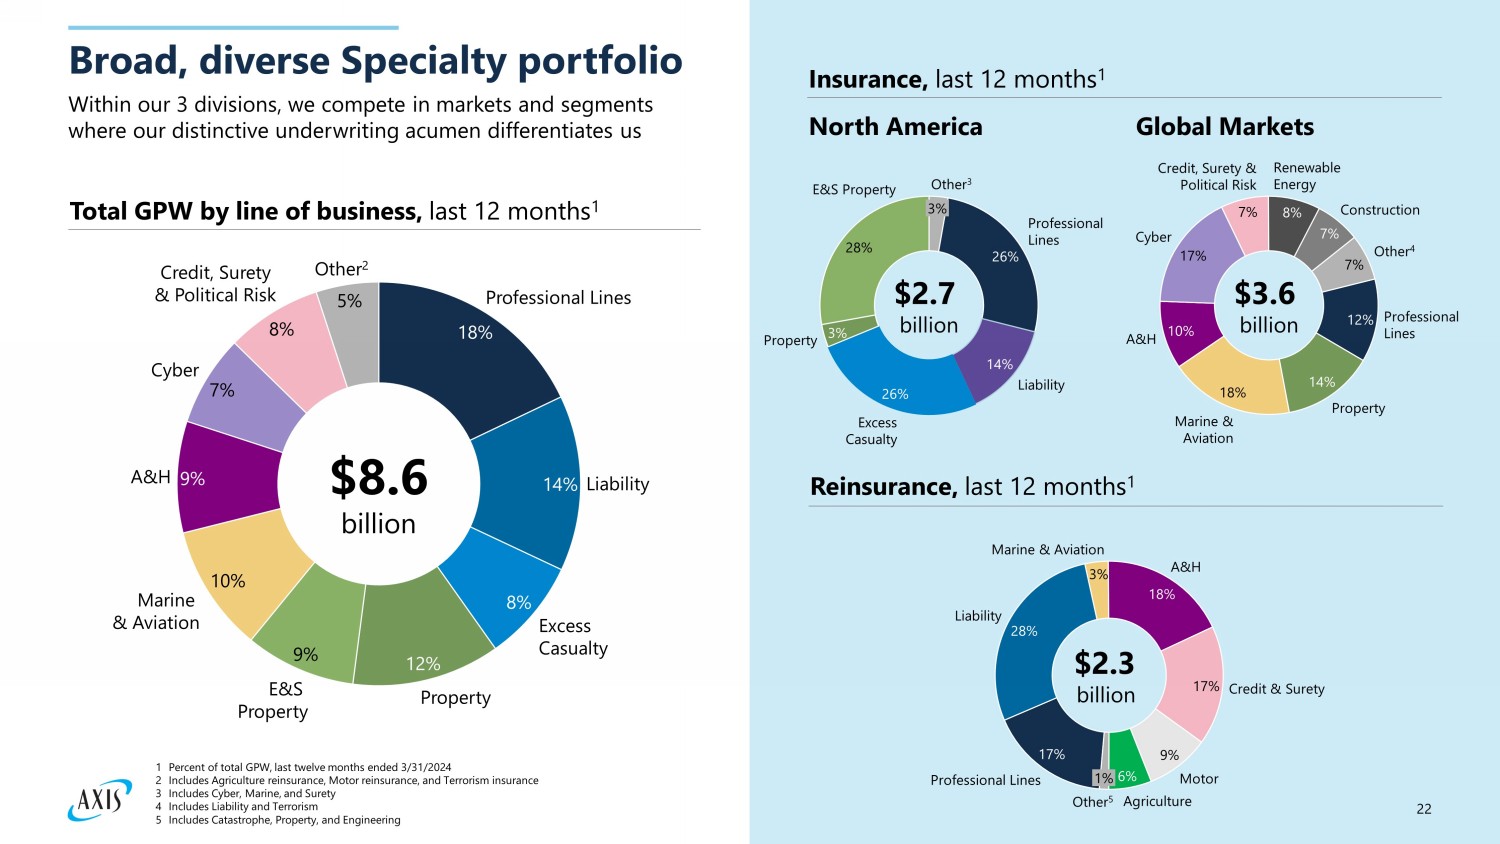
22 Broad, diverse Specialty portfolio Within our 3 divisions, we compete in markets and segments where our distinctive underwriting acumen differentiates us 18% 14% 8% 12% 9% 10% 9% 7% 8% 5% Professional Lines Liability Excess Casualty Property E&S Property Marine & Aviation A&H Cyber Credit, Surety & Political Risk Other 2 $8.6 billion Total GPW by line of business, last 12 months 1 Insurance, last 12 months 1 North America Global Markets Reinsurance, last 12 months 1 17% 3% 18% 17% 9% 6% Professional Lines 28% Liability Marine & Aviation A&H Credit & Surety Motor Agriculture 1% Other 5 $2.3 billion 26% 14% 26% 3% 28% Professional Lines Liability Excess Casualty Property E&S Property 3% Other 3 $2.7 billion 12% 14% 18% 10% 17% 7% 8% 7% 7% Professional Lines Property Marine & Aviation A&H Cyber Credit, Surety & Political Risk Renewable Energy Construction Other 4 $3.6 billion 1 Percent of total GPW, last twelve months ended 3/31/2024 2 Includes Agriculture reinsurance, Motor reinsurance, and Terrorism insurance 3 Includes Cyber, Marine, and Surety 4 Includes Liability and Terrorism 5 Includes Catastrophe, Property, and Engineering
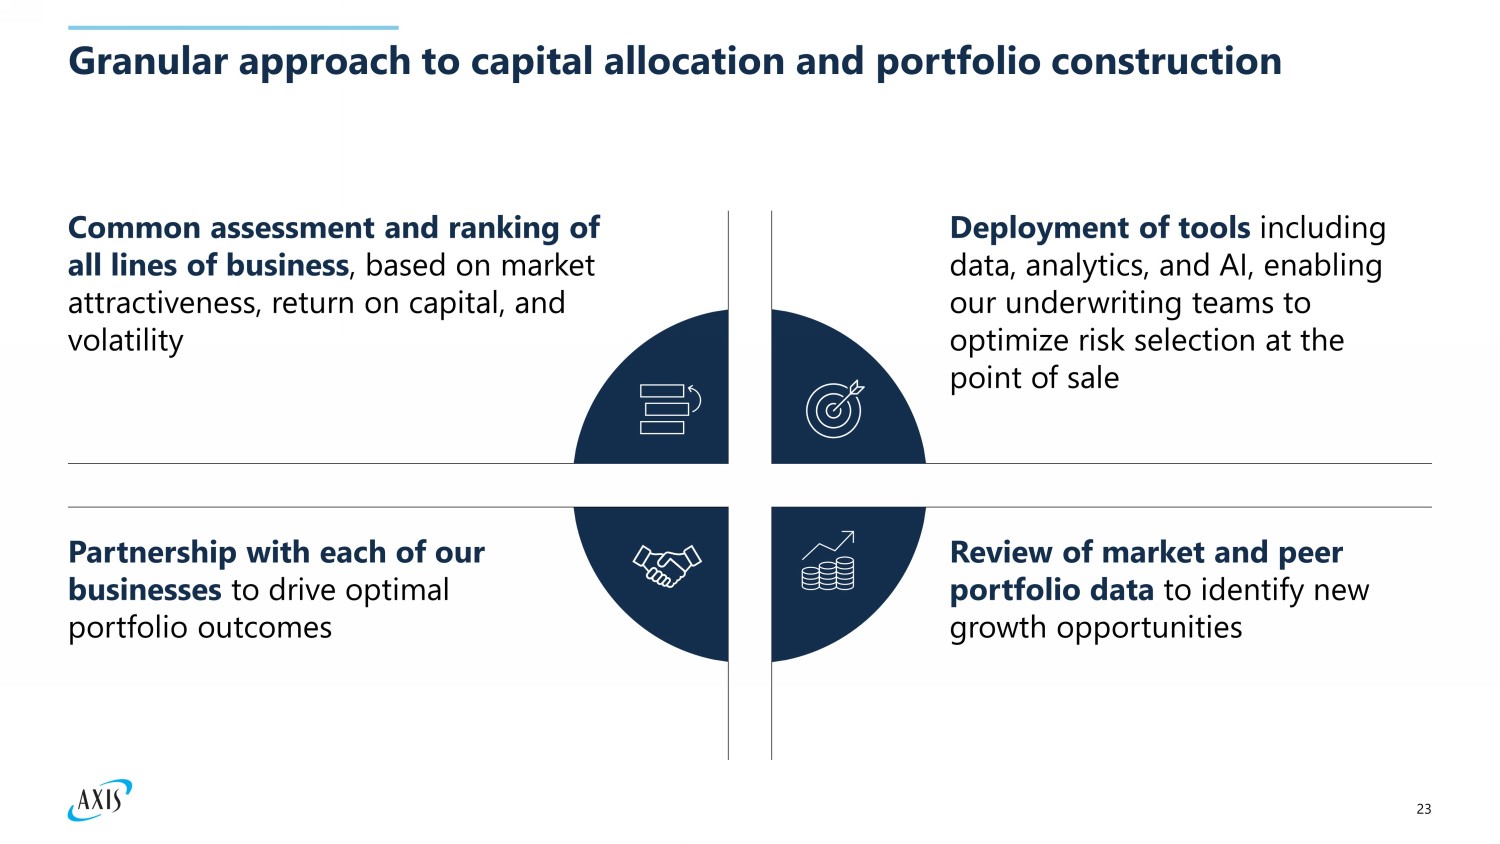
23 Granular approach to capital allocation and portfolio construction Common assessment and ranking of all lines of business , based on market attractiveness, return on capital, and volatility Partnership with each of our businesses to drive optimal portfolio outcomes Deployment of tools incl uding data, analytics, and AI, enabling our underwriting teams to optimize risk selection at the point of sale Review of market and peer portfolio data to identify new growth opportunities
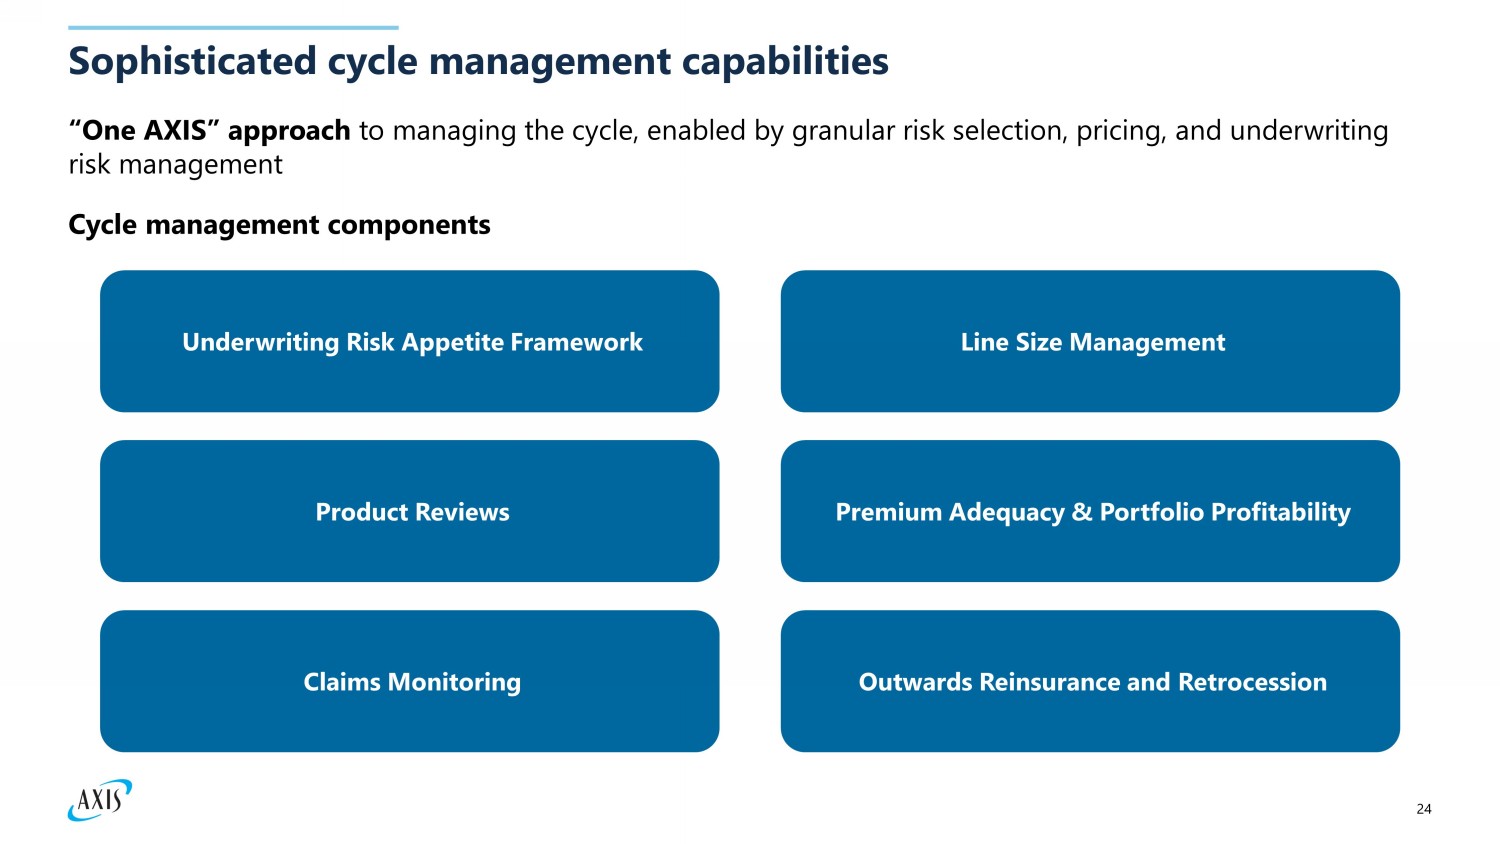
24 Sophisticated cycle management capabilities “One AXIS” approach to managing the cycle, enabled by granular risk selection, pricing, and underwriting risk management Cycle management components Product Reviews Line Size Management Premium Adequacy & Portfolio Profitability Claims Monitoring Underwriting Risk Appetite Framework Outwards Reinsurance and Retrocession
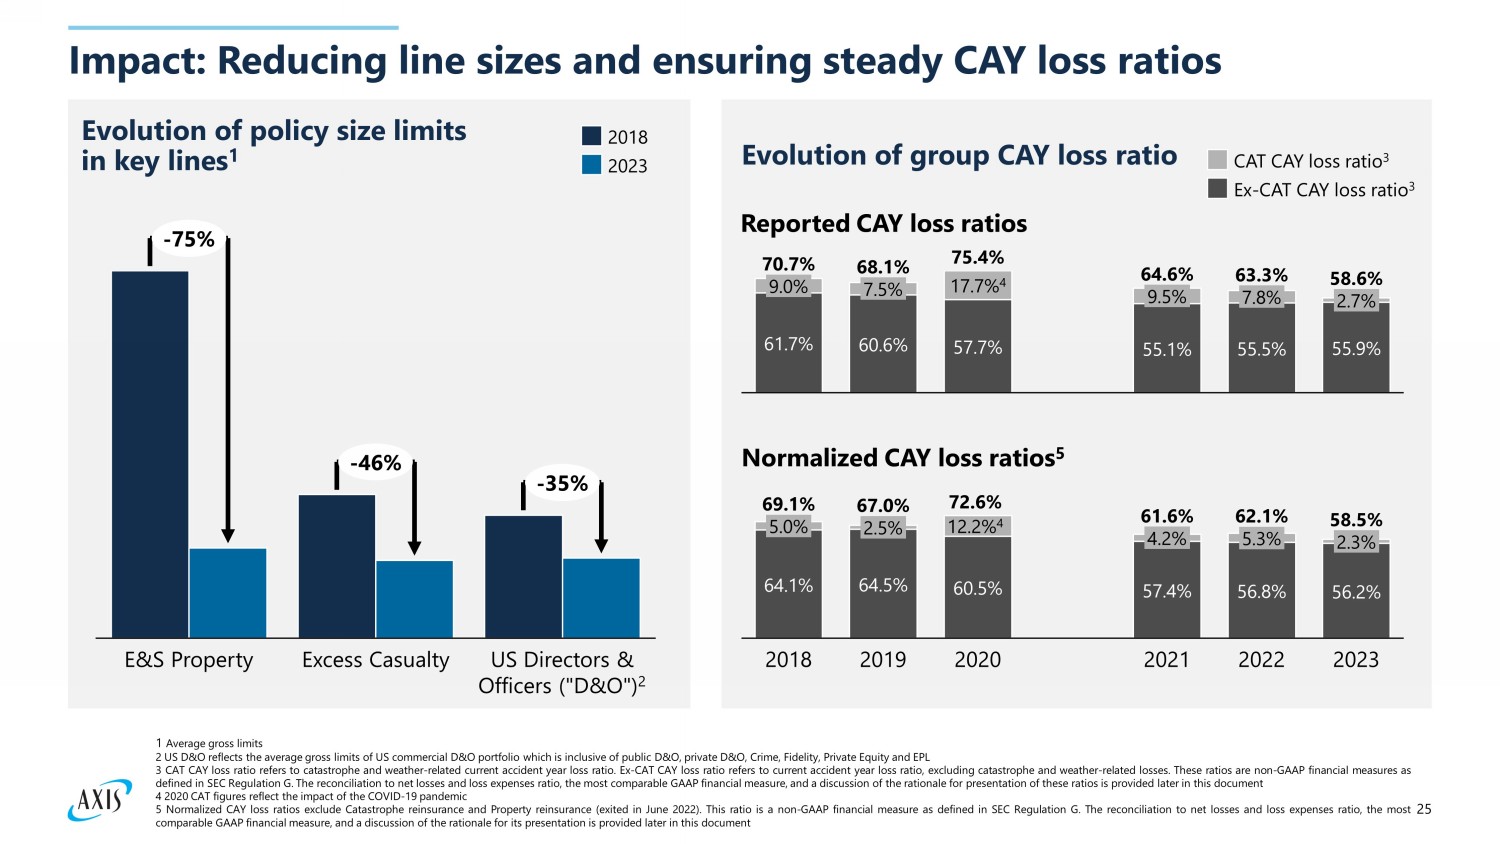
25 Impact: Reducing line sizes and ensuring steady CAY loss ratios E&S Property Excess Casualty US Directors & Officers ("D&O") 2 - 75% - 46% - 35% 2018 2023 61.7% 60.6% 57.7% 55.1% 55.5% 55.9% 9.0% 7.5% 17.7% 4 9.5% 7.8% 2.7% 70.7% 68.1% 75.4% 64.6% 63.3% 58.6% CAT CAY loss ratio 3 Ex - CAT CAY loss r atio 3 64.1% 64.5% 60.5% 57.4% 56.8% 56.2% 5.0% 2018 2.5% 2019 12.2% 4 2020 4.2% 2021 5.3% 2022 2.3% 2023 69.1% 67.0% 72.6% 61.6% 62.1% 58.5% Evolution of policy size limits in key lines 1 Evolution of group CAY loss ratio Reported CAY loss ratios Normalized CAY loss ratios 5 1 Average gross limits 2 US D&O reflects the average gross limits of US commercial D&O portfolio which is inclusive of public D&O, private D&O, Crime, Fidelity, Private Equity and EPL 3 CAT CAY loss r atio refers to catastrophe and weather - related current accident year loss ratio . Ex - CAT CAY loss r atio refers to current accident year loss ratio, excluding catastrophe and weather - related losses . These ratios are non - GAAP financial measures as defined in SEC Regulation G . The reconciliation to net losses and loss expenses ratio, the most comparable GAAP financial measure, and a discussion of the rationale for presentation of these ratios is provided later in this document 4 2020 CAT figures reflect the impact of the COVID - 19 pandemic 5 Normalized CAY loss ratios exclude Catastrophe reinsurance and Property reinsurance (exited in June 2022 ) . This ratio is a non - GAAP financial measure as defined in SEC Regulation G . The reconciliation to net losses and loss expenses ratio, the most comparable GAAP financial measure, and a discussion of the rationale for its presentation is provided later in this document
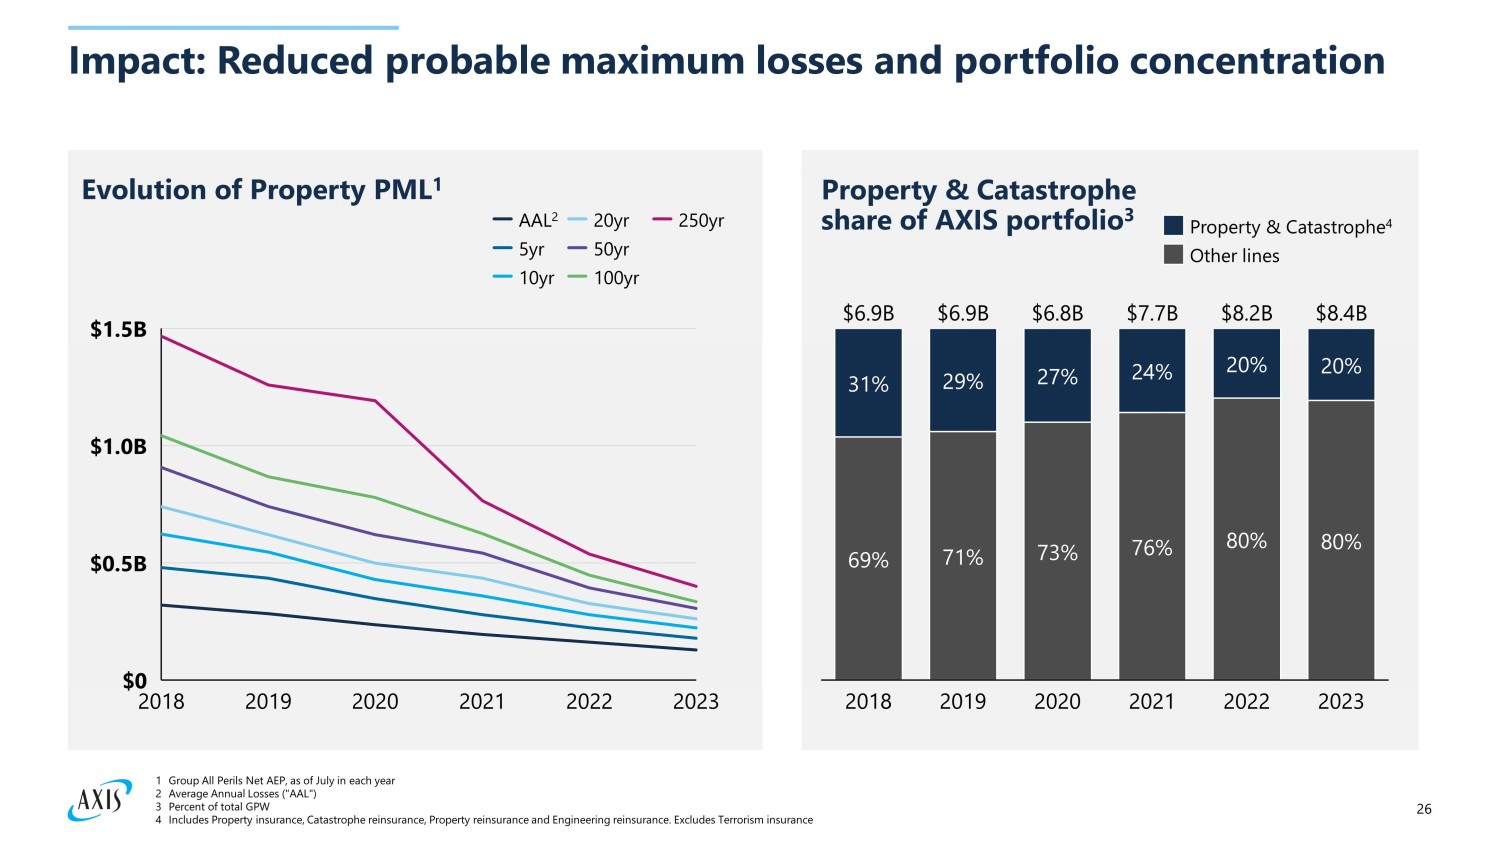
26 Impact: Reduced probable maximum losses and portfolio concentration Evolution of Property PML 1 2018 2019 2020 2021 2022 2023 $0 $0.5B $1.0B $1.5B AAL 2 5yr 10yr 20yr 50yr 100yr 250yr Property & Catastrophe share of AXIS portfolio 3 69% 71% 73% 76% 80% 80% 31% 29% 27% 24% 20% 20% 2018 2019 2020 2021 2022 2023 $6.9B $6.9B $6.8B $7.7B $8.2B $8.4B Property & Catastrophe 4 Other lines 1 Group All Perils Net AEP, as of July in each year 2 Average Annual Losses ("AAL") 3 Percent of total GPW 4 Includes Property insurance, Catastrophe reinsurance, Property reinsurance and Engineering reinsurance. Excludes Terrorism in s urance
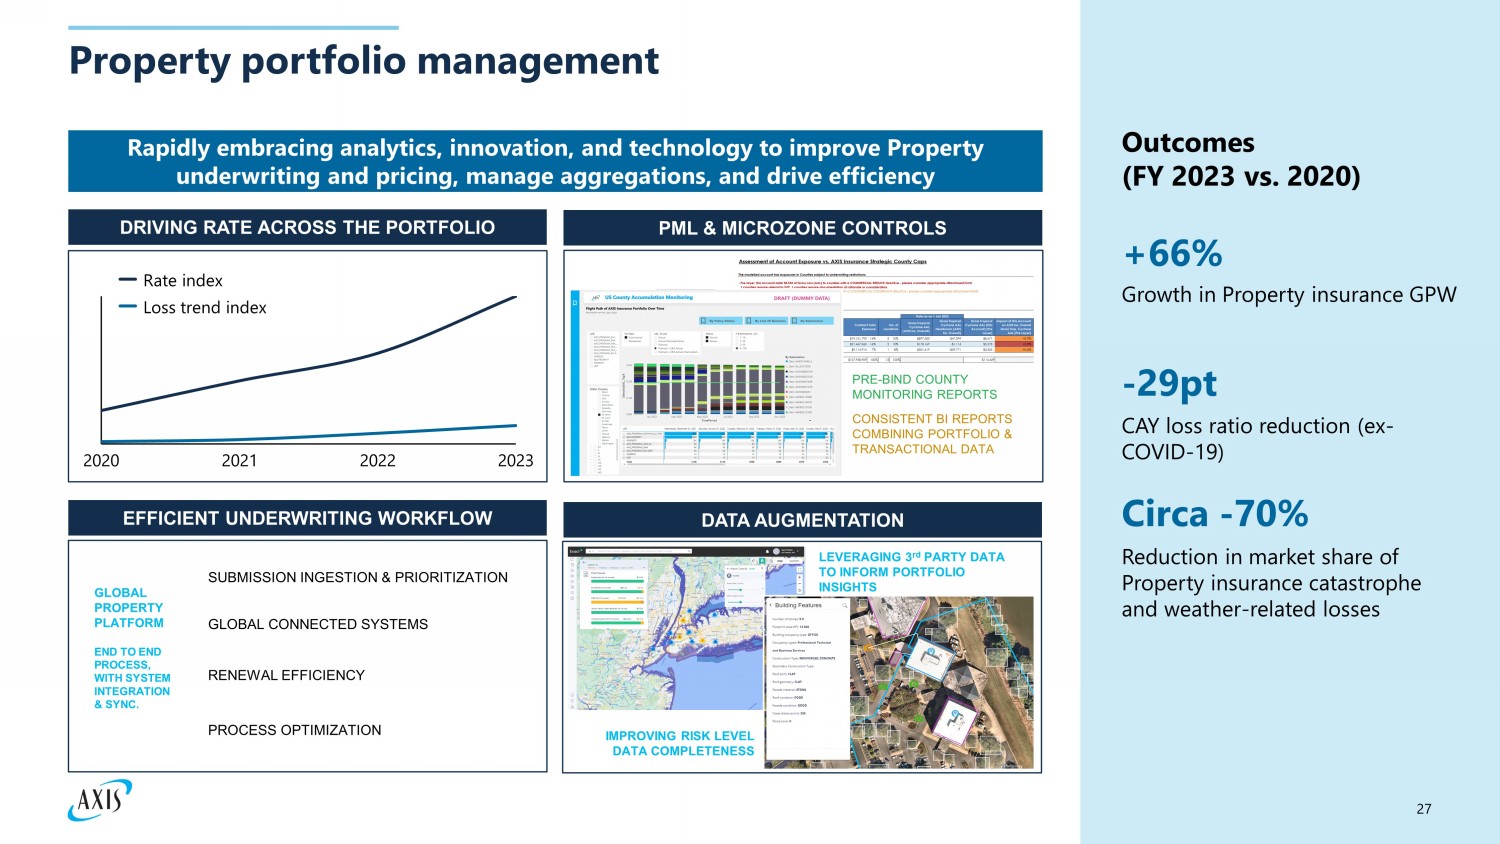
27 Property portfolio management Rapidly embracing analytics, innovation, and technology to improve Property underwriting and pricing, manage aggregations, and drive efficiency EFFICIENT UNDERWRITING WORKFLOW PML & MICROZONE CONTROLS PRE - BIND COUNTY MONITORING REPORTS CONSISTENT BI REPORTS COMBINING PORTFOLIO & TRANSACTIONAL DATA DATA AUGMENTATION IMPROVING RISK LEVEL DATA COMPLETENESS LEVERAGING 3 rd PARTY DATA TO INFORM PORTFOLIO INSIGHTS DRIVING RATE ACROSS THE PORTFOLIO - 29pt CAY l oss ratio reduction (ex - COVID - 19) Circa - 70% Reduction in market share of P roperty insurance catastrophe and weather - related losses +66% Growth in Property insurance GPW GLOBAL PROPERTY PLATFORM END TO END PROCESS, WITH SYSTEM INTEGRATION & SYNC. SUBMISSION INGESTION & PRIORITIZATION GLOBAL CONNECTED SYSTEMS RENEWAL EFFICIENCY PROCESS OPTIMIZATION Outcomes (FY 2023 vs. 2020) 2020 2021 2022 2023 Rate index Loss trend index
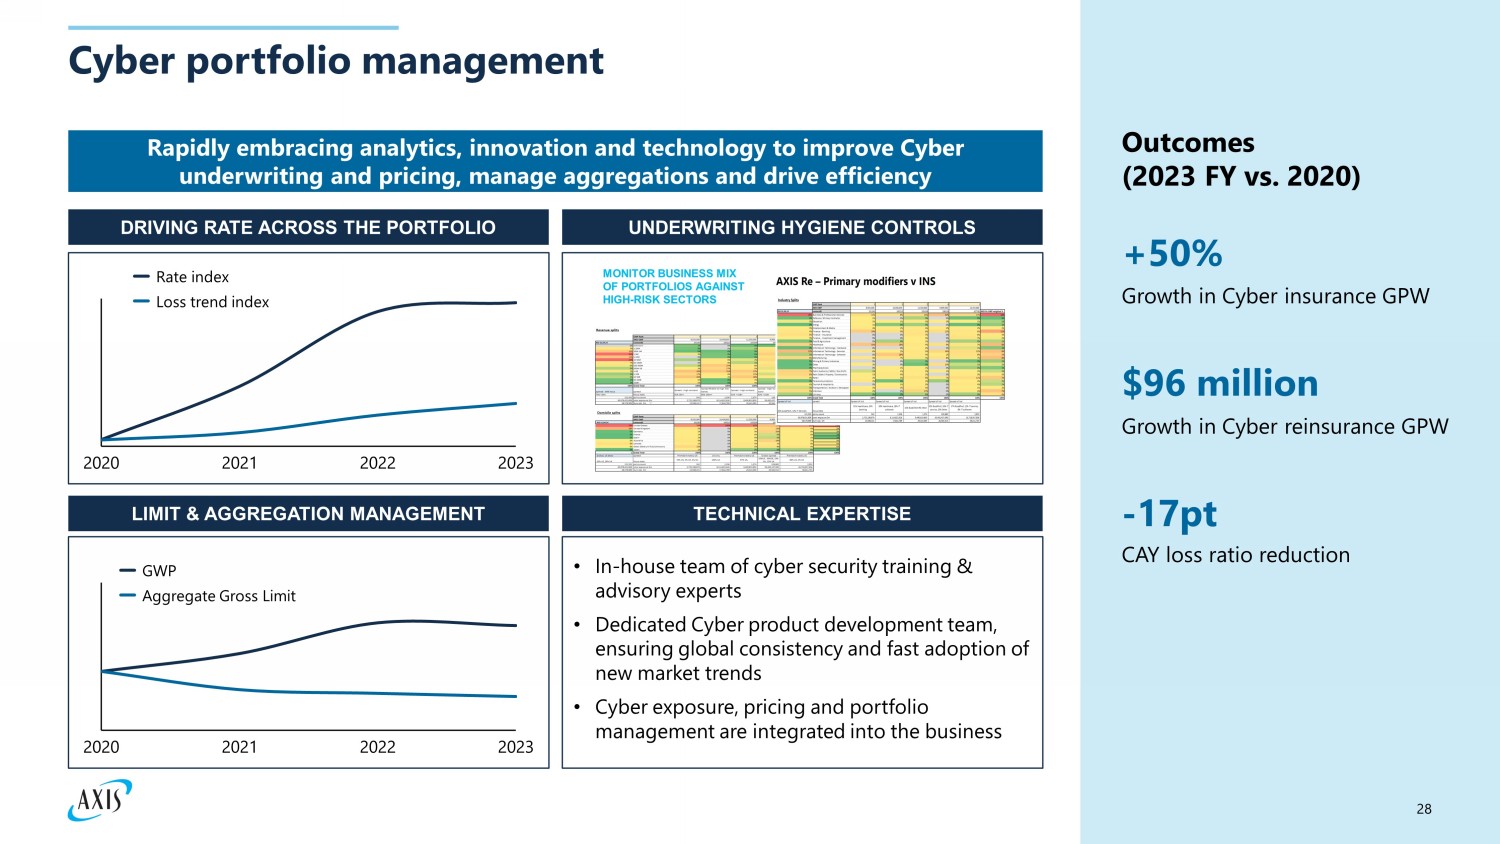
28 Cyber portfolio management Outcomes (2023 FY vs. 2020) Rapidly embracing analytics, innovation and technology to improve Cyber underwriting and pricing, manage aggregations and drive efficiency +50% Growth in Cyber insurance GPW $96 million Growth in Cyber reinsurance GPW - 17 pt CAY loss ratio reduction DRIVING RATE ACROSS THE PORTFOLIO UNDERWRITING HYGIENE CONTROLS LIMIT & AGGREGATION MANAGEMENT TECHNICAL EXPERTISE • In - house team of cyber security training & advisory experts • Dedicated Cyber product development team, ensuring global consistency and fast adoption of new market trends • Cyber exposure, pricing and portfolio management are integrated into the business MONITOR BUSINESS MIX OF PORTFOLIOS AGAINST HIGH - RISK SECTORS 2020 2021 2022 2023 Rate index Loss trend index 2020 2021 2022 2023 GWP Aggregate Gross Limit
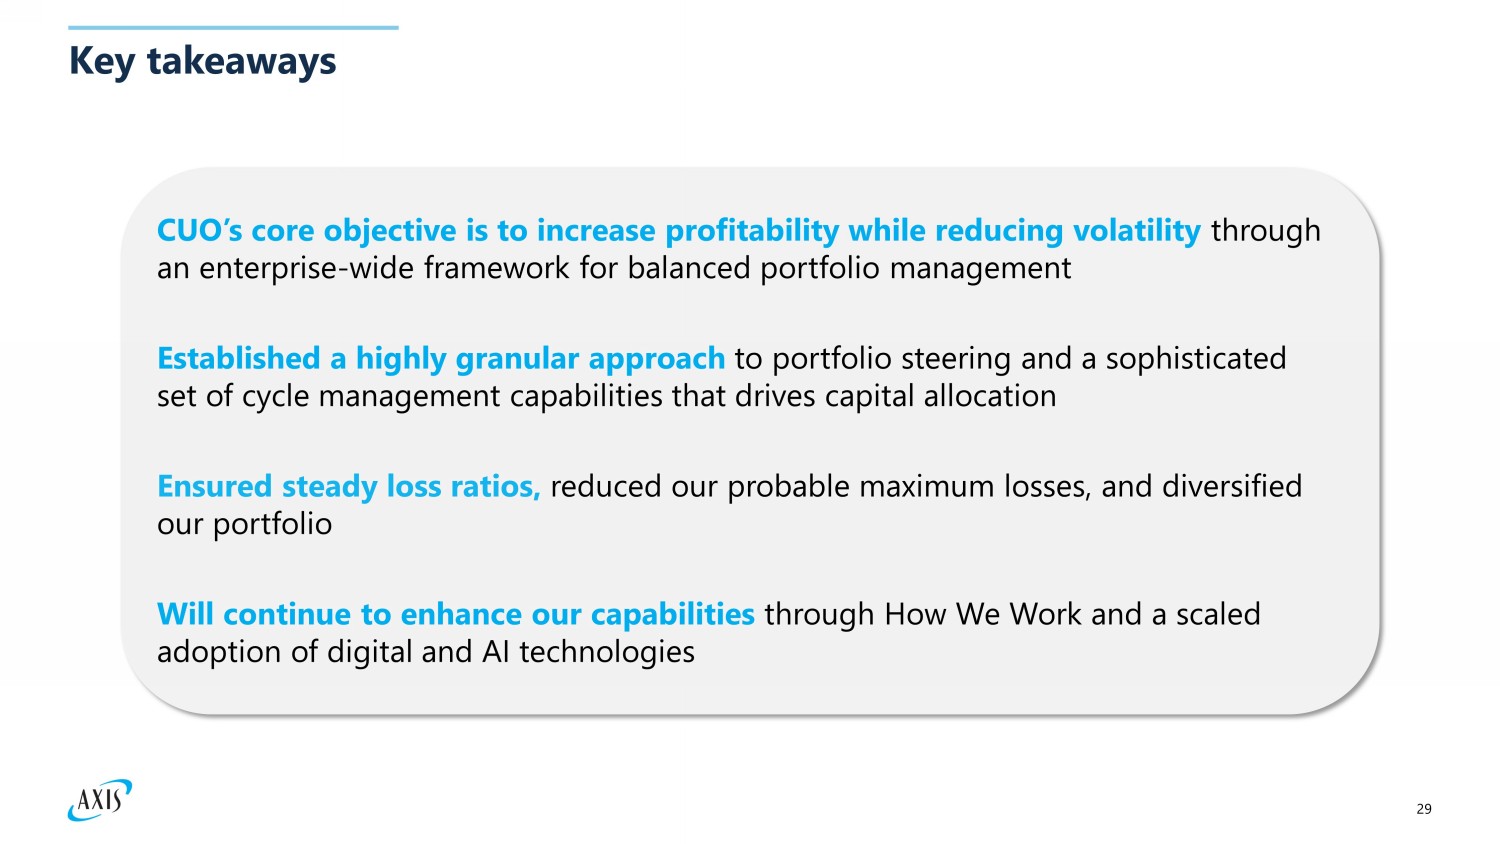
29 Key takeaways CUO’s core objective is to increase profitability while reducing volatility through an enterprise - wide framework for balanced portfolio management Established a highly granular approach to portfolio steering and a sophisticated set of cycle management capabilities that drives capital allocation Will continue to enhance our capabilities through How We Work and a scaled adoption of digital and AI technologies Ensured steady loss ratios, reduced our probable maximum losses, and diversified our portfolio

North America: Expanding our Specialty franchise Michael McKenna Head of North America
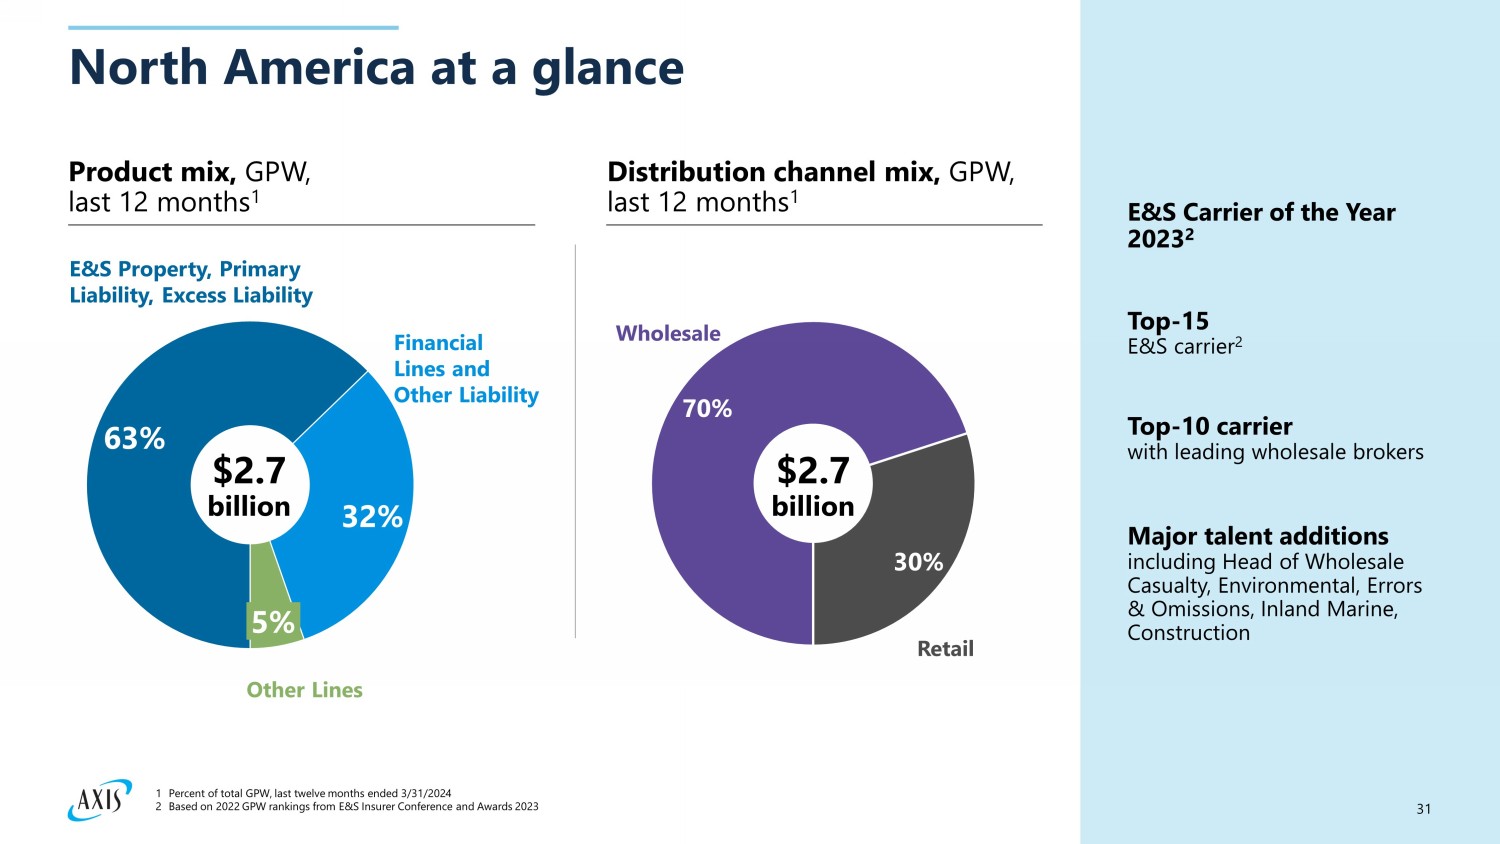
31 70% 30% North America at a glance Product mix, GPW, last 12 months 1 Distribution channel mix, GPW, last 12 months 1 E&S Carrier of the Year 2023 2 Top - 15 E&S carrier 2 Top - 10 carrier w ith leading wholesale brokers Major talent additions i ncluding Head of Wholesale Casualty, Environmental, Errors & Omissions, Inland Marine, Construction 63% 32% 5% Wholesale Retail $2.7 billion Financial Lines and Other Liability Other Lines E&S Property, Primary Liability, Excess Liability 1 Percent of total GPW, last twelve months ended 3/31/2024 2 Based on 2022 GPW rankings from E&S Insurer Conference and Awards 2023 $2.7 billion
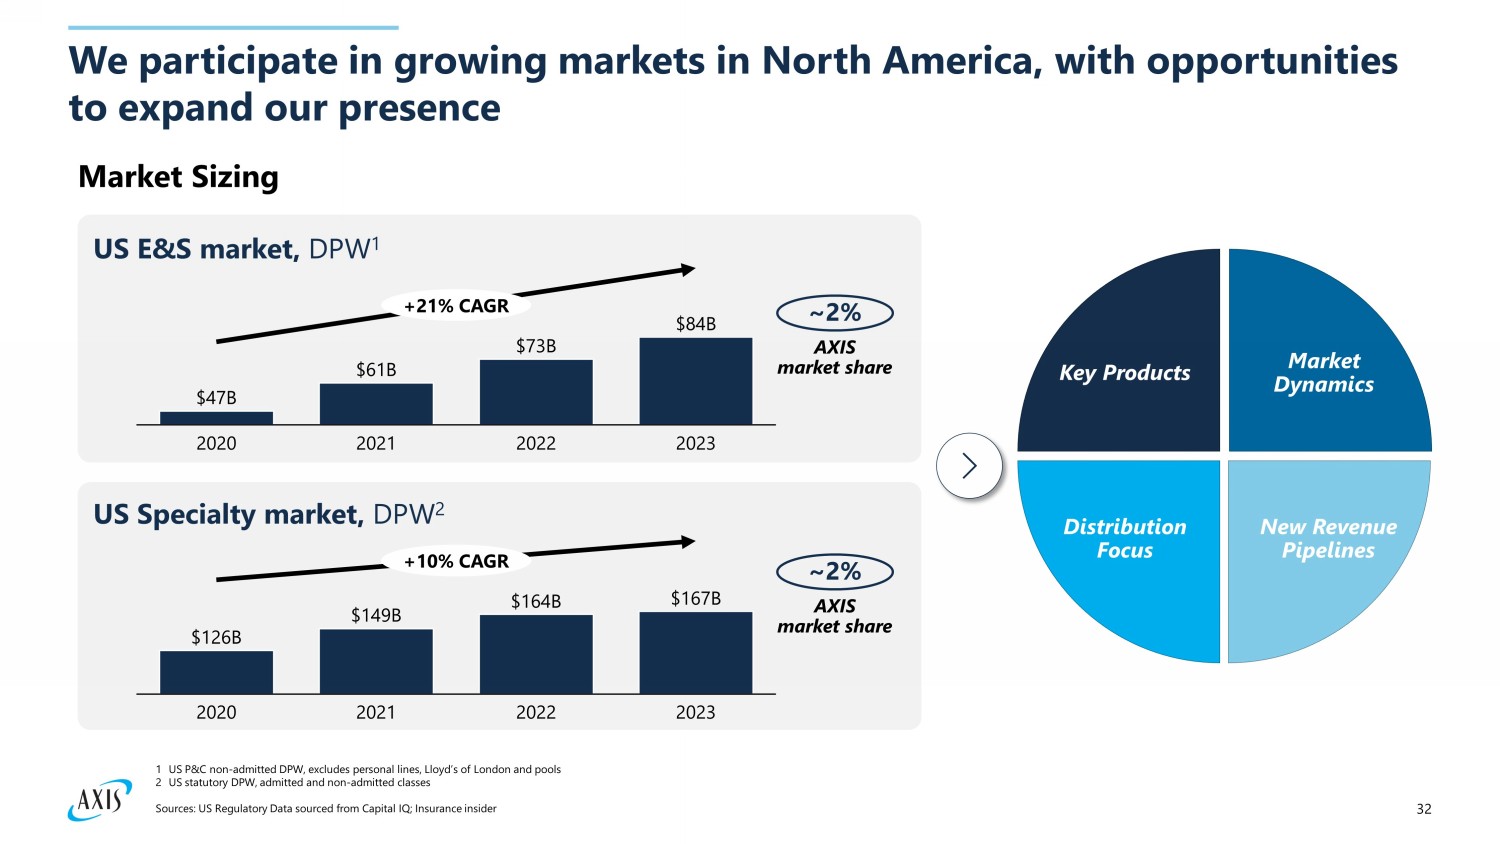
32 We participate in growing markets in North America, with opportunities to expand our presence Market Sizing Key Products Market Dynamics New Revenue Pipelines Distribution Focus $47B $61B $73B $84B 2020 2021 2022 2023 +21% CAGR US E&S market, DPW 1 ~2% AXIS market share $126B $149B $164B $167B 2020 2021 2022 2023 +10% CAGR US Specialty market, DPW 2 1 US P&C non - admitted DPW, excludes personal lines, Lloyd’s of London and pools 2 US statutory DPW, admitted and non - admitted classes Sources: US Regulatory Data sourced from Capital IQ; Insurance insider ~2% AXIS market share
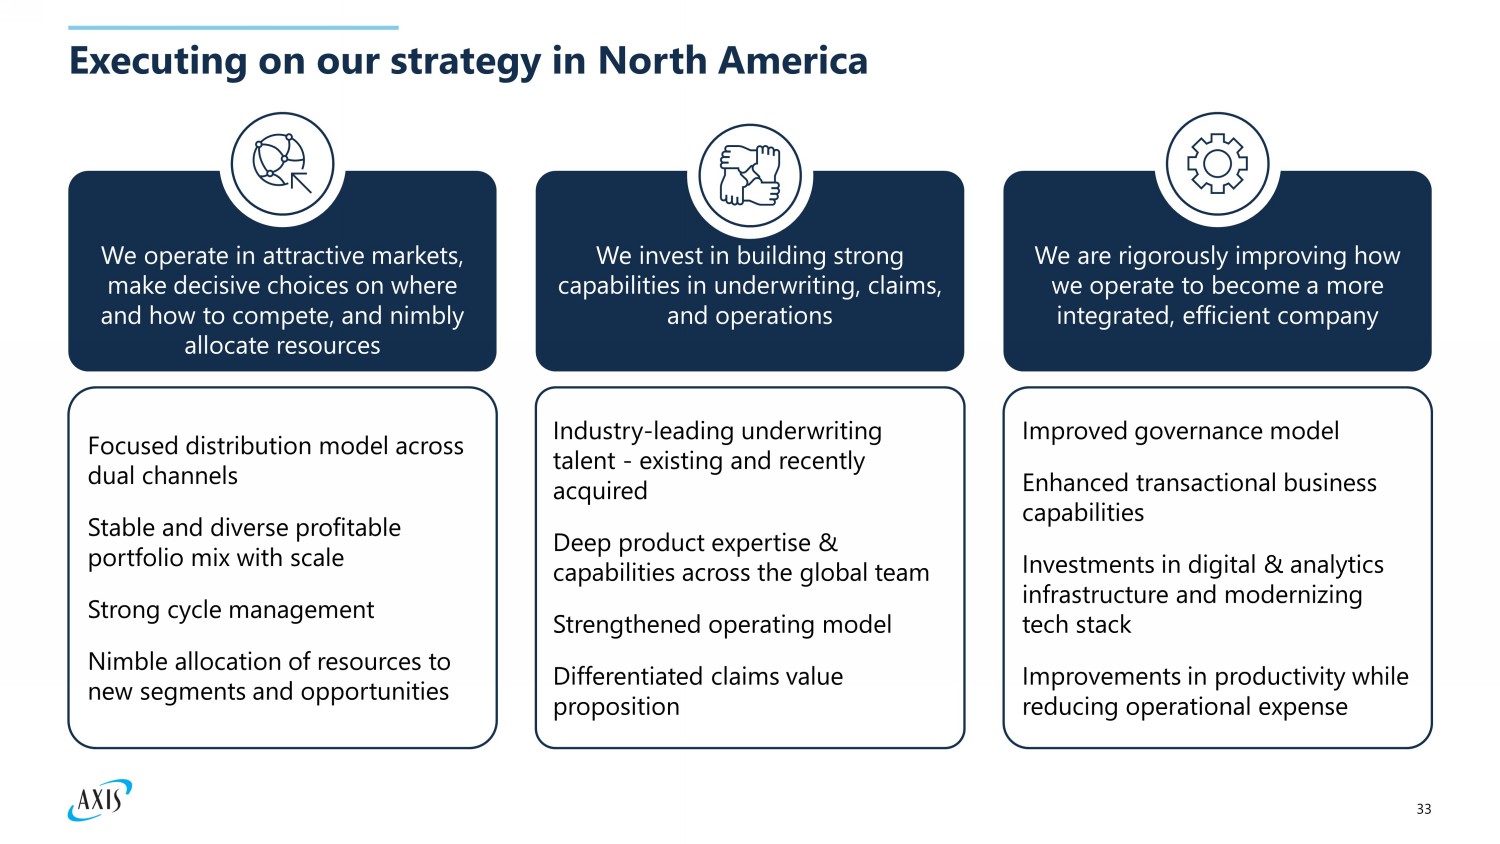
33 Executing on our strategy in North America Focused distribution model across dual channels Stable and diverse profitable portfolio mix with scale Strong cycle management Nimble allocation of resources to new segments and opportunities We operate in attractive markets, make decisive choices on where and how to compete, and nimbly allocate resources We are rigorously improving how we operate to become a more integrated, efficient company We invest in building strong capabilities in underwriting, claims, and operations Industry - leading underwriting talent - existing and recently acquired Deep product expertise & capabilities across the global team Strengthened operating model Differentiated claims value proposition Improved governance model Enhanced transactional business capabilities Investments in digital & analytics infrastructure and modernizing tech stack Improvements in productivity while reducing operational expense
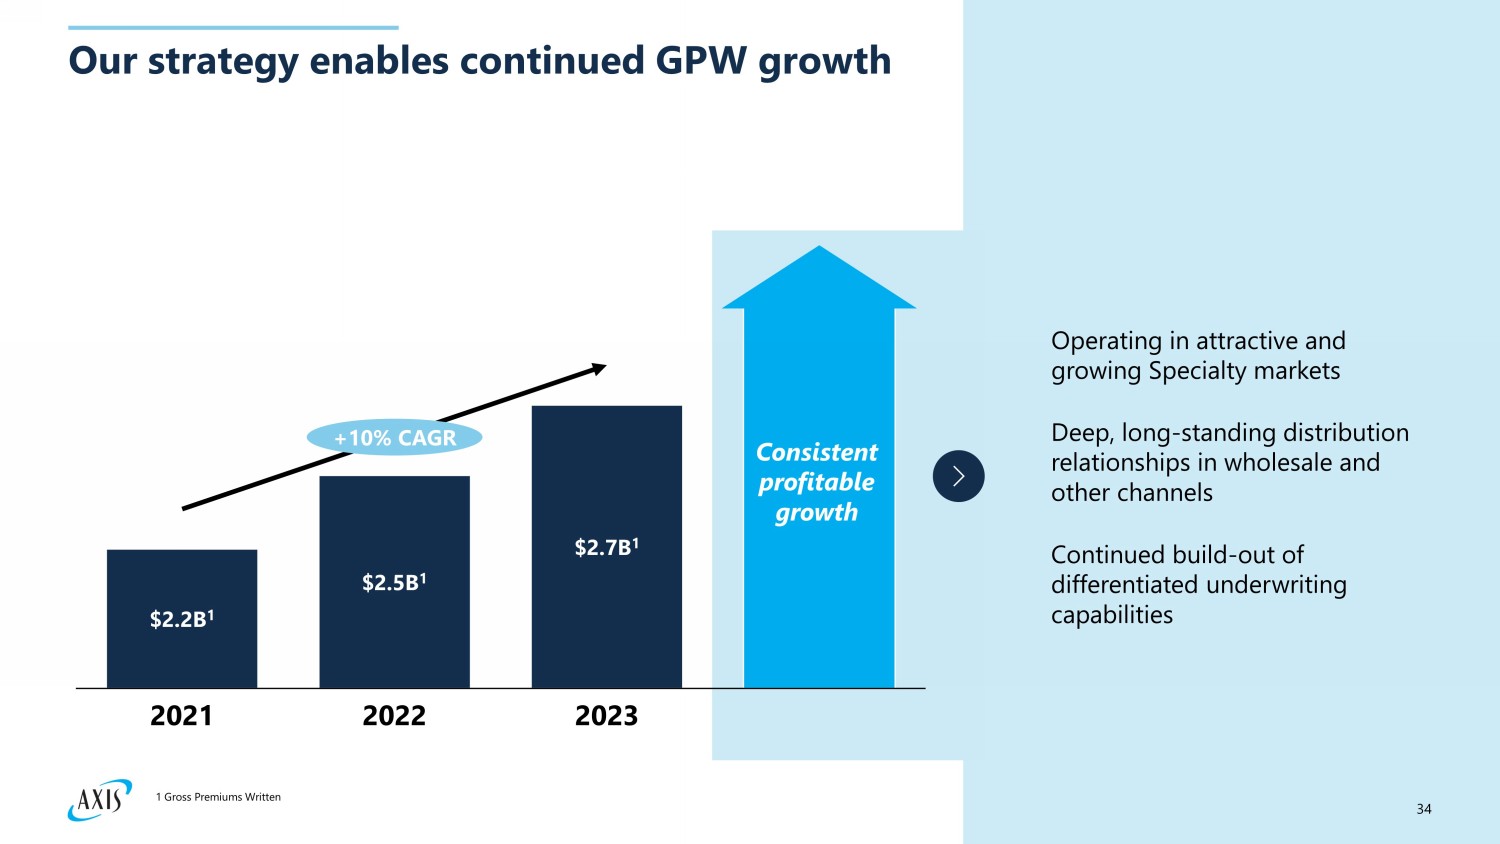
34 Our strategy enables continued GPW growth $2.2B 1 2021 $2.5B 1 2022 $2.7B 1 2023 +10% CAGR Consistent profitable growth Operating in attractive and growing Specialty markets Continued build - out of differentiated underwriting capabilities Deep, long - standing distribution relationships in wholesale and other channels 1 Gross Premiums Written
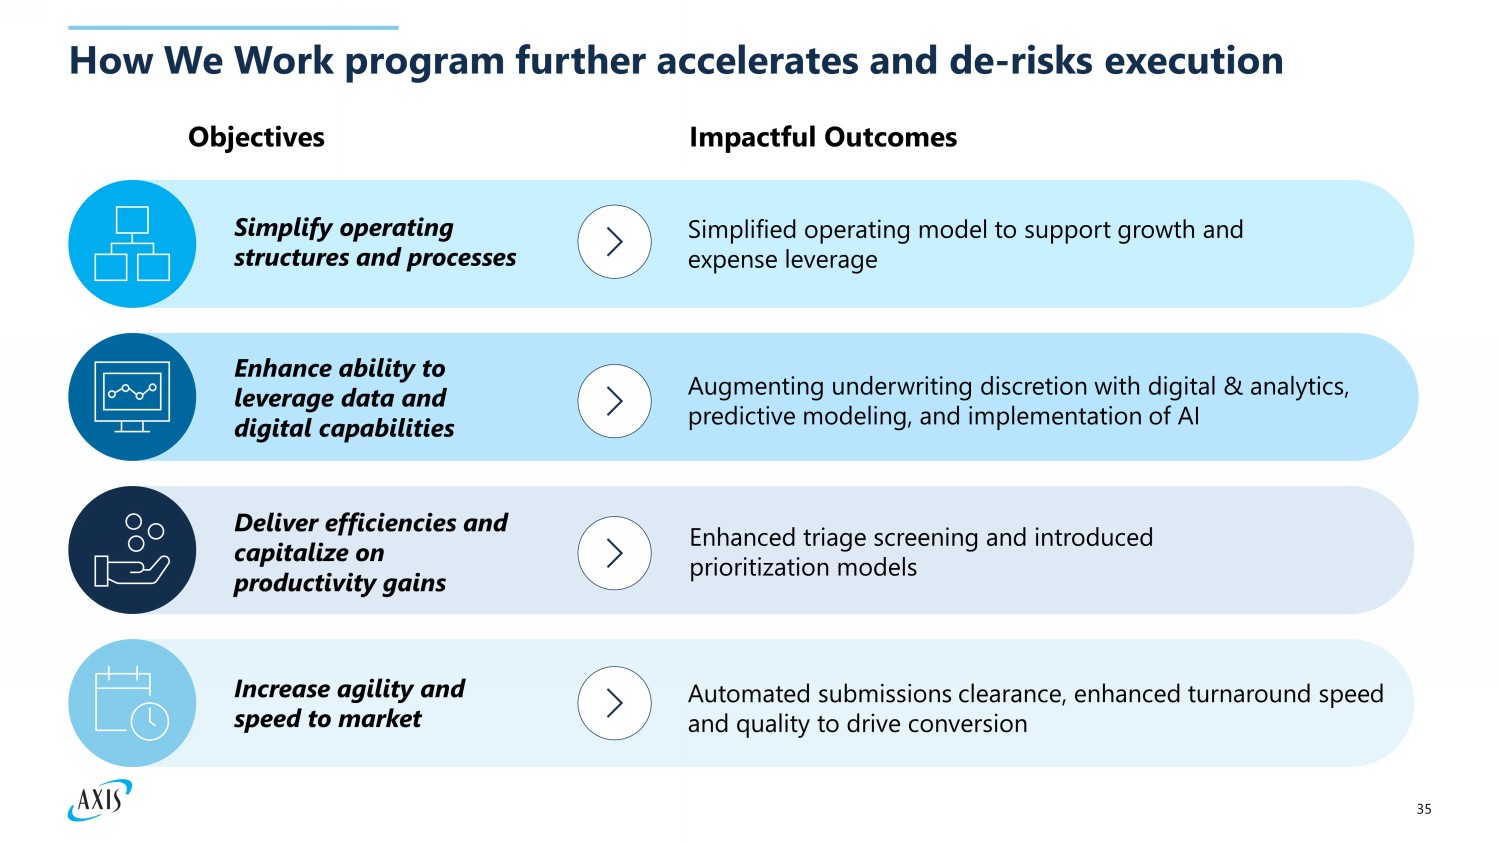
35 How We Work program further accelerates and de - risks execution Objectives Impactful Outcomes Increase agility and speed to market Automated submissions clearance, enhanced turnaround speed and quality to drive conversion Simplify operating structures and processes Simplified operating model to support growth and expense leverage Enhance ability to leverage data and digital capabilities Augmenting underwriting discretion with digital & analytics, predictive modeling, and implementation of AI Deliver efficiencies and capitalize on productivity gains Enhanced triage screening and introduced prioritization models
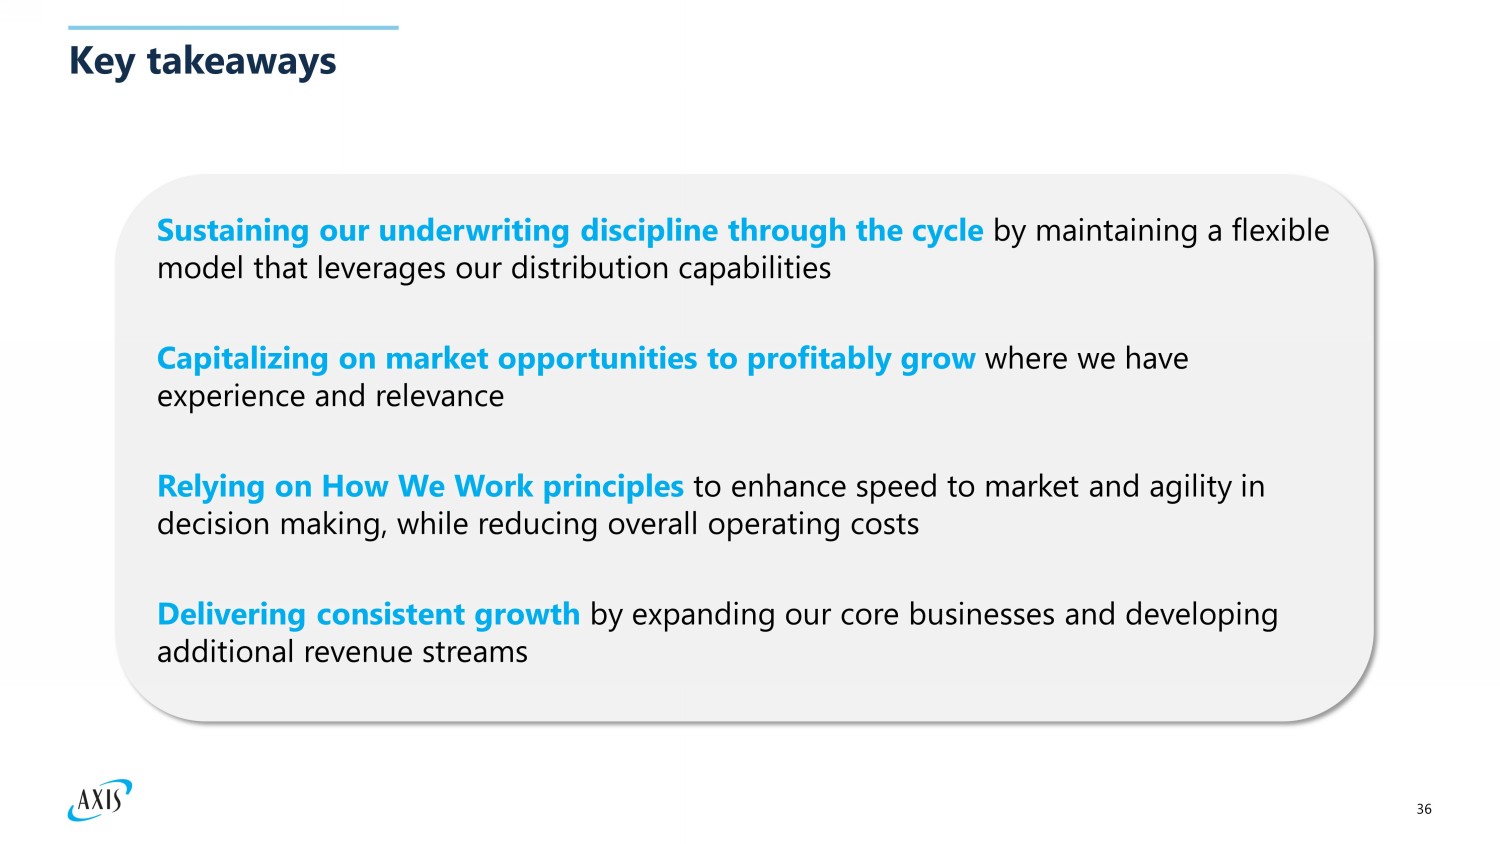
36 Key takeaways Sustaining our underwriting discipline through the cycle by maintaining a flexible model that leverages our distribution capabilities Capitalizing on market opportunities to profitably grow where we have experience and relevance Delivering consistent growth by expanding our core businesses and developing additional revenue streams Relying on How We Work principles to enhance speed to market and agility in decision making, while reducing overall operating costs

Global Markets: Strengthening our leading role in London and beyond Mark Gregory Head of Global Markets
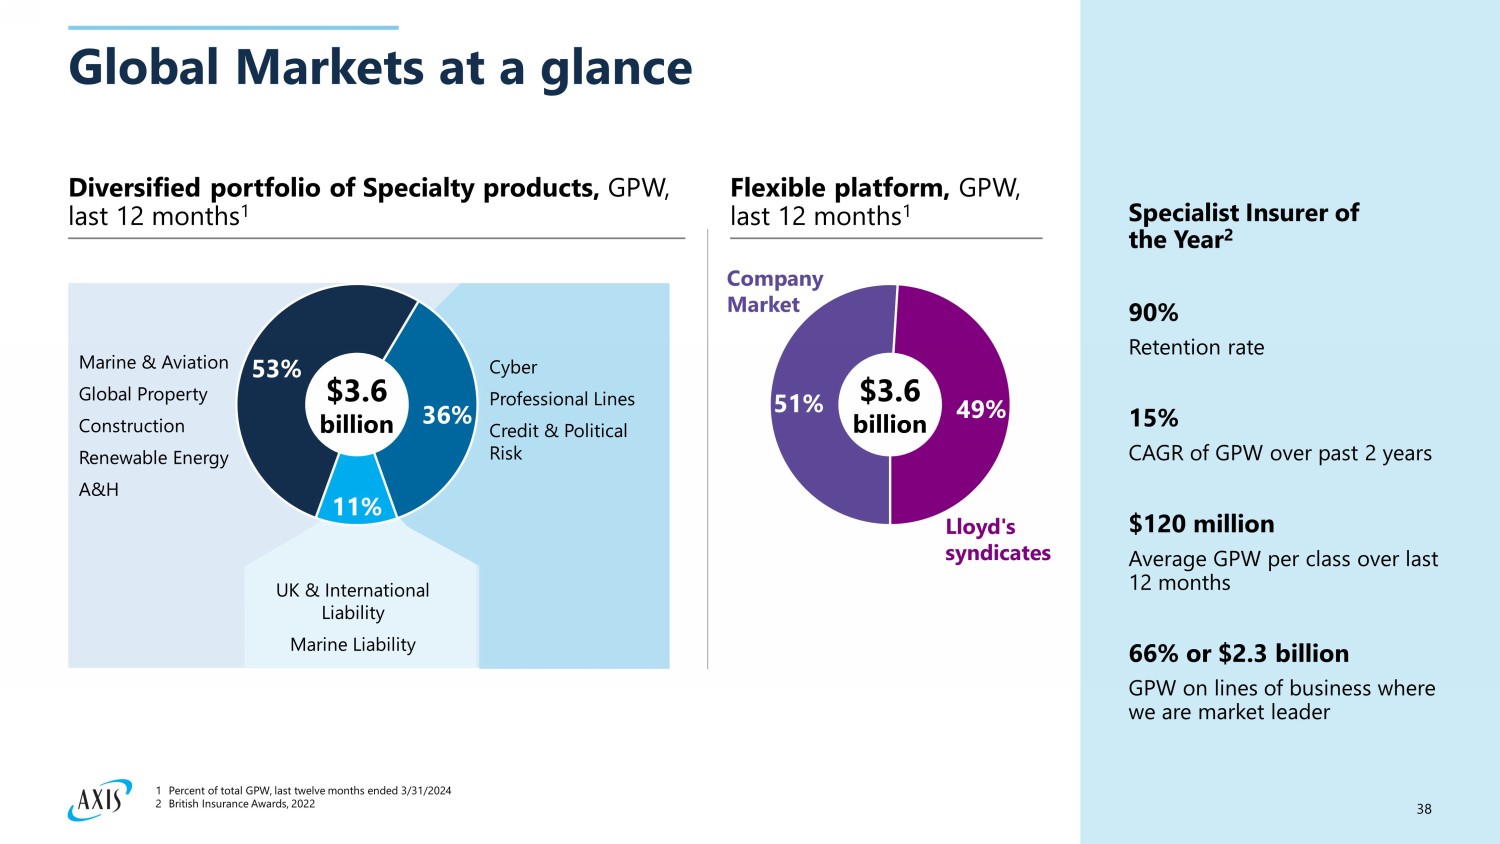
38 Global Markets at a glance Diversified portfolio of Specialty products, GPW, last 12 months 1 Flexible platform, GPW, last 12 months 1 Specialist Insurer of the Year 2 90% Retention rate 15% CAGR of GPW over past 2 years $120 million Average GPW per cl ass over last 12 months 66 % or $2.3 billion GPW on lines of business where we are market leader Cyber Professional Lines Credit & Political R isk UK & International Liability Marine Liability Lloyd's syndicates 53% 36% 11% Marine & Aviation Global Property Construction Renewable Energy A&H $3.6 billion 51% 49% 1 Percent of total GPW, last twelve months ended 3/31/2024 2 British Insurance Awards, 2022 $3.6 billion Company Market
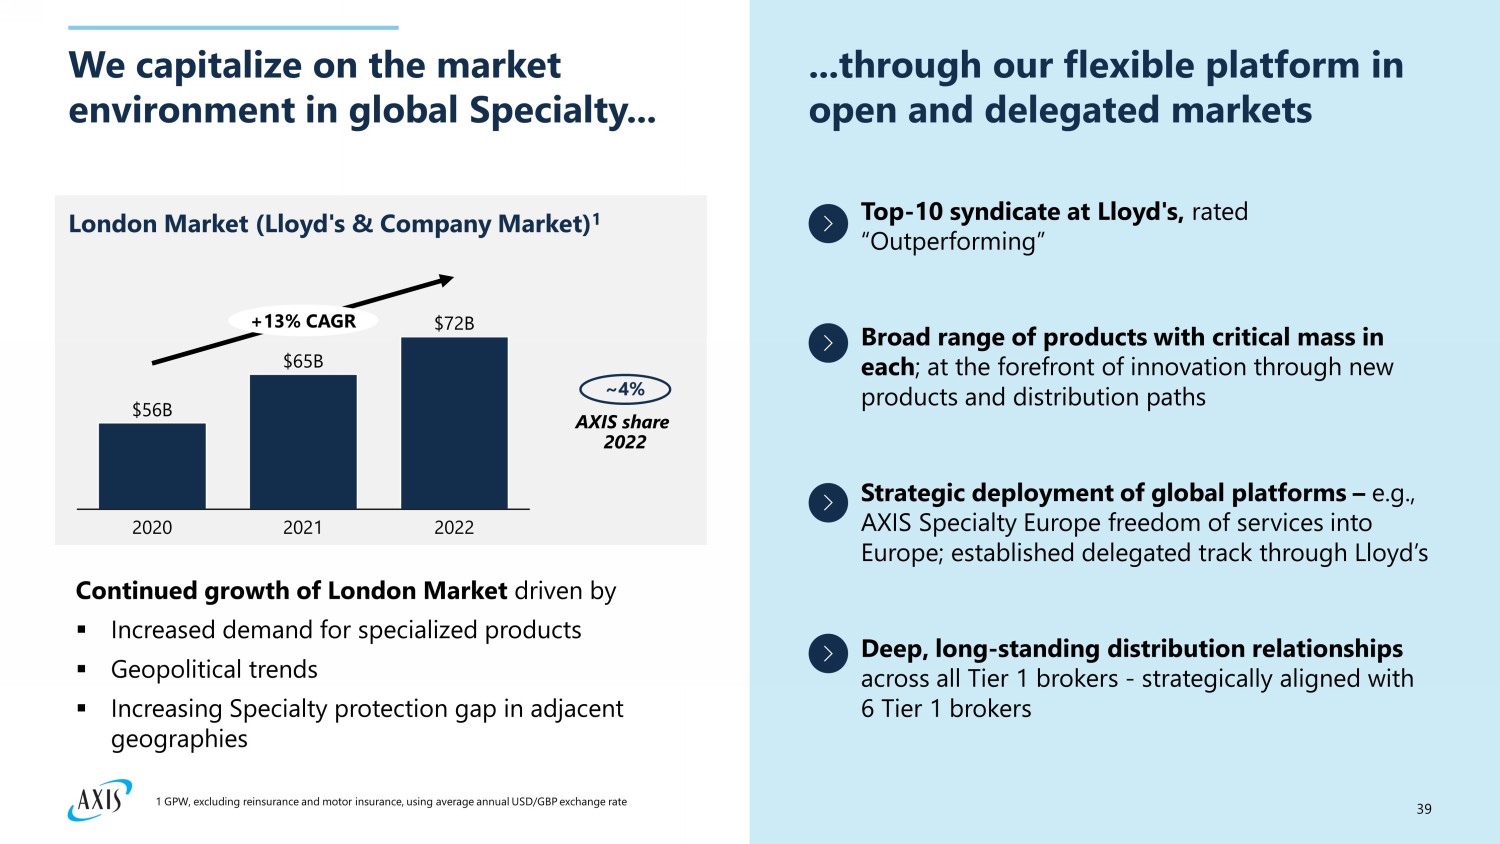
39 We capitalize on the market environment in global Specialty... $56B $65B $72B 2020 20 21 2022 +13% CAGR London Market (Lloyd's & Company Market) 1 ~4% AXIS share 2022 ...through our flexible platform in open and delegated markets Continued growth of London Market driven by ▪ Increased demand for specialized products ▪ Geopolitical trends ▪ Increasing Specialty protection gap in adjacent geographies Top - 10 syndicate at Lloyd's, rated “Outperforming” Strategic deployment of global platforms – e.g., AXIS Specialty Europe freedom of services into Europe; established delegated track through Lloyd’s Deep, long - standing distribution relationships across all Tier 1 brokers - strategically aligned with 6 Tier 1 brokers Broad range of products with critical mass in each ; at the forefront of innovation through new products and distribution paths 1 GPW, excluding reinsurance and motor insurance, using average annual USD/GBP exchange rate
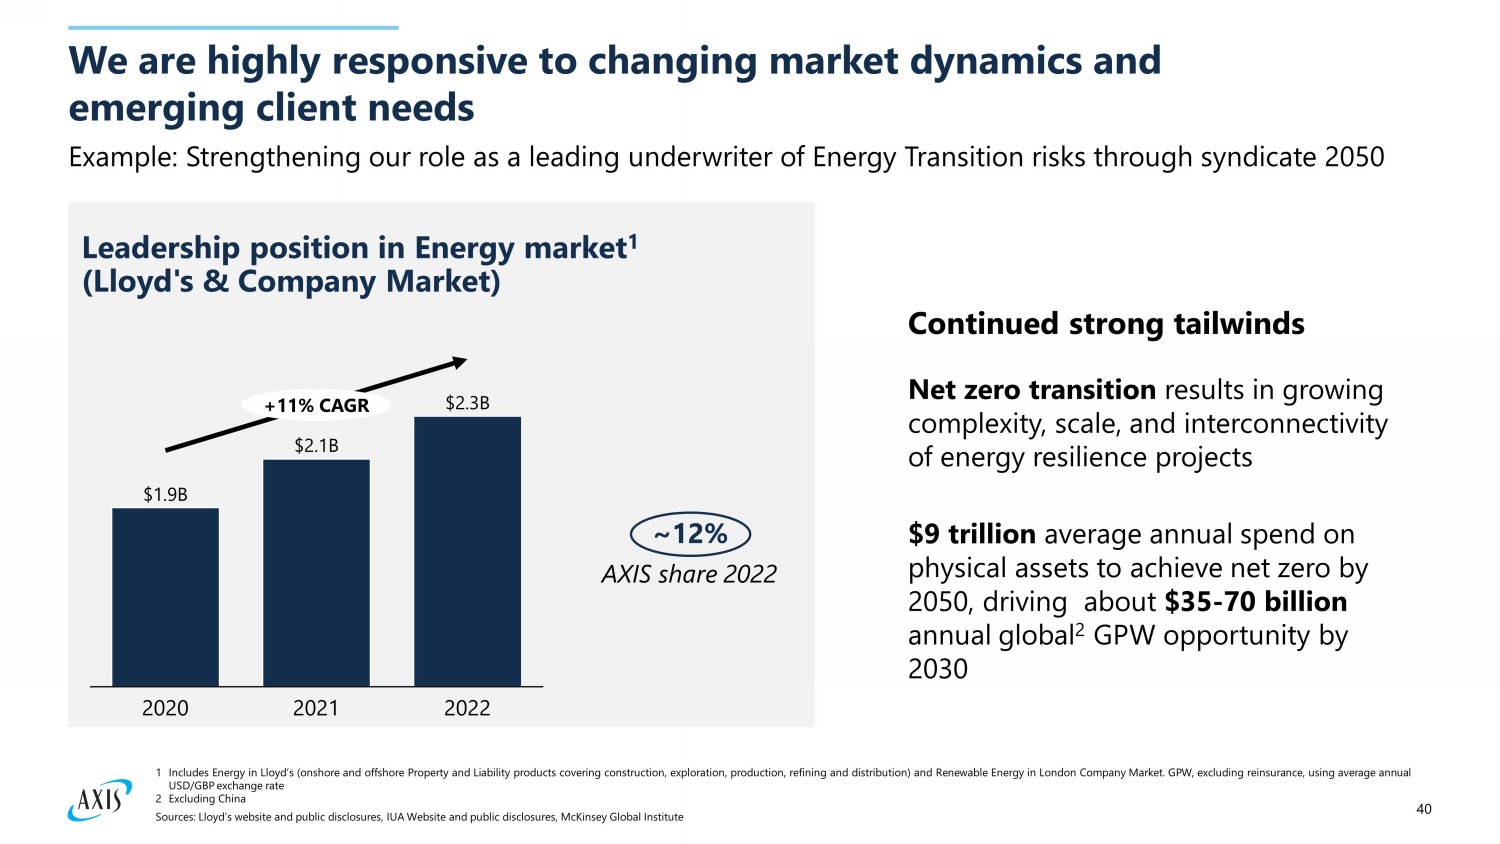
40 We are highly responsive to changing market dynamics and emerging client needs Sources: Lloyd’s website and public disclosures, IUA Website and public disclosures, McKinsey Global Institute $1.9B $2.1B $2.3B 2020 20 21 2022 +11% CAGR Leadership position in Energy market 1 (Lloyd's & Company Market) ~12% AXIS share 2022 Net zero transition results in growing complexity, scale, and interconnectivity of energy resilience projects $9 trillion average annual spend on physical assets to achieve net zero by 2050, driving about $35 - 70 billion annual global 2 GPW opportunity by 2030 Continued strong tailwinds Example: Strengthening our role as a leading underwriter of Energy Transition risks through syndicate 2050 1 Includes Energy in Lloyd’s (onshore and offshore Property and Liability products covering construction, exploration, production, refining and distribution) and Renewable Energy in London Company Market . GPW, excluding reinsurance, using average annual USD/GBP exchange rate 2 Excluding China
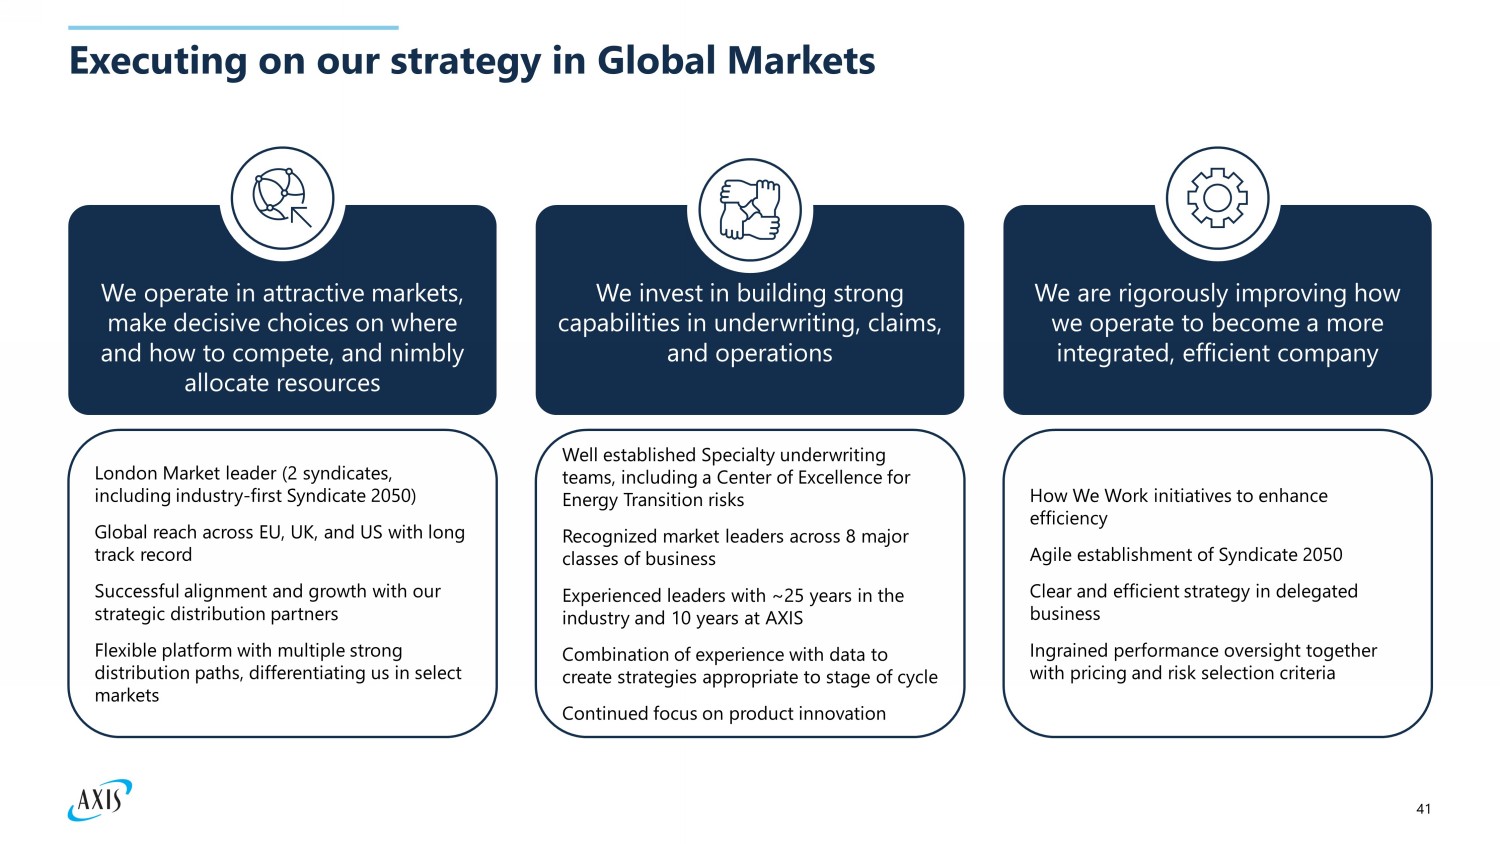
41 Executing on our strategy in Global Markets London M arket leader (2 syndicates, including industry - first Syndicate 2050) Global reach across EU, UK, and US with long track record Successful alignment and growth with our strategic distribution partners Flexible platform with multiple strong distribution paths, differentiating us in select markets We operate in attractive markets, make decisive choices on where and how to compete, and nimbly allocate resources We are rigorously improving how we operate to become a more integrated, efficient company We invest in building strong capabilities in underwriting, claims, and operations Well established Specialty underwriting teams, including a Center of Excellence for Energy Transition risks Recognized market leaders across 8 major classes of business E xperienced leaders with ~ 25 years in the industry and 10 years at AXIS Combination of experience with data to create strategies appropriate to stage of cycle Continued focus on product innovation How We Work initiatives to enhance efficiency Agile establishment of Syndicate 2050 Clear and efficient strategy in delegated business Ingrained performance oversight together with pricing and risk selection criteria
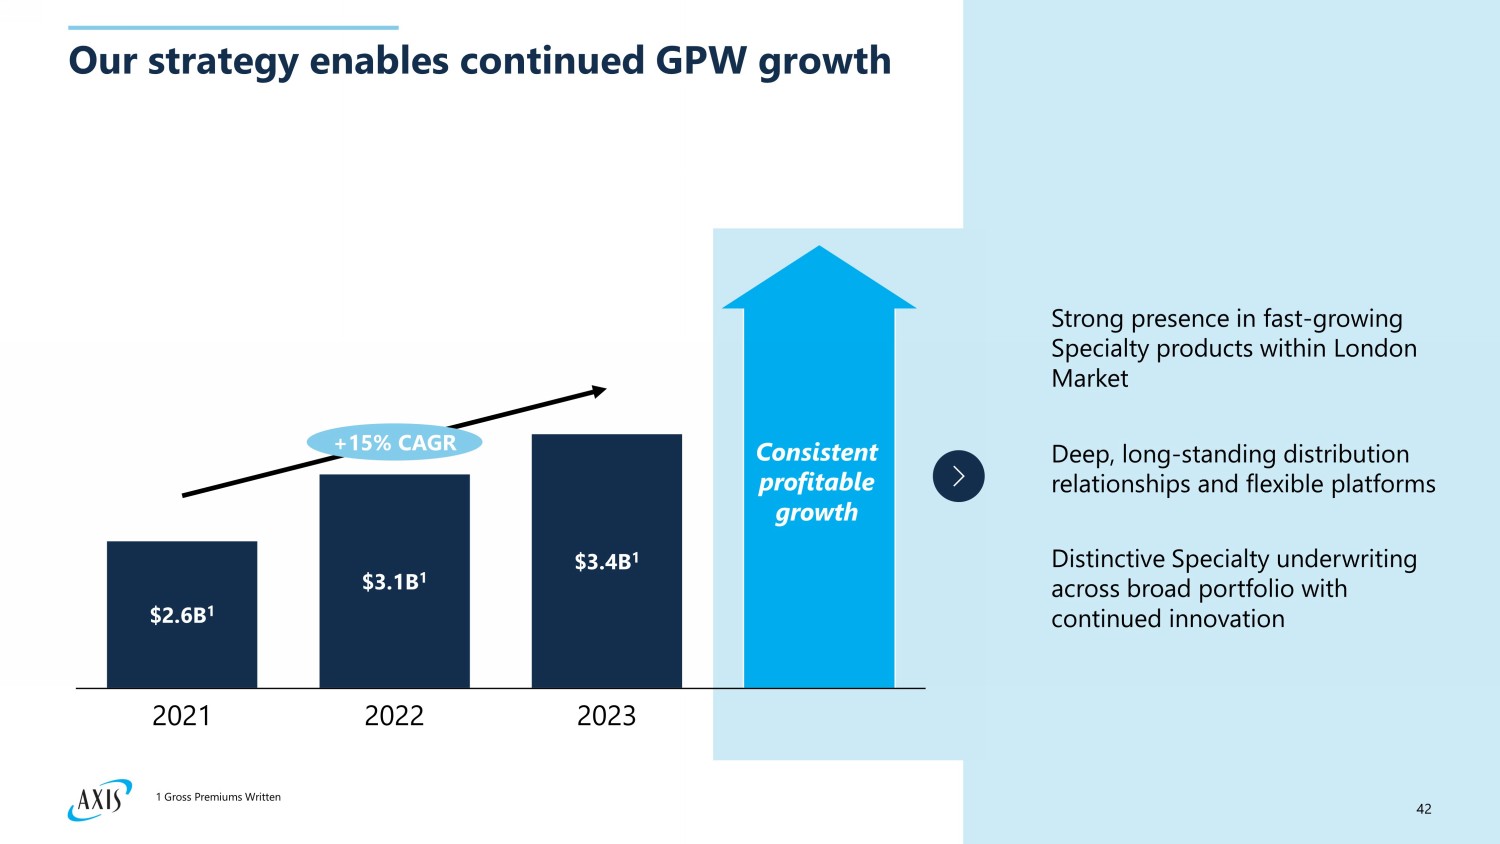
42 Our strategy enables continued GPW growth $2.6B 1 2021 $3.1B 1 20 22 $3.4B 1 20 23 +15% CAGR Consistent profitable growth Distinctive Specialty underwriting across broad portfolio with continued innovation Strong presence in fast - growing Specialty products within London Market Deep, long - standing distribution relationships and flexible platforms 1 Gross Premiums Written
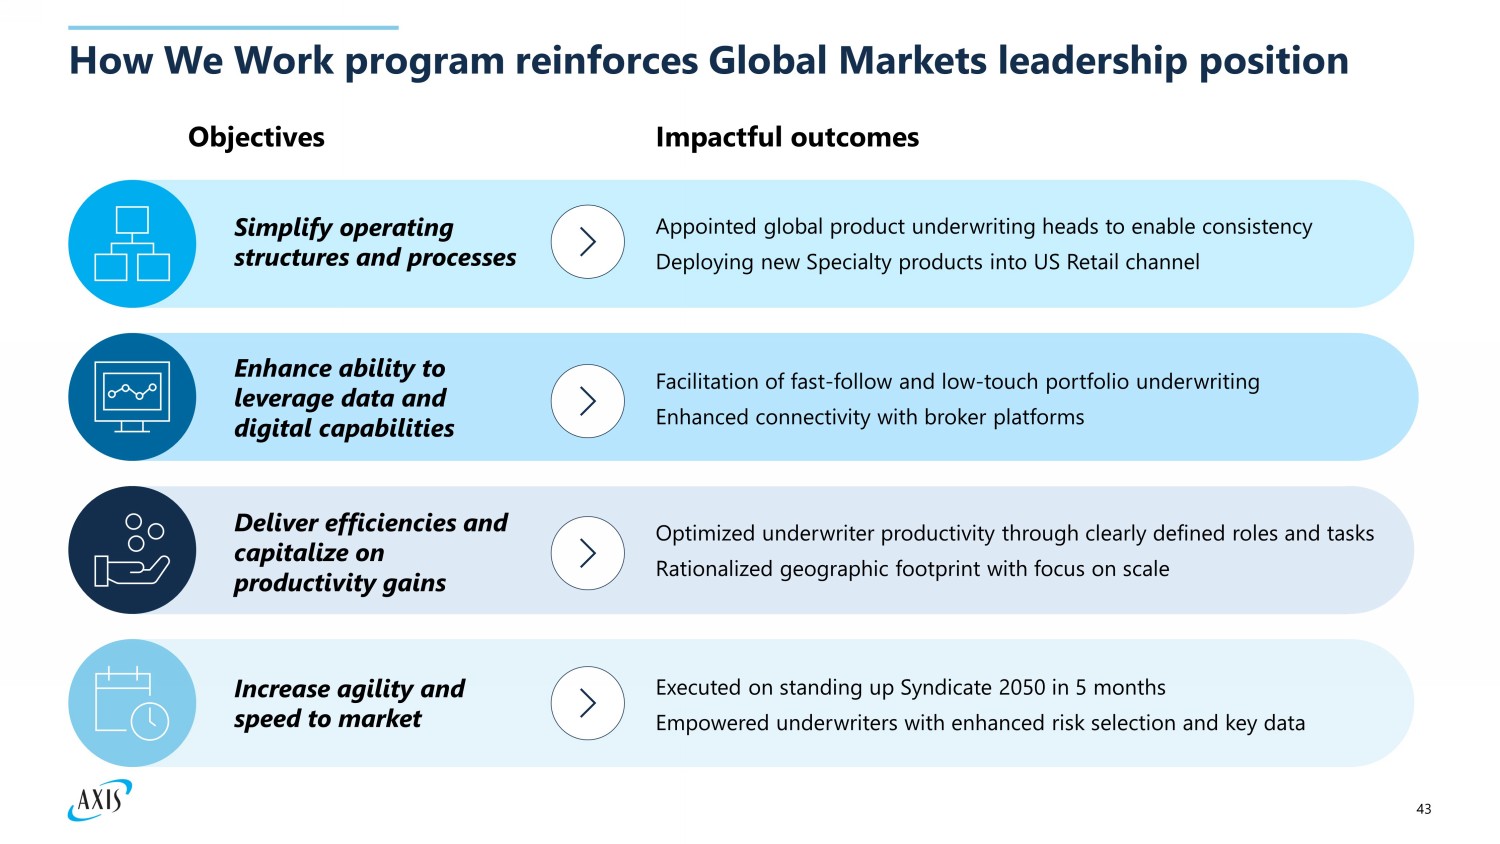
43 How We Work program reinforces Global Markets leadership position Objectives Impactful outcomes Increase agility and speed to market Executed on standing up Syndicate 2050 in 5 months Empowered underwriters with enhanced risk selection and key data Simplify operating structures and processes Appointed global product underwriting heads to enable consistency Deploying new Specialty products into US Retail channel Enhance ability to leverage data and digital capabilities Facilitation of fast - follow and low - touch portfolio underwriting Enhanced connectivity with broker platforms Deliver efficiencies and capitalize on productivity gains Optimized underwriter productivity through clearly defined roles and tasks Rationalized geographic footprint with focus on scale
44 Key takeaways Strong track record of profitable growth with established leadership position and critical mass across key lines of business and distribution channels Continuous investments in top talent and capabilities to maintain leadership position and capture market opportunities through the cycle Committed to delivering consistent growth through leadership in core existing markets and market - first Energy Transition syndicate
AXIS Re: A strategic diversifier Ann Haugh CEO, AXIS Re
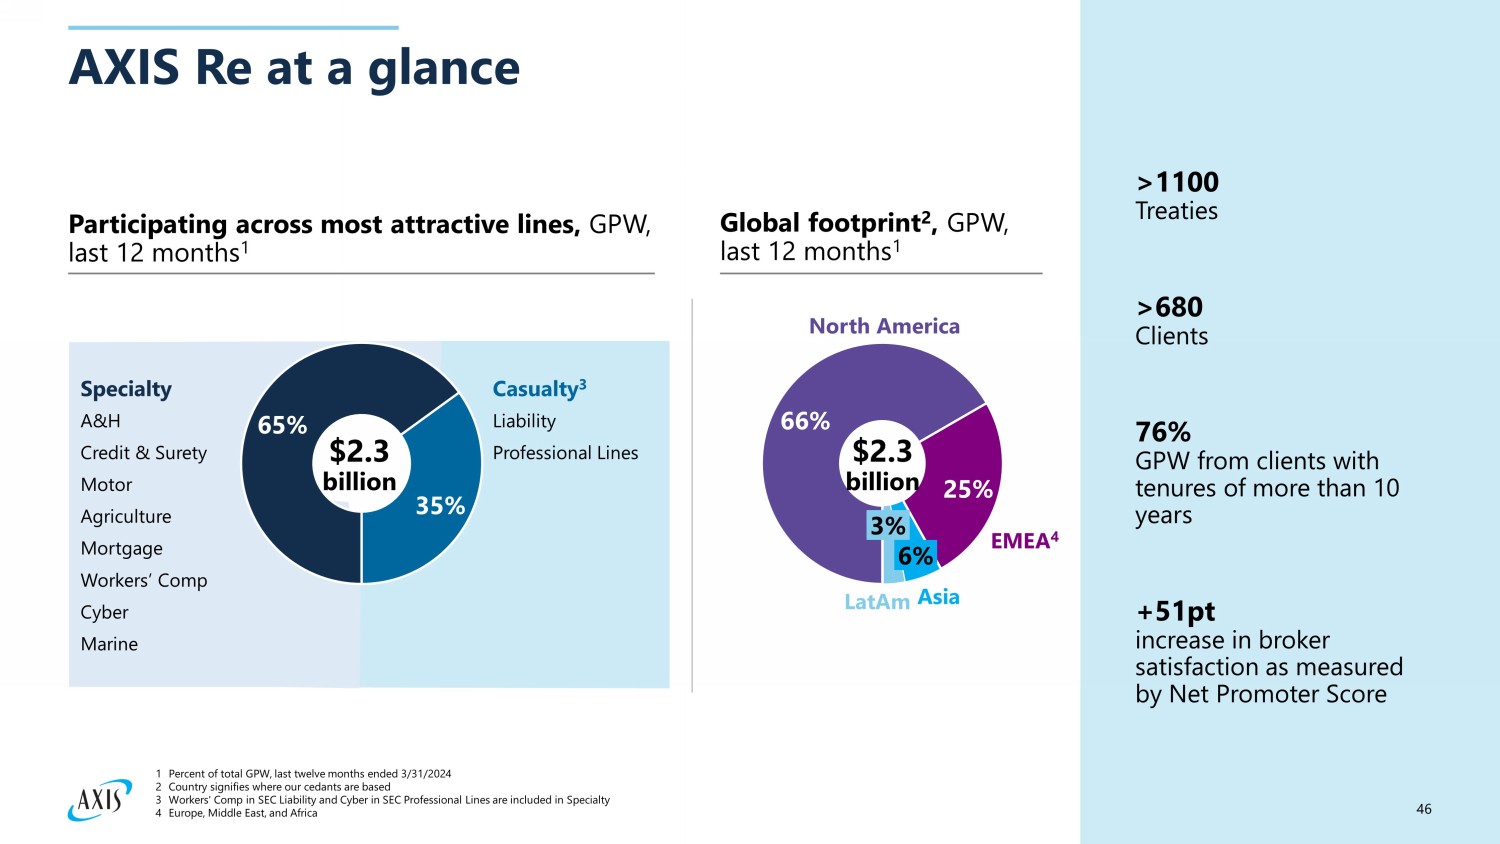
46 AXIS Re at a glance Participating across most attractive lines, GPW, last 12 months 1 Global footprint 2 , GPW, last 12 months 1 Short tail risks Casualty 3 Liability Professional Lines Marine & Aviation Global Property A&H Construction Specialty A&H Credit & Surety Motor Agriculture Mortgage Workers’ Comp Cyber Marine >1100 Treaties >680 Clients 76% GPW from clients with tenures of more than 10 years +51pt increase in broker satisfaction as measured by Net Promoter Score 66% 25% North America EMEA 4 6% Asia 3% LatAm 65% 35% 1 Percent of total GPW, last twelve months ended 3/31/2024 2 Country signifies where our cedants are based 3 Workers' Comp in SEC Liability and Cyber in SEC Professional Lines are included in Specialty 4 Europe, Middle East, and Africa $2.3 billion $2.3 billion
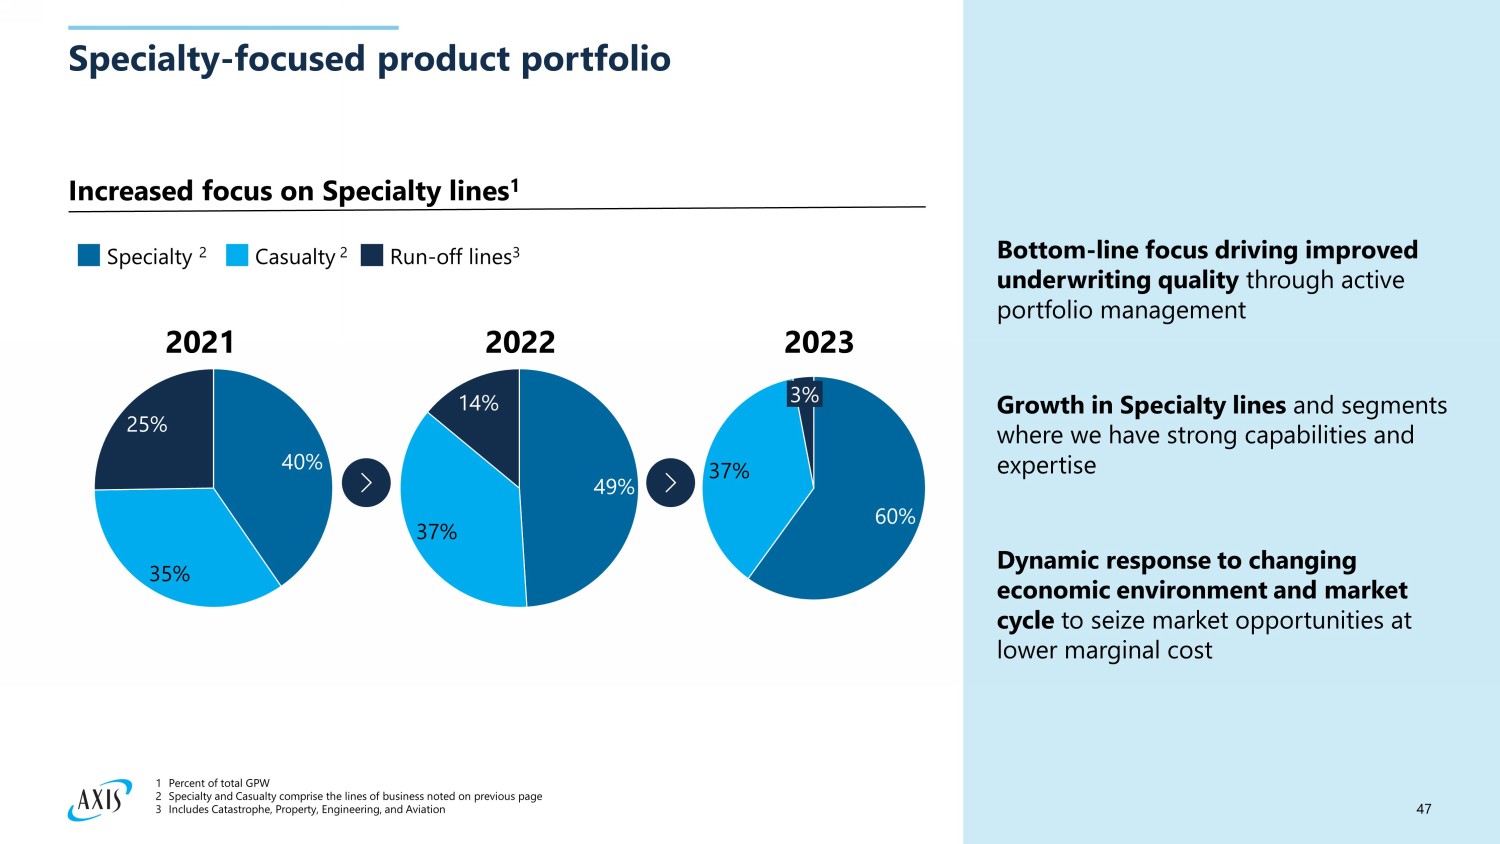
47 Specialty - focused product portfolio 40% 25% 35% 49% 37% 14% 60% 37% 3% 2021 2022 2023 Specialty 2 Casualty 2 Run - off lines 3 Increased focus on Specialty lines 1 Bottom - line focus driving improved underwriting quality through active portfolio management Dynamic response to changing economic environment and market cycle to seize market opportunities at lower marginal cost Growth in Specialty lines and segments where we have strong capabilities and expertise 1 Percent of total GPW 2 Specialty and Casualty comprise the lines of business noted on previous page 3 Includes Catastrophe, Property, Engineering, and Aviation
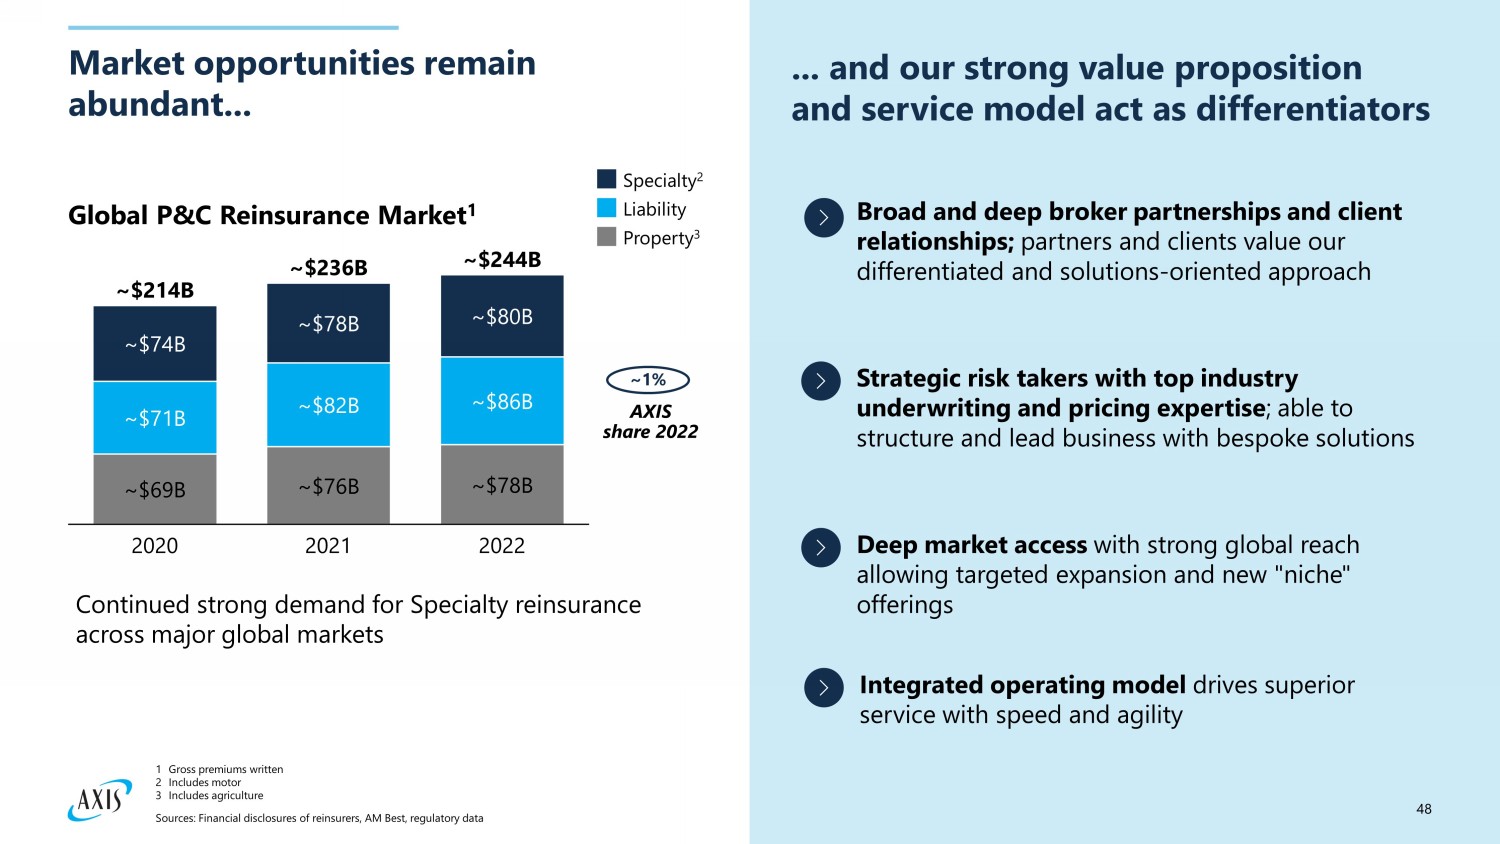
48 Market opportunities remain abundant... ... and our strong value proposition and service model act as differentiators Broad and deep broker partnerships and client relationships; partners and clients value our differentiated and solutions - oriented approach Strategic risk takers with top industry underwriting and pricing expertise ; able to structure and lead business with bespoke solutions Continued strong demand for Specialty reinsurance across major global markets ~45 ~50 ~55 Deep market access with strong global reach allowing targeted expansion and new "niche" offerings Integrated operating model drives superior service with speed and agility ~ $74B ~ $71B ~ $69B 2020 ~ $78B ~ $82B ~ $76B 2021 ~ $80B ~ $86B ~ $78B 2022 ~ $214B ~ $236B ~ $244B Specialty 2 Liability Property 3 ~1% AXIS share 2022 Global P&C Reinsurance Market 1 Sources: Financial disclosures of reinsurers, AM Best, regulatory data 1 Gross premiums written 2 Includes motor 3 Includes agriculture
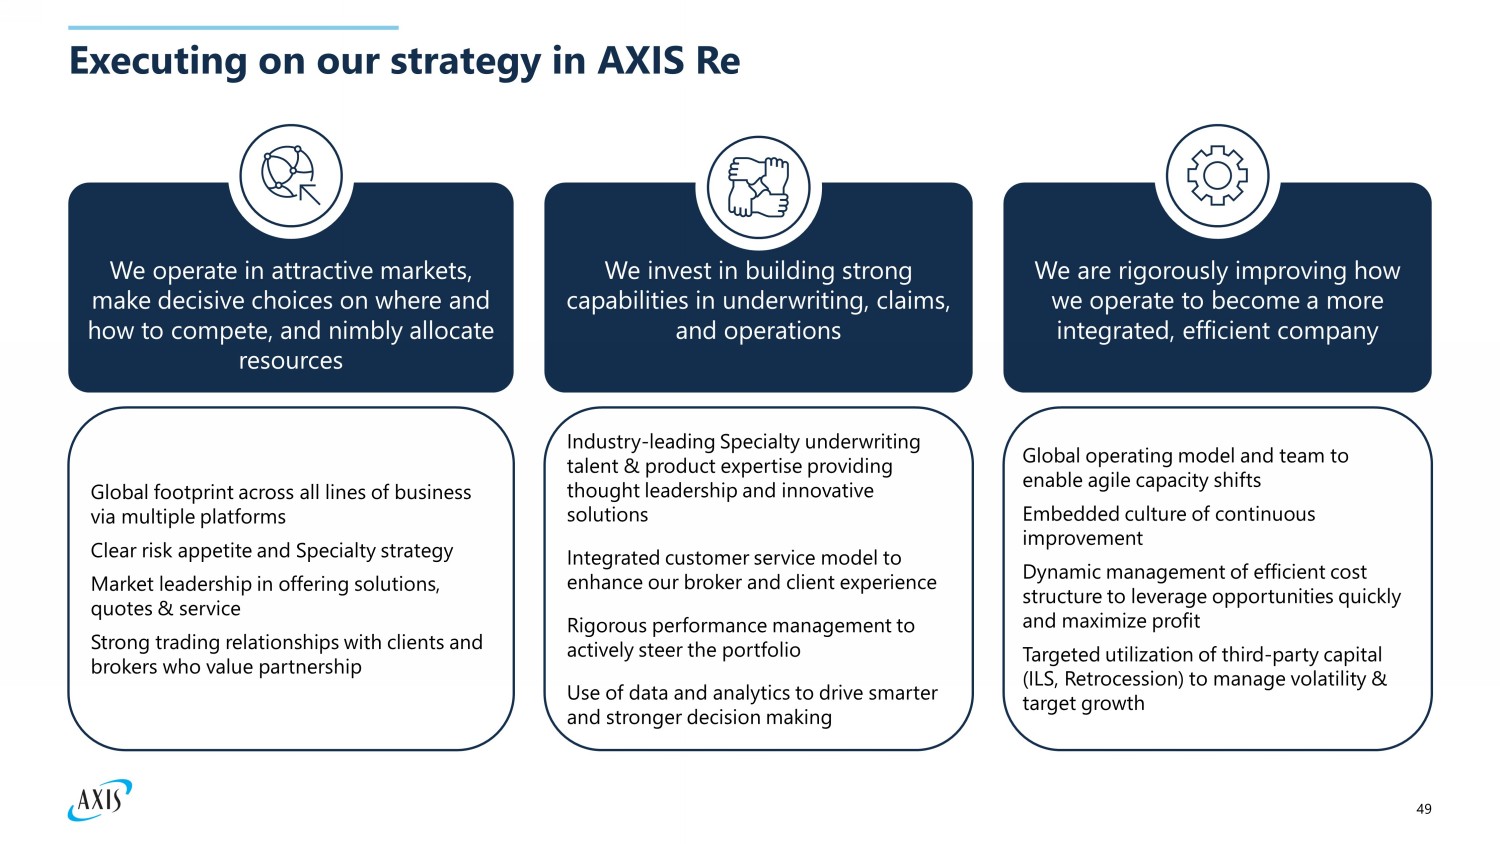
49 Executing on our strategy in AXIS Re Global footprint across all lines of business via multiple platforms Clear risk appetite and Specialty strategy Market leadership in offering solutions, quotes & service Strong trading relationships with clients and brokers who value partnership We operate in attractive markets, make decisive choices on where and how to compete, and nimbly allocate resources We are rigorously improving how we operate to become a more integrated, efficient company We invest in building strong capabilities in underwriting, claims, and operations Industry - leading Specialty underwriting talent & product expertise providing thought leadership and innovative solutions Integrated customer service model to enhance our broker and client experience Rigorous performance management to actively steer the portfolio Use of data and analytics to drive smarter and stronger decision making Global operating model and team to enable agile capacity shifts Embedded culture of continuous improvement Dynamic management of efficient cost structure to leverage opportunities quickly and maximize profit Targeted utilization of third - party capital (ILS, Retrocession) to manage volatility & target growth
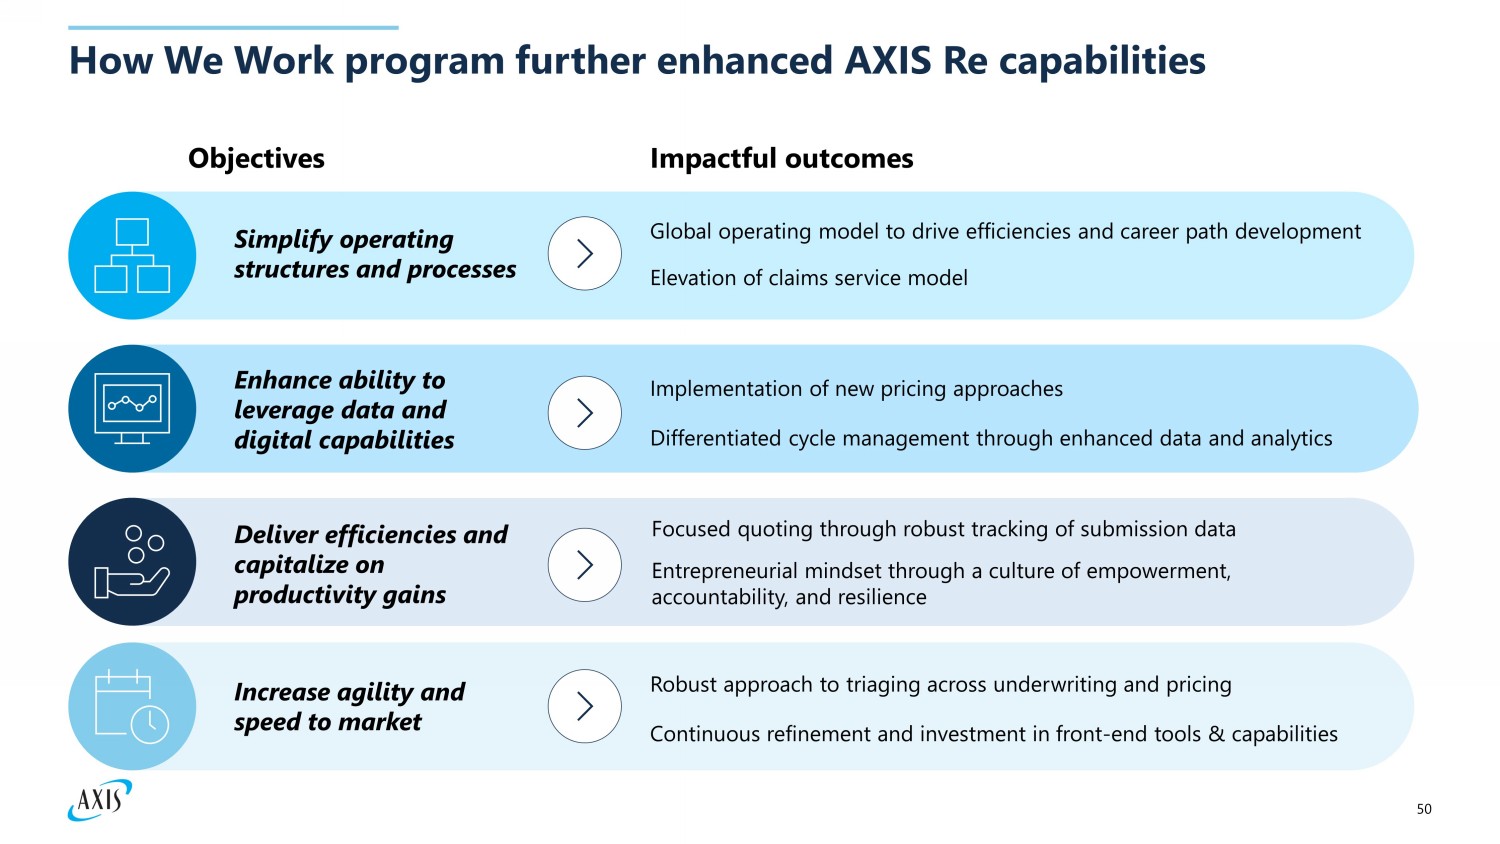
50 How We Work program further enhanced AXIS Re capabilities Objectives Impactful outcomes Increase agility and speed to market Robust approach to triaging across underwriting and pricing Continuous refinement and investment in front - end tools & capabilities Simplify operating structures and processes Global operating model to drive efficiencies and career path development Elevation of claims service model Enhance ability to leverage data and digital capabilities Implementation of new pricing approaches Differentiated cycle management through enhanced data and analytics Deliver efficiencies and capitalize on productivity gains Focused quoting through robust tracking of submission data Entrepreneurial mindset through a culture of empowerment, accountability, and resilience
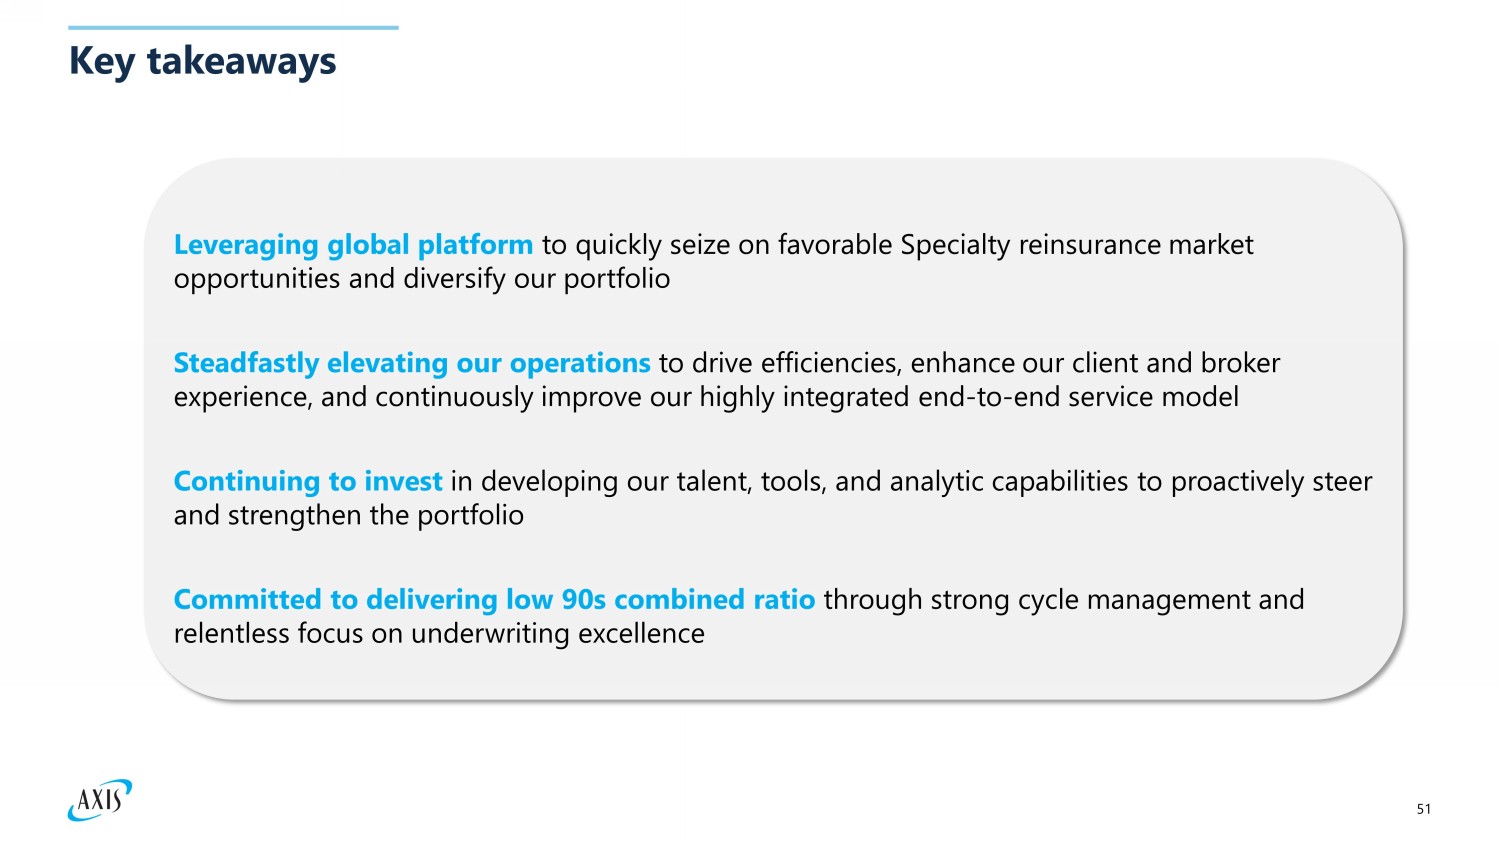
51 Key takeaways Steadfastly elevating our operations to drive efficiencies, enhance our client and broker experience, and continuously improve our highly integrated end - to - end service model Committed to delivering low 90 s combined r atio through strong cycle management and relentless focus on underwriting excellence Continuing to invest in developing our talent, tools, and analytic capabilities to proactively steer and strengthen the portfolio Leveraging global platform to quickly seize on favorable Specialty reinsurance market opportunities and diversify our portfolio

Financial Overview: Maximizing long - term value creation Peter Vogt Chief Financial Officer
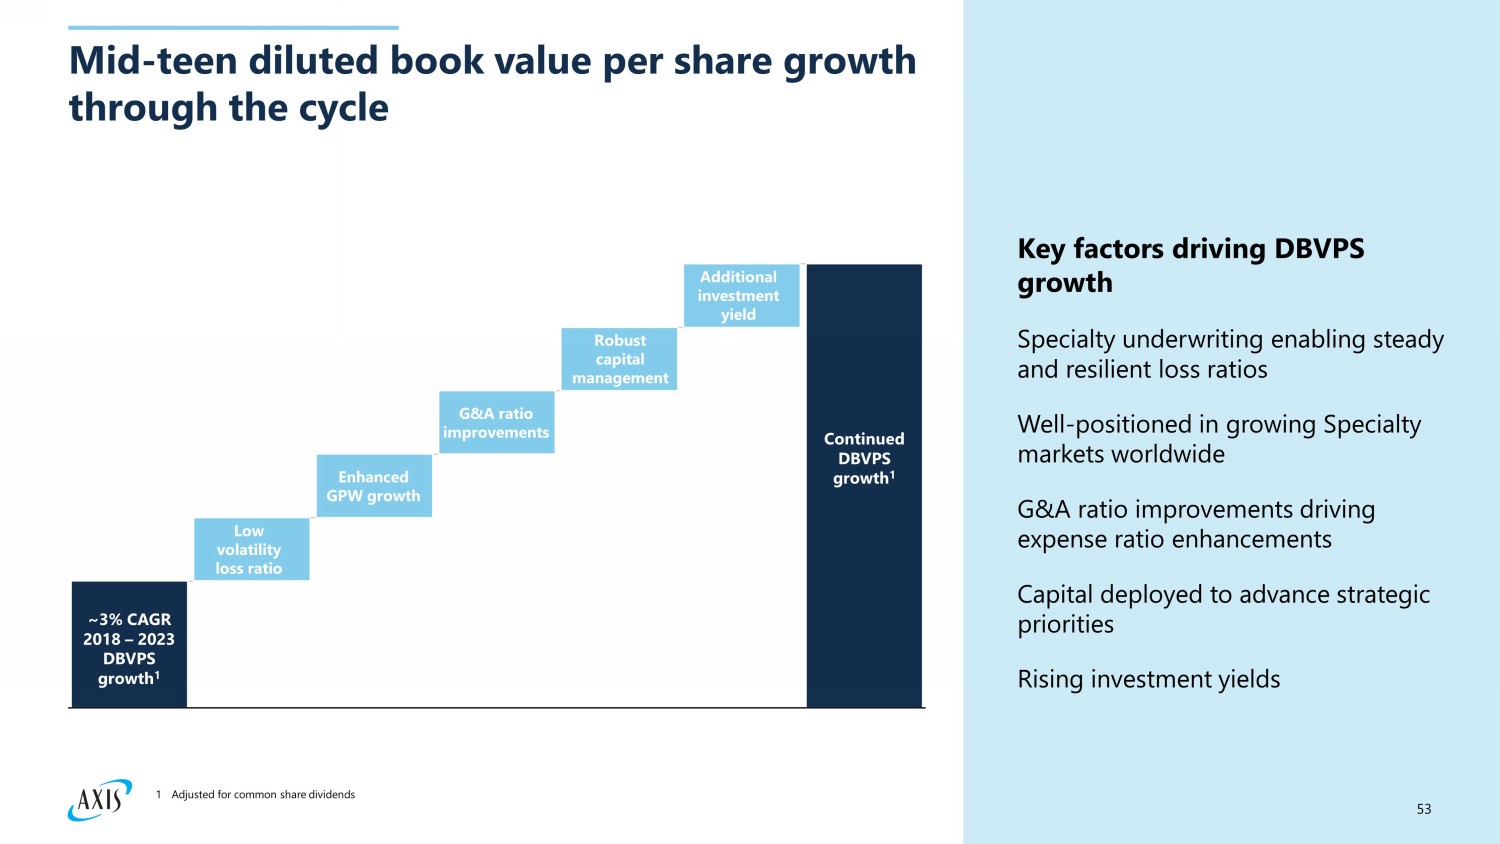
53 Mid - teen diluted book value per share growth through the cycle Enhanced GPW growth G&A ratio improvements Additional investment yield ~ 3 % CAGR 2018 – 2023 DBVPS growth 1 Continued DBVPS growth 1 Low volatility loss ratio Key factors driving DBVPS growth Specialty underwriting enabling steady and resilient loss ratios Well - positioned in growing Specialty markets worldwide G&A ratio improvements driving expense ratio enhancements Capital deployed to advance strategic priorities Rising investment yields Robust capital management 1 Adjusted for common share dividends
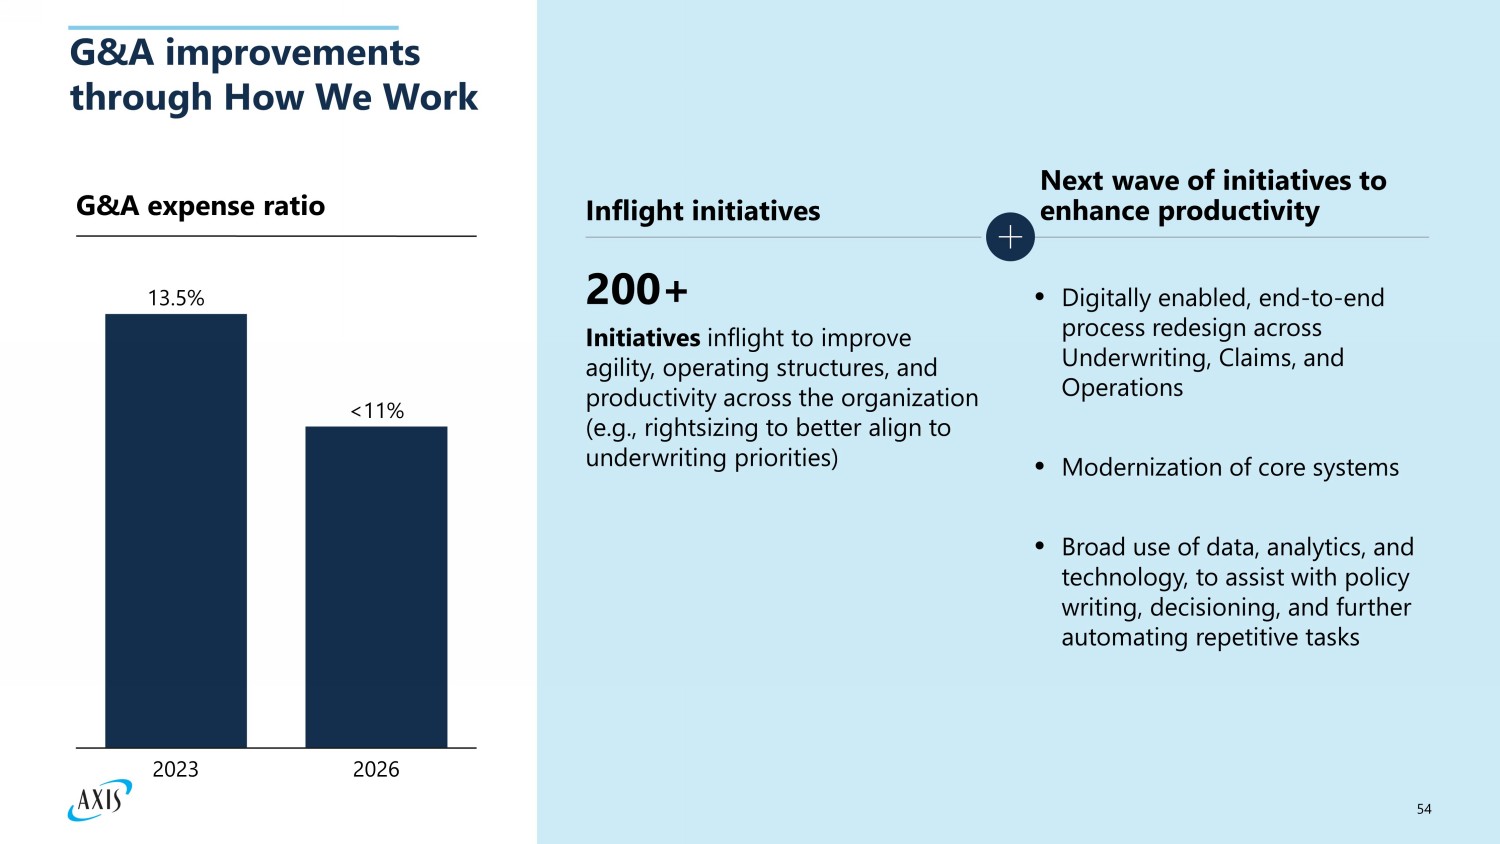
54 G&A improvements through How We Work Inflight initiatives Initiatives inflight to improve agility, operating structures, and productivity across the organization (e.g., rightsizing to better align to underwriting priorities) 200+ Next wave of initiatives to enhance productivity Digitally enabled, end - to - end process redesign across Underwriting, Claims, and Operations Modernization of core systems Broad use of data, analytics, and technology, to assist with policy writing, decisioning, and further automating repetitive tasks G&A expense ratio 2023 2026 13.5% <11%
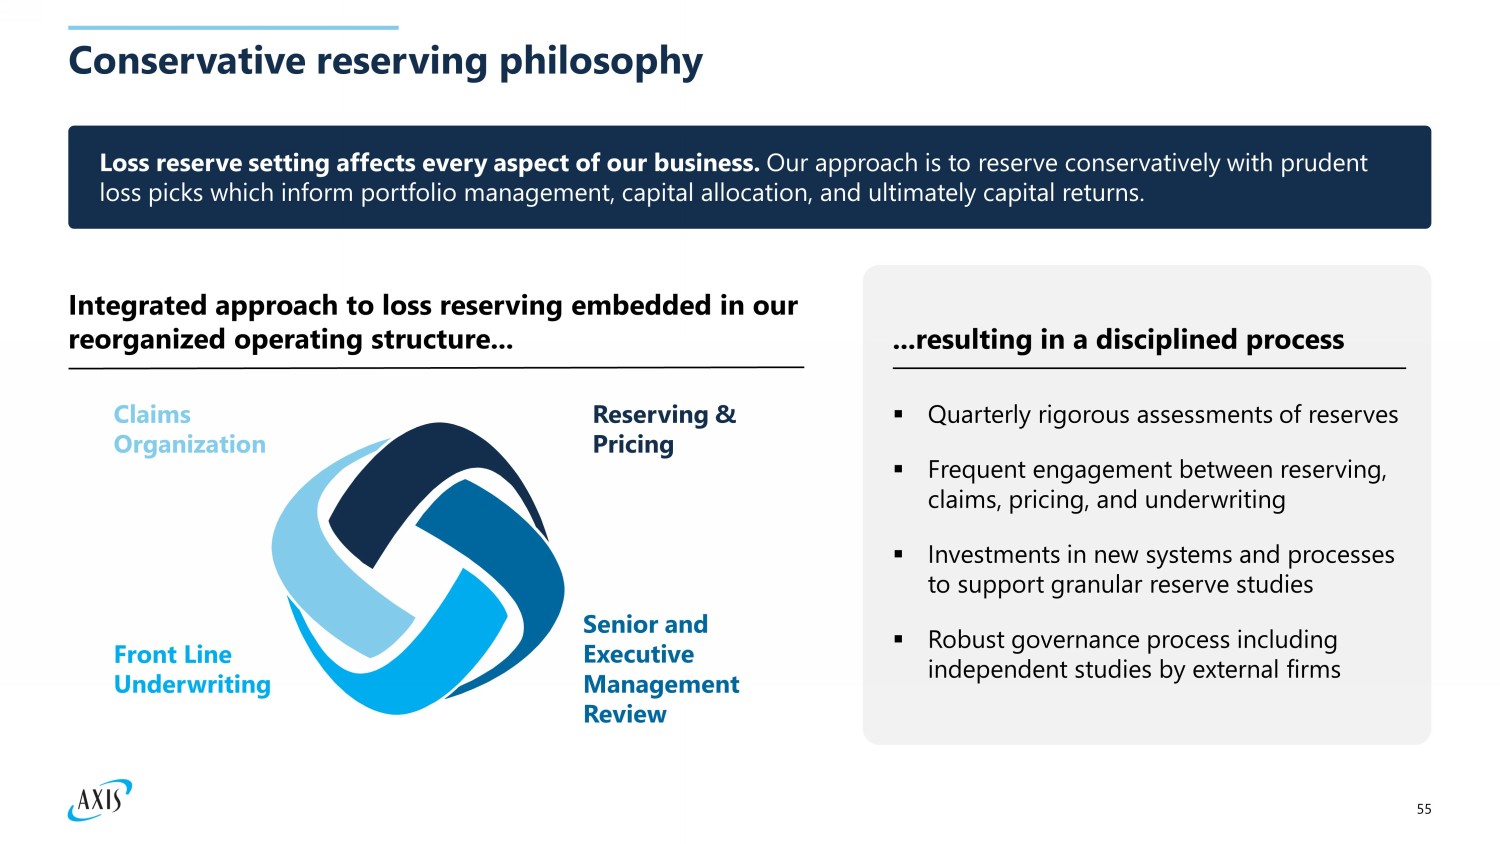
55 Conservative reserving philosophy ▪ Quarterly rigorous assessments of reserves ▪ Frequent engagement between reserving, claims, pricing, and underwriting ▪ Investments in new systems and processes to support granular reserve studies ▪ Robust governance process including independent studies by external firms Integrated approach to loss reserving embedded in our reorganized operating structure... Senior and Executive Management Review Front Line Underwriting Reserving & Pricing Claims Organization ...resulting in a disciplined process Loss reserve setting affects every aspect of our business. Our approach is to reserve conservatively with prudent loss picks which inform portfolio management, capital allocation, and ultimately capital returns.
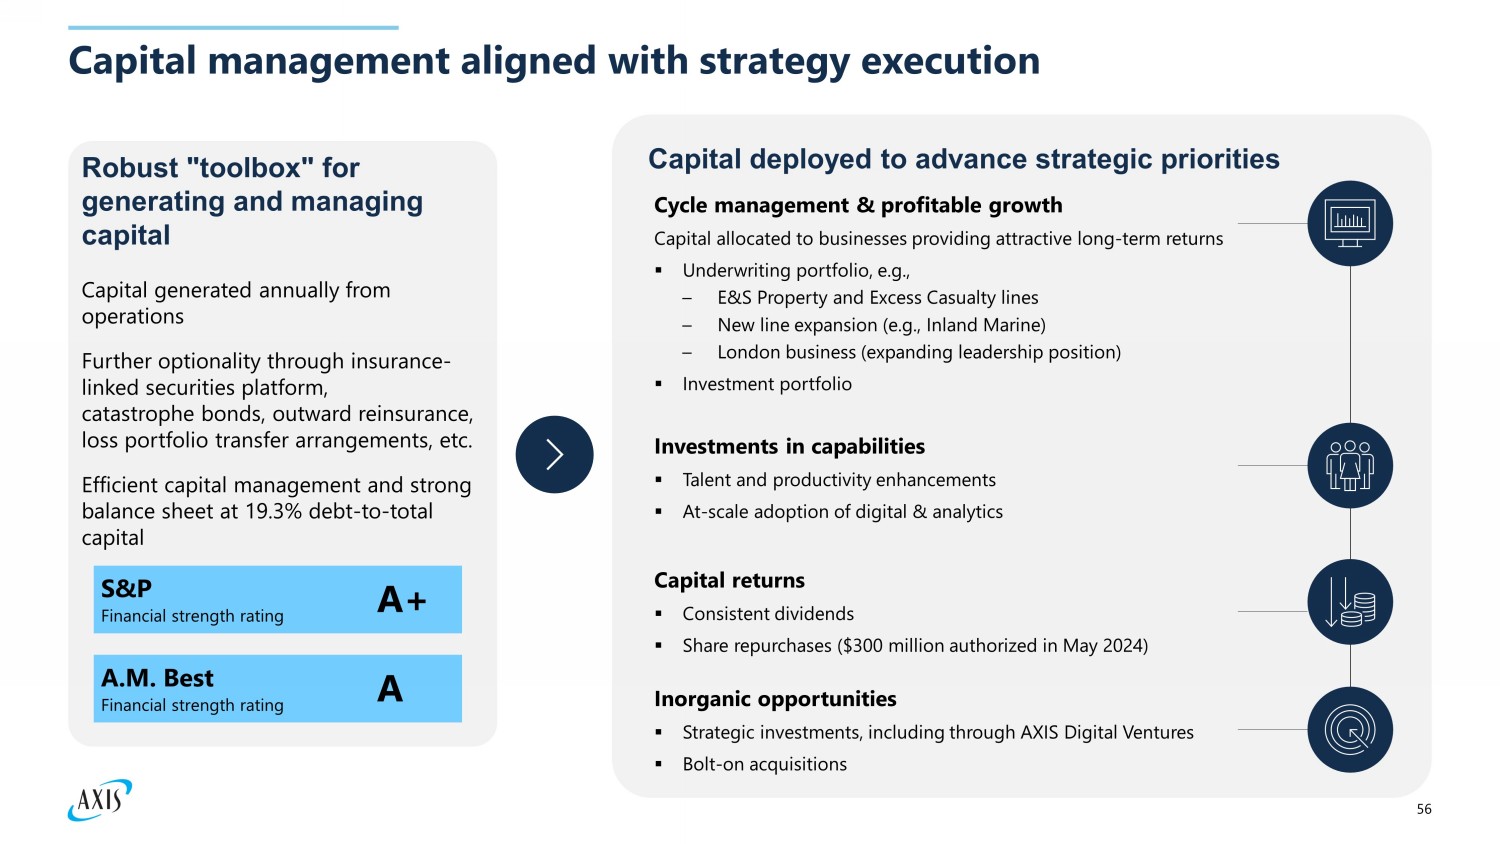
56 Capital management aligned with strategy execution Robust "toolbox" for generating and managing capital Capital generated annually from operations Further optionality through insurance - linked securities platform, catastrophe bonds, outward reinsurance, loss portfolio transfer arrangements, etc. Efficient capital management and strong balance sheet at 19.3% debt - to - total capital S&P Financial strength rating A+ A.M. Best Financial strength rating A Capital deployed to advance strategic priorities Cycle management & profitable growth Capital allocated to businesses providing attractive long - term returns ▪ Underwriting portfolio, e.g., – E&S Property and Excess Casualty lines – New line expansion (e.g., Inland M arine) – London business (expanding leadership position) ▪ Investment portfolio Investments in capabilities ▪ Talent and productivity enhancements ▪ At - scale adoption of digital & analytics Capital returns ▪ Consistent dividends ▪ Share repurchases ($300 million authorized in May 2024) Inorganic opportunities ▪ Strategic investments, including through AXIS Digital Ventures ▪ Bolt - on acquisitions
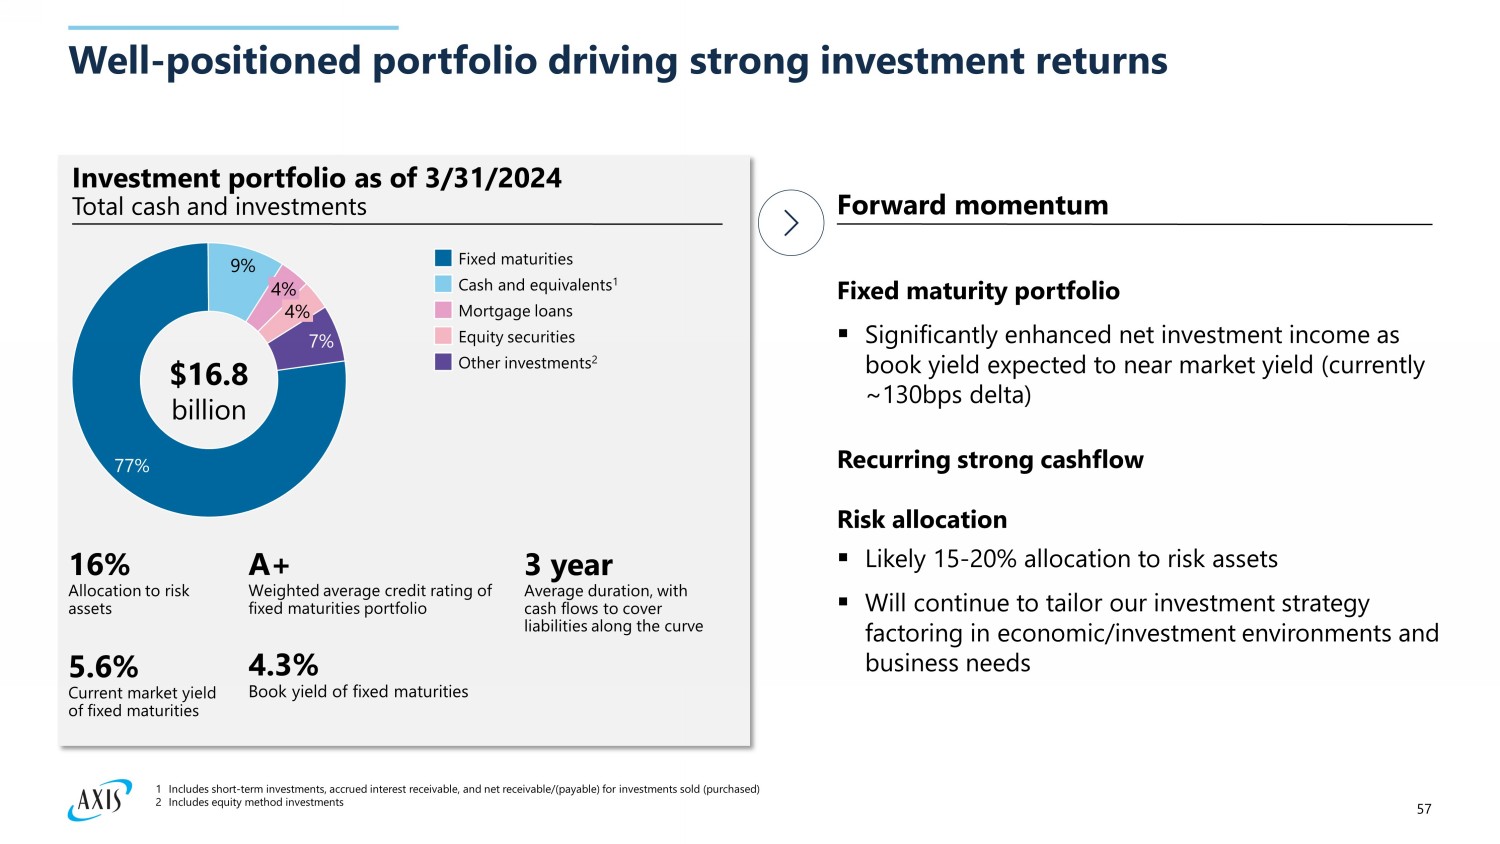
57 Well - positioned portfolio driving strong investment returns 9% 7% 77% 4% 4% I nvestment portfolio as of 3/31/2024 Total cash and investments $16.8 billion Fixed maturities Cash and equivalents 1 Mortgage loans Equity securities Other investments 2 A+ Weighted average credit rating of fixed maturities portfolio 3 year Average duration, with cash flows to cover liabilities along the curve 5.6% Current market yield of fixed maturities 4.3% Book yield of fixed maturities 16% Allocation to risk assets Forward momentum Fixed maturity portfolio ▪ Significantly enhanced net investment income as book yield expected to near market yield (currently ~130bps delta) Recurring strong cashflow Risk allocation ▪ Likely 15 - 20% allocation to risk assets ▪ Will continue to tailor our investment strategy factoring in economic/investment environments and business needs 1 Includes short - term investments, accrued interest receivable, and net receivable/(payable) for investments sold (purchased) 2 Includes equity method investments
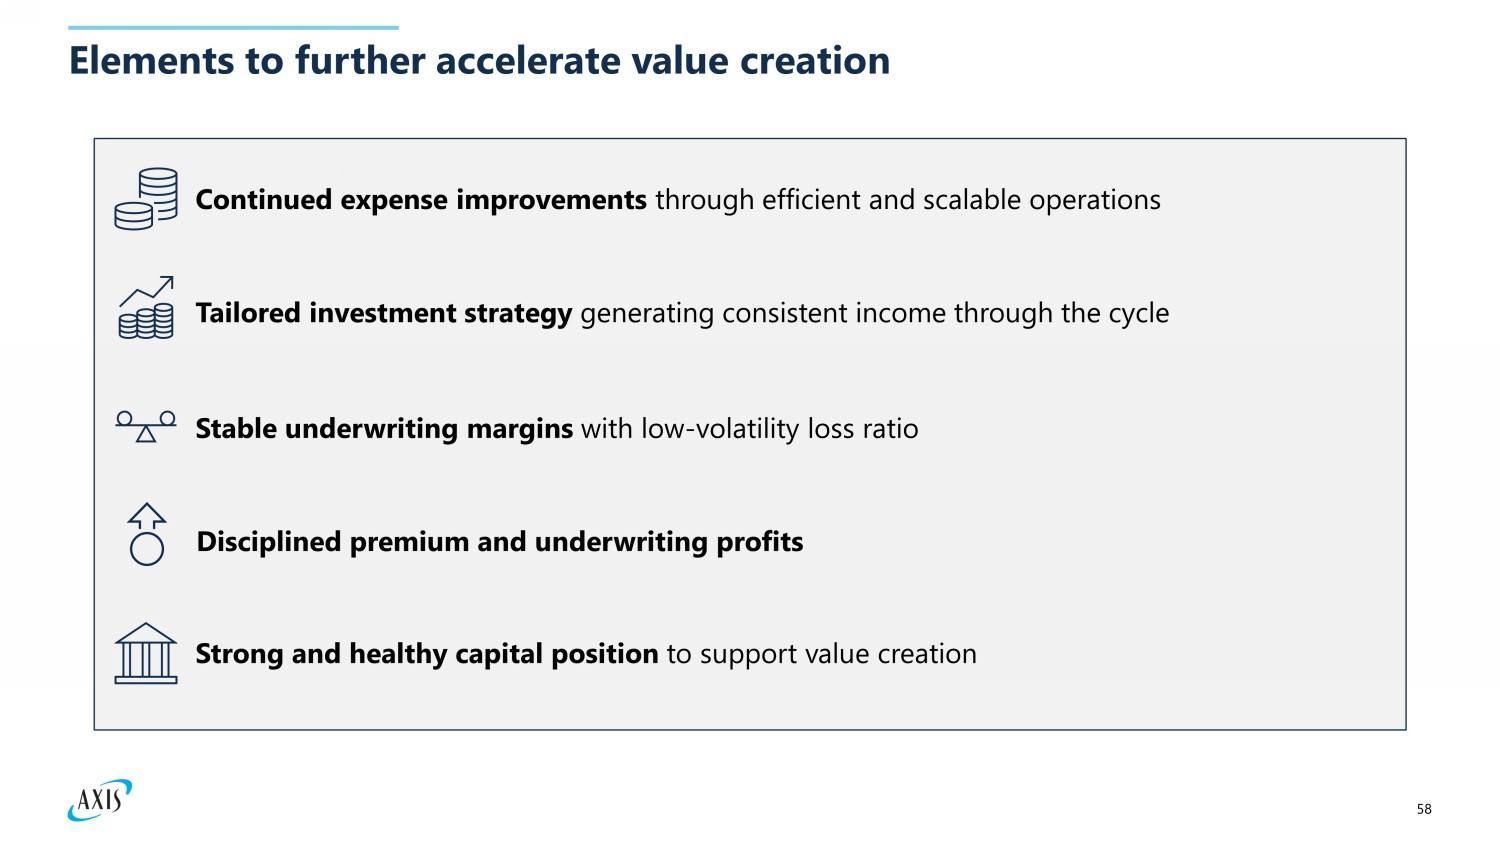
58 Elements to further accelerate value creation Strong and healthy capital position to support value creation Tailored investment strategy generating consistent income through the cycle Continued expense improvements through efficient and scalable operations Disciplined premium and underwriting profits Stable underwriting margins with low - volatility loss ratio

Question & Answer Session
60 Appendix: Non - GAAP Financial Measures Reconciliations
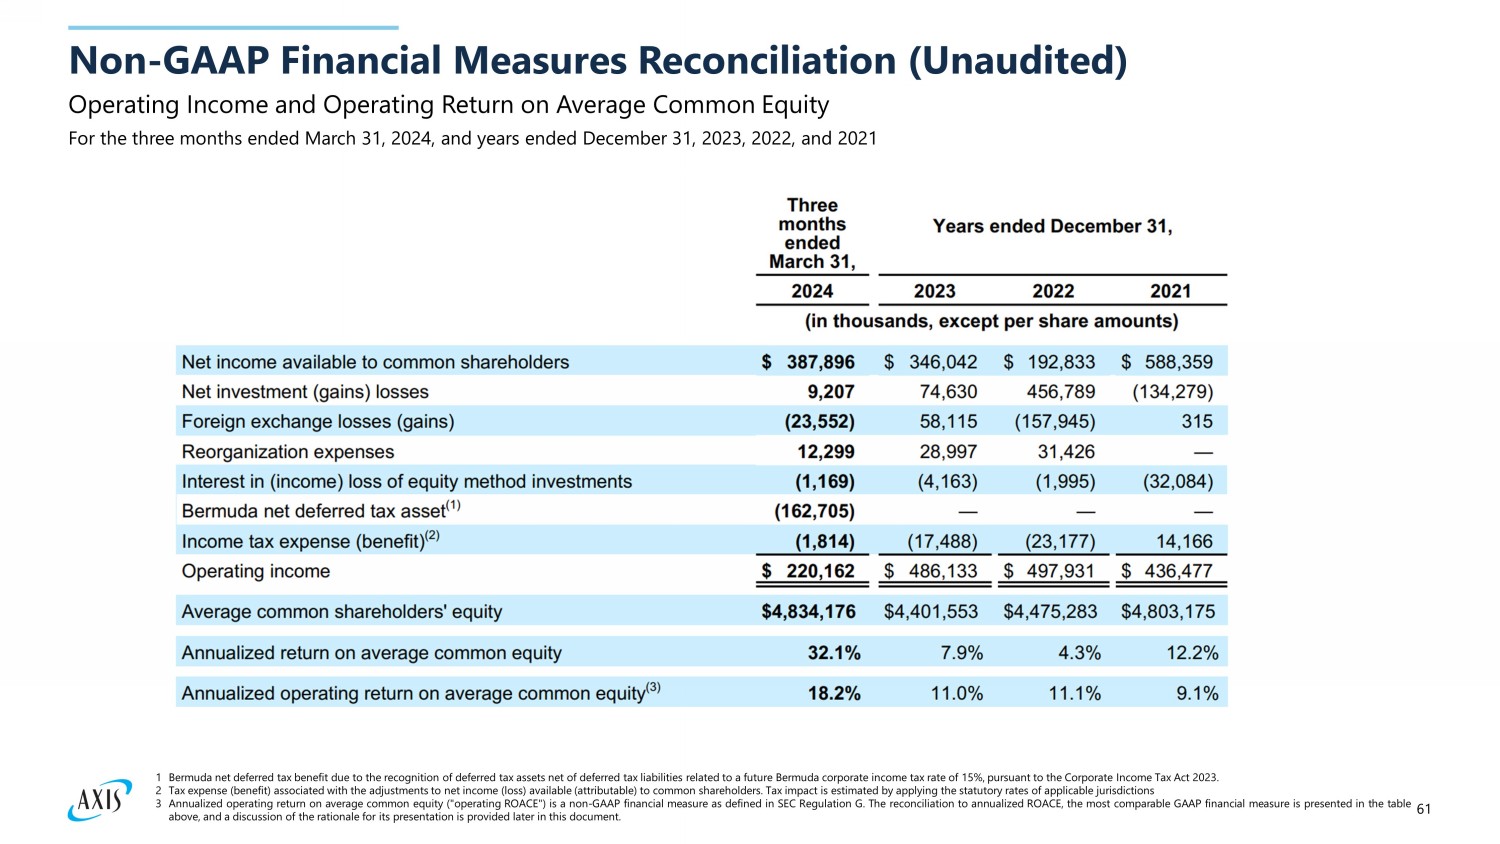
61 Operating Income and Operating Return on Average Common Equity Non - GAAP Financial Measures Reconciliation (Unaudited) 1 Bermuda net deferred tax benefit due to the recognition of deferred tax assets net of deferred tax liabilities related to a future Bermuda corporate income tax rate of 15 % , pursuant to the Corporate Income Tax Act 2023 . 2 Tax expense (benefit) associated with the adjustments to net income (loss) available (attributable) to common shareholders . Tax impact is estimated by applying the statutory rates of applicable jurisdictions 3 Annualized operating return on average common equity ("operating ROACE") is a non - GAAP financial measure as defined in SEC Regulation G . The reconciliation to annualized ROACE, the most comparable GAAP financial measure is presented in the table above, and a discussion of the rationale for its presentation is provided later in this document . For the three months ended March 31, 2024, and years ended December 31, 2023, 2022, and 2021
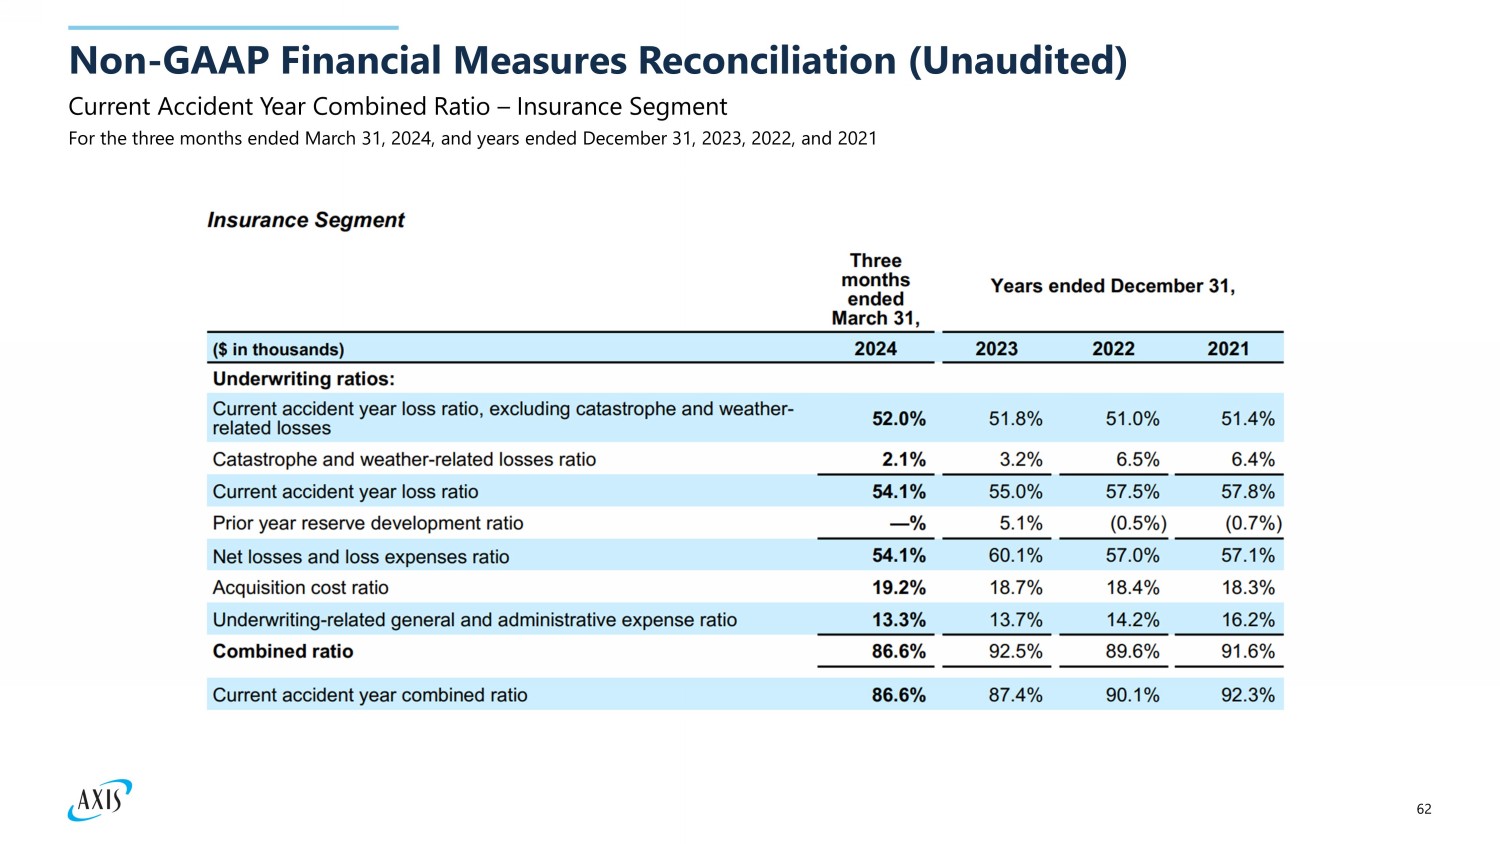
62 Current Accident Year Combined Ratio – Insurance Segment Non - GAAP Financial Measures Reconciliation (Unaudited) For the three months ended March 31, 2024, and years ended December 31, 2023, 2022, and 2021
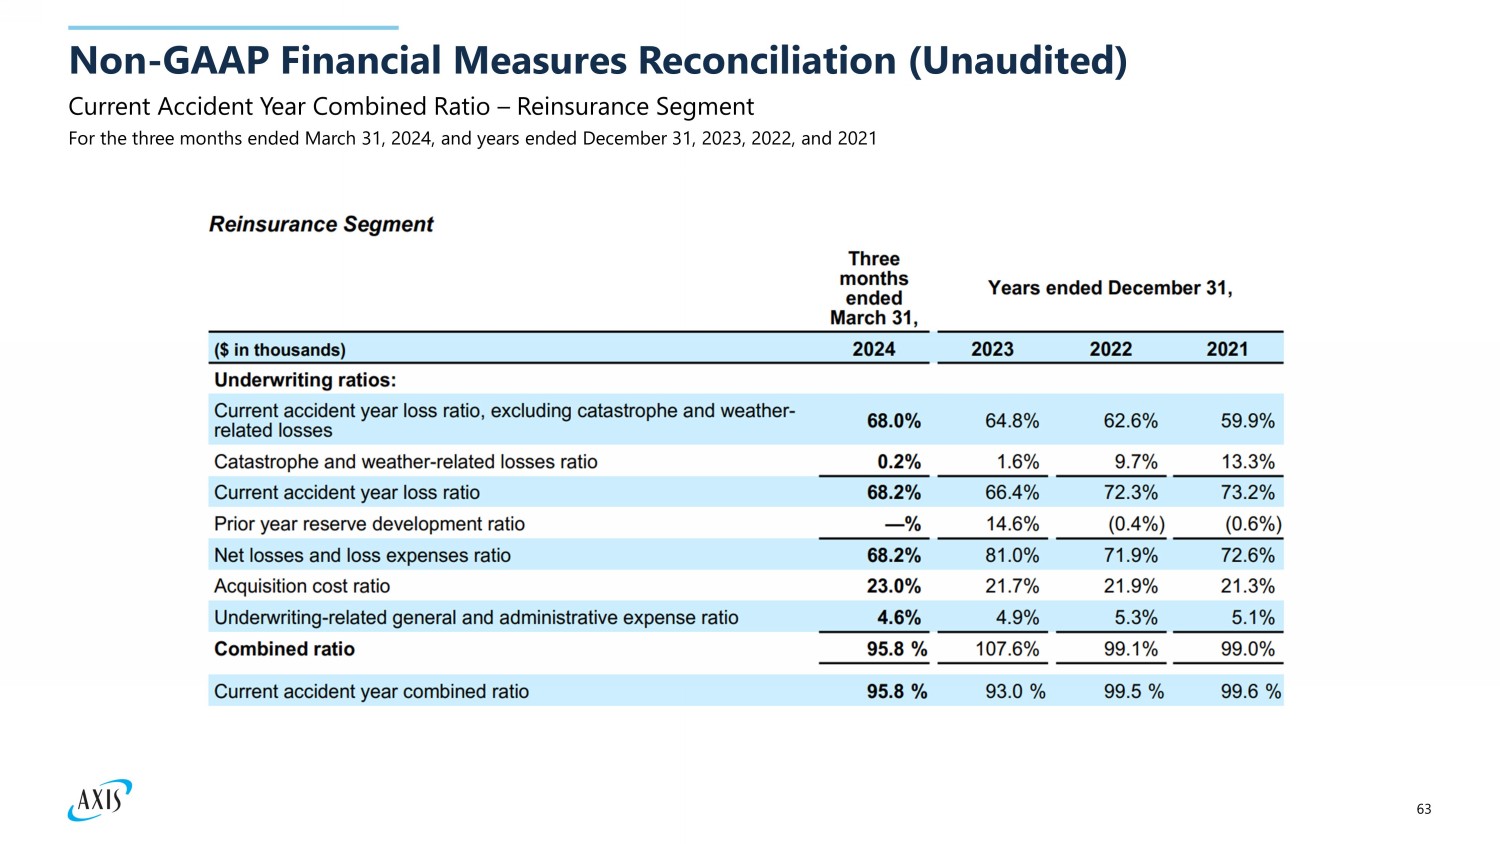
63 Current Accident Year Combined Ratio – Reinsurance Segment Non - GAAP Financial Measures Reconciliation (Unaudited) For the three months ended March 31, 2024, and years ended December 31, 2023, 2022, and 2021
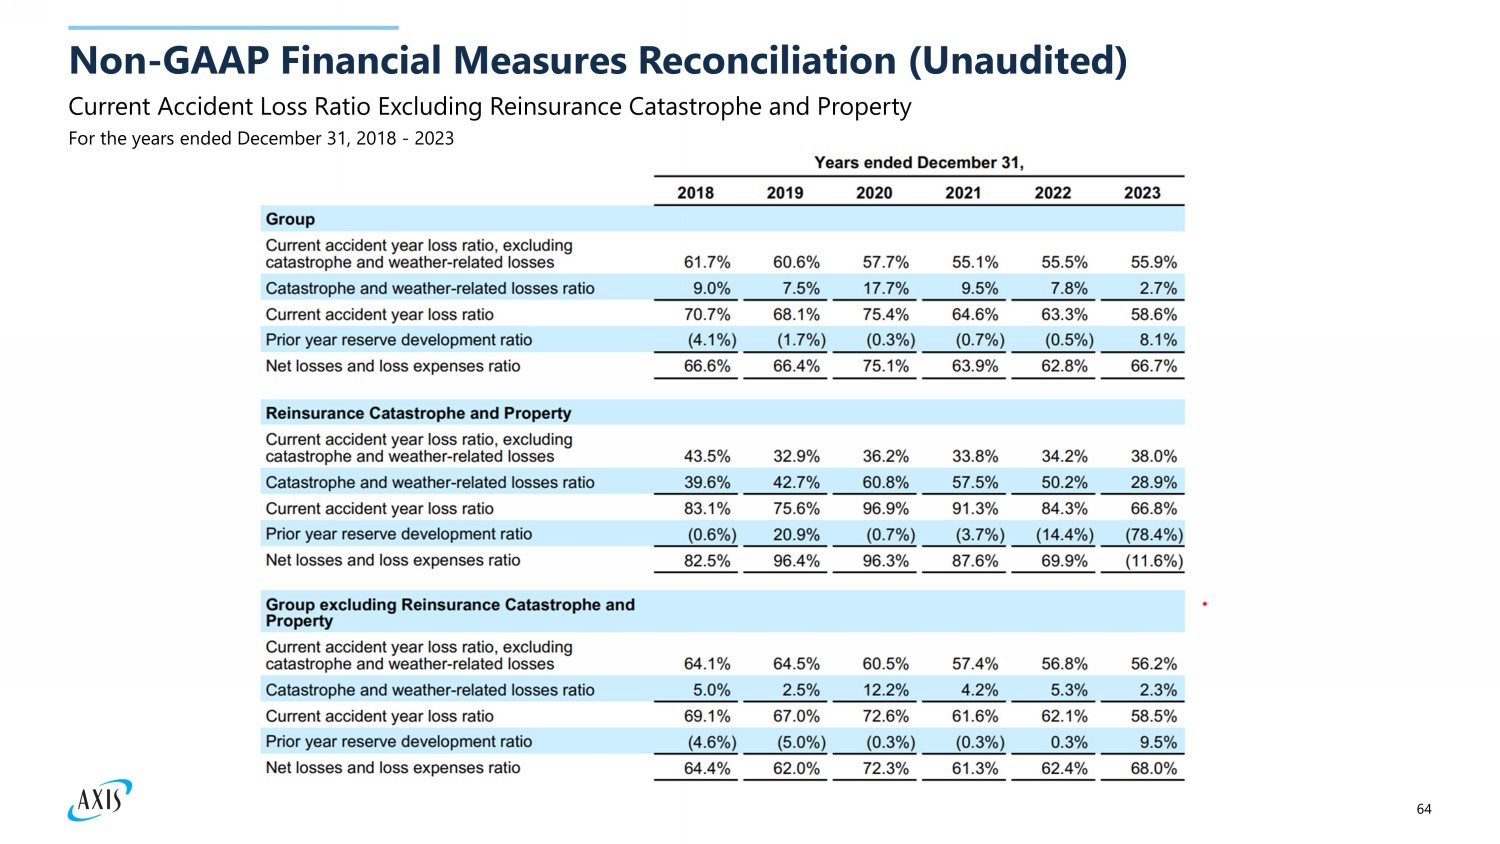
64 Current Accident Loss Ratio Excluding Reinsurance Catastrophe and Property Non - GAAP Financial Measures Reconciliation (Unaudited) For the years ended December 31, 2018 - 2023
65 Rationale for use of Non - GAAP Measures We present our results of operations in a way we believe will be meaningful and useful to investors, analysts, rating agencie s a nd others who use our financial information to evaluate our performance. Some of the measurements we use are considered non - GAAP financial measures under SEC rules and regulations. In this document, we present ope rating income (loss), annualized operating return on average common equity ("operating ROACE"), current accident year combined ratio, current accident year loss ratio, catastrophe and weather - related los ses ratio, current accident year loss ratio, excluding catastrophe and weather - related losses and current accident year loss ratio, excluding reinsurance catastrophe and property which are non - GAAP financial measures as de fined in SEC Regulation G. We believe that these non - GAAP financial measures, which may be defined and calculated differently by other companies, help explain and enhance the understanding of our results of op era tions. However, these measures should not be viewed as a substitute for those determined in accordance with accounting principles generally accepted in the United States of America ("U.S. GAAP"). Operating Income (Loss) and Annualized Operating ROACE Operating income (loss) represents after - tax operational results exclusive of net investment gains (losses), foreign exchange lo sses (gains), reorganization expenses, interest in income (loss) of equity method investments and Bermuda net deferred tax asset. Although the investment of premiums to generate income and investment gains (losses) is an integral part of our operations, t he determination to realize investment gains (losses) is independent of the underwriting process and is heavily influenced by the availability of market opportunities. Furthermore, many users believe that the timin g o f the realization of investment gains (losses) is somewhat opportunistic for many companies. Foreign exchange losses (gains) in our consolidated statements of operations primarily relate to the impact of foreign exchan ge rate movements on net insurance - related liabilities. However, we manage our investment portfolio in such a way that unrealized and realized foreign exchange losses (gains) on our investment portfolio, including u nre alized foreign exchange losses (gains) on our equity securities and foreign exchange losses (gains) realized on the sale of our available for sale investments and equity securities recognized in net investment gains ( los ses) and unrealized foreign exchange losses (gains) on our available for sale investments in other comprehensive income (loss), generally offset a large portion of the foreign exchange losses (gains) arising from our u nde rwriting portfolio, thereby minimizing the impact of foreign exchange rate movements on total shareholders' equity. As a result, we believe that foreign exchange losses (gains) in our consolidated statements of op era tions in isolation are not a meaningful contributor to the performance of our business. Therefore, foreign exchange losses (gains) are excluded from operating income (loss). Reorganization expenses in 2024 primarily relate to severance costs mainly attributable to our "How We Work" program which is fo cused on simplifying our operating structure. Reorganization expenses in 2023 primarily relate to impairments of computer software assets and severance costs mainly attributable to our "How We Work" program. Reorg ani zation expenses in 2022 primarily relate to severance costs and impairments of computer software assets mainly attributable to our exit from catastrophe and property reinsurance lines of business which wa s p art of an overall approach to reduce our exposure to volatile catastrophe risk. Reorganization expenses are primarily driven by business decisions, the nature and timing of which are not related to the und erw riting process. Therefore, these expenses are excluded from operating income (loss). Interest in income (loss) of equity method investments is primarily driven by business decisions, the nature and timing of wh ich are not related to the underwriting process. Therefore, this income (loss) is excluded from operating income (loss). Bermuda net deferred tax asset is due to the recognition of deferred tax assets net of deferred tax liabilities related to a fut ure Bermuda corporate income tax rate of 15%, pursuant to the Corporate Income Tax Act 2023 effective for fiscal years beginning on or after January 1, 2025. The Bermuda net deferred tax asset is not related to the un der writing process. Therefore, this income is excluded from operating income (loss). Certain users of our financial statements evaluate performance exclusive of after - tax net investment gains (losses), foreign exc hange losses (gains), reorganization expenses, interest in income (loss) of equity method investments and Bermuda net deferred tax asset in order to understand the profitability of recurring sources of income. We believe that showing net income (loss) available (attributable) to common shareholders exclusive of after - tax net investment gains (losses), foreign exchange losses (gains), reorganization expenses, interest in income (loss) of equity method investments and Bermuda net deferred tax asset reflects the underlying fundamentals of our business. In addition, we believe that this presentation enables investors and other users of our financial information to analyze performance in a manner similar to how our management analyzes the underlying business perfo rma nce. We also believe this measure follows industry practice and, therefore, facilitates comparison of our performance with our peer group. We believe that equity analysts and certain rating agencies that follow us , a nd the insurance industry as a whole, generally exclude these items from their analyses for the same reasons. The reconciliation of operating income (loss) to net income (loss) available (attributable) to common share hol ders, the most comparable GAAP financial measure, is presented in the 'Non - GAAP Financial Measures Reconciliation ' section of this document.
66 Rationale for use of Non - GAAP Measures We also present annualized operating ROACE, which is derived from the operating income (loss) measure and is reconciled to th e m ost comparable GAAP financial measure, annualized return on average common equity ("ROACE"), in the 'Non - GAAP Financial Measures Reconciliation' section of this document. Current Accident Year Combined Ratio Current accident year combined ratio represents underwriting results exclusive of net favorable (adverse) prior year reserve dev elopment. We believe that the presentation of current accident year combined ratio provides investors with an enhanced understanding of our results of operations by highlighting the profitability of our underwriting a cti vities excluding the impact of volatile prior year reserve development. The reconciliation of current accident year combined ratio to combined ratio, the most comparable GAAP financial measure, is presented in the 'Non - GAAP Financial Measures Reconciliation' section of this document. Current Accident Year Loss Ratio Current accident year loss ratio represents net losses and loss expenses ratio exclusive of net favorable (adverse) prior yea r r eserve development. We believe that the presentation of current accident year loss ratio provides investors with an enhanced understanding of our results of operations by highlighting net losses and loss expenses a sso ciated with our underwriting activities excluding the impact of volatile prior year reserve development. The reconciliation of current accident year loss ratio to net losses and loss expenses ratio, the most comparabl e G AAP financial measure, is presented in the 'Non - GAAP Financial Measures Reconciliation' section of this document. Catastrophe and Weather - Related Losses Ratio (referred to as "CAT CAY loss ratio" on page 26 of this presentation) and Current A ccident Year Loss Ratio, excluding Catastrophe and Weather - Related Losses (referred to as "Ex - CAT CAY loss ratio" on page 26 of this presentation) Catastrophe and weather - related losses ratio represents net losses and loss expenses ratio associated with natural disasters, ma n - made catastrophes, other catastrophe events and other weather - related events exclusive of net favorable (adverse) prior year reserve development. Current accident year loss ratio, excluding catastrophe and weather - related losses represents net losses and loss expenses ratio exclusive of net favorable (adverse) prior year reserve development and net losses and loss expenses associated with natural disasters, man - made catastrophes, other catastrophe events and other weather - related events. We believe that the presentation of these ratios that separately identify net losses and loss expenses associated with catast rop he and weather - related events provide investors with an enhanced understanding of our results of operations due to the inherently unpredictable nature of the occurrence of these events, the potential magnitude o f t hese losses and the complexity that affects our ability to accurately estimate ultimate losses associated with these events. The reconciliation of catastrophe and weather - related losses ratio and current accident year loss ratio, excluding catastrophe and weather - related losses to net losses and loss expenses ratio, the most comparable GAAP financial measure, is presented in the 'Non - GAAP Financial Measures Reconciliation' section of this document. Current Accident Year Loss Ratio, excluding reinsurance catastrophe and property (referred to as "Normalized CAY Loss Ratio" on page 26 of this presentation) Current accident year loss ratio, excluding reinsurance catastrophe and property represents net losses and loss expenses rati o e xclusive of net favorable (adverse) prior year reserve development and the impact of our exit from catastrophe and property reinsurance lines of business in June 2022. We believe that the presentation of current accident year loss ratio, excluding reinsurance catastrophe and property provides in vestors with an enhanced understanding of our results of operations by highlighting losses and loss expenses associated with our underwriting activities excluding the impact of volatile prior year reserve development an d our exit from catastrophe and property reinsurance lines of business. The reconciliation of current accident year loss ratio, excluding reinsurance catastrophe and property to net losses and loss ex penses ratio, the most comparable GAAP financial measure, is presented in the 'Non - GAAP Financial Measures Reconciliation ' section of this document.
v3.24.1.1.u2
| X |
- DefinitionBoolean flag that is true when the XBRL content amends previously-filed or accepted submission.
| Name: |
dei_AmendmentFlag |
| Namespace Prefix: |
dei_ |
| Data Type: |
xbrli:booleanItemType |
| Balance Type: |
na |
| Period Type: |
duration |
|
| X |
- DefinitionFor the EDGAR submission types of Form 8-K: the date of the report, the date of the earliest event reported; for the EDGAR submission types of Form N-1A: the filing date; for all other submission types: the end of the reporting or transition period. The format of the date is YYYY-MM-DD.
| Name: |
dei_DocumentPeriodEndDate |
| Namespace Prefix: |
dei_ |
| Data Type: |
xbrli:dateItemType |
| Balance Type: |
na |
| Period Type: |
duration |
|
| X |
- DefinitionThe type of document being provided (such as 10-K, 10-Q, 485BPOS, etc). The document type is limited to the same value as the supporting SEC submission type, or the word 'Other'.
| Name: |
dei_DocumentType |
| Namespace Prefix: |
dei_ |
| Data Type: |
dei:submissionTypeItemType |
| Balance Type: |
na |
| Period Type: |
duration |
|
| X |
- DefinitionAddress Line 1 such as Attn, Building Name, Street Name
| Name: |
dei_EntityAddressAddressLine1 |
| Namespace Prefix: |
dei_ |
| Data Type: |
xbrli:normalizedStringItemType |
| Balance Type: |
na |
| Period Type: |
duration |
|
| X |
- Definition
+ References
+ Details
| Name: |
dei_EntityAddressCityOrTown |
| Namespace Prefix: |
dei_ |
| Data Type: |
xbrli:normalizedStringItemType |
| Balance Type: |
na |
| Period Type: |
duration |
|
| X |
- DefinitionISO 3166-1 alpha-2 country code.
| Name: |
dei_EntityAddressCountry |
| Namespace Prefix: |
dei_ |
| Data Type: |
dei:countryCodeItemType |
| Balance Type: |
na |
| Period Type: |
duration |
|
| X |
- DefinitionCode for the postal or zip code
| Name: |
dei_EntityAddressPostalZipCode |
| Namespace Prefix: |
dei_ |
| Data Type: |
xbrli:normalizedStringItemType |
| Balance Type: |
na |
| Period Type: |
duration |
|
| X |
- DefinitionA unique 10-digit SEC-issued value to identify entities that have filed disclosures with the SEC. It is commonly abbreviated as CIK. Reference 1: http://www.xbrl.org/2003/role/presentationRef
-Publisher SEC
-Name Exchange Act
-Number 240
-Section 12
-Subsection b-2
| Name: |
dei_EntityCentralIndexKey |
| Namespace Prefix: |
dei_ |
| Data Type: |
dei:centralIndexKeyItemType |
| Balance Type: |
na |
| Period Type: |
duration |
|
| X |
- DefinitionIndicate if registrant meets the emerging growth company criteria. Reference 1: http://www.xbrl.org/2003/role/presentationRef
-Publisher SEC
-Name Exchange Act
-Number 240
-Section 12
-Subsection b-2
| Name: |
dei_EntityEmergingGrowthCompany |
| Namespace Prefix: |
dei_ |
| Data Type: |
xbrli:booleanItemType |
| Balance Type: |
na |
| Period Type: |
duration |
|
| X |
- DefinitionCommission file number. The field allows up to 17 characters. The prefix may contain 1-3 digits, the sequence number may contain 1-8 digits, the optional suffix may contain 1-4 characters, and the fields are separated with a hyphen.
| Name: |
dei_EntityFileNumber |
| Namespace Prefix: |
dei_ |
| Data Type: |
dei:fileNumberItemType |
| Balance Type: |
na |
| Period Type: |
duration |
|
| X |
- DefinitionTwo-character EDGAR code representing the state or country of incorporation.
| Name: |
dei_EntityIncorporationStateCountryCode |
| Namespace Prefix: |
dei_ |
| Data Type: |
dei:edgarStateCountryItemType |
| Balance Type: |
na |
| Period Type: |
duration |
|
| X |
- DefinitionThe exact name of the entity filing the report as specified in its charter, which is required by forms filed with the SEC. Reference 1: http://www.xbrl.org/2003/role/presentationRef
-Publisher SEC
-Name Exchange Act
-Number 240
-Section 12
-Subsection b-2
| Name: |
dei_EntityRegistrantName |
| Namespace Prefix: |
dei_ |
| Data Type: |
xbrli:normalizedStringItemType |
| Balance Type: |
na |
| Period Type: |
duration |
|
| X |
- DefinitionThe Tax Identification Number (TIN), also known as an Employer Identification Number (EIN), is a unique 9-digit value assigned by the IRS. Reference 1: http://www.xbrl.org/2003/role/presentationRef
-Publisher SEC
-Name Exchange Act
-Number 240
-Section 12
-Subsection b-2
| Name: |
dei_EntityTaxIdentificationNumber |
| Namespace Prefix: |
dei_ |
| Data Type: |
dei:employerIdItemType |
| Balance Type: |
na |
| Period Type: |
duration |
|
| X |
- DefinitionLocal phone number for entity.
| Name: |
dei_LocalPhoneNumber |
| Namespace Prefix: |
dei_ |
| Data Type: |
xbrli:normalizedStringItemType |
| Balance Type: |
na |
| Period Type: |
duration |
|
| X |
- DefinitionBoolean flag that is true when the Form 8-K filing is intended to satisfy the filing obligation of the registrant as pre-commencement communications pursuant to Rule 13e-4(c) under the Exchange Act. Reference 1: http://www.xbrl.org/2003/role/presentationRef
-Publisher SEC
-Name Exchange Act
-Number 240
-Section 13e
-Subsection 4c
| Name: |
dei_PreCommencementIssuerTenderOffer |
| Namespace Prefix: |
dei_ |
| Data Type: |
xbrli:booleanItemType |
| Balance Type: |
na |
| Period Type: |
duration |
|
| X |
- DefinitionBoolean flag that is true when the Form 8-K filing is intended to satisfy the filing obligation of the registrant as pre-commencement communications pursuant to Rule 14d-2(b) under the Exchange Act. Reference 1: http://www.xbrl.org/2003/role/presentationRef
-Publisher SEC
-Name Exchange Act
-Number 240
-Section 14d
-Subsection 2b
| Name: |
dei_PreCommencementTenderOffer |
| Namespace Prefix: |
dei_ |
| Data Type: |
xbrli:booleanItemType |
| Balance Type: |
na |
| Period Type: |
duration |
|
| X |
- DefinitionTitle of a 12(b) registered security. Reference 1: http://www.xbrl.org/2003/role/presentationRef
-Publisher SEC
-Name Exchange Act
-Number 240
-Section 12
-Subsection b
| Name: |
dei_Security12bTitle |
| Namespace Prefix: |
dei_ |
| Data Type: |
dei:securityTitleItemType |
| Balance Type: |
na |
| Period Type: |
duration |
|
| X |
- DefinitionName of the Exchange on which a security is registered. Reference 1: http://www.xbrl.org/2003/role/presentationRef
-Publisher SEC
-Name Exchange Act
-Number 240
-Section 12
-Subsection d1-1
| Name: |
dei_SecurityExchangeName |
| Namespace Prefix: |
dei_ |
| Data Type: |
dei:edgarExchangeCodeItemType |
| Balance Type: |
na |
| Period Type: |
duration |
|
| X |
- DefinitionBoolean flag that is true when the Form 8-K filing is intended to satisfy the filing obligation of the registrant as soliciting material pursuant to Rule 14a-12 under the Exchange Act. Reference 1: http://www.xbrl.org/2003/role/presentationRef
-Publisher SEC
-Name Exchange Act
-Section 14a
-Number 240
-Subsection 12
| Name: |
dei_SolicitingMaterial |
| Namespace Prefix: |
dei_ |
| Data Type: |
xbrli:booleanItemType |
| Balance Type: |
na |
| Period Type: |
duration |
|
| X |
- DefinitionTrading symbol of an instrument as listed on an exchange.
| Name: |
dei_TradingSymbol |
| Namespace Prefix: |
dei_ |
| Data Type: |
dei:tradingSymbolItemType |
| Balance Type: |
na |
| Period Type: |
duration |
|
| X |
- DefinitionBoolean flag that is true when the Form 8-K filing is intended to satisfy the filing obligation of the registrant as written communications pursuant to Rule 425 under the Securities Act. Reference 1: http://www.xbrl.org/2003/role/presentationRef
-Publisher SEC
-Name Securities Act
-Number 230
-Section 425
| Name: |
dei_WrittenCommunications |
| Namespace Prefix: |
dei_ |
| Data Type: |
xbrli:booleanItemType |
| Balance Type: |
na |
| Period Type: |
duration |
|
| X |
- Details
| Name: |
us-gaap_StatementClassOfStockAxis=us-gaap_CommonStockMember |
| Namespace Prefix: |
|
| Data Type: |
na |
| Balance Type: |
|
| Period Type: |
|
|
| X |
- Details
| Name: |
us-gaap_StatementClassOfStockAxis=us-gaap_SeriesEPreferredStockMember |
| Namespace Prefix: |
|
| Data Type: |
na |
| Balance Type: |
|
| Period Type: |
|
|
Axis Capital (NYSE:AXS)
過去 株価チャート
から 5 2024 まで 6 2024

Axis Capital (NYSE:AXS)
過去 株価チャート
から 6 2023 まで 6 2024
