Form 424B3 - Prospectus [Rule 424(b)(3)]
2024年5月14日 - 3:52AM
Edgar (US Regulatory)
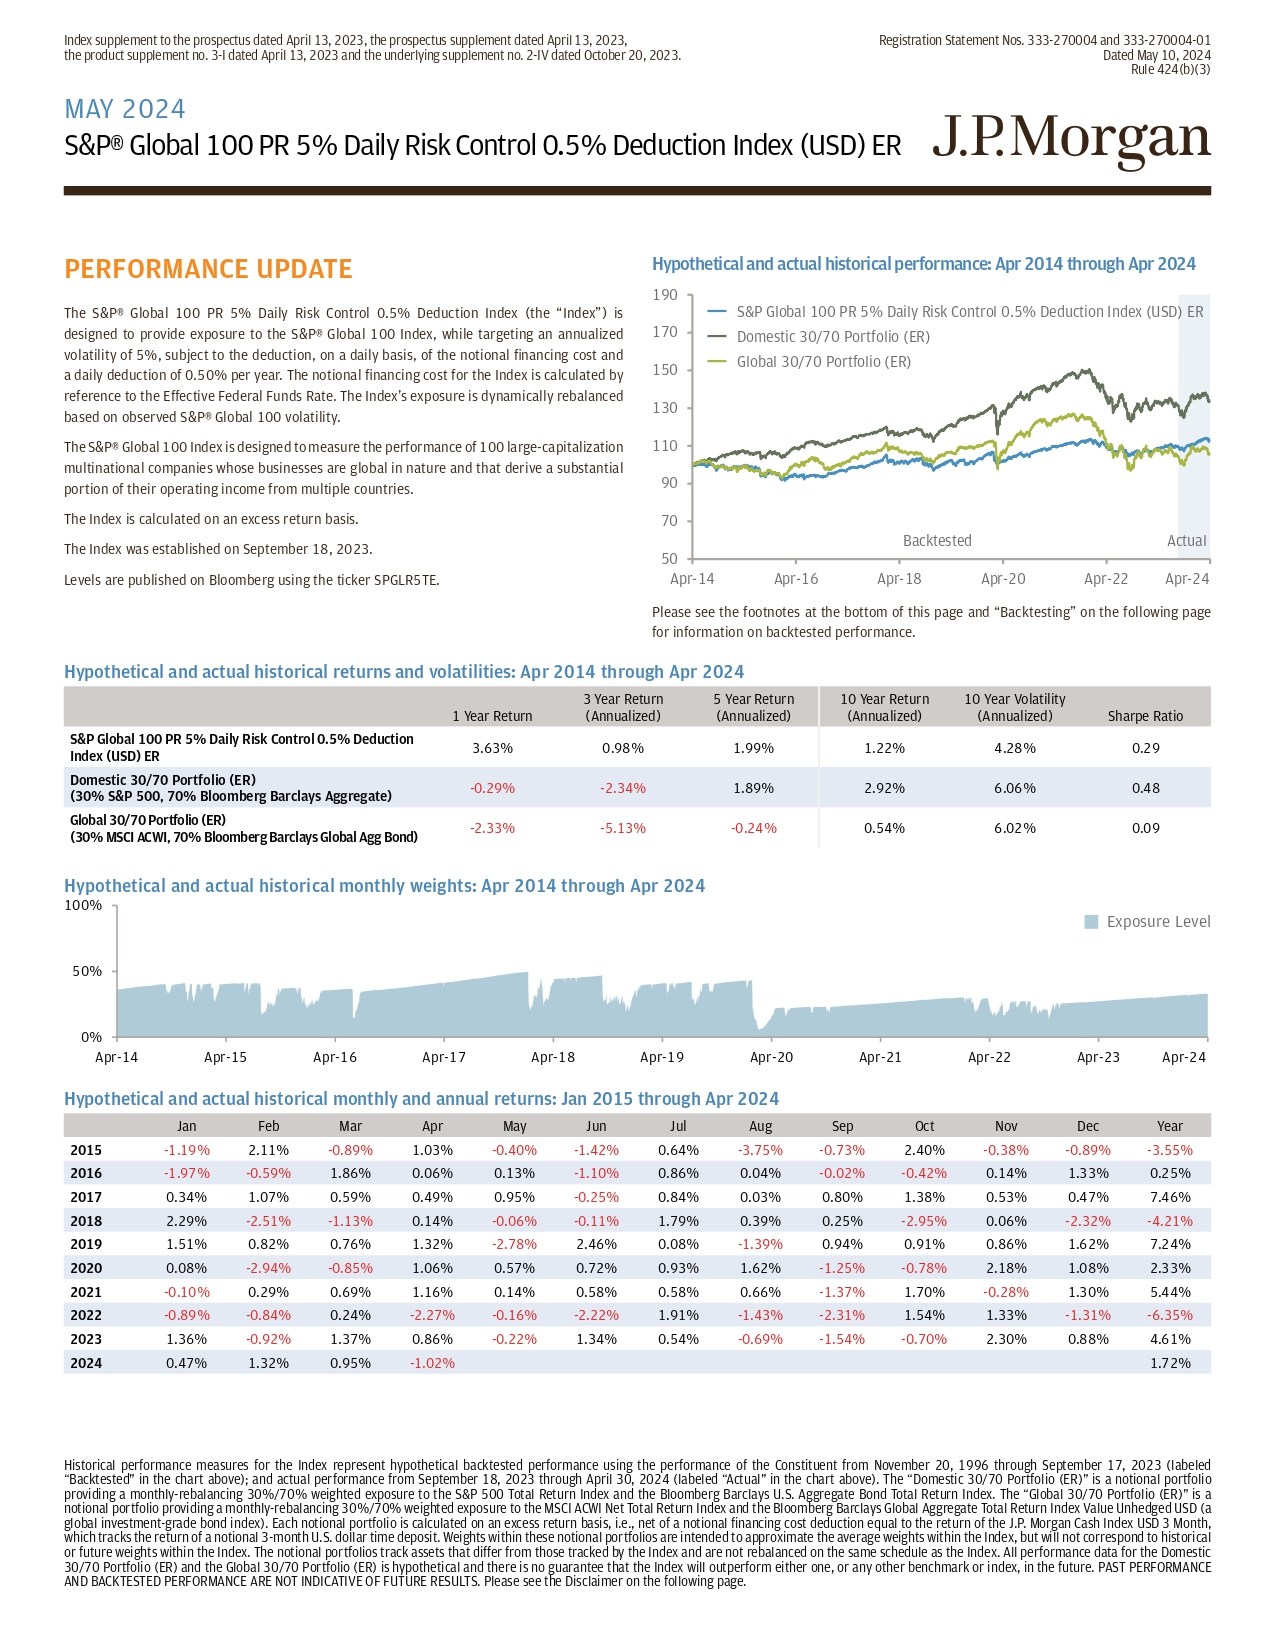
Index supplement to the prospectus dated April 13, 2023, the prospectus supplement dated April 13, 2023, the product supplement no. 3 - I dated April 13, 2023 and the underlying supplement no. 2 - IV dated October 20, 2023. Registration Statement Nos. 333 - 270004 and 333 - 270004 - 01 D ate d May 10 , 2024 Rul e 424(b)(3) M A Y 2024 S&P® Global 100 PR 5% Daily Risk Control 0.5% Deduction Index (USD) ER Historical performance measures for the Index represent hypothetical backtested performance using the performance of the Constituent from November 20 , 1996 through September 17 , 2023 (labeled “Backtested” in the chart above) ; and actual performance from September 18 , 2023 through April 30 , 2024 (labeled “Actual” in the chart above) . The “Domestic 30 / 70 Portfolio (ER)” is a notional portfolio providing a monthly - rebalancing 30 % / 70 % weighted exposure to the S&P 500 Total Return Index and the Bloomberg Barclays U . S . Aggregate Bond Total Return Index . The “Global 30 / 70 Portfolio (ER)” is a notional portfolio providing a monthly - rebalancing 30 % / 70 % weighted exposure to the MSCI ACWI Net Total Return Index and the Bloomberg Barclays Global Aggregate Total Return Index Value Unhedged USD (a global investment - grade bond index) . Each notional portfolio is calculated on an excess return basis, i . e . , net of a notional financing cost deduction equal to the return of the J . P . Morgan Cash Index USD 3 Month, which tracks the return of a notional 3 - month U . S . dollar time deposit . Weights within these notional portfolios are intended to approximate the average weights within the Index, but will not correspond to historical or future weights within the Index . The notional portfolios track assets that differ from those tracked by the Index and are not rebalanced on the same schedule as the Index . All performance data for the Domestic 30 / 70 Portfolio (ER) and the Global 30 / 70 Portfolio (ER) is hypothetical and there is no guarantee that the Index will outperform either one, or any other benchmark or index, in the future . PAST PERFORMANCE AND BACKTESTED PERFORMANCE ARE NOT INDICATIVE OF FUTURE RESULTS . Please see the Disclaimer on the following page . PER F ORMANCE UP D A TE The S&P® Global 100 PR 5 % Daily Risk Control 0 . 5 % Deduction Index (the “Index”) is designed to provide exposure to the S&P® Global 100 Index, while targeting an annualized volatility of 5 % , subject to the deduction, on a daily basis, of the notional financing cost and a daily deduction of 0 . 50 % per year . The notional financing cost for the Index is calculated by reference to the Effective Federal Funds Rate . The Index’s exposure is dynamically rebalanced base d o n obse r v e d S& P ® Globa l 10 0 v olatili t y . The S&P® Global 100 Index is designed to measure the performance of 100 large - capitalization multinational companies whose businesses are global in nature and that derive a substantial portion of their operating income from multiple countries . The Index is calculated on an excess return basis. The Index was established on September 18, 2023. Levels are published on Bloomberg using the ticker SPGLR5TE. Hypothetical and actual historical performance: Apr 2014 through Apr 2024 70 90 1 1 0 1 3 0 1 5 0 1 7 0 1 9 0 Apr - 20 Apr - 22 Apr - 24 S&P Global 100 PR 5% Daily Risk Control 0.5% Deduction Index (USD) ER D o mesti c 30/7 0 P o r t f o lio (ER) G loba l 3 0 /70 P o r t fo l i o (ER) Actual Backtested 50 Apr - 14 Apr - 16 Apr - 18 Please see the footnotes at the bottom of this page and “Backtesting” on the following page for information on backtested performance. Hypothetical and actual historical returns and volatilities: Apr 2014 through Apr 2024 Sharpe Ratio 10 Y ear V olatili t y (Annualized) 10 Y ear R eturn (Annualized) 5 Y ear R eturn (Annualized) 3 Y ear R eturn (Annualized) 1 Y ear R eturn 0.29 4.28% 1.22% 1.99% 0.98% 3.63% S& P Globa l 10 0 P R 5 % D ail y Ris k C o n t r o l 0.5 % Deduction Ind e x (USD ) ER 0.48 6.06% 2.92% 1.89% - 2.34% - 0.29% Domestic 30/70 P o r tf olio (ER) (30% S&P 500, 70% Bloombe r g Ba r cl a ys A g g r e ga te) 0.09 6.02% 0.54% - 0.24% - 5.13% - 2.33% Globa l 30/7 0 Po r tfoli o (ER) (30% MSCI ACWI, 70% Bloomberg Barclays Global Agg Bond) Hypothetical and actual historical monthly weights: Apr 2014 through Apr 2024 100% 5 0 % Apr - 21 Apr - 22 Apr - 23 Apr - 24 Exposure Level 0% Apr - 14 Apr - 15 Apr - 16 Apr - 17 Apr - 18 Apr - 19 Apr - 20 Hypothetical and actual historical monthly and annual returns: Jan 2015 through Apr 2024 Year Dec Nov Oct Sep Aug Jul Jun May Apr Mar Feb Jan - 3.55% - 0.89% - 0.38% 2.40% - 0.73% - 3.75% 0.64% - 1.42% - 0.40% 1.03% - 0.89% 2.11% - 1.19% 2015 0.25% 1.33% 0.14% - 0.42% - 0.02% 0.04% 0.86% - 1.10% 0.13% 0.06% 1.86% - 0.59% - 1.97% 2016 7.46% 0.47% 0.53% 1.38% 0.80% 0.03% 0.84% - 0.25% 0.95% 0.49% 0.59% 1.07% 0.34% 2017 - 4.21% - 2.32% 0.06% - 2.95% 0.25% 0.39% 1.79% - 0.11% - 0.06% 0.14% - 1.13% - 2.51% 2.29% 2018 7.24% 1.62% 0.86% 0.91% 0.94% - 1.39% 0.08% 2.46% - 2.78% 1.32% 0.76% 0.82% 1.51% 2019 2.33% 1.08% 2.18% - 0.78% - 1.25% 1.62% 0.93% 0.72% 0.57% 1.06% - 0.85% - 2.94% 0.08% 2020 5.44% 1.30% - 0.28% 1.70% - 1.37% 0.66% 0.58% 0.58% 0.14% 1.16% 0.69% 0.29% - 0.10% 2021 - 6.35% - 1.31% 1.33% 1.54% - 2.31% - 1.43% 1.91% - 2.22% - 0.16% - 2.27% 0.24% - 0.84% - 0.89% 2022 4.61% 0.88% 2.30% - 0.70% - 1.54% - 0.69% 0.54% 1.34% - 0.22% 0.86% 1.37% - 0.92% 1.36% 2023 1.72% - 1.02% 0.95% 1.32% 0.47% 2024
MAY 2024 | S&P® Global 100 PR 5% Daily Risk Control 0.5% Deduction Index (USD) ER S electe d Risks The level of the Index reflects a 0.50% per annum index deduction and the deduction of a notional financing cost, both of which are deducted daily. JPMorgan Chase & Co. is currently one of the companies that make up the underlying index. The Index may not be successful and may not outperform or underperform the underlying index. The Index may not approximate its target volatility 5%. The daily adjustment of the exposure of the Index to the underlying index may cause the Index not to reflect fully any appreciation of the underlying index or to magnify any depreciation of the underlying index. The Index may be significantly uninvested, which will result in a portion of the Index reflecting no return. The risks identified above are not exhaustive. You should also review carefully the related “Risk Factors” section in the prospectus supplement and the relevant product supplement and underlying supplement and the “Selected Risk Considerations” in the relevant pricing supplement. Disclaimer The information contained in this document is for discussion purposes only . Any information relating to performance contained in these materials is illustrative and no assurance is given that any indicative returns, performance or results, whether historical or hypothetical, will be achieved . These terms are subject to change, and J . P . Morgan undertakes no duty to update this information . This document shall be amended, superseded and replaced in its entirety by a subsequent term sheet and/or disclosure supplement, and the documents referred to therein . In the event any inconsistency between the information presented herein and any such term sheet and/or disclosure supplement, such term sheet and/or disclosure supplement shall govern . The Sharpe Ratio on the previous page is a measure of risk - adjusted performance, calculated as the 10 Year Return (Annualized) divided by the 10 Year Volatility (Annualized) . Investment suitability must be determined individually for each investor, and CDs linked to the Index may not be suitable for all investors . This material is not a product of J . P . Morgan Research Departments . Copyright © 2024 JPMorgan Chase & Co . All rights reserved . For additional regulatory disclosures, please consult : www . jpmorgan . com/disclosures . Information contained on this website is not incorporated by reference in, and should not be considered part of, this document . This monthly update document replaces and supersedes all prior written materials of this type previously provided with respect to the Index .
JP Morgan Chase (NYSE:JPM)
過去 株価チャート
から 4 2024 まで 5 2024

JP Morgan Chase (NYSE:JPM)
過去 株価チャート
から 5 2023 まで 5 2024
