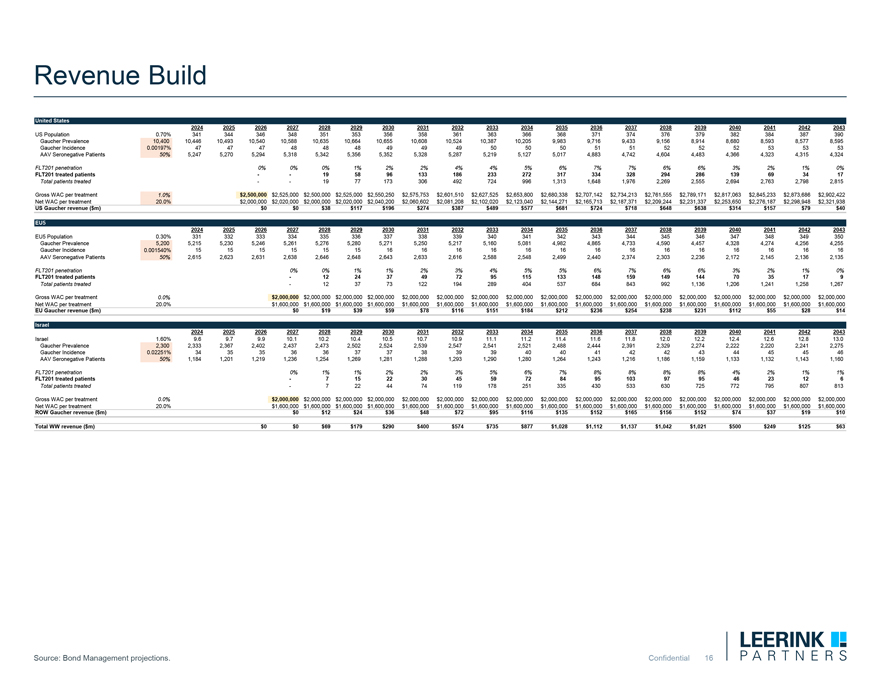
Revenue Build United States 2024 2025 2026 2027 2028 2029 2030 2031 2032 2033 2034 2035 2036 2037 2038 2039
2040 2041 2042 2043 US Population 0.70% 341 344 346 348 351 353 356 358 361 363 366 368 371 374 376 379 382 384 387 390 Gaucher Prevalence 10,400 10,446 10,493 10,540 10,588 10,635 10,664 10,655 10,608 10,524 10,387 10,205 9,983 9,716 9,433 9,156
8,914 8,680 8,593 8,577 8,595 Gaucher Incidence 0.00197% 47 47 47 48 48 48 49 49 49 50 50 50 51 51 52 52 52 53 53 53 AAV Seronegative Patients 50% 5,247 5,270 5,294 5,318 5,342 5,356 5,352 5,328 5,287 5,219 5,127 5,017 4,883 4,742 4,604 4,483 4,366
4,323 4,315 4,324 FLT201 penetration 0% 0% 0% 1% 2% 2% 4% 4% 5% 6% 7% 7% 6% 6% 3% 2% 1% 0% FLT201 treated patients — — 19 58 96 133 186 233 272 317 334 328 294 286 139 69 34 17 Total patients treated — — 19 77 173 306 492 724 996
1,313 1,648 1,976 2,269 2,555 2,694 2,763 2,798 2,815 Gross WAC per treatment 1.0% $2,500,000 $2,525,000 $2,500,000 $2,525,000 $2,550,250 $2,575,753 $2,601,510 $2,627,525 $2,653,800 $2,680,338 $2,707,142 $2,734,213 $2,761,555 $2,789,171 $2,817,063
$2,845,233 $2,873,686 $2,902,422 Net WAC per treatment 20.0% $2,000,000 $2,020,000 $2,000,000 $2,020,000 $2,040,200 $2,060,602 $2,081,208 $2,102,020 $2,123,040 $2,144,271 $2,165,713 $2,187,371 $2,209,244 $2,231,337 $2,253,650 $2,276,187 $2,298,948
$2,321,938 US Gaucher revenue ($m) $0 $0 $38 $117 $196 $274 $387 $489 $577 $681 $724 $718 $648 $638 $314 $157 $79 $40 EU5 2024 2025 2026 2027 2028 2029 2030 2031 2032 2033 2034 2035 2036 2037 2038 2039 2040 2041 2042 2043 EU5 Population 0.30% 331
332 333 334 335 336 337 338 339 340 341 342 343 344 345 346 347 348 349 350 Gaucher Prevalence 5,200 5,215 5,230 5,246 5,261 5,276 5,280 5,271 5,250 5,217 5,160 5,081 4,982 4,865 4,733 4,590 4,457 4,328 4,274 4,256 4,255 Gaucher Incidence 0.001540%
15 15 15 15 15 15 16 16 16 16 16 16 16 16 16 16 16 16 16 16 AAV Seronegative Patients 50% 2,615 2,623 2,631 2,638 2,646 2,648 2,643 2,633 2,616 2,588 2,548 2,499 2,440 2,374 2,303 2,236 2,172 2,145 2,136 2,135 FLT201 penetration 0% 0% 1% 1% 2% 3% 4%
5% 5% 6% 7% 6% 6% 3% 2% 1% 0% FLT201 treated patients — 12 24 37 49 72 95 115 133 148 159 149 144 70 35 17 9 Total patients treated — 12 37 73 122 194 289 404 537 684 843 992 1,136 1,206 1,241 1,258 1,267 Gross WAC per treatment 0.0%
$2,000,000 $2,000,000 $2,000,000 $2,000,000 $2,000,000 $2,000,000 $2,000,000 $2,000,000 $2,000,000 $2,000,000 $2,000,000 $2,000,000 $2,000,000 $2,000,000 $2,000,000 $2,000,000 $2,000,000 Net WAC per treatment 20.0% $1,600,000 $1,600,000 $1,600,000
$1,600,000 $1,600,000 $1,600,000 $1,600,000 $1,600,000 $1,600,000 $1,600,000 $1,600,000 $1,600,000 $1,600,000 $1,600,000 $1,600,000 $1,600,000 $1,600,000 EU Gaucher revenue ($m) $0 $19 $39 $59 $78 $116 $151 $184 $212 $236 $254 $238 $231 $112 $55 $28
$14 Israel 2024 2025 2026 2027 2028 2029 2030 2031 2032 2033 2034 2035 2036 2037 2038 2039 2040 2041 2042 2043 Israel 1.60% 9.6 9.7 9.9 10.1 10.2 10.4 10.5 10.7 10.9 11.1 11.2 11.4 11.6 11.8 12.0 12.2 12.4 12.6 12.8 13.0 Gaucher Prevalence 2,300
2,333 2,367 2,402 2,437 2,473 2,502 2,524 2,539 2,547 2,541 2,521 2,488 2,444 2,391 2,329 2,274 2,222 2,220 2,241 2,275 Gaucher Incidence 0.02251% 34 35 35 36 36 37 37 38 39 39 40 40 41 42 42 43 44 45 45 46 AAV Seronegative Patients 50% 1,184 1,201
1,219 1,236 1,254 1,269 1,281 1,288 1,293 1,290 1,280 1,264 1,243 1,216 1,186 1,159 1,133 1,132 1,143 1,160 FLT201 penetration 0% 1% 1% 2% 2% 3% 5% 6% 7% 8% 8% 8% 8% 4% 2% 1% 1% FLT201 treated patients — 7 15 22 30 45 59 72 84 95 103 97 95 46
23 12 6 Total patients treated — 7 22 44 74 119 178 251 335 430 533 630 725 772 795 807 813 Gross WAC per treatment 0.0% $2,000,000 $2,000,000 $2,000,000 $2,000,000 $2,000,000 $2,000,000 $2,000,000 $2,000,000 $2,000,000 $2,000,000 $2,000,000
$2,000,000 $2,000,000 $2,000,000 $2,000,000 $2,000,000 $2,000,000 Net WAC per treatment 20.0% $1,600,000 $1,600,000 $1,600,000 $1,600,000 $1,600,000 $1,600,000 $1,600,000 $1,600,000 $1,600,000 $1,600,000 $1,600,000 $1,600,000 $1,600,000 $1,600,000
$1,600,000 $1,600,000 $1,600,000 ROW Gaucher revenue ($m) $0 $12 $24 $36 $48 $72 $95 $116 $135 $152 $165 $156 $152 $74 $37 $19 $10 Total WW revenue ($m) $0 $0 $69 $179 $290 $400 $574 $735 $877 $1,028 $1,112 $1,137 $1,042 $1,021 $500 $249 $125 $63
Source: Bond Management projections. Confidential 16